Article

Investigation of the Hydrostatic Pressure Effect on the Formation of Hot Tearing in the AA6111 Alloy During Direct Chill Casting of Rectangular Ingots

1
Aluminum Research Center—REGAL, Department of Mining, Metallurgy and Materials Engineering, Laval University, 1065, Ave de la Médecine, Québec, QC G1V 0A6, Canada
2
Aluminum Research Center—REGAL, Department of Applied Sciences, University of Quebec at Chicoutimi, 555, boul. de l’Université, Saguenay, Québec, QC G7H 2B1, Canada
3
Department of Materials Science and Engineering, McMaster University, 1280 Main Street West, Hamilton, ON L8S 4L7, Canada
4
RioTinto, 1955 Bd Mellon, Saguenay, QC G7S 0L4, Canada
*
Author to whom correspondence should be addressed.
Appl. Mech. 2025, 6(3), 53; https://doi.org/10.3390/applmech6030053
Submission received: 31 March 2025 / Revised: 17 June 2025 / Accepted: 24 June 2025 / Published: 19 July 2025
(This article belongs to the Special Issue Thermal Mechanisms in Solids and Interfaces)

Abstract

The formation of hot tearing during direct chill casting of aluminum alloys, specifically AA6111, is a significant challenge in the production of ingots for industrial applications. This study investigates the role of hydrostatic pressure and tensile stress in the formation of hot tearing during direct chill casting of rectangular ingots. Combining experimental results and finite element modeling with ABAQUS/CAE 2022, the mechanical behavior of the semi-solid AA6111 alloy was analyzed under different cooling conditions. “Hot” (low water flow) and “Cold” (high water flow) conditions were the two types of cooling conditions that produced cracked and sound ingots, respectively. The outcomes indicate that high tensile stress and localized negative hydrostatic pressure in the hot condition are the main factors promoting the initiation and propagation of cracks in the mushy zone, whereas the improvement of the cooling conditions reduces these defects.

1. Introduction

1.1. The Direct Chill Casting Process

The semi-continuous direct chill (DC) casting method was introduced in 1935 to produce large aluminum ingots for rolling, extrusion, and forging applications. Since its inception, numerous improvements have been made to enhance both the quality and production speed of these ingots [1,2,3,4,5,6,7].
Figure 1 illustrates a schematic diagram of a typical DC casting process and some details about the heat transfer from the ingot. Initially, a bottom block is placed inside the water-cooled mold, and liquid metal is poured into the open mold from the top. Once the liquid metal reaches a certain height and the solid shell has achieved sufficient strength to support the liquid pool, the bottom block is lowered into a pit with a velocity referred to as the casting speed. Molten metal is continuously fed into the mold from the top. As the partially solidified ingot comes out of the mold, water spray directly contacts the cast surface.
During the operation, heat transfer occurs in direct chill casting through several mechanisms. Initially, heat is transferred from the liquid metal to the mold, which is known as primary cooling. Subsequently, heat is further transferred from the ingot surface to the water in contact with it, referred to as secondary cooling. During the start-up phase of the casting process, there is an additional mechanism of heat transport between the base of the ingot and the bottom block [8]. Typically, approximately 80 percent of the heat is removed through secondary cooling during steady-state operation [6]. Due to demands on lightweight construction and energy efficiency in the transportation industry, the utilization of aluminum alloys, especially 6xxx DC casting alloys, is on the rise. The industrial selection of 6xxx alloys is related to the high strength/weight ratio, good corrosion resistance, and reasonable formability of these alloys [9].
Among 6xxx series alloys, AA6111 alloys are widely used in the automotive industry as body sheets for the vehicle, as well as in structural applications. The main alloying elements present in AA6111 alloys include Mg, Si, Cu, and Mn. Given the multi-component nature of alloying elements, AA6111 alloys exhibit a large solidification interval, leading to the formation of as-cast microstructures with different intermetallic phases during solidification. As a result, these alloys are highly prone to hot tearing during DC casting.

1.2. Hot Tearing in DC Casting

The formation of hot tearing is one of the most important challenges in the DC casting process. This defect is caused by the limited ability of the mushy zone to be healed during the deformation when only a small fraction of the liquid phase is present in the semi-solid mush. These cracks have significant implications for the quality of products and lead to the rejection of the ingot [10]. Managing the thermal cooling conditions during the DC casting process for aluminum sheet ingots is a complex task. Understanding the mechanisms and the required conditions for hot-tearing formation is important for industrial-scale production, but it has not been well-established yet for some hot-tearing-prone alloys. Some investigations have shown that hot tearing and porosity originate from the same cause, but hot tearing additionally necessitates tensile deformation in the mushy zone [11,12]. Other research indicates that hot tears initiate from pores, while others show that hot tearing and porosity are interrelated. As a result, reducing and controlling the formation of porosity considerably improves the ductility of semi-solid materials [13].
The most important processing parameters that influence the tendency for hot tearing are casting speed, casting temperature, and cooling water flow rate [14]. These factors affect melt flow and the cooling conditions of the ingot, which in turn impact the stresses caused by thermal contraction and solidification shrinkage. Researchers generally agree that in aluminum alloys, a higher melt temperature increases the thermal gradient during solidification, leading to the formation of columnar dendritic grains that are more prone to hot tearing compared to equiaxed globular grains [4,14]. Faster casting speeds result in a higher solidification rate and a deeper mushy zone, both of which raise the risk of hot tearing [4]. Additionally, a high cooling water flow rate can create uneven thermal contraction, causing the surface to cool faster than the center, which leads to stress and strain accumulation and ultimately contributes to hot tearing [4,15].
Various criteria for predicting hot tearing have been established [16]. These criteria are based on factors such as strain, strain rate, alloy composition, and solidification conditions [13,17]. One well-studied criterion, based on strain rate, is called the RDG (Rappaz–Drezet–Gremaud) criterion [11]. The RDG criterion focuses on how liquid metal flows between dendrites in the mushy zone. As the solid network becomes more interconnected deeper in the mush, feeding becomes challenging, and the risk of hot tears increases. A critical factor in hot tear development is the liquid pressure drop, which is the difference between metallostatic and local pressures in the mush. Hot tears form if the local pressure falls below the cavitation pressure. Both solid shrinkage and deformation contribute to this pressure drop, which is calculated using a mass balance over the mushy region [11,18].

1.3. Mathematical Simulations of DC Casting

Modeling of DC casting to investigate the formation of hot tearing has been the focus of researchers for decades. More investigations were done on round billets [13,19,20,21]. Suyitno [4] carried out a comprehensive study on hot tearing formation in the direct chill (DC) casting of aluminum alloys. The author used finite element modeling to simulate what happens in the mushy zone during casting. These simulations helped predict the stresses, strains, and temperature changes that are important for understanding when hot tearing happens. The findings showed that the highest stresses and strains occur at the center of the round cast billet. Some other researchers investigated rectangular ingots. As a result of the rectangular shape, the stresses and thus hot tearing concentrate on the ingot’s surface [2,22]. Sengupta et al. [23] developed a mathematical model to analyze heat transfer during the start-up phase of the DC casting process on rectangular aluminum ingots. In this study, they noted how water intrusion impacted heat transfer efficiency and focused on improving casting parameters during the start-up phase of DC casting. Their model results matched well with the experimental data from AA5182 direct chill ingots. Larouche et al. [24] investigated the tensile deformation of the Al-4.5 pct Cu aluminum alloy during solidification using a direct chill surface simulator (DCSS). They developed a constitutive model, focusing on grain boundary sliding as a key deformation mechanism. The model includes variables such as solid fraction and channel thickness, which are suitable for predicting the tensile behavior of semi-solid microstructures and addressing hot tearing during solidification.
Also, in recent years, some researchers have developed models to specifically predict hot tearing during DC casting [25,26]. Khodaei et al. [15] developed a multi-scale modeling approach to investigate hot tearing in the DC casting of aluminum alloys AA5182 and AA3104. They combined a macro-scale thermomechanical model with a meso-scale granular model. Their results revealed how casting speed, thermal gradients, and feeding coefficients affected hot tearing susceptibility. They accurately predicted hot tearing initiation, growth, and propagation in the mushy zone. Chen et al. [13] conducted a 2D model to predict the hot tearing susceptibility of the AA6111 alloy during the round DC casting of billets. The results showed that higher casting speeds and larger billet diameters resulted in greater hot tearing susceptibility, while better cooling conditions contributed to its reduction. Further, their study demonstrated the significance of pore fraction and its connection to the development of hot tearing. Also, some other researchers found that porosities and hot tearing are interlinked, and where there are more porosities, it is prone to form hot tearing [11,13]. In the high solid fraction, hydrostatic pressure plays a crucial role in the dynamics of the casting’s internal structure and the formation of porosities. It is calculated as the average of the normal stresses:
P h = ( S 11 + S 22 + S 33 ) / 3
where S11, S22, and S33 are the normal stress components in the X, Y, and Z directions, respectively. When the hydrostatic pressure is negative in any spot, this situation can initiate the nucleation of porosity within the casting in that spot. In this case, the remaining liquid metal may no longer be able to flow adequately into regions experiencing a pressure reduction, leading to localized shrinkage and porosity. Conversely, when the hydrostatic pressure is positive, it indicates that the pressure is directed inward, mitigating the risk of porosity formation and reducing the potential for defects like hot tearing.

1.4. Study Intent

This study focuses on modeling and analyzing the mechanical behavior of an Al AA6111 alloy during the DC casting process for rolling ingots with rectangular cross-sections. The evolution of hydrostatic pressure, stress, and strain near the solidus temperature was examined and correlated with hot tears in real DC-cast ingots. This approach provides insights into the link between casting conditions and defect formation, aiming to improve the quality of the final product.

2. Experimental Section

2.1. Materials

Two AA6111 ingots with a rectangular cross-section area of 200 mm × 600 mm and 400 mm in length were provided by the Arvida Research and Development Center of Rio Tinto Aluminum (Saguenay, QC, Canada). Table 1 shows the chemical composition of the AA6111 alloy, as determined by optical emission spectroscopy immediately before casting. Each ingot was cast with different water flow rates, called ‘Hot’ and ‘Cold’ conditions, in which the hot condition involved lower water flow rates and the cold condition used higher water flow rates (see Figure 2). Two thermocouples were embedded into the molten metal within the ingot near the base of the casting to record metal temperatures during the DC casting process. The thermocouples were placed in the ingot adjacent to the rolling and narrow faces at heights of 170 mm above the ingot and bottom block interface and 25 mm inside the surfaces and were hauled by the solidified metal. Figure 3 illustrates the thermocouple position in the ingot.

2.2. Model Description

The model was adapted based on a previous model developed by Sengupta et al. [27]. Due to the two planes of symmetry of the ingot, only a quarter section of the ingot and the bottom block were modeled. The symmetry planes are indicated in Figure 3. To better monitor the formation of the gap between them, both objects were meshed, ensuring that the nodes at the interface were aligned. The model geometry was meshed with cuboid elements, with a size range from 1.6 mm to 20 mm. The calculation was implemented in ABAQUS/CAE 2022 using the built-in FORTRAN user subroutines. ABAQUS was selected for this analysis due to its flexibility in handling user-defined heat transfer coefficients and temperature-dependent constitutive models. A FIELD subroutine was employed to monitor the formation of the gap between the ingot and the bottom block. Also, a FILM subroutine was used to calculate the complex heat transfer coefficients between the ingot and its immediate surroundings—air, water, and the bottom block. The results were extracted from the simulation using Python scripts. The computational regions and the thermal boundary conditions are depicted in Figure 4. The initial heat loss occurs at the direct contact between the molten metal and the water-cooled mold (primary cooling, A1), and at the interface between the bottom block and the ingot (A4), which includes the effects of gap formation during casting. In area A2, the water spray hits the ingot surface, while the water, free falling is observed in area A3. The heat loss along A6 is assumed to be zero due to the symmetry of the face, and area A7 is also assumed to have zero heat loss, as new material is continuously fed into the mold. In the simulation, the bottom block and ingot are kept in a fixed position. Consequently, the thermal boundary moves upward by following changes in casting speed. A continuous flow of liquid metal is simulated by gradually activating horizontal layers of elements (see Figure 4b). The initial temperature of the liquid metal was set at 670 °C, representing the pouring temperatures of the casting of AA6111. The ambient temperature was presumed to be 25 °C.
To prevent convergence difficulties caused by rigid body motion, applying appropriate mechanical boundary conditions is crucial. As a result, the lowest node at the ingot’s center was constrained by a virtual spring to prevent any separation between the bottom block and the ingot at that surface and center. Stresses, strains, and temperatures were determined based on the position of the ingot and how much time had passed. The focus was on the early stage of the process, known as the start-up phase. This start-up stage lasted up to 350 s.

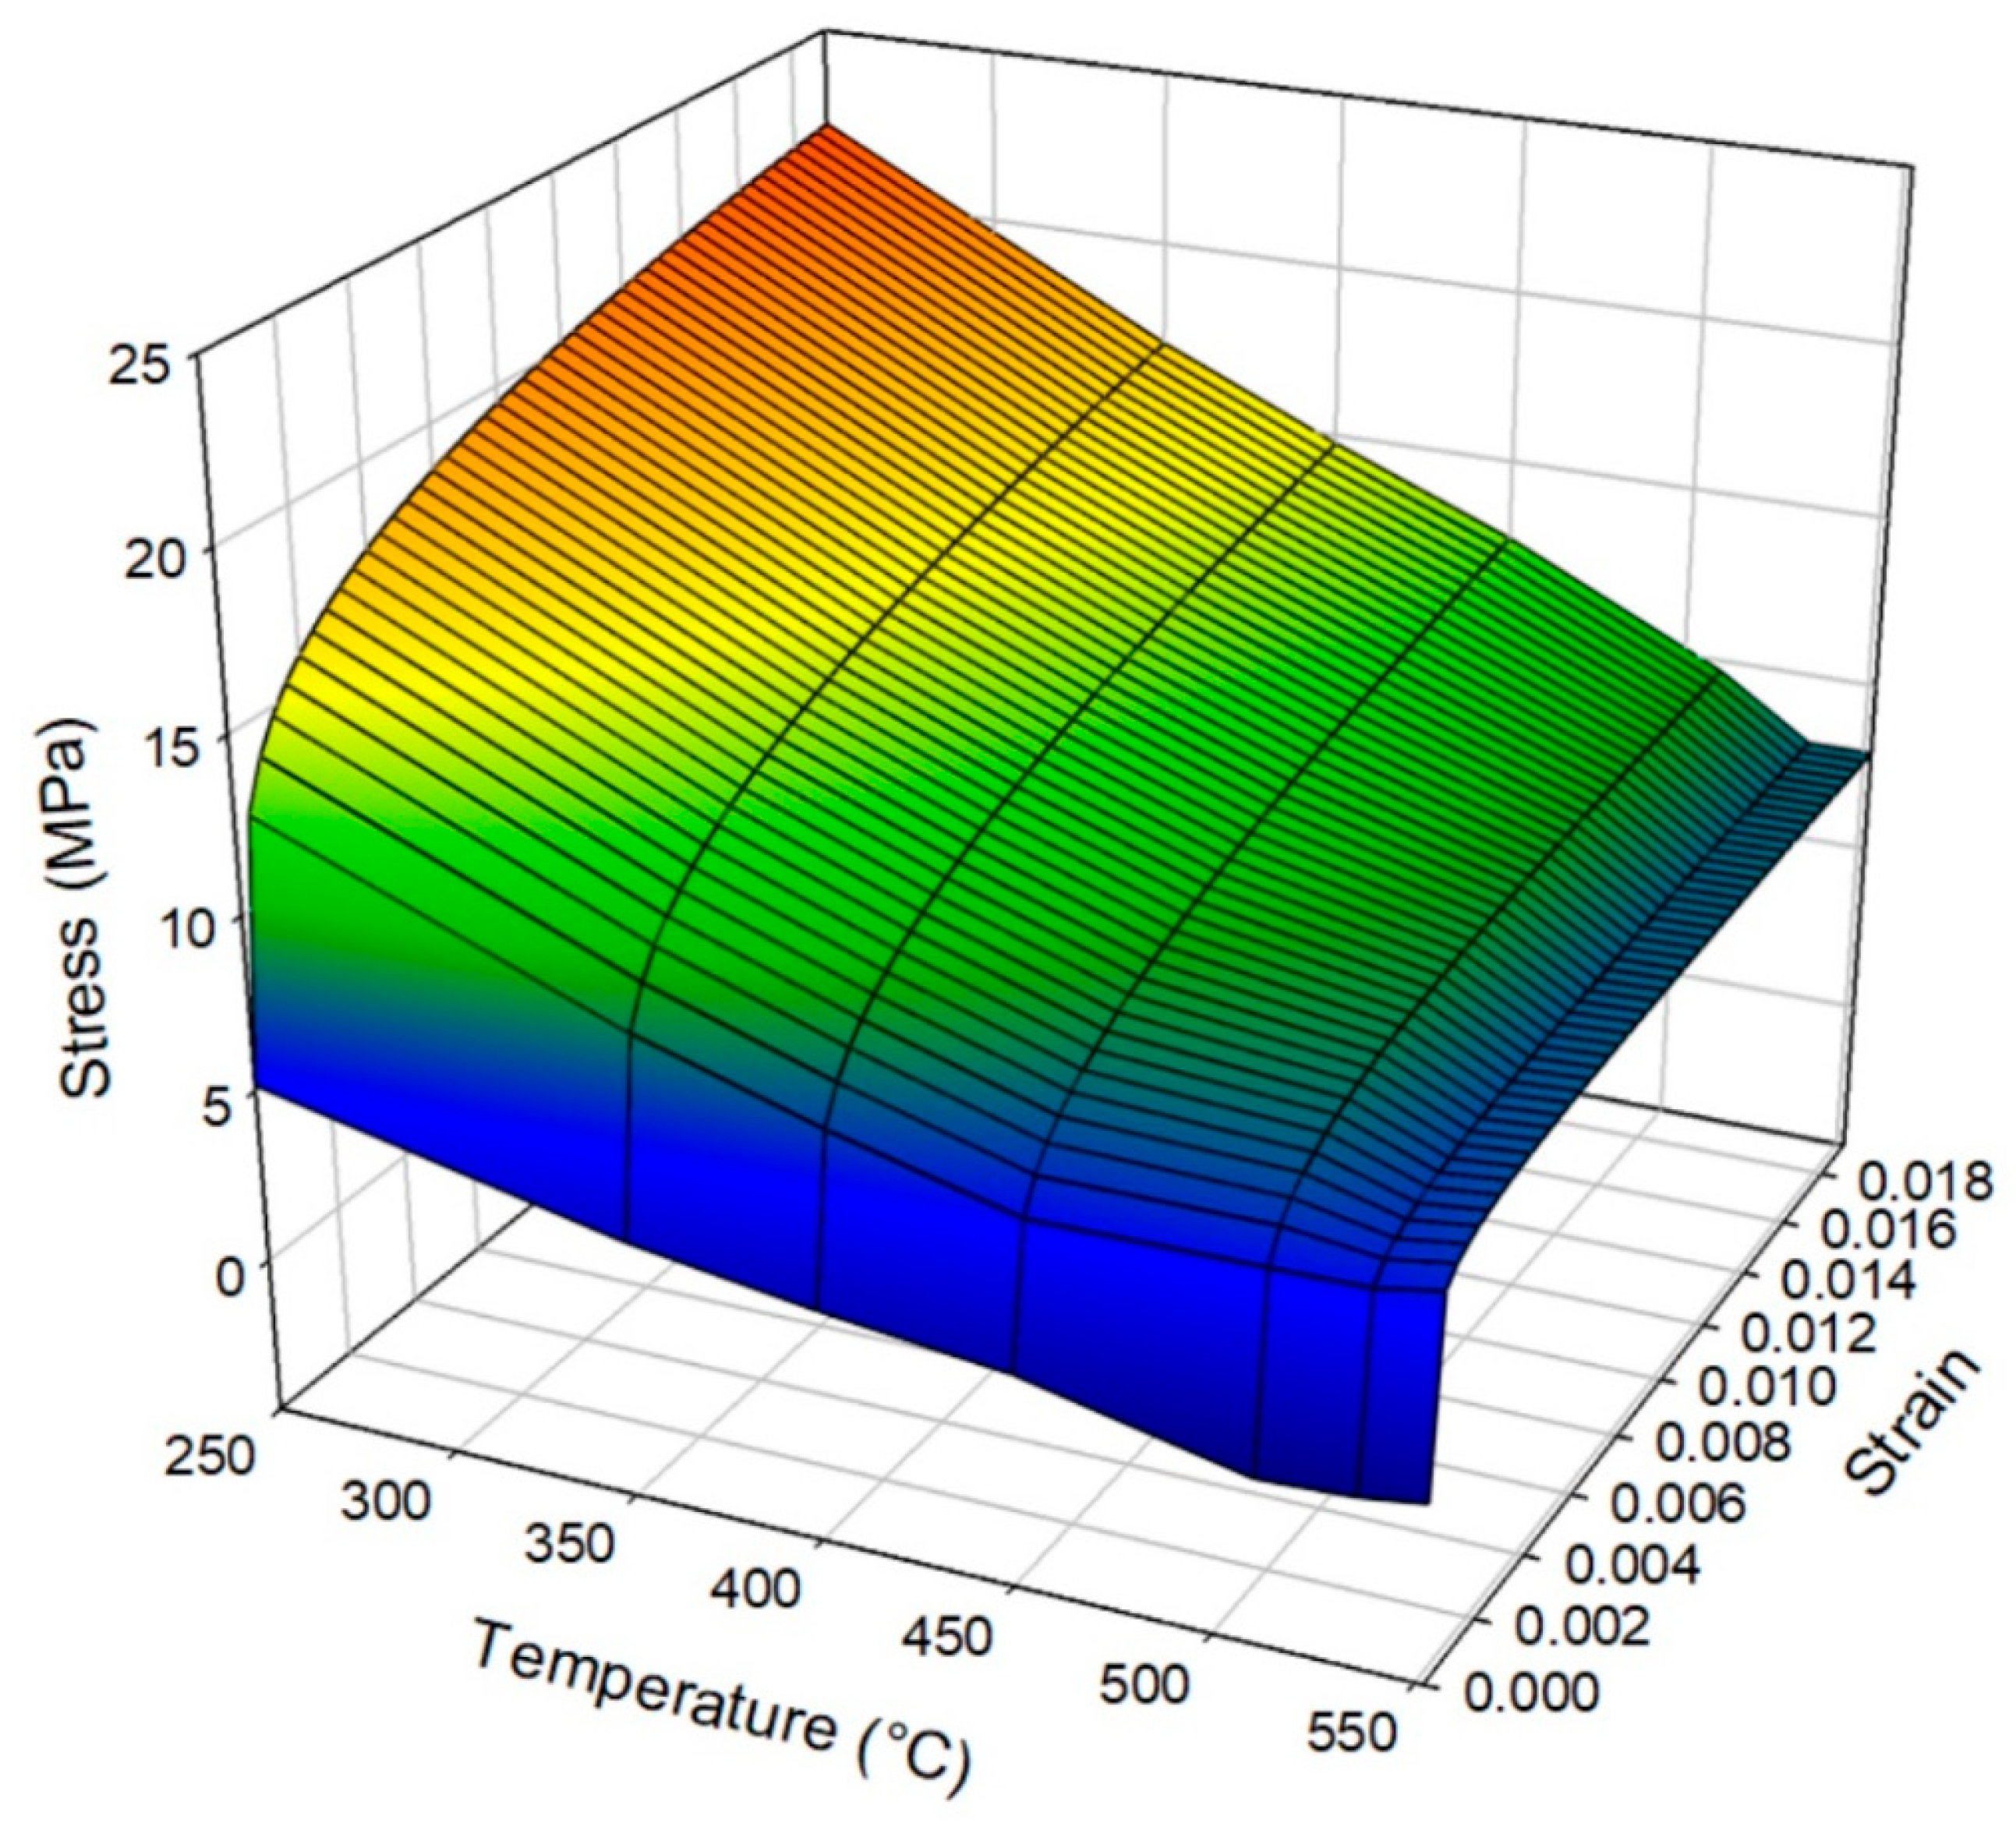
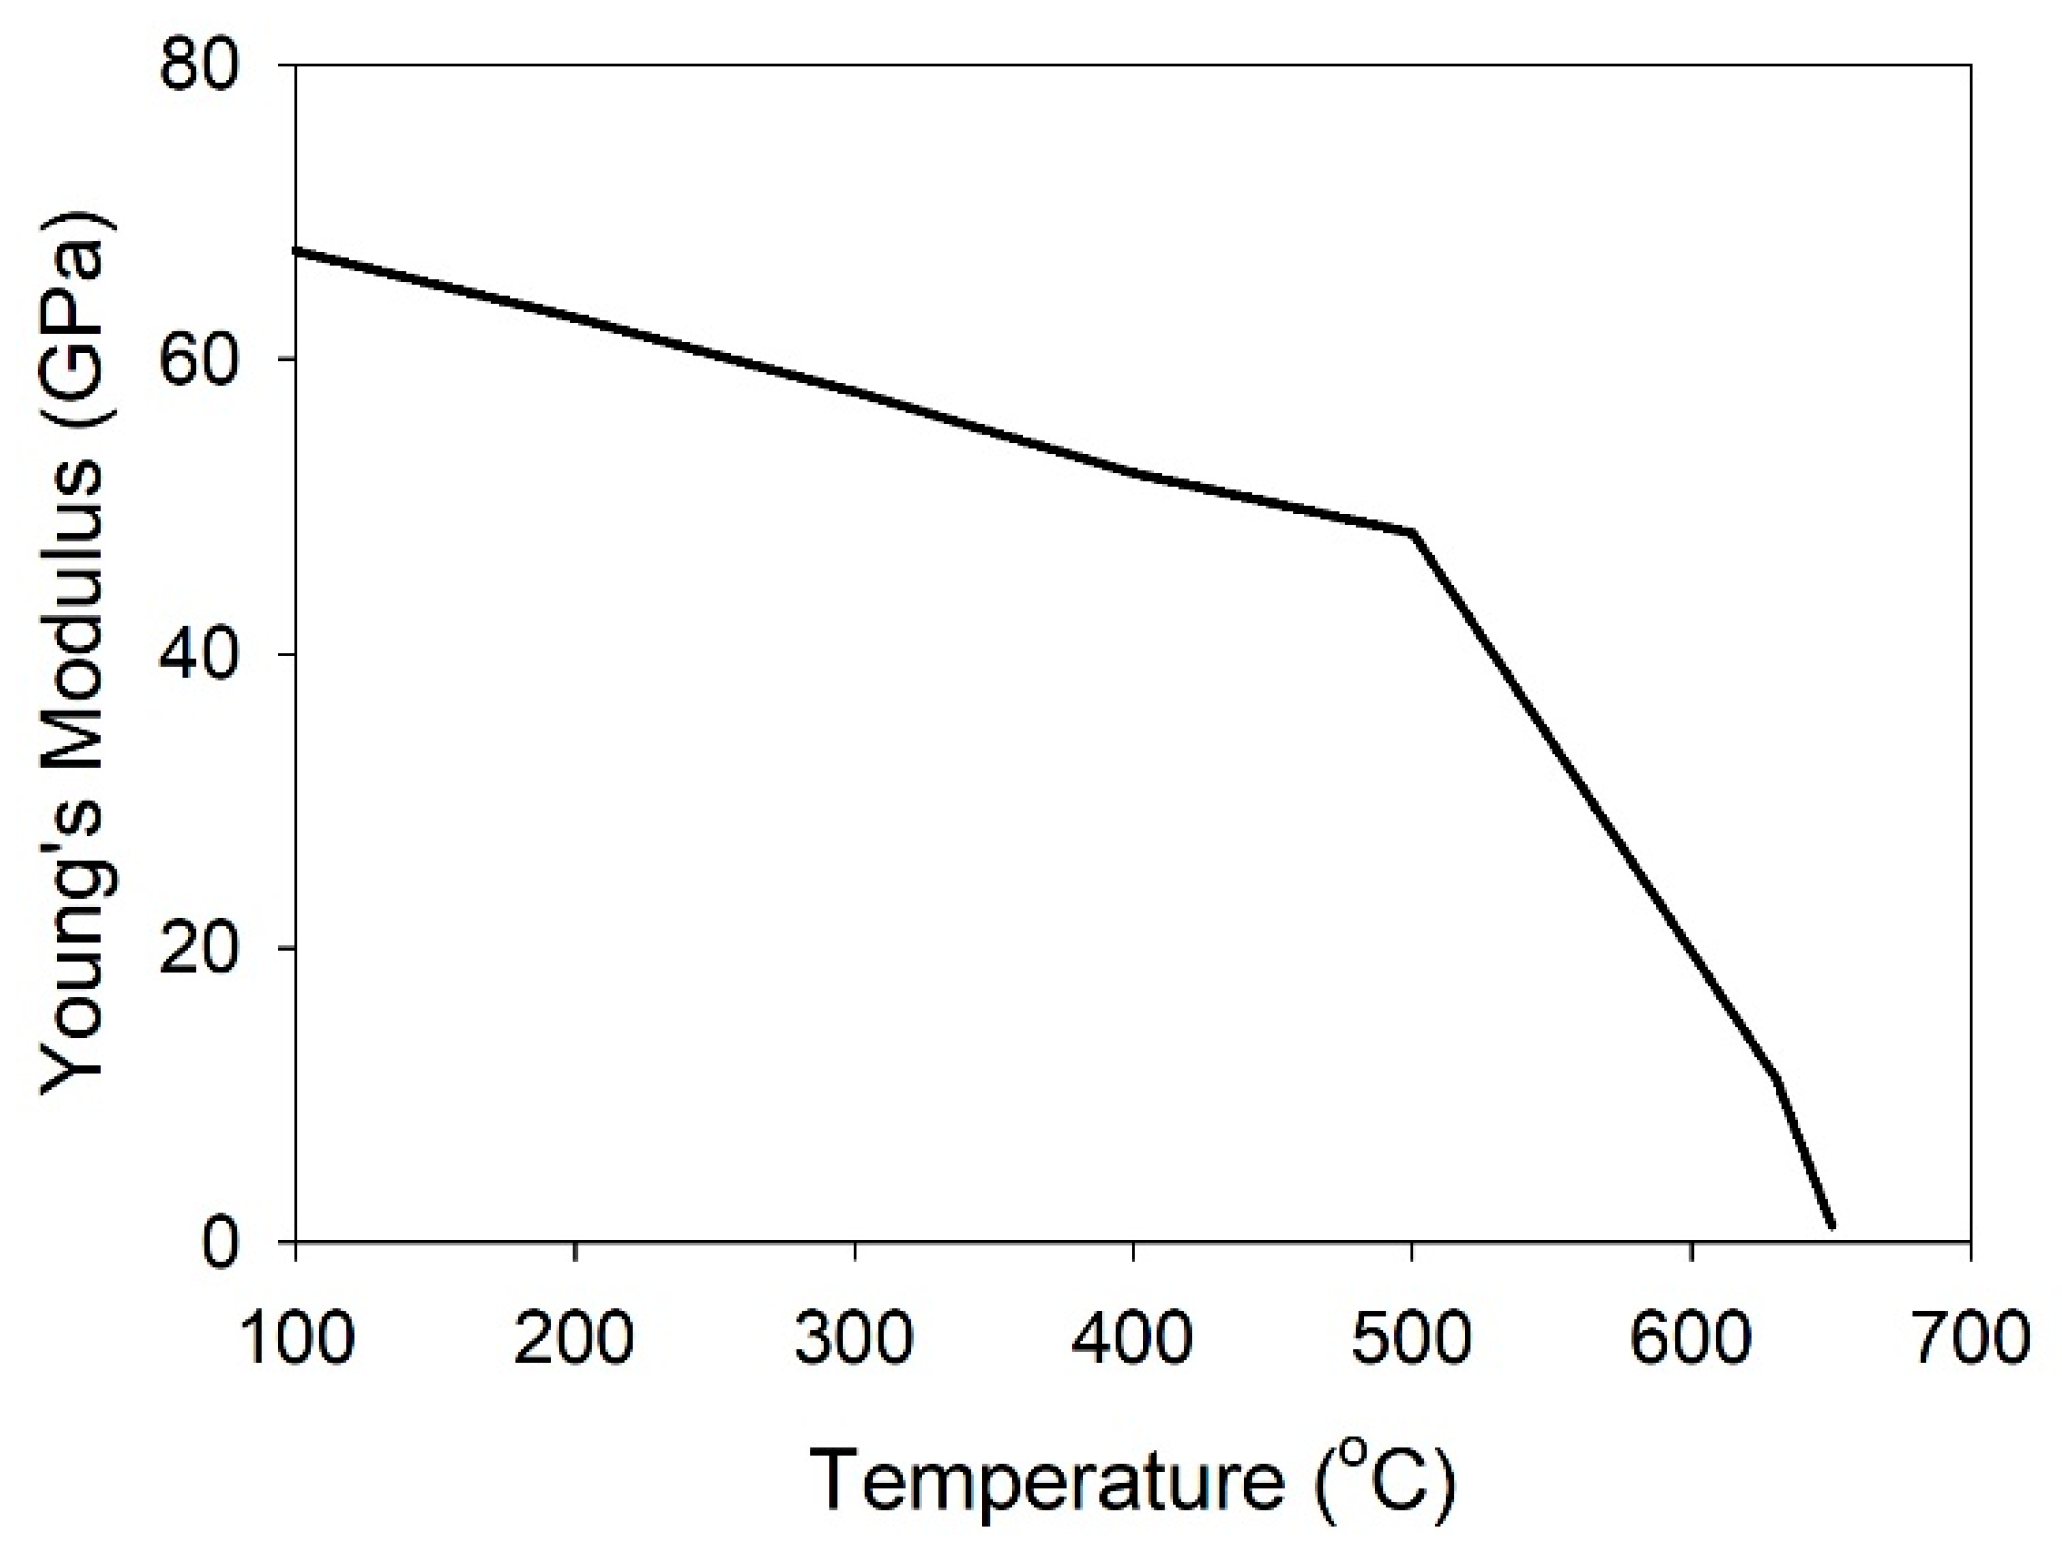
2.3. Material Properties

DC casting models necessitate the incorporation of the alloy’s specific solidification path relevant to the simulation. Precisely identifying the start and end of solidification, as well as predicting the evolution in solid fraction with temperature, are extremely important. These parameters are closely intertwined with the mechanical properties in the semi-solid state. Consequently, to achieve reliable predictions of semi-solid stress–strain behaviors, an accurate representation of the alloy’s solidification path must be included in the model.
Solid phase precipitation during solidification was calculated with a model proposed by Larouche [28], which accounts for both back-diffusion and micro-segregation. The results are shown in Table 2. As can be seen, the microstructure of the AA6111 alloy consists of α-Al dendrite cells and several intermetallic phases, including primary Mg2Si, two Fe-rich intermetallics (α-Al15(Fe,Mn)3Si2 and β-Al5(Fe,Mn)Si), and two Cu-bearing intermetallics (Q-Al5Mg8Si6Cu2 and θ-Al2Cu) [29]. Figure 5 illustrates the calculated fraction solid versus temperature curve for the AA6111 alloy as predicted by [28]. The liquidus and solidus temperatures of this alloy are seen to be 652 and 510 °C, respectively.
Thermophysical properties for AA6111 alloy were extracted from references [13,30,31]. The thermophysical properties utilized in this model are provided in Table 3. The density of the material is held constant at 2400 kg/m3 to avoid altering the mass, since the volume of the computational domain is held constant. Poisson’s ratio was considered to be 0.3.
The plastic stress data, used as input in the coupled temperature–displacement analysis to simulate the alloy’s behavior during solidification, were calculated based on the tensile test results of Qassem et al.’s work on AA6111 [29], which were obtained near the solidus temperature. The creep stress was calculated with the model proposed by Larouche et al. [24]. According to this model, when sufficient liquid is present between grains, fully lubricated sliding can occur. To apply this concept to stress, a parameter κ was used, which represents the fraction of grain boundaries where sliding does not occur. In other words, this parameter determines how much of the applied stress contributes to plastic deformation. If σyield is the nominal stress required to activate plastic deformation through these boundaries, then by combining a portion of the yield stress with the stresses induced by the two mechanisms, which are σ c r e e p (non-lubricated) and σ v i s c (lubricated), the average stress can be expressed as follows [24]:
σ = κ · σ y i e l d + ( 1 κ ) · ( 0 h t r a n s σ c r e e p ψ i n d h + h t r a n s σ v i s c ψ i n d h )
where h is the channel thickness between solidified particles, htrans is the critical channel thickness, and   ψ i n is the log-normal distribution of h. The values for σvisc and ψ i n are calculated via the following:
σ v i s c = μ ε ˙ 9 [ ( 1 g s m ε 2 ) 3 + 2 ( 1 g s m + ε ) 3 ]
ψ l n = 1 h 2 π · ln ϕ g exp [ 1 2 ( ln h ln h m e d ln ϕ g ) 2 ]
where gs is the solid volume fraction, m is a microstructure factor, µ is the viscosity of the liquid phase, ε is the uniaxial strain, and ɛ ˙ is the uniaxial strain rate. In Equation (3), ϕ g is the standard geometric deviation, and hmed is the median value of h. The standard geometric deviation is a key parameter in the log-normal distribution that describes the dispersion or spread of the channel thickness distribution.
The influence of temperature and strain rate on material deformation is expressed as below [30]:
ε ˙ = A [ sinh ( α σ ) ] n exp ( Q R T )
where σ is the flow stress (MPa); T is the temperature (K); R is the gas content; Q is the thermal deformation activation energy (J.mol−1); and A, n, and α are material constants. The flow stress was used to describe the non-lubricated creep behavior at high temperatures.
Table 4 gives the value of the constants required for these equations that were taken from the references [24,30]. Based on Equation (2) and the relevant parameters, the values of ϕ g and κ were adjusted to optimize the fit between the experimental results and the curve generated by the model.
Table 5 shows the value of ϕ g , κ, and σyield used with strain rates of 0.0001 and 0.001 s−1 and temperature between 510 and 564 °C. The stress was interpolated between the pre-determined values of strain, strain rates, and temperature. Figure 6 illustrates the modeled and experimental curves at temperatures of 535 and 564 °C. The graph in Figure 7 demonstrates how the calculated flow stress changes with the plastic strain and temperature when the strain rate is 0.0001 s−1. The reader is referred to [24] for a complete description of the constitutive model.
The Young’s modulus for this study was taken from the reference [31] for the solid state up to 500 °C. At higher temperatures, Young’s modulus is observed to decrease progressively, with a pronounced drop just above the solidus temperature [32]. This trend aligns well with previous research findings. Figure 8 shows the evolution of Young’s modulus with temperature used in this study. Young’s modulus values for higher temperatures were obtained from reference [13].

3. Results and Discussion

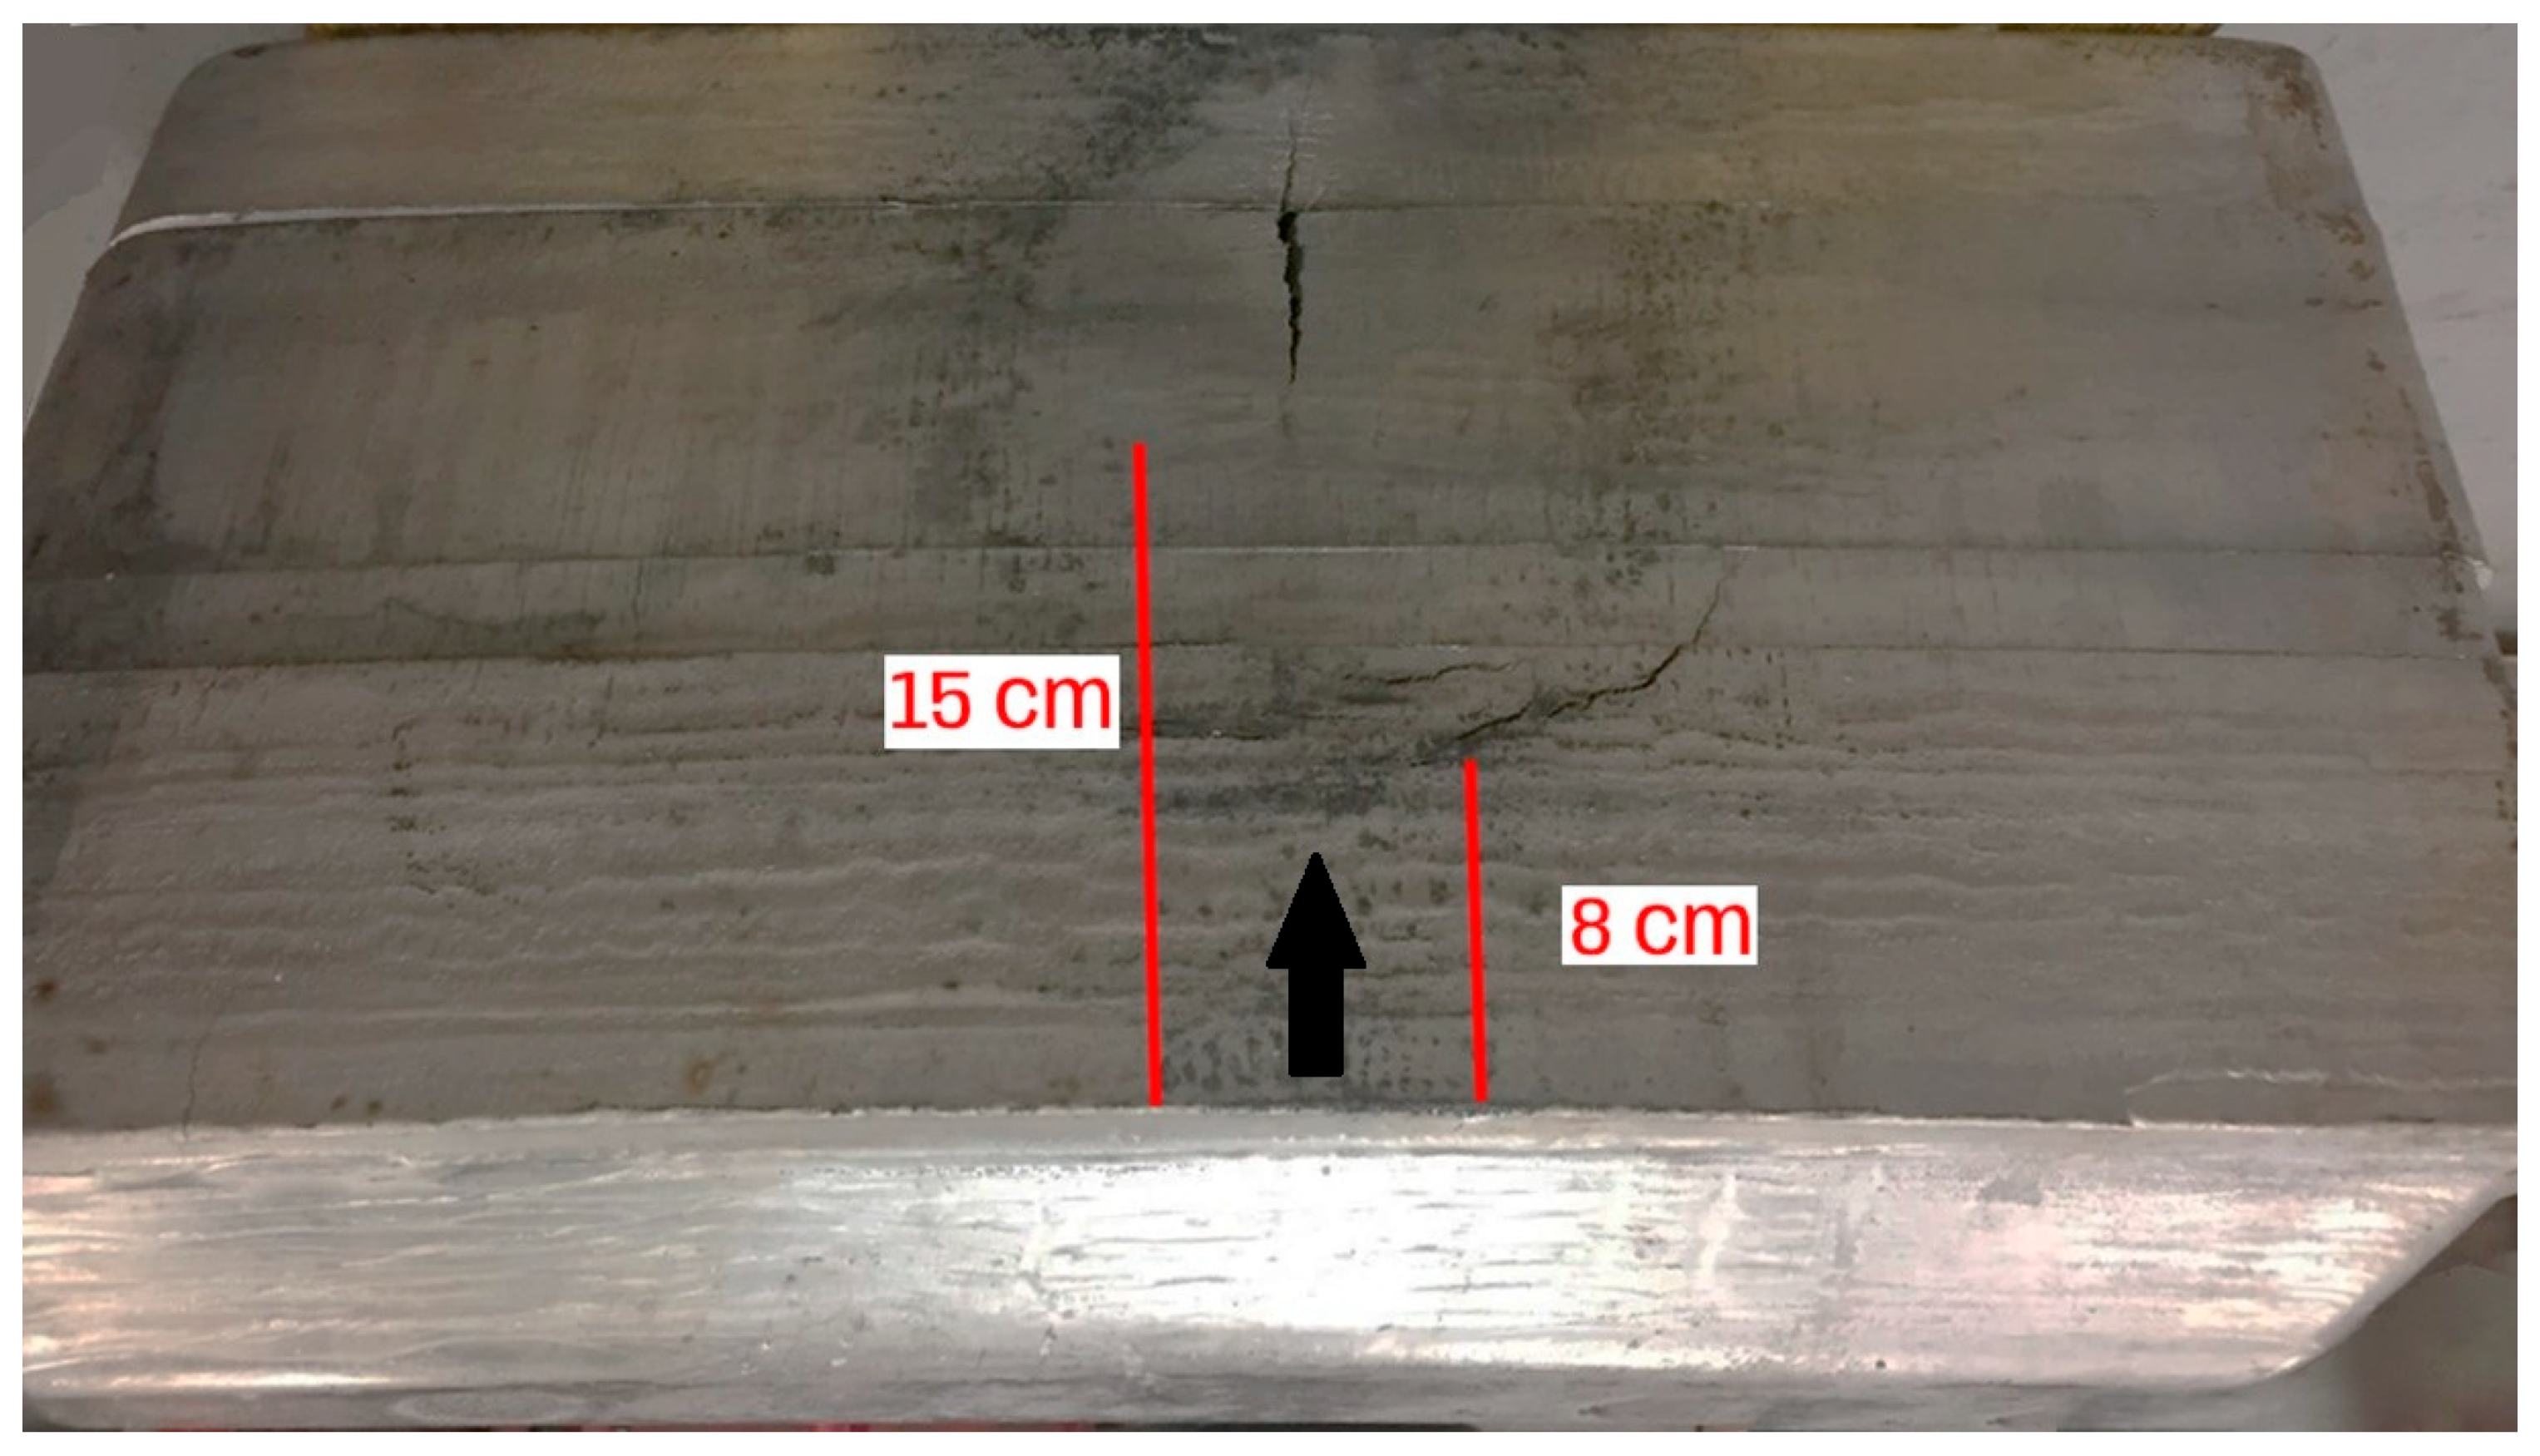
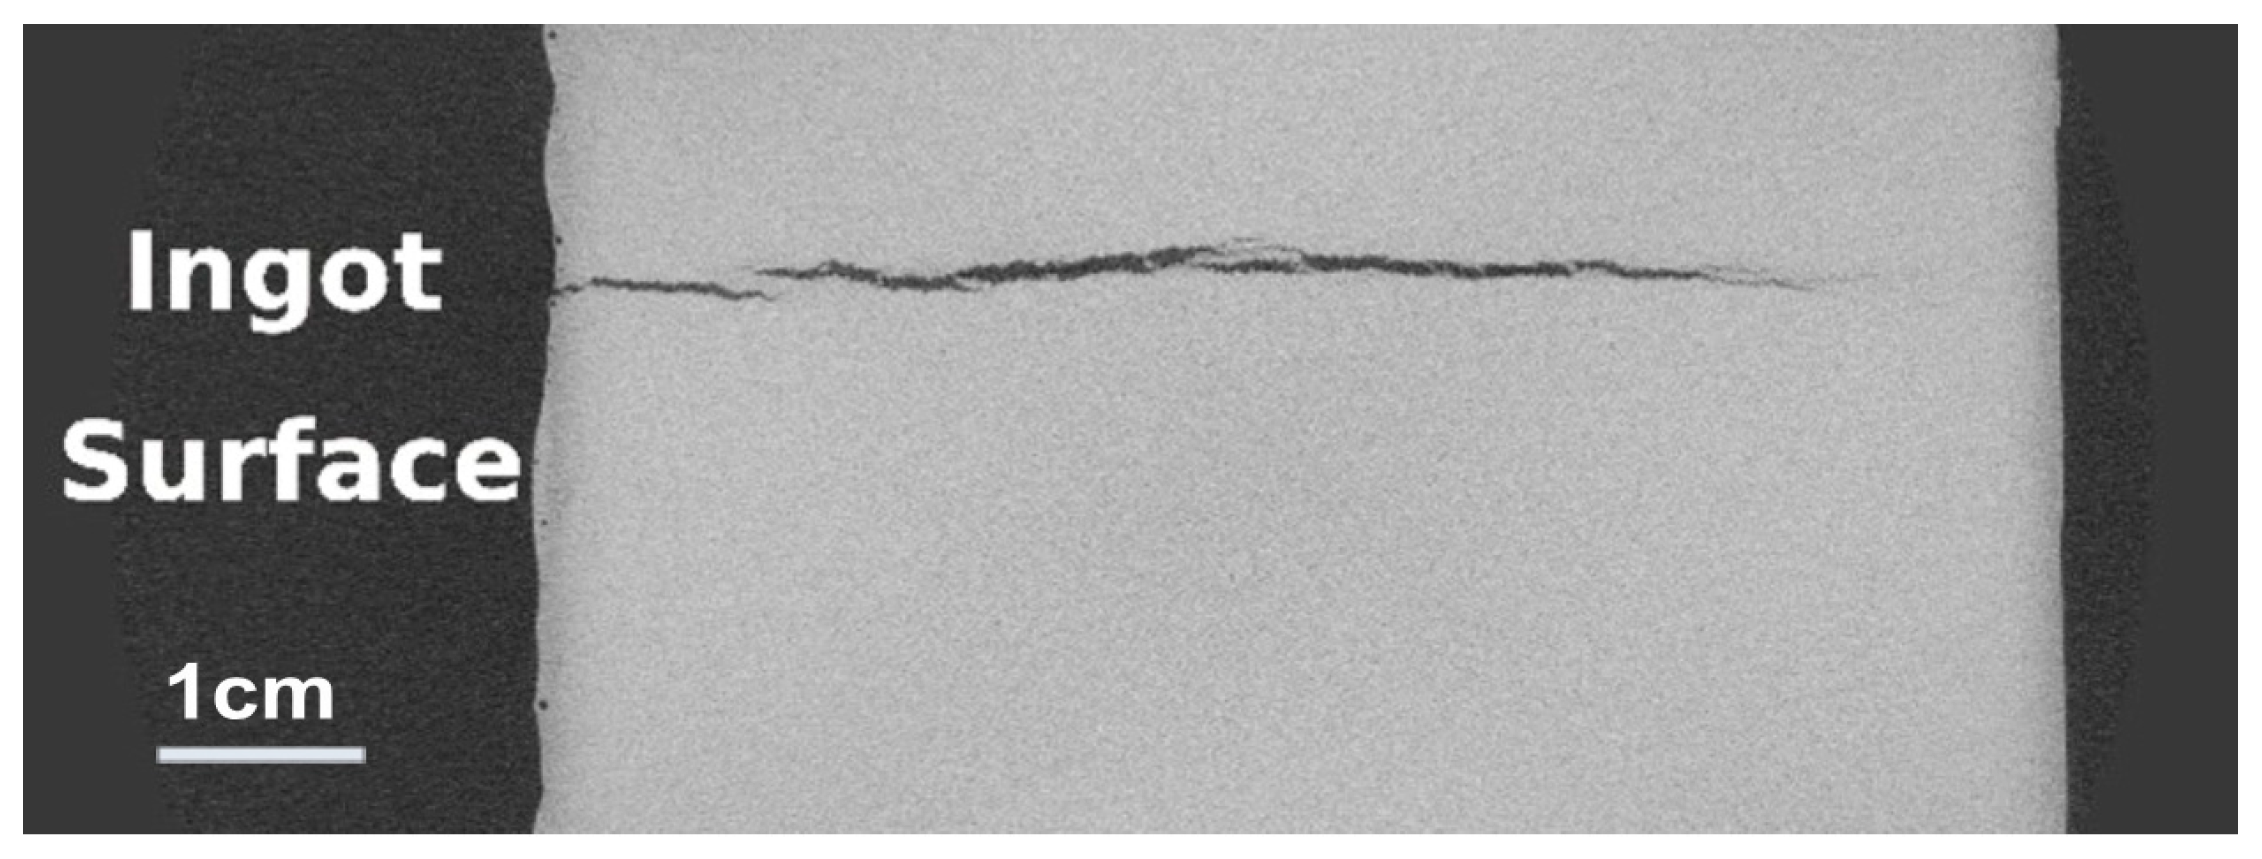
3.1. Macro Cracks in the Cast Ingots

Upon visually inspecting the cracked ingot cast under the hot condition, shown in Figure 9, it is observed that the first transverse cracks (perpendicular to the casting direction) emerge at approximately 8 cm above the ingot and bottom block interface. Following this, more severe and deeper longitudinal cracks begin to form, starting 15 cm above the mentioned interface. These two types of cracks differed in their appearance and characteristics. Evidence of remelting in the last stage of solidification and deformation was seen in the longitudinal cracks in the higher position of the ingot. In contrast, the transverse cracks in the lower position were generally thin and small and exhibited minimal deformations on the crack surfaces. The longitudinal cracks seem to have been produced by hot tearing, while the transverse cracks resulted most likely from another defect, cold cracking.
Under the cold condition, the rolling face of the ingot exhibited no cracks, while two large cracks were found on the ingot bottom touching the bottom block (see Figure 10). This region is not included in the final ingot as it is typically cut off at the beginning of downstream processing. The presence of these cracks in the cold ingot and hot tearing in the hot ingot suggests that the relaxation of stresses caused by cracking was different.

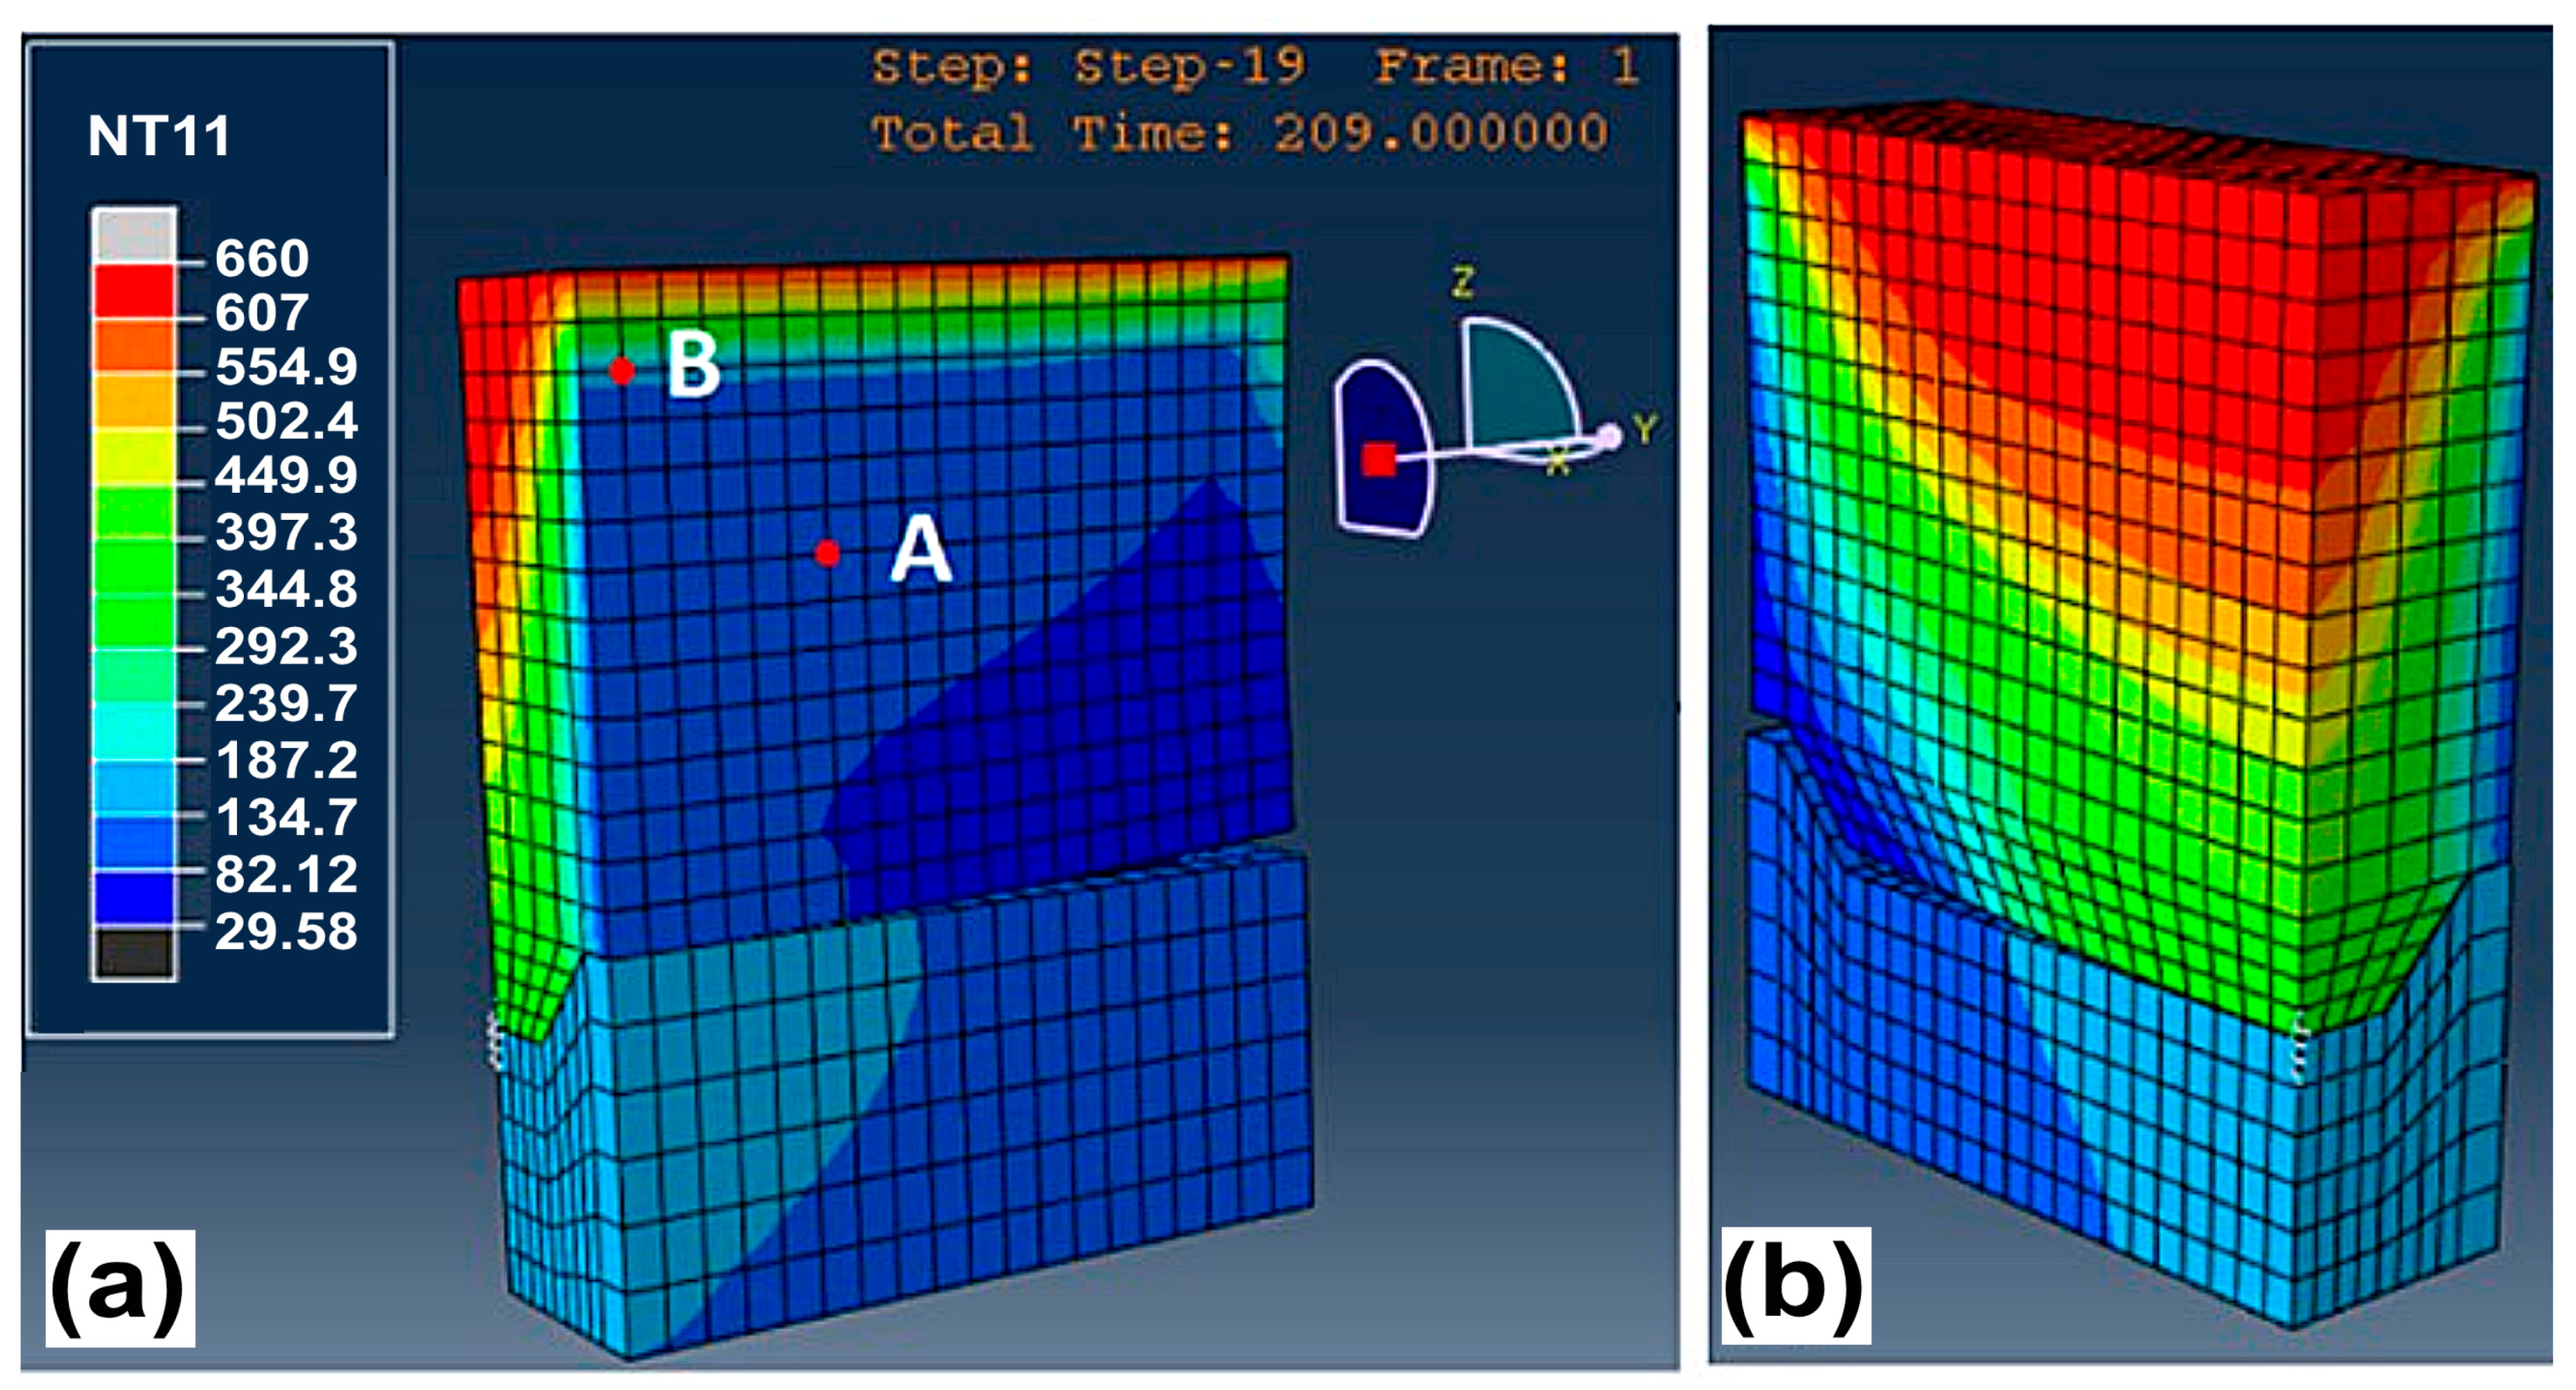
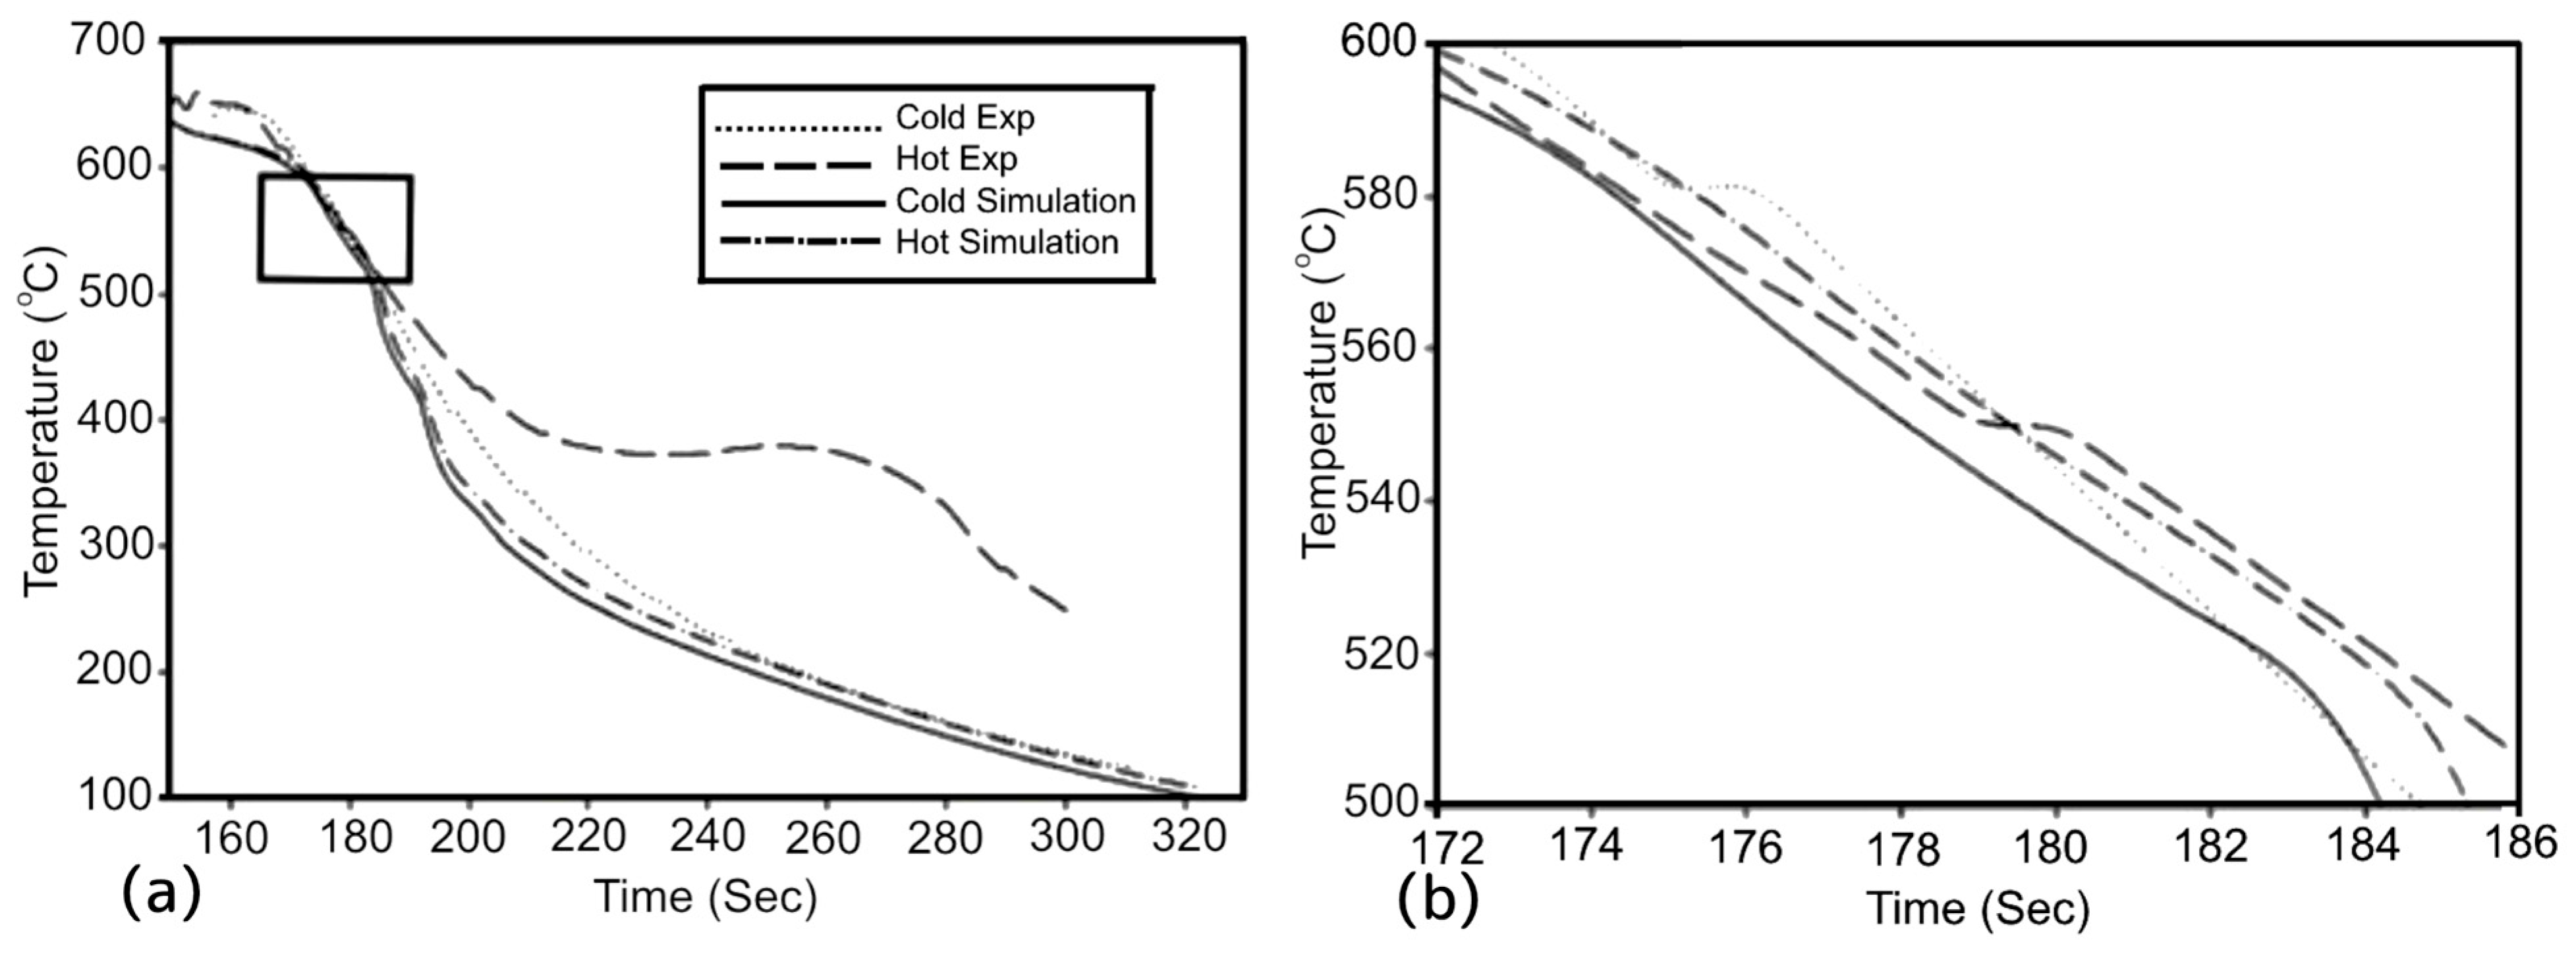
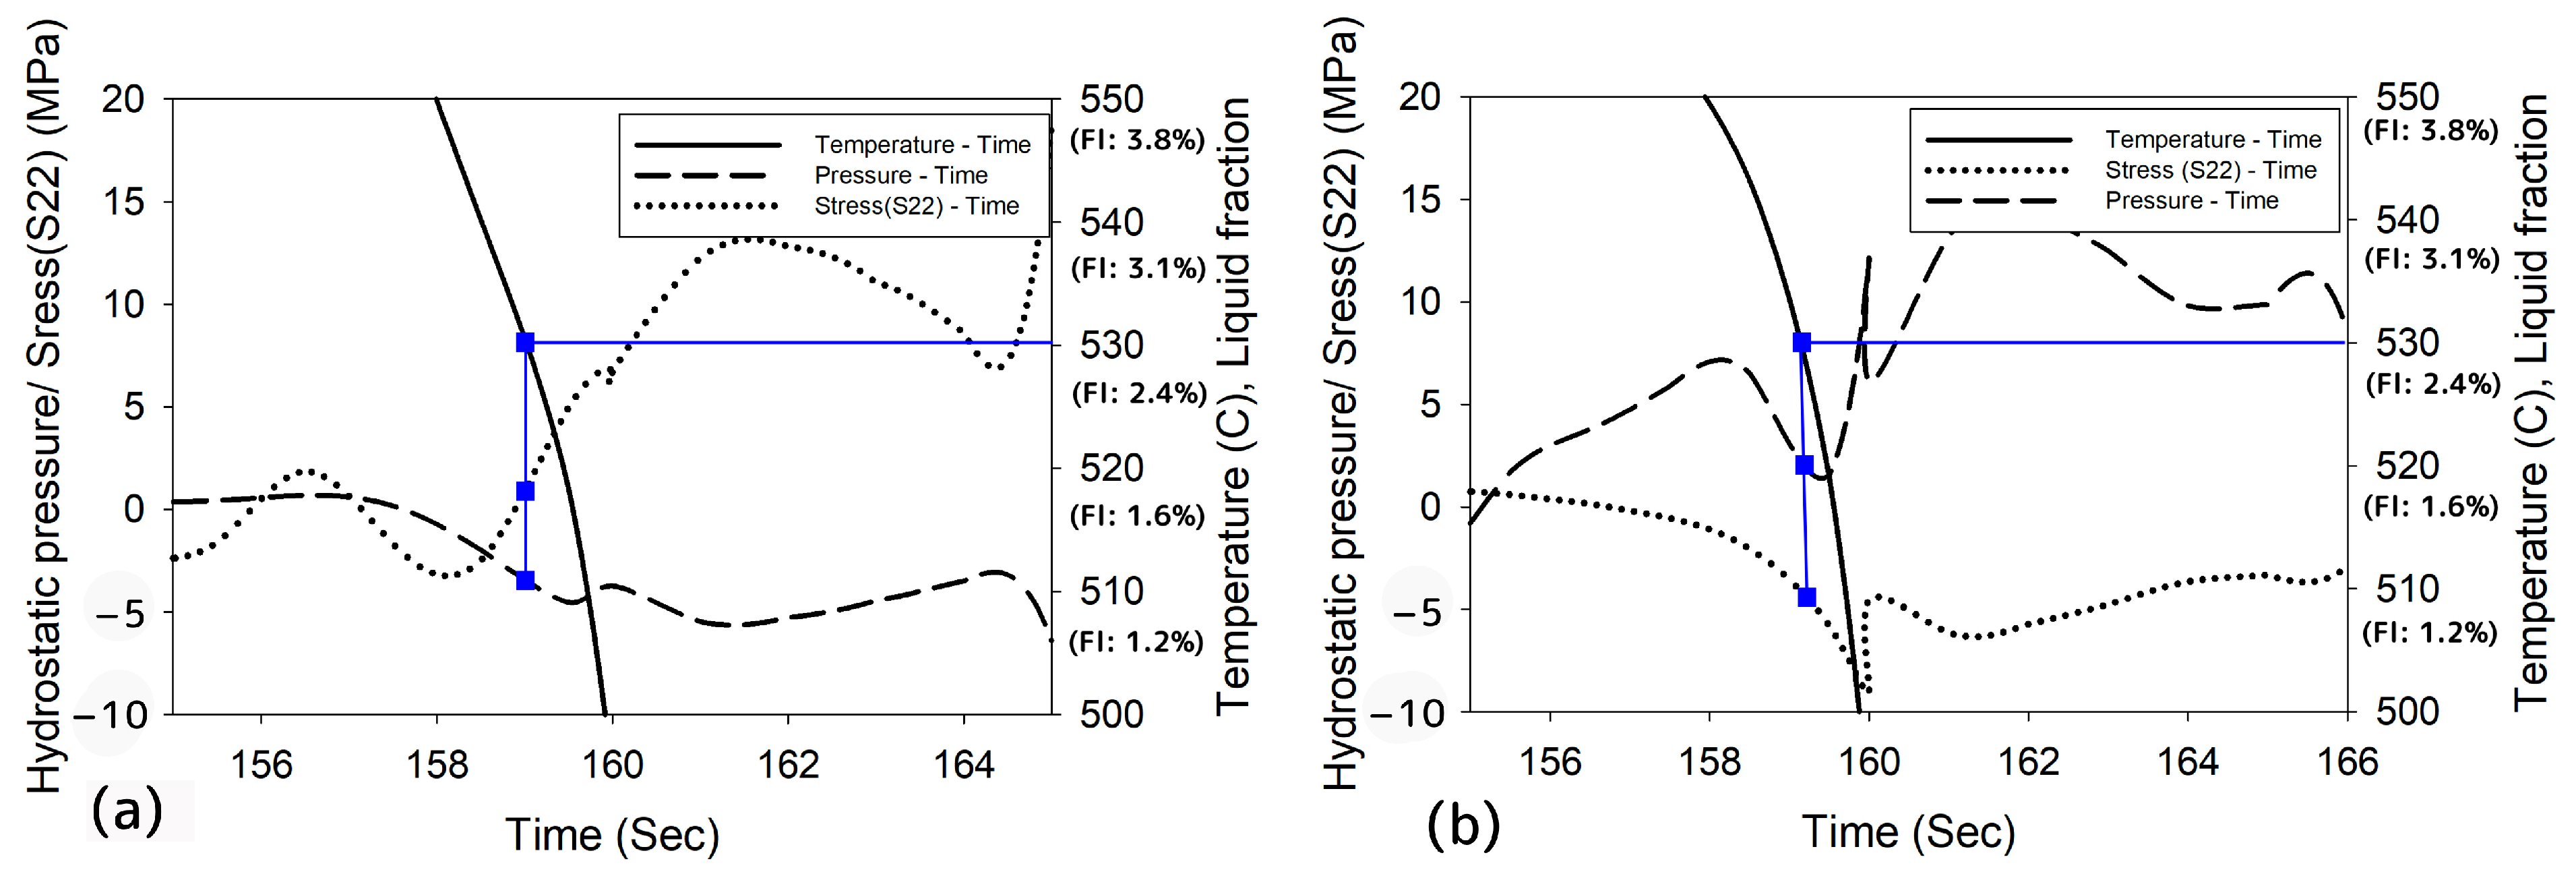
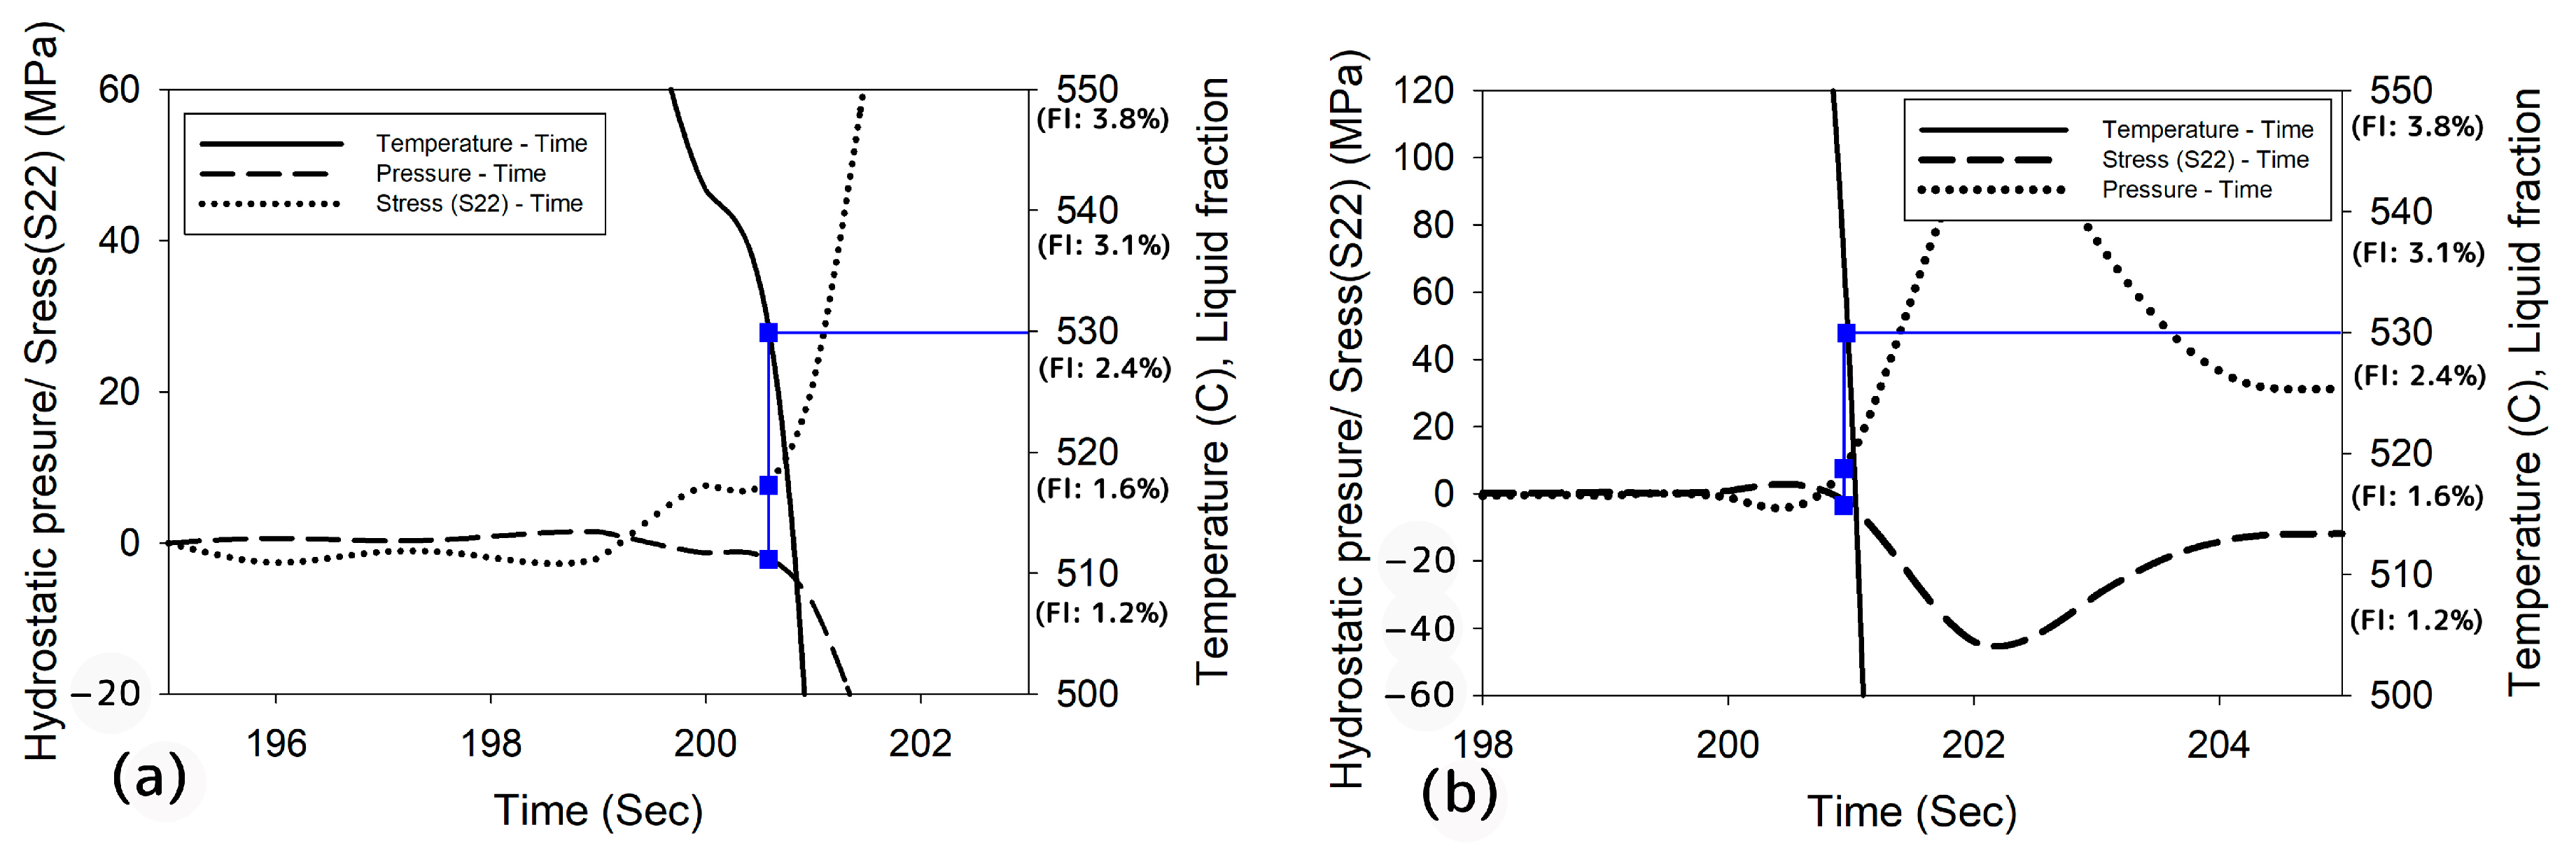
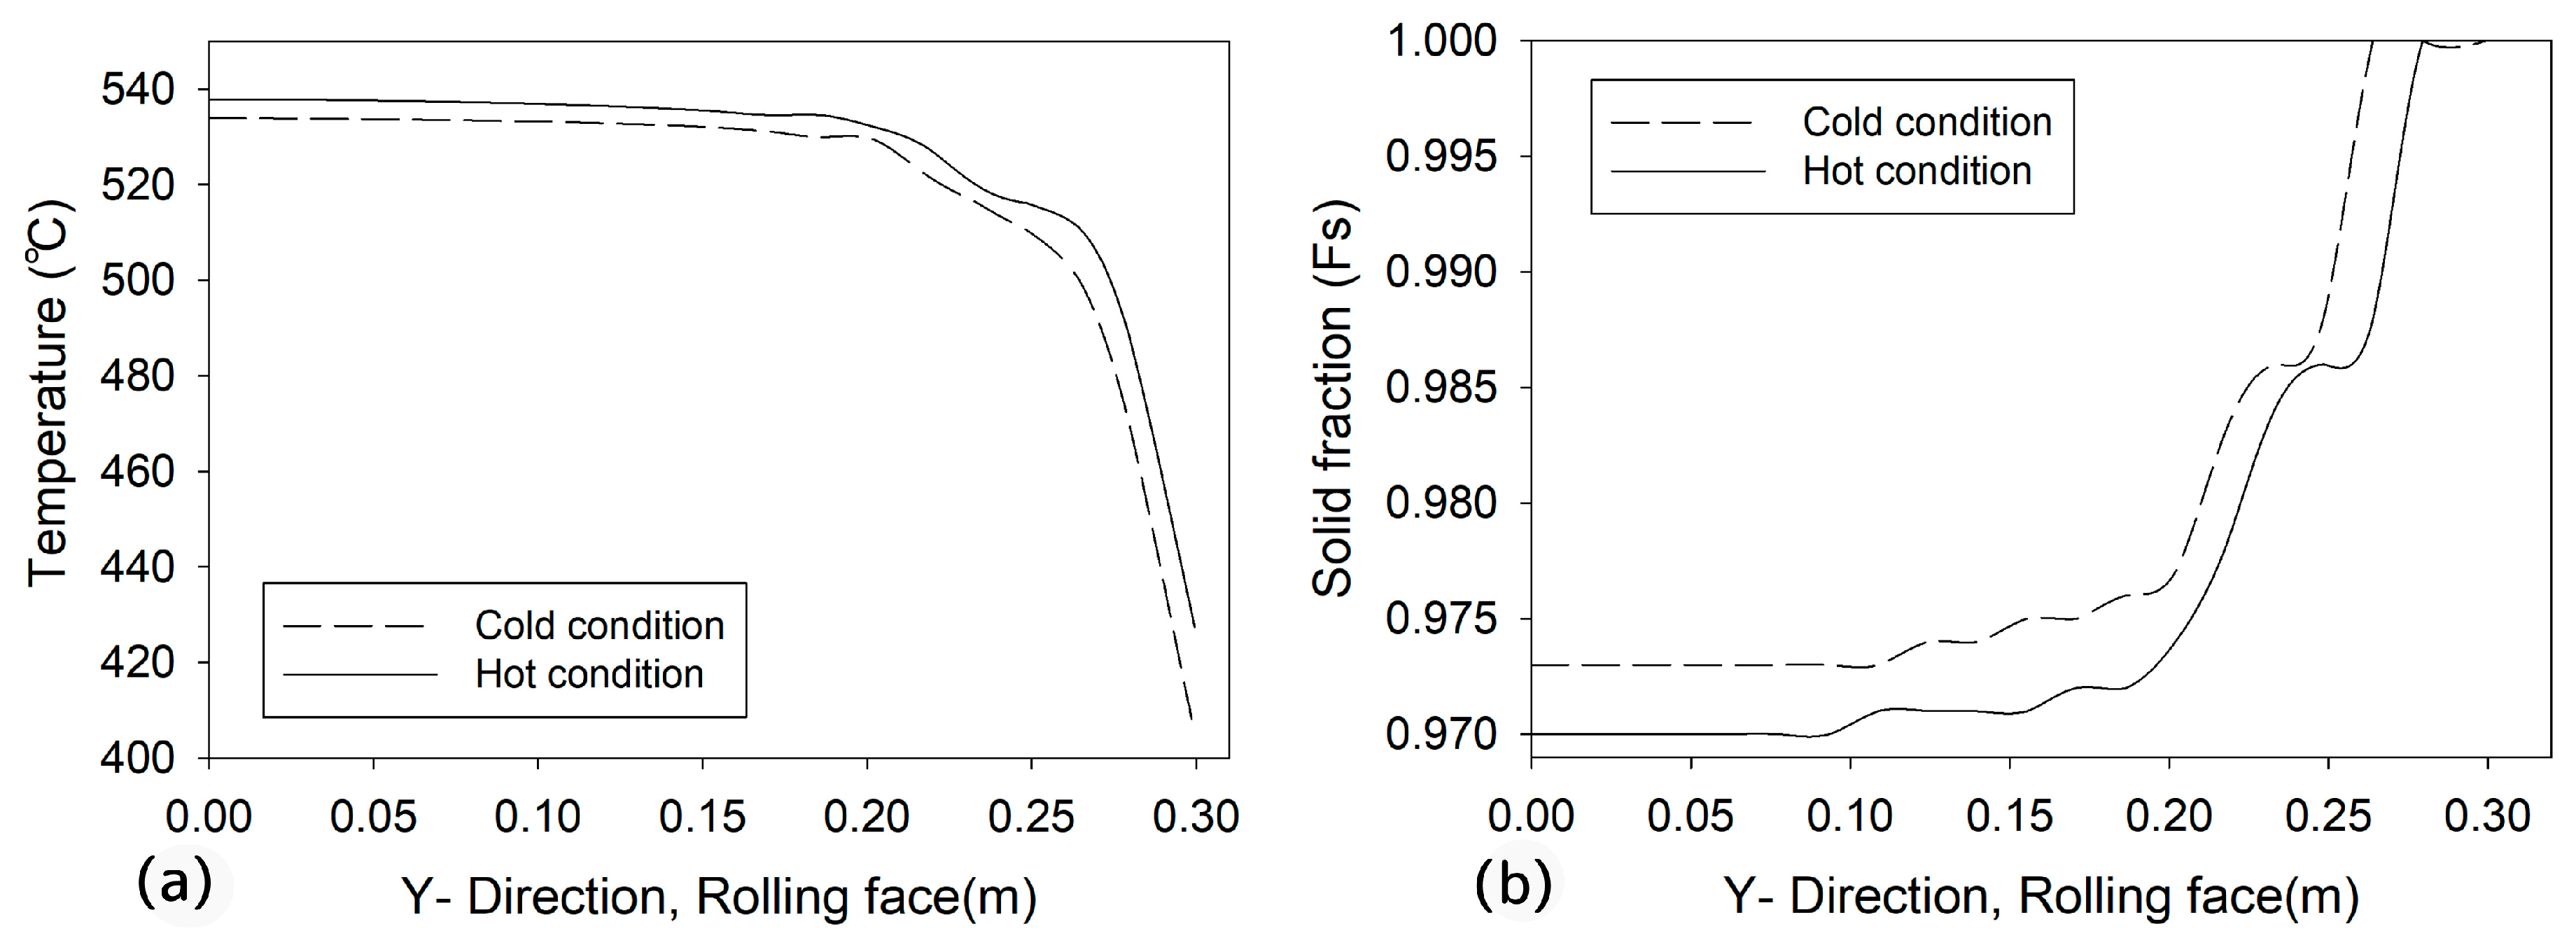
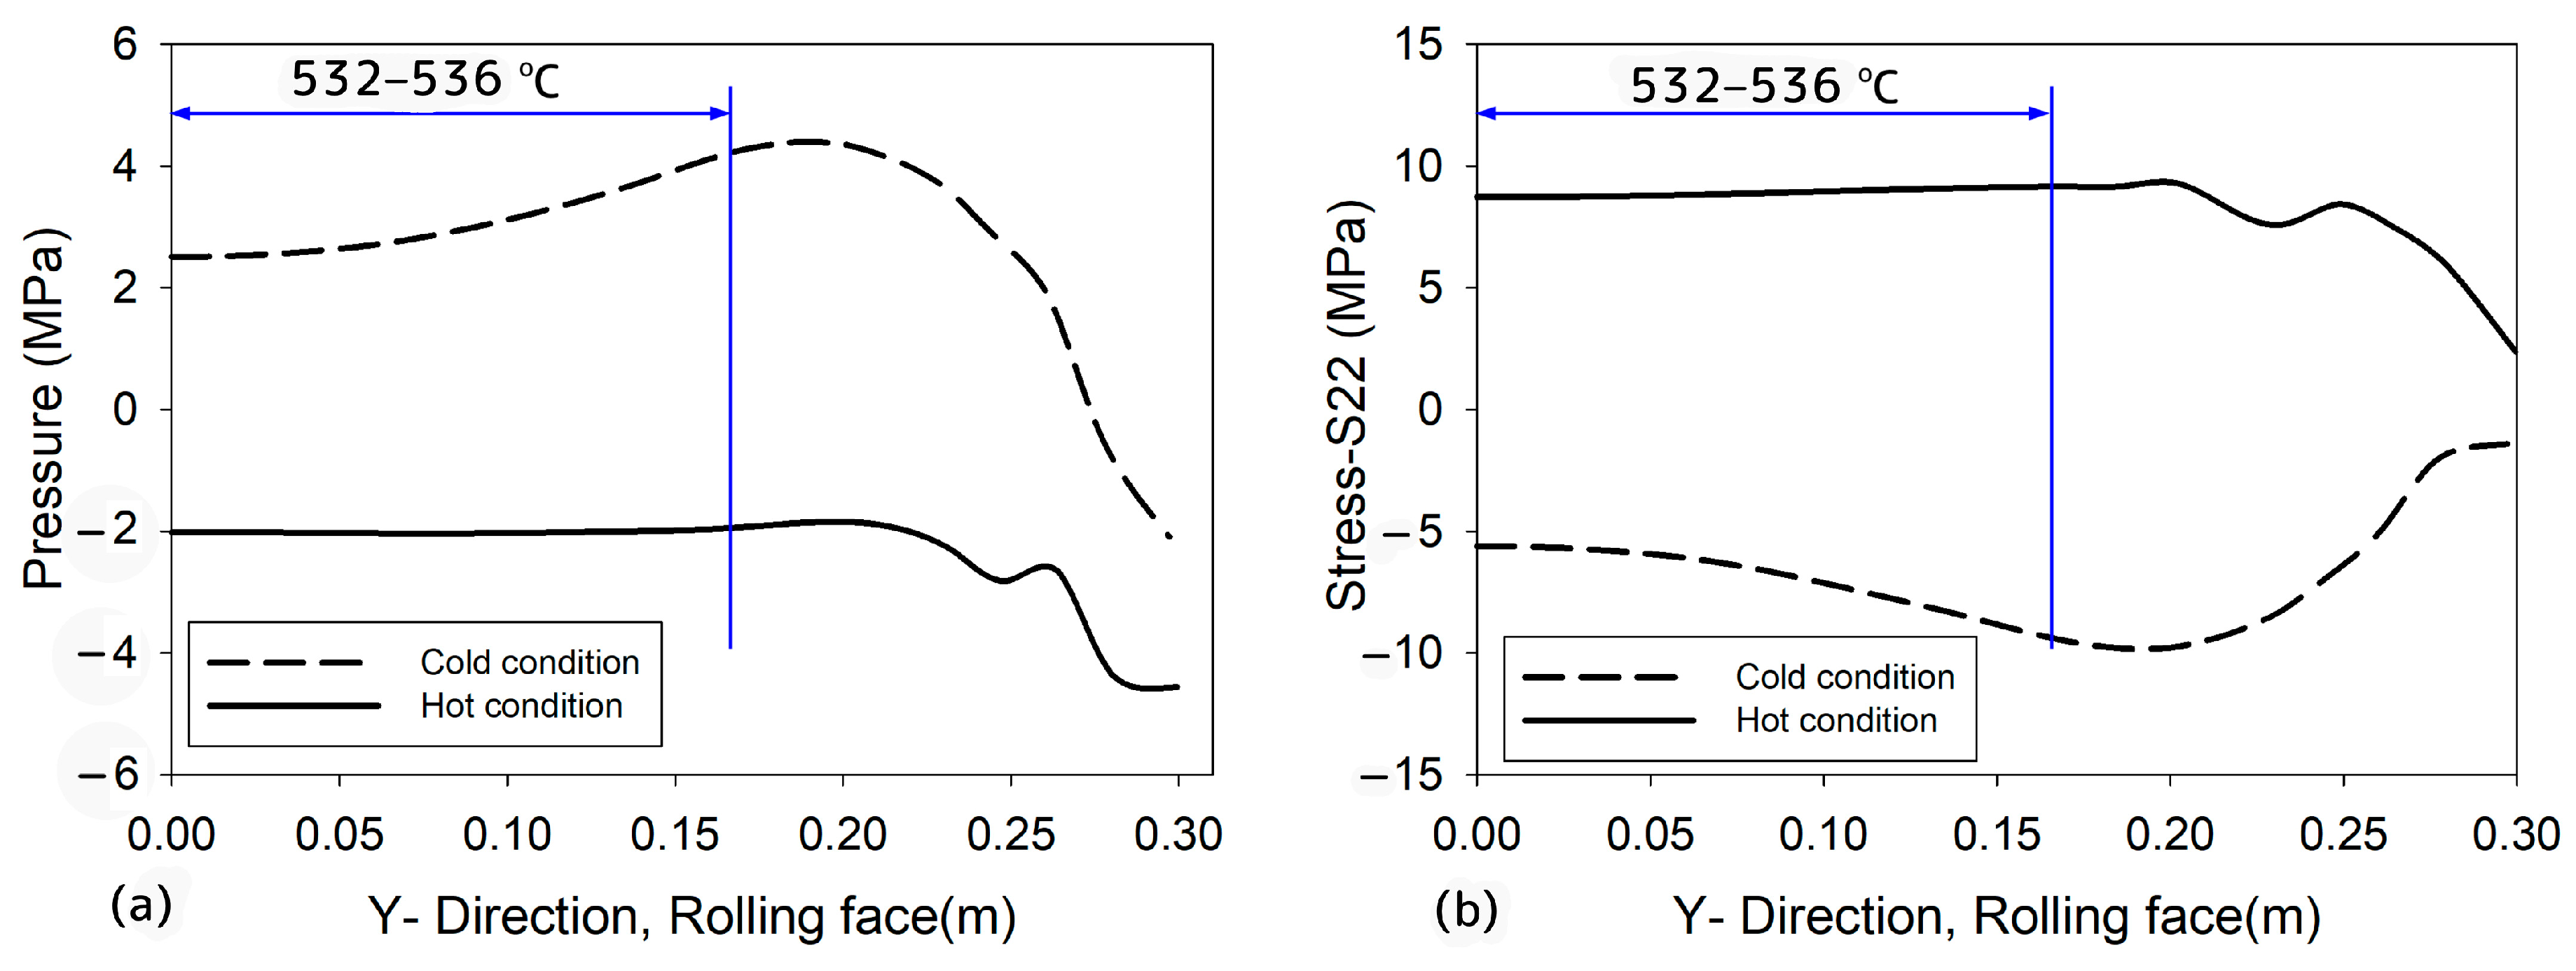
3.2. Modeling and Its Analysis

Figure 11 shows a contour plot of the ingot temperatures after 209 s, with (a) showing the rolling face and (b) the symmetry faces. As can be seen, the metal was in direct contact with the mold and water spray on the external surfaces, which rapidly cooled. However, the cooling process was slower in the center of the ingot and along the symmetry faces. Figure 12a displays calculated and measured temperature variations during the casting of the ingot at the positions corresponding to the embedded thermocouples for each ingot under hot and cold conditions. Figure 12b provides a magnified view of the temperature range where hot tearing is likely to occur. The experimental hot condition curve displays a different pattern that shows a change in the slope and reheating phenomenon. This is likely due to the infiltration of molten metal into hot tearing cracks, which raises the temperature around the cracked areas. Since the tip of the embedded thermocouple was close to the severe hot tearing crack, it captured this change in heat flow. Of course, the mathematical simulation cannot consider localized reheating caused by hot tearing. As expected, the cold simulated curve during solidification and cooling has a lower temperature than the hot condition simulated curve. An overall observation reveals a satisfactory agreement between the simulation and experimental results when cracking does not occur.
Figure 13 and Figure 14 illustrate the evolution of temperature, hydrostatic pressure, and the S22 stress component during solidification at specific points and near the solidus temperature (A and B in Figure 11). It is necessary to mention that, since hot tearing cracks occur in a longitudinal orientation, the stress (S22), which is perpendicular to the crack along the rolling face in the Y direction (Figure 11a), plays a key role in their formation. Since the model combines the material properties as one phase, it was assumed that the pressure within a finite element remains the same in both the liquid and solid phases. The values of S22 and hydrostatic pressure were taken from the finite elements located along the rolling face. At a temperature of 530 °C and a liquid percentage of 2.4% at both points A and B under the hot conditions, the hydrostatic pressure values were negative: −4.3 MPa for point A and −1.6 MPa for point B. The corresponding stress in the y-direction (rolling face) was 1.8 MPa for point A and 8.7 MPa for point B. In the cold conditions, the hydrostatic pressures at both points were positive, 2.1 MPa at point A and 9.45 MPa at point B, while the stresses were negative, at −4.7 MPa for point A and −3.06 MPa for point B, respectively. In both positions A and B, there are negative hydrostatic and positive S22 values in the hot condition that promote the formation and propagation of porosities and hot tearing. In both images, the blue lines represent the stress and pressure values at a temperature of 530 °C and a liquid fraction of 2.4%.
To better link the stress predictions with hot tearing, results were extracted for a specific line positioned 16 cm above the bottom block on the rolling face to compare the hot and cold conditions. Figure 15a,b show the temperature and solid fraction profile along the mentioned line. As expected, the temperature profile on the surface of the ingot in the hot condition shows a higher temperature and lower solid fraction compared to the cold condition.
Figure 16 illustrates the evolution of stress (S22) and pressure along a line on the rolling faces that is located 16 cm above the interface of the ingot and bottom block for both hot and cold conditions (red line in Figure 3). For the hot condition, the hydrostatic pressure in the molten metal close to the solidus temperature along the mentioned line is negative. At the same time, the stress S22 is highly positive and prone to form porosities and hot tearing, while in the cold condition along that line, the situation is completely different. Localized negative hydrostatic pressure in a semi-solid state creates a suitable area for hot tearing formation. When positive stress in the appropriate direction occurs in this region, the possibility of hot tearing formation will increase.
The combination of negative hydrostatic and positive stress, close to the solidus temperature, is likely the cause of hot tearing [11]. After a complete investigation of stress and pressure on the surface of the ingot, it is identified that the zone, 12.8 cm above the ingot and bottom block interface, is the initial region where the hydrostatic pressure becomes negative, and S22 exhibits positive and considerably high values under hot conditions. In contrast, this situation was not observed on the surface of the ingot under cold conditions.
Upon further investigation of data extracted from nodes located 20 mm inside the external surfaces for both conditions, it was found that negative pressure and positive stress were obtained at some points under hot and cold conditions. These conditions are conducive to porosity formation. It is normal to have porosities inside the cracked ingot, but more investigation was required for the sound ingot. As shown in Figure 17a, a sample was extracted and prepared from the sound ingot at the exact location where hot tearing occurred in the cracked ingot, 20 mm beneath the external surface. Figure 17b shows an SEM image of the sample, confirming the presence of microporosities in the specific area under investigation. Even though this microporosity was generated because of the negative pressure and high positive stress (S22), the situation was reversed near the surface of the ingot cast under the cold condition because the hydrostatic pressure was positive and the tensile stress was negative there, preventing the propagation of a large macroscopic crack.

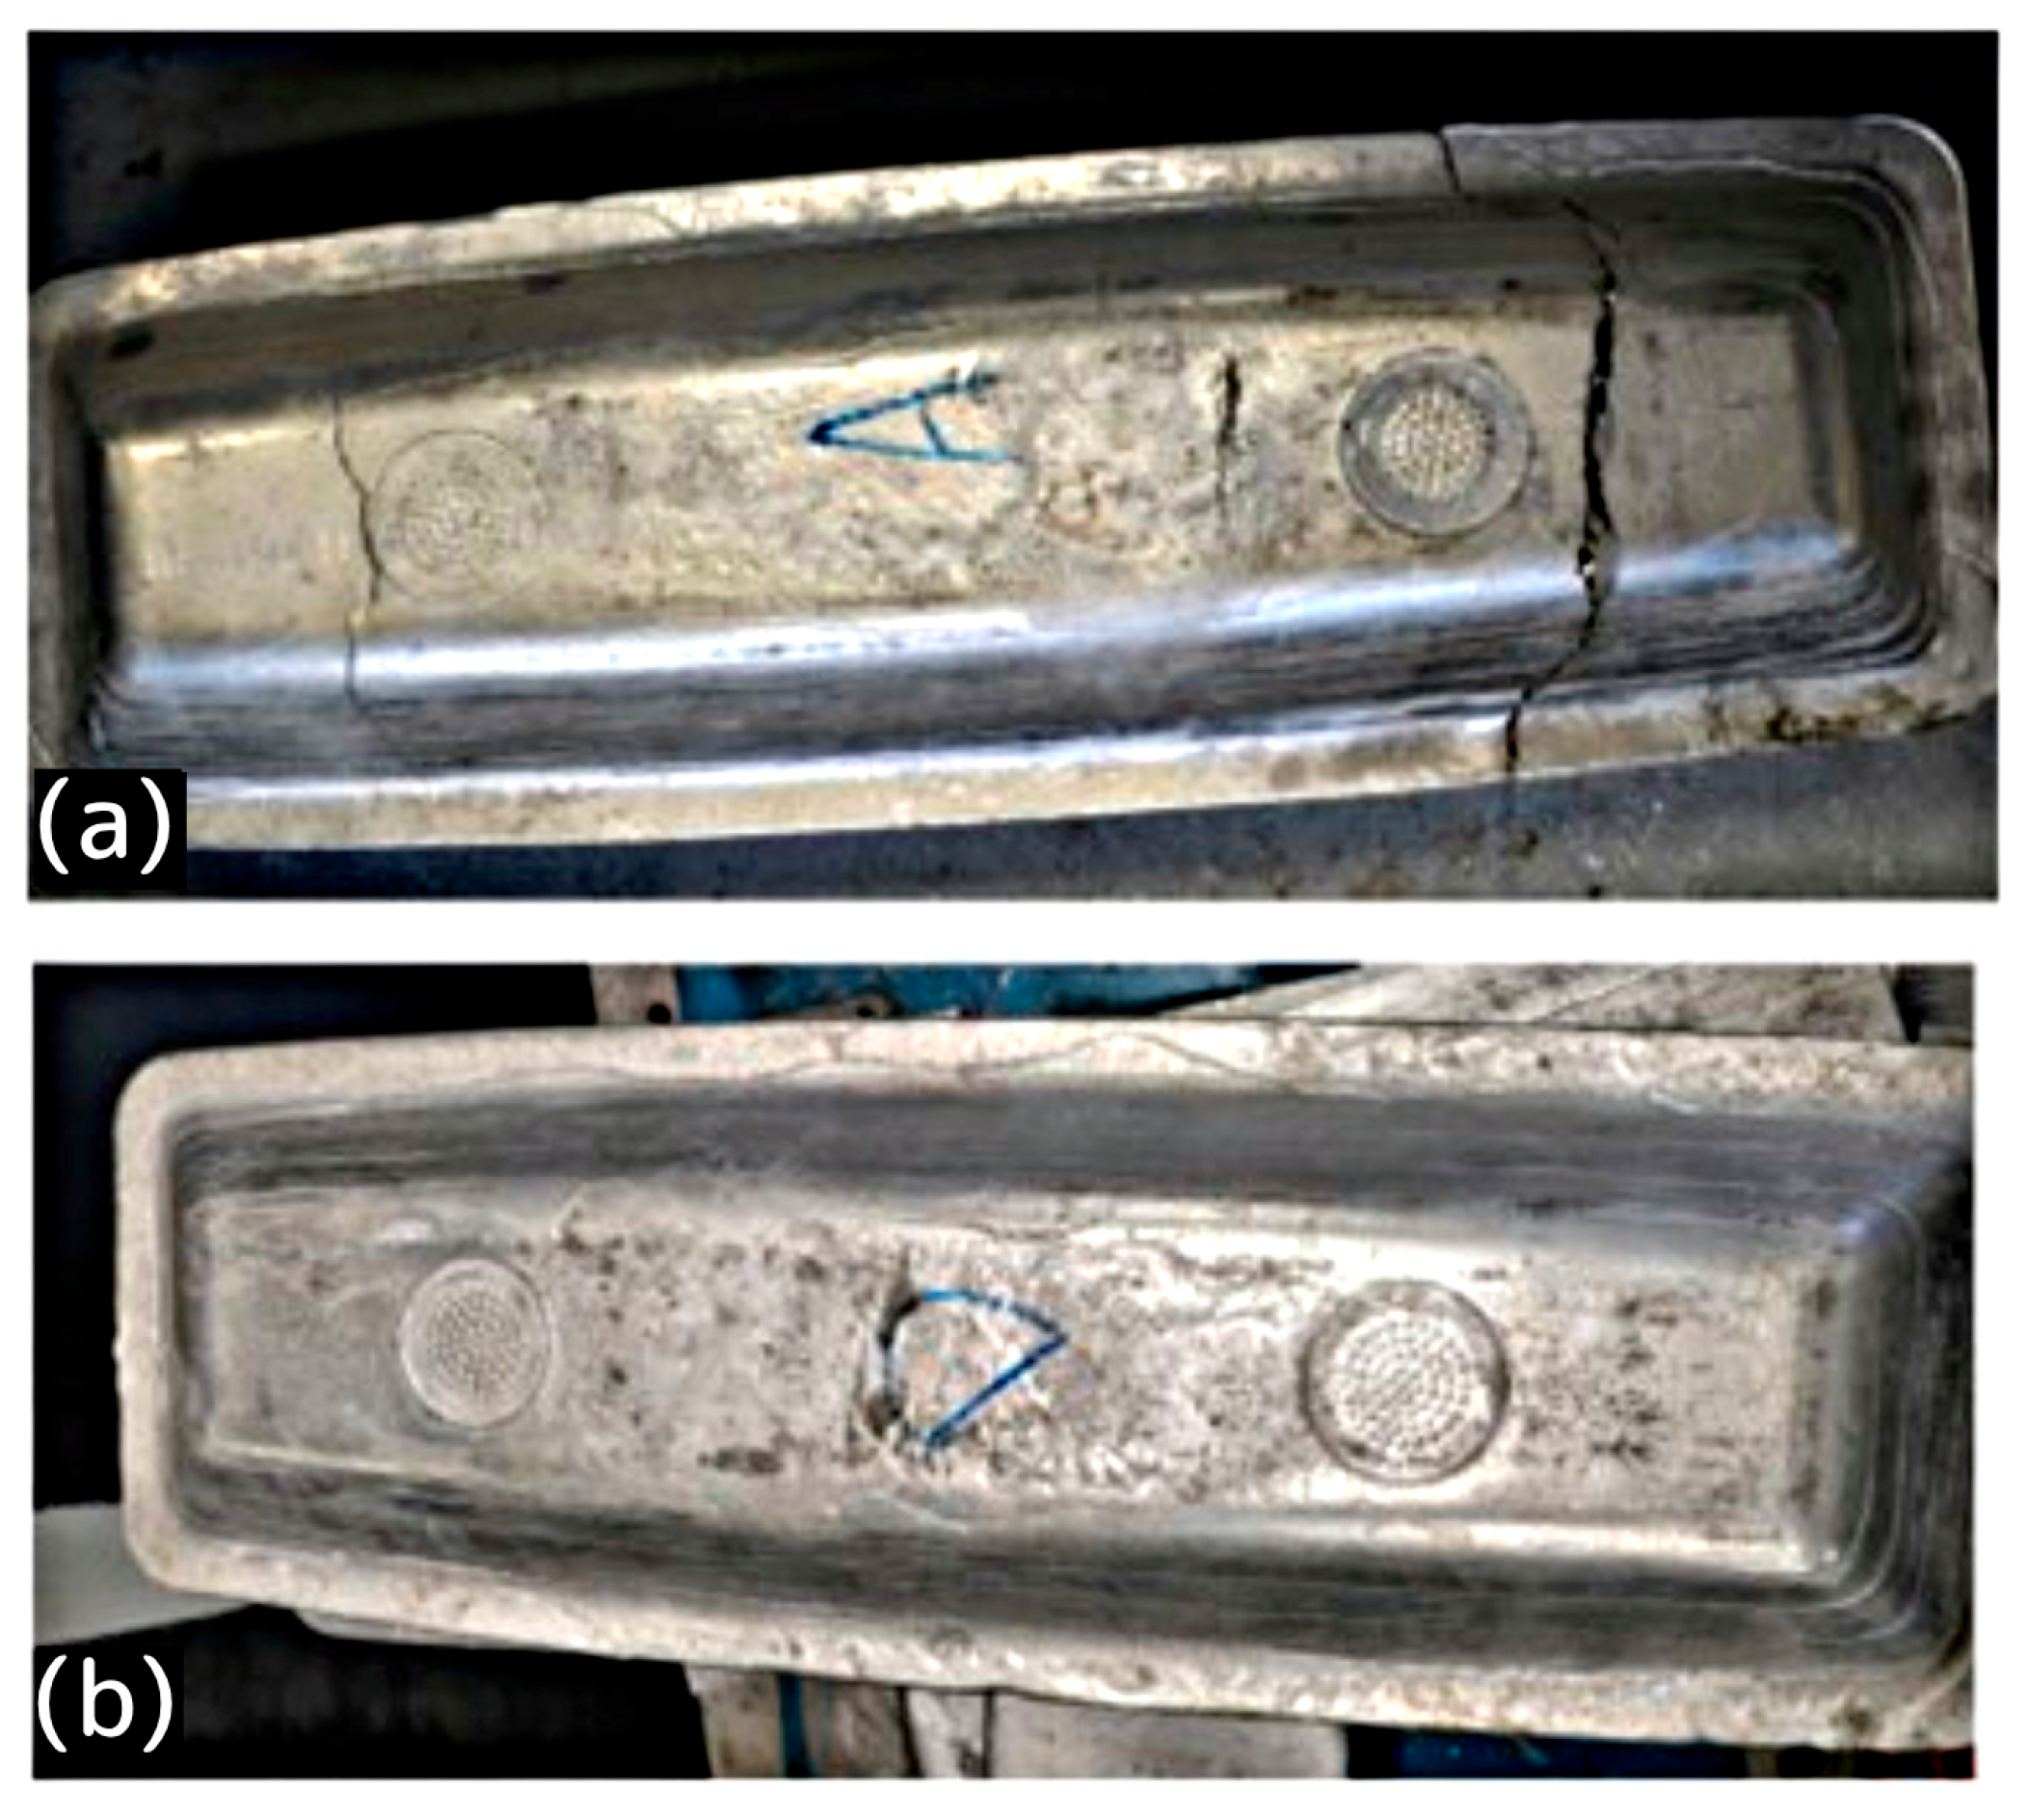
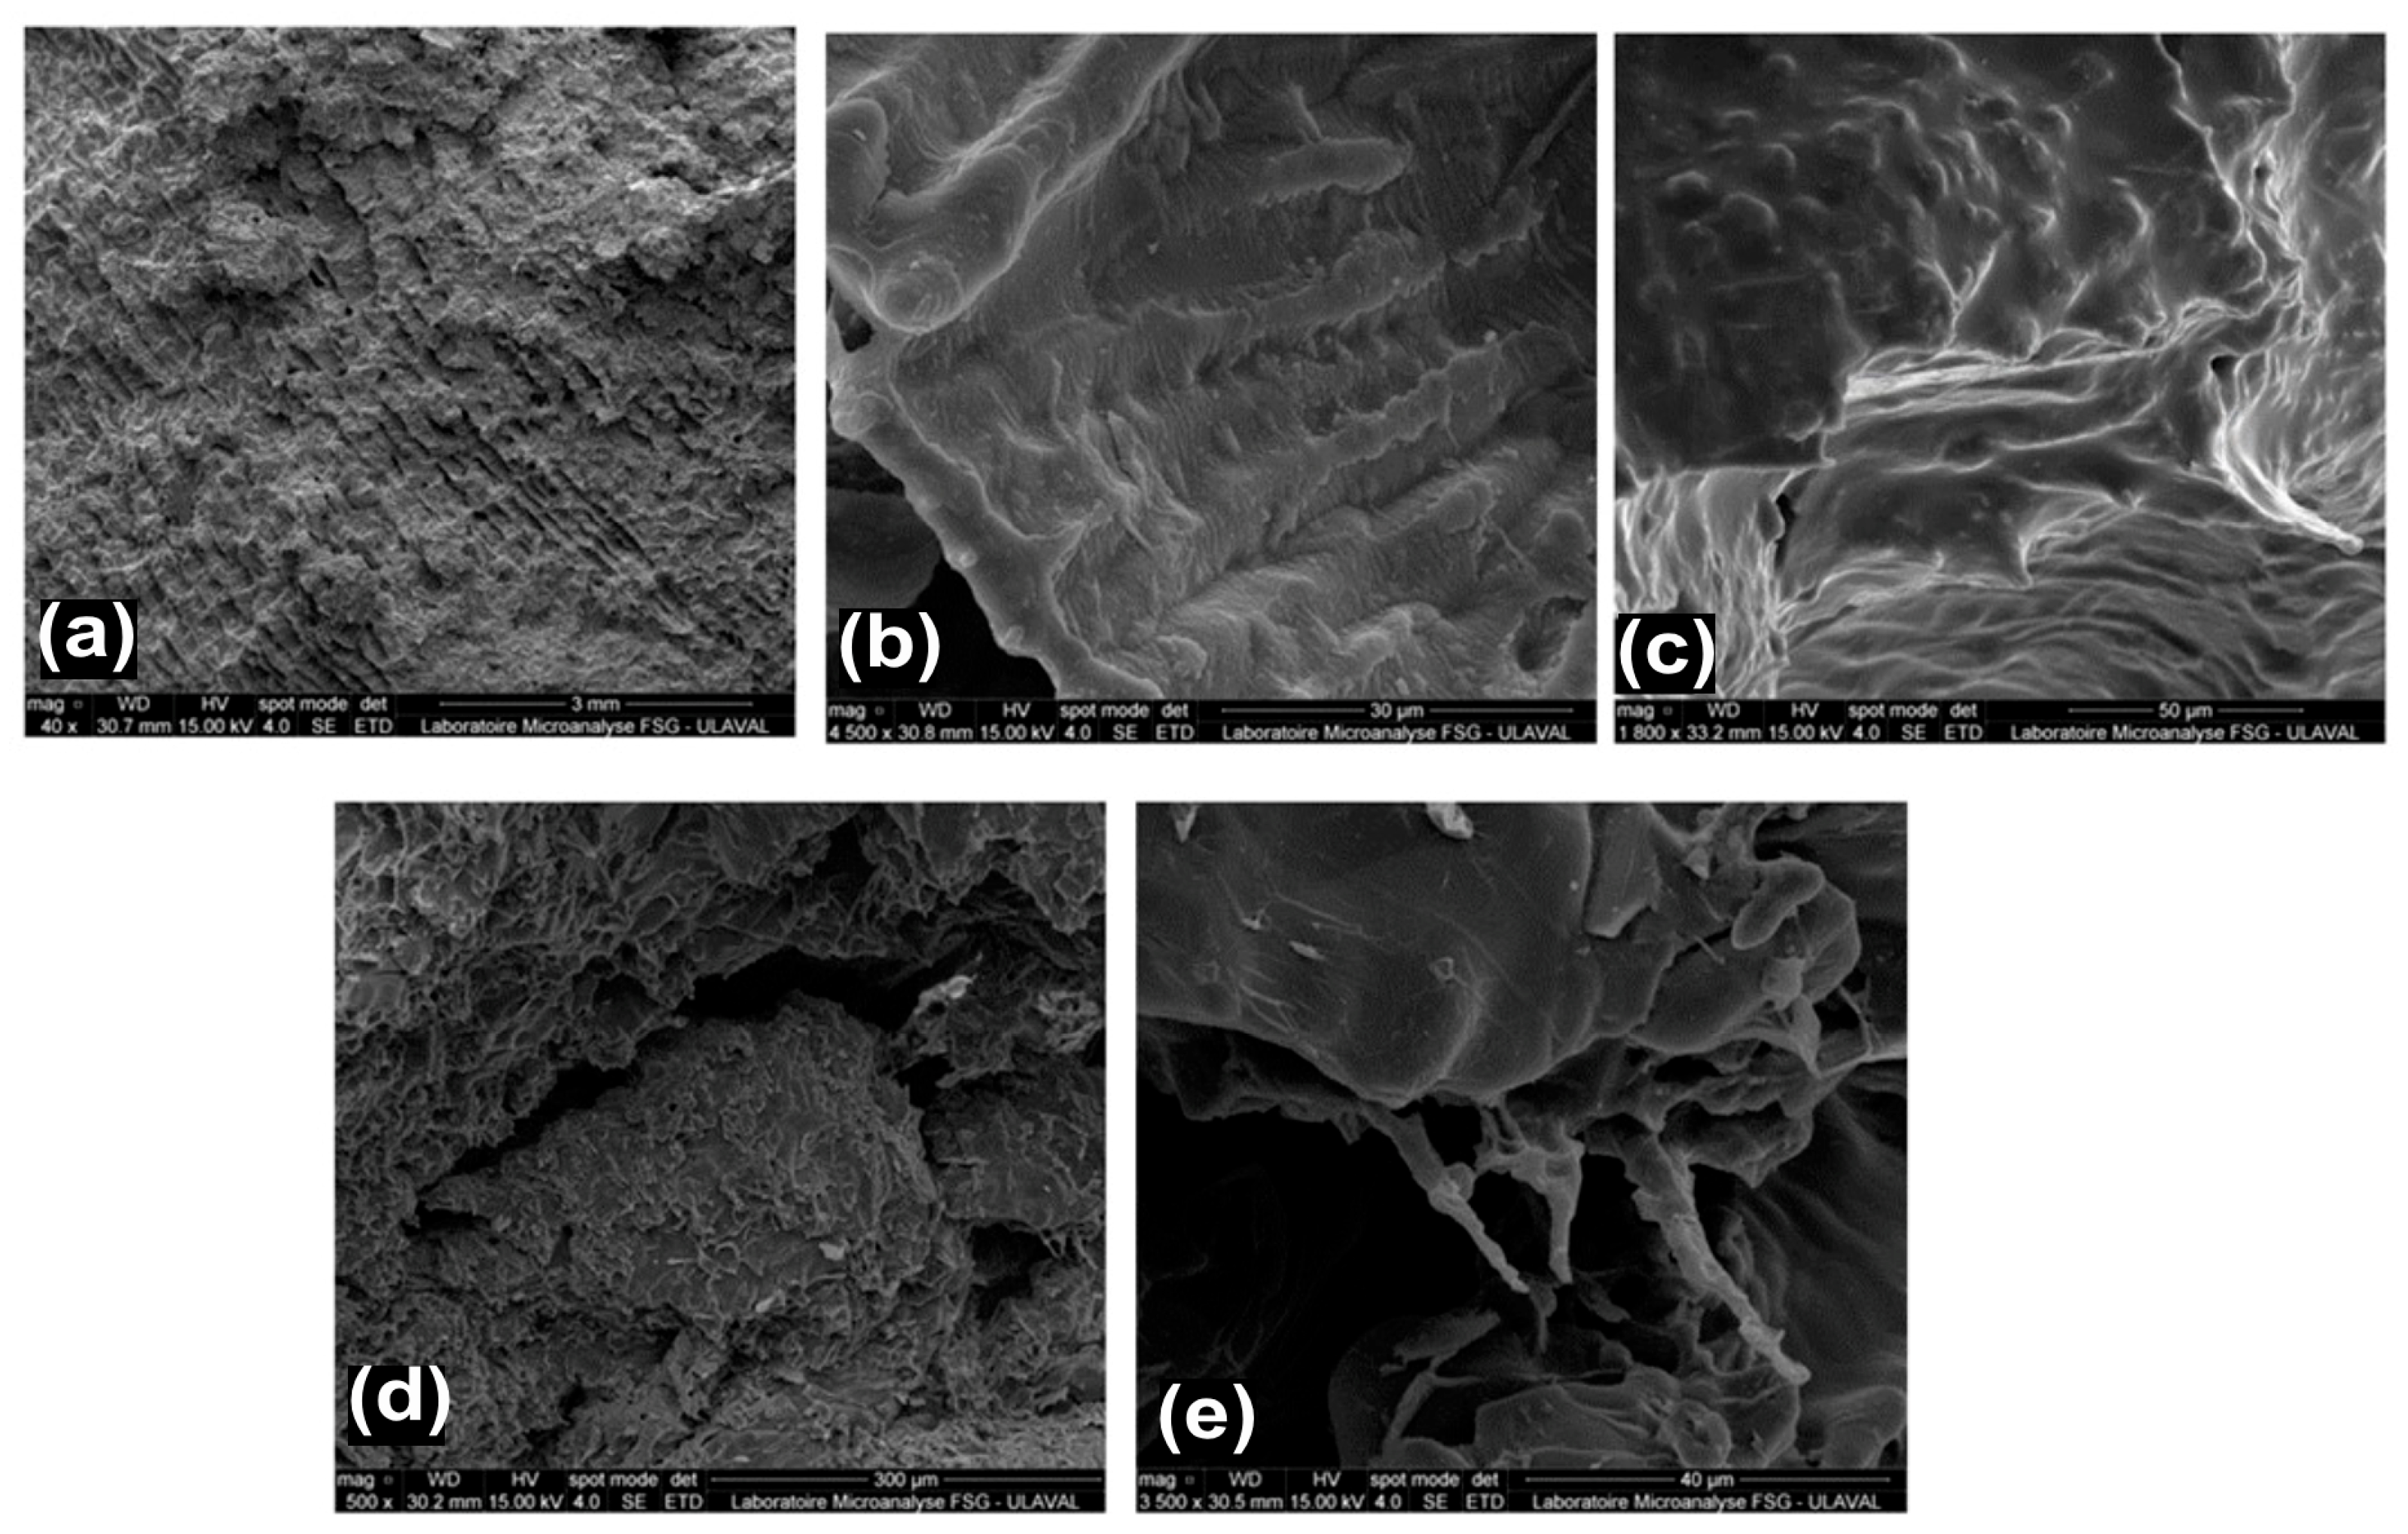
3.3. Crack Surfaces Analysis

To better understand the hot tearing phenomenon in DC-cast rolling ingots, the longitudinal central crack in the hot ingot (Figure 9) was cut and opened for examination. The optical image in Figure 18 shows the complex topography of the crack surface, including bridges between the two opposite sides of the crack and multiple crack initiation locations that merged during crack propagation. The topography of both sides of the crack does not match in most areas, indicating that the crack has not propagated along a continuous path, but that many small cracks have merged with a severe deformation of bridges to form this topography. Also, there is a smooth and meandering area (black rectangular) close to the ingot surface, which is supposed to be where the crack emerged at the surface. This topographic diversity on the fracture surface indicates that the fracture occurred in different regions at various temperatures. The SEM images of the crack surfaces are presented in Figure 19. These SEM images show a (a) directional and layered structure, (b) dendrites and liquid on the microstructure, (c) round and glassy-like zones that indicate liquid between the dendrites and reheating of the metal during solidification, (d) ductile areas, and (e) some sharp and pointy structures that are related to the bridges remaining during the formation of crack. Other studies [33,34] have thoroughly investigated the bridges between the two crack surfaces and the liquid in the fracture surface.
Figure 20 shows an X-ray tomography image of a hot-tearing crack on the opposite rolling face of the sample shown in Figure 9. The 3D image was acquired using a Nikon M2 system at 220 kV, with a 2850 × 2850 flat-panel detector, yielding a voxel size of 33.6 µm (Nikon Corporation, Tokyo, Japan). The AA6111 sample, measuring 10 cm × 10 cm × 10 cm, was cut from the near-surface region of the ingot. This crack was located in the center of the surface, 15 cm above the tip of the bottom block. It is noteworthy that the crack is thinner near the surface and thicker within the ingot, indicating that the crack initially formed inside the ingot and propagated towards the surface. This observation supports the hypothesis that cracking was facilitated by pore formation due to reduced pressure. The crack path shows discontinuity within the interior of the ingot. These observations may indicate the presence of multiple distinct crack initiation sites inside the ingot and their subsequent coalescence during crack propagation. This agrees with the simulation results, revealing that initiation of hot tearing cracks was favorable in both conditions below the surface, and likely beyond 20 mm from the surface. The extensive presence of the liquid phase on the fracture surface confirms the infiltration of the molten metal into the formed cracks.

4. Conclusions

This study examined the influence of hydrostatic pressure in the semi-solid state, leading to the development of hot tears during the DC casting of AA6111 alloy. Simulations were conducted with ABAQUS and used a modified constitutive equation. Industrial trials were carried out to create a hot cast, filled with hot tears, and a cold cast, without hot tears. The findings reveal that, under hot conditions leading to the cracked ingot, in some points of the ingot surface, the ingot experiences negative hydrostatic pressure within the temperature range of 530 to 540 °C in the semi-solid state, accompanied by high enough positive S22 stress. These situations and stress direction are completely suitable for forming hot tearing. In comparison, such a combination of negative hydrostatic pressure and a positive high amount of stress was not calculated in the surfaces of the ingot under cold conditions. That leads to producing a sound ingot under cold conditions and the formation of hot tearing under hot conditions.

Author Contributions

Conceptualization, D.L. and H.K; methodology, D.L., H.K and J.C.; formal analysis, H.K., D.L. and X.G.C.; investigation, H.K., D.L., X.G.C. and A.P.; writing—original draft preparation: H.K.; writing—review and editing: H.K., D.L., X.G.C. and A.P.; supervision: D.L.; project administration: D.L.; funding acquisition, D.L. and X.G.C. All authors have read and agreed to the published version of the manuscript.

Funding

This research was funded by of the Fonds de recherche du Québec-Nature et technologies (FRQNT) grant number 2018-LU-252831 and the Mitacs Acceleration grant number IT14722.

Institutional Review Board Statement

Not applicable.

Informed Consent Statement

Not applicable.

Data Availability Statement

The data presented in this study are available on request from the corresponding author. Data related to the heat transfer coefficients will not be disclosed due to privacy restrictions.

Acknowledgments

The authors would like to acknowledge the financial support of the Fonds de recherche du Québec-Nature et technologies (FRQNT) under Grant No. 2018-LU-252831 and the Mitacs Acceleration under Grant No. IT14722. The authors would also like to thank ARDC, Rio Tinto Aluminum for their technical support.

Conflicts of Interest

Co-author Josée Colbert is currently employed by “Technical Service, Rio Tinto Aluminium, Saguenay, QC, G7S 0L4, Canada” while contributing to this manuscript. His contributions to this work and manuscript were made independently. The remaining authors declare that the research was conducted in the absence of any commercial or financial relationships that could be constructed as a potential conflict of interest.

References

  1. Li, Y.; Li, H.; Katgerman, L.; Du, Q.; Zhang, J.; Zhuang, L. Recent advances in hot tearing during casting of aluminium alloys. Prog. Mater. Sci. 2021, 117, 100741. [Google Scholar] [CrossRef]
  2. Eskin, D. Physical Metallurgy of Direct Chill Casting of Aluminum Alloys; Taylor & Francis: London, UK, 2008; pp. 1–303. [Google Scholar]
  3. Jamaly, M.A.M.N. The Effects of Microstructural Features and Process Parameters on the Hot Tearing in Direct Chill Cast Aluminum Alloys. Ph.D. Thesis, University of British Columbia, Vancouver, BC, Canada, 2012. [Google Scholar]
  4. Suyitno. Hot Tearing and Deformation in Direct-Chill Casting of Aluminium Alloys; Delft University of Technology: Delft, The Netherlands, 2005. [Google Scholar]
  5. Boender, W.; Burghardt, A.; van Klaveren, E.P.; Rabenberg, J. Numerical Simulation of DC Casting; Interpreting the Results of a Thermo-Mechanical Model, Essential Readings in Light Metals; The Minerals, Metals, and Materials Society: Pittsburgh, PA, USA, 2016; pp. 933–938. [Google Scholar]
  6. Bolduc, S.; Kiss, L.I. Sensitivity study of the influence of the water boiling parameters on aluminum semi-continuous DC casting. Int. J. Therm. Sci. 2020, 151, 106276. [Google Scholar] [CrossRef]
  7. Begum, L.; Hasan, M. 3-D CFD simulation of a vertical direct chill slab caster with a submerged nozzle and a porous filter delivery system. Int. J. Heat Mass Transf. 2014, 73, 42–58. [Google Scholar] [CrossRef]
  8. Larouche, A.; Caron, Y.; Kocaefe, D. Impact of Water Heat Extraction and Casting Conditions on Ingot Thermal Response during DC Casting, in Essential Readings in Light Metals. In Essential Readings in Light Metals: Volume 3 Cast Shop for Aluminum Production; Springer International Publishing: Cham, Switzerland, 2013; pp. 690–695. [Google Scholar]
  9. Mukhopadhyay, P. Alloy Designation, Processing, and Use of AA6XXX Series Aluminium Alloys. Int. Sch. Res. Not. 2012, 2012, 165082. [Google Scholar] [CrossRef]
  10. Subroto, T.; Eskin, D.G.; Miroux, A.; Ellingsen, K.; M’hAmdi, M.; Katgerman, L. Semi-solid Constitutive Parameters and Failure Behavior of a Cast AA7050 Alloy. Metall. Mater. Trans. A 2021, 52, 871–888. [Google Scholar] [CrossRef]
  11. Rappaz, M.; Drezet, J.M.; Gremaud, M. A new hot-tearing criterion. Metall. Mater. Trans. A (USA) 1999, 30A, 449–455A. [Google Scholar] [CrossRef]
  12. Braccini, M.; Martin, C.L.; Suéry, M.; Bréchet, Y. Relation between mushy zone rheology and hot tearing phenomena in Al-Cu alloys. Model. Cast. Weld. Adv. Solidif. Process. IX 2000, 3, 18–24. [Google Scholar]
  13. Chen, D.-X.; Dou, R.-F.; Han, J.-Q.; Wang, J.-S. Prediction of hot tearing susceptibility of direct chill casting of AA6111 alloys via finite element simulations. Trans. Nonferrous Met. Soc. China 2020, 30, 3161–3172. [Google Scholar] [CrossRef]
  14. Suyitno; Eskin, D.G.; Savran, V.I.; Katgerman, L. Effect of casting speed on structure formation and hot tearing during direct-chill casting of AL-CU alloys. Metall. Mater. Trans. A 2004, 35A, 3551–3561. [Google Scholar] [CrossRef]
  15. Khodaei, N.; Phillion, A.B. A study on hot tearing in direct chill casting of Al-Mn-Mg alloys using a multi-scale approach. Metall. Mater. Trans. B 2021, 52, 1424–1435. [Google Scholar] [CrossRef]
  16. Nallathambi, A.K.; Penumakala, P.K.; Specht, E. Review of hot tearing studies in Al alloys during direct chill casting. In Proceedings of the 2013 International Symposium on Liquid Metal Processing & Casting, Austin, TX, USA, 22–25 September 2013; Springer: Berlin/Heidelberg, Germany, 2016. [Google Scholar]
  17. Suyitno; Kool, W.H.; Katgerman, L. Hot tearing criteria evaluation for direct-chill casting of an Al-4.5 pct Cu alloy. Metall. Mater. Trans. A 2005, 36, 1537–1546. [Google Scholar] [CrossRef]
  18. Dou, R.; Phillion, A.B. Application of a Pore Fraction Hot Tearing Model to Directionally Solidified and Direct Chill Cast Aluminum Alloys. Metall. Mater. Trans. A 2016, 47, 4217–4225. [Google Scholar] [CrossRef]
  19. Nallathambi, A.K.; Tyagi, M.; Specht, E.; Bertram, A. Thermomechanical analysis of direct chill casting using finite element method. Trans. Indian Inst. Met. 2011, 64, 13. [Google Scholar] [CrossRef]
  20. Lalpoor, M.; Eskin, D.G.; Katgerman, L. Cold-Cracking Assessment in AA7050 Billets during Direct-Chill Casting by Thermomechanical Simulation of Residual Thermal Stresses and Application of Fracture Mechanics. Metall. Mater. Trans. A-Phys. Metall. Mater. Sci. 2009, 40A, 3304–3313. [Google Scholar] [CrossRef]
  21. Fjaer, H.G.; Mo, A. ALSPEN—A MATHEMATICAL-MODEL FOR THERMAL-STRESSES IN DIRECT CHILL CASTING OF ALUMINUM BILLETS. Metall. Trans. B-Process Metall. 1990, 21, 1049–1061. [Google Scholar]
  22. Han, Q.; Viswanathan, S.; Spainhower, D.L.; Das, S.K. The nature of surface cracking in direct chill cast aluminum alloy ingots. Metall. Mater. Trans. A 2001, 32, 2908–2910. [Google Scholar] [CrossRef]
  23. Sengupta, J.; Cockcroft, S.; Maijer, D.; Wells, M.; Larouche, A. The effect of water ejection and water incursion on the evolution of thermal field during the start-up phase of the direct chill casting process. J. Light Met. 2002, 2, 137–148. [Google Scholar] [CrossRef]
  24. Larouche, D.; Langlais, J.; Wu, W.; Bouchard, M. A constitutive model for the tensile deformation of a binary aluminum alloy at high fractions of solid. Metall. Mater. Trans. B 2006, 37, 431–443. [Google Scholar] [CrossRef]
  25. Jolly, M.; Katgerman, L. Modelling of defects in aluminium cast products. Prog. Mater. Sci. 2022, 123, 100824. [Google Scholar] [CrossRef]
  26. Guo, G.; Yao, T.; Liu, W.; Tang, S.; Xiao, D.; Huang, L.; Wu, L.; Feng, Z.; Gao, X. Numerical Simulation and Machine Learning Prediction of the Direct Chill Casting Process of Large-Scale Aluminum Ingots. Materials 2024, 17, 1409. [Google Scholar] [CrossRef] [PubMed]
  27. Sengupta, J.; Cockcroft, S.L.; Maijer, D.M.; Wells, M.A.; Larouche, A. On the development of a three-dimensional transient thermal model to predict ingot cooling behavior during the start-up phase of the direct chill-casting process for an AA5182 aluminum alloy ingot. Metall. Mater. Trans. B 2004, 35, 523–540. [Google Scholar] [CrossRef]
  28. Larouche, D. Computation of solidification paths in multiphase alloys with back-diffusion. Calphad 2007, 31, 490–504. [Google Scholar] [CrossRef]
  29. Qassem, M.; Javidani, M.; Larouche, D.; Colbert, J.; Chen, X.-G. Effect of chemical composition on the semisolid tensile properties and hot tearing susceptibility of AA6111 DC cast alloys. J. Mater. Sci. 2022, 57, 21519–21536. [Google Scholar] [CrossRef]
  30. Wang, B.Z.; Huang, X.M.; Wang, C.; Wang, Z.Y.; Xing, C.; Ji, H.C. Constitutive equations of AA6111 aluminum alloy. Metalurgija 2019, 58, 267–271. [Google Scholar]
  31. Alankar, A.; Wells, M.A. Constitutive behavior of as-cast aluminum alloys AA3104, AA5182 and AA6111 at below solidus temperatures. Mater. Sci. Eng. A 2010, 527, 7812–7820. [Google Scholar] [CrossRef]
  32. Qassem, M.; Javidani, M.; Larouche, D.; Colbert, J.; Chen, X.-G. Temperature Dependence of Elastic Properties of Al-Mg-Si Direct-Chill-Cast AA6111 Alloy at Near-Solidus Temperatures. J. Mater. Eng. Perform. 2024, 33, 987–998. [Google Scholar] [CrossRef]
  33. Zhong, H.; Zhao, Y.; Lin, Z.; Li, T.; Guo, Q.; Li, L.; Zhai, Q.; Han, Q. Understanding the roles of interdendritic bridging on hot tearing formation during alloy solidification. J. Mater. Res. Technol. 2023, 27, 5368–5371. [Google Scholar] [CrossRef]
  34. Katgerman, L.; Van Haaften, W.; Kool, W. Constitutive behaviour and hot tearing during aluminium DC casting. Mater. Forum 2004, 28, 312–318. [Google Scholar]
Figure 1. Schematic representation of the DC casting process, illustrating the solid (S), liquid (L), and mushy zone (S+L), along with the water contact regions at the surface and bottom of the ingot [4].
Applmech 06 00053 g001
Figure 2. The two water flow rates used during DC casting.
Applmech 06 00053 g002
Figure 3. Schematic of the whole ingot indicating the thermocouple (TC) position. The red line will be discussed in Section 3.2.
Applmech 06 00053 g003
Figure 4. (a) Two-dimensional schematic of the computational domain of the DC-cast ingot. A1–A7 correspond with the boundaries defined in [4]. (b) Schematic describing how the horizontal layers of elements were activated during the simulation from (1) to (4).
Applmech 06 00053 g004
Figure 5. Solid fraction versus temperature for AA6111 alloy calculated with Larouche’s model [28].
Applmech 06 00053 g005
Figure 6. Model and experimental curves at 535 and 564 °C with a strain rate of 0.0001 s1.
Applmech 06 00053 g006
Figure 7. Flow stress versus temperature and strain for a fixed strain rate of 0.0001 s1.
Applmech 06 00053 g007
Figure 8. Evolution of Young’s modulus with the temperature of the AA6111 alloy.
Applmech 06 00053 g008
Figure 9. Rolling face of the ingot with transverse and longitudinal cracks, and the black arrow indicates the casting direction.
Applmech 06 00053 g009
Figure 10. Bottom of the ingots in a (a) cold condition (without hot tearing crack) and a (b) hot condition (with hot tearing crack).
Applmech 06 00053 g010
Figure 11. Temperature variation of the hot cast ingot in (a) the rolling face and (b) symmetry faces. Point A is 12.8 cm and point B is 19.2 cm above the interface of the ingot and bottom block. (More details about points A and B are provided in Figure 13 and Figure 14.)
Applmech 06 00053 g011
Figure 12. (a) Temperature variations during solidification for the experiments and simulated castings; (b) magnified view of the rectangular area in (a).
Applmech 06 00053 g012
Figure 13. Temperature, hydrostatic pressure, and stress S22 component variation during solidification for point A in Figure 11; (a) hot and (b) cold conditions. The blue line represents the amount of stress and hydrostatic pressure corresponding to the temperature of 530 °C.
Applmech 06 00053 g013
Figure 14. Temperature, hydrostatic pressure, and stress S22 component variation during solidification for point B in Figure 11; (a) hot and (b) cold conditions. The blue line represents the amount of stress and pressure corresponding to the temperature of 530 °C.
Applmech 06 00053 g014
Figure 15. (a) Temperature and (b) solid fraction variation in a certain path in the rolling face 16 cm above the interface of the ingot and bottom block, for hot and cold conditions.
Applmech 06 00053 g015
Figure 16. (a) Pressure and (b) stress (S22) distribution through the defined path on the rolling face for hot and cold conditions. The blue lines outline the zone where the temperature range makes the material vulnerable to hot tearing.
Applmech 06 00053 g016
Figure 17. (a) Sample position −20 mm inside of the external surface of the sound ingot (red area); (b) SEM images of the red surface.
Applmech 06 00053 g017
Figure 18. Optical images of the crack surfaces, with red lines indicating the ingot surfaces.
Applmech 06 00053 g018
Figure 19. SEM images of crack surfaces. (a) Directional and layered structure, (b) dendrites, (c) round and glassy-like zones, (d) ductile areas, and (e) some sharp and pointy structures.
Applmech 06 00053 g019
Figure 20. Tomographic image of a hot tearing crack on the ingot.
Applmech 06 00053 g020
Table 1. Chemical composition of AA6111 alloy used in this study (weight%).
ElementsCuSiMgMnFeAl
0.50.60.50.10.19Balance
Table 2. Solidification path of AA6111 alloy predicted by Larouche’s model [28].
Solidification PathTemperature (°C)
l α Al + α Al ( Fe , Mn ) Si 620
l α Al + β Al ( Fe , Mn ) Si 581.25
l α Al + Si 557
l α Al + Q Phase (Al5Cu2Mg8Si6)541.75
l α Al + θ Al 2 Cu 514.5
Table 3. Material properties used in DC casting simulation.
Temperature
(°C)
Thermal Expansion Coefficient × 10−6 (K−1) [31]Specific Heat Capacity (J.kg−1·K−1) [13]Thermal Conductivity (W·m−1·K−1) [13]
2022.4147909.2196.8
10023.1396950.4202.1
20024.1860999.6204.6
30025.24531044.8204.1
40026.31761090201.7
50027.40271135.2198.1
51027.51201170197.6
55029.42921217190.1
60032.48691112177
63038.97691023151.5
66067.8313100388
Table 4. Constants used in this investigation [24,30].
ConstantsValue
m1/2 for a columnar structure
µ0.001 Pa·s
a100 µm
Q148,616 KJ/mol
Table 5. The ϕ g , κ, and other values adjusted to fit with experimental results.
Strain Rate (s−1)Temp (°C)Fraction Solid ϕ g κYield Stress (MPa)
0.0001 5100.98870.55
5350.971170.655
5520.96550.634
5640.947270.754
0.001 5350.971190.456
5520.96250.44
5640.947150.454
Disclaimer/Publisher’s Note: The statements, opinions and data contained in all publications are solely those of the individual author(s) and contributor(s) and not of MDPI and/or the editor(s). MDPI and/or the editor(s) disclaim responsibility for any injury to people or property resulting from any ideas, methods, instructions or products referred to in the content.

