Article

Slip-Resistance Performance of Basketball Shoes Tread Patterns on Common Courts

1
Centre for Biomedical Engineering, Indian Institute of Technology Delhi, New Delhi 110016, India
2
Department of Biomedical Engineering, All India Institute of Medical Sciences Delhi, New Delhi 110029, India
*
Author to whom correspondence should be addressed.
Appl. Mech. 2025, 6(3), 54; https://doi.org/10.3390/applmech6030054
Submission received: 16 April 2025 / Revised: 10 July 2025 / Accepted: 14 July 2025 / Published: 24 July 2025

Abstract

Basketball requires intense movements like jumping and sudden changes in direction, increasing the risk of slips and falls due to poor shoe–court traction. Therefore, a significant demand is for good traction performance in basketball shoes, particularly in the heel region on different court surfaces, to prevent slipping. This study examined the traction performance of fifteen common basketball shoe designs that were considered and developed using thermoplastic polyurethane to assess the available coefficient of friction (ACOF) on popular floorings (hardwood, synthetic, and polyurethane) under dry and wet conditions using a robotic slip tester. Results indicate that the hardwood flooring provided better traction, followed by the synthetic flooring, while the polyurethane flooring showed reduced friction. The study also examined the traction with apparent contact areas. Shoes with herringbone and circular tread patterns demonstrated the highest traction on all flooring in dry conditions. This research is anticipated to help basketball shoemakers choose safer shoes for player safety and performance, providing a foundation for future research on shoe flooring interaction in basketball.

Graphical Abstract

1. Introduction

Basketball is a highly popular sport around the world, with approximately 450 million people participating globally [1]. It is a dynamic game involving repetitive motions of varying intensity and quick direction changes horizontally and vertically, requiring players to continuously adapt their body orientation while engaging in actions such as walking, pivoting, sprinting, and jumping. The players cover about 4.5 to 5 km in a typical game, spending 56.8% walking, 34.1% running and jumping, and 9.1% stationary [2,3]. The sport carries a risk of injury, where high school players report an injury rate of 1.94 injuries per 1000 exposures. Common injuries include those affecting the foot or ankle (39.7%), knee (14.7%), and neck/face/head (13.6%), with frequent diagnoses being ligament strains (44.0%), muscle or tendon strains (17.7%), and concussions (7.0%) [4].
The primary cause of basketball-related injuries is low traction between the flooring surface and shoes, which leads to slips and falls. Traction is typically quantified by measuring the available coefficient of friction (ACOF), either through human slipping trials or mechanical devices [5,6,7]. However, ethical and safety concerns have led to the development and use of various slip-testing devices to estimate the ACOF without involving human participants. Over the years, various slip testers, including diverse operating mechanisms, have been designed and employed [8,9]. Research on a biofidelic slip tester to accurately assess the traction between shoe and flooring types remains limited [10,11]. In basketball courts, flooring is typically constructed with hardwood, synthetic, and composite materials, each with unique coefficients of friction that can affect traction performance [12,13,14,15]. The traction and stability of the shoe are affected by the heel as the initial point of ground contact, rendering it a crucial area for performance evaluation and development [16].
Additionally, heel traction may vary depending on factors such as outsole design [12,17,18,19,20], outsole material [21,22], wear [23], contact area [24], pollutants [18,25], flooring material, and surface type [26]. Research has examined the influence of the playing surface, specifically wood and synthetic, on basketball performance [27]. Wooden floors typically provide higher friction, enhancing performance, while synthetic surfaces offer lower friction. However, excessive friction can raise the risk of ankle sprains [28]. Recent research showed that shoe characteristics can improve athletic performance, with outsole traction being the primary footwear quality associated with performance enhancement [29]. Therefore, shoes play a crucial role in sports such as basketball, ensuring player safety and enhancing performance, with traction being a key factor in preventing slips and enabling optimal movement on the court [30]. There are various common tread patterns applied in basketball that can enhance traction, stability, and performance. The herringbone pattern is the most common, providing excellent multidirectional traction and channeling dust away to maintain grip on both hardwood and synthetic surfaces. Circular patterns are often found in pivot zones to support quick turns, while hexagonal patterns evenly distribute pressure for consistent traction. Wavy grooves aid in smooth transitions and natural foot motion, balancing grip and comfort. Each tread pattern was designed to meet different player needs and court conditions [31,32,33].
A study by Pedroza et al. [34] found that by increasing the ground’s coefficient of friction from 0.3 to 0.5, the time needed to perform an agility maneuver improved. However, the time required did not improve further above 0.5, leading them to conclude that this friction is sufficient for agility in indoor sports. Luo & Stefanyshyn et al. [35] investigated the relationship between footwear traction and linear acceleration performance. They showed that modifying outsole materials enhances traction performance and quantified ACOF using a portable tester. Their findings indicated that increased traction leads to improved performance. Additionally, research has demonstrated that better shoe traction can impact both curved and linear sprinting performance and improve performance during cutting movements [35].
Further, Worobets & Wannop et al. [13] explored the impact of basketball shoe properties on athletic performance during sprints, vertical jumps, and cutting drills, and found that outsole traction had the most significant influence on reduced traction-impairing performance and increased traction-enhancing cutting performance [13]. Despite these insights, there was not enough information publicly available on the traction of basketball shoe heels on different court surfaces to understand the role of flooring. Moreover, while research has evaluated basketball shoe performance on standard court surfaces, few studies have been found to investigate shoe traction on various commonly used surfaces in basketball games. It is recommended that athletes choose sports shoes with little outsole traction without compromising performance [35]. Hence, understanding the effect of traction on the playing surface and sports shoe characteristics is essential for performance and injury prevention [36].
In this work, fifteen commonly available basketball shoe designs were selected, replicating their heel pattern. A portable slip testing device measured the coefficient of friction (ACOF) on hardwood, synthetic, and PU materials-based flooring, and tested under dry and wet conditions. To investigate their impact on shoe traction, we measured shore hardness and the shoe contact area. Key findings highlighted the roles of ACOF and apparent contact area in determining the shoe traction across various flooring surfaces. Furthermore, the contributions of distinct tread shapes with both dry and wet conditions across the heel traction were compared. In addition to offering recommendations on how to choose and create safer shoes to avoid slips and falls, this research provides an understanding of shoe traction mechanics and guides safer shoe design to reduce slips. Thus, we hypothesize that the tread design and apparent contact area substantially impact the ACOF under various floor and contaminant circumstances. Shoes with specialized tread patterns and reduced wear are thought to maintain a higher ACOF, minimizing slipping hazards on multiple surfaces.

2. Materials and Methods

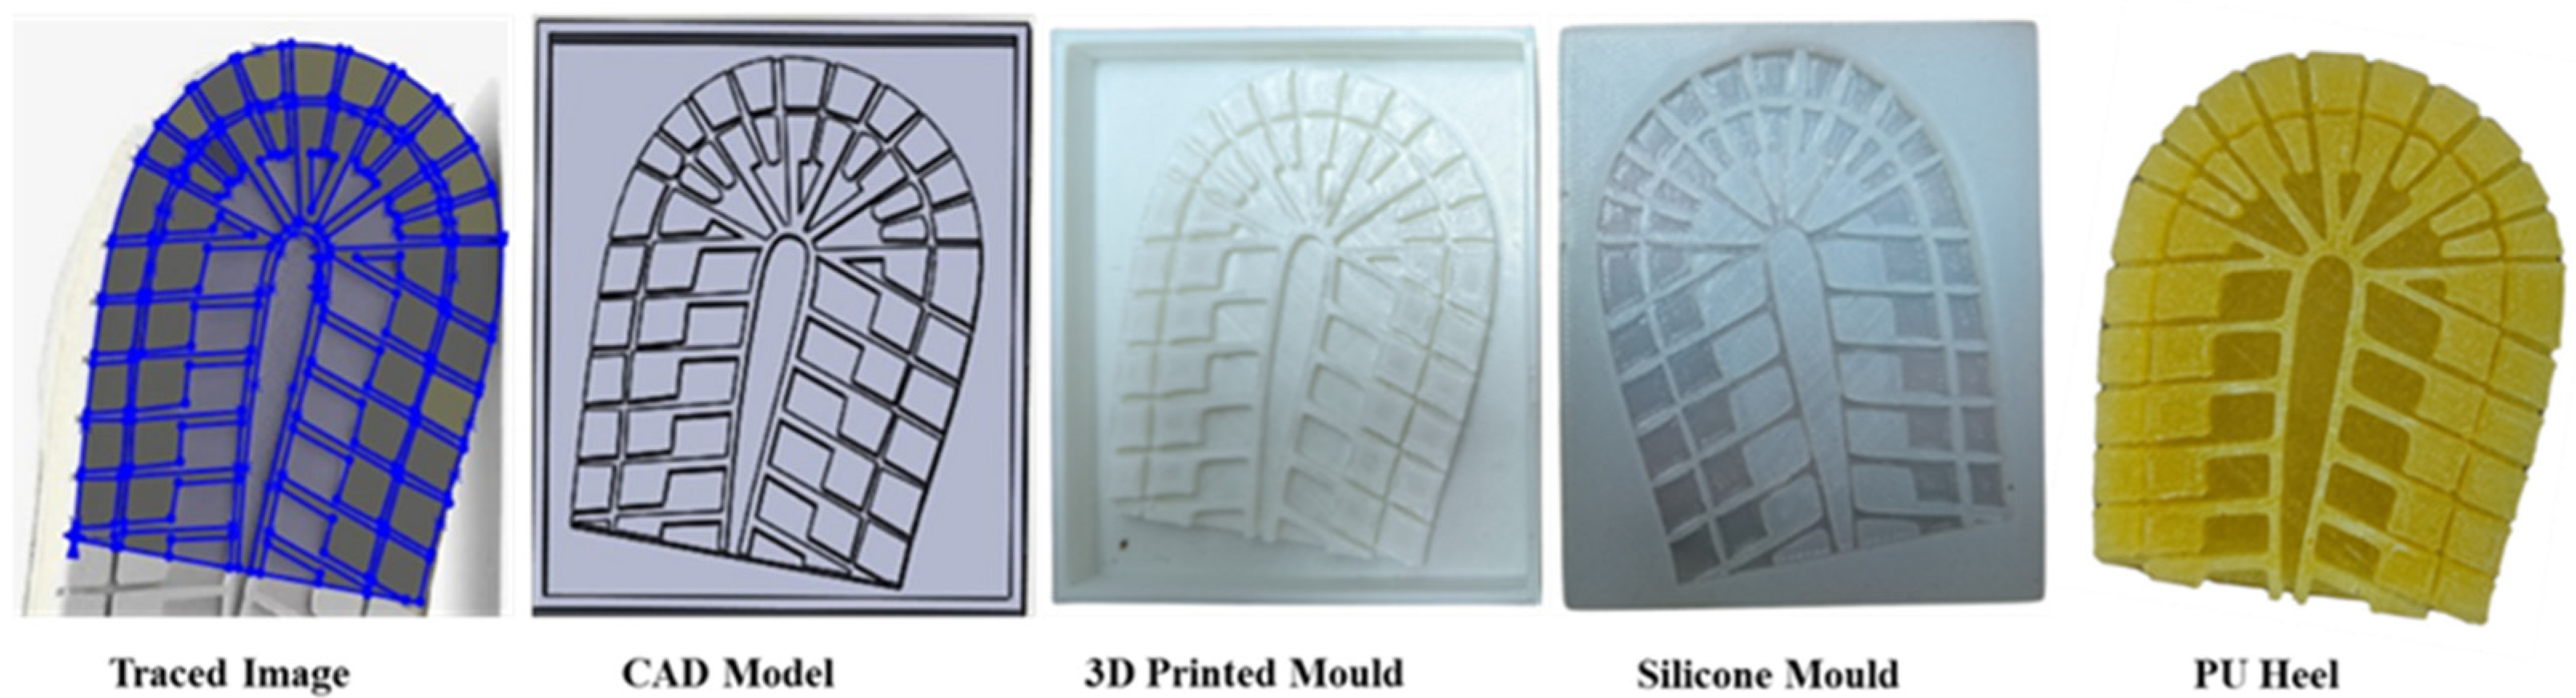
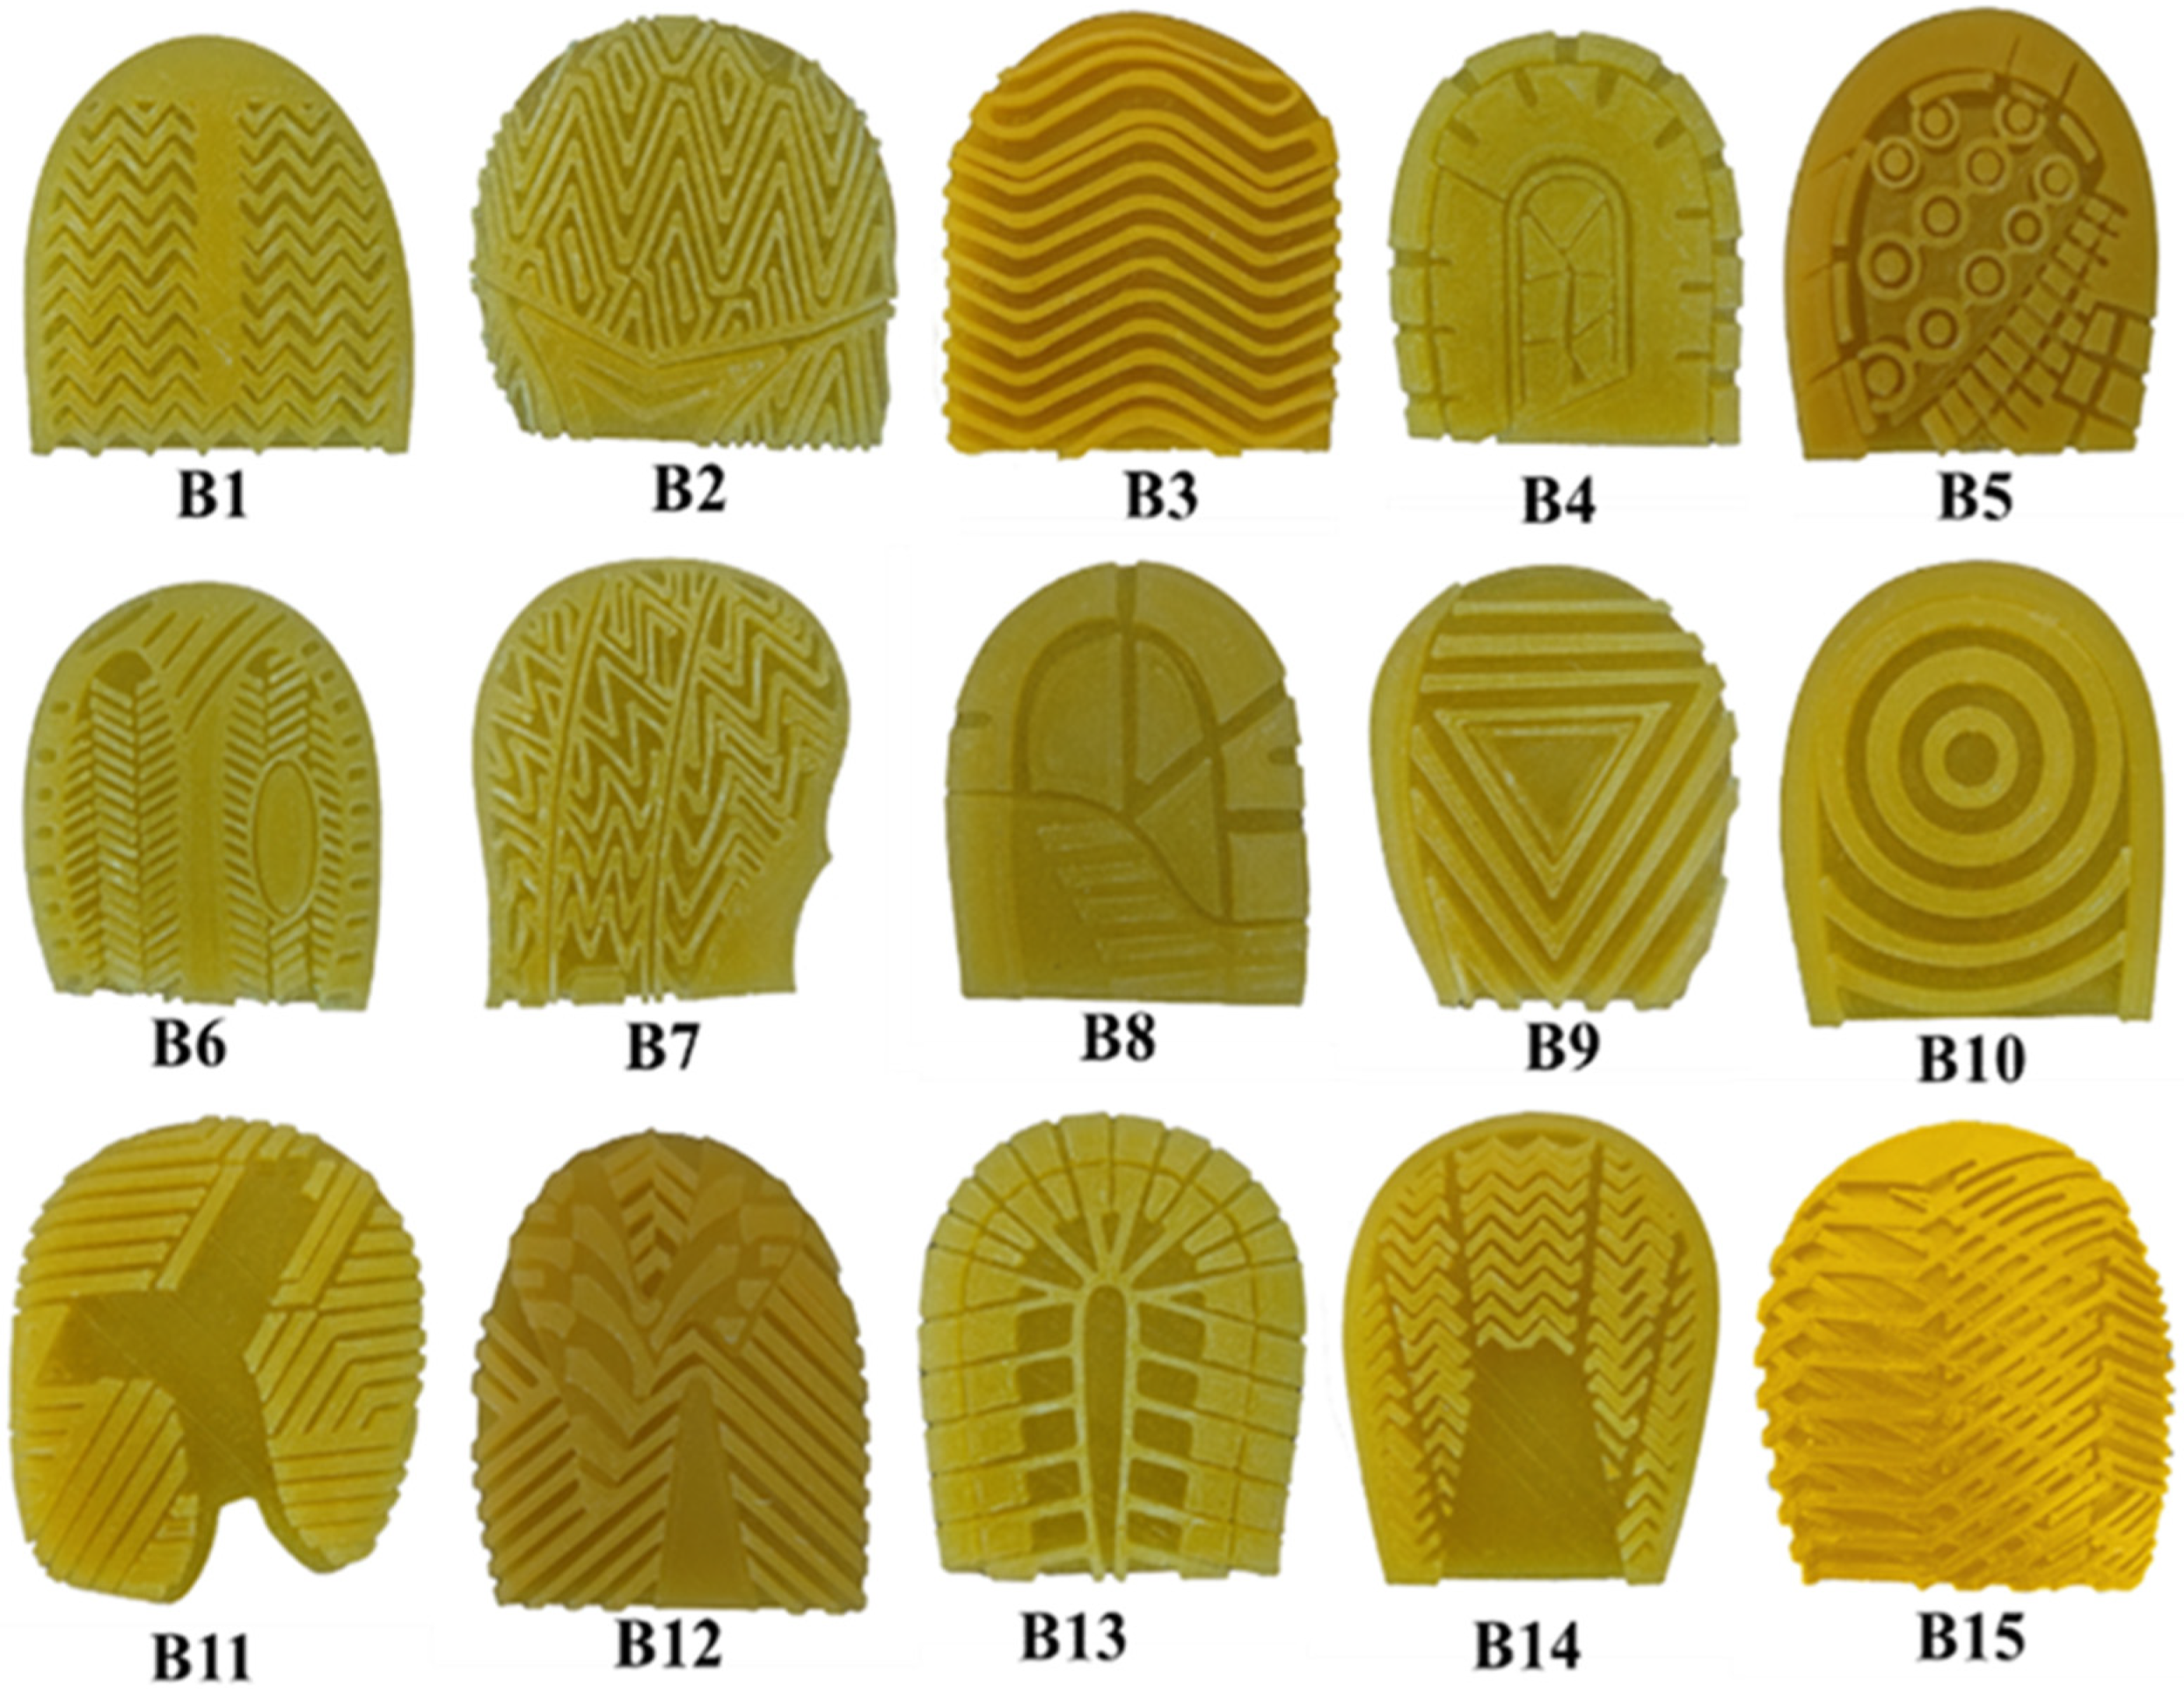
2.1. Design and Development of Shoe Outsoles

The design and development of shoe outsoles involve careful consideration of materials and structural patterns to optimize performance. Commonly available basketball shoes were selected to replicate their heel geometry. All friction tests were performed using custom-fabricated shoes, with designs based on commercially available models, with an average measured shore hardness of 40A. To ensure consistency, the material properties were standardized by manufacturing all shoes with the same shore hardness (i.e., Shore 40A) [37]. Polyurethane was used as the primary material due to its flexibility and durability, making it a common choice in footwear manufacturing. In this study, common tread patterns were used, but there were no commonly consistent features, as these designs were highly varied. The selected design featured treads having herringbone, circular, wavy, and other design patterns having similar geometries, which could be used in basketball shoes. For instance, patterns B1, B7, B12, and B15 showcase herringbone designs, which consist of zigzag, V-shaped, or interlocking patterns. Other notable patterns include B2, a modified herringbone or broken zigzag; B3, which features a wave or sine pattern with block designs; B5, a dot and grid pattern; B6, an asymmetrical hybrid; and B8, resembling a geometric or maze-like structure. Additionally, there are B9, characterized by triangle shapes; B10, which includes concentric circles and arcs; B11, featuring cross-directional bar and groove patterns; B13, with ribbed and segmented shapes; and B14, combining herringbone with a central block.
Figure 1 shows the procedure for producing the outsole heel pattern. The tread geometry of the outsole was imported into 3D modeling software (SolidWorks, 2020, Dassault Systems, Paris, France). After creating CAD models for all outsoles, their corresponding positive molds were 3D-printed utilizing a Creality Ender 3D printer (Shenzhen Creality 3D Technology, Shenzhen, China). The molds were subsequently filled with liquid silicone polymer (LSR130, Chemzest products, Chennai, India) and left to cure for 5 h. Once cured, the silicone molds were removed and filled with two-part polyurethane (Aditya Polymers, New Delhi, India), which has a shore hardness of 40A, measured from an actual basketball shoe to replicate the pattern design of the shoe heel. The molds were allowed to cure for 40 h to ensure they hardened properly. Figure 2 illustrates the fifteen produced outsole heel patterns. Previous studies have shown that shore hardness and tread shape are effective for assessing footwear performance under various slippage conditions [23,24,25].

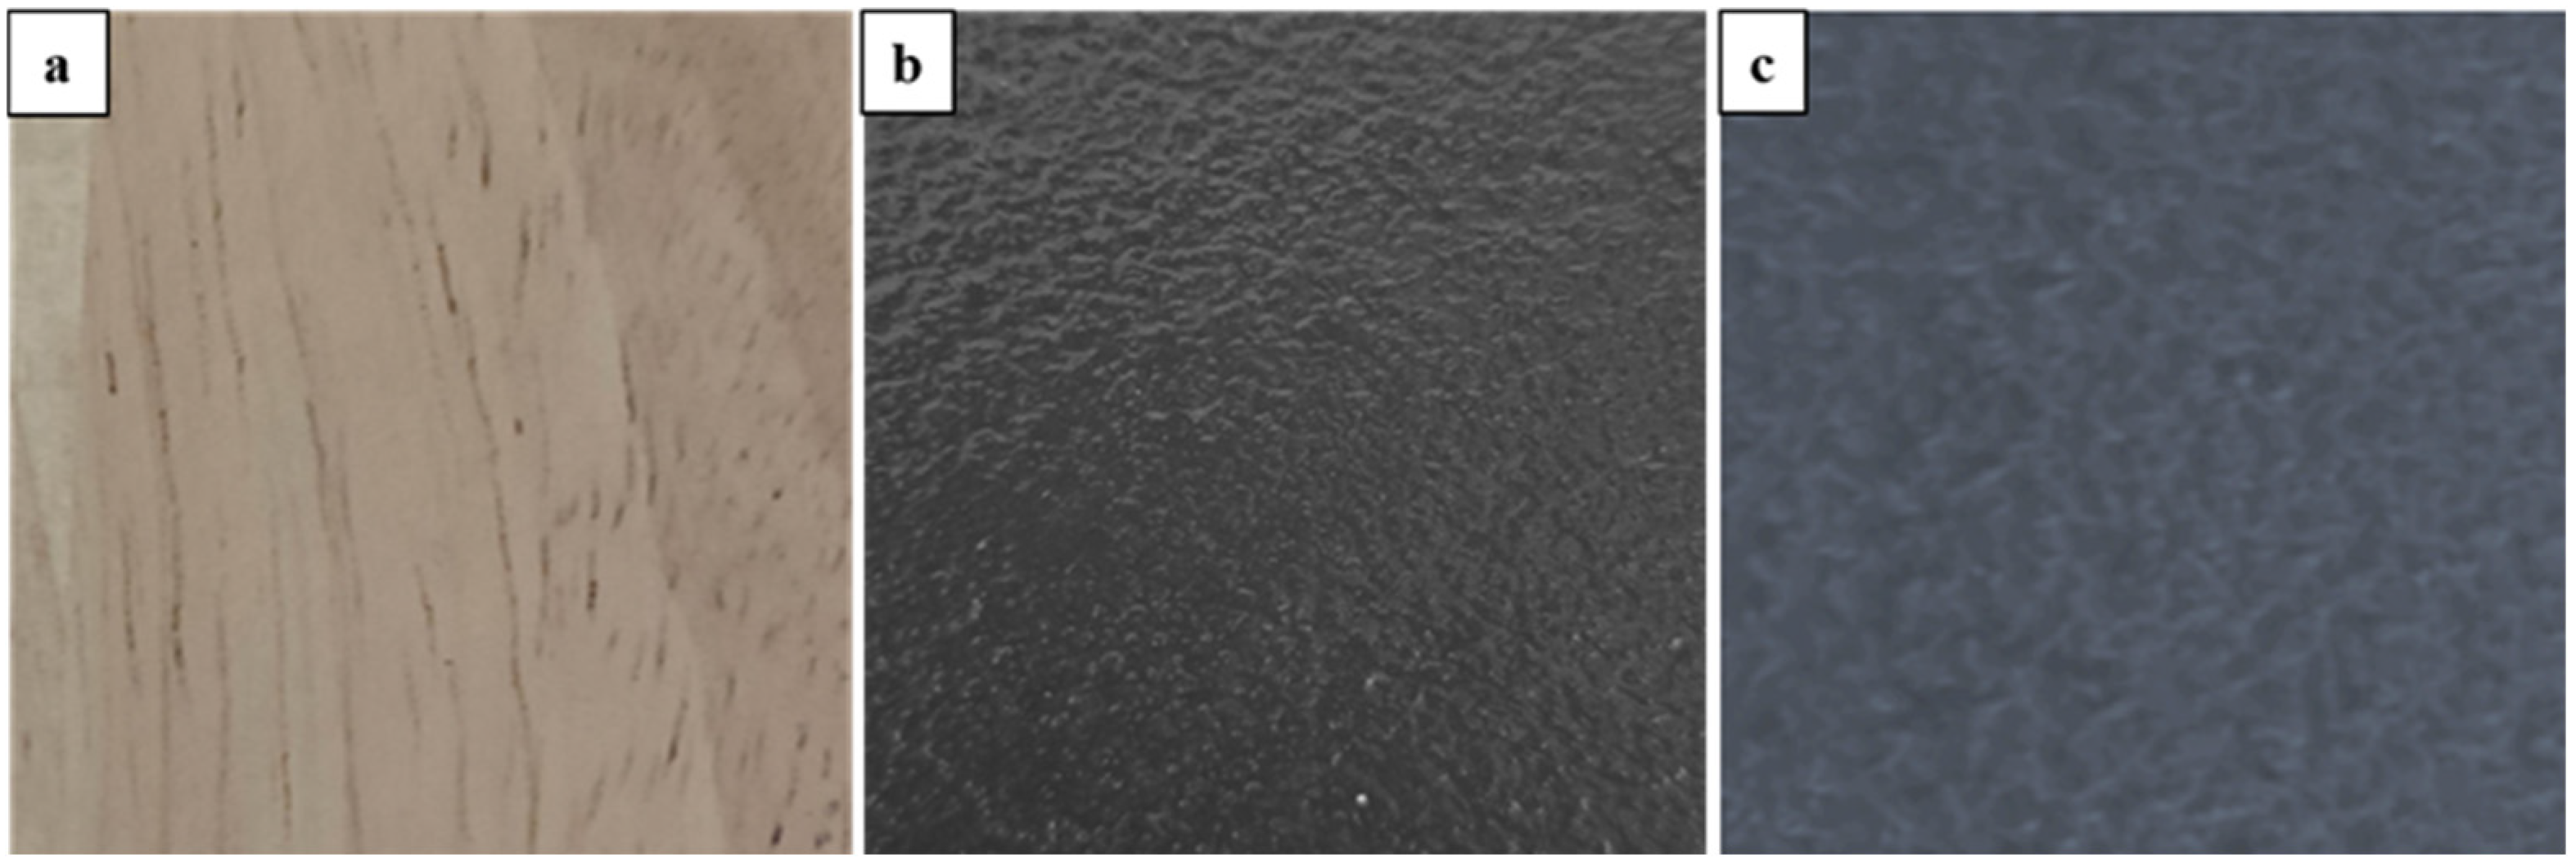
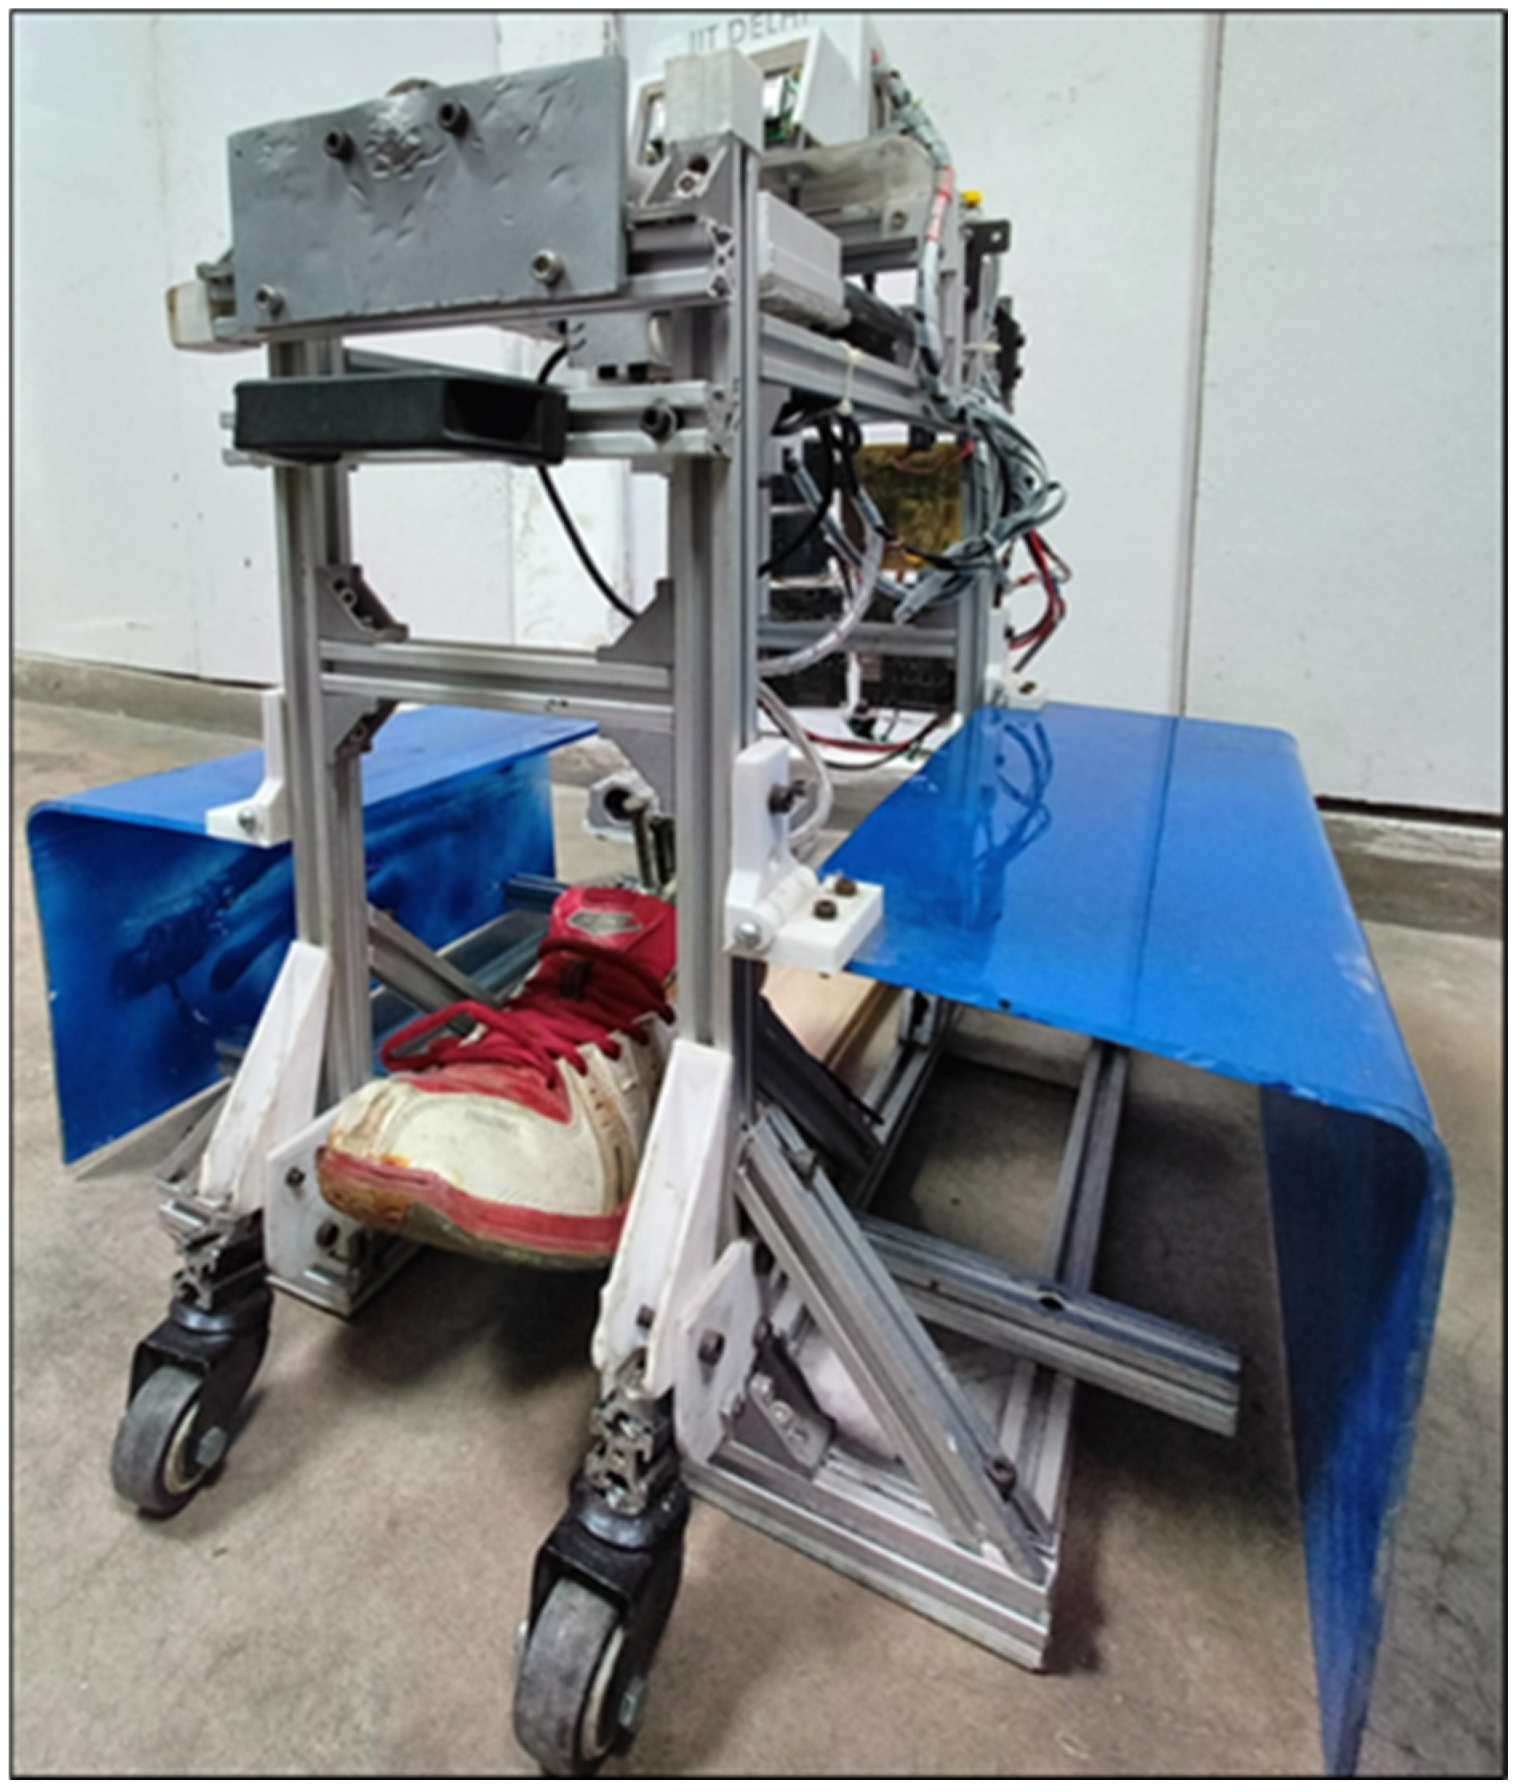
2.2. Slip Testing Experiments

The basketball shoes were tested on three standard flooring surfaces: hardwood (wood, moldo sports, New Delhi, India), synthetic material (pro-flex, moldo sports, New Delhi, India), and polyurethane (HPU-500, moldo sports, New Delhi, India)-based materials (Figure 3). The average surface roughness (Ra) of the analyzed floorings was measured using a surface profile gauge (Precise Equipment, Chennai, India). Measurements were taken at five distinct points on each surface, and the results were averaged. The hardwood flooring was made from laminated maple wood and had no surface treatment. The average surface roughness was measured at Ra = 21 µm, indicating a relatively smooth finish. This type of flooring is commonly used in professional indoor basketball courts and offers low mechanical interlocking with shoe outsoles. Another type of flooring was synthetic, made from polyvinyl chloride (PVC) as part of a commercial sports flooring system. This flooring features a multilayered construction, with a PVC wear layer (~2 mm) bonded to a foam underlayer (~4 mm) for shock absorption. The surface had a lightly textured matte finish, could be enhanced with micro-embossing for improved grip, and had an average surface roughness of Ra = 178 µm. Lastly, PU (polyurethane) flooring consists of a 5 mm PU wear layer over a 5 mm elastic foam underlayer, resulting in a total thickness of approximately 10 mm. This flooring had a fine grit micro-textured surface, with an average surface roughness of Ra = 105 µm. Additionally, the shoes were tested under two slippage conditions: dry and wet slipping conditions.
The ACOF of shoes was measured using a portable biofidelic slip risk assessment instrument (Figure 4), adhering to the standards outlined in ASTM F2913-19 [38]. The device operates at a baud rate of 9600 bits per second. The friction data retrieved during testing were averaged over a 200 ms period from the start of the slipping motion to ensure biofidelity. The functioning principle or working mechanism of the slip testing device included two major motions. While the normal load was simulated using a vertical motion mechanism, the slipping velocity was provided by a horizontal motion mechanism. To replicate the slipping motion caused by heel strikes, a slipping angle of 17° was used for all shoe tests, with the angle adjusting mechanism [7,8]. A vertical load cell working in a closed feedback loop checks the device’s output of a preset constant load of 270 N. As the normal load increased, the motor applied a horizontal velocity of 0.3 m/s simultaneously to mimic real-life sliding biomechanics [39,40]. A load cell that was oriented horizontally was used to measure the friction forces. The device’s load sensors had low nonlinearity (i.e., 0.010 percent full scale), low hysteresis (0.05 percent full scale), and a maximum testing capacity of 500 N. The device’s measuring resolution was at least 0.010. The LCD panel mounted on the slip tester displays the average values of the available coefficient of friction (ACOF) obtained over the 200 ms interval. These testing parameters were derived from prior slip testing investigations that utilized a biofidelic slip tester [41,42,43]. The device setup, functioning principles, and calibration or comparative measurements of this device have been discussed in the literature by Gupta et al., who developed a portable device for surface traction characterization at the shoe–floor interface [44]. There have been other biofidelic slip testers that have been successfully used for the calculation of the friction values between the footwear and flooring [45,46]. Before performing dry slip testing, the flooring was cleaned with a microfiber cloth. Subsequently, a slip testing test was conducted to replicate the wet slipping condition by dispersing 25 mL of water on the surface of the test floor [47]. All the tests were conducted at a room temperature of 25 ± 2 °C, consistent with standard conditions for testing. The apparent contact area refers to the projected area of the shoe outsole that is in contact with the floor during slip testing. This area was determined by importing the SLDPRT part file of the heel pattern into SolidWorks 2020 (Dassault Systèmes, Paris, France). The tread pattern of the outsole heel was analyzed by isolating it from the heel region, and then the surface area was measured using the mass properties feature.
During the slipping condition, ACOF for each slip test trial was calculated as the average ratio of horizontal force, also known as shear force (Fs), to the vertical force (Fv) over 200 ms after the full load and speed were achieved [41]. The ACOF was determined using the ratio of these dynamic quantities, as shown in Equation (1).
A C O F = F s F v
The standard deviation values reported in the figures were calculated based on five repeated measurements for each shoe floor combination under the same testing conditions. The mathematical error was 5% of the calculated value and did not exceed that value.
σ = 1 N i = 1 N X i μ   2
where
  • σ = Standard deviation of ACOF
  • X = The value in the data distribution
  • µ = ACOF mean
  • N = Five repetitions
The determination coefficient (R2) was used to characterize the quality of correlations between flooring, apparent contact area, and averaged ACOF across each slipping condition. It is a metric that provides information about how well a model fits data. In the context of regression, it is a statistical indicator of how closely the regression line resembles the actual data [48]. For this reason, this approach is helpful when a statistical model is used to predict future events or validate hypotheses. Equation (3) below illustrates how to calculate R2.
R 2 = 1 S u m   s q u a r e d   r e g r e s s i o n   ( S S R ) T o t a l   s u m   o f   s q u a r e s   ( S S T )

3. Results

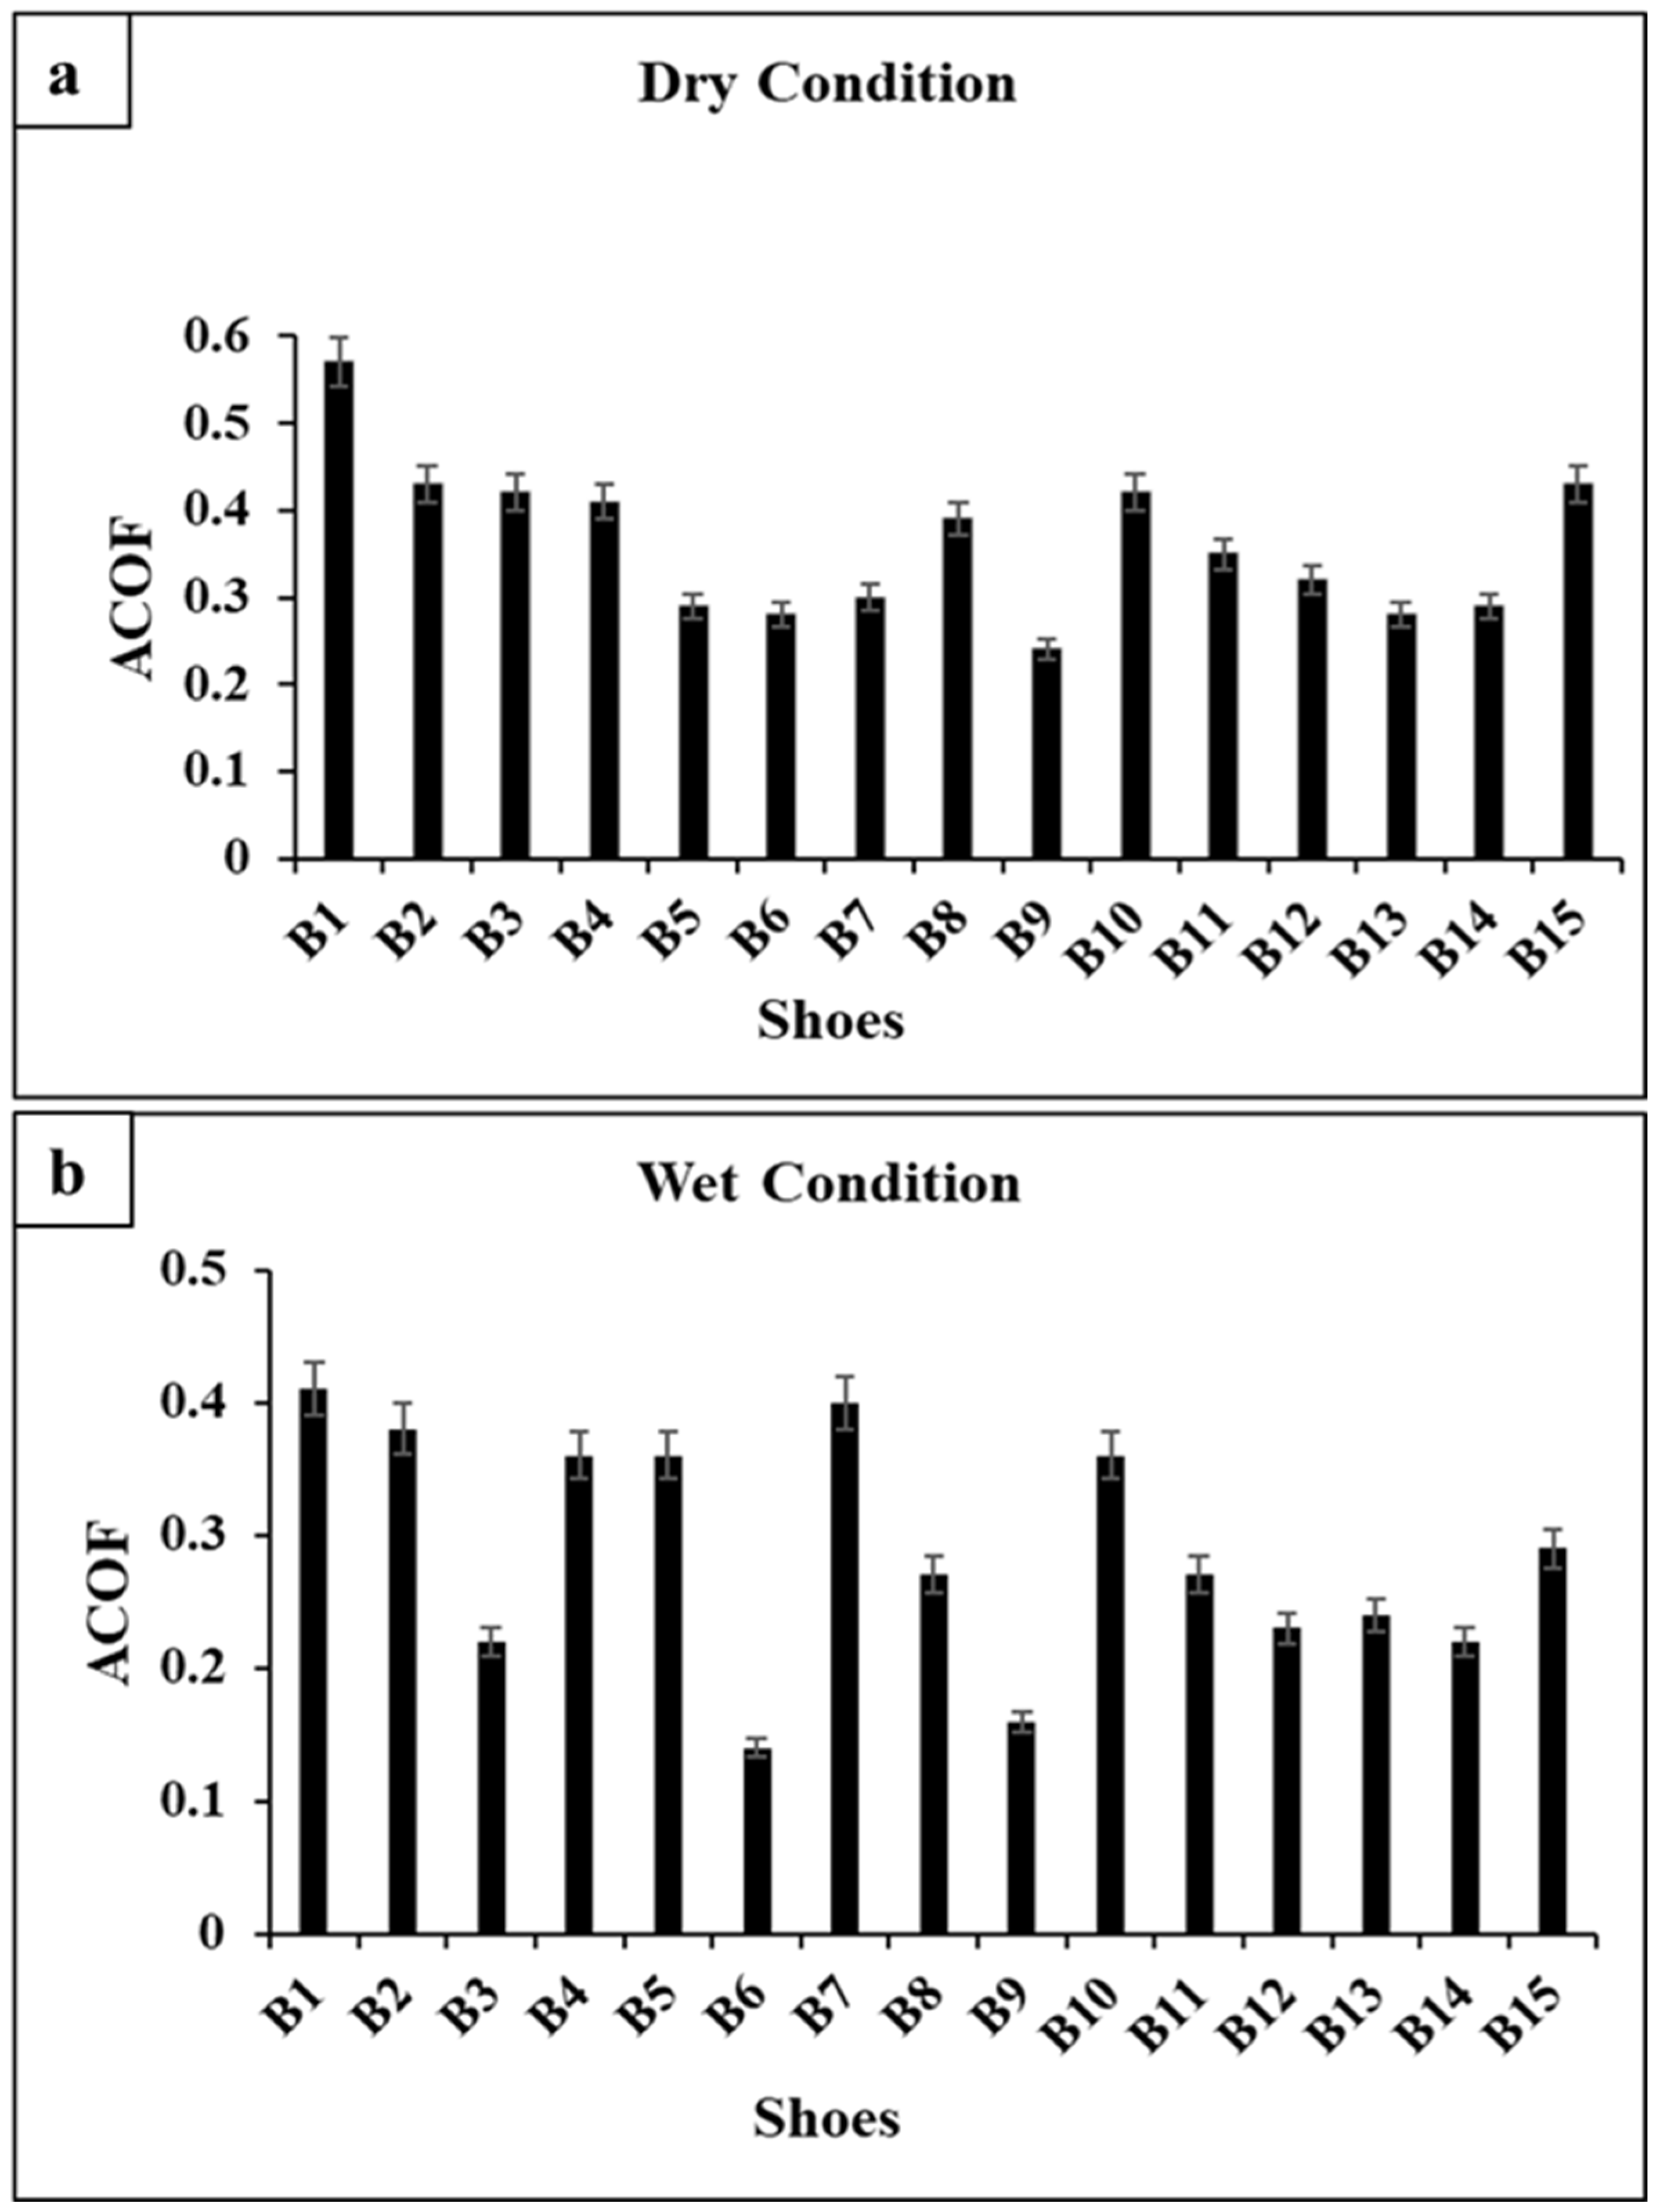
3.1. ACOF Outcomes on the Hardwood Flooring

The shoes were tested on hardwood flooring under various slipping conditions, and the obtained ACOF values ranged from 0.14 to 0.57 (Figure 5). On dry hardwood flooring, the ACOF values ranged from 0.24 to 0.57 (Figure 5a). Among the tested shoes, B1 exhibited the highest ACOF at 0.57, while B9 demonstrated the lowest ACOF at 0.24 when evaluated on dry hardwood flooring. Shoes B11 and B8 exhibited moderate ACOF values of 0.32 and 0.35, respectively. When compared to the traction performance of B9, B2 showed a 79.1% increase in ACOF, B3 showed a 75% increase, B4 a 70% increase, B5 a 20.8% increase, B6 a 16.6% increase, B7 a 25% increase, B8 a 62.5% increase, B10 a 75% increase, B11 a 45.8% increase, B12 a 33.3% increase, B13 a 16.6% increase, B14 a 20.8% increase, and B15 a 79.1% increase. Significant variations in the ACOF were detected across the tested shoes on dry hardwood floors.
Further, the shoes were tested on wet hardwood flooring, and the ACOF values varied from 0.14 to 0.41 (Figure 5b). In these wet conditions, shoe B1 demonstrated the highest ACOF at 0.41, while shoe B6 exhibited the lowest ACOF at 0.14. In comparison to the traction performance of B6, B2 showed a 171.4% increase in ACOF, B3 a 57.1% increase, B4, B5, and B10 a 157.1% increase, B7 a 185.7% increase, B8 and B11 a 92.8% increase, B9 a 14.2% increase, B12 a 64.2% increase, B13 a 71.4% increase, B14 showed a 57.1% increase, and B15 a 107.1% increase. Significant differences in the ACOF were observed across the tested shoes on wet hardwood floors.

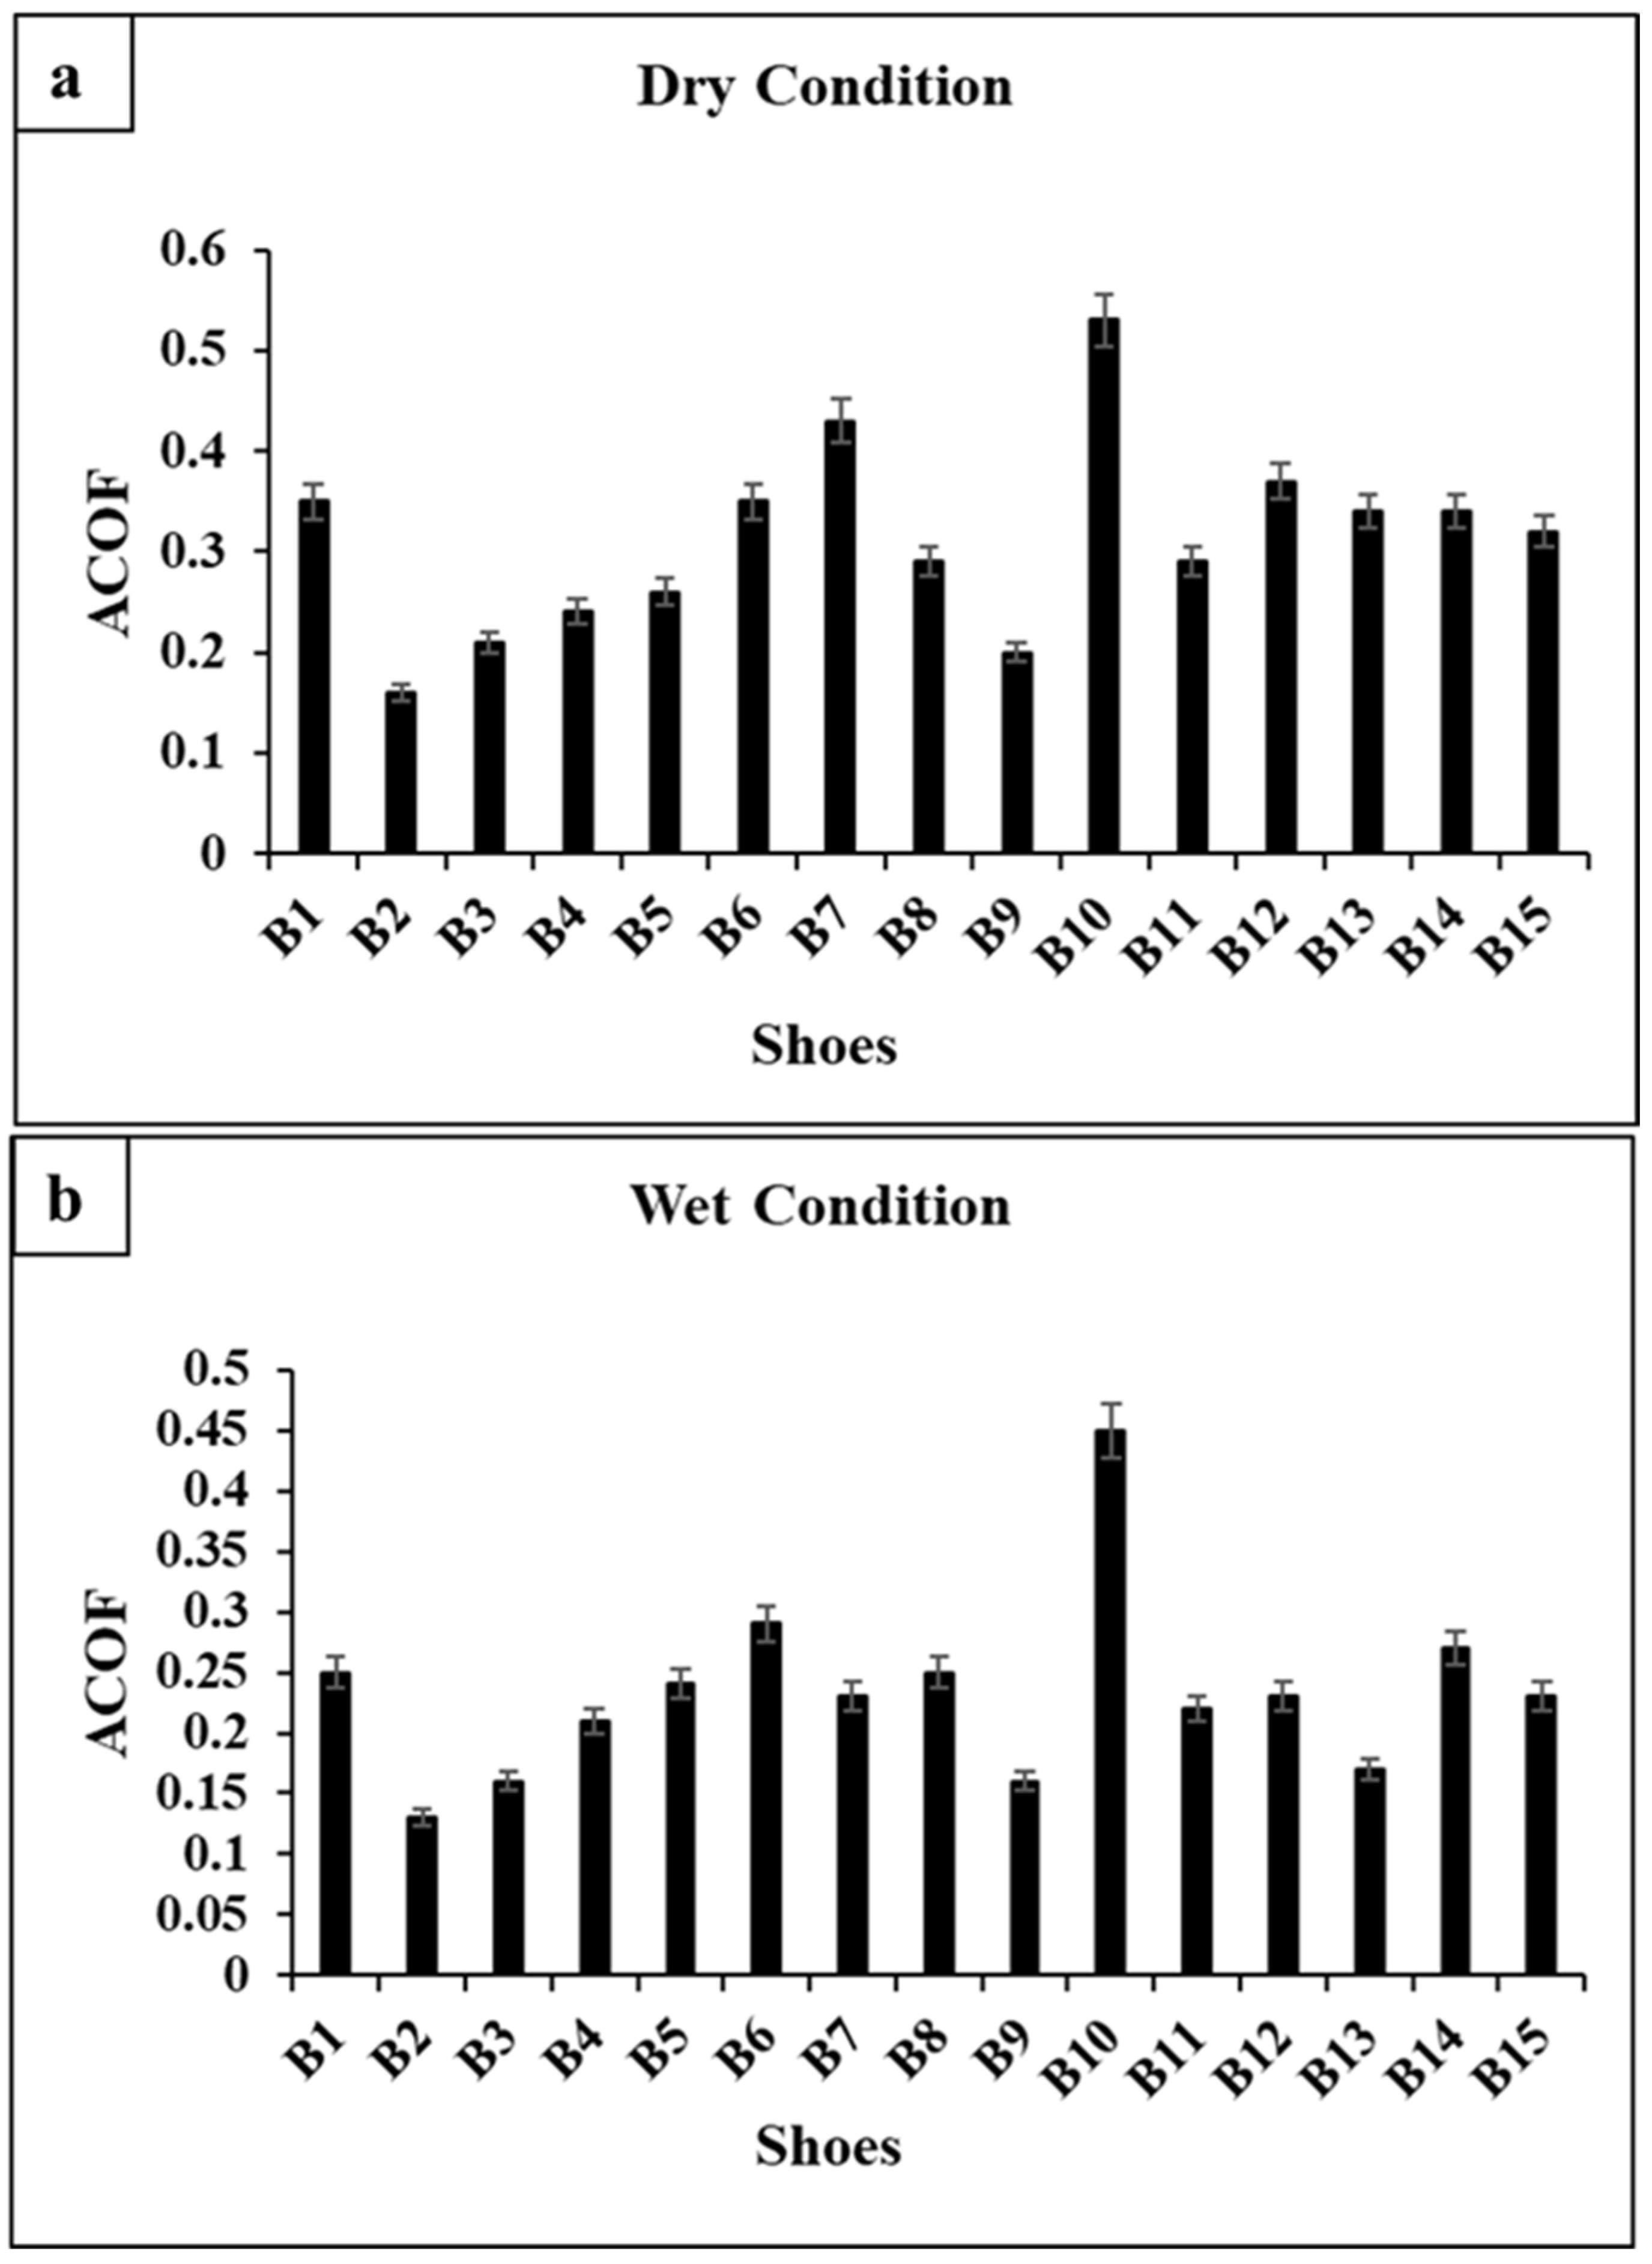
3.2. ACOF Outcomes on the Synthetic Flooring

The ACOF of shoes evaluated on the synthetic flooring under various slippage scenarios ranged from 0.13 to 0.53, as illustrated in Figure 6. The ACOF of shoes on dry synthetic flooring ranged from 0.16 to 0.53 (Figure 6a). Shoe B10 exhibited the highest ACOF at 0.53, while shoe B2 demonstrated the lowest ACOF at 0.16 when evaluated on dry synthetic flooring. In comparison to the traction performance of B2, B1 showed a 118.7% increase in ACOF, B3 a 31.25% increase, B4 a 50% increase, B5 a 62.5% increase, B6 a 118.7% increase, B7 a 168.7% increase, B8 a 81.25% increase, B9 a 25% increase, B11 a 81.25% increase, B12 a 131.25% increase, B13 and B14 a 112.5% increase, and B15 a 100% increase.
On wet synthetic flooring, the ACOF values varied from 0.13 to 0.45 (Figure 6b). The shoe pattern B10 had the highest ACOF at 0.45, while B2 had the lowest ACOF at 0.13. In comparison to the traction performance of B2, B1 showed a 92.30% increase in ACOF, B3 a 23% increase, B4 a 61.53% increase, B5 a 84.6% increase, B6 a 123% increase, B7 a 76.9% increase, B8 a 92.3% increase, B9 a 23% increase, B11 a 69.23% increase, B12 a 76.92% increase, B13 a 76.92% increase, B14 a 107.6% increase, and B15 a 76.92% increase.

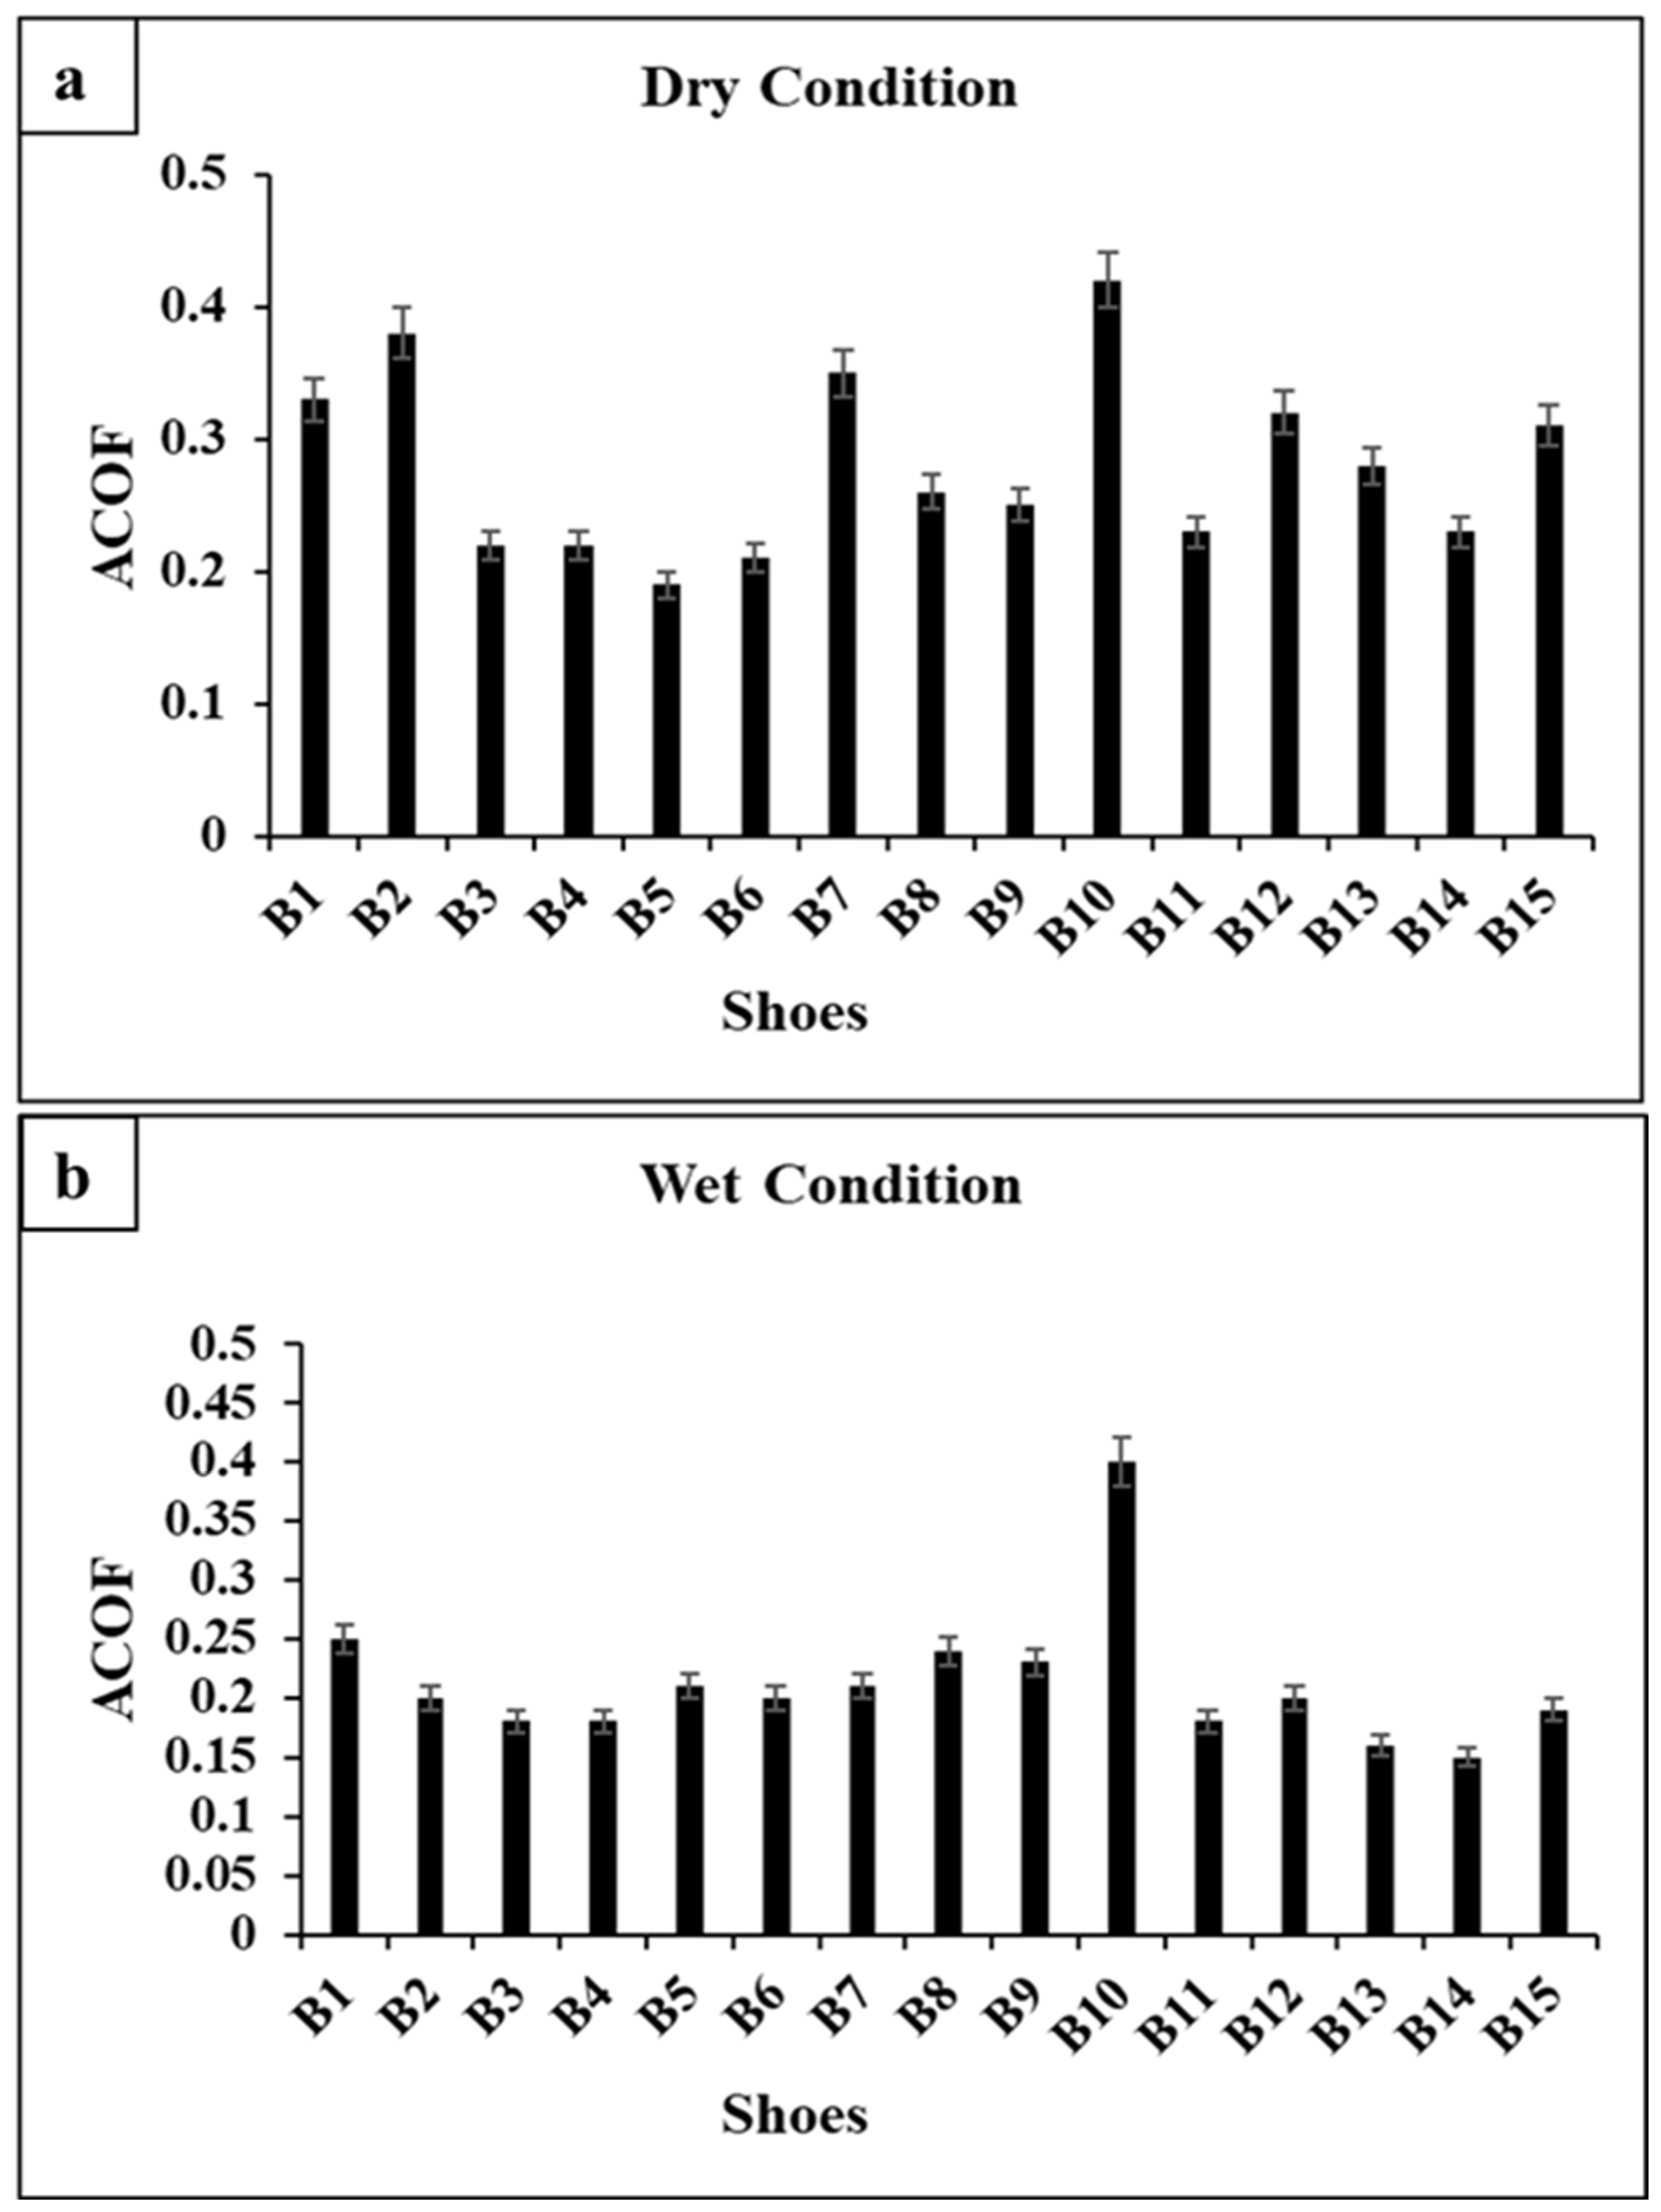
3.3. ACOF Outcomes on the PU Flooring

On PU flooring, the ACOF of shoes was evaluated in various slippage situations ranging from 0.15 to 0.42, as shown in Figure 7. On the dry PU flooring, the ACOF values varied from 0.19 to 0.42 (Figure 7a). Shoe B10 showed the highest ACOF at 0.42, and shoe B5 the lowest ACOF at 0.19. In comparison to the traction performance of B5, B1 showed a a73.6% increase in ACOF, B2 1a 00% increase, B3 and B4 a 15.7% increase, B6 a 10.5% increase, B7a 84.2% increase, B8 a 36.8% increase, B9 a 31.5% increase, B11 a 21.05% increase, B12 a 68.42% increase, B13 a 47.36% increase, B14 a 21.05% increase, and B15 a 63.15% increase.
On wet PU flooring, the ACOF values varied from 0.15 to 0.4 (Figure 7b). Consistent with the ACOF results in arid environments, B10 demonstrated the highest ACOF at 0.4, while B14 exhibited the lowest ACOF at 0.15. In comparison to the traction performance of B14, B1 showed a 66.6% increase in ACOF, B2 a 33.3% increase, B3 and B4 a 20% increase, B5 a 50% increase, B6 a 33.3% increase, B7 a 40% increase, B8 a 60% increase, B9 a 53.3% increase, B11 a 20% increase, B12 a 33.3% increase, B13 a 6.6% increase, and B15 a 26.6% increase.

3.4. Impact of Footwear Characteristics on Traction Performance

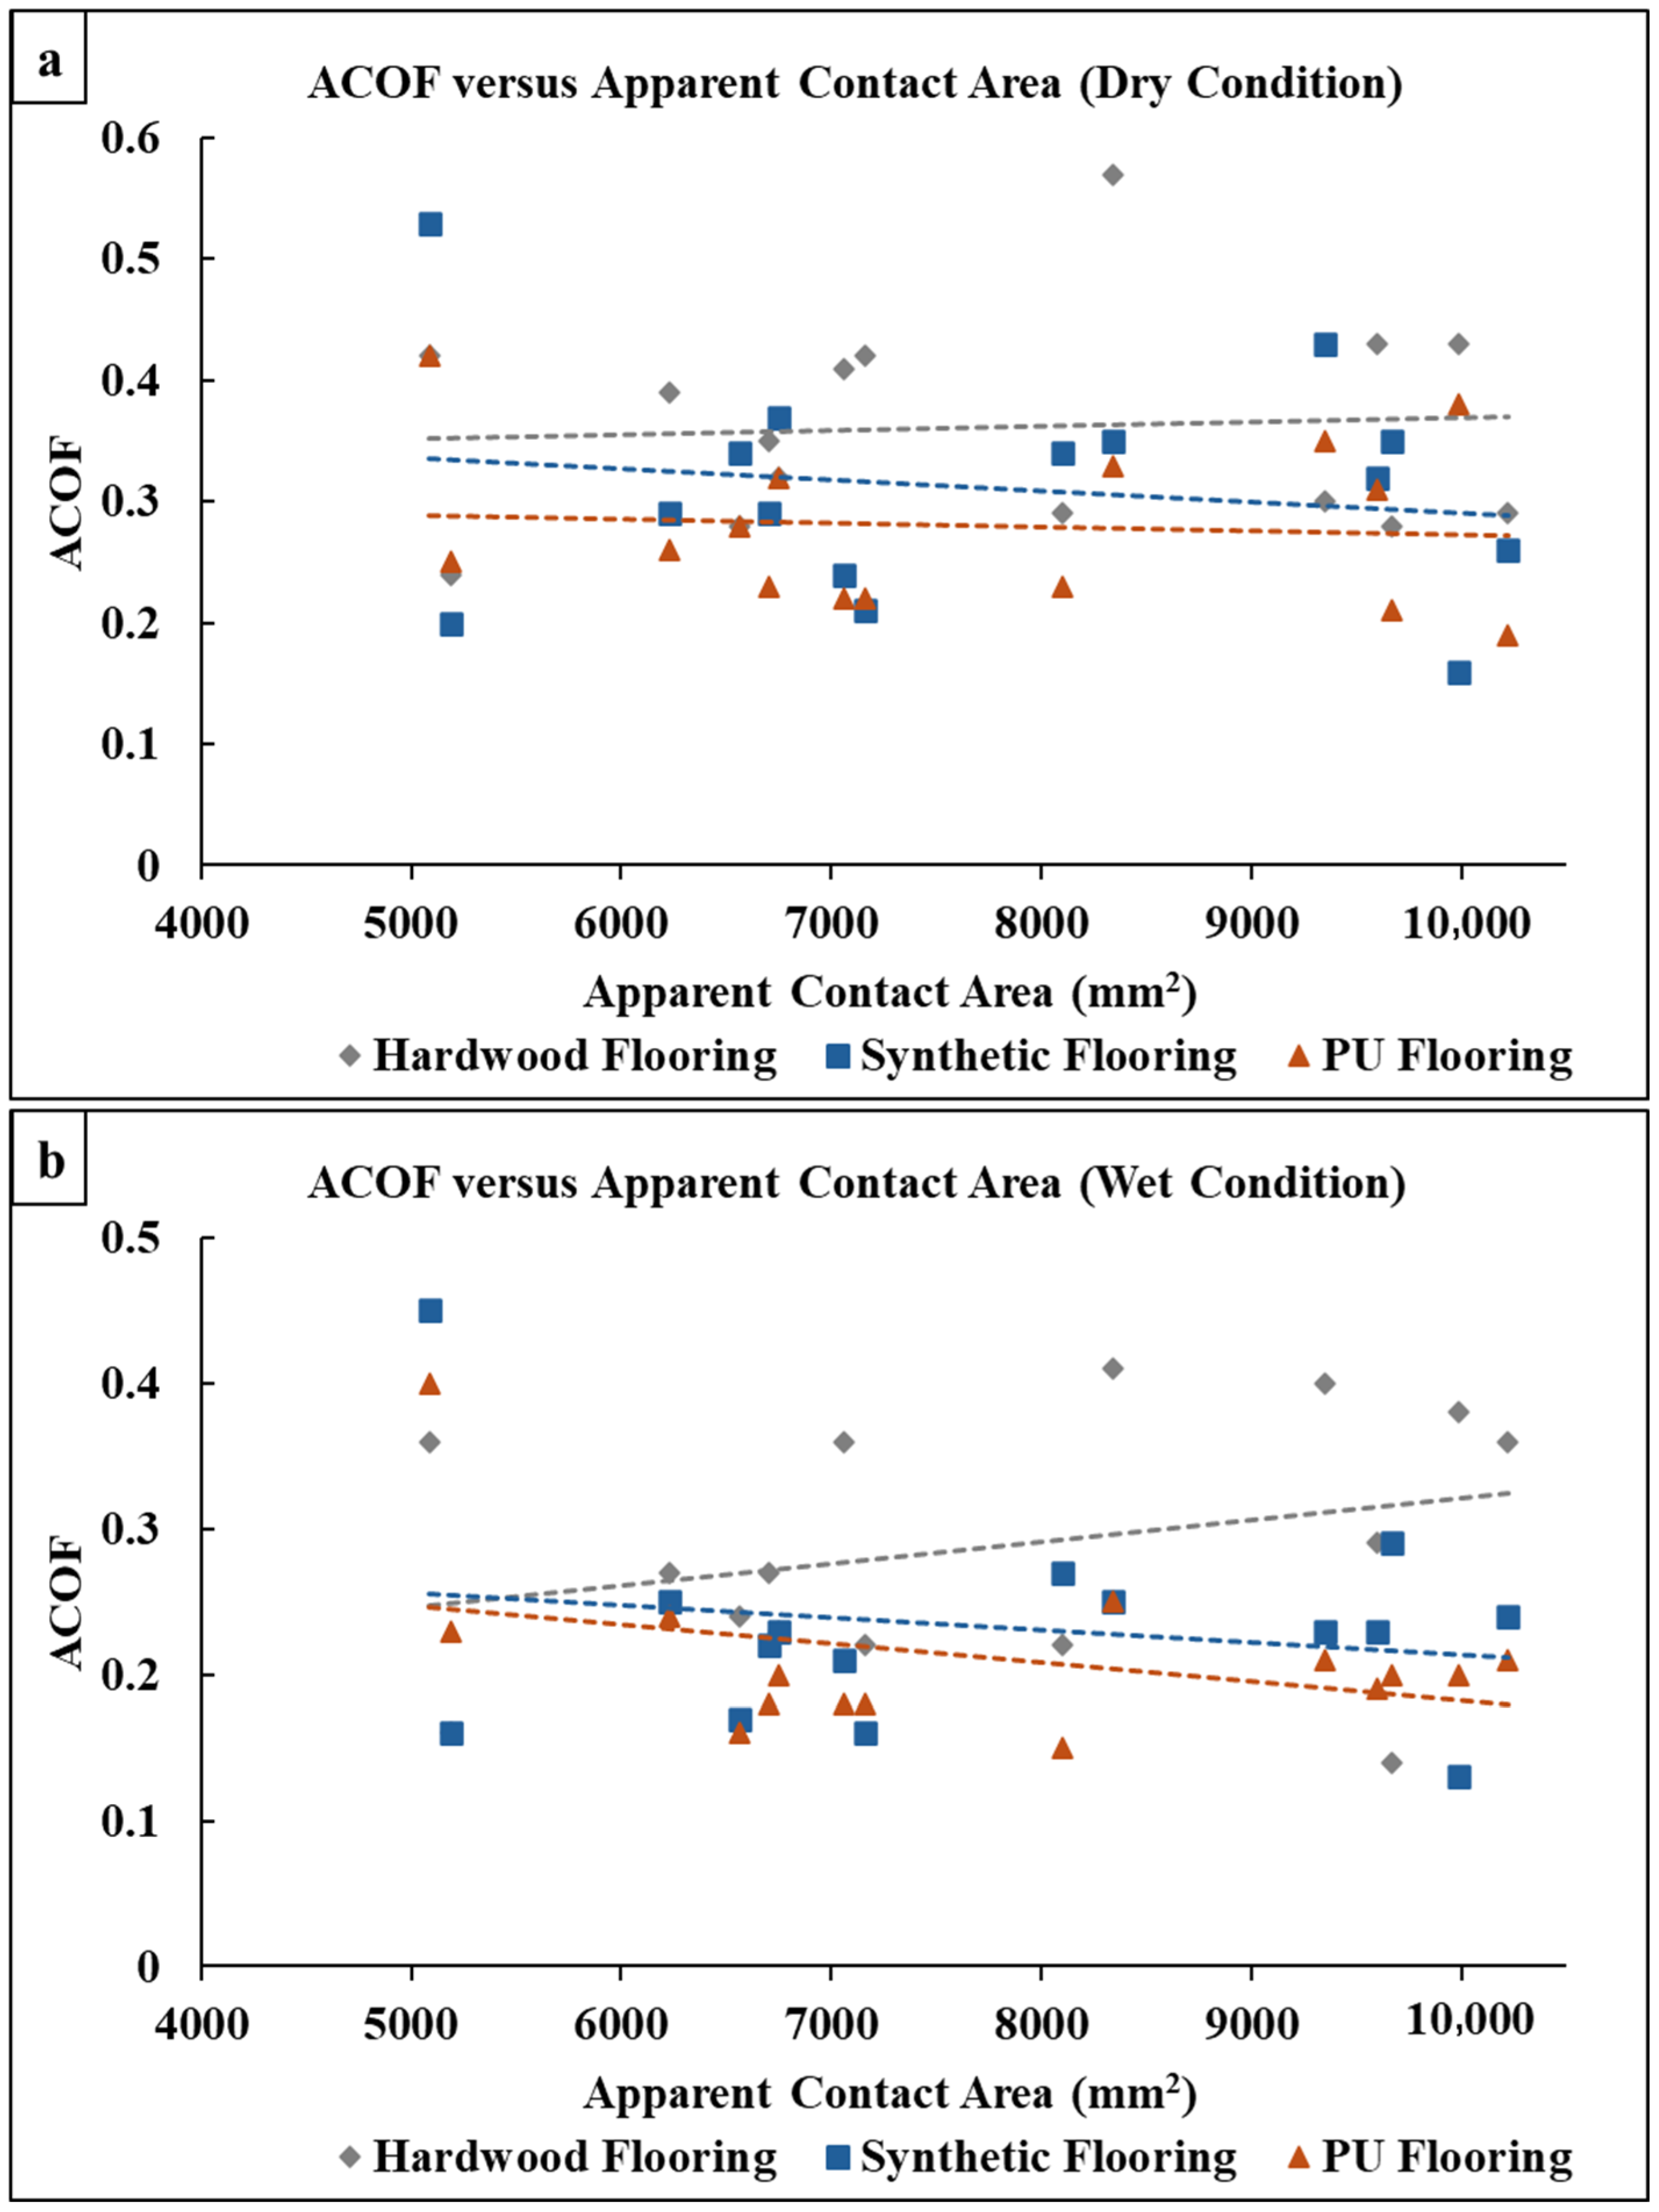
3.4.1. Effect of Apparent Contact Area on ACOF

The relationship between ACOF and apparent contact area among the shoes under dry slipping conditions was illustrated in Figure 8a. When analyzing, it was found that the apparent contact area of dry hardwood flooring exhibited substantially no trends with the total traction performance of the shoe. Notably, B5 had the largest apparent contact area of 10,222 mm2 but recorded a relatively low ACOF of 0.29. In contrast, shoe B1 had a smaller apparent contact area of 8341 mm2 and the highest ACOF of 0.57. Among the fifteen shoes examined, ten shoes conformed to the above ACOF of 0.30; however, shoe B10 exhibited the smallest apparent contact area of 5086 mm2 with a high ACOF of 0.42. In synthetic flooring, a negative trend was observed between the apparent contact area and the ACOF. It was observed that B10 had the lowest apparent contact area of 5086 mm2 and had the highest ACOF of 0.53. Eight shoes conformed to the above ACOF of 0.30; however, shoe B2 exhibited a high apparent contact area of 9985 mm2 with a low ACOF of 0.16. In PU flooring, the apparent contact area exhibited substantially no trends with the total traction performance of the footwear. Notably, B5 had the largest apparent contact area of 10,222 mm2 and had the lowest ACOF of 0.19, but B10 had the lowest apparent contact area of 5086 mm2 with the highest ACOF of 0.42. Six shoes conformed to the above ACOF of 0.30. In this case, the moderate contact area exhibited a suitable traction performance of the shoes on hardwood flooring.
The relationship between the ACOF and the apparent contact area of the developed outsoles under wet slipping conditions was shown in Figure 8b. In wet hardwood flooring, the apparent contact area showed positive significant trends related to the overall traction performance of the shoes. Notably, shoe B5 had the largest apparent contact area of 10,222 mm2 but a moderate ACOF of 0.36. In contrast, shoe B1 had a smaller apparent contact area of 8341 mm2 and the highest ACOF of 0.41. This outcome was similar to the dry slipping conditions. It was observed that only six out of fifteen shoes met the ACOF threshold of 0.30 in wet conditions. However, shoe B10 exhibited the lowest apparent contact area of 5086 mm2 along with an ACOF of 0.36 (i.e., above 0.3). In synthetic flooring, the apparent contact area demonstrated a negative trend with the ACOF. For instance, B10 had the lowest apparent contact area of 5086 mm2, but the highest ACOF of 0.45 only met the ACOF threshold of 0.30. The shoe B2 had a high apparent contact area of 9985 mm2 along with a low ACOF of 0.13. For PU flooring, again, the apparent contact area showed significant negative trends related to traction performance. Shoe B5 had the largest apparent contact area of 10,222 mm2 and an ACOF of 0.21, while shoe B10 had the lowest apparent contact area of 5086 mm2 but a higher ACOF of 0.40. In this case, a moderate contact area followed the trend with suitable traction performance for the shoes on hardwood flooring.

3.4.2. Effect of Heel Tread Pattern on ACOF

Five out of the fifteen heel patterns demonstrated ACOF above the threshold values across all flooring types in dry conditions, due to their unique tread pattern designs (Table 1). Patterns B1, B7, B12, and B15 feature herringbone patterns (a sequence of zigzag, V-shaped, or interlocking patterns). These designs are commonly used in basketball shoes and provide superior traction for abrupt stops, fast turns, and lateral motions. On dry hardwood flooring, shoe pattern B1 exhibited the highest ACOF, showing increases of 62.8% and 72.7% compared to synthetic and PU flooring, respectively. In contrast, pattern B7 had the lowest ACOF, with decreases of 43.3% and 16.6% compared to synthetic and PU flooring, respectively. However, its unique heel design showed an increase in the ACOF in wet conditions, 33.3% on wet hard flooring. Similarly, pattern B12 showed a 23.3% increase in ACOF compared to both hardwood and PU flooring in dry conditions. Additionally, pattern B10, featuring concentric circles and arcs, demonstrated excellent ACOF across all types of flooring in both dry and wet conditions. In dry conditions, the ACOF for pattern B10 increased 26.1% on synthetic flooring compared to hardwood and PU flooring, while in wet conditions, it increased 25% and 12.5%, respectively. Overall, these patterns showed excellent ACOF values on wet hardwood flooring, followed by synthetic flooring. However, the PU flooring exhibited poor ACOF results. Among these floorings, better ACOF was observed in the synthetic flooring.

4. Discussion

This study assessed the traction performance of basketball shoe designs across various flooring types, namely hardwood, synthetic, and PU, under different slipping conditions. The results highlighted the significant impact of both shoe heel patterns and flooring materials on slip resistance. Hardwood flooring demonstrated better traction performance under both wet and dry conditions. Approximately 60% of the tested shoes exceeded the ACOF threshold of 0.3 in dry conditions, while 40% did so in wet conditions. Although slip resistance was improved compared to synthetic and PU floorings, it was still insufficient to ensure complete safety in wet conditions. For synthetic flooring exhibited, only 50% of the shoes achieved ACOF values above the threshold in dry conditions, and only a single shoe maintained slip resistance behavior in wet conditions. The variability in ACOF values from 0.16 to 0.53 indicates that the heel pattern significantly influences the performance, suggesting only moderate performance on synthetic flooring. On the other hand, PU flooring posed the greatest challenge regarding slip resistance. Only 40% of the shoes surpassed the ACOF threshold in dry conditions, and their performance in wet conditions was largely unsatisfactory, with only one shoe exhibiting near slip-resistant behavior.
On hardwood flooring, the best ACOF in dry conditions was recorded for patterns B1 (0.57), B2 (0.43), B3 (0.42), and B10 (0.42). These patterns seem to interact effectively with the hardwood, likely due to their tread geometry, which could ensure good surface contact. In wet conditions, B1 (0.41), B2 (0.38), and B10 (0.36) still performed well, probably because of their ability to efficiently evacuate water and maintain contact with the floor. In contrast, patterns B6 (0.14) and B14 (0.22) exhibited the poorest performance in wet conditions, possibly due to closed tread designs that trap water and limit micro asperity engagement. For synthetic flooring, the highest dry ACOF was achieved by B10 (0.53), B7 (0.43), and B12 (0.37). Despite the high roughness of the synthetic flooring, only those tread patterns that could be effectively interlocked with the surface carried superior grip. Under wet conditions, B10 (0.45), B6 (0.29), and B14 (0.27) continued to show relatively high ACOF, with B10 again emerging as a consistently high performer. Patterns such as B9 (0.16), B3 (0.16), and B2 (0.13) performed poorly in wet conditions, likely due to limited water dispersion and weak mechanical grip. On PU flooring, the highest dry ACOF was achieved by B10 (0.42), B7 (0.35), and B2 (0.38). Despite the smoother surface, these tread patterns can manage to maintain good adhesive contact. In wet conditions, B10 (0.40), B8 (0.24), and B1 (0.25) also performed relatively well. The consistent performance of B10, even on smooth and wet PU flooring, suggests that the tread design allows for efficient water drainage. Conversely, patterns B13 (0.16) and B14 (0.15) performed poorly, indicating that they rely on adhesion rather than tread-induced grip, which fails in wet conditions.
Additionally, tread patterns significantly influenced ACOF, especially under wet conditions. The herringbone tread pattern, composed of V-shaped grooves arranged in alternating angles, could have provided multidirectional traction. This configuration can be effective during lateral movements, deceleration, and heel strikes, as it allows for consistent engagement with the floor regardless of foot landing angle. This is crucial in basketball, where abrupt changes in direction and dynamic movements are common. Both herringbone and curved (wave-like) patterns could have created structural channels that aid in displacing fluids and removing debris from the shoe–floor interface. This functionality can be especially beneficial under wet conditions, where such patterns help prevent hydroplaning by reducing fluid film accumulation. As a result, these designs exhibit higher available coefficient of friction (ACOF) values compared to flatter or minimally patterned outsoles [31,32,33]. In the present study, samples B1, B7, B12, and B15 featured variations in the herringbone pattern, ranging from zigzag to V-shaped and interlocking designs. These shoes could have demonstrated consistently superior slip resistance, particularly under wet conditions, due to their effective tread geometry. The finding aligns with the previous studies that underscore the importance of tread patterns in optimizing friction performance under challenging conditions [49,50]. This work aligns with a previous analysis by Jones et al. [41], which highlighted the significant influence of contact area and shoe outsole hardness overall. Furthermore, in dry and wet conditions, ACOF and apparent contact area on synthetic flooring showed a negative trend, which may indicate that the flooring’s surface roughness has a bigger impact on ACOF than apparent contact area. A positive trend in wet conditions exists between ACOF and the apparent contact area in hardwood floors; however, it points to the potential dominance of the apparent contact area (or tread designs) in influencing ACOF over the flooring’s surface roughness. The dominance of surface roughness over apparent contact area in flooring and the dominance of apparent contact area over surface roughness are two examples of our findings that were comparable to the previous literature and are consistent with a study by Meehan et al. [51]. The effects of various flooring types on the available friction of the basketball heel pattern were examined in this study. It also demonstrated that floorings with high surface roughness result in relatively large changes in ACOF values, while floorings with lower surface roughness produce relatively small changes in ACOF values.
The primary mechanisms of friction between the contact surfaces of a shoe and the floor are adhesion and hysteresis. In a study by Strobel et al. [52], the impact of variations in adhesion and hysteresis friction components across three distinct materials was examined. For low shore A hardness materials (polyurethane), higher hysteresis and lubricated adhesion friction were observed across some contaminant conditions. This aligns with the current finding where hardwood generally has low surface roughness, exhibits a dominant adhesion friction, and the contribution of hysteresis friction was presumed to be small. Furthermore, the finite element model developed by Moghaddam et al. [53] confirmed that adhesion increases for smoother shoes, while hysteresis friction increases for rougher floor surfaces. In the current study, the tread patterns such as B1, B2, and B14 could be shown to enhance adhesion by maximizing real contact area due to their finer, more continuous surface geometries. On the other hand, deeper and more intricate patterns like B3, B5, and B15 may have improved localized micro-deformation, resulting in greater hysteresis friction. However, hysteresis loss does not occur due to macroscopic deformation at the tread unit level but rather results from the repeated micro-scale deformation and recovery process caused by contact with the asperities on the counter surface [53,54].
This study has some limitations that need to be addressed. The current study considers the vertical load to be approximately 270 N, and the sliding speed is around 0.3 m/s, based on the existing slip mechanism [39,40]. However, further study on basketball motion should be conducted to ascertain the exact amount of load and sliding conditions. There is a lack of studies regarding the slipping motion of basketball shoes, and the mechanisms of the footwear have not been thoroughly tested. In the future, we are planning to investigate the biomechanics of the lower body during basketball motion for a better understanding of sliding conditions and will do a detailed analysis. Although common patterns were considered for this study, studying more tread designs, floorings, and contamination effluents could provide a better understanding. Tests were conducted on common flooring materials and contaminants found in indoor environments. Another limitation of this study is the minimum ACOF value among the tested samples as a baseline for comparison. As it is a preliminary study, there are no particularly defined standards for acceptable or optimal ACOF values in basketball shoe tread patterns applied on common courts. This study could provide an initial and foundational contribution to this area of research, aiming to address the existing knowledge gap through direct observations and analysis. Extending these findings beyond the flooring types examined in this study should be performed with caution. Our understanding of the generalization of traction across surfaces may be improved by considering more floorings and contaminant conditions, especially those found outdoors.

5. Conclusions

In conclusion, the application of the flooring type (hardwood, synthetic, and PU) produced varying surface roughness, and most basketball shoes did not demonstrate slip-resistant performance under typical slippery conditions. Shoes with comparable hardwood flooring demonstrated enhanced slip-resistance performance in dry as well as wet conditions. Furthermore, followed by synthetic flooring and PU flooring. Shoe heel with herringbone and curved (or circular) treads in the heel area exhibited superior grip performance relative to other shoes. This research is anticipated to enhance our understanding of how design elements of typical basketball shoes influence traction, a topic that has not been thoroughly examined to our knowledge. The results are anticipated to offer guidance to the players and basketball shoemakers in selecting and developing safer shoes to address the issue of injuries.

Author Contributions

P.Y.: Methodology; Data Curation; Validation; Investigation; Formal Analysis; Writing—Original Draft; Writing—Review and Editing. S.G.: Data Curation; Investigation; Formal Analysis. D.S.: Data Curation. A.C.: Conceptualization; Supervision; Writing—Review and Editing. All authors have read and agreed to the published version of the manuscript.

Funding

This research received no external funding.

Institutional Review Board Statement

Not applicable.

Informed Consent Statement

Not applicable.

Data Availability Statement

The datasets generated during and/or analyzed during the current study are not publicly available due to their size but are available from the corresponding author on reasonable request.

Conflicts of Interest

The authors declare no potential conflicts of interest with respect to the research, authorship, and/or publication of this article.

References

  1. Stojanović, E.; Faude, O.; Scanlan, A.T.; Jakovljević, V.; Ćosić, M.; Kocić, M.; Radovanović, D. Injury incidence among adolescent and senior basketball players: A prospective study in 19 teams across an entire season. Phys. Sportsmed. 2024, 52, 386–394. [Google Scholar] [CrossRef] [PubMed]
  2. Narazaki, K.; Berg, K.; Stergiou, N.; Chen, B. Physiological demands of competitive basketball. Scand. J. Med. Sci. Sports 2009, 19, 425–432. [Google Scholar] [CrossRef] [PubMed]
  3. Kuhlman, S.; Sabick, M.; Pfeiffer, R.; Cooper, B.; Forhan, J. Effect of loading condition on the traction coefficient between shoes and artificial turf surfaces. Proc. Inst. Mech. Eng. Part P. J. Sport. Eng. Technol. 2010, 224, 155–165. [Google Scholar] [CrossRef]
  4. Borowski, L.A.; Yard, E.E.; Fields, S.K.; Comstock, R.D. The epidemiology of US high school basketball injuries, 2005–2007. Am. J. Sports Med. 2008, 36, 2328–2335. [Google Scholar] [CrossRef] [PubMed]
  5. Chang, W.-R.; Grönqvist, R.; Leclercq, S.; Myung, R.; Makkonen, L.; Strandberg, L.; Brungraber, R.J.; Mattke, U.; Thorpe, S.C. The role of friction in the measurement of slipperiness, Part 1: Friction mechanisms and definition of test conditions. Ergonomics 2001, 44, 1217–1232. [Google Scholar] [CrossRef] [PubMed]
  6. Hanson, J.P.; Redfern, M.S.; Mazumdar, M. Predicting slips and falls considering required and available friction. Ergonomics 1999, 42, 1619–1633. [Google Scholar] [CrossRef] [PubMed]
  7. Beschorner, K.E.; Redfern, M.S.; Porter, W.L.; Debski, R.E. Effects of slip testing parameters on measured coefficient of friction. Appl. Ergon. 2007, 38, 773–780. [Google Scholar] [CrossRef] [PubMed]
  8. Iraqi, A.; Cham, R.; Redfern, M.S.; Beschorner, K.E. Coefficient of friction testing parameters influence the prediction of human slips. Appl. Ergon. 2018, 70, 118–126. [Google Scholar] [CrossRef] [PubMed]
  9. Gupta, S.; Chatterjee, S.; Malviya, A.; Chanda, A. Traction Performance of Common Formal Footwear on Slippery Surfaces. Surfaces 2022, 5, 489–503. [Google Scholar] [CrossRef]
  10. Beschorner, K.E.; Chanda, A.; Moyer, B.E.; Reasinger, A.; Griffin, S.C.; Johnston, I.M. Validating the ability of a portable shoe-floor friction testing device, NextSTEPS, to predict human slips. Appl. Ergon. 2023, 106, 103854. [Google Scholar] [CrossRef] [PubMed]
  11. Aschan, C.; Hirvonen, M.; Mannelin, T.; Rajamäki, E. Development and validation of a novel portable slip simulator. Appl. Ergon. 2005, 36, 585–593. [Google Scholar] [CrossRef] [PubMed]
  12. Singh, G.; Beschorner, K.E. A Method for Measuring Fluid Pressures in the Shoe–Floor–Fluid Interface: Application to Shoe Tread Evaluation. IIE Trans. Occup. Ergon. Hum. Factors 2014, 2, 53–59. [Google Scholar] [CrossRef] [PubMed]
  13. Worobets, J.; Wannop, J.W. Influence of basketball shoe mass, outsole traction, and forefoot bending stiffness on three athletic movements. Sport. Biomech. 2015, 14, 351–360. [Google Scholar] [CrossRef] [PubMed]
  14. Moriyasu, K.; Nishiwaki, T.; Shibata, K.; Yamaguchi, T.; Hokkirigawa, K. Friction control of a resin foam/rubber laminated block material. Tribol. Int. 2019, 136, 548–555. [Google Scholar] [CrossRef]
  15. Lam, W.K.; Sterzing, T.; Cheung, J.T.M. Reliability of a basketball specific testing protocol for footwear fit and comfort perception. Footwear Sci. 2011, 3, 151–158. [Google Scholar] [CrossRef]
  16. Liu, H.; Wu, Z.; Lam, W.K. Collar height and heel counter-stiffness for ankle stability and athletic performance in basketball. Res. Sport. Med. 2017, 25, 209–218. [Google Scholar] [CrossRef] [PubMed]
  17. Yamaguchi, T.; Katsurashima, Y.; Hokkirigawa, K. Effect of rubber block height and orientation on the coefficients of friction against smooth steel surface lubricated with glycerol solution. Tribol. Int. 2017, 110, 96–102. [Google Scholar] [CrossRef]
  18. Li, K.W.; Chen, C.J. The effect of shoe soling tread groove width on the coefficient of friction with different sole materials, floors, and contaminants. Appl. Ergon. 2004, 35, 499–507. [Google Scholar] [CrossRef] [PubMed]
  19. Li, K.W.; Chin, J.C. Effects of tread groove orientation and width of the footwear pads on measured friction coefficients. Saf. Sci. 2005, 43, 391–405. [Google Scholar] [CrossRef]
  20. Yamaguchi, T.; Umetsu, T.; Ishizuka, Y.; Kasuga, K.; Ito, T.; Ishizawa, S.; Hokkirigawa, K. Development of new footwear sole surface pattern for prevention of slip-related falls. Saf. Sci. 2012, 50, 986–994. [Google Scholar] [CrossRef]
  21. Nishi, T.; Yamaguchi, T.; Hokkirigawa, K. Development of high slip-resistant footwear outsole using rubber surface filled with activated carbon/sodium chloride. Sci. Rep. 2022, 12, 267. [Google Scholar] [CrossRef] [PubMed]
  22. Jakobsen, L.; Lysdal, F.G.; Bagehorn, T.; Kersting, U.G.; Sivebaek, I.M. The effect of footwear outsole material on slip resistance on dry and contaminated surfaces with geometrically controlled outsoles. Ergonomics 2023, 66, 322–329. [Google Scholar] [CrossRef] [PubMed]
  23. Hemler, S.L.; Pliner, E.M.; Redfern, M.S.; Haight, J.M.; Beschorner, K.E. Effects of natural shoe wear on traction performance: A longitudinal study. Footwear Sci. 2022, 14, 1–12. [Google Scholar] [CrossRef] [PubMed]
  24. Iraqi, A.; Vidic, N.S.; Redfern, M.S.; Beschorner, K.E. Prediction of coefficient of friction based on footwear outsole features. Appl. Ergon. 2020, 82, 102963. [Google Scholar] [CrossRef] [PubMed]
  25. Chanda, A.; Jones, T.G.; Beschorner, K.E. Generalizability of Footwear Traction Performance across Flooring and Contaminant Conditions. IISE Trans. Occup. Ergon. Hum. Factors 2018, 6, 98–108. [Google Scholar] [CrossRef] [PubMed]
  26. Derler, S.; Huber, R.; Kausch, F.; Meyer, V.R. Effectiveness, durability and wear of anti-slip treatments for resilient floor coverings. Saf. Sci. 2015, 76, 12–20. [Google Scholar] [CrossRef]
  27. Bressel, E.; Yonker, J.C.; Kras, J.; Heath, E.M. Comparison of Static and Dynamic Balance in Female Collegiate Soccer, Basketball, and Gymnastics Athletes. J. Athl. Train. 2007, 42, 42–46. [Google Scholar] [PubMed]
  28. Serrano, C.; Sánchez-Sánchez, J.; López-Fernández, J.; Hernando, E.; Gallardo, L. Influence of the playing surface on changes of direction and plantar pressures during an agility test in youth futsal players. Eur. J. Sport Sci. 2020, 20, 906–914. [Google Scholar] [CrossRef] [PubMed]
  29. Abdelkrim, N.B.; El Fazaa, S.; El Ati, J. Time–motion analysis and physiological data of elite under-19-year-old basketball players during competition. Br. J. Sports Med. 2007, 41, 69–75. [Google Scholar] [CrossRef] [PubMed]
  30. Frias Bocanegra, J.M.; Fong, D.T.P. Playing surface traction influences movement strategies during a sidestep cutting task in futsal: Implications for ankle performance and sprain injury risk. Sport. Biomech. 2022, 21, 380–390. [Google Scholar] [CrossRef] [PubMed]
  31. Fales, C.W.; Stone, R.T.; Van Groningen, D.; Westby, B. Tread patterns and the effect on basketball player slippage. Proc. Hum. Factors Ergon. Soc. 2020, 64, 1328–1332. [Google Scholar] [CrossRef]
  32. Van Groningen, D. Effects of outsole shoe patterns on athletic performance. 2016. Available online: https://api.semanticscholar.org/CorpusID:58897018 (accessed on 2 March 2025).
  33. Clarke, J.; Carré, M.; Damm, L.; Dixon, S. Understanding the influence of surface roughness on the tribological interactions at the shoe-surface interface in tennis. Proc. Inst. Mech. Eng. Part J. J. Eng. Tribol. 2012, 226, 636–647. [Google Scholar] [CrossRef]
  34. Pedroza, A.; Fernandez, S.; Heidt, R.; Kaeding, C. Evaluation of the shoe-surface interaction using an agility maneuver. Med. Sci. Sports Exerc. 2010, 42, 1754–1759. [Google Scholar] [CrossRef] [PubMed]
  35. Luo, G.; Stefanyshyn, D. Identification of critical traction values for maximum athletic performance. Footwear Sci. 2011, 3, 127–138. [Google Scholar] [CrossRef]
  36. Barrons, Z.B.; Esposito, M.J.S.; Stefanyshyn, D.J.; Wannop, J.W. The traction requirements of female and male basketball players. Footwear Sci. 2023, 15, 28–34. [Google Scholar] [CrossRef]
  37. Cardoso, H.; Guimarães, M.; Lopes, L.; Lino Alves, J. Development of a rubber sole with an integral cushioning system for casual sport shoes. Proc. Inst. Mech. Eng. Part L. J. Mater. Des. Appl. 2019, 233, 2253–2266. [Google Scholar] [CrossRef]
  38. ASTM F2913-17; Standard Test Method for Measuring the Coefficient of Friction for Evaluation of Slip Performance of Footwear and Test Surfaces/Flooring Using a Whole Shoe Tester. ASTM: West Conshohocken, PA, USA, 2017. [CrossRef]
  39. Beschorner, K.E.; Siegel, J.L.; Hemler, S.L.; Sundaram, V.H.; Chanda, A.; Iraqi, A.; Haight, J.M.; Redfern, M.S. An observational ergonomic tool for assessing the worn condition of slip-resistant shoes. Appl. Ergon. 2020, 88, 103140. [Google Scholar] [CrossRef] [PubMed]
  40. Hemler, S.L.; Pliner, E.M.; Redfern, M.S.; Haight, J.M.; Beschorner, K.E. Traction performance across the life of slip-resistant footwear: Preliminary results from a longitudinal study. J. Safety Res. 2020, 74, 219–225. [Google Scholar] [CrossRef] [PubMed]
  41. Jones, T.; Iraqi, A.; Beschorner, K. Performance testing of work shoes labeled as slip resistant. Appl. Ergon. 2018, 68, 304–312. [Google Scholar] [CrossRef] [PubMed]
  42. Gupta, S.; Chatterjee, S.; Malviya, A.; Singh, G.; Chanda, A. A Novel Computational Model for Traction Performance Characterization of Footwear Outsoles with Horizontal Tread Channels. Computation 2023, 11, 23. [Google Scholar] [CrossRef]
  43. Gupta, S.; Bose, D.; Chatterjee, S.; Chanda, A. Effect of Outsole Material and Wear on Traction Performance of Nurse’s Footwear in Hospitals. Tribol. Trans. 2024, 67, 323–331. [Google Scholar] [CrossRef]
  44. Gupta, S.; Malviya, A.; Chatterjee, S.; Chanda, A. Development of a Portable Device for Surface Traction Characterization at the Shoe-Floor Interface. Surfaces 2022, 5, 504–520. [Google Scholar] [CrossRef]
  45. Yamaguchi, T.; Yamada, R.; Warita, I.; Shibata, K.; Ohnishi, A.; Sugama, A.; Hinoshita, M.; Sakauchi, K.; Matsukawa, S.; Hokkirigawa, K. Relationship between slip angle in ramp test and coefficient of friction values at shoe-floor interface measured with cart-type friction measurement device. J. Biomech. Sci. Eng. 2018, 13, 17–00389. [Google Scholar] [CrossRef]
  46. Shibata, K.; Abe, S.; Yamaguchi, T.; Hokkirigawa, K. Development of a Cart-type Friction Measurement Device for Evaluation of Slip Resistance of Floor Sheets. Undefined 2016, 51, 721–736. [Google Scholar] [CrossRef]
  47. Gupta, S.; Sidhu, S.S.; Chatterjee, S.; Malviya, A.; Singh, G.; Chanda, A. Effect of Floor Coatings on Slip-Resistance of Safety Shoes. Coatings 2022, 12, 1455. [Google Scholar] [CrossRef]
  48. Newcastle University. Coefficient of Determination, R-Squared. Available online: https://www.ncl.ac.uk/webtemplate/ask-assets/external/maths-resources/statistics/regression-and-correlation/coefficient-of-determination-r-squared.html (accessed on 7 March 2025).
  49. Li, K.W.; Wu, H.H.; Lin, Y.C. The effect of shoe sole tread groove depth on the friction coefficient with different tread groove widths, floors and contaminants. Appl. Ergon. 2006, 37, 743–748. [Google Scholar] [CrossRef] [PubMed]
  50. Islam, S.; Gide, K.; Dutta, T.; Bagheri, Z.S. The effect of tread patterns on slip resistance of footwear outsoles based on composite materials in icy conditions. J. Saf. Res. 2023, 87, 453–464. [Google Scholar] [CrossRef] [PubMed]
  51. Meehan, E.E.; Vidic, N.; Beschorner, K.E. In contrast to slip-resistant shoes, fluid drainage capacity explains friction performance across shoes that are not slip-resistant. Appl. Ergon. 2022, 100, 103663. [Google Scholar] [CrossRef] [PubMed]
  52. Strobel, C.M.; Menezes, P.L.; Lovell, M.R.; Beschorner, K.E. Analysis of the contribution of adhesion and hysteresis to shoe-floor lubricated friction in the boundary lubrication regime. Tribol. Lett. 2012, 47, 341–347. [Google Scholar] [CrossRef]
  53. Moghaddam, S.R.M.; Redfern, M.S.; Beschorner, K.E. A microscopic finite element model of shoe-floor hysteresis and adhesion friction. Tribol. Lett. 2015, 59, 42. [Google Scholar] [CrossRef]
  54. Cowap, M.J.H.; Moghaddam, S.R.M.; Menezes, P.L.; Beschorner, K.E. Contributions of adhesion and hysteresis to coefficient of friction between shoe and floor surfaces: Effects of floor roughness and sliding speed. Tribol. Mater. Surf. Interfaces 2015, 9, 77–84. [Google Scholar] [CrossRef]
Figure 1. Procedure for producing the outsole heel pattern.
Applmech 06 00054 g001
Figure 2. The heel area of selected basketball shoes. Starting from the upper left (B1) to the lower right (B15).
Applmech 06 00054 g002
Figure 3. Flooring Surfaces Type: (a) Hardwood, (b) Synthetic, (c) polyurethane (PU).
Applmech 06 00054 g003
Figure 4. Portable and biofidelic slip tester.
Applmech 06 00054 g004
Figure 5. Traction performance basketball shoes on hardwood flooring under (a) dry conditions and (b) water-contaminated conditions.
Applmech 06 00054 g005
Figure 6. Traction performance basketball shoes on synthetic flooring under (a) dry conditions and (b) water-contaminated conditions.
Applmech 06 00054 g006
Figure 7. Traction performance basketball shoes on PU flooring under (a) dry conditions and (b) water-contaminated conditions.
Applmech 06 00054 g007
Figure 8. The trend between ACOF and apparent contact area across the shoes under (a) dry conditions and (b) wet conditions.
Applmech 06 00054 g008
Table 1. Patterns that showed high ACOF on individual slipping conditions.
Heel
Pattern
Hardwood FlooringSynthetic FlooringPU Flooring
Dry
Condition
Wet
Condition
Dry
Condition
Wet
Condition
Dry
Condition
Wet
Condition
Applmech 06 00054 i0010.570.410.350.250.330.25
Applmech 06 00054 i0020.30.40.430.230.350.21
Applmech 06 00054 i0030.420.360.530.450.420.4
Applmech 06 00054 i0040.320.230.370.230.320.2
Applmech 06 00054 i0050.430.290.320.230.310.19
Disclaimer/Publisher’s Note: The statements, opinions and data contained in all publications are solely those of the individual author(s) and contributor(s) and not of MDPI and/or the editor(s). MDPI and/or the editor(s) disclaim responsibility for any injury to people or property resulting from any ideas, methods, instructions or products referred to in the content.

