Article

Crashworthiness of Additively Manufactured Crash Boxes: A Comparative Analysis of Fused Deposition Modeling (FDM) Materials and Structural Configurations

by
Ahmed Saber
1,*,
A. M. Amer
1,
A. I. Shehata
2,
H. A. El-Gamal
3 and
A. Abd_Elsalam
2
1
College of Engineering and Technology, American University of the Middle East, Egaila 54200, Kuwait
2
Mechanical Engineering Department, Arab Academy for Science and Technology and Maritime Transport (AASTMT), Alexandria 19838, Egypt
3
Mechanical Engineering Department, College of Engineering, Alexandria University, Alexandria 21526, Egypt
*
Author to whom correspondence should be addressed.
Appl. Mech. 2025, 6(3), 52; https://doi.org/10.3390/applmech6030052
Submission received: 6 May 2025 / Revised: 29 June 2025 / Accepted: 7 July 2025 / Published: 11 July 2025

Abstract

Crash boxes play a crucial role in automotive safety by absorbing impact energy during collisions. The advancement of additive manufacturing (AM), particularly Fused Deposition Modeling (FDM), has enabled the fabrication of geometrically complex and lightweight crash boxes. This study presents a comparative evaluation of the crashworthiness performance of five FDM materials, namely, PLA+, PLA-ST, PLA-LW, PLA-CF, and PETG, across four structural configurations: Single-Cell Circle (SCC), Multi-Cell Circle (MCC), Single-Cell Square (SCS), and Multi-Cell Square (MCS). Quasi-static axial compression tests are conducted to assess the specific energy absorption ( S E A ) and crush force efficiency ( C F E ) of each material–geometry combination. Among the materials, PLA-CF demonstrates superior performance, with the MCC configuration achieving an S E A of 22.378 ± 0.570 J/g and a C F E of 0.732 ± 0.016. Multi-cell configurations consistently outperformed single-cell designs across all materials. To statistically quantify the influence of material and geometry on crash performance, a two-factor ANOVA was performed, highlighting geometry as the most significant factor across all evaluated metrics. Additionally, a comparative test with aluminum 6063-T5 demonstrates that PLA-CF offers comparable crashworthiness, with advantages in mass reduction, reduced P C F , and enhanced design flexibility inherent in AM. These findings provide valuable guidance for material selection and structural optimization in FDM-based crash boxes.

1. Introduction

In recent decades, automotive manufacturers have increasingly prioritized the enhancement of vehicle performance and safety. A fundamental aspect of vehicle safety is crashworthiness, which refers to the ability of a vehicle’s structure to absorb impact energy and reduce the risk of injury during collisions [1]. Among the structural components that significantly contribute to crashworthiness, the crash box plays a critical role. It is specifically engineered to deform in a controlled manner during a collision. This deformation converts the kinetic energy generated upon impact into strain energy through structural deformation, thereby protecting both the occupants and other critical structural elements from damage. The performance of crash boxes is influenced by both the material properties and geometric configuration.
Traditional manufacturing techniques employed for crash box production include stamping [2,3], welding [4,5], extrusion [6,7,8], CNC water jet cutting [9], wire electrical discharge machining [10,11,12], and composite fabrication [13]. Despite their widespread use, these methods impose constraints on geometric complexity, often limiting the design to relatively simple structural forms. As a result, there is growing interest in advanced fabrication methods such as additive manufacturing (AM), commonly known as 3D printing, which was introduced by Charles Hull in 1984 [14]. Unlike traditional manufacturing methods, AM offers greater design flexibility, facilitating the creation of intricate, high-performance crash box designs [15]. Various AM techniques have been utilized to manufacture crash boxes, each offering distinct advantages and limitations, including Stereolithography (SLA) [16,17], Material Jetting (MJT) [18,19], Selective Laser Melting (SLM) [20,21], Selective Laser Sintering (SLS) [22,23], Fused Deposition Modeling (FDM) [24,25,26,27], and hybrid approaches [28,29]. Among the various AM techniques, FDM has become widely adopted due to its accessibility, versatility, and recent advancements in both technology and material development, which have enhanced its efficiency, cost-effectiveness, and suitability for crash box production [30].
FDM printers can process a wide variety of polymer filaments, including Polyamide (PA or Nylon), Polylactic Acid (PLA), Polycarbonate (PC), Acrylonitrile Styrene Acrylate (ASA), Acrylonitrile Butadiene Styrene (ABS), Thermoplastic Polyurethane (TPU), and Polyethylene Terephthalate Glycol (PETG) [31]. Several studies have explored the application of polymer filaments in the design and fabrication of crash boxes [32,33,34]. Sun et al. [35] examined shape memory corrugated tubes (SMCTs) produced from PLA/TPU blends, highlighting their energy absorption characteristics. Ha et al. [36] proposed a bio-inspired hierarchical circular honeycomb (BHCH) structure, modeled after the natural geometry of wood, and compared its crashworthiness to that of conventional circular honeycombs (CH) fabricated from Polyamide (PA). Awd Allah et al. [37] investigated the influence of infill patterns—defined as the internal geometrical configurations used in FDM to fill printed parts—on the crash performance of PLA-based tubes. Zhang et al. [38] studied the mechanical behavior of metamaterial lattice structures manufactured using PLA and PETG, demonstrating their potential for energy-absorbing applications.
The development of fiber-reinforced polymer filaments, such as carbon fiber (CF) and glass fiber (GF) composites, has further enhanced the mechanical properties of FDM materials, making them more suitable for energy-absorbing applications [31]. Several studies have employed these advanced filaments in the design of crash boxes to enhance their performance [39,40,41]. For instance, Wang et al. [42] examined multi-cell-filled tubes with various internal geometries including circular, hexagonal, and triangular, fabricated from PA-CF, highlighting the influence of internal geometry on crashworthiness. Building upon this, Liu et al. [43] explored the behavior of stepwise graded multi-cell tubes (SGMTs) and continuous graded multi-cell tubes (CGMTs) produced using PA-CF, demonstrating the advantages of functionally graded designs. Li et al. [44] introduced an origami-inspired crash box (OCB) fabricated from PA-CF, while Xing et al. [45] proposed a nested origami crash box also utilizing PA-CF. Additionally, Wang et al. [46] investigated the energy absorption performance of thin-walled composite tubes made from PA, PA-CF, and PA-GF, further validating the potential of fiber-reinforced materials in crashworthiness applications such as crash boxes and impact mitigation systems.
The rapid advancement of fused FDM materials, including PLA+, PLA-ST (Super Tough), PLA-LW (Low Weight), PLA-CF, and PETG, has expanded the possibilities for fabricating crash boxes with improved energy absorption capabilities. These materials were selected due to their wide commercial availability, compatibility with standard FDM 3D printers, ease of processing without specialized techniques, and their promising potential for energy absorption applications. Despite the growing accessibility of these materials, comparative studies evaluating their crashworthiness remain limited. To address this gap, the present study systematically investigates and compares the crashworthiness behavior of these five materials across four commonly used crash box geometries. This work provides valuable insights into the combined influence of material selection and structural design on crashworthiness, supporting more informed decisions in the development of FDM-based additively manufactured crash boxes.

2. Experimental Procedure

2.1. Geometrical Design

Circular and square sections, in both single-cell and multi-cell configurations, are among the most commonly used geometries in crash box design due to their well-documented crash performance [47]. Accordingly, this study selected four representative configurations to evaluate and compare the crashworthiness of different FDM materials: Single-Cell Circle (SCC), Multi-Cell Circle (MCC), Single-Cell Square (SCS), and Multi-Cell Square (MCS). For the multi-cellular structures, two concentric tubes connected by web-to-web links were employed, a design previously demonstrated to enhance energy absorption efficiency [44,48]. The ratio of the inner tube’s side length to that of the outer tube was fixed at 0.5 for both square and circular sections, as this configuration has been shown to optimize crash performance [49]. To enable a consistent comparison among different cross-sectional geometries, the side length of the square tubes and the diameter of the circular tubes were set to be equal [50]. The side length of the outer square tube (L) and the diameter of the outer circular tube (D) were both set to 30 mm, with a wall thickness (t) of 1.5 mm. For the inner tubes, the side length (l) of the square tube and the diameter (d) of the circular tube were both set to 15 mm. The height (H) was fixed at 60 mm for all specimens [51]. Additionally, a base plate with dimensions 50 mm × 50 mm and a thickness of 2 mm was incorporated at the bottom of each specimen to prevent slipping during compression [52]. A detailed schematic of the specimen dimensions is provided in Figure 1.

2.2. Materials and Processing Parameters

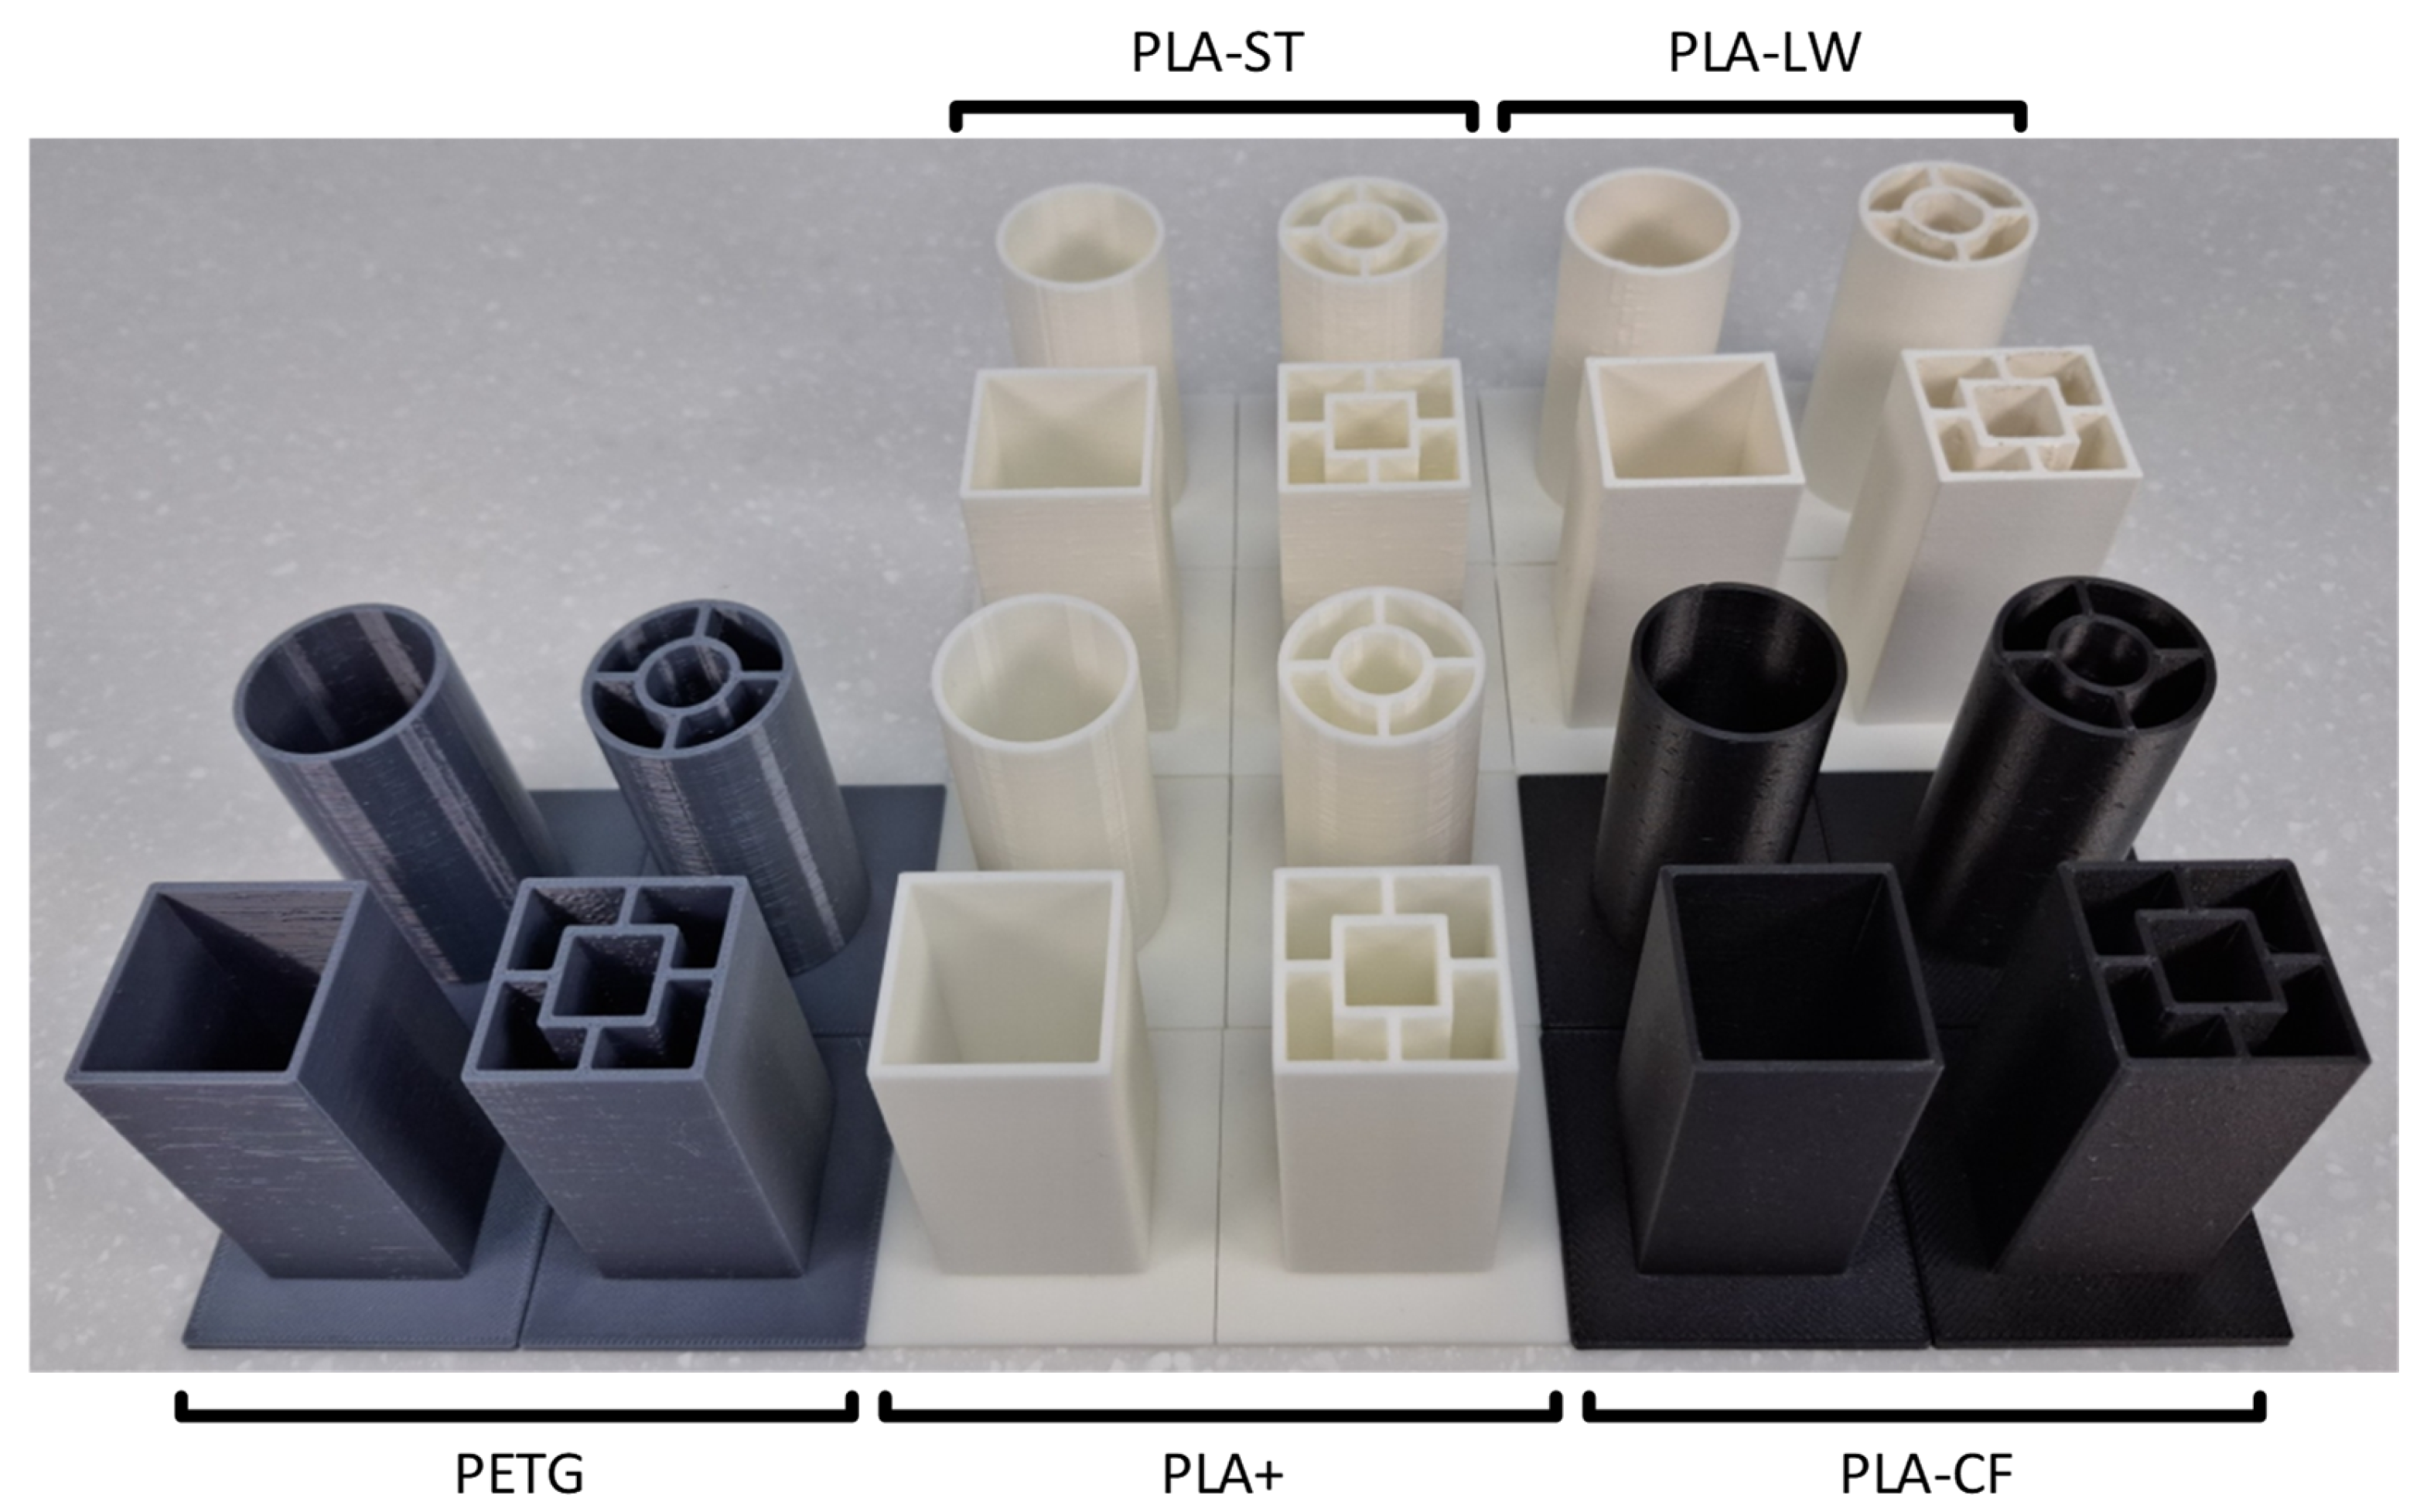
In this research, specimens were fabricated using a 1.75 mm diameter filament supplied by Shenzhen eSUN Industrial Co., Ltd., Shenzhen, China, with the mechanical properties provided by the manufacturer summarized in Table 1. The designs were created using SOLIDWORKS and exported in Standard Tessellation Language (STL) file format. The STL files were processed using Bambu Studio slicing software (version 2.1.0), developed by Bambu Lab Corporation, to generate the necessary G-code for printing. The specimens were manufactured using a Bambu Lab A1 Mini FDM 3D printer. Printing parameters were selected based on the recommended settings provided by the filament and printer manufacturers to ensure high-quality prints and consistent mechanical performance. Potential printing defects were systematically monitored throughout the fabrication process. Samples exhibiting defects were reprinted to maintain consistent quality and minimize any impact on the crashworthiness results. For each configuration and material, three replicas were printed to enable repeatable testing and statistical evaluation. The specific 3D printing parameters used are listed in Table 2, and Figure 2 shows one replica of each fabricated design configuration.

2.3. Experimental Method

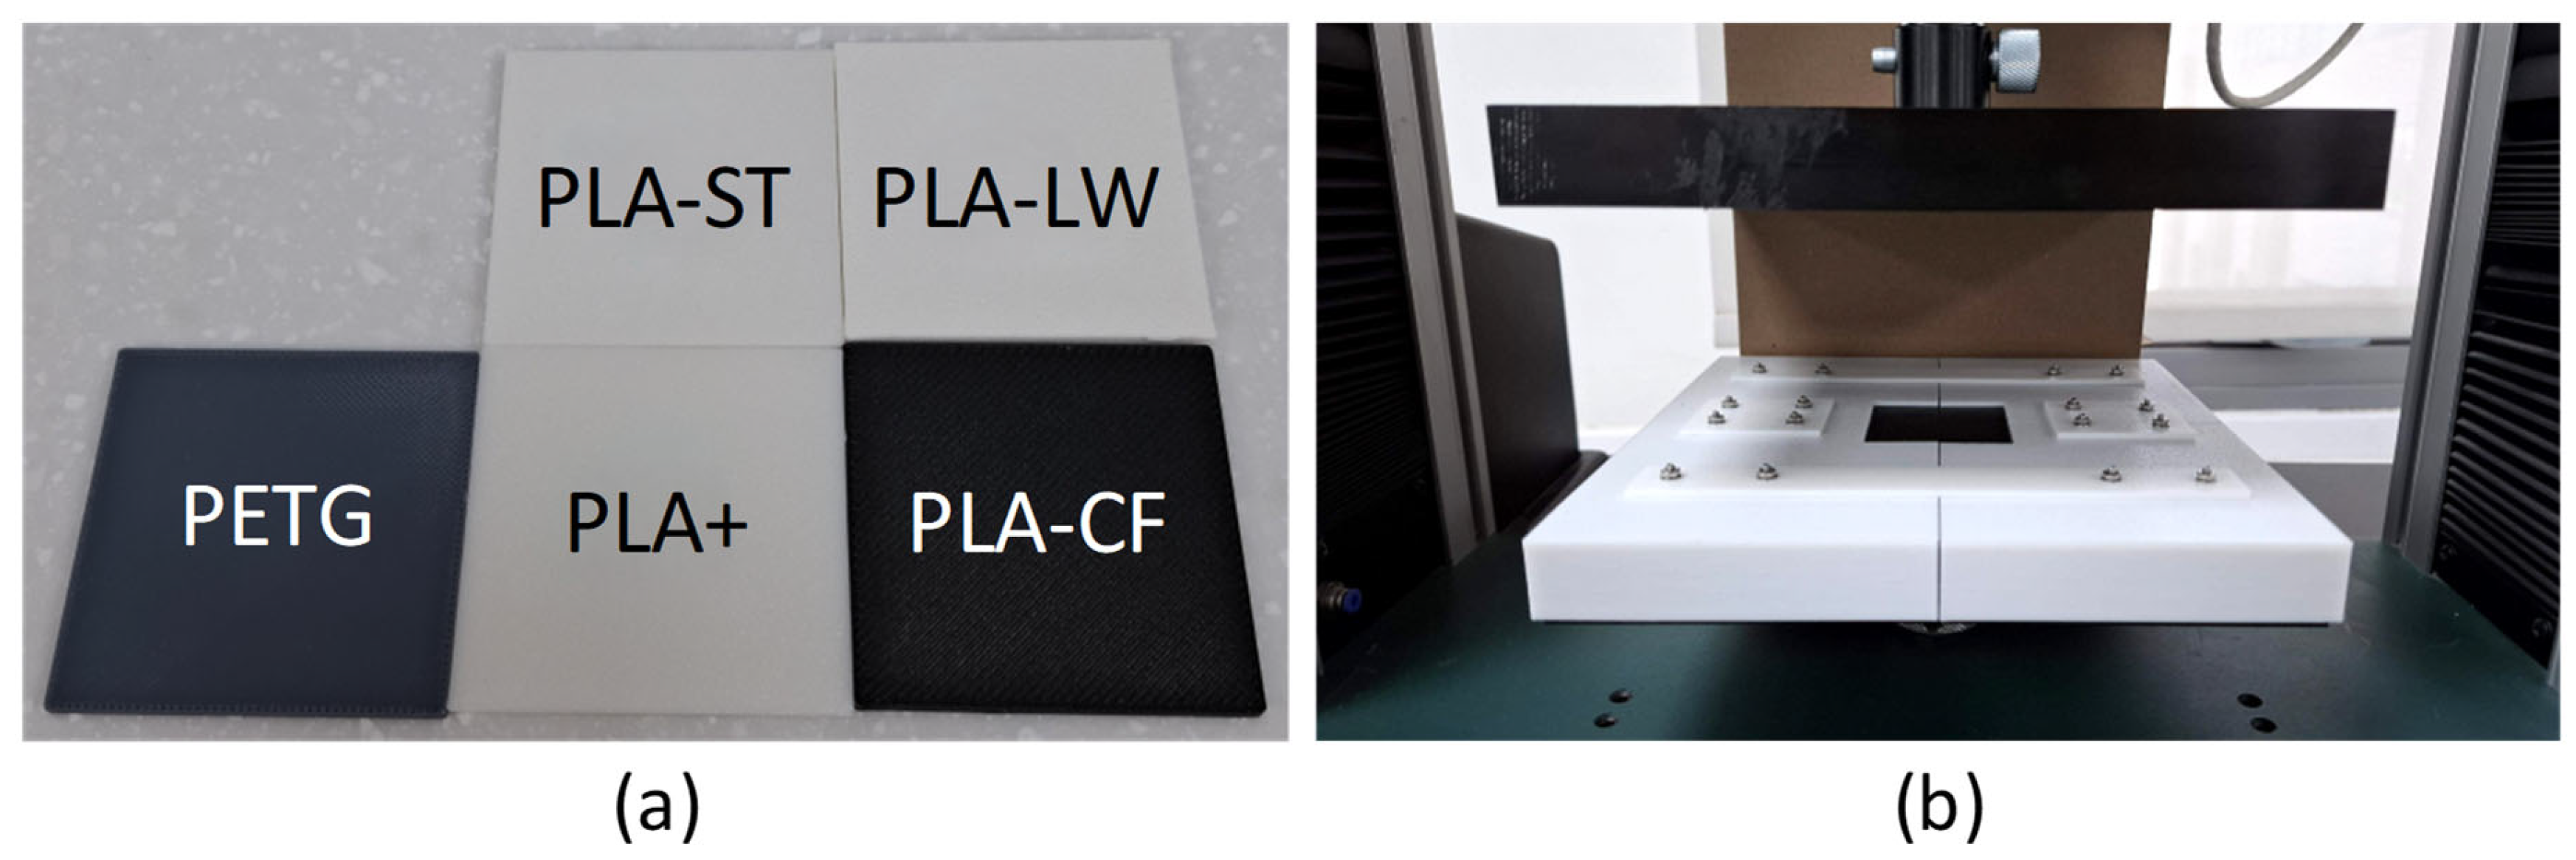
To evaluate the crashworthiness of the fabricated specimens, quasi-static axial compression tests were conducted at room temperature using a Tinius Olsen universal testing machine (Model 50ST), equipped with a 50 kN load cell. A separate base with dimensions of 50 mm × 50 mm and a thickness of 2 mm was printed for each material, as depicted in Figure 3a. Before testing, the mass of the specimen, including the incorporated base, was measured, and the mass of the separate base was subtracted to obtain the mass of the specimen. The specimens were placed between two parallel flat plates of the universal testing machine. The lower plate included a 3D-printed frame with a groove (50 mm × 50 mm × 2 mm) to securely hold the specimen base, as shown in Figure 3b, ensuring stability and preventing slipping during compression. The upper flat plate moved downward, applying a compressive force to the specimen at a loading speed of 5 mm/min [44,53]. The crushing displacement was fixed at 2/3 of the original specimen height [42,51], resulting in a test duration of 8 min. Force–displacement data were recorded throughout the test, and the entire compression process was documented via video recording to capture the deformation patterns of the specimens.

2.4. Definition of Crashworthiness Indicators

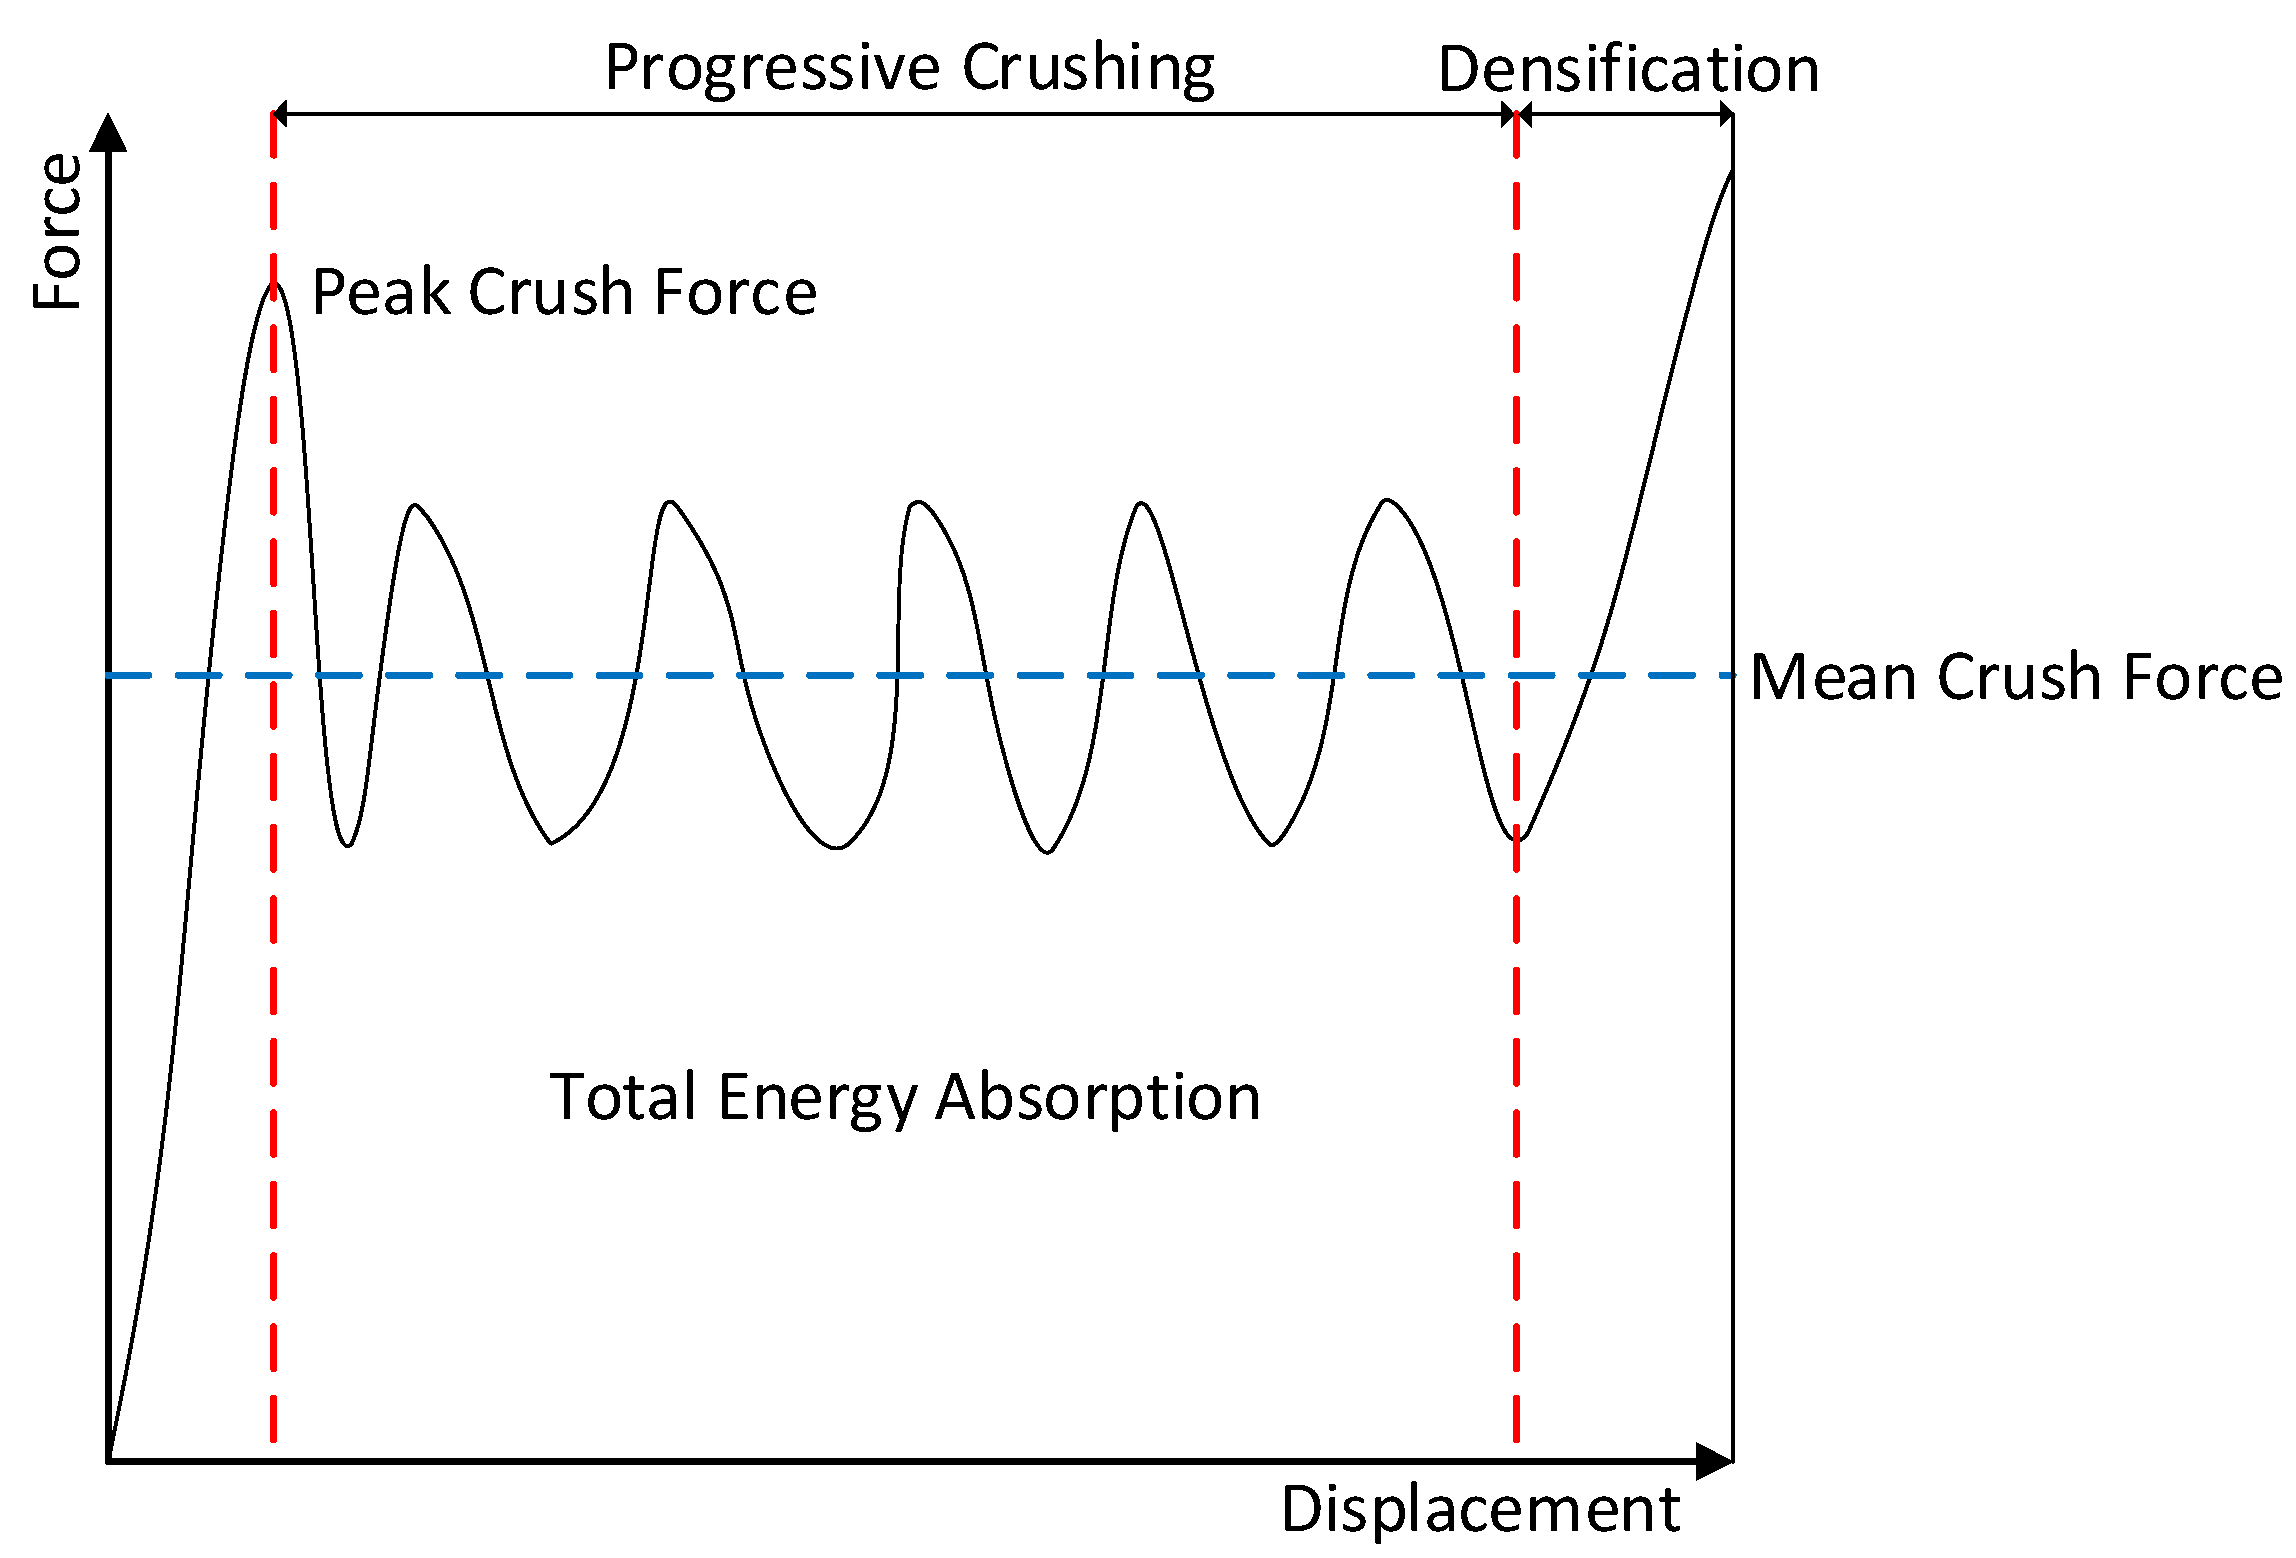
The effectiveness of a crash box is evaluated using several performance metrics that quantify its ability to mitigate crash forces and minimize damage to both the vehicle and its occupants. These metrics are typically derived from the force–displacement diagram, which provides insights into the crash box’s energy absorption characteristics. Figure 4 presents a typical force–displacement diagram for a crash box going through axial crushing. To describe the characteristics of energy absorption, the following parameters are considered [54]:

2.4.1. Total Energy Absorption, E T

The total energy absorption ( E T ) of a crash box can be determined by calculating the work performed by the crushing force. It is represented by the area under the axial force versus the axial displacement curve, as illustrated in Figure 4. E T is expressed as:
E T = 0 δ m a x F d δ
where F is the crushing force, δ is the displacement, and δ m a x is the total crush displacement.

2.4.2. Peak Crush Force, P C F

The peak crush force ( P C F ) , as illustrated in Figure 4, is the maximum force observed in the axial direction during the crushing process.

2.4.3. Mean Crush Force, M C F

The mean crush force ( M C F ) is defined as the total energy absorbed per unit of total crush displacement. It is expressed as:
M C F = E T δ m a x

2.4.4. Specific Energy Absorption, S E A

Specific energy absorption ( S E A ) is defined as the total energy absorbed per unit mass of the crash box. It is expressed as:
S E A = E T m
where m is the mass of the crash box.

2.4.5. Crush Force Efficiency, C F E

Crush force efficiency ( C F E ) is defined as the ratio of the M C F to the P C F . It is expressed as:
C F E = M C F P C F

2.4.6. Composite Objective Function, f

This study mainly focuses on S E A and C F E as crashworthiness key metrics [54]. A higher S E A indicates greater energy absorption per unit mass, which helps reduce the kinetic energy transmitted to occupants and thereby enhances safety [55]. Similarly, a higher C F E reflects a lower P C F , resulting in less force being transferred to the passenger [55]. Therefore, the objective is to maximize both the S E A and C F E to improve crash performance. To balance the maximization of the S E A and C F E , a composite objective function is formulated, as shown in Equation (5).
f ( x ) = w S E A ( x ) S E A m a x + ( 1 w ) C F E ( x ) C F E m a x
where S E A m a x and C F E m a x are the maximum values of the S E A and C F E observed across different configurations. Since both S E A and C F E are considered equally important, the weighting factor w is set to 0.5 for all analyses [54].

3. Results and Discussion

3.1. Deformation Patterns

The deformation patterns observed during quasi-static axial compression tests at displacements of 10, 20, 30, and 40 mm are presented in Figure 5 and Figure 6. The results reveal that both the geometric configuration and material selection significantly influence the deformation behavior, leading to distinct crushing modes and corresponding variations in performance. Most configurations exhibit the desired progressive folding mode, characterized by sequentially forming and overlapping folds, indicating stable and efficient energy absorption. However, this behavior was not observed in the SCS specimens manufactured from PLA+, PLA-ST, PLA-LW, and PLA-CF, nor in the SCC specimens made from PLA-LW. In these cases, only a single fold developed, resulting in limited deformation and reduced energy absorption. Additionally, the SCS specimens fabricated from PETG exhibited a brittle failure mode in which the structure shattered progressively during compression rather than undergoing stable folding. This failure mode markedly compromised the energy absorption capacity. This behavior is attributed to stress concentrations at the corners of the square geometry, combined with the inherently brittle nature of PETG. In contrast, all multi-cell configurations (MCC and MCS) consistently demonstrated progressive folding across all materials, confirming the effectiveness of multi-cell designs in promoting stable deformation and enhancing energy absorption capability.

3.2. Force–Displacement Relationship

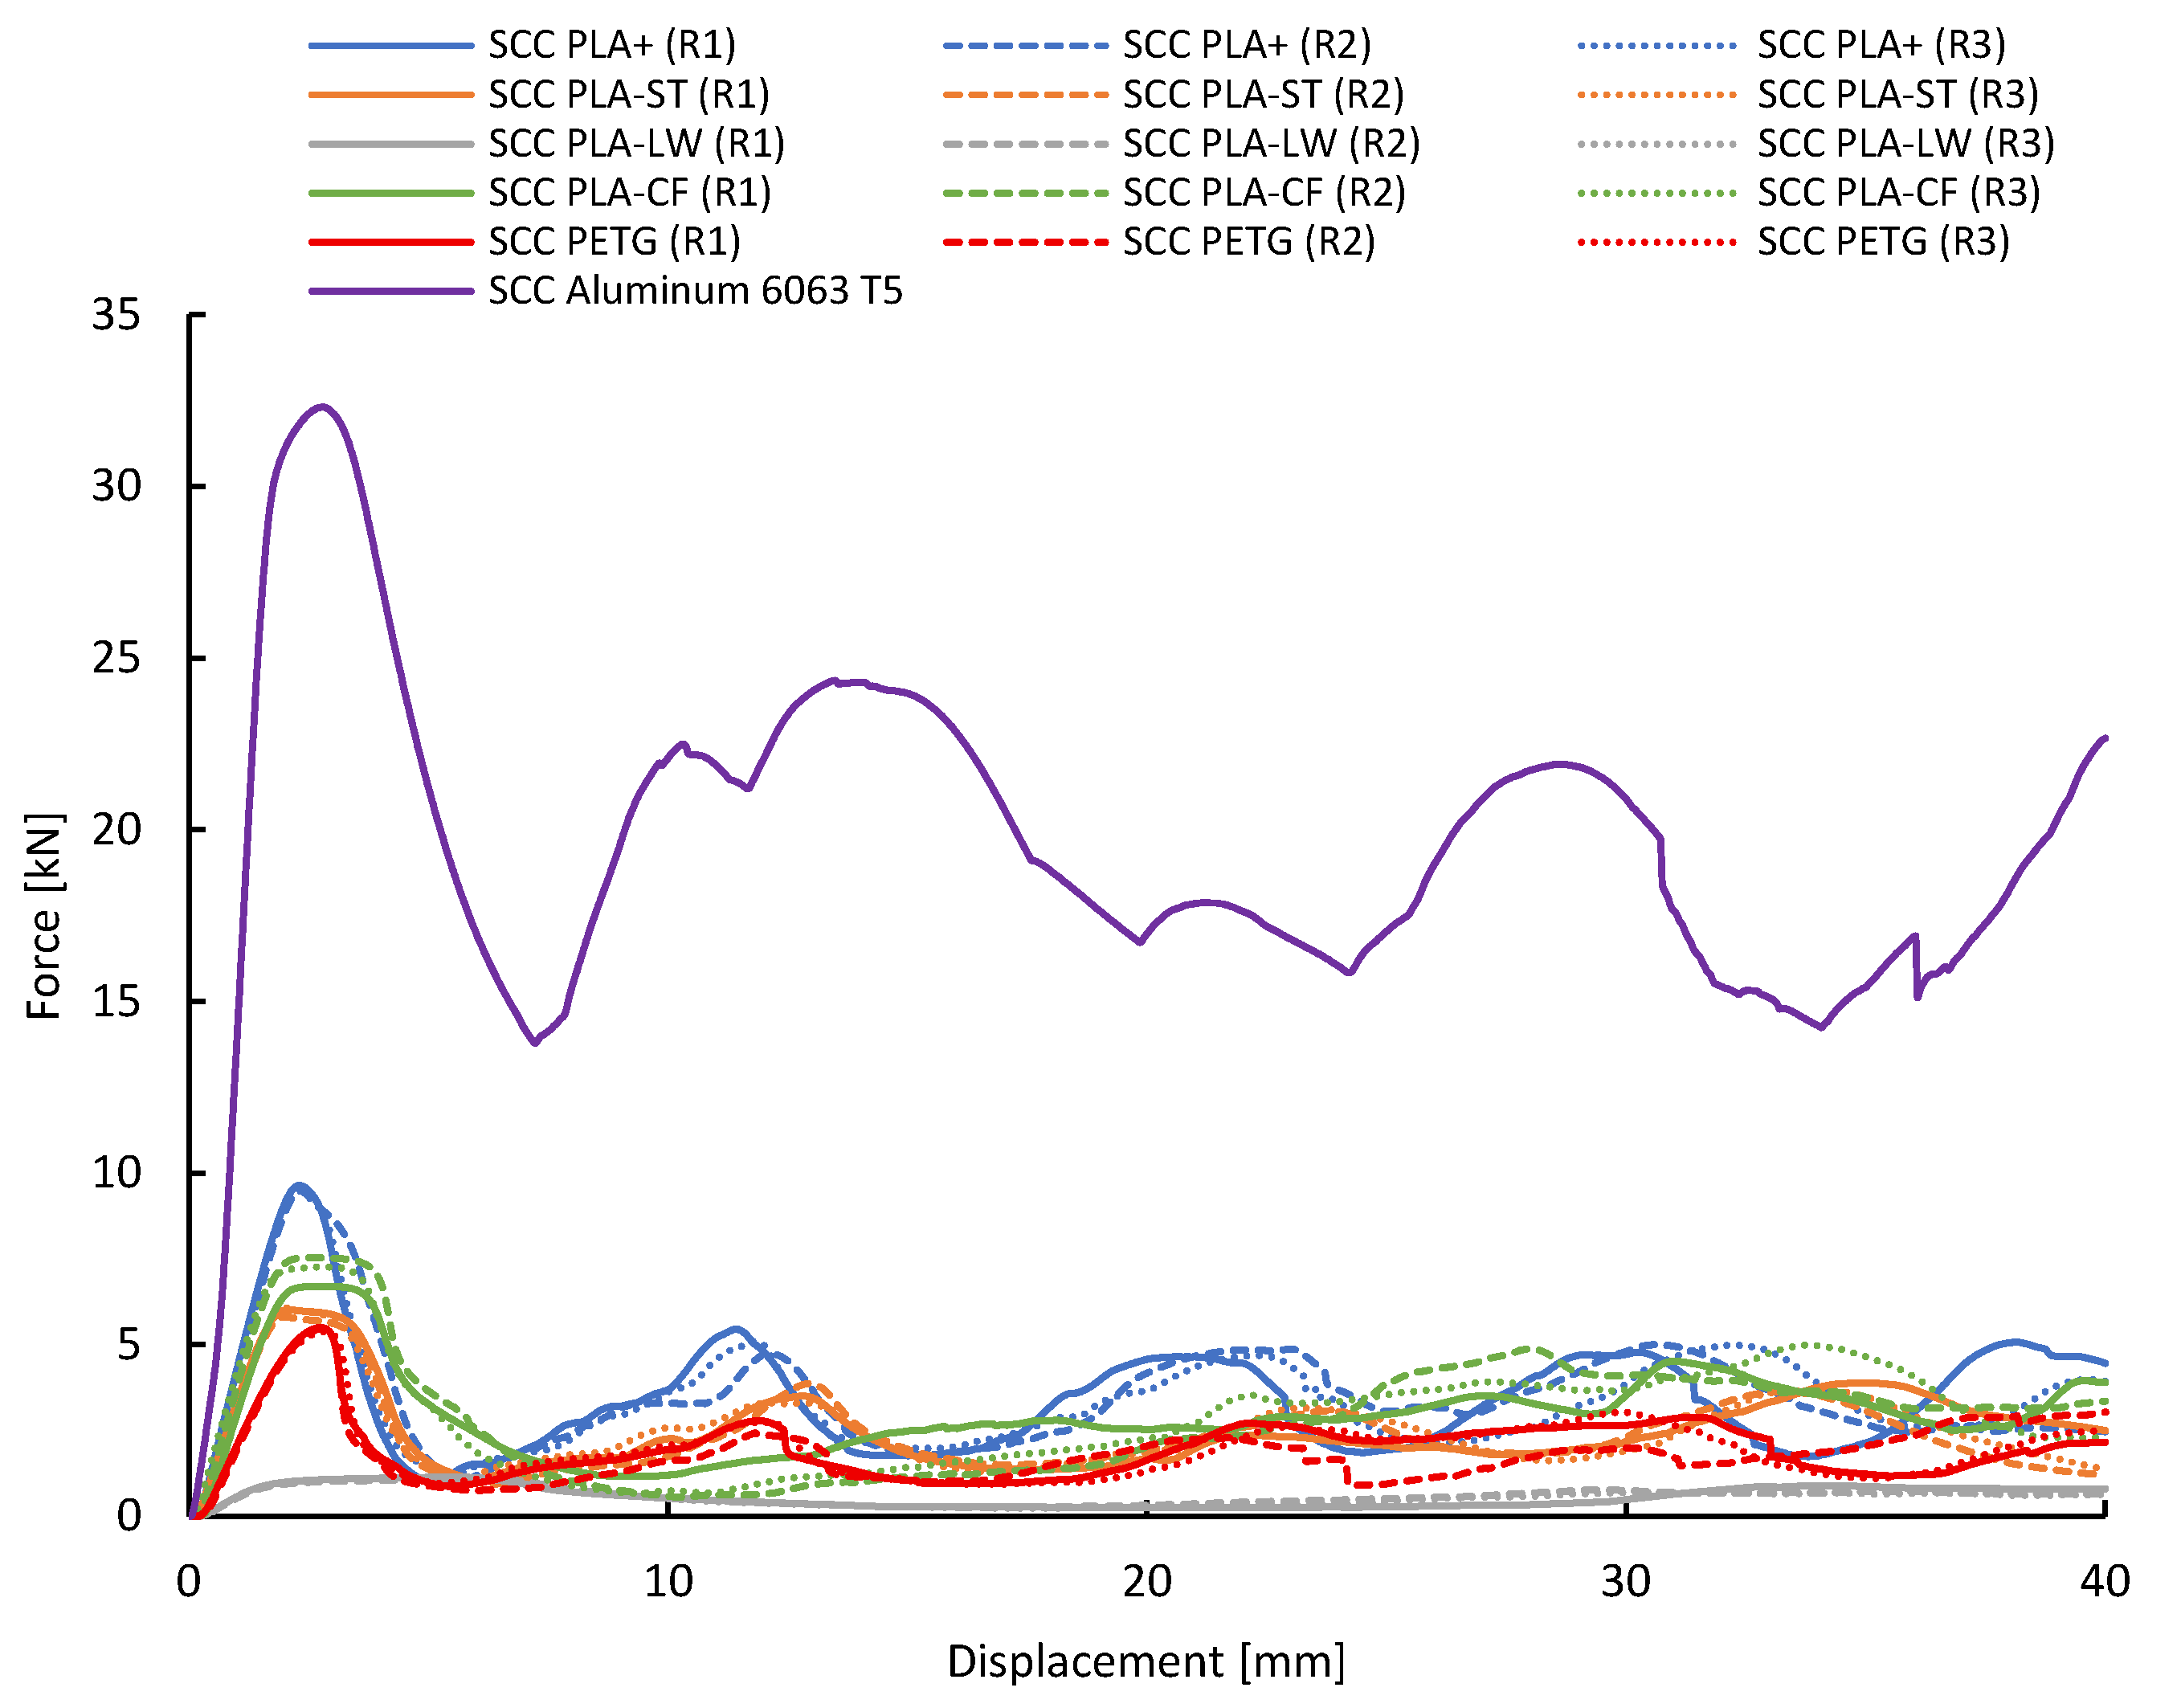
Force–displacement curves for each material and design configuration are presented in Figure 7, providing insights into the collapse behavior of the structures. For each configuration, three curves are presented, labeled R1, R2, and R3, corresponding to the three replicated compression tests. Throughout compression, all configurations generally exhibit consistent and uniform plastic deformation, except for SCS PETG, which displays a brittle failure mode characterized by abrupt decreases in force on the force–displacement curve. In all cases, the P C F is observed within the displacement range of 1–5 mm. The highest P C F , 19.946 ± 0.567 kN, is recorded for the MCS configuration fabricated from PLA+, while the lowest P C F , 1.105 ± 0.032 kN, is found in the SCC configuration manufactured from PLA-LW. After reaching the P C F , all specimens transition into the post-crushing stage, during which the crushing force oscillates, reflecting sustained energy absorption and continuous deformation.

3.3. Energy–Displacement Relationship

Energy–displacement curves for each material and design configuration are presented in Figure 8, illustrating the energy absorption behavior during compression. Each configuration includes three curves, labeled R1, R2, and R3, each corresponding to a replicated test. Overall, all configurations exhibit a steady increase in energy absorption with increasing displacement up to the maximum value. The energy–displacement curves of the multi-cell designs (MCC and MCS) display steeper slopes, indicating more efficient energy absorption compared to the single-cell configurations (SCC and SCS). The highest E T , 0.472 ± 0.005 kJ, is recorded for the MCS configuration fabricated from PLA+, while the lowest E T , 0.023 ± 0.001 kJ, is found in the SCC configuration manufactured from PLA-LW.

3.4. Crashworthiness Indicators

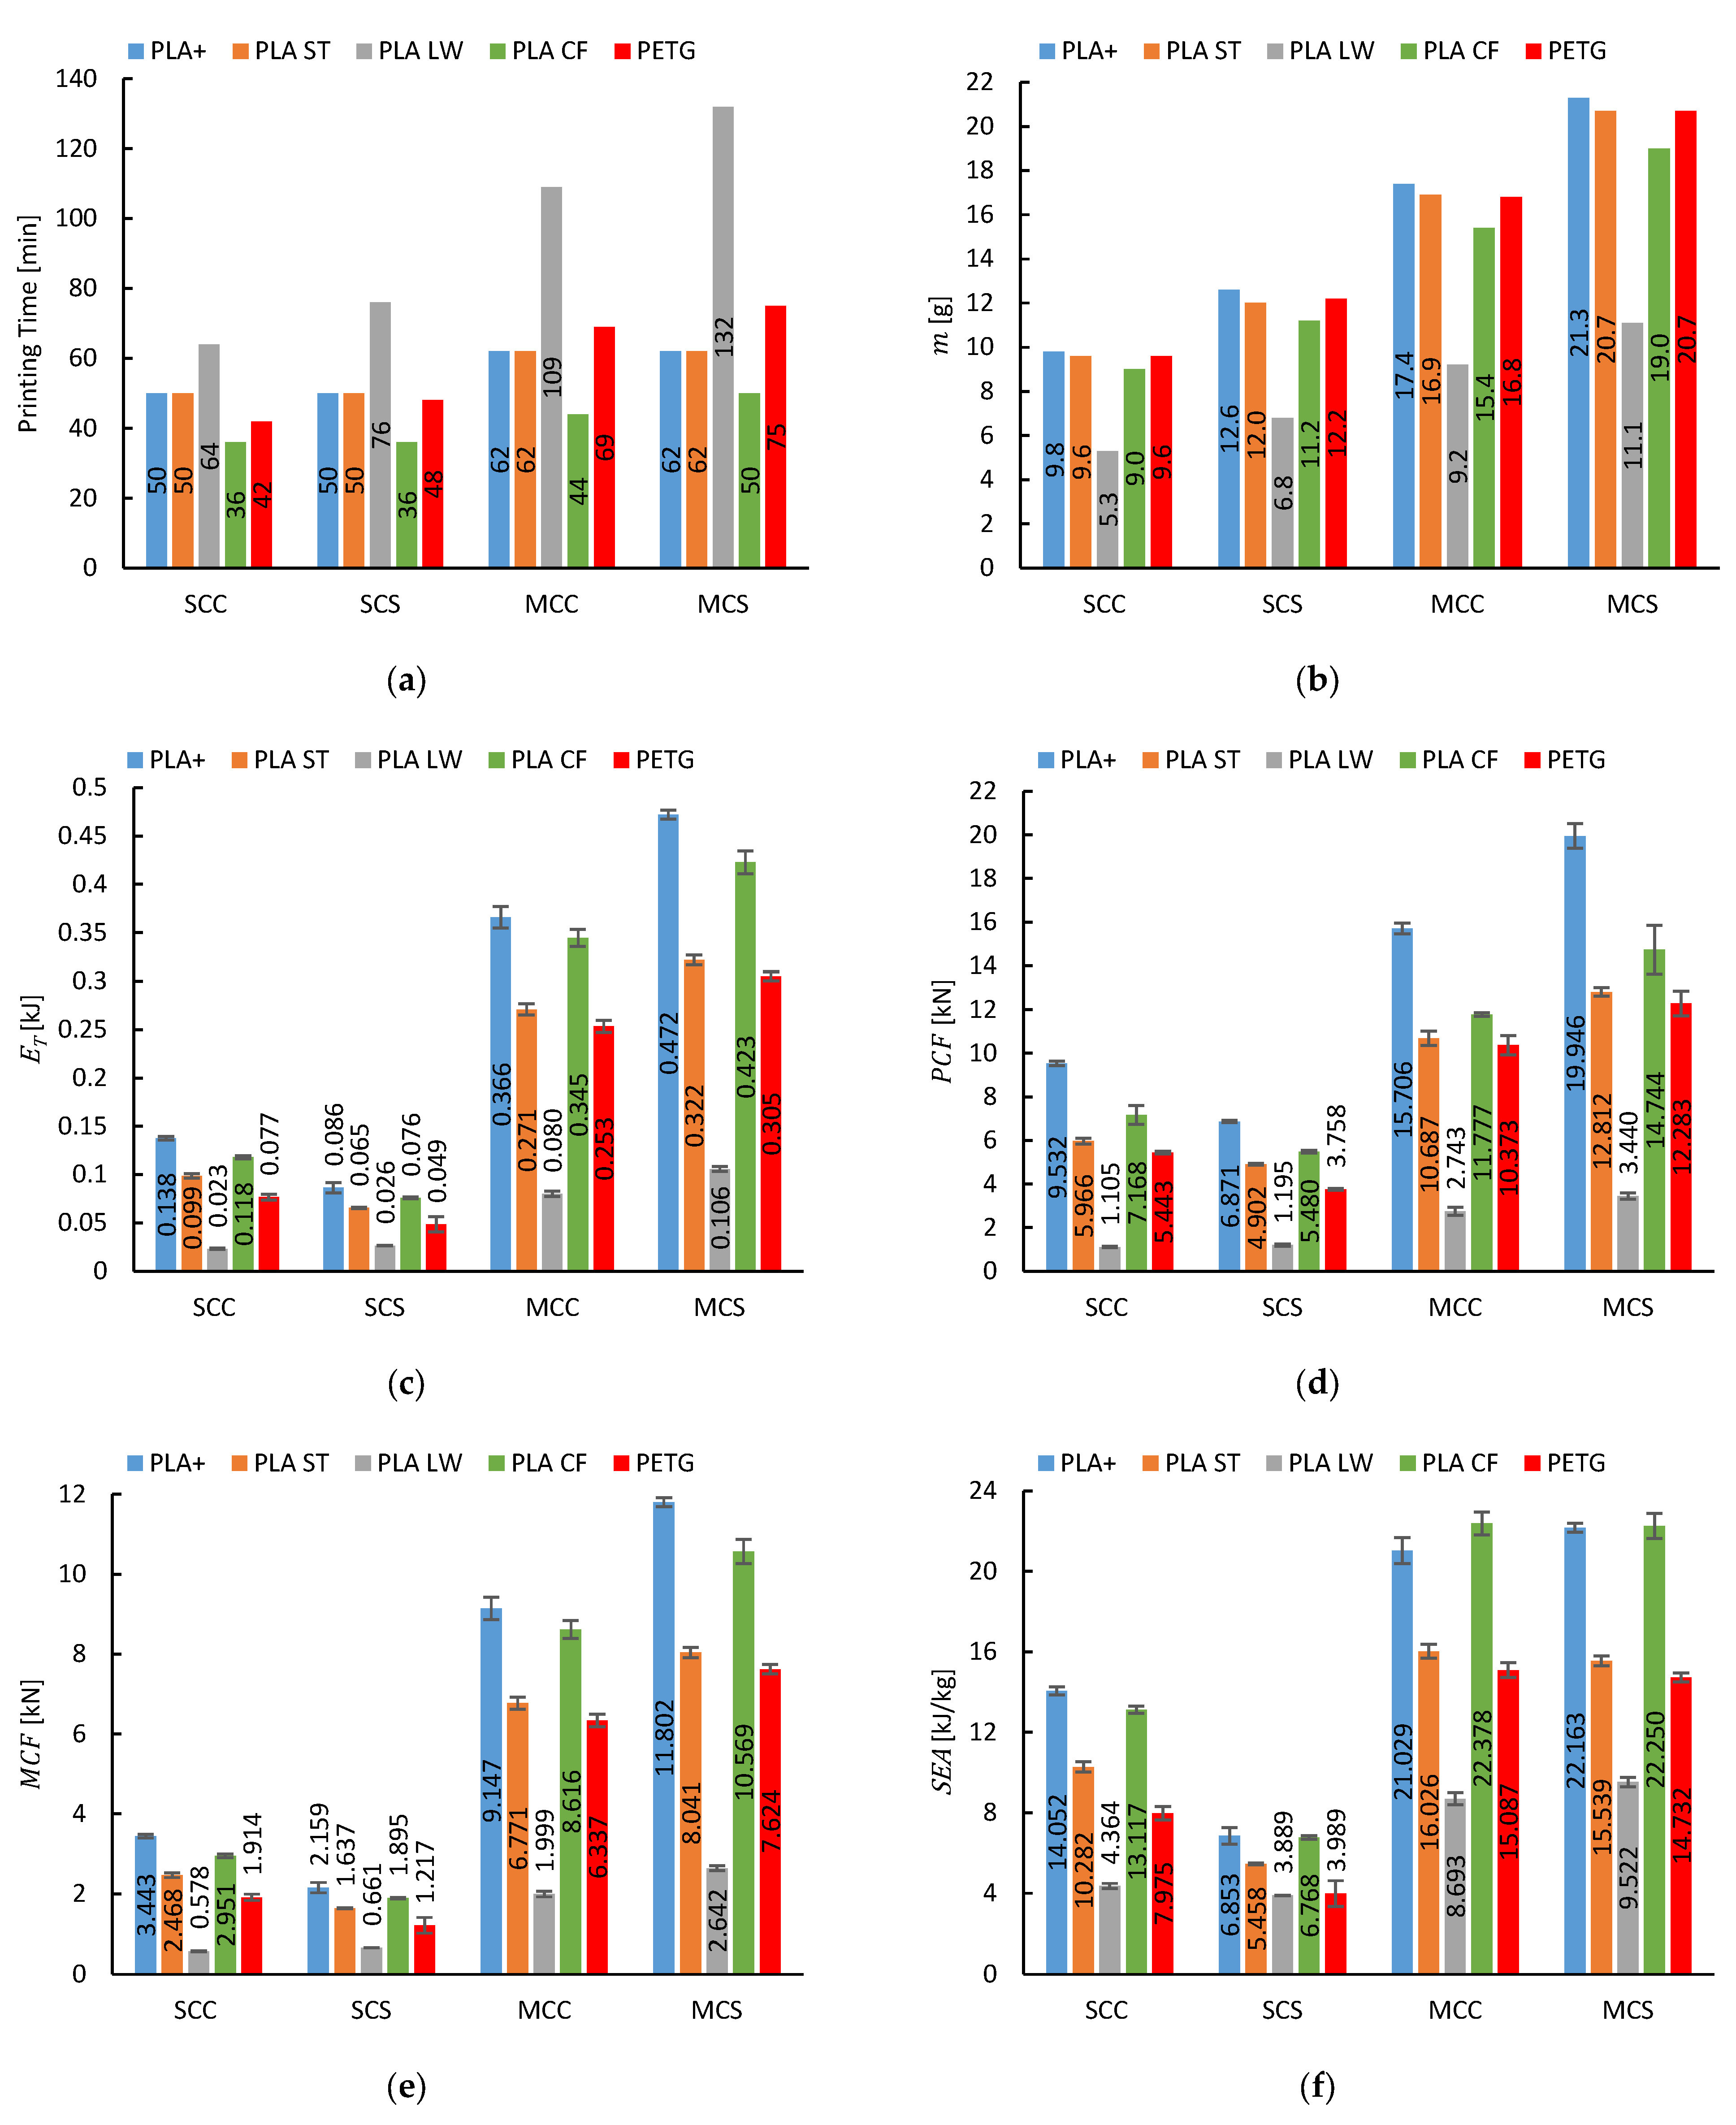
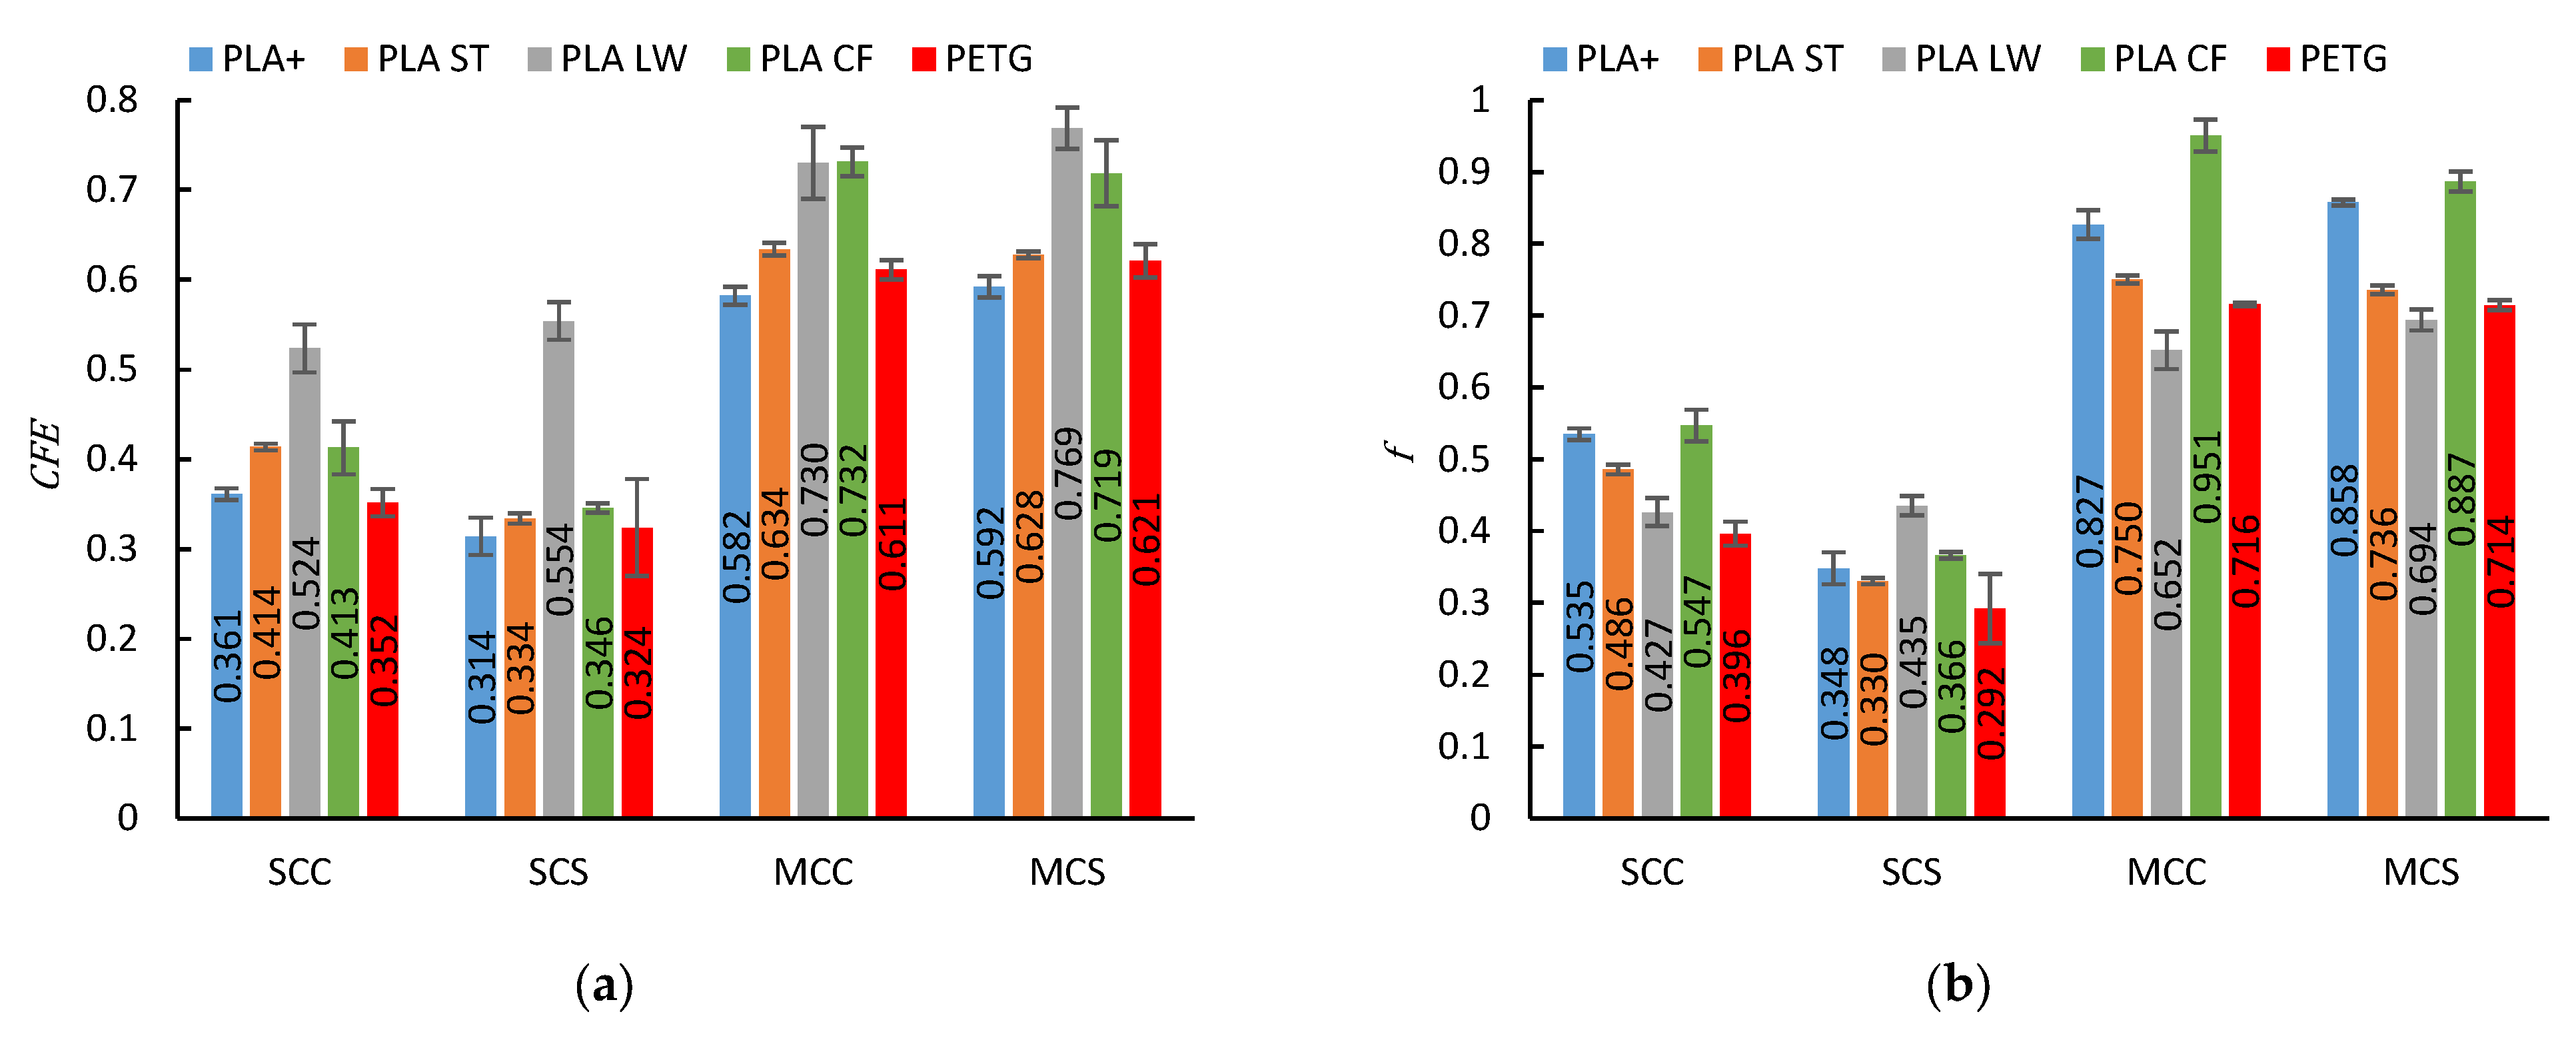
This section presents a comprehensive comparison of printing time, mass, and crashworthiness indicators across various materials and design configurations, as summarized in Table 3. The results are reported as mean values with corresponding standard deviations to reflect measurement consistency. To facilitate the analysis, column charts are used to visually display the printing time, mass, and crashworthiness indicators, including E T , P C F , M C F , S E A , C F E , and f , as shown in Figure 9 and Figure 10.
The printing time varied significantly across the different material and geometry combinations, primarily influenced by the design complexity and the printing parameters associated with each material. As expected, multi-cell configurations (MCC and MCS) required substantially longer printing times than their single-cell counterparts (SCC and SCS), due to their increased volume and more intricate internal structures. Among all configurations, MCS PLA-LW exhibited the longest printing time at 132 min, whereas SCC PLA-CF required the shortest duration at just 36 min. The extended printing time of PLA-LW is primarily attributed to its foaming nature, which necessitates a reduced printing speed of 50 mm/s to ensure consistent material expansion and dimensional stability. In contrast, the shorter printing time of PLA-CF is due to the use of a larger nozzle diameter (0.6 mm) and greater layer height (0.3 mm), both of which significantly enhance the material deposition rate.
The mass results reveal distinct trends influenced by both geometry and material type. Multi-cell designs (MCC and MCS) consistently exhibit higher mass than their single-cell counterparts (SCC and SCS) across all materials, due to increased material volume. Similarly, square-section geometries (SCS and MCS) tend to exhibit higher mass than circular-section designs (SCC and MCC). Among the tested materials, PLA-LW consistently shows the lowest mass in all configurations, which aligns with its relatively low density of 1.20 g/cm3, while PLA+, with a higher density of 1.23 g/cm3, generally results in the highest m in all configurations. Although PETG has the highest density at 1.27 g/cm3, it does not yield the heaviest specimens, indicating that print settings significantly affect the mass. PETG, PLA-ST, and PLA-CF exhibit intermediate mass values and follow a consistent increasing trend from SCC to MCS.
The E T results indicate that PLA+ demonstrates the highest E T , particularly in the MCS configuration, which achieves the maximum value of 0.472 ± 0.005 kJ. Across all configurations, PLA-CF consistently follows closely behind, while PLA-ST exhibits moderate performance. PETG and PLA-LW consistently record the lowest E T values among all configurations.
The P C F results indicate that PLA+ exhibits the highest peak crushing force, particularly in the MCS configuration, achieving a maximum value of 19.946 ± 0.567 kN. In all configurations, PLA-LW consistently exhibits the lowest P C F values, generally remaining below 4 kN. For the remaining materials, including PLA-ST, PLA-CF, and PETG, moderate performance is observed. It is important to note that while higher P C F values suggest greater E T , excessively high P C F is not always advantageous for crashworthiness, as it can lead to higher impact forces transmitted to the passenger. Thus, a balance between moderate P C F and E T is crucial for optimal crash box performance.
The M C F results indicate that PLA+ achieves the highest M C F , particularly in the MCS configuration, achieving a maximum value of 11.802 ± 0.116 kN. Across all configurations, PLA-CF consistently follows closely behind, while PLA-ST exhibits moderate performance. PETG and PLA-LW consistently record the lowest M C F values among all configurations, which is attributed to their low E T . Unlike P C F , where excessively high values may not be favorable, a higher M C F directly contributes to improved crashworthiness by reflecting a structure’s ability to sustain stable and efficient load-bearing capacity throughout the crushing process.
The S E A results indicate that PLA-CF exhibits the highest value, reaching 22.378 ± 0.570 kJ/kg in the MCC configuration. Although PLA+ records a higher E T of 0.366 ± 0.011 kJ compared to 0.345 ± 0.009 kJ for PLA-CF in the MCC configuration, its greater mass of 17.4 g, in contrast to PLA-CF’s 15.4 g, results in a slightly lower S E A value of 21.029 ± 0.645 kJ/kg. PLA-ST demonstrates moderate performance. Consistent with the M C F results, both PLA-LW and PETG exhibit poor S E A performance in all configurations, as S E A values are also influenced by E T .
The C F E results reveal that PLA-LW exhibits the highest value, reaching 0.769 ± 0.023 in the MCS configuration. This underscores the material’s capacity to maintain stable deformation while exhibiting a relatively low P C F , as reflected in the force–displacement curves shown in Figure 7. PLA-CF also demonstrates strong performance, with a C F E of 0.732 ± 0.016 in the MCC configuration, while PLA-ST presents moderate results. In contrast, PLA+ records relatively low C F E values, indicating less efficient load distribution despite its higher M C F and E T . PETG similarly shows low C F E values, primarily due to its brittle failure behavior, which limits its ability to undergo effective progressive folding.
The composite objective function f , which balances S E A and C F E , is used to evaluate the overall crashworthiness performance of the different configurations. The results indicate that MCC PLA-CF achieves the highest f value of 0.951 ± 0.022, demonstrating superior crashworthiness through the optimal combination of high S E A and C F E . MCS PLA-CF also maintains excellent performance with an f value of 0.887 ± 0.014, further confirming the superior crashworthiness of PLA-CF across different configurations. PLA+ exhibits strong but slightly lower performance, with f values of 0.827 ± 0.020 and 0.858 ± 0.004 for MCC and MCS, respectively. PLA-ST samples show moderate performance, where MCC and MCS configurations record f values of 0.750 ± 0.006 and 0.736 ± 0.006, respectively. Although PLA-LW samples demonstrate high C F E values, their lower S E A limits their overall performance, resulting in f values of 0.652 ± 0.026 for MCC and 0.694 ± 0.014 for MCS. These values are the lowest among all multi-cell configurations, highlighting the limited crashworthiness of PLA-LW. PETG samples show the poorest crashworthiness among the materials evaluated, particularly in the single-cell configurations, where f values are extremely low at 0.396 ± 0.017 for SCC and 0.292 ± 0.048 for SCS. The standard deviations in the f values are consistently low, below 10%, for all configurations except SCS PETG, demonstrating a high level of experimental reliability. The elevated standard deviation of 16.44% for SCS PETG is likely attributable to the brittle nature of the material, which causes more variable and less predictable deformation behavior during testing. Overall, the results demonstrate that PLA-CF is the most effective material for energy-absorbing crash box designs, and multi-cell configurations consistently outperform single-cell designs across all materials.
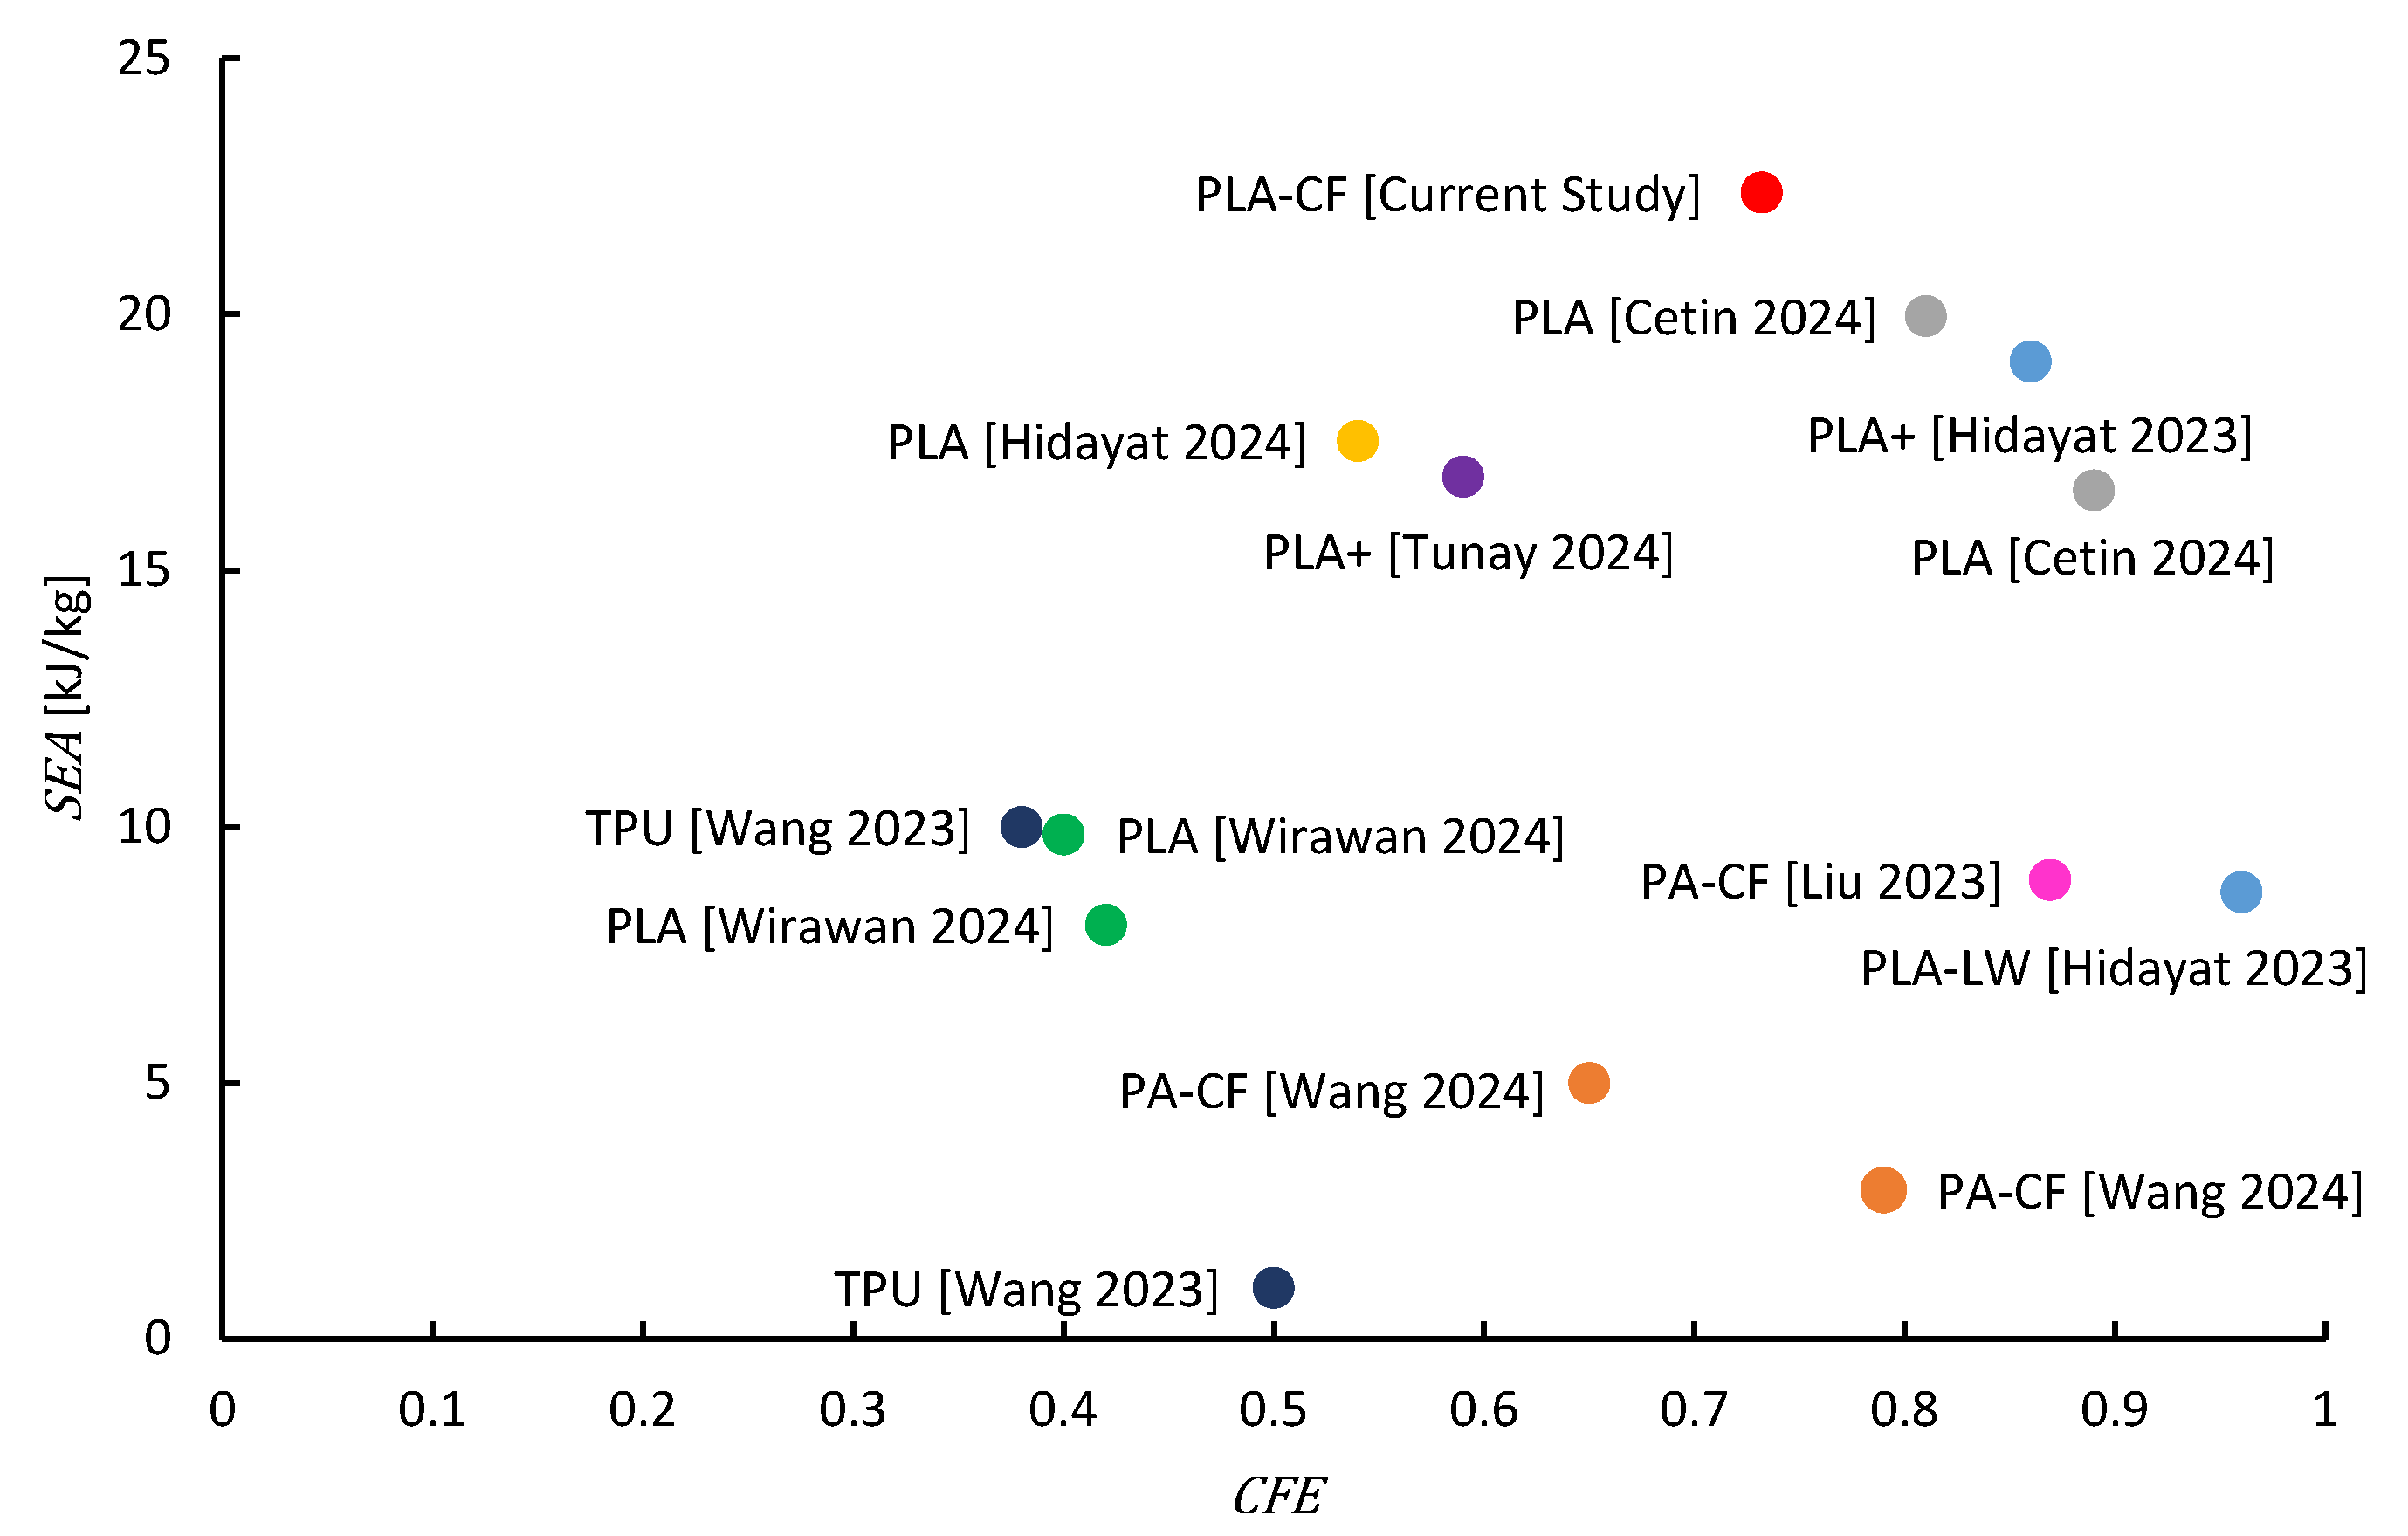
A comparative analysis is conducted between the PLA-CF crash box evaluated in this study and the optimal design configurations reported in recent research on FDM-fabricated tubular crash boxes, as illustrated in Figure 11. The figure depicts the relationship between S E A and C F E for crash boxes fabricated from various materials, including PLA, PLA+, PLA-LW, PA-CF, and TPU. Notably, the PLA-CF crash box, employing a basic multi-cell circular geometry without any optimization, demonstrates superior crashworthiness compared to many of the reported crash boxes. It achieves the highest S E A value while maintaining a substantial C F E , highlighting the potential of PLA-CF as an effective material for crash box applications. The observed superior performance of the PLA-CF crash box in this study is likely due to the combined effect of its multi-cellular geometry and the increased stiffness provided by the carbon fiber reinforcement. However, it is important to emphasize that this comparison serves as a general performance benchmark rather than a direct equivalency, due to variations in test conditions, specimen geometries, printing parameters, and material grades among the cited studies.

4. ANOVA of Crashworthiness Indicators

To quantitatively evaluate the influence of material and geometric parameters on crash performance, a two-factor analysis of variance (ANOVA) was conducted on the experimental dataset using the anovan function in MATLAB R2013b (version 8.2.0.701). The factors included material type (categorical: PLA+, PLA-ST, PLA-LW, PLA-CF, and PETG) and geometry (categorical: SCC, SCS, MCC, and MCS). The response variables analyzed were S E A , C F E , and f . As shown in Table 4, Table 5 and Table 6, geometry was identified as the primary factor, accounting for 60.47%, 77.19%, and 85.59% of the variance in S E A , C F E , and f , respectively. Material effects contributed to 33.27%, 18.62%, and 8.53%, while the interaction between geometry and material accounted for 6.06%, 2.87%, and 5.34% of the variance in S E A , C F E , and f , respectively. Both material type and geometry, as well as their interaction, exhibited highly significant p-values (p < 0.05), confirming their strong influence on crashworthiness. The low residual error percentages, ranging from 0.20% to 1.32%, indicate that the selected factors and their interaction explained most of the variation in the dataset.

5. Crashworthiness Comparison Between Additively and Traditionally Manufactured Materials

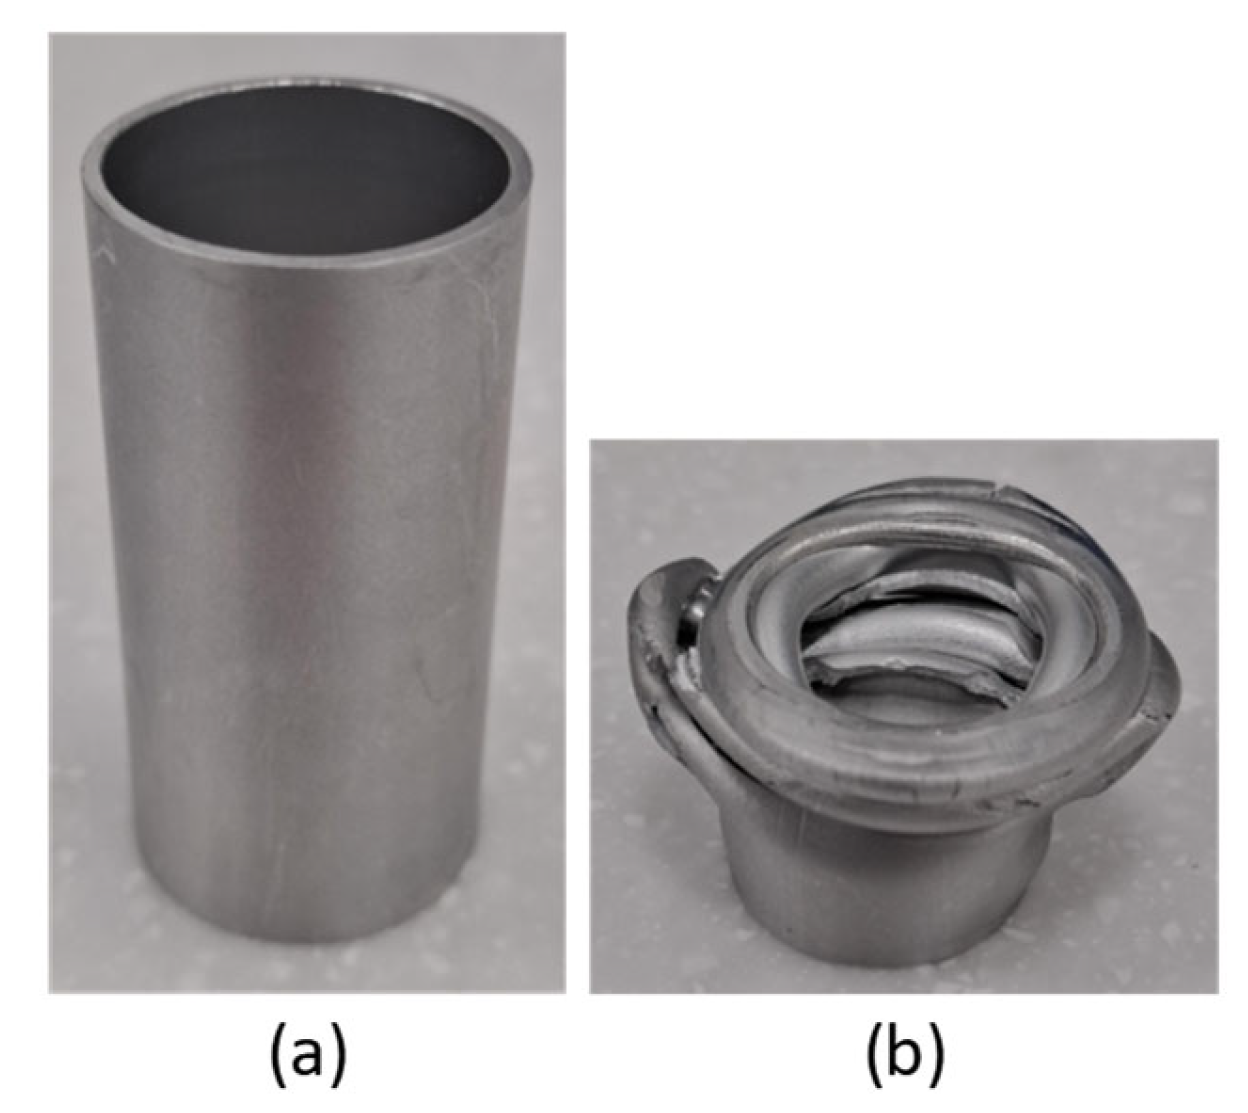
To evaluate the crashworthiness of additively and traditionally manufactured materials, a quasi-static compression test was conducted on an aluminum 6063-T5 tube produced by the extrusion process, using the same SCC geometry as the 3D-printed specimens, as shown in Figure 12. Aluminum 6063-T5 is selected due to its widespread application in crash boxes, attributed to its high strength-to-weight ratio, structural reliability, and proven energy absorption capabilities [8,54,55]. The material properties of aluminum 6063-T5 include a density of 2700 kg/m3, a Poisson’s ratio of 0.3, a Young’s modulus of 68.2 GPa, a yield stress of 180 MPa, and an ultimate tensile strength of 206 MPa [59].
The force–displacement curves of all materials based on the SCC geometry are presented in Figure 13, illustrating the differences in structural response and energy absorption behavior between the aluminum tube and the polymer-based crash boxes. The aluminum specimen, with a measured mass of 21.5 g, achieved the highest S E A of 36.20 kJ/kg and a C F E of 0.602. However, it also exhibited a high P C F of 32.32 kN, which is less desirable in crashworthiness applications. Among the FDM-printed specimens, PLA-CF demonstrated the most favorable performance, achieving an S E A of 13.117 ± 0.185 kJ/kg and a C F E of 0.413 ± 0.029 with a significantly lower P C F of 7.168 ± 0.427 kN and a mass of 9.0 g.
Although aluminum exhibits superior mechanical properties, PLA-CF offers a balanced performance by achieving adequate energy absorption while significantly reducing P C F and mass. Moreover, additive manufacturing enables the creation of complex geometries such as bio-inspired, lattice, and multi-cellular structures, which can substantially enhance energy absorption despite the inherently lower strength of PLA-CF. This geometry-driven design potential plays a pivotal role in narrowing the performance gap between FDM-printed PLA-CF and traditionally manufactured aluminum. Furthermore, hybrid designs that integrate traditionally manufactured elements with additively manufactured components may offer an effective strategy for enhancing crash box efficiency.

6. Limitations, Practical Implications, and Future Work

FDM-printed PLA-CF exhibits certain limitations that may restrict its suitability for high-performance applications. Specifically, its moderate thermal resistance limits performance in elevated temperature environments, where softening and material degradation can occur. Additionally, its hygroscopic nature leads to moisture absorption, which can adversely affect long-term mechanical properties and overall reliability. These factors should be carefully considered when employing PLA-CF in demanding operational conditions. Furthermore, although this study focused on quasi-static compression testing, it is recognized that real-world crash events are inherently dynamic and involve higher strain rates. The quasi-static approach was adopted to provide a consistent baseline for comparing the crashworthiness of different FDM materials and geometries, aligning with standard practices reported in the literature and offering a practical means for early-stage comparative assessments.
Despite these limitations, FDM-printed PLA-CF provides a balanced performance by achieving adequate energy absorption while significantly reducing peak crushing force and mass. It is well-suited for applications such as lightweight, low-speed vehicles, robotics, and other scenarios where moderate crash energy absorption is acceptable. Additionally, PLA-CF offers clear advantages in rapid prototyping and early design validation, with low cost and design flexibility enabling faster development of complex geometries. This makes PLA-CF ideal for iterative design cycles and functional testing of novel structures.
Future research should focus on leveraging the design flexibility of FDM-printed PLA-CF for developing and optimizing advanced geometric architectures, such as bio-inspired, lattice, and multi-cellular designs, which have shown significant potential for enhancing energy absorption capacity. Further investigation into hybrid configurations that integrate traditionally manufactured elements with additively manufactured components is also recommended, as such approaches may effectively combine the advantages of both additive and traditional manufacturing to improve crashworthiness. In parallel, material enhancements should be explored, including refined polymer formulations and improved composite reinforcements, to address current limitations related to thermal stability, moisture sensitivity, and mechanical durability. Additionally, incorporating microstructural analyses, such as Scanning Electron Microscope (SEM) imaging, will be important to deepen the understanding of fracture mechanisms and material behavior. Moreover, future work should incorporate dynamic testing to better capture strain-rate effects encountered in real-world crash scenarios. Combining material advancements with optimized geometric designs, hybrid manufacturing approaches, and dynamic evaluation could further expand the applicability of PLA-CF in crashworthiness applications.

7. Conclusions

The performance of FDM-printed crash boxes made from various materials and design configurations was evaluated in this study to optimize crashworthiness. The materials considered were PLA+, PLA-ST, PLA-LW, PLA-CF, and PETG, while the design configurations were SCC, SCS, MCC, and MCS. Several key findings emerged from the analysis:
  • PLA-CF achieved the best performance, with the MCC design configuration achieving an S E A of 22.378 ± 0.570 J/g and a C F E of 0.732 ± 0.016. The MCS design configuration achieved an S E A of 21.167 ± 0.308 J/g and a C F E of 0.672 ± 0.011.
  • PETG and PLA-LW demonstrated the lowest crashworthiness performance, primarily due to the low structural stiffness of PLA-LW and the brittle fracture characteristics of PETG.
  • Multi-cell configurations (MCC and MCS) outperformed single-cell configurations (SCC and SCS) across all tested materials.
  • ANOVA results revealed that geometry was the dominant factor influencing crash performance, accounting for 60.47%, 77.19%, and 85.59% of the variance in S E A , C F E , and f , respectively. Both material type and geometry, as well as their interaction, showed statistically significant effects (p < 0.05), reinforcing their importance in determining crashworthiness.
  • To evaluate the crashworthiness of additively manufactured materials relative to traditional ones, a compression test was performed on aluminum 6063-T5. While aluminum 6063-T5 possesses superior material properties, PLA-CF demonstrated an adequate level of crashworthiness. It also offers distinct advantages, including reduced mass, lower P C F , and enhanced design flexibility inherent to additive manufacturing. These attributes make PLA-CF a promising alternative for efficient crash box designs, particularly in the development of advanced geometric architectures such as bio-inspired, lattice, and multi-cellular structures.

Author Contributions

Conceptualization, A.S., A.M.A. and A.A.; methodology, A.S., A.M.A. and A.A.; formal analysis, A.S., A.M.A. and A.A.; investigation, A.S., A.M.A. and A.A.; resources, A.S., A.M.A. and A.A.; data curation, A.S., A.M.A. and A.A.; writing—original draft preparation, A.S. and A.M.A.; writing—review and editing, A.S. and A.M.A.; visualization, A.S. and A.M.A.; supervision, A.M.A., A.I.S. and A.A.; project administration, A.I.S. and H.A.E.-G. All authors have read and agreed to the published version of the manuscript.

Funding

This research received no external funding.

Institutional Review Board Statement

Not applicable.

Informed Consent Statement

Not applicable.

Data Availability Statement

The data presented in this study are available on request from the corresponding author.

Conflicts of Interest

The authors declare no conflicts of interest.

References

  1. Omar, M.A. The Automotive Body Manufacturing Systems and Processes; John Wiley and Sons: Hoboken, NJ, USA, 2011; ISBN 9780470976333. [Google Scholar]
  2. Ma, J.; Dai, H.; Shi, M.; Yuan, L.; Chen, Y.; You, Z. Quasi-Static Axial Crushing of Hexagonal Origami Crash Boxes as Energy Absorption Devices. Mech. Sci. 2019, 10, 133–143. [Google Scholar] [CrossRef]
  3. Yuan, L.; Shi, H.; Ma, J.; You, Z. Quasi-Static Impact of Origami Crash Boxes with Various Profiles. Thin-Walled Struct. 2019, 141, 435–446. [Google Scholar] [CrossRef]
  4. Wesselmecking, S.; Kreins, M.; Dahmen, M.; Bleck, W. Material Oriented Crash-Box Design—Combining Structural and Material Design to Improve Specific Energy Absorption. Mater. Des. 2022, 213, 110357. [Google Scholar] [CrossRef]
  5. Kaczyński, P.; Makuła, P. Constitutive Strength Model for Spot Joints of Thin-Walled Energy-Absorbing Elements. Eng. Struct. 2023, 292, 116592. [Google Scholar] [CrossRef]
  6. Hanssen, A.G.; Langseth, M.; Hopperstad, O.S. Static and Dynamic Crushing of Circular Aluminum Extrusions with Aluminum Foam Filler. Int. J. Impact Eng. 2000, 24, 475–507. [Google Scholar] [CrossRef]
  7. Hanssen, A.G.; Langseth, M.; Hopperstad, O.S. Static and Dynamic Crushing of Square Aluminum Extrusions with Aluminum Foam Filler. Int. J. Impact Eng. 2000, 24, 347–383. [Google Scholar] [CrossRef]
  8. Acar, E.; Altin, M.; Güler, M.A. Evaluation of Various Multi-Cell Design Concepts for Crashworthiness Design of Thin-Walled Aluminum Tubes. Thin-Walled Struct. 2019, 142, 227–235. [Google Scholar] [CrossRef]
  9. Aktaş, C.; Acar, E.; Güler, M.A.; Altın, M. An Investigation of the Crashworthiness Performance and Optimization of Tetra-Chiral and Reentrant Crash Boxes. Mech. Based Des. Struct. Mach. 2023, 51, 6881–6904. [Google Scholar] [CrossRef]
  10. Mert, S.K.; Demiral, M.; Altin, M.; Acar, E.; Güler, M.A. Experimental and Numerical Investigation on the Crashworthiness Optimization of Thin-Walled Aluminum Tubes Considering Damage Criteria. J. Braz. Soc. Mech. Sci. Eng. 2021, 43, 113. [Google Scholar] [CrossRef]
  11. Güler, M.A.; Mert, S.K.; Altin, M.; Acar, E. An Investigation on the Energy Absorption Capability of Aluminum Foam-Filled Multi-Cell Tubes. J. Braz. Soc. Mech. Sci. Eng. 2023, 45, 541. [Google Scholar] [CrossRef]
  12. Chen, J.; Li, E.; Liu, W.; Mao, Y.; Hou, S. Crashworthiness Analysis of Novel Cactus-Inspired Multi-Cell Structures under Axial Crushing. Int. J. Mech. Sci. 2024, 268, 109053. [Google Scholar] [CrossRef]
  13. Kathiresan, M.; Manisekar, K.; Rajamohan, V.; Güler, M.A. Investigations on Crush Behavior and Energy Absorption Characteristics of GFRP Composite Conical Frusta with a Cutout under Axial Compression Loading. Mech. Adv. Mater. Struct. 2022, 29, 5360–5377. [Google Scholar] [CrossRef]
  14. Hull, C.W. Apparatus for Production of Three Dimensional Objects by Stereolithography. US4575330A, 11 March 1986. [Google Scholar]
  15. Saber, A.; Amer, A.M.; Shehata, A.I.; El-Gamal, H.A.; Abd_Elsalam, A. Recent Developments in Additively Manufactured Crash Boxes: Geometric Design Innovations, Material Behavior, and Manufacturing Techniques. Appl. Sci. 2025, 15, 7080. [Google Scholar] [CrossRef]
  16. Li, Q.; Wang, W.; Tan, H.; Long, X.; Wang, F.; Hu, L. Energy Absorption Characteristics of Modular Assembly Structures under Quasi-Static Compression Load. Compos. Struct. 2024, 342, 118260. [Google Scholar] [CrossRef]
  17. Wang, Y.; Zhang, Z.; Xue, X.; Zhou, J.; Song, Z. Axial and Lateral Crushing Performance of Plate-Lattice Filled Square Sandwich Tubes. Compos. Struct. 2021, 274, 114404. [Google Scholar] [CrossRef]
  18. Tao, Y.; Li, W.; Wei, K.; Duan, S.; Wen, W.; Chen, L.; Pei, Y.; Fang, D. Mechanical Properties and Energy Absorption of 3D Printed Square Hierarchical Honeycombs under In-Plane Axial Compression. Compos. Part B Eng. 2019, 176, 107219. [Google Scholar] [CrossRef]
  19. Zhang, X.; Xie, J.; Chen, J.; Okabe, Y.; Pan, L.; Xu, M. The Beetle Elytron Plate: A Lightweight, High-Strength and Buffering Functional-Structural Bionic Material. Sci. Rep. 2017, 7, 4440. [Google Scholar] [CrossRef] [PubMed]
  20. Alkhatib, S.E.; Matar, M.S.; Tarlochan, F.; Laban, O.; Mohamed, A.S.; Alqwasmi, N. Deformation Modes and Crashworthiness Energy Absorption of Sinusoidally Corrugated Tubes Manufactured by Direct Metal Laser Sintering. Eng. Struct. 2019, 201, 109838. [Google Scholar] [CrossRef]
  21. Stanczak, M.; Fras, T.; Blanc, L.; Pawlowski, P.; Rusinek, A. Numerical and Experimental Study on Mechanical Behaviour of the AlSi10Mg Aluminium Structures Manufactured Additively and Subjected to a Blast Wave. In Proceedings of the EPJ Web of Conferences, Madrid, Spain, 20–24 September 2021; EDP Sciences: Les Ulis, France, 2021; Volume 250, p. 02017. [Google Scholar]
  22. Tang, Y.; Li, Q.; Miao, X.; Chen, B.; Yin, L.; Liu, X.; Gu, C. Design Novel Origami Structures for Energy Absorption under Compressive Load. Acta Mech. Sin. 2024, 40, 423271. [Google Scholar] [CrossRef]
  23. Zeng, Y.; Du, X.; Yao, H.; Li, P.; Dong, P.; Chen, J. An Nylon Lattice Structure with Improved Mechanical Property and Energy Absorption Capability. Compos. Part C Open Access 2022, 8, 100285. [Google Scholar] [CrossRef]
  24. Peng, X.; Liu, G.; Li, J.; Wu, H.; Jia, W.; Jiang, S. Compression Property and Energy Absorption Capacity of 4D-Printed Deformable Honeycomb Structure. Compos. Struct. 2023, 325, 117591. [Google Scholar] [CrossRef]
  25. Raj, R.; Jiyalal Prajapati, M.; Tsai, J.T.; Kumar, A.; Jeng, J.Y. Design and Additive Manufacturing of Novel Hybrid Lattice Metamaterial for Enhanced Energy Absorption and Structural Stability. Mater. Des. 2024, 245, 113268. [Google Scholar] [CrossRef]
  26. Shen, W.; Zhang, Z.; Okudan Kremer, G.E.; Qin, H. Origami-Inspired Infill Pattern for Additive Manufacturing. Manuf. Lett. 2022, 33, 516–520. [Google Scholar] [CrossRef]
  27. Saber, A.; Güler, M.A.; Acar, E.; ElSayed, O.S.; Aldallal, H.; Alsadi, A.; Aldousari, Y. Crash Performance of Additively Manufactured Tapered Tube Crash Boxes: Influence of Material and Geometric Parameters. Designs 2025, 9, 72. [Google Scholar] [CrossRef]
  28. Fu, X.; Zhang, X.; Huang, Z. Axial Crushing of Nylon and Al/Nylon Hybrid Tubes by FDM 3D Printing. Compos. Struct. 2021, 256, 113055. [Google Scholar] [CrossRef]
  29. Luo, G.; Liu, J.; Li, L.; Xue, P.; Zhao, J.; Chen, Y. Crashworthiness Analysis and Multi-Objective Optimization Design for Foam-Filled Spiral Tube. Int. J. Mech. Sci. 2024, 282, 109588. [Google Scholar] [CrossRef]
  30. Capasso, I.; Andreacola, F.R.; Brando, G. Additive Manufacturing of Metal Materials for Construction Engineering: An Overview on Technologies and Applications. Metals 2024, 14, 1033. [Google Scholar] [CrossRef]
  31. Wu, Y.; Fang, J.; Wu, C.; Li, C.; Sun, G.; Li, Q. Additively Manufactured Materials and Structures: A State-of-the-Art Review on Their Mechanical Characteristics and Energy Absorption. Int. J. Mech. Sci. 2023, 246, 108102. [Google Scholar] [CrossRef]
  32. Chen, W.; Guo, C.; Zuo, X.; Zhao, J.; Peng, Y.; Wang, Y. Experimental and Numerical Investigation of 3D Printing PLA Origami Tubes under Quasi-Static Uniaxial Compression. Polymers 2022, 14, 4135. [Google Scholar] [CrossRef]
  33. Khoa, N.D.; Bohara, R.P.; Ghazlan, A.; Thai, T.; Ngo, T. Novel Hierarchical Bioinspired Cellular Structures with Enhanced Energy Absorption under Uniaxial Compression. Aerosp. Sci. Technol. 2024, 147, 108995. [Google Scholar] [CrossRef]
  34. Efstathiadis, A.; Symeonidou, I.; Tsongas, K.; Tzimtzimis, E.K.; Tzetzis, D. 3D Printed Voronoi Structures Inspired by Paracentrotus Lividus Shells. Designs 2023, 7, 113. [Google Scholar] [CrossRef]
  35. Sun, G.; Wang, J.; Wang, K.; Baghani, M.; Peng, Y.; Rao, Y. Repeatable Compressive Functionality of 3D Printed Shape-Memory Thin-Walled Corrugated Structures. Int. J. Mech. Sci. 2023, 257, 108552. [Google Scholar] [CrossRef]
  36. Ha, N.S.; Pham, T.M.; Tran, T.T.; Hao, H.; Lu, G. Mechanical Properties and Energy Absorption of Bio-Inspired Hierarchical Circular Honeycomb. Compos. Part B Eng. 2022, 236, 109818. [Google Scholar] [CrossRef]
  37. Awd Allah, M.M.; Abdel-Aziem, W.; Abd El-baky, M.A. Collapse Behavior and Energy Absorbing Characteristics of 3D-Printed Tubes with Different Infill Pattern Structures: An Experimental Study. Fibers Polym. 2023, 24, 2609–2622. [Google Scholar] [CrossRef]
  38. Zhang, D.; Li, M.; Qiu, N.; Yang, J.; Wu, C.; Steven, G.; Li, Q.; Fang, J. 4D-Printed Reusable Metamaterial via Shape Memory Effect for Energy Dissipation. Int. J. Mech. Sci. 2024, 275, 109309. [Google Scholar] [CrossRef]
  39. Bintara, R.D.; Choiron, M.A. Deformation Pattern and Energy Absorption of Polylactic Acid (PLA) Carbon Crash Box under Quasi Static Loading. In Proceedings of the IOP Conference Series: Materials Science and Engineering, Malang, Indonesia, 1 February 2021; IOP Publishing: Bristol, UK, 2021; Volume 1034, p. 012011. [Google Scholar]
  40. Liu, Y.; Tan, Q.; Lin, H.; Wang, J.; Wang, K.; Peng, Y.; Yao, S. Integrated Design and Additive Manufacturing of Lattice-Filled Multi-Cell Tubes. Compos. Sci. Technol. 2023, 243, 110252. [Google Scholar] [CrossRef]
  41. Liu, Y.; Wang, J.; Cai, R.; Xiang, J.; Wang, K.; Yao, S.; Peng, Y. Effects of Loading Rate and Temperature on Crushing Behaviors of 3D Printed Multi-Cell Composite Tubes. Thin-Walled Struct. 2023, 182, 110311. [Google Scholar] [CrossRef]
  42. Wang, K.; Liu, Y.; Wang, J.; Xiang, J.; Yao, S.; Peng, Y. On Crashworthiness Behaviors of 3D Printed Multi-Cell Filled Thin-Walled Structures. Eng. Struct. 2022, 254, 113907. [Google Scholar] [CrossRef]
  43. Liu, Y.; Wang, J.; Tan, Q.; Gao, H.; Wang, K.; Yao, S.; Peng, Y. On Multi-Stage Deformation and Gradual Energy Absorption of 3D Printed Multi-Cell Tubes with Varying Cross-Section. Eng. Struct. 2024, 319, 118839. [Google Scholar] [CrossRef]
  44. Li, J.; Qu, M.; Jiang, Z. Multi-Objective Optimization for 3D Printed Origami Crash Box Cell Based on Artificial Neural Networks and NSGA-II. J. Mater. Process. Des. 2023, 7, 1–13. [Google Scholar] [CrossRef]
  45. Xing, S.; Jiang, Z.; Zhao, J.; Sun, X.; Wang, Y. Failure Mechanism and Crashworthiness Optimization of Variable Stiffness Nested Origami Crash Box. Eng. Fail. Anal. 2025, 167, 108953. [Google Scholar] [CrossRef]
  46. Wang, J.; Liu, Y.; Wang, K.; Yao, S.; Peng, Y.; Rao, Y.; Ahzi, S. Progressive Collapse Behaviors and Mechanisms of 3D Printed Thin-Walled Composite Structures under Multi-Conditional Loading. Thin-Walled Struct. 2022, 171, 108810. [Google Scholar] [CrossRef]
  47. Yao, R.; Pang, T.; Zhang, B.; Fang, J.; Li, Q.; Sun, G. On the Crashworthiness of Thin-Walled Multi-Cell Structures and Materials: State of the Art and Prospects. Thin-Walled Struct. 2023, 189, 110734. [Google Scholar] [CrossRef]
  48. Tunay, M.; Bardakci, A. A Study of Crashworthiness Performance in Thin-Walled Multi-Cell Tubes 3D-Printed from Different Polymers. J. Appl. Polym. Sci. 2024, 141, e56287. [Google Scholar] [CrossRef]
  49. Pirmohammad, S.; Nikkhah, H. Crashworthiness Investigation of Bitubal Columns Reinforced with Several inside Ribs under Axial and Oblique Impact Loads. Proc. Inst. Mech. Eng. Part D J. Automob. Eng. 2018, 232, 367–383. [Google Scholar] [CrossRef]
  50. Özen, İ.; Gedikli, H.; Aslan, M. Experimental and Numerical Investigation on Energy Absorbing Characteristics of Empty and Cellular Filled Composite Crash Boxes. Eng. Struct. 2023, 289, 116315. [Google Scholar] [CrossRef]
  51. Wang, K.; Sun, G.; Wang, J.; Yao, S.; Baghani, M.; Peng, Y. Reversible Energy Absorbing Behaviors of Shape-Memory Thin-Walled Structures. Eng. Struct. 2023, 279, 115626. [Google Scholar] [CrossRef]
  52. Hidayat, D.; Istiyanto, J.; Sumarsono, D.A.; Kurniawan, F.; Ardiansyah, R.; Wandono, F.A.; Nugroho, A. Investigation on the Crashworthiness Performance of Thin-Walled Multi-Cell PLA 3D-Printed Tubes: A Multi-Parameter Analysis. Designs 2023, 7, 108. [Google Scholar] [CrossRef]
  53. Hidayat, D.; Istiyanto, J.; Sumarsono, D.A.; Kurniawan, F.; Abdurohman, K. Crashworthiness Characteristics of Thin-Walled Multi-Cell Structures via the Application of Annealing Process: An Experimental Investigation. Evergreen 2024, 11, 1892–1900. [Google Scholar] [CrossRef]
  54. Saber, A.; Güler, M.A.; Altin, M.; Acar, E. Bio-Inspired Thin-Walled Energy Absorber Adapted from the Xylem Structure for Enhanced Vehicle Safety. J. Braz. Soc. Mech. Sci. Eng. 2024, 46, 613. [Google Scholar] [CrossRef]
  55. Altin, M.; Acar, E.; Güler, M.A. Foam Filling Options for Crashworthiness Optimization of Thin-Walled Multi-Tubular Circular Columns. Thin-Walled Struct. 2018, 131, 309–323. [Google Scholar] [CrossRef]
  56. Cetin, E. Energy Absorption of Thin-Walled Multi-Cell Tubes with DNA-Inspired Helical Ribs under Quasi-Static Axial Loading. J. Braz. Soc. Mech. Sci. Eng. 2024, 46, 607. [Google Scholar] [CrossRef]
  57. Wirawan, W.A.; Junipitoyo, B.; Putro, S.H.S.; Sabitah, A.; Suudy, A.H.; Ridwan, R.; Choiron, M.A. Collapse Behavior and Energy Absorption Characteristics of Design Multi-Cell Thin Wall Structure 3D-Printed Under Quasi Statistic Loads. Automot. Exp. 2024, 7, 149–160. [Google Scholar] [CrossRef]
  58. Wang, K.; Tan, Q.; Wang, J.; Liu, Y.; Zhai, Z.; Yao, S.; Peng, Y. A Low-Cost Granular-Medium Hot Quasi-Isostatic Pressing Method for Enhancing Compressive Properties of 3D Printed Structures. J. Manuf. Process. 2024, 115, 441–451. [Google Scholar] [CrossRef]
  59. Wu, S.; Zheng, G.; Sun, G.; Liu, Q.; Li, G.; Li, Q. On Design of Multi-Cell Thin-Wall Structures for Crashworthiness. Int. J. Impact Eng. 2016, 88, 102–117. [Google Scholar] [CrossRef]
Figure 1. Specimen geometry and dimensions.
Applmech 06 00052 g001
Figure 2. Representative specimens of fabricated design configurations.
Applmech 06 00052 g002
Figure 3. (a) Three-dimensionally printed base for each material. (b) Lower plate with 3D-printed frame.
Applmech 06 00052 g003
Figure 4. Typical force–displacement diagram for a crash box.
Applmech 06 00052 g004
Figure 5. Deformation patterns of PLA+, PLA-ST, PLA-LE, and PLA-CF tubes.
Applmech 06 00052 g005
Figure 6. Deformation patterns of PETG tubes.
Applmech 06 00052 g006
Figure 7. Force–displacement relationship of different materials and design configurations: (a) PLA+; (b) PLA-ST; (c) PLA-LW; (d) PLA-CF; (e) PETG.
Applmech 06 00052 g007
Figure 8. Energy-displacement relationship of different materials and design configurations: (a) PLA+; (b) PLA-ST; (c) PLA-LW; (d) PLA-CF; (e) PETG.
Applmech 06 00052 g008
Figure 9. (a) Printing time; (b) m ; (c) E T ; (d) P C F ; (e) M C F ; (f) S E A . All tests were conducted at room temperature.
Applmech 06 00052 g009
Figure 10. (a) C F E ; (b) f . All tests were conducted at room temperature.
Applmech 06 00052 g010
Figure 11. Comparison of S E A and C F E values for tubular crash boxes manufactured using the FDM process in recent studies [40,48,51,52,53,56,57,58].
Applmech 06 00052 g011
Figure 12. Aluminum 6063-T5 tube: (a) before compression; (b) after compression.
Applmech 06 00052 g012
Figure 13. Force–displacement relationship of different additively manufactured materials and aluminum.
Applmech 06 00052 g013
Table 1. Filament properties.
PropertyPLA+PLA-STPLA-LWPLA-CFPETG
Density (g/cm3)1.231.251.21.211.27
Tensile Strength (MPa)6334.332.23952.2
Elongation at Break (%)209068.94.2783
Flexural Strength (MPa)744341.3110358.1
Flexural Modulus (MPa)19731477170150031073
IZOD Impact Strength (kJ/m2)9638.585.084.7
Table 2. FDM printing parameters.
ParameterPLA+PLA-STPLA-LWPLA-CFPETG
Printing temperature (°C)220220245220255
Bed temperature (°C)6565556580
Diameter of nozzle (mm)0.40.40.40.60.4
Layer height (mm)0.20.20.20.30.2
Infill density (%)100100100100100
Outer wall print speed (mm/s)2002005012080
Inner wall print speed (mm/s)30030050150120
Table 3. Printing time, mass, and crashworthiness indicators for different materials and design configurations.
CasePrinting Time [min] m [g] E T [kJ] P C F [kN] M C F [kN] S E A [kJ/kg] C F E f
SCC PLA+509.80.138 ± 0.0029.532 ± 0.0943.443 ± 0.04814.052 ± 0.1950.361 ± 0.0070.535 ± 0.008
SCS PLA+5012.60.086 ± 0.0056.871 ± 0.0442.159 ± 0.1296.853 ± 0.4100.314 ± 0.0210.348 ± 0.022
MCC PLA+6217.40.366 ± 0.01115.706 ± 0.2519.147 ± 0.28121.029 ± 0.6450.582 ± 0.0100.827 ± 0.020
MCS PLA+6221.30.472 ± 0.00519.946 ± 0.56711.802 ± 0.11622.163 ± 0.2170.592 ± 0.0120.858 ± 0.004
SCC PLA ST509.60.099 ± 0.0025.966 ± 0.1342.468 ± 0.06010.282 ± 0.2490.414 ± 0.0040.486 ± 0.007
SCS PLA ST5012.00.065 ± 0.0014.902 ± 0.0441.637 ± 0.0135.458 ± 0.0440.334 ± 0.0060.330 ± 0.005
MCC PLA ST6216.90.271 ± 0.00610.687 ± 0.3226.771 ± 0.14616.026 ± 0.3460.634 ± 0.0070.750 ± 0.006
MCS PLA ST6220.70.322 ± 0.00512.812 ± 0.1928.041 ± 0.12715.539 ± 0.2460.628 ± 0.0030.736 ± 0.006
SCC PLA LW645.30.023 ± 0.0011.105 ± 0.0320.578 ± 0.0174.364 ± 0.1300.524 ± 0.0270.427 ± 0.019
SCS PLA LW766.80.026 ± 0.0001.195 ± 0.0420.661 ± 0.0033.889 ± 0.0150.554 ± 0.0210.435 ± 0.013
MCC PLA LW1099.20.080 ± 0.0032.743 ± 0.1831.999 ± 0.0698.693 ± 0.3000.730 ± 0.0400.652 ± 0.026
MCS PLA LW13211.10.106 ± 0.0033.440 ± 0.1412.642 ± 0.0639.522 ± 0.2260.769 ± 0.0230.694 ± 0.014
SCC PLA CF369.00.118 ± 0.0027.168 ± 0.4272.951 ± 0.04213.117 ± 0.1850.413 ± 0.0290.547 ± 0.022
SCS PLA CF3611.20.076 ± 0.0015.480 ± 0.0541.895 ± 0.0246.768 ± 0.0850.346 ± 0.0050.366 ± 0.005
MCC PLA CF4415.40.345 ± 0.00911.777 ± 0.0828.616 ± 0.22022.378 ± 0.5700.732 ± 0.0160.951 ± 0.022
MCS PLA CF5019.00.402 ± 0.00614.953 ± 0.03110.054 ± 0.14621.167 ± 0.3080.672 ± 0.0110.887 ± 0.014
SCC PETG429.60.077 ± 0.0035.443 ± 0.0601.914 ± 0.0787.975 ± 0.3270.352 ± 0.0150.396 ± 0.017
SCS PETG4812.20.049 ± 0.0083.758 ± 0.0441.217 ± 0.1963.989 ± 0.6420.324 ± 0.0540.292 ± 0.048
MCC PETG6916.80.253 ± 0.00610.373 ± 0.4396.337 ± 0.15515.087 ± 0.3680.611 ± 0.0110.716 ± 0.002
MCS PETG7520.70.305 ± 0.00512.283 ± 0.5627.624 ± 0.11514.732 ± 0.2220.621 ± 0.0190.714 ± 0.007
Table 4. ANOVA results for S E A .
Source of VariationDFContributionAdj SSAdj MSp-Value
Material433.27%748.5399187.13506.26 × 10−44
Geometry360.47%1360.3018453.43391.05 × 10−49
Material × Geometry126.06%136.395311.36634.95 × 10−26
Error400.20%4.49940.1118
Total59100%
Table 5. ANOVA results for C F E .
Source of VariationDFContributionAdj SSAdj MSp-Value
Material418.62%0.25400.06355.21 × 10−23
Geometry377.19%1.05310.35101.69 × 10−35
Material × Geometry122.87%0.03920.00338.39 × 10−7
Error401.32%0.01800.0005
Total59100%
Table 6. ANOVA results for f .
Source of VariationDFContributionAdj SSAdj MSp-Value
Material48.53%0.20750.05193.96 × 10−24
Geometry385.59%2.08110.69372.83 × 10−44
Material × Geometry125.34%0.12990.01083.98 × 10−17
Error400.53%0.01280.0003
Total59100%
Disclaimer/Publisher’s Note: The statements, opinions and data contained in all publications are solely those of the individual author(s) and contributor(s) and not of MDPI and/or the editor(s). MDPI and/or the editor(s) disclaim responsibility for any injury to people or property resulting from any ideas, methods, instructions or products referred to in the content.