Article

Production and Physicochemical Characterization of Activated Carbon from the Mesocarp of the Coconut (Cocos nucifera L.) Variety Alto del Pacifico

by
Gabriela Ramos Clamont Montfort
1,
José A. Azamar-Barrios
2,
Patricia Quintana-Owen
2,
Víctor Rejón-Moo
2,
William S. González-Gómez
2 and
Tomás J. Madera-Santana
1,*
1
Centro de Investigación en Alimentación y Desarrollo, Carr. Gustavo E. Astiazarán Rosas. No. 46. Col. La Victoria, Hermosillo 83304, Sonora, Mexico
2
Department of Applied Physics, Center for Research and Advanced Studies, Campus Merida, Km 6 Carretera Antigua a Progreso, Cordemex, Mérida 97310, Yucatán, Mexico
*
Author to whom correspondence should be addressed.
Chemistry 2025, 7(3), 88; https://doi.org/10.3390/chemistry7030088
Submission received: 18 February 2025 / Revised: 21 May 2025 / Accepted: 22 May 2025 / Published: 28 May 2025
(This article belongs to the Section Green and Environmental Chemistry)

Abstract

:
The mesocarp, a by-product of coconut production, consists of a fibrous outer layer and a medullary tissue. These fibers can be utilized as an alternative source for producing activated carbon (AC). This study presents a method for producing activated carbon from coconut mesocarp fibers (CMFs) using a phosphoric acid (H3PO4) solution as the activating agent. The chemical activation process involves two stages: (1) carbonization of the CMFs, and (2) activation with H3PO4 at elevated temperatures. AC was characterized by its structural, thermal, surface morphological, and elemental properties. The resulting AC developed a lamellar structure with a porous network. Notably, the AC treated with a 60% v/v H3PO4 solution demonstrated a BET adsorption surface area of 1508 m2/g, a total pore volume of 0.871 cm3/g, and an average pore diameter of 2.20 nm. Fourier-transform infrared spectroscopy (FTIR) confirmed the presence of aromatic rings in the AC, while thermogravimetric analysis showed that the AC decomposed at 428 °C, compared to 418 °C for the non-activated carbon. Elemental analysis revealed a 9.04% increase in carbon content in the AC. Producing activated carbon from coconut mesocarp fibers offers a cost-effective method to generate high-surface-area activated carbon from agro-industrial waste.

Graphical Abstract

1. Introduction

Agricultural products, including corn, rice, sugar cane, potatoes, coconuts, and so forth, are processed in starch, sugar, and oil refineries to produce pure feedstock, raw materials for food industries, and chemical or fermentation processes [1]. However, these industries and processes produce agro-industrial waste (AIW) products such as straw, bran, cobs, and husks, which are rich in lignocellulose. Based on renewable sources and at low cost, several AIW products could be considered candidates for producing activated carbon [2]. One significant source of plant-derived activated carbon is the endocarp (nutshell) of the coconut fruit. It serves as an important means of livelihood for coconut producers in countries such as the Philippines, Sri Lanka, Indonesia, and India, with total exports reaching 189,938 metric tons in 2015 [3]. In addition to the endocarp, other by-products of the coconut fruit have the potential to produce activated carbon, including the mesocarp (fibrous layer, husk), which also has the potential for activated carbon production.
Coconut palm (Cocos nucifera L.) is well known as the “Three of life” or the “Three of abundance” (Figure 1a). It provides income for people in rural communities (Figure 1b) in more than 94 countries across Southeast Asia, the Pacific Islands, West and East Africa, and North and South America (Mexico and Brazil) [4,5]. The fruit of the coconut palm is an agricultural product grown throughout the year with a rounded shape (Figure 1c), a diameter between 20 and 30 cm, and a weight of up to 2.5 kg. The coconut fruit consists of an outer epicarp, transitioning from smooth in young specimens to a rigid, lignified structure upon ripening. The mesocarp, a 4–5 cm fibrous middle layer comprising 35% of the fruit’s weight, forms the primary parenchyma tissue; its fibers shift from translucent in tender fruit to brown and desiccated when mature, arranged longitudinally. Internally, the endocarp (shell) encloses the seed, lined by a thin brown testa. The innermost layer, the endosperm, is the edible portion, differentiated into solid (coconut meat) and liquid (coconut water) phases. This study focuses on the mesocarp.
According to Alvarado et al. [6], the dry coconut mesocarp is composed of long and short fibers, as well as dust from the medullary tissue. A regular coconut fruit may contain approximately 125 g of dry fibers and 250 g of medullary dust. Therefore, each coconut can have between 375 g and 400 g of dry mesocarp. Coconut mesocarp fibers (CMFs), also known as coir or husk, are stiff fibers and shorter in length (between 15 and 30 cm) and diameter (between 0.254 mm and 1.016 mm) compared to other vegetable fibers [7]. The chemical composition of CMFs varies according to the coconut variety, fruit ripening, and the cultivation environment. In addition to the fibers, CMF is composed of dead plant cells and has good physical properties such as density, tensile strength, modulus, and elongation at break. However, the fiber composition of CMF differs in terms of cellulose, lignin, hemicellulose, and pectin content.
CMFs have been used in the ornamentation industry, such as for the elaboration of hydroponic media, because they are a valuable source of minerals such as potassium (K+) and chlorine (Cl) [8]. CMFs are used in construction [9,10], for the treatment of industrial effluents, for heavy metal adsorption [11], as a growing substrate for soft fruits (raspberries, strawberries, etc.), and for the manufacture of ropes and ecological pots, among others [12]. In contrast, coconut shells are commonly used to produce activated carbon due to their small macroporous structure, low ash content, and high fixed carbon [13].
Recent studies from the literature have reported the use of CMF to produce activated carbon for different applications, such as to remove crystal violet dye from aqueous solutions [14], to fabricate activated carbon paste electrode to detect heavy metals such as lead (Pb2+) and cadmium (Cd2+) [15], and to produce activated carbon to be used as an electrode material for supercapacitor energy storage [16] and electrochemical capacitors [17]. Compared to coconut shells, CMFs offer advantages such as availability, affordability, low cost, and environmentally beneficial characteristics. CMFs have beneficial properties, including being freely available, inexpensive, and non-hazardous to nature. However, the properties of the activated carbon produced from these fibers depend significantly on the production process. Thus, developing an easy method to produce activated carbon from CMFs with homogeneous characteristics that could compete with other activated carbons is important.
Activated carbon (AC) is a material that has had an important impact on daily life, primarily through various purification processes (air and other gas purification, water treatment, automotive-emission canisters, etc.). Additionally, it plays a vital role in the medical and pharmaceutical industries. An increasing interest in the production of AC has focused on organic, renewable, and low-cost precursors (agro-industrial waste) [18]. AC from organic origins is a porous form of carbon manufactured primarily from coconut shells in a two-step process (carbonization and activation). According to analysts, the demand for organic AC will increase in the coming years, and coconut-producing nations can take advantage of the situation [19]. This report includes the search for new production alternatives, such as obtaining AC from the mesocarp of coconut fruits.
The carbon produced from coconut shells can be activated physically (thermal) or chemically (chemical dehydration) [20,21]. Physical activation involves primary carbonization of the precursor material, followed by a heat treatment between 700 °C and 1100 °C under a flow of water vapor, O2, CO2, or a mixture of gases that guarantees a reactive atmosphere during the activation process. Chemical activation is performed by the impregnation of the precursor material with a dehydrating or activating agent such as sodium hydroxide (NaOH), potassium hydroxide (KOH), phosphoric acid (H3PO4), or zinc chloride (ZnCl2), followed by a heat treatment with temperatures between 400 and 900 °C, where carbonization and activation occur almost simultaneously. Using H3PO4 as an activating agent for CMFs-derived AC is crucial because it provides a low-temperature, environmentally friendly method of increasing porosity and surface area while maintaining the fibers’ inherent benefits of abundance, sustainability, and affordability. The activation agents allow the pyrolysis of the precursor material whilst avoiding the release of organic matter, which increases the carbon retention, delays the burning of the precursor material, and increases the yield of AC. Chemical activation has several advantages over physical activation, including lower pyrolysis temperatures, shorter activation times, higher yields, the incorporation of functional groups on the surface, and improved pore diameter [21,22]. AC has a large surface area and high porosity and has been widely used as an adsorbent for separation, purification, decolorization, and deodorization of vegetable oils and fats, water purification and pollution treatments, air and gas purification (cigarette filters and motor vehicle exhausts), and for the food and pharmaceutical industries.
In this study, carbon derived from CMFs was chemically activated using H3PO4 as the activating agent. The chemical activation approach was used in conjunction with carbonization in an inert atmosphere for this aim. The carbon’s outstanding morphological, surface, structural, and thermal stability led to its first carbonization in an inert atmosphere, followed by chemical activation with H3PO4. The resulting AC’s thermal, structural, surface, and morphological properties were presented. Considering the low cost of CMFs, the AC’s porosity, thermal, and structural characteristics suggest that this agro-industrial waste product has the potential to produce profitable AC.

2. Materials and Methods

2.1. Materials

Mesocarp husk from the Alto Pacifico II coconut fruit variety was collected at the port of San Crisanto in Yucatan, Mexico (21.3518° N, 89.1807° W). The husk was sun-dried until reaching a moisture content of 7.67 ± 1.0%. The fibers were ground twice using the Pagani® industrial knife mill model 1620 and Comitrol® model 3600 from Urschel Laboratories Inc. (Chesterton, IN, USA). The ground material was sieved at No. 40 mesh (Tyler), and the retained material (+40) was used in this research, referred to as the coconut mesocarp fiber (CMF).
For the study, the following chemicals were used phosphoric acid (H3PO4), sulfuric acid (H2SO4) (95–98%), a Kjeldahl catalyst (3.5 g K2SO4 and 0.4 g CuSO4 per tablet), sodium hydroxide solution (NaOH) (40% w/w), boric acid solution (H3BO3) (4% w/v), and hydrochloric acid (HCl) standard solution (0.1 N). All chemicals were reagent grade and were supplied by Fagalab S.A. (Mocorito, Sinaloa, Mexico). Distilled water was used to prepare aqueous phosphoric acid (H3PO4) solutions at 10% to 80% v/v concentrations. Argon (Ar) gas was procured from the Infra Group (Merida, Mexico).

2.2. Proximate Analysis of Coconut Mesocarp Fibers

The proximate analysis of CMF includes determination of moisture content, ash content, volatile matter, crude fat, and protein content, following the AOAC methods. The moisture content of the CMF was determined by weight loss due to water evaporation, calculated as the difference in weight between dry and wet material and expressed as a percentage. For the analysis, sample holders were weighed and then 2 g of CMF was placed in a Blue M model ESP400 (New Columbia, PA, USA) convection oven at 115 °C for 3 h. Afterwards, the samples were placed in a desiccator to cool to room temperature for 30 min before weighing the dry sample. The moisture content was calculated using the following formula:
M o i s t u r e   ( % ) = B C A × 100
where A is the weight of the wet sample (g), B is the crucible weight + wet sample (g), and C is the weight of the crucible + dry sample (g).
Ash. The procedure for determining ash content consisted of CMF calcination to eliminate organic matter, leaving only inorganic materials, such as minerals. The process began by weighing the empty crucible and placing it in a muffle furnace at 550 °C for 2 h. Once the process was complete, the crucible was allowed to cool and transferred to a desiccator until a constant weight was obtained. The crucible was weighed and 1.5 g of CMF was weighed into the crucible. The crucible and the sample were ignited over a burner until smoking ceased. Subsequently, the crucible was placed in the muffle furnace at 525 °C for 5 h. Finally, the sample was cooled, placed in a desiccator, and weighed to determine the ash content.
A s h   c o n t e n t   ( % ) = A B C × 100
where A is the weight of the crucible with ash (g), B is the weight of the empty crucible (g), and C is the weight of the sample (g).
Volatile matter. Approximately 2 g of sample was weighed and introduced into a crucible, which had been pre-weighed. The volatile matter of organic samples is gases and vapors released when the sample is heated in the absence of air or an inert atmosphere. The sample was subjected to dry oxidation in a muffle furnace at 550 °C for 10 min, then cooled and placed into a desiccator to reach room temperature. The crucible containing the sample was weighed, and the volatile matter calculated using the Equation (3):
V o l a t i l e   m a t t e r   % = Z 1 Z 2 Z 1 × 100
where Z1 is the initial weight of the sample before dry oxidation (g) and Z2 is the final weight of the sample after dry oxidation (g).
Soxhlet extraction. The procedure to determine the crude fat of the CMF was performed using a Soxhlet extractor. Around 1.5 g of sample was weighed in a cellulose extraction cartridge (thimble) and then placed in a Soxhlet extraction system. A flask with 90 mL of petroleum ether was connected to the extractor and heated with a heating plate for 8 h and refluxed every 4 min. After this, the cartridge was removed from the Soxhlet extractor and placed in a 250 mL beaker to be dried in a convective oven at 105 °C to dry the thimble until a constant weight was reached. The following formula was used:
C r u d e   f a t   ( % ) = M 2 M 1 M × 100
where M1 is the weight of the dry thimble (g), M2 is the weight of the thimble and extracted fat (g), and M is the weight of the sample (g).
Protein content. A mixture of 0.2 g of sample and 2 g of Kjeldahl catalyst was placed in a Kjeldahl flask, and 5 mL of sulfuric acid (H2SO4) (95–98%) was added and subjected to digest until a light blue color was obtained. The solution was allowed to cool, and 10 mL of distilled water was added. Subsequently, 15 mL of a solution of boric acid (H3BO3) (4% w/v) and 2 drops of methyl red indicator were added. Using a dispenser, a solution of NaOH (40% w/v) was added, then the Kjeldahl flask was introduced into the distillation equipment. The distillate was collected up to 150 mL of the total volume, and a green coloration was obtained in the solution of the flask. Then, titration was performed with a standard solution of HCl (0.1 N).
K j e l d a h l   n i t r o g e n   % = V × N × 14.01 W × 10
C r u d e   p r o t e i n   ( % ) = K j e d a h l   n i t r o g e n   ( % )   × F
where V is the volume of HCL (mL) used to titrate, N is the normality of the standard solution of HCL, 14.01 is the atomic weight of nitrogen, W is the weight of the sample (g), 10 is the factor to convert mg/g to percent, and F (F = 5.30) is the factor to convert N to protein [23].

2.3. Carbonization Process

The carbonization process was conducted in a Thermo Fisher Scientific, Thermolyne oven (model 46100) Scientific (Waltham, MA, USA). 4 g of CMF was placed in a previously weighted porcelain capsule and the carbonization process was performed in a high temperature oven, Thermolyne 46100. The carbonization temperature was 300 °C for 5 min with an argon (Ar) gas flow rate of 30 cm3/min. After cooling to 30 °C, the porcelain capsule was transferred to a desiccator for weighing. This procedure was repeated five times to determine the carbonization yield using the following equation:
Y i e l d   ( % ) = 1 w i w f w f   × 100
where wi is the initial weight of the CMF and wf is the final weight of the CMF after carbonization.

2.4. Chemical Activation Procedure

Solutions of H3PO4 at concentrations of 0%, 20%, 40%, 60%, and 80% v/v were prepared. 5 g of carbonized CMF was placed in porcelain capsules, and 15 mL of H3PO4 solution was individually added. The samples were left to soak at room temperature overnight, and then they were placed in a high-temperature oven and heated up to 100 °C for 2 h. Subsequently, the temperature was increased to 400 °C for 3 h. The sample was then cooled to 45 °C and placed into a desiccator to determine the weight of the sample, and at least three replicates were performed. Afterwards, the samples were washed with distilled water until they reached neutrality to remove the acid residue, until a pH of 7 was reached. Subsequently, the samples were dried in a convection oven at 110 °C for 24 h.

2.5. Physicochemical Characterization of AC

The structural characterization of activated carbon (AC) samples was conducted using Fourier transform infrared (FTIR) spectroscopy. This was performed with the smart diffuse reflectance FTIR accessory on a Thermo Nicolet™ spectrophotometer, model Nexus 670-FTIR (Madison, WI, USA). The FTIR spectra were obtained with a resolution of 4 cm−1 over a range of 4000 to 400 cm−1, and 100 scans.
Thermal characterization of both inactivated and activated carbon from CMF at different concentrations of H3PO4 solution was performed using Thermogravimetric Analysis (TGA). A Discovery TGA balance model from TA-Instruments (New Castle, DE, USA) was used in this analysis. Approximately 10 mg of each sample was individually weighed and heated from room temperature (25 °C) to 600 °C, at a heating rate of 10 °C/min and under an inert atmosphere of nitrogen gas (N2).
The determination of specific surface area and microporosity was determined by the BET (Brünauer, Emmett, and Teller) method. A 10 mg of AC was placed in a sample holder and degassed at 150 °C under a reduced pressure of 2 mm Hg overnight. Surface parameters were obtained through nitrogen adsorption at 77 °K (−196.15 °C) and at a pressure of 5 × 10⁻⁷ Pa, using BELSORP-Max equipment (Tokyo, Japan), and the analysis was performed using the MEL Master program.
Morphological characterization of the inactivated and activated carbon was performed using a JEOL model JSM-7600F (Peabody, MA, USA) field emission scanning electron microscope (FESEM). The elemental analysis was performed using energy dispersive X-ray spectroscopy (EDS) on an Oxford INCA analyzer (Abingdon, UK).

2.6. Statistical Analysis

The findings of the experiments were statistically analyzed using descriptive analysis and the mean and standard deviation of the calculated variable. NCSS 12 statistical software was used for statistical analysis (NCSS, LLC, Kaysville, UT, USA). To find significant differences in the concentrations of H3PO4 solutions, a one-way analysis of variance (ANOVA) at p < 0.05 was used. Mean values were compared using Tukey’s post hoc method at a significance level of 0.05 when significant differences were observed.

3. Results

3.1. Proximal Analysis of CMF

The results of proximal characterization for CMF are presented in Table 1. The CMF samples showed an average moisture content of 8.67%, volatile matter of 77.54%, and ash value of 5.12%. These results indicate slightly higher moisture content and slightly lower ash, extractables, and protein levels compared to the values reported by Rincón et al. [24].

3.2. Characterization of AC

3.2.1. Yield of Carbon from the Carbonization Process

According to the results in Table 1, the carbon yield produced by the procedure developed in this work is 49.38%, which is comparable to yields reported in the literature [25,26].

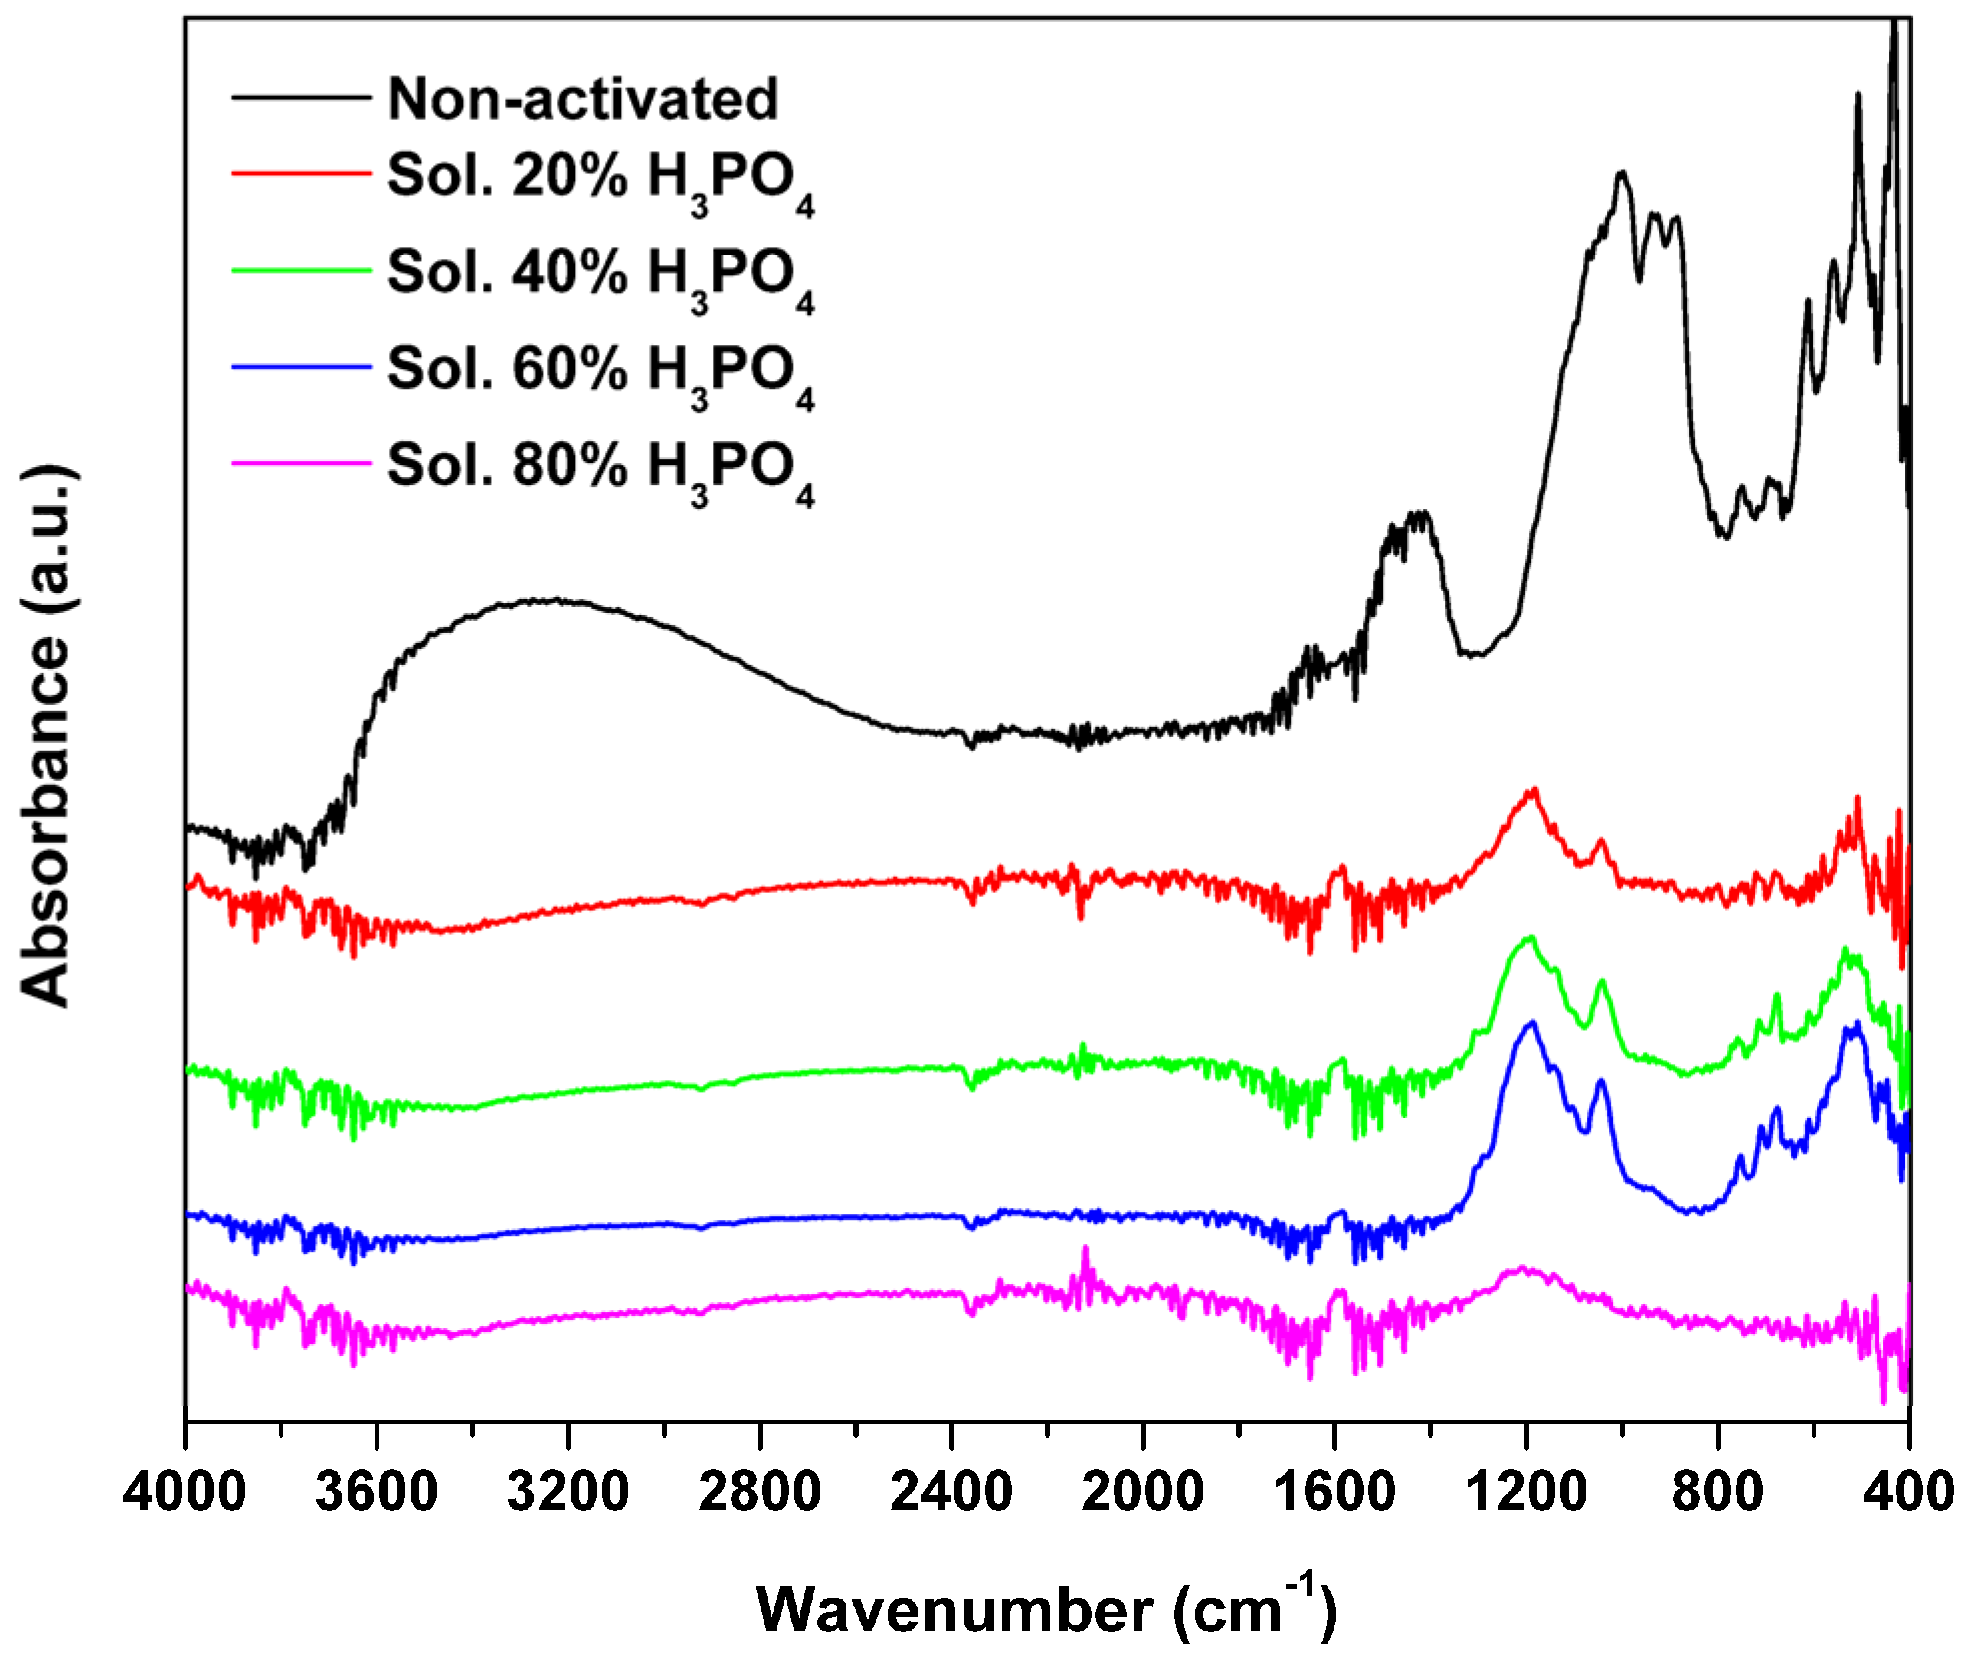
3.2.2. Structural Characterization

The functional groups of activated and non-activated carbon obtained from CMF can be determined by Fourier transform infrared (FTIR) spectroscopy. Figure 2 shows the spectra of both the non-activated carbon and the carbon activated with H3PO4 solutions from 0 to 80% v/v. The characteristic absorption bands of the inactivated and activated carbon from CMF appear in the region of 3300 to 2924, 1616, 1433, and between 1223 and 915 cm−1 and are summarized in Table 2.

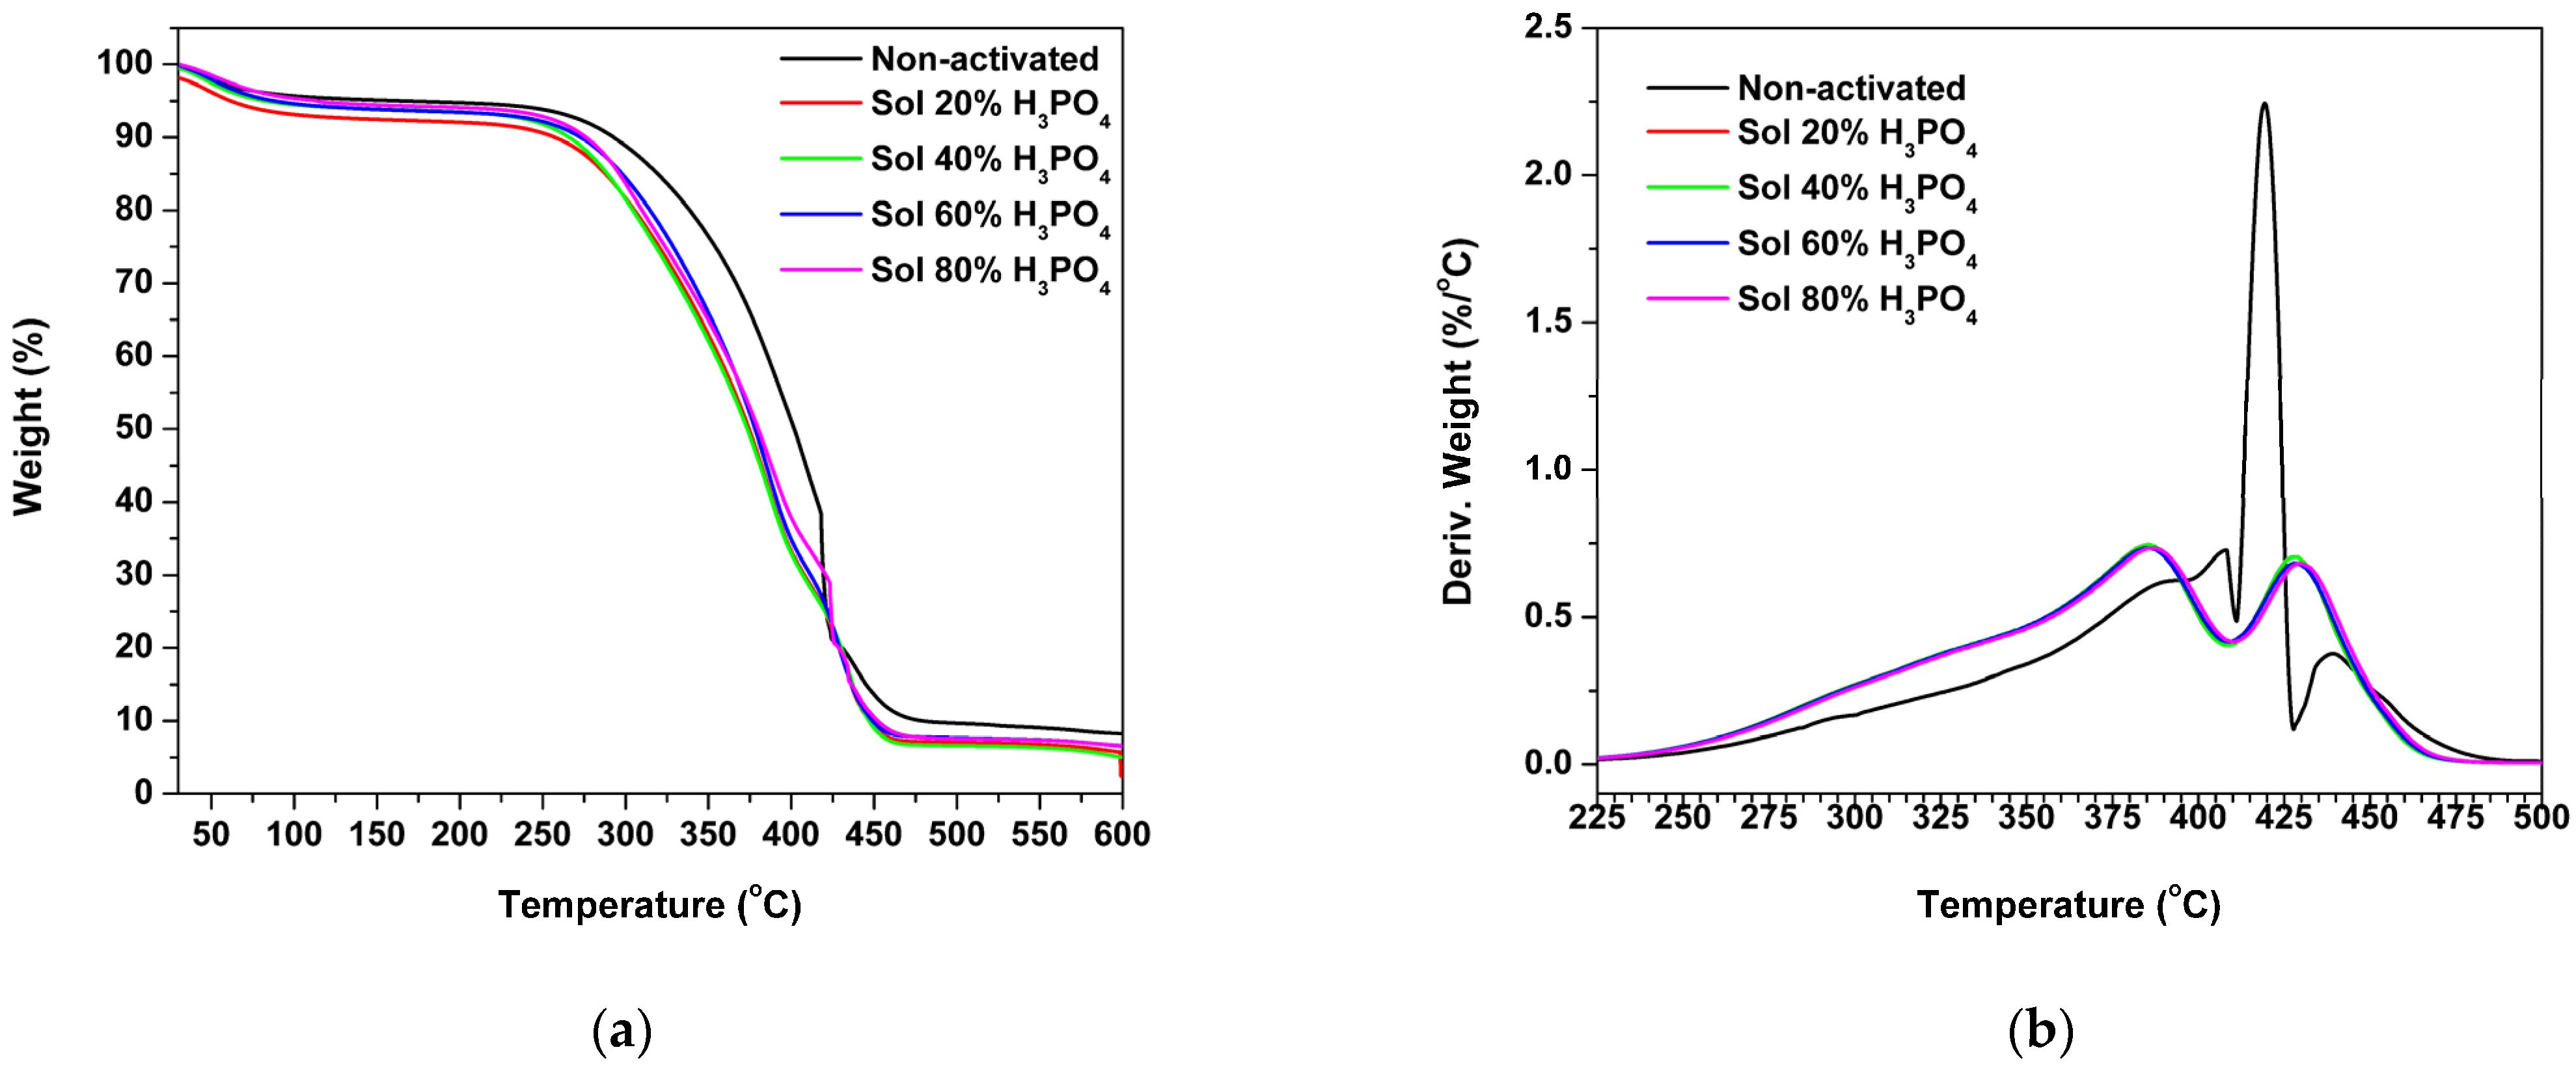
3.2.3. Thermal Characterization

Figure 3 shows the TG and DTG thermograms of carbon samples from CMF (inactivated) and H3PO4-activated carbon. The TG thermograms (Figure 3a) indicate that the initial weight loss is due to the release of moisture present in the samples, which starts before 50 °C and ends shortly after 125 °C. Subsequently, a noticeable inflection can be observed in the thermograms, corresponding to a higher mass loss in all samples. This inflection begins at 232 °C for non-activated carbon, whereas for activated carbon, it is at 203 °C, indicating that non-activated carbon has better thermal stability. The temperature range in which the highest mass loss of the samples occurs ranges from 223 to 482 °C, with ash formation in the samples registered at 600 °C. The weight loss for activated carbon was approximately 89.37%, compared to 84.418% for the non-activated carbon. At 600 °C, the ash content was measured at 5.29% and 8.31% for activated and non-activated carbon, respectively. Figure 3b presents the DTG results of both inactivated and H3PO4-activated carbon. The decomposition of the samples occurs in two stages. The first stage occurs between 245 °C and 412 °C, reaching a maximum decomposition temperature at 392 °C and 378 °C for non-activated and activated carbon, respectively. A second stage is observed between 415 °C and 483 °C, where the maximum temperature of decomposition is observed at 418 °C and 428 °C for non-activated and activated carbon, respectively. While both types of carbons exhibit similar decomposition temperatures during the first stage of decomposition. However, the second stage revealed that the decomposition temperature of activated carbon is slightly higher than that of non-activated carbon, which means that the activated carbon is suitable to be applied as an adsorbent since it has high thermal stability.

3.2.4. Surface Properties

The adsorption properties of activated carbon depend on its surface area and pore distribution. Therefore, the size of the pores that develop during the activation process with H3PO4 plays an important role in adsorption [27]. The surface area (As,BET) and total pore volume (VT,pore) of the activated carbon showed an increase with H3PO4 concentration, reaching maximum values at a H3PO4 concentration of 60% v/v (Table 3). This increase is attributed to the interaction between the activating agent (H3PO4) and the carbon from CMF. The BET nitrogen adsorption isotherms of the analyzed samples are presented in the Supplementary Material (Figures S1–S5).

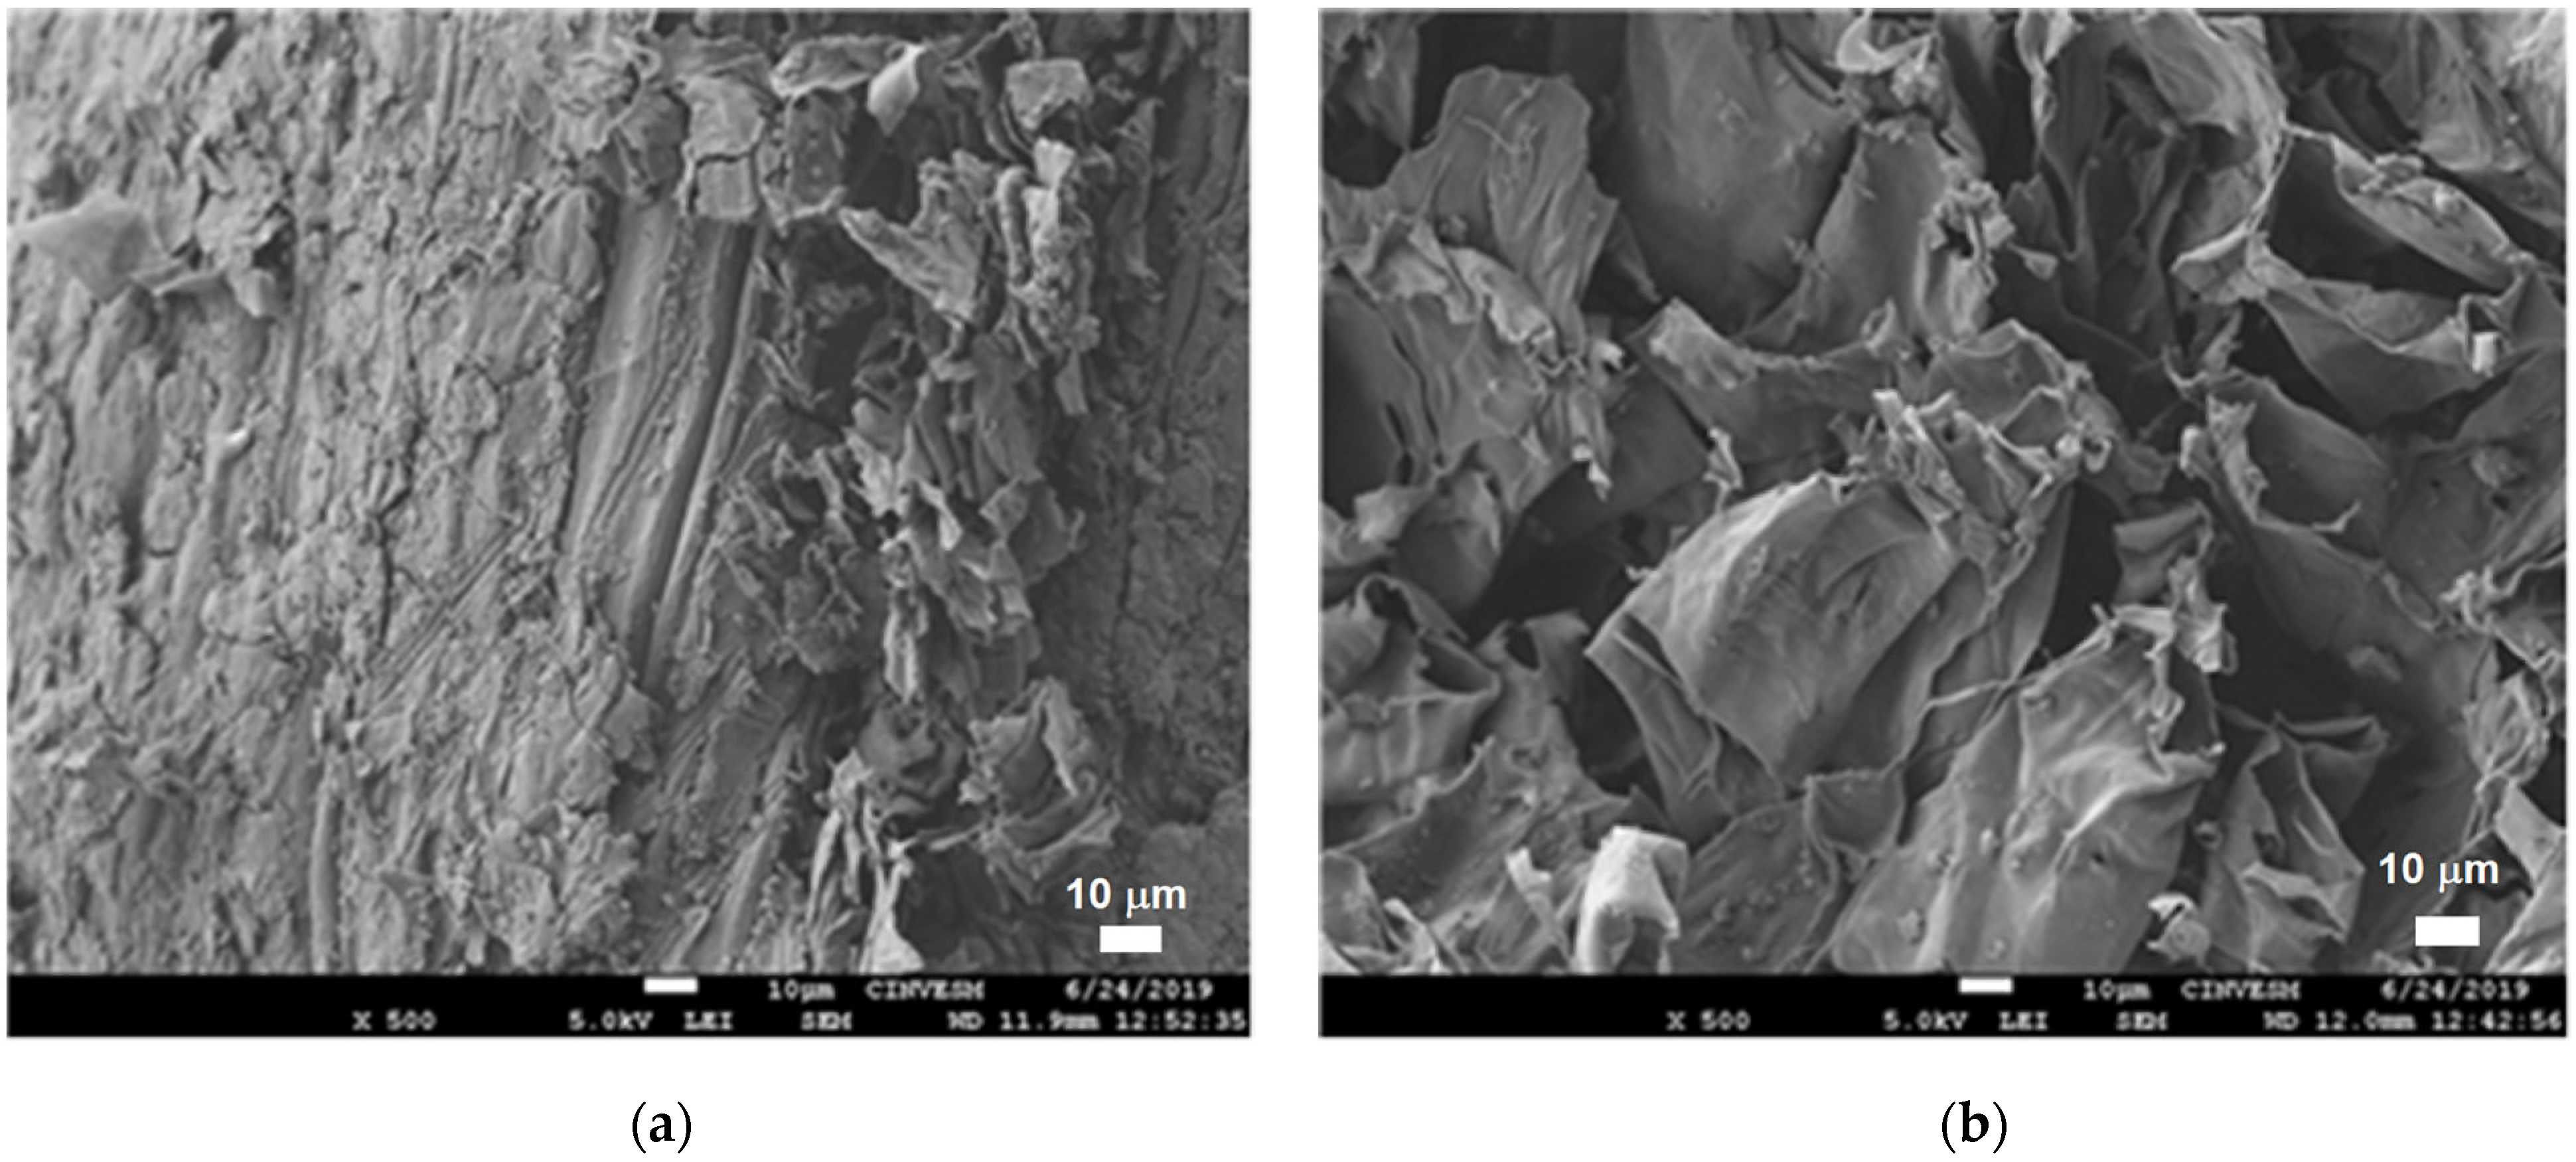
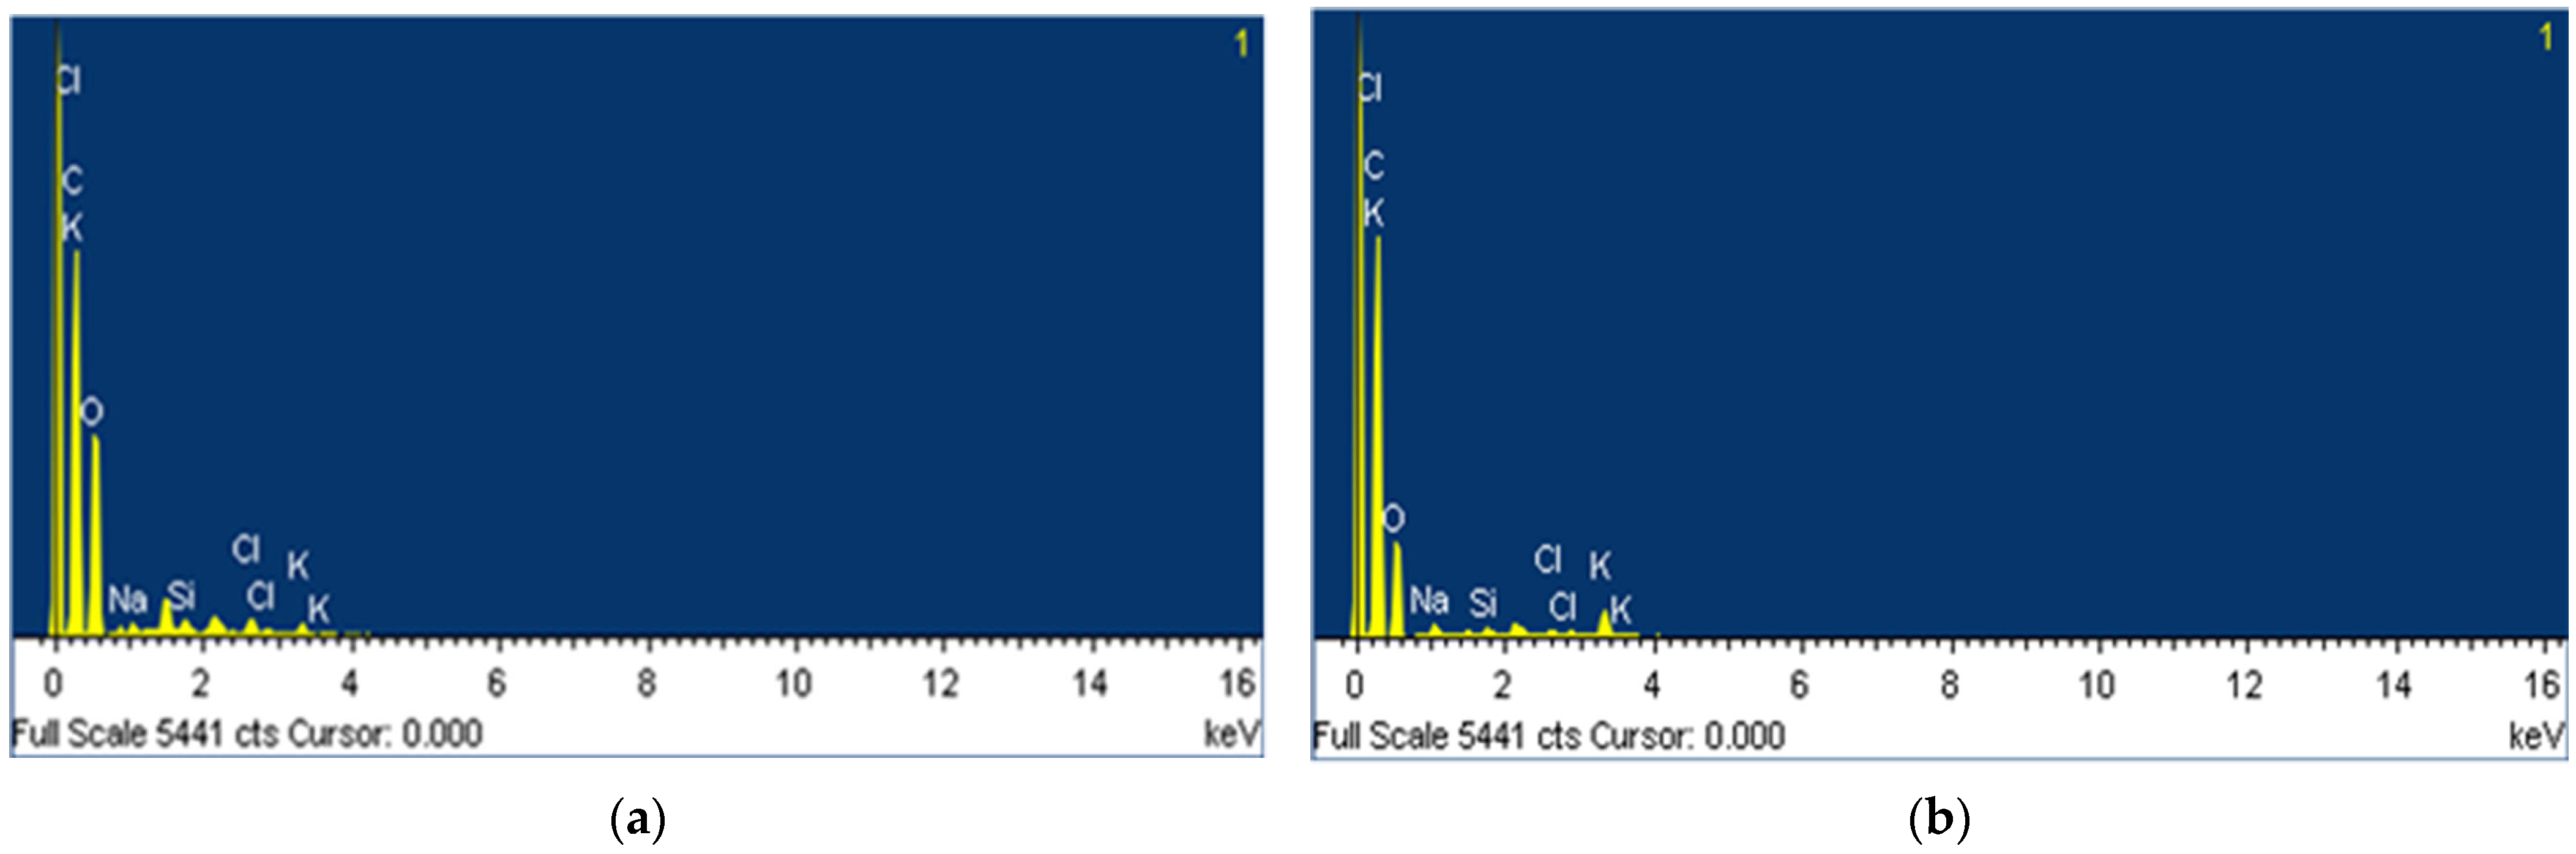
3.2.5. Morphological Characterization and Elemental Composition

The scanning electron microscopy technique was used to observe the morphology of the activated and non-activated carbon from CMF. Figure 4 shows the micrographs of the inactivated and activated carbon treated with a solution of H3PO4 at 60% v/v. Figure 4a corresponds to non-activated carbon, which shows a compact structure with carbonized impurities on the surface, which remained after the incineration process. These impurities consist of the tissue of the fibers, which corresponds to carbon from the lignin and hemicellulose present in CMF. In contrast, the activated carbon presents uniform and lamellar-shaped microstructures, without impurities or aggregates, resulting in a smooth surface with cavities on the external surface (Figure 4b). These micrographs reveal the effective function of H3PO4 as an activating agent, which has reacted (oxidized and eroded) the hydrocarbons (tar) and other compounds on the carbon surface of the CMF. The carbonization and activation process with H3PO4 effectively removed volatiles and impurities, forming a lamellar structure in the activated carbon, characterized by smooth surfaces and cavities.
The elemental analysis performed by energy dispersive spectroscopy (EDS) on inactivated and activated carbon micrographs allowed the analysis of changes in elemental content. The results in Table 4 demonstrate that the non-activated carbon has a higher oxygen content, indicating that this element is present in carbonized impurities. After the activation process, the carbon content increased while the oxygen content decreased. Traces of minerals detected in the analysis (Na, K, Ca, Si, Cl, and Mg) are from CMFs from soil absorption during growth. They are unusual for the porous surface of activated carbon.
Figure 5 presents the energy spectra of the non-activated (Figure 5a) and activated (Figure 5b) carbon. Both carbon samples show different carbon and oxygen contents. Other elements present are Na, Si, Cl, and K because the raw material contains traces of these elements. The spectra of both samples show that the bands of the spectrum correspond to the elements of C, O, Cl, K, Na, and Si. Both spectra have shown a change in the intensity of their bands, indicating a change in the composition of the materials after the activation process.

4. Discussion

The proximal analysis results also differ from dry coconut shells characterized by Satheesh et al. [28], which reported moisture and ash values of 0.609% and 68.5%, respectively. The CMF exhibited average extractive and protein contents of 0.93% and 4.13%, respectively (Table 1), which are higher than the values reported by Shamim et al. [29]. However, the extractables value was significantly lower than the 12.1% reported by Carre et al. [30], who analyzed the Malaysian Tall coconut variety. The discrepancies in these values can be attributed to the specific part of the coconut fruit studied, the coconut variety, and its degree of maturity. Another important aspect to consider when using CMF as an activated carbon precursor is its fixed carbon content and relatively low amount of ash [31].
The carbon yield derived from agro-industrial waste through carbonization processes has been extensively documented in the literature. Bergna et al. [32] observed notably high yields for pre-carbonized birch wood chips, reporting 62.6% after 2 h and 43.9% after 4 h. Similarly, Gratuito et al. [33] documented an average carbon yield of 51% from dry coconut shells. In comparison, the yield obtained in this study (49.38%) exceeds that reported by Wang et al. [32,33,34], who achieved a yield of 36.9% for mesoporous activated carbon derived from coconut shells using H3PO4 as an activating agent under optimized conditions via orthogonal experimental design. These findings underscore coconut mesocarp fibers’ relatively high carbonization efficiency (CMFs) among biomass-derived precursors.
Phosphoric acid (H3PO4) serves as a multifunctional agent in activated carbon (AC) synthesis, acting as a dehydrating agent, crosslinker, and pore-forming activator. The activation mechanism proceeds through distinct thermally driven stages: Initially, at low temperatures (100–250 °C), H3PO4 induces dehydration and hydrolysis, breaking down hemicellulose and cellulose to release water and volatile organics while catalyzing bond cleavage (e.g., C–O–C in lignocellulose), thereby reducing tar formation and improving carbon yield. As temperatures rise to 250–400 °C, H3PO4 promotes crosslinking through phosphate ester (C–O–P) formation, stabilizing the carbon framework while concurrently facilitating aromatization to enhance graphitic domains and mitigate structural shrinkage. At higher temperatures (400–600 °C), H3PO4 decomposes into polyphosphates that etch the carbon matrix, generating a bimodal pore system of micropores and mesopores; subsequent acid removal by washing yields an open pore network with surface areas reaching ~2000 m2/g. Additionally, residual phosphorus-containing groups (P=O, P–O–C) impart surface acidity and catalytic functionality, optimizing the AC for adsorption of metals or organic pollutants. At 400–600 °C, H3PO4 decomposes into polyphosphates that etch the carbon matrix, resulting in a bimodal pore system of micropores and mesopores. Acid removal by washing provides an open pore network with surface areas exceeding ~2000 m2/g. Furthermore, the remaining phosphorus-containing groups (P=O, P–-O–-C) contribute to the AC’s surface acidity and catalytic activity, enhancing its ability to adsorb metals or organic contaminants. Heidarinejad et al. [35] found H3PO4-derived AC had broader pore size distributions than KOH-activated carbon, making it superior for dye adsorption. Neme et al. [36] showed ZnCl₂ creates more mesopores but leaves toxic residues, whereas H3PO4 offers cleaner synthesis.
The broad absorption band presented in the spectrum of the non-activated carbon spanning from 3435 cm−1 to 3095 cm−1 (Figure 2) is attributed to the stretching vibration of the O-H bond (intermolecular hydrogen bonding). A slight band at 2920 cm−1 is assigned to the asymmetric stretching vibrations of the C-H bond [37]. In contrast, the spectra of activated carbon do not exhibit these absorption bands. Nevertheless, the C–C vibrations in aromatic rings produced activated carbons’ spectra that exhibited a band at 1600–1580 cm−1. In particular, they do show a stretching vibration of the C=C bond of the aromatic ring, giving rise to the band at 1616 cm−1, along with a C=C stretching band at 1573 cm−1. The region between 1300 and 1000 cm−1 shows broad bands associated with functional groups containing phosphorus and oxygen. The band observed at 1230 cm−1 in the spectra of activated carbons shows a gradual increase in intensity as the concentration of H3PO4 increases. It is attributed to the P=O bond in phosphate esters and aromatic phosphates (P-O-C stretch) [38]. The signal at 1115 cm−1 is attributed to the stretching vibration of the C-O bond [39], which is more intense in activated carbon samples because the C-O component of alcohol is converted to the corresponding ether. In addition, the FTIR spectrum of non-activated carbon presents an absorption band at 885 cm−1, which is attributed to the bending vibration of the C-H bond at a high degree of substitution in the aromatic ring [36,37,38,39,40]. These results suggest that the carbonization of coconut fibers has formed an aromatic ring. Previous studies have reported similar results in the FTIR spectrum of activated carbon derived from orange peel prepared from styrene-divinylbenzene at 1000 °C by activation with H3PO4 [40]. The main changes induced by high acid concentration are the appearance of C–H vibrational modes (caused by the carbon matrix’s surface oxygen being reduced) and an increase in phosphorus-containing functional groups (indicated by the band at about 1100 cm−1). Generally, carbonized CMF may contain hydroxyl (-OH), -CH2- or -CH3, C=C, C-O and other functional groups, and H3PO4-activated CMF carbon may contain hydroxyl, -CH2- or -CH3, C=C, C-O and an increased degree of substituted aromatic ring, along with other chemical groups.
The TG and DTG analysis of inactivated and H3PO4-activated carbon derived from coconut mesocarp fibers (CMF) provides valuable insights into their thermal stability and decomposition behavior (Figure 3a,b). The initial weight loss before 125 °C in both samples corresponds to moisture release, a common feature in lignocellulosic materials [41]. A significant mass loss occurs between 223–482 °C, primarily due to the decomposition of hemicellulose, cellulose, and lignin [42]. For non-activated carbon, decomposition begins at 232 °C, while in activated carbon, it starts at 203 °C, suggesting better thermal stability in the inactivated sample. However, activated carbon exhibits a higher overall weight loss (89.37%) than non-activated carbon (84.42%), likely due to the enhanced porosity created by H3PO4 activation, which facilitates the release of volatiles. The ash content at 600 °C is lower for activated carbon (5.29%) than for non-activated carbon (8.31%), indicating effective removal of inorganic components during activation [43]. The DTG thermograms reveal a two-stage decomposition process. The first stage (245–428 °C) involves primary degradation, with peak decomposition temperatures at 392 °C (inactivated) and 378 °C (activated). The second stage (396–483 °C) shows a shift, with activated carbon decomposing at a higher temperature (428 °C vs. 418 °C), signifying enhanced thermal stability due to structural modifications by activation [41]. In general, the high thermal resistance of activated carbon confirms its suitability for high-temperature adsorption applications. The phosphoric acid activation process is crucial in modifying the carbon matrix, optimizing it for environmental remediation, gas separation, and liquid-phase adsorption applications.
The change in mesopore volume was significant with the addition of the activating agent, suggesting that the increase in micropores is benefited by the volatilization of the compounds of CMF during thermal activation (Table 2). Both thermal and chemical activation contribute to the formation of these structures. Some authors have reported the formation of microporous carbon by temperature activation [44,45]. Gonzalez-Serrano et al. [46] have reported that the activation of carbon from lignin, activated by H3PO4, is due to the lignin content. These results suggest that the development of porous structures in the carbon from CMFs occurs due to their high lignin content (19.38%) [24]. Regarding the pore diameter (ϕpore), this value is significantly reduced in the carbon activated with H3PO4 compared to the non-activated carbon. The ϕpore values of the activated carbons are slightly higher than those reported by Achari et al. [47], who described granular activated carbon from coconut shell using zircon chloride (ZnOCl2) and activated at superheated steam flow. Their BET analysis revealed that the non-activated carbons are microporous, with ϕpore in the range of 8.10 to 8.24 nm. According to Branton and Bradley [48], the main factors for selecting an active carbon are pore size distribution and ϕpore. In this sense, the VT,pore, and ϕpore values of the activated carbon from CMF are fairly similar to those of other activated carbon from coconut reported in the literature [25,26].
The morphology of activated carbon from CMFs (Figure 4b) has shown a similar structure to that of activated carbon from coconut shell [49] and olive stone [50], where both studies used H3PO4 as the activating agent. The activated carbon particles with this lamellar structure form a porous network within the particles, and this porous structure contributes to the adsorption of gases [51]. An important aspect is that the activated carbon has increased the purity of the carbon by 9.04% (Figure 5 and Table 3), which benefits the adsorption capacity of the activated carbon, because the higher the purity of the carbon, the higher the adsorption power of the carbon. The oxygen content in the activated carbon decreases after activation (Table 3), which is due to the partial decomposition of oxygen by temperature treatment during activation. Similar characteristics have been reported by Zhang et al. [40] in carbon fibers of coconut.

5. Conclusions

This work demonstrated the synthesis of activated carbon (AC) from coconut mesocarp fibers (CMFs) via phosphoric acid (H3PO4) activation, revealing that it is a promising and sustainable precursor for adsorption applications. The carbonization method produced 49.38% fixed carbon from CMFs compared to prior studies on coconut shell-derived carbon (36.9–51%), demonstrating CMF’s efficiency as a precursor. The carbon output is due to CMF’s advantageous lignocellulosic composition, particularly the 19.38% lignin content, which improves thermal stability and pore formation.
A bimodal pore system with a BET surface area greater than 2000 m2/g and a mixture of micropores and mesopores was produced by effective H3PO4 activation. The chemical and thermal changes brought about by activation were validated by FTIR and TG-DTG studies. These changes included the production of phosphate esters (P=O, P–O–C) and increased thermal stability, as evidenced by shifts in decomposition from 392 °C (non-activated) to 428 °C (activated). The purity and adsorptive capacity of the finished product were further confirmed by the decrease in ash and oxygen content (5.29% vs. 8.31% in non-activated carbon). Similar to AC obtained from coconut shells and other agroindustrial wastes, the AC’s morphology showed a lamellar porous structure, with pore sizes (~8.10–8.24 nm) suitable for gas and liquid-phase adsorption. The 9.04% improvement in carbon purity after activation demonstrates the process’s effectiveness in improving surface functionality.
A practical and sustainable method of creating high-performance activated carbon that offers excellent adsorption capacity and valorizes agricultural waste is demonstrated by the high carbon yield, remarkable surface area, and customized pore structure attained through H3PO4 activation of CMFs.

Supplementary Materials

The following supporting information can be downloaded at: https://www.mdpi.com/article/10.3390/chemistry7030088/s1, Figure S1: BET nitrogen adsorption isotherm of non-activated carbon; Figure S2: BET nitrogen adsorption isotherm of AC with sol. 20% H3PO4 (code M6.dat); Figure S3: BET nitrogen adsorption isotherm of AC with sol. 40% H3PO4 (code M4.dat); Figure S4. BET nitrogen adsorption isotherm of AC with sol. 60% H3PO4 (code M7.dat); Figure S5. BET nitrogen adsorption isotherm of AC with sol. 80% H3PO4 (code M9.dat).

Author Contributions

Conceptualization, G.R.C.M. and T.J.M.-S.; methodology, J.A.A.-B.; formal analysis, G.R.C.M. and T.J.M.-S.; investigation, T.J.M.-S.; resources, P.Q.-O. and J.A.A.-B.; data curation, W.S.G.-G. and V.R.-M.; writing—original draft preparation, T.J.M.-S.; writing—review and editing, G.R.C.M.; visualization, J.A.A.-B. and P.Q.-O.; supervision, T.J.M.-S.; project administration, G.R.C.M.; funding acquisition, G.R.C.M. All authors have read and agreed to the published version of the manuscript.

Funding

This research was supported by Consejo Nacional de Ciencia y Tecnología-CONACYT FORDECYT-project No. 296195.

Data Availability Statement

Data will be available as requested.

Acknowledgments

S.A. Cauich Moo and J.L. Cortes for their technical assistance. Part of this work was developed in the facilities of the National Laboratory of Nano Biomaterials (LANNBIO) of CINVESTAV Unidad Mérida as part of project FOMIX-Yucatán 2008-108160, CONACYT LAB-2009-01-123913, 292692, 294643, and 299083. This work was developed with financial support from CONACYT FORDECYT project No. 296195.

Conflicts of Interest

The authors declare no conflicts of interest.

References

  1. Wall, J.D.; Hardwood, C.S.; Demain, A.L. Bioenergy; ASM-Press: Washington, DC, USA, 2008; pp. 3–472. [Google Scholar] [CrossRef]
  2. Zhang, Y.; Song, X.; Xu, Y.; Sheng, H.; Kong, X.; Xu, H. Utilization of wheat bran for producing activated carbon with high specific surface area via NaOH activation using industrial furnace. J. Clean. Prod. 2019, 210, 366–375. [Google Scholar] [CrossRef]
  3. Rethinam, P. International scenario of coconut sector. In The Coconut Palm (Cocos nucifera L.)-Research and Development Perspectives, 1st ed.; Nampoothiri, K.U.K., Krishnakumar, V., Thampan, P.K., Achuthan Nair, M., Eds.; Springer Nature: Singapore, 2018; pp. 21–56. [Google Scholar] [CrossRef]
  4. Zizumbo-Villarreal, D.; Fernández-Barrera, M.; Torres-Hernández, N.; Colunga-García, P. Morphological variation of fruit in mexican populations of Cocos nucifera L. (Arecaceae) under in situ and ex situ conditions. Genet. Resour. Crop Evol. 2005, 52, 421–434. [Google Scholar] [CrossRef]
  5. Xiao, Y.; Xu, P.; Fan, H.; Baudouin, L.; Xia, W.; Bocs, S.; Xu, J.; Li, Q.; Guo, A.; Zhou, L.; et al. The genome draft of coconut (Cocos nucifera). GigaScience 2017, 6, 1–11. [Google Scholar] [CrossRef] [PubMed]
  6. Alvarado, K.; Blanco, A.; Taquechel, A. Fibra de coco. Una alternativa ecológica como sustrato agrícola. Agric. Org. 2008, 8, 30–31. [Google Scholar]
  7. Faridul Hasan, K.M.; György Horváth, P.; Bak, M.; Alpár, T. A state-of-art review on coir fiber-reinforced biocomposites. RCS Adv. 2021, 11, 10548–10571. [Google Scholar] [CrossRef]
  8. Yahya, A.; Safie, H.; Kahar, S. Properties of coco peat-based growing media and their effects on two annual ornamentals. J. Trop. Agric. Food Sci. 1997, 25, 151–157. [Google Scholar]
  9. Gupta, M.; Kumar, M. Effect of nanosilica and coir fiber on compressive strength and abrasion resistance on concrete. Constr. Build. Mater. 2019, 226, 44–50. [Google Scholar] [CrossRef]
  10. Abraham, D.P.R.; Josephc, A.; Jasheelad, A.; Sarma, J. Development of coir-fibre cement composite roofing titles. Procedia Technol. 2016, 24, 169–178. [Google Scholar] [CrossRef]
  11. Anirudhan, T.; Unnithan, M. Arsenic (V) removal from aqueous solutions using an anion exchanger derived from coconut coir pith and its recovery. Chemosphere 2007, 61, 60–66. [Google Scholar] [CrossRef]
  12. Carlile, W.R.; Raviv, M.; Prasad, M. Organic soilless media components. In Soilless Culture. Theory and Practice, 2nd ed.; Raviv, M., Lieth, H., Bar-Tal, A., Eds.; Academic Press: New York, NY, USA, 2019; pp. 303–378. [Google Scholar] [CrossRef]
  13. Das, D.; Samal, D.P.; Meikap, B.C. Preparation of activated carbon from green coconut shell and its characterization. J. Chem. Eng. Proc. Technol. 2015, 6, 248. [Google Scholar] [CrossRef]
  14. Aljeboree, A.M.; Alkaim, A.F.; Al-Dujaili, A.H. Adsorption isotherm, kinetic modeling and thermodynamics of crystal violet dye on coconut husk-based activated carbon. Desalin. Water Treat. 2015, 53, 3656–3667. [Google Scholar] [CrossRef]
  15. Palisoc, S.T.; Estioko, L.C.D.; Natividad, M.T. Voltametric determination of lead and cadmium in vegetables by graphene paste electrode modified with activated carbon from coconut husk. Mater. Res. Express. 2018, 5, 085035. [Google Scholar] [CrossRef]
  16. Taer, E.; Naipospos, V.M.; Taslim, R.; Agustino, A. Activated carbon monolith derived from coconut husk fiber as electrode material for supercapacitor energy storage. J. Phys. Conf. Ser. 2020, 1655, 012164. [Google Scholar] [CrossRef]
  17. Momodu, D.; Okafor, C.; Manyala, N.; Bello, A.; Gaetan, M.; Kana, Z.; Ntsoenzok, E. Transformation of plant biomass waste into resourceful activated carbon nanostructures for mixed-assembly type electrochemical capacitors. Waste Biomass Valori. 2019, 10, 1741–1753. [Google Scholar] [CrossRef]
  18. Húmpola, P.; Odetti, H.; Moderno-Pirajan, J.C.; Giraldo, L. Activated carbons obtained from agro-industrial waste: Textural analysis and adsorption environmental pollutants. Adsorption 2016, 21, 23–31. [Google Scholar] [CrossRef]
  19. Transparency Market Research. Coconut Activated Carbon Market-Global Industry Analysis, Size, Share, Growth, Trends, and Forecast, 2019–2027. Albany NY, USA. Available online: https://www.transparencymarketresearch.com/coconut-activated-carbon-market.html (accessed on 21 May 2025).
  20. Budinova, T.; Ekinci, E.; Yardim, F.; Grimm, A.; Björnbom, E.; Minkova, V. Characterization and application of activated carbon produced by H3PO4 and water vapor activation. Fuel Process. Technol. 2016, 87, 899–905. [Google Scholar] [CrossRef]
  21. Vidal, M.V.; Rodriguez Suarez, A.; Martinez Barrios, K.; Ocampo Perez, J.; Barrios Lara, W. Potential of agroindustrial waste for the synthesis of activated carbon: A review. Sci. Tech. 2018, 23, 411–419. [Google Scholar] [CrossRef]
  22. Tay, T.; Ucar, S.; Karagöz, S. Preparation and characterization of inactivated carbon from waste biomass. J. Hazard. Mater. 2009, 165, 481–485. [Google Scholar] [CrossRef]
  23. Thiex, N.J.; Manson, H.; Anderson, S.; Persson, J.A. Determination of crude protein in animal feed, forage, grain and oilseeds by using block digestion with copper catalyst and steam distillation into boric acids: Collaborative study. J. AOAC Int. 2002, 85, 309–317. [Google Scholar] [CrossRef]
  24. Rincón, J.F.; Rincón, P.G.; Torres, E.; Mondragón, A.G.; Sánchez, M.E.; Arana, A.; Ortiz, A.; Jiménez, E. Caracterización fisicoquímica y funcional de la fibra de coco de mesocarpio de coco (Cocos nucifera L.). Investig. Desarro. Cienc. Tecnol. Aliment. 2016, 1, 279–284. [Google Scholar]
  25. Ram Patel, M.; Lal Panwar, N. Biochar from agricultural crop residues: Environmental, production, and life cycle assessment overview. Resour. Conserv. Recyc. Adv. 2023, 19, 200173. [Google Scholar] [CrossRef]
  26. Alvez-Tovar, B.; Scalize, P.S.; Angiolillo-Rodríguez, G.; Albuquerque, A.; Ebang, M.N.; de Oliveira, T.F. Agro-industrial waste upcycling into activated carbons: A sustainable approach for dye removal and wastewater treatment. Sustainability. 2025, 17, 2036. [Google Scholar] [CrossRef]
  27. McDougall, G.J. The physical nature and manufacture of activated carbon. J. S. Afr. Inst. Min. Metall. 1991, 91, 109–120. [Google Scholar]
  28. Satheesh, M.; Pugazhvadivu, M.; Prabu, B.; Gunasegaran, V.; Manikandan, A. Synthesis and characterization of coconut shell ash. J. Nanosci. Nanotechnol. 2019, 19, 4123–4128. [Google Scholar] [CrossRef] [PubMed]
  29. Shamim, H.M.; Hussain, S.; Al-Mahin, A. Solid-state Fermentation of coconut coir by Pleurotus sajor-caju increases the anti-oxidant properties and nutritional value. Biotechnology 2016, 15, 141–147. [Google Scholar] [CrossRef]
  30. Carre, B.; Hebrant, M.; Brosse, N.; Latif, N.H.A.; Hussin, M.H. Effect of different prehydrolysis processes on lignin extractability coconut husk fibers. J. Phys. Sci. 2019, 30, 207–209. [Google Scholar] [CrossRef]
  31. González-García, P. Activated carbon from lignocellulosics precursors: A review of the synthesis methods, characterization techniques and applications. Renew. Sust. Energy Rev. 2018, 82, 1393–1414. [Google Scholar] [CrossRef]
  32. Bergna, D.; Varila, T.; Romar, H.; Lassi, U. Comparison of properties of activated carbons produced in one-stage and two-stages process. J. Carbon Res. 2018, 4, 41–50. [Google Scholar] [CrossRef]
  33. Gratuito, M.K.B.; Panyathanmaporn, T.; Chumnanklang, R.-A.; Sirinuntawittaya, N.; Dutta, A. Production of activated carbon from coconut shell: Optimization using response surface methodology. Bioresource Technol. 2008, 99, 4887–4895. [Google Scholar] [CrossRef]
  34. Wang, X.; Li, D.; Li, W.; Peng, J.; Xia, H.; Zhang, L.; Guo, S.; Cheng, G. Optimization of mesoporous activated carbon from coconut shells by chemical activation with phosphoric acid. Bioresources 2013, 8, 6187–6195. [Google Scholar] [CrossRef]
  35. Heidarinejad, Z.; Dehghani, M.H.; Heidari, M.; Javedan, G.; Ali, I.; Sillanpää, M. Methods for preparation and activation of activated carbon: A review. Environ. Chem. Lett. 2020, 18, 393–415. [Google Scholar] [CrossRef]
  36. Neme, I.; Gonfa, G.; Masi, C. Activated carbon from biomass precursors using phosphoric acid: A review. Heliyon 2022, 8, e11940. [Google Scholar] [CrossRef] [PubMed]
  37. Xie, Z.; Guan, W.; Ji, F.; Song, Z.; Zhao, Y. Production of biologically activated carbon from orange peel and landfill leachate subsequent treatment technology. J. Chem.-N. Y. 2014, 2014, 491912. [Google Scholar] [CrossRef]
  38. Coates, J. Interpretation of infrared spectra, a practical approach. In Encyclopedia of Analytical Chemistry, 1st ed.; Meyers, R.A., Ed.; John Wiley & Sons Ltd.: Chichester, UK, 2000; pp. 1–23. [Google Scholar] [CrossRef]
  39. Puziy, A.M.; Poddubnaya, O.I.; Martínez-Alonso, A.; Suárez-García, F.; Tascón, J.M.D. Synthetic carbons activated with phosphoric acid: I. Surface chemistry and ion binding properties. Carbon 2002, 40, 1493–1505. [Google Scholar] [CrossRef]
  40. Zhang, L.; Tu, L.-Y.; Chen, Q.; Li, C.-H.; Wang, Z.-H.; Li, W. Coconut-based activated carbon fibers for efficient adsorption of various organic dyes. RSC Adv. 2018, 8, 42280–42291. [Google Scholar] [CrossRef]
  41. Ioannidou, O.; Zabaniotou, A. Agricultural residues as precursors for activated carbon production—A review. Renew. Sust. Energy Rev. 2007, 11, 1966–2005. [Google Scholar] [CrossRef]
  42. Yang, H.; Yan, R.; Chen, H.; Lee, D.H.; Zheng, C. Characteristics of hemicellulose, cellulose and lignin pyrolysis. Fuel 2007, 86, 1781–1788. [Google Scholar] [CrossRef]
  43. Gao, Y.; Yue, Q.; Gao, B.; Li, A. Insight into activated carbon from different kinds of chemical activating agents: A review. Sci. Total Environ. 2020, 746, 141094. [Google Scholar] [CrossRef]
  44. Dastgheib, S.A.; Rockstraw, D.A. Pecan shell activated carbon: Synthesis, characterization, and application for the removal of copper from aqueous solutions. Carbon 2001, 39, 1849–1855. [Google Scholar] [CrossRef]
  45. Guo, Y.; Rockstraw, D.A. Physicochemical properties of carbons prepared from pecan shell by phosphoric acid activation. Bioresource Technol. 2007, 98, 1513–1521. [Google Scholar] [CrossRef]
  46. Gonzalez-Serrano, E.; Cordero, T.; Rodriguez-Mirasol, J.; Cotoruelo, L.; Rodriguez, J.J. Removal of water pollutants with activated carbons prepared from H3PO4 activation of lignin from Kraft blank liquors. Water Res. 2004, 38, 3043–3050. [Google Scholar] [CrossRef] [PubMed]
  47. Archari, V.S.; Rajalashmi, A.S.; Jayasree, S.; Lopez, R.M. Surface area and porosity development on granular activated carbon by zirconium: Adsorption isotherm studies. J. Appl. Res. Technol. 2018, 16, 211–218. [Google Scholar] [CrossRef]
  48. Branton, P.; Brodley, R.H. Effects of active carbon pore size distributions on adsorption of toxic organic compounds. Adsorption 2011, 17, 293–301. [Google Scholar] [CrossRef]
  49. Laine, J.; Calafat, A.; Labady, M. Preparation and characterization of activated carbons from coconut shell impregnated with phosphoric acid. Carbon 1989, 24, 191–195. [Google Scholar] [CrossRef]
  50. Yakout, S.M.; El-Deen, G.S. Characterization of activated carbon prepared by phosphoric acid activation of olive stones. Arab. J. Chem. 2016, 9, S1155–S1162. [Google Scholar] [CrossRef]
  51. Kennedy, L.J.; Vijaya, J.J.; Kayalvizhi, K.; Sekaran, G. Adsorption of phenol from aqueous solutions using mesoporous carbon prepared by two-stage process. Chem. Eng. J. 2007, 132, 279–287. [Google Scholar] [CrossRef]
Figure 1. Coconut palm (a), native person debarking coconut fruit (b), copra production in a rural community of San Crisanto, Yucatan, Mexico, and structure of a coconut fruit (c).
Chemistry 07 00088 g001
Figure 2. FTIR spectra of non-activated and activated carbon at different H3PO4-concentrations.
Chemistry 07 00088 g002
Figure 3. Thermogram of carbon from non-activated and H3PO4-activated CMF at different concentrations (a), and first derivative of the thermogram (DTG) (b).
Chemistry 07 00088 g003
Figure 4. Micrographs of non-activated carbon (a) and activated carbon with a solution of H3PO4 at 60% v/v (b).
Chemistry 07 00088 g004
Figure 5. Energy dispersive spectroscopy (EDS) analysis of non-activated carbon (a), and activated carbon with a solution of H3PO4 at 60% v/v (b).
Chemistry 07 00088 g005
Table 1. Results of proximate analysis of CMF.
AnalysisValues (d.b.) *
Moisture (%)8.67 ± 0.59
Volatile matter (%)77.54 ± 0.44
Ash (%)5.12 ± 0.24
Extractables (%)0.93 ± 0.06
Crude proteins (%)4.13 ± 0.26
Yield (%)49.38 ± 5.53
* d.b.: dry basis. The values are reported as mean ± standard deviation.
Table 2. Functional groups observed in the FTIR spectra of non-activated and activated carbon from CMF.
Functional GroupNon-Activated Carbon
(cm−1)
Activated Carbon
(cm−1)
O-H stretching3450–3150ND
-CH2950–2800ND
-C=C (aromatic)16351630
C-H bending1545–15601550
C=C16551650
C=O15901605
C-O1210–11601190
C-O-CND1380
P=O
P-O-C stretch
ND1230
Table 3. Determination of surface analysis.
SampleAs,BET
(m2/g)
VT,pore
(cm3/g)
ϕpore
(nm)
Non-activated carbon4.450.0098.18
AC with sol. 20% H3PO4200.980.1683.31
AC with sol. 40% H3PO4680.750.409.2.40
AC with sol. 60% H3PO41580.520.8712.20
AC with sol. 80% H3PO4850.060.4012.31
AC: Activated carbon; As,BET: surface area by BET method; VT,pore: total pore volume; ϕpore: pore diameter.
Table 4. Elements present in the CMF carbon by EDS.
ElementCarbon from CMF
Non-Activated (wt. %)AC with Sol. 60% H3PO4 (wt. %)
C54.8563.89
O41.9030.89
Others3.255.22
Others: Na, Si, Cl, and K.
Disclaimer/Publisher’s Note: The statements, opinions and data contained in all publications are solely those of the individual author(s) and contributor(s) and not of MDPI and/or the editor(s). MDPI and/or the editor(s) disclaim responsibility for any injury to people or property resulting from any ideas, methods, instructions or products referred to in the content.

