Article

Improvements in Gold Nanorod Biocompatibility with Sodium Dodecyl Sulfate Stabilization

1
Department of Nanomedicine, Houston Methodist Research Institute, Houston, TX 77030, USA
2
Department of Electronics, Politecnico di Torino, 10129 Torino, Italy
3
Department of Physics & Astronomy, Rice University, Houston, TX 77005, USA
4
Department of Chemistry, Rice University, Houston, TX 77005, USA
5
Department of Cardiovascular Surgery, Houston Methodist Research Institute, Houston, TX 77030, USA
*
Author to whom correspondence should be addressed.
J. Nanotheranostics 2021, 2(3), 157-173; https://doi.org/10.3390/jnt2030010
Submission received: 15 July 2021 / Revised: 17 August 2021 / Accepted: 23 August 2021 / Published: 26 August 2021
(This article belongs to the Special Issue Exclusive Papers of the Editorial Board Members)

Abstract

:
Due to their well-defined plasmonic properties, gold nanorods (GNRs) can be fabricated with optimal light absorption in the near-infrared region of the electromagnetic spectrum, which make them suitable for cancer-related theranostic applications. However, their controversial safety profile, as a result of surfactant stabilization during synthesis, limits their clinical translation. We report a facile method to improve GNR biocompatibility through the presence of sodium dodecyl sulfate (SDS). GNRs (120 × 40 nm) were synthesized through a seed-mediated approach, using cetyltrimethylammonium bromide (CTAB) as a cationic surfactant to direct the growth of nanorods and stabilize the particles. Post-synthesis, SDS was used as an exchange ligand to modify the net surface charge of the particles from positive to negative while maintaining rod stability in an aqueous environment. GNR cytotoxic effects, as well as the mechanisms of their cellular uptake, were examined in two different cancer cell lines, Lewis lung carcinoma (LLC) and HeLa cells. We not only found a significant dose-dependent effect of GNR treatment on cell viability but also a time-dependent effect of GNR surfactant charge on cytotoxicity over the two cell lines. Our results promote a better understanding of how we can mediate the undesired consequences of GNR synthesis byproducts when exposed to a living organism, which so far has limited GNR use in cancer theranostics.

Graphical Abstract

1. Introduction

As a result of their geometry-dependent, unique surface plasmon properties, gold nanorods (GNRs) have revealed great potential in applications involving imaging, therapy, and biological sensing [1,2,3,4,5]. In fact, among several types of plasmonic metal nanoparticles, including spherical, pyramidal [6,7,8], symmetry breaking [9,10,11,12], or other types of core–shell shaped-nanoparticles, such as nanoshells, refs. [13,14,15] GNRs have a higher light absorption coefficient in the near-infrared (NIR) region of the electromagnetic spectrum (600–900 nm) [16,17,18]. This characteristic permits a broad range of innovative applications where GNRs can be employed as a multifunctional NIR light-mediated platform. For instance, when the longitudinal localized surface plasmon resonance of GNRs is tuned to the NIR, they are able to photothermally induce local cancer cell death after optical excitation [19,20]. At the same time, GNRs act as excellent contrast agents for photoacoustic imaging with long-lasting photothermal stability [21,22] during nanosecond-pulsed NIR laser illumination. This NIR-absorption property has also been investigated for single-particle level detection showing that GNRs can be used as small probes for early cancer diagnosis [23,24].
In addition to their NIR-absorption distinctive properties, researchers have examined GNRs as contrast agents for computed tomography (CT), refs. [25,26] since they exhibit a higher X-ray attenuation coefficient when compared with iodinated contrast agents [27]. To date, iodine is the most commonly used CT contrast agent to enhance contrast resolution in the body, but it results in short blood circulation time and rapid clearance from the kidneys [28]. Several studies demonstrated that gold nanoparticles have prolonged circulation times dependent on their surface chemistry, such that the particles can achieve a CT outcome with good efficiency with retention times in the body longer than other standard contrast agents [29,30,31]. Additionally, gold nanoparticles of different sizes are able to enhance the effects of radiation [32]. All of these characteristics along with the fact that the biological transparency window (~600–1000 nm) coincides with the longitudinal plasmon band of GNRs, ref. [33] make gold nanorods suitable agents to aid in the clinical diagnosis and treatment of cancer with high accuracy and sensitivity, such as through CT-guided photothermal therapy [34,35], photodynamic therapy [36], and cancer radiotherapy [37].
One of the main challenges that limits the clinical translation of GNRs is their controversial safety profile. There is a lack of knowledge concerning the undesired consequences of GNRs or the byproducts associated with their synthesis when they come into contact with a living organism [38]. For instance, the nature of their toxicity is still under debate. The most common approach to synthesize GNRs is to use cetyltrimethylammonium bromide (CTAB) as a growth-directing surfactant, which assembles as a bilayer structure on the GNR surface. CTAB is essential for nanorod growth because it stabilizes the particle size and permits growth into an anisotropic shape, which allows for a tunable surface plasmon mode as a function of aspect ratio. CTAB, however, is a moderately cytotoxic agent [39] which interacts with the phospholipid bilayer of the cellular membrane to inhibit the enzyme ATP-synthase by the cetrimonium cation, leading to cell death [40]. Therefore, CTAB exchange or removal or overcoating with other agents on the GNR surface is required prior to any biological application [41]. Some studies indicate that GNR cytotoxicity may be caused by impurity of surfactant, suggesting that cytotoxicity is caused by free CTAB in solution [42] and the quantity of surfactant [43]. However, other researchers have proven that GNR cytotoxicity is mainly related to the CTAB bilayer on the particle surface rather than the free residual molecules in solution [44].
Since the removal of CTAB causes instability of GNR suspensions, a major challenge is to prevent GNR aggregation while maintaining a low toxicity profile [45]. To solve this issue, several researchers exchanged the CTAB layers with more biocompatible ligands, such as thiolated polyethylene glycol (PEG) [46], 1,2-dimyristoyl-sn-glycero-3-phosphocholine (DMPC) phospholipid molecules, ref. [47] mercaptoundecanoic acid (MUA) [48], or thiolated polyamidoamine (PAMAM) [49]. Others have used multistep exchange processes, whereby CTAB was first exchanged with polystyrenesulfonate, which was then displaced with citrate [39]. An alternative strategy is to completely encapsulate the GNR surface with an additional biocompatible coating, for example bovine serum albumin (BSA) [50] or human serum albumin (HSA).
In this study, we aim to investigate the effects of the charge of the GNR surfactant on cell viability. We used sodium dodecyl sulfate (SDS) as an overcoating agent which stabilizes the GNR surface, changing the net charge from positive (CTAB) to negative. Since cationic-anionic surfactant mixtures, known as “catanionics”, such as those composed of SDS/CTAB, exhibit properties different from those of the individual surfactants, they can demonstrate improvements in stability and also be used to mimic biological membranes [51]. SDS has been used in a recent study as anionic surfactant to replace the CTAB bilayer during the synthesis of small GNRs (28 × 7 nm), showing improved cell viability in A549 adenocarcinomic human alveolar basal epithelial cells [52]. We optimized the purification process of large GNRs (120 × 40 nm) and investigate the mechanisms of their cellular uptake as well as their cytotoxic effects in a murine model of Lewis lung carcinoma (LLC) and a human model of cervix adenocarcinoma (HeLa).
The selection of GNR dimensions for achieving efficient contrast for bioimaging, as well as for photothermal therapeutic applications, is based on the optical properties of the nanoparticles. In fact, the choice of larger nanorods derives from previous observations which report that, generally, GNRs with aspect ratio ~3 and width < 40 nm produced a stronger photoacoustic signal compared with smaller nanorods (width < 25 nm) [3]. In addition, it has been proven that GNRs with a larger effective radius and high aspect ratio produce the highest scattering contrast for imaging applications [53] as well as greater effect on X-ray attenuation [27]. This size regime allows for powerful ablation and strong imaging contrast, characteristics suitable for theranostic applications.
The novelty of the present work demonstrates that improvements can be made in biocompatibility of nanomaterials without significant changes to the particles’ shape, stability, or plasmonic properties. Further, improvements in biocompatibility are made without disrupting the CTAB surface functionalization, needed to generate unidirectional particle growth. Indeed, we show that the introduction of a commonly found anionic surfactant, SDS, can be easily introduced through wet chemistry in the fabrication process and translated for large scale up. The outcomes presented here benefit our understanding of the mechanisms of the biological action of surfactants and their mixtures used as nanoparticle stabilizers, and consequently, aid in the design of innovative GNR-based platforms for cancer nanotheranostics.

2. Materials and Methods

2.1. Synthesis of Gold Nanorods (GNRs)

Gold nanorods were synthesized by a binary surfactant method modified to produce sufficient quantities of gold nanorods that are approximately 40 nm in transversal dimension and 120 nm in longitudinal length [54,55,56]. In this method, gold(III) chloride is reduced to gold(I) ions in the presence of cetyltrimethylammonium bromide (CTAB) and sodium oleate (NaOL). Gold nanorod growth is then initiated by injecting separately synthesized gold nanoparticle seed solutions. The nanorod synthesis can be monitored by tracking the plasmon peak in the extinction spectrum in real time. When the peak is at the desired wavelength, the growth solution is pelleted in a centrifuge, the growth solution is removed, and the nanorods are resuspended in CTAB solution. If the synthesis is not stopped, the nanorods will grow to become large and polydisperse.
The growth solution was prepared in a round bottom flask with 50 mL of deionized water heated to 50 °C on a temperature-controlled heating mantle. A total of 1.5 g of CTAB (Sigma Aldrich, St. Louis, MO, USA, H9151 lot 019K00241) and 0.247 g of NaOL (Sigma Aldrich, St. Louis, MO, USA, O7501 lot SLBR5187V) were added, the solution was stirred until the powder dissolved, and then allowed to cool to 30 °C. A 4 mM silver nitrate solution was prepared by adding 68 mg AgNO3 (Sigma Aldrich, St. Louis, MO, USA, 209139 lot MKCK0755) to 100 mL of water at room temperature. A 20 mM gold chloride stock solution was prepared by adding 788 mg of HAuCl4 (Sigma Aldrich, St. Louis, MO, USA, 520918) to 100 mL of deionized water. A total of 2.5 mL of this stock solution was diluted into 47.5 mL of deionized water held at 30 °C in a temperature-controlled bath. Once the surfactant mixture is stable at 30 °C, 4.8 mL of the AgNO3 solution is added, and the surfactant mixture is left undisturbed at 30 °C for 15 min. Next, the 50 mL HAuCl4 solution is added to the surfactant mixture and set for medium stir at 30 °C for 90 min. The solution is initially a yellowish orange color and over time becomes clear. During the 90 min incubation, 64 mM ascorbic acid (Sigma Aldrich, St. Louis, MO, USA, 95209 lot 1442630V) solution is prepared by adding 565 mg of powder to 50 mL of deionized water and letting it dissolve in the 30 °C bath. To create the seed particles, 0.125 mL of the 20 mM gold chloride stock solution is added to 4.875 mL of deionized water. This 5 mL solution is combined with 5 mL of a 200 mM stock solution of CTAB, which must be heated to completely dissolve the surfactant. Next, 10 mM NaBH4 (Sigma Aldrich, St. Louis, MO, USA, 480886 lot MKCJ8009) was prepared by adding 38 mg of powder to 100 mL of deionized water. The solution was gently swirled and immediately used (between 1 and 2 min from the time it was dissolved as NaBH4 is not a stable solution and creates hydride ions that reduce the gold ions to create the seed particles). Note that the hydride ion concentration varies over time and is sensitive to temperature and stirring conditions. The seed solution was stirred vigorously and ~1 mL of the NaBH4 solution was added. Stirring of the seed solution was stopped, and the solution left to sit for 30 min. Since the hydride concentration is sensitive to preparation conditions, multiple seed solutions were made by adding varying amounts of NaBH4 solution (e.g., 0.3 mL, 0.6 mL, 0.9 mL, and 1.2 mL), and the seed solution that appeared faint brown after 30 min was used. Once the surfactant growth solution had incubated for 90 min, 2.5 mL of a 3 M HCl (Sigma 320331 lot MKCJ5989) stock solution was added, and the growth solution set to slowly stir for 15 min while the temperature was held to 30 °C. After this time, 0.25 mL of the ascorbic acid solution was added, and the growth solution vigorously stirred for 30 s. Next, 0.002 mL of the seed solution was added, the growth solution stirred for 30 s, and then left still at 30 °C. The nanorod synthesis continued to proceed over several hours.
Small volumes of the growing nanorods were periodically sampled and their extinction spectra measured to monitor the plasmon resonance. A weak plasmon band is initially observed at the limit of the instrument’s spectral window (~1000 nm), and it grows and shifts to shorter wavelengths. Once it reaches ~800 nm, the growth solution is transferred to glass tubes and pelleted in a centrifuge at 2000× g for 20 min. The growth solution was decanted, and the nanorod pellets resuspended in CTAB or SDS (Sigma Aldrich, St. Louis, MO, USA, 436143 lot MKBF9866V) solution at the desired concentration (2 to 10 mM). This purification process is also used to transfer nanorods initially stabilized in CTAB to SDS solution.

2.2. GNR Characterization

After synthesis, gold nanorod optical properties and morphology were evaluated with UV-VIS spectroscopy and high contrast transmission electron microscopy (TEM). Modifications in surface chemistry were evaluated with ζ-potential and surface-enhanced Raman scattering (SERS). Physicochemical properties of the gold nanorods were also investigated with high resolution computed tomography (micro-CT) to classify the gold nanorods as potential diagnostic agents.

2.2.1. ζ-Potential

Particle surface charge (ζ-potential) was measured with a Zetasizer Nano ZS (Malvern Panalytical, MA, USA). Briefly, 1 mL of the sample solution (concentration < 1 mg/mL) was placed in a four-sided cuvette capped by the universal dip cell ZEN1002. All the measurements were conducted at 25 °C with a refractive index of 1.

2.2.2. Ultraviolet-Visible (UV-VIS) Spectroscopy

For synthesis and surface chemistry modifications of the gold nanorods, absorbance spectra were recorded with an Ocean Optics USB4000 fiber spectrometer in glass cuvettes. For applications in cell culture, absorbance spectra of the prepared GNR solutions were obtained on a Beckman Coulter UV-VIS (200–1000 nm) spectrophotometer (DU 730, Beckman Coulter, Inc., Brea, CA, USA). The sample in 1 mL volume (concentration < 1 mg/mL) was stored in a four-sided cuvette and placed in the standard single cell holder of the machine. To obtain optimal results, before taking each sample measurement a blank measurement (with milli-Q water) was performed. We measured the spectra after synthesis and after dispersion in serum obtained from healthy porcine (Male Castrated Yucatan Minipig, ~38 kg, S&S Farms, Ramona, CA, USA) approved by the Institutional Animal Care and Use Committee (IACUC) at the Houston Methodist Research Institute (approved code: AUP-0620-0035, 2 June 2020). To obtain the serum, whole blood was collected in serum blood collection tubes (BD Vacutainer, Franklin Lakes, NJ, USA) and centrifuged for 15 min at 2000× g.

2.2.3. Transmission Electron Microscopy (TEM)

Gold nanorod solutions are deposited on 300 mesh copper grids with a lacey carbon film (Ted Pella 01890). A 5 mL drop of the solution is applied to the grid which is held in the air with tweezers until the solution dries. The grid is imaged in a JEOL 2100F transmission electron microscope with a CCD camera. The images are captured and processed by Digital Micrograph software from Gatan Inc. (Pleasanton, CA, USA).

2.2.4. Micro-Computed Tomography (Micro-CT)

To investigate the physicochemical properties of the gold nanorods as a promising multifunctional platform for theranostics, we imaged both CTAB-GNRs and SDS-GNRs using a Siemens Inveon High-Resolution Micro Computed Tomography imaging system (slice thickness of 105 μm, in a plane resolution of 105 μm, tube voltage at 80 kV, tube current at 500 μA, and exposure time of 240 ms). Sample dilutions were prepared in 0.2 mL individual tubes with a flat cap (Thermo Fisher Scientific, Waltham, MA, USA, AB0620) in 30 μL volumes, ranging from 0 to 2 mg [Au]/mL after pelleting the particles via centrifugation (1000× g, 5 min). Gold concentration was established by inductively coupled plasma optical emission spectrometry (ICP-OES). Digital CT images (DICOM files) were analyzed and processed using 3Dslicer and X-ray attenuation intensity was calculated in Hounsfield unit (HU).

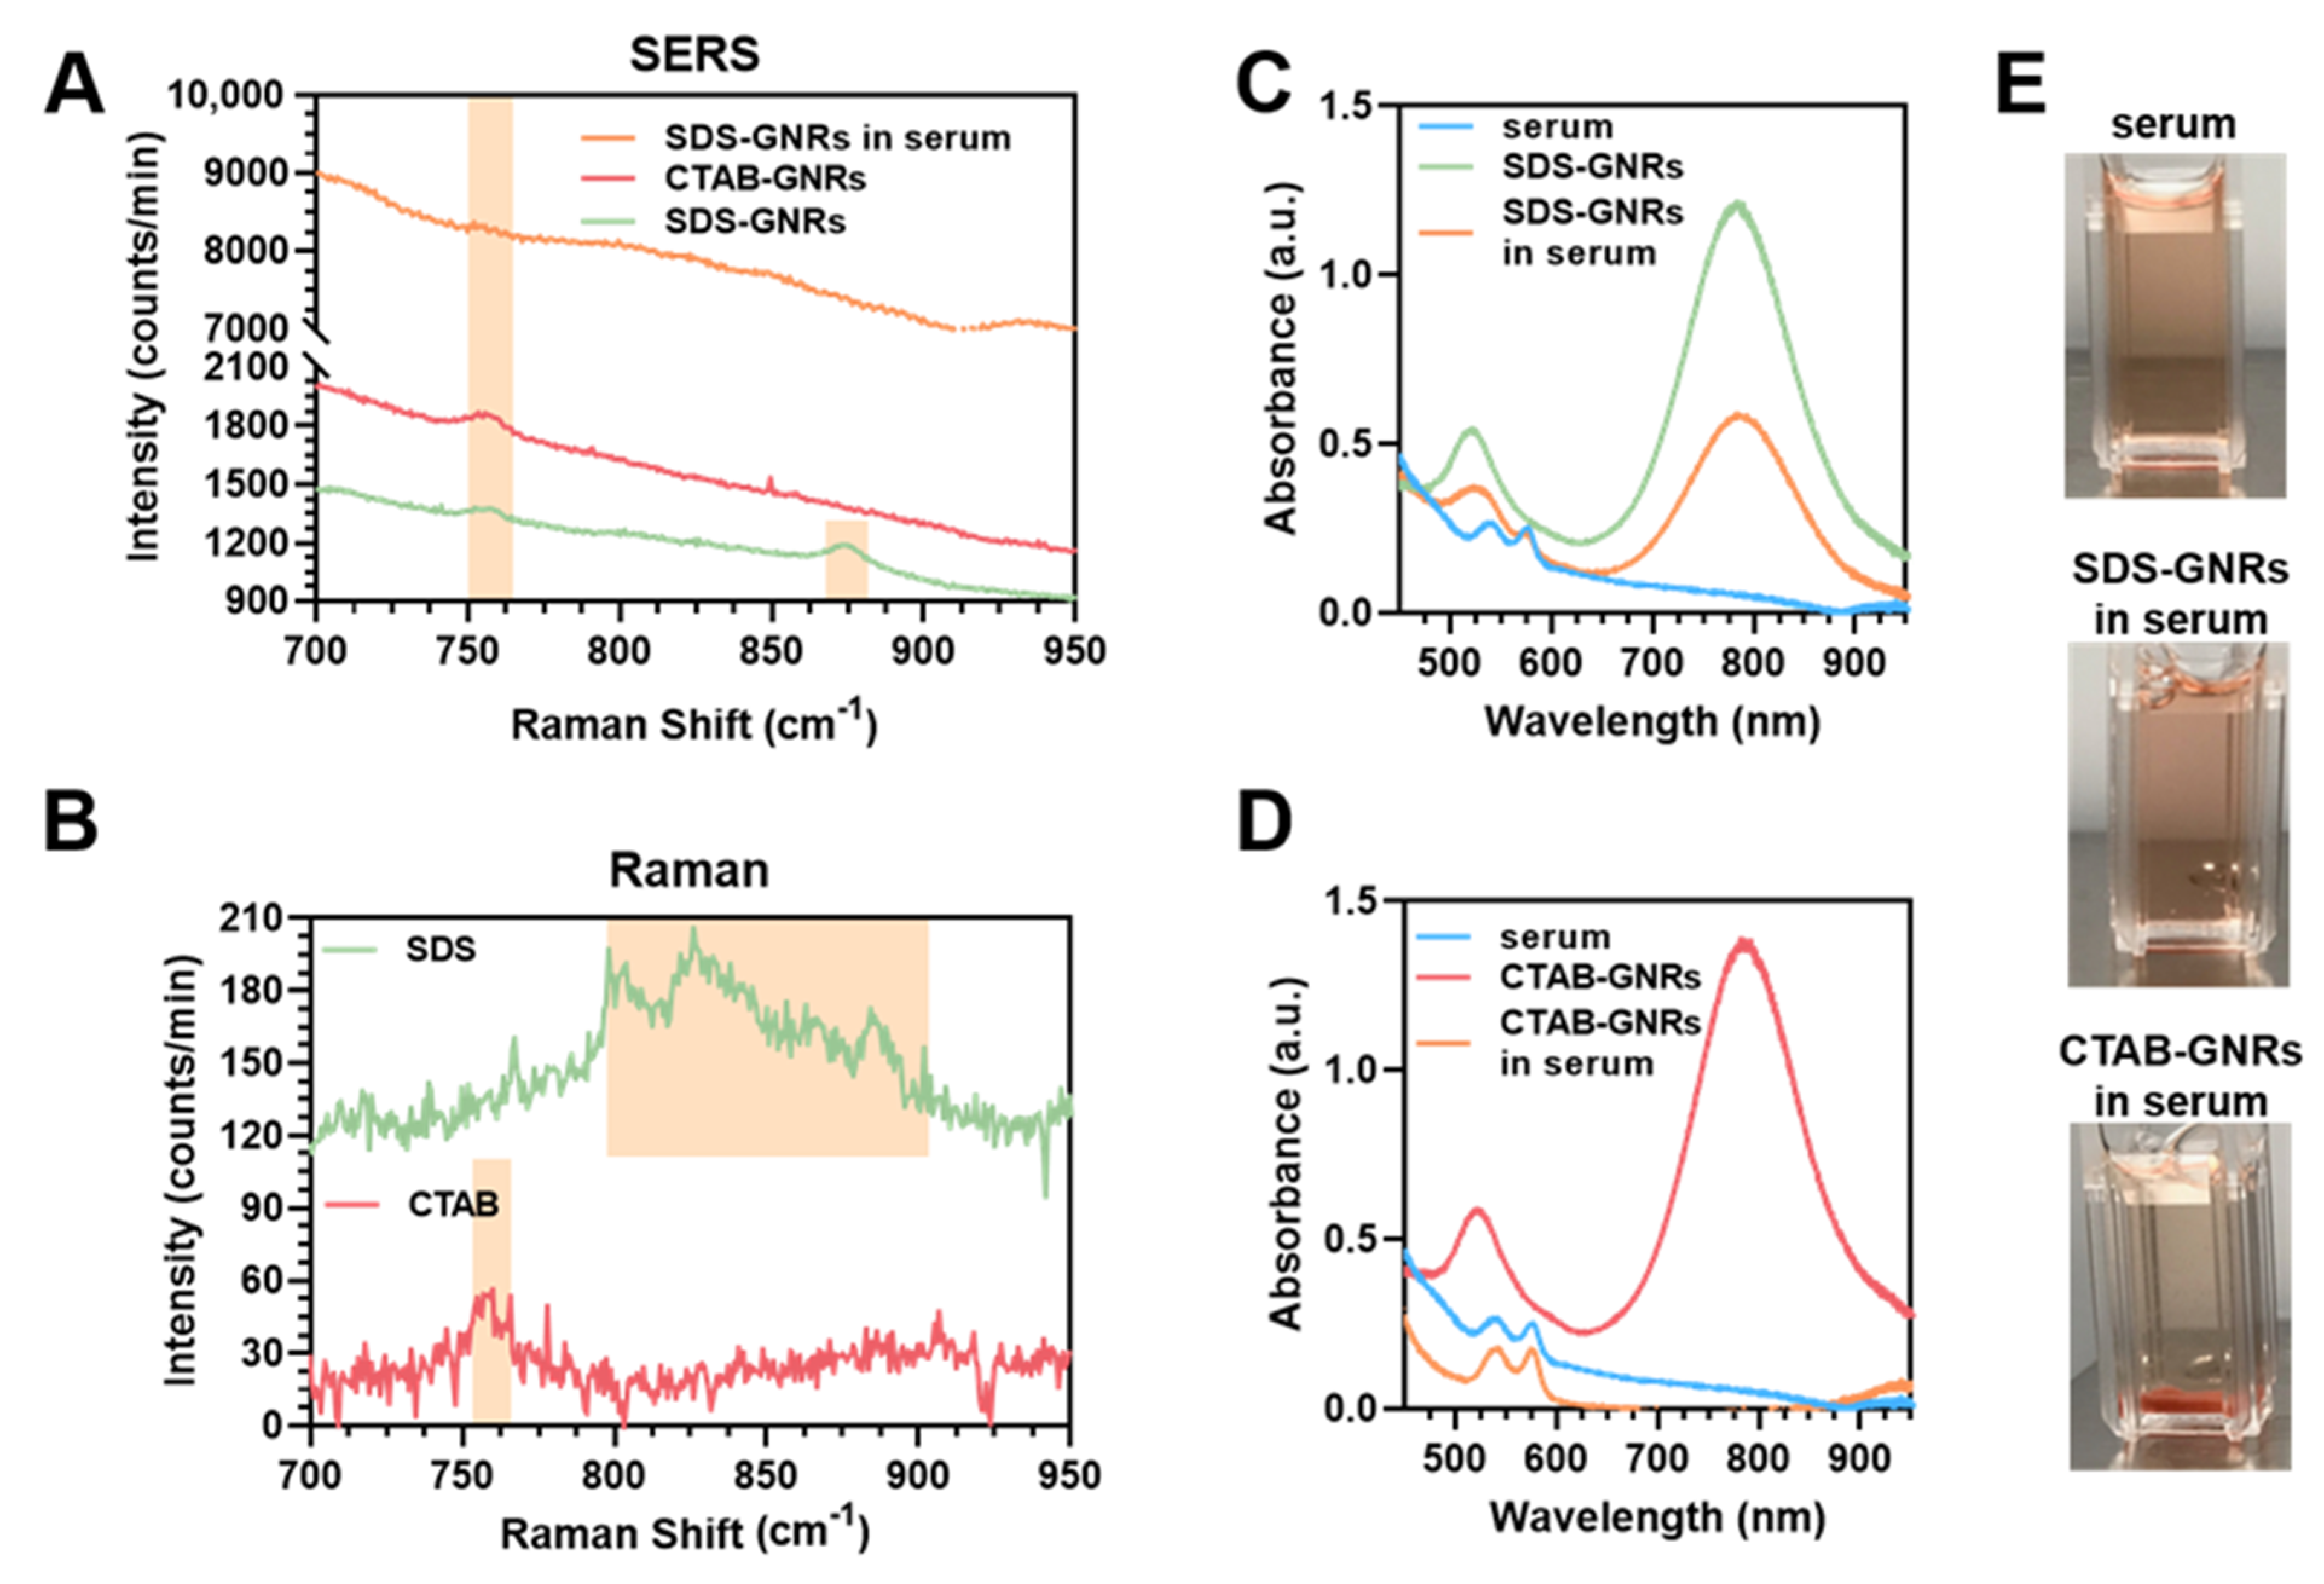
2.2.5. Surface-Enhanced Raman Scattering (SERS)

Raman and SERS spectra were recorded on a custom-built Raman microspectrometer that uses a stabilized 785 nm, 80 mW diode laser (Coherent Inc., Santa Clara, CA, USA), near-infrared corrected objective lenses, an aberration free IsoPlane SCT 320 spectrometer (Princeton Instruments Inc., Trenton, NJ, USA), and a Pixis 265E open electrode CCD camera (Princeton Instruments Inc., Trenton, NJ, USA) [57]. The sample is continuously pumped through glass capillaries to avoid any settling of the nanoparticles or heating by the laser.

2.3. Cell Culture

In this present study, two cell types were treated and observed: cervix adenocarcinoma (HeLa) and murine Lewis lung carcinoma (LLC) cells. Both cell lines were purchased from ATCC® (American Type Culture Collection, Manassas, VA, USA).

Cell Lines and Passaging

Protocols for cell culture, maintenance, and sub-culturing were the same for both cell lines. Cells stored in liquid nitrogen for long-term cryopreservation were thawed and mixed with 10 mL of complete growth media in T-75 flask. Cell culture flasks and plates were kept in a HERAcell 150i CO2 incubator (Thermo Fisher Scientific, Waltham, MA, USA) set to 37 °C and 5% humidity, and media was changed every few days as needed to maintain cell growth. Dulbecco’s modified Eagle medium (DMEM) was the basal media used to subculture the LLC cells, while Eagle’s Minimum Essential Medium (EMEM) was the basal media used to subculture the HeLa cells. Complete growth media of DMEM and EMEM were prepared by adding 10% fetal bovine serum (FBS, USDA approved, ATCC®, Manassas, VA, USA). Cells were passaged for subculturing using 0.25% trypsin −0.53 mM EDTA solution (Thermo Fisher Scientific, Waltham, MA, USA, 25-200-056) and then neutralized with complete growth media. The cell suspension was then centrifuged at 130× g for 5 min. Afterwards, the supernatant was removed, the pellet was resuspended in 1 mL of complete media, and the cells counted using a Countess™ II FL Automated Cell Counter (Invitrogen, Carlsbad, CA, USA) and plated into 6-well/96-well plates and grown until confluent (as described further in Section 2.5.1).

2.4. Viability Assays

Viability assays were performed to compare the effects of CTAB-GNR and SDS-GNR treatments in both cancer cell lines and detect potential cytotoxicity, dependent on the treatment dosage, incubation time, and surfactant type.

2.4.1. Trypan Blue Assay

Trypan blue is a diazo dye which is taken up exclusively by dead cells, while unstained cells represent the total number of viable cells. In this assay, both cell lines were treated with CTAB-stabilized or SDS-stabilized gold nanorods, incubated for a 24-h period, trypsinized, and stained with trypan blue. We quantified the number of viable (unstained) cells and assessed cell proliferation or cytotoxicity due treatment in comparison to untreated (control) cells.
Each cell line was seeded into 6-well plates at a concentration density of 1 × 10⁵ cells/mL. We treated the cells in triplicate wells by replacing the culture medium with fresh medium containing 15 μg Au/mL of particles and incubating the cells for 1 h, 3 h, 6 h, 12 h, and 24 h at 37 °C and 5% humidity. Cells were detached from the wells using 0.25% trypsin −0.53 mM EDTA solution and resuspended with 1 mL of complete growth media. A total of 1% of the cells were aliquoted, stained with 0.4% Trypan Blue Solution (Thermo Fisher Scientific, Waltham, MA, USA, 15250061), and counted using a Countess™ II FL Automated Cell Counter (Invitrogen, Carlsbad, CA, USA). The remaining cell solution was centrifuged at 100× g for 5 min to remove the supernatant. This pellet was used for ICP-OES analysis as described in Section 2.5.3.

2.4.2. MTT Assay

To evaluate treatment-related modifications in the rate of cell proliferation, we spectrophotometrically assessed reduction of 3-(4, 5-dimethylthiazolyl-2)-2, 5-diphenyltetrazolium bromide (a yellow dye known as MTT) to the blue product formazan. To perform this assay, both cell lines were first seeded separately into 96-well plates (Corning™ Costar™ 96-Well, Cell Culture-Treated, Flat-Bottom Microplate, Thermo Fisher Scientific, Waltham, MA, USA, 15250061) at a concentration density of 1 × 10⁵ cells/mL and incubated in a cell culture incubator for 24 h. The following day, the media was aspirated and replaced with fresh medium containing the particles to expose the cells to the colloidally stable, homogenous dispersions of gold nanorods. Different concentrations of gold nanorod treatment were investigated: low-dose treatment at 1 µg [Au]/mL, medium-dose treatment at 15 µg [Au]/mL, and high-dose treatment at 50 µg Au/mL. After an additional 24 h incubation period at 37 °C and 5% humidity, 10 µL of MTT Reagent (ATCC®, American Type Culture Collection, Manassas, VA, USA) was added to each well, and the plates incubated until a purple precipitate was visible under the microscope. All wells were then treated with 100 µL of Detergent Reagent (ATCC®, American Type Culture Collection, Manassas, VA, USA) until complete dissolution to formazan, which occurs when the dark colored solution is homogeneous under microscope. A Synergy™ H4 Hybrid Microplate Reader (BioTek Instruments, Inc., Winooski, VT, USA) was used to measure the absorbance of the solution in the well at 570 nm and 690 nm.

2.5. In Vitro Uptake of GNRs

2.5.1. Optical Microscopy

Live-cell optical microscopy was conducted to evaluate cell morphology and visually assess cell conditions for all the cell culture experiments reported. Cells that do not display typical morphology is indicative of possible toxicity due to the administered treatments. Abnormalities in cell morphology include blebbing [58], swollen mitochondria [59], and detachment from the substrate [60]. Optical microscopy images were acquired using a Nikon ECLIPSE Ts2 Inverted Microscope (Nikon Instruments Inc., Melville, NY, USA) with a 10× magnification objective and 50% brightness.

2.5.2. Electron Microscopy

To perform electron microscopy assessments, HeLa and LLC cells treated with CTAB-stabilized or SDS-stabilized gold nanorods were pelleted by centrifuging for 5 min at 100× g, resuspended in 1 mL of 4% paraformaldehyde (Electron Microscopy Sciences, Hatfield, PA, USA), and left overnight for fixation and preservation. Following this procedure, the samples were washed three times through repeated centrifugation and resuspension with 0.1 M PBS. The PBS is then replaced with 2% osmium tetroxide (OsO4) in cacodylate buffer (Electron Microscopy Sciences, Hatfield, PA, USA), and allowed to incubate for 2 h at room temperature, before washing three times with 0.1 M PBS. To remove water, the specimens were resuspended in a series of graded ethanol (Pharmco, Brookfield, WI, USA) at 30%, 50%, 70%, and 90% for 10 min each, followed by a wash of 90% acetone (Sigma Aldrich, St. Louis, MO, USA) for 10 min and three washes of 100% acetone for 15 min. Samples were embedded in 100% resin using flat molds after 2 h pre-inclusion in resin/100% acetone (1:1), followed by overnight pre-inclusion in resin/100% acetone (2:1), and finally 3 h pre-inclusion in 100% resin (Electron Microscopy Sciences, Hatfield, PA, USA). Polymerization was obtained by incubating the samples for 48 h at 60 °C in a laboratory oven (Quincy Lab Inc., Chicago, IL, USA) and the hard blocks were sliced into 100 nm ultrathin sections using a diamond knife (DiATOME Diamond Knives, Hatfield, PA, USA). Sections were placed on copper grids (200 mesh) (Ted Pella, Inc., Redding, CA, USA) and stained with uranyl acetate and lead citrate (Electron Microscopy Sciences, Hatfield, PA, USA). Images were obtained with an FEI Nova NanoSEM 230 (FEI Co., Hillsboro, OR, USA) using the bright field setting in STEM mode under a vacuum of 15 kV.

2.5.3. Inductively Coupled Plasma Optical Emission Spectrometry (ICP-OES)

Inductively coupled plasma optical emission spectrometry (ICP-OES) measurements were performed with a Varian Agilent 720-es ICP spectrometer (Agilent, Santa Clara, CA, USA) to quantify the cellular uptake of the gold nanorods. Gold calibration curves were generated by diluting a gold standard consisting of Au 1000 µg/mL in 10% hydrochloric acid (HCl) (Perkin Elmer, Waltham, MA, USA, N9303759) in a solution prepared with 1% trace metal grade nitric acid (HNO3, Thermo Fisher Scientific, Waltham, MA, USA) and 10% trace metal grade HCl (Thermo Fisher Scientific, Waltham, MA, USA). Gold emission was measured at 242.794 nm and 267.594 nm using the ICP-OES software (ICP Expert II). After a 24 h incubation period with the particles, collected cell pellets were digested in 1 mL aqua-regia solution (nitric acid and hydrochloric acid in a molar ratio of 1:3) in a chemical fume hood for 1 h. We then added 2 mL of standard diluent (10% HCl, 1% HNO3) and filtered the final solution using 0.6 μm filters (MilliporeSigma™, Burlington, MA, USA, Steriflip Quick Release-GP Sterile Vacuum Filtration System). All measurements were performed in triplicate, averaging the outcomes from the two emission lines. The gold content found in each pellet was normalized to the total number of counted cells (dead and alive). With this normalization, we assume that nanorod internalization does not vary between the cells.

2.6. Statistical Analysis

GraphPad Prism (version 9.1.0; GraphPad Software, Inc., San Diego, CA, USA) was used for all statistical analyses and graphs. Mean ± s.e.m. values were calculated for all results. Statistical significance was assessed by one-way or two-ways analysis of variance (ANOVA) with Tukey’s multiple comparisons test.

3. Results

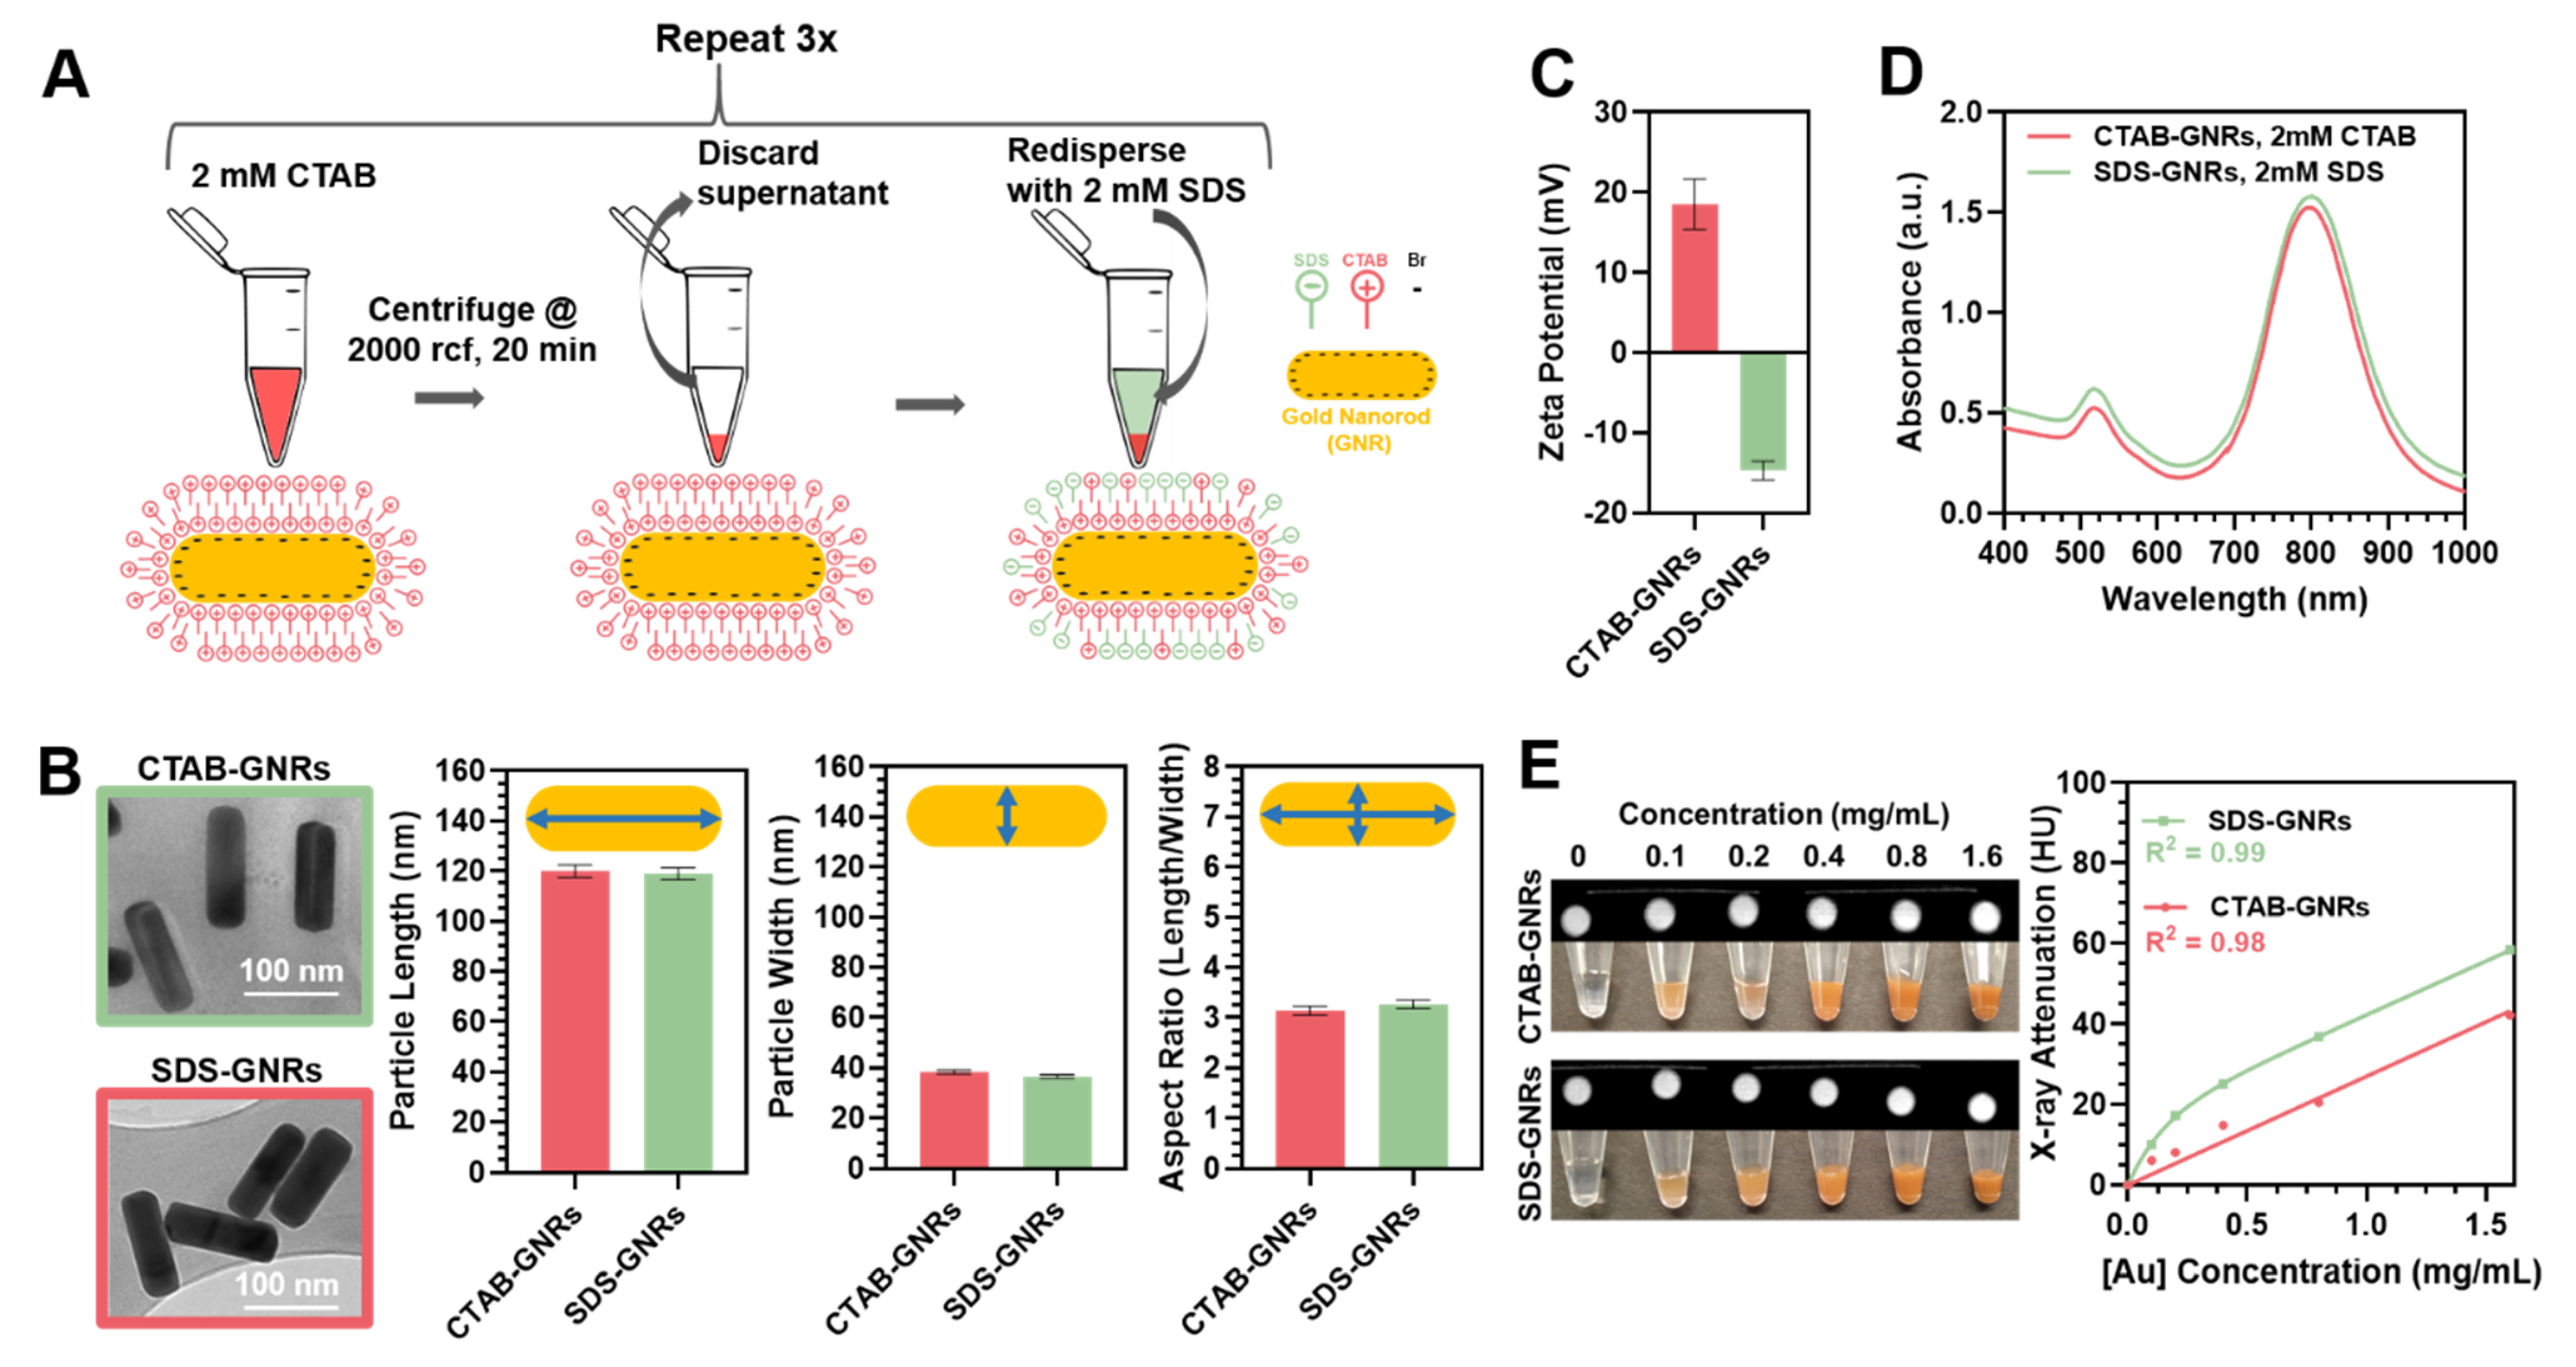
3.1. GNR Surface Chemistry Modification and Characterization

Figure 1A shows a schematic of the surface chemistry modification with SDS after synthesis and stabilization with CTAB surfactant as described in Section 2.1. SDS has been chosen as anionic surfactant to overcoat the CTAB bilayer on the GNRs. After synthesis and coating, the GNR longitudinal and transversal dimensions were estimated from the TEM images (where an average of 50 particles were measured) using Matlab (v9.9.0.1467703, R2020b, The MathWorks, Inc., Natick, MA, USA). CTAB and SDS functionalized particle solutions appeared similar in color, indicative that the particles were similar in size, and upon TEM inspection, displayed low polydispersity (Figure 1B insets). As reported in Figure 1B, particle size was found to be 120 ± 2.5 nm in length and 38 ± 1 nm in width for the CTAB-GNRs and 118 ± 2.4 nm in length and 36 ± 1 nm in width for the SDS-GNRs, highlighting that there was no significant difference in shape or size between particle treatment types. Aspect ratios were 3.14 ± 0.43 for the CTAB-GNRs and 3.26 ± 0.35 for SDS-GNRs (mean ± s.e.m.). Zeta potential measurements were performed for all the samples at room temperature and pH equivalent to synthesis conditions. Figure 1C shows the difference in surface charge for the particle types, whereby the CTAB-GNRs have a net positive charge of 18.53 ± 5.44 mV, while the SDS-GNRs exhibit a negative charge of −14.7 ± 2.06 mV.
Absorbance spectra collected in the range 200–1000 nm display two distinct plasmon resonance peaks for the GNRs arising from their anisotropic configuration (transverse and longitudinal bands), which correspond to the oscillation of electrons in the shorter (517 nm) and longer (CTAB-GNRs: 795 nm, SDS-GNRs: 800 nm) axis (Figure 1D). We attribute the redshift of the longitudinal band in the SDS-GNRs to changes in the refractive index of the local environment and interparticle distance which depends on the dispersion status altered by the presence of the anionic surfactant. No evidence of macro-aggregation or flocculation phenomena is visible from the spectra or upon physical inspection of the particles.
X-ray attenuation of GNRs measured using micro-CT are reported in Figure 1E. The inset on the left represents optical photos of the gold nanorods dilutions as well as their CT contrast in the coronal plane. All data points were normalized to the attenuation of water (0 mg/mL particle concentration). An increase in attenuation from low to high concentration was observed for both the CTAB-GNRs and SDS-GNRs. Interestingly, the SDS-GNRs attenuate slightly more than CTAB-GNRs at the same concentrations and experimental conditions. However, we also observed that in the case of the SDS-GNRs, when plotted as a function of gold concentration, the CT attenuation values deviate slightly from linearity (R2 = 0.96 when fit with a linear regression versus R2 = 0.99 when fit with two-phase association). Further investigations are necessary to clarify this behavior. Overall, the increase in X-ray attenuation as the gold mass increases indicates that GNRs can act as CT contrast agents and are suitable for theranostic applications.
The ability of gold nanostructures to focus light onto a presence of nearby molecule due to their surface plasmons can be exploited with SERS, a spectroscopic technique that enhances the Raman scattering of adsorbed molecules. Changes in surface chemistry, such as the length [61], angle [62], or conformation [63] of a small molecule attached to a gold nanoparticle surface, lipid transfer from the surface, [64] as well as the presence and interactions of intercalants or biomolecules [65,66], can all be structurally identified using SERS. Figure 2A displays the SERS spectra of CTAB-GNR and SDS-GNR solutions as well as SERS spectra of SDS-GNRs redispersed in serum. Figure 2B contains unenhanced Raman spectra of pure CTAB and SDS solutions for reference. CTAB has an isolated peak at 760 cm−1 that corresponds to the symmetric stretching vibration of the trimethylammonium headgroup. SDS has a band of peaks at 800–900 cm−1 that represents various headgroup and alkane chain modes. These regions of interest are highlighted in Figure 2. The SERS spectra from the CTAB-GNR solution contains a strong peak at 760 cm−1 as expected, since the surfactant forms a bilayer on the GNR, with the headgroup positioned near the gold surface and strongly enhanced. SERS from SDS-GNRs has a reduced peak at 760 cm−1, as well as a strong, isolated peak at 870 cm−1 that is within the band that corresponds to SDS. The SERS enhancement of a specific peak within the band is not uncommon in SERS since the signal depends on the orientation of the SDS molecule within the near field of the gold nanorod. This data supports the hypothesis that the CTAB is not completely dissociated from the GNR surface and rather that the SDS is acting as an additional coating agent as presented in Figure 1A. The SERS spectrum of SDS-GNRs in serum is weaker than SDS-GNRs in their native solution. However, the presence of a peak at 760 cm−1 is preliminary evidence that the SDS functionalization allowed the nanorods to incorporate into the serum and are still stable. Figure 2C,D show the absorption spectra of SDS-GNRs and CTAB-GNRs, respectively, after preparation and after resuspension in porcine serum. Both absorption measurements (Figure 2D) and visual inspection (Figure 2E) confirm that CTAB-GNRs are not stable in serum, while the SDS-GNR absorption spectrum shows well-defined peaks after particle redispersion in serum (Figure 2C). For the SDS-GNR sample in serum, no macro-aggregation is visible in solution (Figure 2E).

3.2. Dose-Dependent Cytotoxicity Effects of CTAB-GNRs and SDS-GNRs

In this section we report our results on the viability, proliferation, and morphology of cancer cells after GNR exposure. We studied these effects after incubation of the cells with the particles for 24 h, using low, medium, and high dose treatments as described in Section 2.5.1. Figure 3A,B show optical microscopy images of a monolayer of HeLa and LLC cells treated and incubated for 24 h at 37 °C and 5% humidity with 15 μg Au/mL CTAB-GNRs or SDS-GNRs. After the 24 h incubation with CTAB-GNRs, the typical epithelial cell morphology of the HeLa cells, and the rounded, loosely attached morphology of the LLC cells (untreated controls), changed to destroyed or floating for both cell lines. This is not surprising as the cationic surfactant, CTAB, is able diffuse across the cell membrane directly and target the mitochondria causing apoptosis. Conversely, GNRs stabilized with the anionic surfactant, SDS, were able to enter the cells directly by endocytosis without destruction of the cell membrane. Macro-accumulation of the SDS-GNRs in the HeLa cytoplasm is visible with optical microscopy. Macro-traces of the SDS-GNRs are also visible in the LLC cytoplasm. In order to provide the most reliable results, we assessed cell viability with two different assays: Trypan blue and MTT. Trypan blue results are reported for the HeLa cells in Figure 3C and LLC cells in Figure 3D, and MTT results are reported for the HeLa cells in Figure 3E and LLC cells in Figure 3F. All of the treatment doses result in significant cytotoxicity for CTAB-GNRs in both cell lines, while the SDS-GNRs were cytotoxic only at high dosage (50 µg/mL). The differences obtained by comparing the two viability assays in the case of 15 μg Au/mL indicates that the increased cytotoxicity observed in the MTT assay is mainly influenced by mitochondrial metabolism. Despite the huge difference in cell viability between the CTAB and SDS stabilized GNR treatments, viability decreased in both cases in a concentration-dependent manner.

3.3. Time-Dependent Cytotoxicity Effects of CTAB-GNRs and SDS-GNRs

In this section we report time dependent results on the cell viability, proliferation, and morphology, along with the levels of cellular uptake for each GNR treatment type. We noticed under microscopic gross inspection that after administration, the CTAB-GNRs had an immediate cytotoxic effect on both cell lines, while the SDS-GNRs remained unaltered. We hypothesized that cytotoxicity could be a function of time in the case of GNR administration. We tested this hypothesis by measuring cell viability over time using the Trypan blue assay in HeLa (Figure 4A) and LLC cells (Figure 4B) incubated with the nanorods. The CTAB-GNR treatment killed the cells after just 1 h of particle incubation, while the cells treated with SDS-GNRs remained viable over time. We then quantified the gold internalized by the cells over time using ICP-OES (Figure 4C,D). Interestingly, it seems that the mechanisms of SDS-GNR uptake were cell line dependent: the LLC cells exponentially encapsulate the particles over time, while internalization of the SDS-GNRs in the HeLa cells occurred mostly within the first hour of incubation and increased slightly over time. To assess the toxicology of the GNR particles after 24 h of treatment, we acquired SEM images of the HeLa (Figure 4E) and LLC cells (Figure 4F) in STEM mode. Another scientific concern regarding internalization of a nanomaterial is related to the possibility of ultrastructural changes of the particles. SEM images revealed that the SDS-GNRs are internalized in vesicles and that their shape is unaltered after cell internalization in both cell lines.

4. Discussion

In this study we demonstrate that the charge of the surface coating agent modulates the cytotoxicity of GNRs in mammalian cells. We confirmed surface modification of the nanorods with SDS using SERS and notably, this improves their stability when applied to a biological environment, such as serum. Further, at the same concentration (2 mM), CTAB and SDS surfactants have a radically different impact on cell viability.
CTAB is an essential surfactant in the synthesis of gold nanorods. It has been proposed that the bromine moiety binds preferentially to the (100) crystal plane on the side of the nanoparticle, creating anisotropic growth on the (111) facet which gives rise to the rod-like shape of the particle and transverse and longitudinal axes [67]. Therefore, the concentration of CTAB can only be lowered to a certain point without disrupting the colloidal stability and inducing irreversible aggregation or morphological changes of the gold nanorods. Therefore, exploring the safety profile of CTAB conjugated nanorods is crucial. Previous studies have reported non-covalent surface coatings to reduce CTAB induced toxicity in cancer cells. Hauck et al. [68] demonstrated that cation polyelectrolyte coating of the CTAB-GNR surface through electrostatic interactions results in nontoxic particles when compared to CTAB-capped nanorods and no gene expression abnormalities were observed in treated HeLa cells. Although this coating strategy showed significant reduction in the GNR cytotoxicity, the CTAB bilayer underlying the polyelectrolyte polymer was still present on the surface of the polyelectrolyte overcoated particle, demonstrating that not all of the CTAB was shielded [69].
Fernando et al. [70] tested the cytotoxicity and cellular uptake of CTAB-GNRs and PEG coated GNRs in HeLa cells, demonstrating that CTAB-GNRs are more toxic to HeLa cells because of the persistence in solution of unbound CTAB from the synthesis. Even though the PEG-GNRs were safer than the CTAB-capped GNRs, this study reports that HeLa cells did not readily internalize the PEG-GNRs at 10, 24, or 48 h after treatment. According to our results, nanoparticle exposure time is an important variable for cellular cytotoxicity. In fact, after 1 h of CTAB-GNR incubation, only 20% of the cells were viable, indicating that the toxic effects are immediate for particles stabilized with a cationic surfactant, even though the longer incubation time (24 h) resulted in greater cell death.
Intracellular gold uptake over time was quantified using ICP-OES and presented differences in the particle uptake kinetics depending on the cell line. Both quantification analysis and optical microscopy confirmed the presence of the particles in the cellular cytoplasm. However, while ICP-OES is an excellent quantitative tool for gold content, it cannot differentiate between GNRs adsorbed on the surface of the cell and those internalized within the cell. As reported in literature [71], treatment of cells with heparin sulfate prior to analysis can be used to desorb surface-adsorbed nanoparticles, since the heparin sulfate polymer has a higher binding affinity to the cellular surface and can displace any surface-bound GNRs. Moreover, for a better understanding of the mechanism of CTAB/SDS-stabilized GNR cytotoxicity, the amount of surfactant that is effectively inside the cell should be measured.
Finally, we measured the X-ray absorption properties of the GNRs using a micro-CT source. The increase in CT attenuation as the gold mass increases indicates that GNRs can be used as CT contrast agents, opening the door to a vast range of theranostic applications. We interestingly noticed that in the case of the SDS-GNRs, our X-ray signal increased non-linearly (fit using a two-phase association) as we increased the mass concentration of the sample, resulting in a bi-phasic curve with two linear components, one for each material, GNR and SDS. Given that all the CT parameters and experimental conditions were the same during the CT imaging experiment for the SDS-GNRs and CTAB-GNRs as they were measured at the same time, varying only the sample solution, we hypothesize that the signal deviation from non-linearity is from the solvent. It is possible that since the SDS is not covalently attached to the nanorods but rather held in this fluid environment by hydrophobic and electrostatic interactions, the presence of this organic material in solution changes the relationship between mass content and X-ray attenuation. A linear transformation of the original linear attenuation makes the Hounsfield scale a relative scale, but in this case, it is possible that our standard is not pure water and instead has a low presence of SDS. This behavior should be investigated more in future studies.

5. Conclusions

In this study, we tested the effects of charge of the surfactant agent used to stabilize GNRs on cell viability. We synthesized GNRs with a positive surface charge through a seed-mediated approach using CTAB as a cationic surfactant, and then used SDS, an anionic surfactant, to alter the GNR surface charge to negative values. We evaluated any cytotoxic effects due to GNR treatment type, as well as the mechanisms of cellular uptake in two different mammalian cancer cell lines. Our results suggest a significant dose-dependent effect on cell viability and a time-dependent cytotoxicity effect as a function of surfactant charge for both cell lines. As strategies and technologies to improve local delivery of agents for cancer treatment are emerging [72,73,74,75], there is a greater need to better characterize nanoparticles to understand their interactions with cancerous cells. The results of this study can aid in the design of future theranostic applications for oncological translation.

Author Contributions

Conceptualization, R.T., A.Z., J.H.H. and C.S.F.; methodology, R.T., A.Z., M.L.S., J.H.H. and C.S.F.; formal analysis, R.T., J.H.H. and C.S.F.; investigation, C.S.F.; resources, C.S.F. and J.H.H.; data curation, R.T., A.Z. and M.L.S.; writing—original draft preparation, R.T. and C.S.F.; writing—review and editing, J.H.H. and C.S.F.; supervision, J.H.H., C.S.F. and D.D.; funding acquisition, J.H.H. and C.S.F. All authors have read and agreed to the published version of the manuscript.

Funding

This research was funded by collaborative seed funding from Rice University and the Houston Methodist Research Institute (J.H.H. and C.S.F.), funds from the National Science Foundation (award number 1709084), funds from the Golfers Against Cancer (C.S.F.), and funds from Houston Methodist Research Institute (C.S.F.).

Data Availability Statement

The data that support the findings of this study are available from the corresponding author upon reasonable request.

Acknowledgments

The authors are grateful to Yareli Carcamo-Bahena and Amber Lee Royal for assistance will cell culture maintenance, Xukui Wang and the Houston Methodist Research Institute Translational Imaging PreClinical Imaging (Small Animal) Core, and the Houston Methodist Research Institute Electron Microscopy Core.

Conflicts of Interest

The authors declare no conflict of interest.

References

  1. Ge, X.; Fu, Q.; Su, L.; Li, Z.; Zhang, W.; Chen, T.; Yang, H.; Song, J. Light-Activated Gold Nanorod Vesicles with NIR-II Fluorescence and Photoacoustic Imaging Performances for Cancer Theranostics. Theranostics 2020, 10, 4809–4821. [Google Scholar] [CrossRef]
  2. Harris-Birtill, D.; Singh, M.; Zhou, Y.; Shah, A.; Ruenraroengsak, P.; Gallina, M.E.; Hanna, G.B.; Cass, A.E.G.; Porter, A.E.; Bamber, J.; et al. Gold Nanorod Reshaping in Vitro and in Vivo Using a Continuous Wave Laser. PLoS ONE 2017, 12, e0185990. [Google Scholar] [CrossRef] [Green Version]
  3. Knights, O.B.; McLaughlan, J.R. Gold Nanorods for Light-Based Lung Cancer Theranostics. Int. J. Mol. Sci. 2018, 19, 3318. [Google Scholar] [CrossRef] [PubMed] [Green Version]
  4. Yin, J.; Zhang, Y.; Ma, D.; Yang, R.; Xu, F.; Wu, H.; He, C.; Liu, L.; Dong, J.; Shao, Y. Nanoassembly and Multiscale Computation of Multifunctional Optical-Magnetic Nanoprobes for Tumor-Targeted Theranostics. ACS Appl. Mater. Interfaces 2019, 11, 41069–41081. [Google Scholar] [CrossRef] [PubMed]
  5. Mayer, K.M.; Lee, S.; Liao, H.; Rostro, B.C.; Fuentes, A.; Scully, P.T.; Nehl, C.L.; Hafner, J.H. A Label-Free Immunoassay Based Upon Localized Surface Plasmon Resonance of Gold Nanorods. ACS Nano 2008, 2, 687–692. [Google Scholar] [CrossRef] [PubMed]
  6. Mayer, K.M.; Hao, F.; Lee, S.; Nordlander, P.; Hafner, J.H. A Single Molecule Immunoassay by Localized Surface Plasmon Resonance. Nanotechnology 2010, 21, 255503. [Google Scholar] [CrossRef] [PubMed]
  7. Lee, S.; Mayer, K.M.; Hafner, J.H. Improved Localized Surface Plasmon Resonance Immunoassay with Gold Bipyramid Substrates. Anal. Chem. 2009, 81, 4450–4455. [Google Scholar] [CrossRef] [PubMed]
  8. Ward, D.R.; Grady, N.K.; Levin, C.S.; Halas, N.J.; Wu, Y.; Nordlander, P.; Natelson, D. Electromigrated Nanoscale Gaps for Surface-Enhanced Raman Spectroscopy. Nano Lett. 2007, 7, 1396–1400. [Google Scholar] [CrossRef] [PubMed] [Green Version]
  9. Kelly, A.T.; Filgueira, C.S.; Schipper, D.E.; Halas, N.J.; Whitmire, K.H. Gold Coated Iron Phosphide Core–Shell Structures. RSC Adv. 2017, 7, 25848–25854. [Google Scholar] [CrossRef] [Green Version]
  10. Nehl, C.L.; Liao, H.; Hafner, J.H. Optical Properties of Star-Shaped Gold Nanoparticles. Nano Lett. 2006, 6, 683–688. [Google Scholar] [CrossRef] [PubMed] [Green Version]
  11. Hao, F.; Nehl, C.L.; Hafner, J.H.; Nordlander, P. Plasmon Resonances of a Gold Nanostar. Nano Lett. 2007, 7, 729–732. [Google Scholar] [CrossRef]
  12. Wang, H.; Wu, Y.; Lassiter, B.; Nehl, C.L.; Hafner, J.H.; Nordlander, P.; Halas, N.J. Symmetry Breaking in Individual Plasmonic Nanoparticles. Proc. Natl. Acad. Sci. USA 2006, 103, 10856–10860. [Google Scholar] [CrossRef] [PubMed] [Green Version]
  13. Levin, C.S.; Hofmann, C.; Ali, T.A.; Kelly, A.T.; Morosan, E.; Nordlander, P.; Whitmire, K.H.; Halas, N.J. Magnetic-Plasmonic Core-Shell Nanoparticles. ACS Nano 2009, 3, 1379–1388. [Google Scholar] [CrossRef]
  14. Brinson, B.E.; Lassiter, J.B.; Levin, C.S.; Bardhan, R.; Mirin, N.; Halas, N.J. Nanoshells Made Easy: Improving Au Layer Growth on Nanoparticle Surfaces. Langmuir 2008, 24, 14166–14171. [Google Scholar] [CrossRef] [PubMed] [Green Version]
  15. Nehl, C.L.; Grady, N.K.; Goodrich, G.P.; Tam, F.; Halas, N.J.; Hafner, J.H. Scattering Spectra of Single Gold Nanoshells. Nano Lett. 2004, 4, 2355–2359. [Google Scholar] [CrossRef] [Green Version]
  16. Luo, D.; Hasan, M.S.; Shahid, S.; Khlebtsov, B.N.; Cattell, M.J.; Sukhorukov, G.B. Gold Nanorod Mediated Chlorhexidine Microparticle Formation and Near-Infrared Light Induced Release. Langmuir 2017, 33, 7982–7993. [Google Scholar] [CrossRef]
  17. Kwon, Y.; Choi, Y.; Jang, J.; Yoon, S.; Choi, J. NIR Laser-Responsive PNIPAM and Gold Nanorod Composites for the Engineering of Thermally Reactive Drug Delivery Nanomedicine. Pharmaceutics 2020, 12, 204. [Google Scholar] [CrossRef] [Green Version]
  18. Haine, A.T.; Niidome, T. Gold Nanorods as Nanodevices for Bioimaging, Photothermal Therapeutics, and Drug Delivery. Chem. Pharm. Bull. 2017, 65, 625–628. [Google Scholar] [CrossRef] [Green Version]
  19. Vines, J.B.; Yoon, J.-H.; Ryu, N.-E.; Lim, D.-J.; Park, H. Gold Nanoparticles for Photothermal Cancer Therapy. Front. Chem. 2019, 7, 167. [Google Scholar] [CrossRef] [PubMed] [Green Version]
  20. Kim, H.S.; Lee, D.Y. Near-Infrared-Responsive Cancer Photothermal and Photodynamic Therapy Using Gold Nanoparticles. Polymers 2018, 10, 961. [Google Scholar] [CrossRef] [Green Version]
  21. Huang, H.-C.; Barua, S.; Kay, D.B.; Rege, K. Simultaneous Enhancement of Photothermal Stability and Gene Delivery Efficacy of Gold Nanorods Using Polyelectrolytes. ACS Nano 2009, 3, 2941–2952. [Google Scholar] [CrossRef] [PubMed]
  22. Su, X.; Fu, B.; Yuan, J. Gold Nanocluster-Coated Gold Nanorods for Simultaneously Enhanced Photothermal Performance and Stability. Mater. Lett. 2017, 188, 111–114. [Google Scholar] [CrossRef]
  23. Carozza, S.; Culkin, J.; van Noort, J. Accuracy of the Detection of Binding Events Using 3D Single Particle Tracking. BMC Biophys. 2017, 10, 1–13. [Google Scholar] [CrossRef] [Green Version]
  24. Ye, Z.; Wang, X.; Xiao, L. Single-Particle Tracking with Scattering-Based Optical Microscopy. Anal. Chem. 2019, 91, 15327–15334. [Google Scholar] [CrossRef] [Green Version]
  25. Wathen, C.A.; Caldwell, C.; Chanda, N.; Upendran, A.; Zambre, A.; Afrasiabi, Z.; Chapaman, S.E.; Foje, N.; Leevy, W.M.; Kannan, R. Selective X-Ray Contrast Enhancement of the Spleen of Living Mice Mediated by Gold Nanorods. Contrast Media Mol. Imaging 2015, 10, 188–193. [Google Scholar] [CrossRef]
  26. Quan, P.; Bu, W.; Lin, B.; Jiang, X.; Wang, L. Correlating Ligand Density with Cellular Uptake of Gold Nanorods Revealed by X-Ray Reflectivity. J. Nanosci. Nanotechnol. 2019, 19, 7557–7563. [Google Scholar] [CrossRef]
  27. Khademi, S.; Sarkar, S.; Kharrazi, S.; Amini, S.M.; Shakeri-Zadeh, A.; Ay, M.R.; Ghadiri, H. Evaluation of Size, Morphology, Concentration, and Surface Effect of Gold Nanoparticles on X-Ray Attenuation in Computed Tomography. Phys. Med. 2018, 45, 127–133. [Google Scholar] [CrossRef]
  28. Lusic, H.; Grinstaff, M.W. X-Ray Computed Tomography Contrast Agents. Chem. Rev. 2013, 113, 1641–1666. [Google Scholar] [CrossRef] [PubMed] [Green Version]
  29. Qu, X.; Li, X.; Liang, J.; Wang, Y.; Liu, M.; Liang, J. Micro-CT Imaging of RGD-Conjugated Gold Nanorods Targeting Tumor In Vivo. J. Nanomater. 2016, 2016, e8368154. [Google Scholar] [CrossRef] [Green Version]
  30. Terracciano, R.; Sprouse, M.L.; Wang, D.; Ricchetti, S.; Hirsch, M.; Ferrante, N.; Butler, E.B.; Demarchi, D.; Grattoni, A.; Filgueira, C.S. Intratumoral Gold Nanoparticle-Enhanced CT Imaging: An in Vivo Investigation of Biodistribution and Retention. In Proceedings of the IEEE 20th International Conference on Nanotechnology (IEEE-NANO), Montreal, QC, Canada, 29–31 July 2020; pp. 349–353. [Google Scholar] [CrossRef]
  31. Terracciano, R.; Zhang, A.; Butler, E.B.; Demarchi, D.; Hafner, J.H.; Grattoni, A.; Filgueira, C.S. Effects of Surface Protein Adsorption on the Distribution and Retention of Intratumorally Administered Gold Nanoparticles. Pharmaceutics 2021, 13, 216. [Google Scholar] [CrossRef]
  32. Pandey, A.; Vighetto, V.; Di Marzio, N.; Ferraro, F.; Hirsch, M.; Ferrante, N.; Mitra, S.; Grattoni, A.; Filgueira, C.S. Gold Nanoparticles Radio-Sensitize and Reduce Cell Survival in Lewis Lung Carcinoma. Nanomaterials 2020, 10, 1717. [Google Scholar] [CrossRef] [PubMed]
  33. Hlapisi, N.; Motaung, T.E.; Linganiso, L.Z.; Oluwafemi, O.S.; Songca, S.P. Encapsulation of Gold Nanorods with Porphyrins for the Potential Treatment of Cancer and Bacterial Diseases: A Critical Review. Bioinorg. Chem. Appl. 2019, 2019, e7147128. [Google Scholar] [CrossRef] [PubMed]
  34. Xia, L.; Zhang, C.; Li, M.; Wang, K.; Wang, Y.; Xu, P.; Hu, Y. Nitroxide-Radicals-Modified Gold Nanorods for in Vivo CT/MRI-Guided Photothermal Cancer Therapy. Int. J. Nanomed. 2018, 13, 7123–7134. [Google Scholar] [CrossRef] [Green Version]
  35. Qin, J.; Peng, Z.; Li, B.; Ye, K.; Zhang, Y.; Yuan, F.; Yang, X.; Huang, L.; Hu, J.; Lu, X. Gold Nanorods as a Theranostic Platform for in Vitro and in Vivo Imaging and Photothermal Therapy of Inflammatory Macrophages. Nanoscale 2015, 7, 13991–14001. [Google Scholar] [CrossRef] [PubMed]
  36. Youssef, Z.; Yesmurzayeva, N.; Larue, L.; Jouan-Hureaux, V.; Colombeau, L.; Arnoux, P.; Acherar, S.; Vanderesse, R.; Frochot, C. New Targeted Gold Nanorods for the Treatment of Glioblastoma by Photodynamic Therapy. J. Clin. Med. 2019, 8, 2205. [Google Scholar] [CrossRef] [PubMed] [Green Version]
  37. Her, S.; Jaffray, D.A.; Allen, C. Gold Nanoparticles for Applications in Cancer Radiotherapy: Mechanisms and Recent Advancements. Adv. Drug Deliv. Rev. 2017, 109, 84–101. [Google Scholar] [CrossRef] [PubMed]
  38. An, L.; Wang, Y.; Tian, Q.; Yang, S. Small Gold Nanorods: Recent Advances in Synthesis, Biological Imaging, and Cancer Therapy. Materials 2017, 10, 1372. [Google Scholar] [CrossRef] [Green Version]
  39. Mehtala, J.G.; Zemlyanov, D.Y.; Max, J.P.; Kadasala, N.; Zhao, S.; Wei, A. Citrate-Stabilized Gold Nanorods. Langmuir 2014, 30, 13727–13730. [Google Scholar] [CrossRef] [Green Version]
  40. Ito, E.; Yip, K.W.; Katz, D.; Fonseca, S.B.; Hedley, D.W.; Chow, S.; Xu, G.W.; Wood, T.E.; Bastianutto, C.; Schimmer, A.D.; et al. Potential Use of Cetrimonium Bromide as an Apoptosis-Promoting Anticancer Agent for Head and Neck Cancer. Mol. Pharmacol. 2009, 76, 969–983. [Google Scholar] [CrossRef] [Green Version]
  41. He, J.; Unser, S.; Bruzas, I.; Cary, R.; Shi, Z.; Mehra, R.; Aron, K.; Sagle, L. The Facile Removal of CTAB from the Surface of Gold Nanorods. Colloids Surf. B. Biointerfaces 2018, 163, 140–145. [Google Scholar] [CrossRef]
  42. Alkilany, A.M.; Nagaria, P.K.; Hexel, C.R.; Shaw, T.J.; Murphy, C.J.; Wyatt, M.D. Cellular Uptake and Cytotoxicity of Gold Nanorods: Molecular Origin of Cytotoxicity and Surface Effects. Small 2009, 5, 701–708. [Google Scholar] [CrossRef] [PubMed]
  43. Lee, H.; Hong, Y.; Lee, D.; Hwang, S.; Lee, G.; Yang, J.; Yoon, D.S. Surface Potential Microscopy of Surfactant-Controlled Single Gold Nanoparticle. Nanotechnology 2020, 31, 215706. [Google Scholar] [CrossRef] [PubMed]
  44. Zhang, Y.; Xu, D.; Li, W.; Yu, J.; Chen, Y. Effect of Size, Shape, and Surface Modification on Cytotoxicity of Gold Nanoparticles to Human HEp-2 and Canine MDCK Cells. J. Nanomater. 2012, 2012, 375496. [Google Scholar] [CrossRef] [Green Version]
  45. Shi, X.; Perry, H.L.; Wilton-Ely, J.D.E.T. Strategies for the Functionalisation of Gold Nanorods to Reduce Toxicity and Aid Clinical Translation. Nanotheranostics 2021, 5, 155–165. [Google Scholar] [CrossRef]
  46. Schulz, F.; Friedrich, W.; Hoppe, K.; Vossmeyer, T.; Weller, H.; Lange, H. Effective PEGylation of Gold Nanorods. Nanoscale 2016, 8, 7296–7308. [Google Scholar] [CrossRef] [PubMed] [Green Version]
  47. Santhosh, P.B.; Thomas, N.; Sudhakar, S.; Chadha, A.; Mani, E. Phospholipid Stabilized Gold Nanorods: Towards Improved Colloidal Stability and Biocompatibility. Phys. Chem. Chem. Phys. 2017, 19, 18494–18504. [Google Scholar] [CrossRef] [PubMed]
  48. Su, L.; Hu, S.; Zhang, L.; Wang, Z.; Gao, W.; Yuan, J.; Liu, M. A Fast and Efficient Replacement of CTAB with MUA on the Surface of Gold Nanorods Assisted by a Water-Immiscible Ionic Liquid. Small 2017, 13, 1602809. [Google Scholar] [CrossRef]
  49. Pan, B.; Gao, F.; Ao, L.; Tian, H.; He, R.; Cui, D. Controlled Self-Assembly of Thiol-Terminated Poly(Amidoamine) Dendrimer and Gold Nanoparticles. Colloids Surf. A Physicochem. Eng. Asp. 2005, 259, 89–94. [Google Scholar] [CrossRef]
  50. Yasun, E.; Li, C.; Barut, I.; Janvier, D.; Qiu, L.; Cui, C.; Tan, W. BSA Modification to Reduce CTAB Induced Nonspecificity and Cytotoxicity of Aptamer-Conjugated Gold Nanorods. Nanoscale 2015, 7, 10240–10248. [Google Scholar] [CrossRef] [Green Version]
  51. Mahiuddin, S.; Zech, O.; Raith, S.; Touraud, D.; Kunz, W. Catanionic Micelles As a Model to Mimic Biological Membranes in the Presence of Anesthetic Alcohols. Langmuir 2009, 25, 12516–12521. [Google Scholar] [CrossRef]
  52. Li, J.; Wang, W.; Zhang, X.; Yao, H.; Wei, Z.; Li, X.; Mu, X.; Jiang, J.; Zhang, H. Seedless Preparation of Au Nanorods by Hydroquinone Assistant and Red Blood Cell Membrane Camouflage. RSC Adv. 2018, 8, 21316–21325. [Google Scholar] [CrossRef] [Green Version]
  53. Jain, P.K.; Lee, K.S.; El-Sayed, I.H.; El-Sayed, M.A. Calculated Absorption and Scattering Properties of Gold Nanoparticles of Different Size, Shape, and Composition: Applications in Biological Imaging and Biomedicine. J. Phys. Chem. B 2006, 110, 7238–7248. [Google Scholar] [CrossRef] [PubMed] [Green Version]
  54. Matthews, J.R.; Payne, C.M.; Hafner, J.H. Analysis of Phospholipid Bilayers on Gold Nanorods by Plasmon Resonance Sensing and Surface-Enhanced Raman Scattering. Langmuir 2015, 31, 9893–9900. [Google Scholar] [CrossRef] [PubMed]
  55. Simeral, M.L.; Zhang, A.; Demers, S.M.E.; Hughes, H.J.; Abdul-Moqueet, M.; Mayer, K.M.; Hafner, J.H. Effects of Conformational Variation on Structural Insights from Solution-Phase Surface-Enhanced Raman Spectroscopy. J. Phys. Chem. B 2021, 125, 2031–2041. [Google Scholar] [CrossRef] [PubMed]
  56. Ye, X.; Zheng, C.; Chen, J.; Gao, Y.; Murray, C.B. Using Binary Surfactant Mixtures to Simultaneously Improve the Dimensional Tunability and Monodispersity in the Seeded Growth of Gold Nanorods. Nano Lett. 2013, 13, 765–771. [Google Scholar] [CrossRef] [PubMed]
  57. Hughes, H.J.; Demers, S.M.E.; Zhang, A.; Hafner, J.H. The Orientation of a Membrane Probe from Structural Analysis by Enhanced Raman Scattering. Biochim. Biophys. Acta Biomembr. 2020, 1862, 183109. [Google Scholar] [CrossRef] [PubMed]
  58. Hillegass, J.M.; Shukla, A.; Lathrop, S.A.; MacPherson, M.B.; Fukagawa, N.K.; Mossman, B.T. Assessing Nanotoxicity in Cells in Vitro. Wiley Interdiscip. Rev. Nanomed. Nanobiotechnol. 2010, 2, 219–231. [Google Scholar] [CrossRef] [Green Version]
  59. Hussain, S. Measurement of Nanoparticle-Induced Mitochondrial Membrane Potential Alterations. Methods Mol. Biol. 2019, 1894, 123–131. [Google Scholar] [CrossRef]
  60. Pavlovich, E.; Volkova, N.; Yakymchuk, E.; Perepelitsyna, O.; Sydorenko, M.; Goltsev, A. In Vitro Study of Influence of Au Nanoparticles on HT29 and SPEV Cell Lines. Nanoscale Res. Lett. 2017, 12, 1–9. [Google Scholar] [CrossRef] [Green Version]
  61. Levin, C.S.; Janesko, B.G.; Bardhan, R.; Scuseria, G.E.; Hartgerink, J.D.; Halas, N.J. Chain-Length-Dependent Vibrational Resonances in Alkanethiol Self-Assembled Monolayers Observed on Plasmonic Nanoparticle Substrates. Nano Lett. 2006, 6, 2617–2621. [Google Scholar] [CrossRef]
  62. Matthews, J.R.; Shirazinejad, C.R.; Isakson, G.A.; Demers, S.M.E.; Hafner, J.H. Structural Analysis by Enhanced Raman Scattering. Nano Lett. 2017, 17, 2172–2177. [Google Scholar] [CrossRef] [PubMed]
  63. Levin, C.S.; Bishnoi, S.W.; Grady, N.K.; Halas, N.J. Determining the Conformation of Thiolated Poly(Ethylene Glycol) on Au Nanoshells by Surface-Enhanced Raman Scattering Spectroscopic Assay. Anal. Chem. 2006, 78, 3277–3281. [Google Scholar] [CrossRef] [PubMed]
  64. Kundu, J.; Levin, C.S.; Halas, N.J. Real-Time Monitoring of Lipid Transfer between Vesicles and Hybrid Bilayers on Au Nanoshells Using Surface Enhanced Raman Scattering (SERS). Nanoscale 2009, 1, 114–117. [Google Scholar] [CrossRef]
  65. Levin, C.S.; Kundu, J.; Janesko, B.G.; Scuseria, G.E.; Raphael, R.M.; Halas, N.J. Interactions of Ibuprofen with Hybrid Lipid Bilayers Probed by Complementary Surface-Enhanced Vibrational Spectroscopies. J. Phys. Chem. B 2008, 112, 14168–14175. [Google Scholar] [CrossRef] [Green Version]
  66. Levin, C.S.; Kundu, J.; Barhoumi, A.; Halas, N.J. Nanoshell-Based Substrates for Surface Enhanced Spectroscopic Detection of Biomolecules. Analyst 2009, 134, 1745–1750. [Google Scholar] [CrossRef]
  67. Heuer-Jungemann, A.; Feliu, N.; Bakaimi, I.; Hamaly, M.; Alkilany, A.; Chakraborty, I.; Masood, A.; Casula, M.F.; Kostopoulou, A.; Oh, E.; et al. The Role of Ligands in the Chemical Synthesis and Applications of Inorganic Nanoparticles. Chem. Rev. 2019, 119, 4819–4880. [Google Scholar] [CrossRef] [Green Version]
  68. Hauck, T.S.; Ghazani, A.A.; Chan, W.C.W. Assessing the Effect of Surface Chemistry on Gold Nanorod Uptake, Toxicity, and Gene Expression in Mammalian Cells. Small 2008, 4, 153–159. [Google Scholar] [CrossRef]
  69. Jia, Y.P.; Shi, K.; Liao, J.F.; Peng, J.R.; Hao, Y.; Qu, Y.; Chen, L.J.; Liu, L.; Yuan, X.; Qian, Z.Y.; et al. Effects of Cetyltrimethylammonium Bromide on the Toxicity of Gold Nanorods Both In Vitro and In Vivo: Molecular Origin of Cytotoxicity and Inflammation. Small Methods 2020, 4, 1900799. [Google Scholar] [CrossRef]
  70. Fernando, D.; Sulthana, S.; Vasquez, Y. Cellular Uptake and Cytotoxicity of Varying Aspect Ratios of Gold Nanorods in HeLa Cells. ACS Appl. Bio Mater. 2020, 3, 1374–1384. [Google Scholar] [CrossRef]
  71. Alkilany, A.M.; Murphy, C.J. Toxicity and Cellular Uptake of Gold Nanoparticles: What We Have Learned so Far? J. Nanopart. Res. 2010, 12, 2313–2333. [Google Scholar] [CrossRef] [PubMed] [Green Version]
  72. Chua, C.Y.X.; Ho, J.; Demaria, S.; Ferrari, M.; Grattoni, A. Emerging Technologies for Local Cancer Treatment. Adv. Ther. 2020, 3, 2000027. [Google Scholar] [CrossRef] [PubMed]
  73. Liu, H.-C.; Viswanath, D.I.; Pesaresi, F.; Xu, Y.; Zhang, L.; Di Trani, N.; Paez-Mayorga, J.; Hernandez, N.; Wang, Y.; Erm, D.R.; et al. Potentiating Antitumor Efficacy Through Radiation and Sustained Intratumoral Delivery of Anti-CD40 and Anti-PDL1. Int. J. Radiat. Oncol. Biol. Phys. 2021, 110, 492–506. [Google Scholar] [CrossRef] [PubMed]
  74. Chua, C.Y.X.; Ho, J.; Susnjar, A.; Lolli, G.; Trani, N.D.; Pesaresi, F.; Zhang, M.; Nance, E.; Grattoni, A. Intratumoral Nanofluidic System for Enhancing Tumor Biodistribution of Agonist CD40 Antibody. Adv. Ther. 2020, 3, 2000055. [Google Scholar] [CrossRef]
  75. Chua, C.Y.X.; Jain, P.; Susnjar, A.; Rhudy, J.; Folci, M.; Ballerini, A.; Gilbert, A.; Singh, S.; Bruno, G.; Filgueira, C.S.; et al. Nanofluidic Drug-Eluting Seed for Sustained Intratumoral Immunotherapy in Triple Negative Breast Cancer. J. Control. Release 2018, 285, 23–34. [Google Scholar] [CrossRef]
Figure 1. Surface chemistry modification and characterization of CTAB-GNRs and SDS-GNRs. (A) Schematic of the surface chemistry modification process of the nanorods with CTAB and SDS surfactants. (B) Transmission electron microscopy (TEM) images of the particles and quantification of particle length, width and aspect ratio. (C) Zeta potential and (D) absorbance spectra of the nanorods stabilized with CTAB and SDS. (E) X-ray attenuation of the nanorods as a function of gold concentration obtained using a micro-CT source. CT contrast (upper view) and photos (lower view) for each sample dilution. X-ray attenuation as a function of gold concentration is plotted. Data points are fit using linear regression (CTAB-GNRs) where y = 24.7x + 2.5 or two-phase association (SDS-GNRs) where y = 151.1 × (1 − e−6.9x) + 45658.2 × (1 − e−6.9x).
Jnt 02 00010 g001
Figure 2. (A) SERS spectra of CTAB-GNRs and SDS-GNRs and tentative band assignments. (B) Unenhanced Raman spectra of pure CTAB and SDS solutions for reference. Absorption spectra of (C) SDS-GNRs and SDS-GNRs in serum and (D) CTAB-GNRs and CTAB-GNRs in serum. (E) Optical photos of the functionalized GNRs in serum showing instability of CTAB-GNRs.
Jnt 02 00010 g002
Figure 3. Effects of CTAB-GNR and SDS-GNR treatment on cell viability. Optical microscopy images of (A) HeLa and (B) LLC cells treated and incubated for 24 h with 15 μg [Au] /mL CTAB-GNRs and SDS-GNRs. Trypan blue assay for (C) HeLa and (D) LLC cells treated and incubated for 24 h with CTAB-GNRs and SDS-GNRs. Significant difference between groups (*** p < 0.0005, **** p < 0.0001). MTT assay for (E) HeLa and (F) LLC cells treated and incubated for 24 h with CTAB-GNRs and SDS-GNRs. Significant difference between groups (**** p < 0.0001) for all treatment doses. SDS-GNRs are significantly cytotoxic at higher doses in both cell lines. All data in the figure are reported as mean ± s.e.m in triplicate.
Jnt 02 00010 g003
Figure 4. Effects of CTAB-GNR and SDS-GNR treatment on cell viability as function of incubation time and cell line. (A,B) Viability determined by Trypan blue assay and (C,D) intracellular uptake determined by ICP-OES plotted as function of incubation time for (A,C) HeLa and (B,D) LLC cells. Significant cytotoxicity for CTAB-GNRs (* p < 0.05, ** p < 0.0005, **** p < 0.0001). All data in the figure are reported as mean ± s.e.m in triplicate. SEM images in STEM mode of fixed (E) HeLa and (F) LLC cells treated and incubated for 24 h with CTAB-GNRs and SDS-GNRs.
Jnt 02 00010 g004
Publisher’s Note: MDPI stays neutral with regard to jurisdictional claims in published maps and institutional affiliations.

