Article

Multiscale Remote Sensing Data Integration for Gully Erosion Monitoring in Southern Brazil: Case Study

by
Fábio Marcelo Breunig
1,*,
Malva Andrea Mancuso
2,
Ana Clara Amalia Coimbra
3,
Leonardo José Cordeiro Santos
1,
Tais Cristina Hempe
2,
Elaine de Cacia de Lima Frick
1,
Edenilson Roberto do Nascimento
1,
Tony Vinicius Moreira Sampaio
1,
William Gaida
3,
Elias Fernando Berra
1,
Romário Trentin
4,
Arsalan Ahmed Othman
5,6 and
Veraldo Liesenberg
7
1
Department of Geography, Federal University of Paraná (UFPR), Curitiba 81531-990, PR, Brazil
2
Department of Engineering and Environmental Technology, Federal University of Santa Maria (UFSM), Frederico Westphalen 98400-000, RS, Brazil
3
Department of Forest Engineering, Federal University of Santa Maria (UFSM), Frederico Westphalen 98400-000, RS, Brazil
4
Department of Geography, Federal University of Santa Maria, Santa Maria 97105-900, RS, Brazil
5
Iraq Geological Survey, Sulaymaniyah Office, Sulaymaniyah 46001, Iraq
6
Petroleum Engineering Department, College of Engineering, Komar University of Science and Technology, Sulaymaniyah 460013, Iraq
7
Department of Forest Engineering, Santa Catarina State University (UDESC), Lages 88520-000, SC, Brazil
*
Author to whom correspondence should be addressed.
AgriEngineering 2025, 7(7), 212; https://doi.org/10.3390/agriengineering7070212
Submission received: 24 April 2025 / Revised: 17 June 2025 / Accepted: 19 June 2025 / Published: 2 July 2025

Abstract

The degradation and loss of arable soils pose significant challenges to global food security, requiring advanced mapping and monitoring techniques to improve soil and crop management. This study evaluates the integration of Unmanned Aerial Vehicles (UAVs) and orbital sensor data for monitoring and quantifying gullies with low-cost data. The research focuses on a gully in southern Brazil, utilizing high-spatial-resolution imagery to analyze its evolution over a 25-year period (2000–2024). Photointerpretation and manual delineation procedures were adopted to define gully shoulder lines, based on low-cost and multiple-spatial-resolution data from Google Earth Pro (GEP), UAVs and conventional aerial photographs. Planimetric, volumetric, climatic, and pedological parameters were assessed and evaluated over time. Field inspections supported our interpretations. The results show that gully expansion can be effectively mapped and monitored by combining high-spatial-resolution GEP data with aerial imagery. The gully area has increased by more than 50% over the past two decades, based on GEP data, which were corroborated by submeter-resolution UAV data. The findings indicate that the erosive process remains active, progressing toward the base level. These results provide critical insights for land managers, policymakers, and agricultural stakeholders to implement targeted soil recovery strategies and mitigate further land degradation.

1. Introduction

Advances in Brazilian agriculture are crucial to ensuring food security in various regions of the world [1], as Brazil’s agriculture sector feeds 10% of the world’s population. Furthermore, the quality of agricultural areas associated with soil degradation and loss has led to a reduction or even made crop production unfeasible, as well as, in some cases, the advancement of erosion processes [2,3,4]. Considering the five classes of soil vulnerability intensity to water erosion (mainly based on erodibility and slope), a higher concentration of vulnerable soils is observed in the western regions of the states of South Brazil and São Paulo [5]. Degraded soil results in a loss of quality and productive capacity, and, thus, its ecological, economic, and social functions become restricted.
Proper management practices and monitoring systems must be adopted to achieve sustainable production [6,7]. Understanding the dynamics of degraded soils is crucial, as their recovery is time-consuming and generates high costs [8,9]. For example, ravines and gullies are among the primary types of environmental degradation that require efforts for proper control, mitigation, and recovery [2,10,11]. However, monitoring these areas requires the use of techniques that allow for combining punctual field data with macro-scale approaches, such as remote sensing techniques [12,13] with proper methods for each scale [14].
Among the existing conventional techniques, the use of pegs and erosion pins stands out for measuring the retreat of margins and verifying erosion movement [15]. For this reason, it is relevant to seek more accurate methods for monitoring erosive processes [6,16]. In this scenario, geotechnologies become significant tools [3,17,18]. With the availability of high-spatial-resolution remote sensing data, such as products associated with the Google Earth Pro (GEP) platform (© Google LCC, Mountain View, CA, USA), the monitoring of gully areas can be carried out at different scales [19,20]. In parallel, Unmanned Aerial Vehicles (UAVs) have gained popularity and are finding niches in agricultural and environmental applications [16,21,22,23,24,25]. Despite some methodological proposals [20], the combined use of GEP, UAV, and conventional (manned aircraft) aerial photographs still requires more investigation. The challenge refers to the integration of multiple high-spatial-resolution data without precise ground control points (GCPs), across multiple dates, as well as the spectral capabilities of such sensors.
Considering the relevance of studies on erosive processes and the potential use of multiscale and multi-temporal remote sensing data, the study objective was to evaluate the potential of integrating airborne and orbital high-spatial-resolution data for gully monitoring and characterization in southern Brazil. Specifically, we focused on the following: (a) planimetric measurement of gully size; (b) volumetry of removed sediments; and (c) the time dynamics of these variables. A semi-automatic integration of UAV, conventional airborne data, and high-spatial-resolution data from Google Earth Pro (GEP) was implemented. As a case study, a gully located in the municipality of Palmeira das Missões, in the north of Rio Grande do Sul State, Brazil, was selected, considering the area’s representativeness in the region and the scarcity of studies in the area. This study focused on low-cost or freely available data [20].

2. Materials and Methods
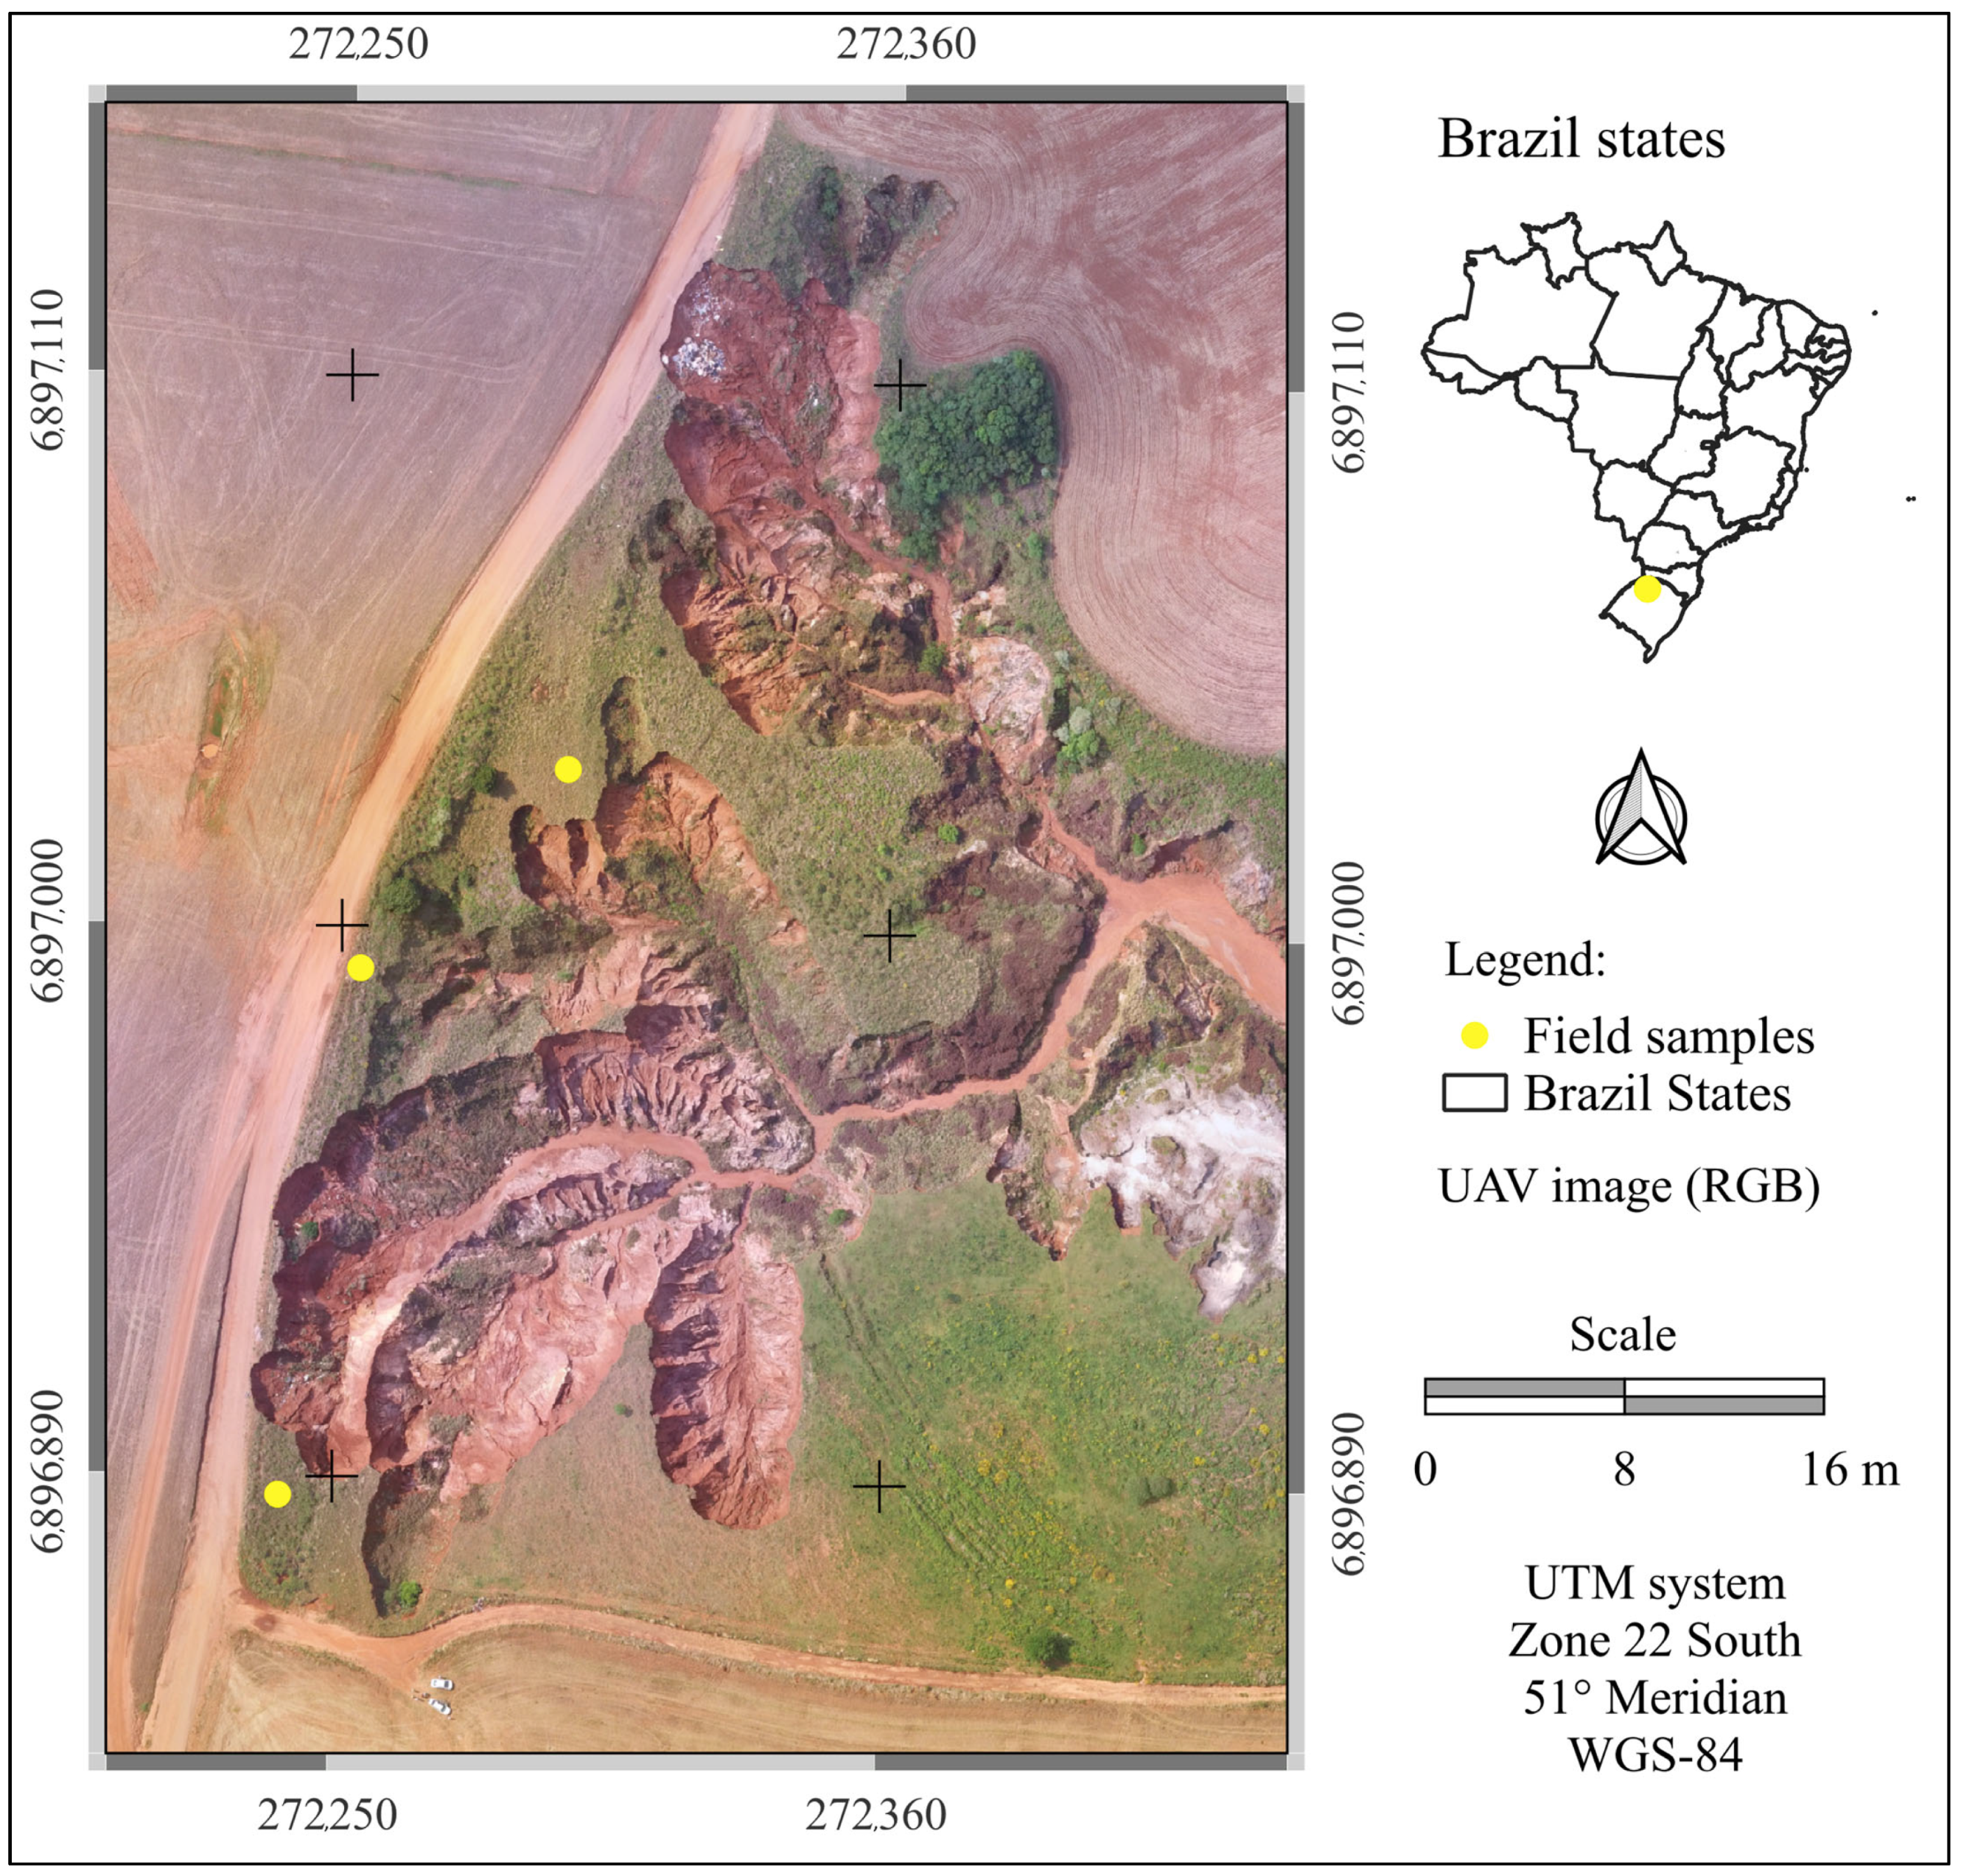
This study’s main steps were field campaigns, the acquisition of UAV and conventional aerial data, and orbital data from the Google Earth Pro platform. The main methodological steps are presented in Figure 1.

2.1. Study Area

In Brazil, the processes of soil loss and degradation through sandification (similar to desertification [26,27,28]) are expanding, primarily due to inadequate anthropic land use in conjunction with its inherent fragility [26,27,28]. Guerra and Jorge [29] and Guerra et al. [30] highlight two erosion drivers in Brazil: the first is associated with natural conditions with emphasis on topography, soil texture, vegetation cover, and hydrological regime; the second considers anthropic actions related to the removal of vegetation cover for cultivation/pasture/urban expansion and specific interventions, such as slope cuts. The pressure exerted by anthropogenic activities on soils can be considered a significant contributor to the emergence of erosion processes [31]. Therefore, coupled effects must be considered on a local scale.
In the Rio Grande do Sul, Brazil’s southernmost state, the study of erosive processes has focused on the western region due to the natural fragility of its soils in the Pampa biome (grasslands) [32,33,34]. The western region of the state has the highest concentration of gullies, which mainly extend through the municipality of Cacequi over the Piramboia Formation. Several studies have been conducted to analyze these processes, their conditioning factors and types of evolution [35,36].
In the northern region of Rio Grande do Sul, the Tupanciretã formation extends across several municipalities and significantly contributes to the formation of gullies due to its association with erosion processes during its formation. Unlike in the west of the state, processes in this geological formation are less frequent but generate intense gullies [37,38]. Although research into gullies in the state has been ongoing for several decades, the application of modern technologies such as UAV is recent and could enhance our understanding of these processes. In this region, the occurrence of gullies has been a significant environmental problem that needs to be mitigated. This region represents a significant commodity as a production region. Interestingly, various erosive processes can be identified in the Palmeira das Missões, whose economic base is primarily livestock and agriculture. Despite this, the nature of the origin and evolution of these areas remain under discussion [26,27,28,29,30,31,32,33,34,35,36].
A regional representative gully located in the municipality of Palmeira das Missões, Rio Grande do Sul State, Brazil, was selected due to the availability of airborne, UAV, and GEP data, which allowed for evaluating the dynamics of the erosive process (Figure 2). The selected gully limits are located near the state road designated as RS-508. The base of the gully (deposition area) remains a source of construction sand extraction, which has implications for the silting of headwater streams. The surrounding area consists of agricultural land, and according to Sangiovo [39], the process began more than 40 years ago. The region’s relief is gently undulating to flat. Several other erosive processes can be found in the neighborhood, indicating the region’s fragility.
The region is characterized by a humid subtropical climate, as classified by the Köppen–Geiger climate classification: Cfa [40,41]. According to EMBRAPA [42], the predominant soils in the municipality of Palmeira das Missões are Dystrophic Red Latosol + Eutrophic Red Nitosols; Dystrophic Red Latosol; Dystrophic Red Latosol + Eutrophic Red Nitosols + Eutrophic Haplic Nitosols; and Eutrophic Litholic Neosols + Orthic Ebanic Vertisols + Eutrophic Haplic Cambisols. In the gully area, there is a predominance of Dystrophic Red Latosol. The region is characterized by cultivated commodities (soybeans, maize, and wheat) and livestock. Annual crops are usually associated with monocultures such as soybeans, corn, and wheat, in line with the state’s agricultural production incentive policy [43,44]. Based on Ruppel et al. [45] and Menegotto et al. [46], the region is located on the Tupaciretã formation.
The municipality of Palmeira das Missões is located in a transition area of contact between two phytogeographic formations of Rio Grande do Sul, composed of a Deciduous Seasonal Forest and a Mixed Ombrophilous Forest [47,48].

2.2. Data Acquisition and Pre-Processing

2.2.1. Field Data

Two field campaigns, conducted on 18 October 2017 and 9 May 2023, were carried out to obtain UAV data. For this purpose, a Matrice 100 UAV with an X3 camera (16 MPixels) [49] and a Phantom 4 with a 12 MPixels RGB camera [50] were used. In both campaigns, autonomous planned flights and manual observation flights were conducted to acquire photographs and videos.
Complementary field activities were conducted to collect three soil samples from the topsoil of the gully, with the aim of determining the following physical parameters: soil texture and saturation (Figure 2). The determinations were made in the soil physics laboratory of the Federal University of Santa Maria—Frederico Westphalen Campus. The samples were collected at a depth of 0–10 cm. The collection site was cleaned with a hoe, and volumetric rings of 100 cm3 were placed on the bare soil. Using an iron extractor, the rings were fitted with a hammer, and soil samples were taken from three different locations in triplicate for soil density analysis. Deformed (mixed) samples were collected for texture analysis to complement the soil analysis. The soil analysis followed the Brazilian recommendation [51].
Figure 2. UAV RGB true-color composition of 2023 for the gully in the municipality of Palmeira das Missões, in the north of Rio Grande do Sul State, Brazil. Brazilian states are indicated in the top-right subfigure. Source: Vector data were acquired from IBGE [48]. Yellow dots indicate the soil sample collection points, at the border of the gully topsoils. Cross symbols indicate the geographic coordinates within the figure.
Agriengineering 07 00212 g002

2.2.2. UAV Data

Planned flights were defined using the Pix4D(©) 1.3.1 capture application, with 80% along and across the overlay. The photographs were taken at nadir (90°) with automatic sensitivity control (gedISO). The 2017 flights were conducted at altitudes of 80 and 120 m above the highest point in the region (the takeoff point). For 2023, flights were conducted at heights varying from 60 to 120 m. Manual flights were conducted at varied heights and geometries to highlight the “ridges” and “walls” that form the features of interest within the gully and to facilitate the post-interpretation.
For the processing of planimetric images, Agisoft Metashape software [52] was used, implementing Structure from Motion (SfM) algorithms [53,54]. All processing steps were performed using the highest-quality settings available. Thus, sequential processing was adopted: (a) alignment of photographs; (b) dense point cloud; (c) Digital Surface Model (DEM); (d) composition of an ortho-mosaic. In the first step, the number of keys and tie points was limited to 40,000 and 4000, respectively. In the second step, dense cloud creation, a mild depth filtering process was applied using ultra-high setting. In this step, we also calculated a confidence band (95%). For DEM, the point cloud was used with interpolation enabled. For the year 2021, we evaluated the vegetation classification algorithm and generated a DEM based only on the ground points. The ortho-mosaic was created using the DEM as the surface model, and hole filling was enabled. The ground sample distance (GSD) of the acquisitions ranged from 2.50 cm to 7.20 cm, depending on the chosen height. The creation of 360 photographs and videos was the purpose behind the flying of the manual flies.
Additionally, data filtering tests were conducted to attempt to remove vegetation from the DEM using Metashape’s standard parameters. Finally, the data were exported to GIS 3.40 software (QGIS [55]) for the quantification of the gully area. Volumetry was calculated within Agisoft Metashape software [52] to quantify the soil loss over time.
The Agisoft Metashape software used the “best fit” model to delineate cross-sectional profiles and calculate volumes. The profiles were drawn in defined sectors to enable the analysis of the temporal evolution of the erosive process.

2.2.3. Conventional Aerial Data

The airborne data were obtained from the collection of the Map Library of the 1 Centro de Geoinformação (1 CGEO) of the Brazilian Army’s Directory of Geographic Service (DSG). A photograph associated with the CONDOR topographic map (CONDOR Sheet—SH-22-V-A-II-1—Index map code 2916-1), dated 1995 at 1:50,000 scale (standard error < 15 m, according to the PEC), was used. The photograph was georeferenced using large topographic and anthropic landmarks as a reference; however, due to georeferencing constraints, a direct match with the other data (UAV and GEP) was not possible. Thus, only planimetric measurements were extracted from this product. Complementarily, an old version of the topographic chart was used (CONDOR Sheet—SH-22-V-A-II-1—Index map code 2916-1) prepared by the Brazilian Directory of Geographic Service (DSG).

2.2.4. Satellite Data—Google Earth Pro (GEP)

For this study, aerial and orbital images were acquired (Figure 2). The orbital data were obtained from the Google Earth Pro platform (GEP, 2024, Google LLC). To standardize the study area, a bounding rectangle was created using the high-spatial-resolution image from 2024, as a reference obtained via the Quick Map Service plugin within QGIS software [55]. To extract the other high-spatial-resolution images from the GEP platform, a vector rectangle was created and exported to Google Earth Pro. Subsequently, the images were exported at the highest-possible spatial resolution (8192 × 4712 pixels) in JPG format. They were then georeferenced based on the 2024 image corners and reference points. These images underwent adjustments to enhance the contrast, brightness, and saturation of the scenes. Despite the georeferencing process, it was not possible to provide positional error data due to the absence of permanent ground control points (GCPs) on all dates. Still, another study found GEP images geolocation average error of 4.38 m, ranging from 2 to 10 m according to the region [56]. Thus, high-spatial-resolution images of GEP were obtained for the years 2000, 2004, 2012, and 2024.

2.2.5. Ancillary Data

Additionally, precipitation data for the years under evaluation were obtained to investigate any possible qualitative relationship between rainfall and the gully evolution. A direct cross-correlation was not possible because of the absence of compatible temporal UAV coverage. This information was obtained from the automatic weather station of Palmeira das Missões [57]. To increase temporal coverage, data from the GPM GPM_3IMERGM v07 product (Time Series, Area-Averaged of Merged Satellite-Gauge Precipitation Eimate—Final Run-in mm/month) [58] were used. Furthermore, due to gaps in the time series, monthly reanalysis data from the Climate Hazards Group InfraRed Precipitation with station data were also integrated [59].

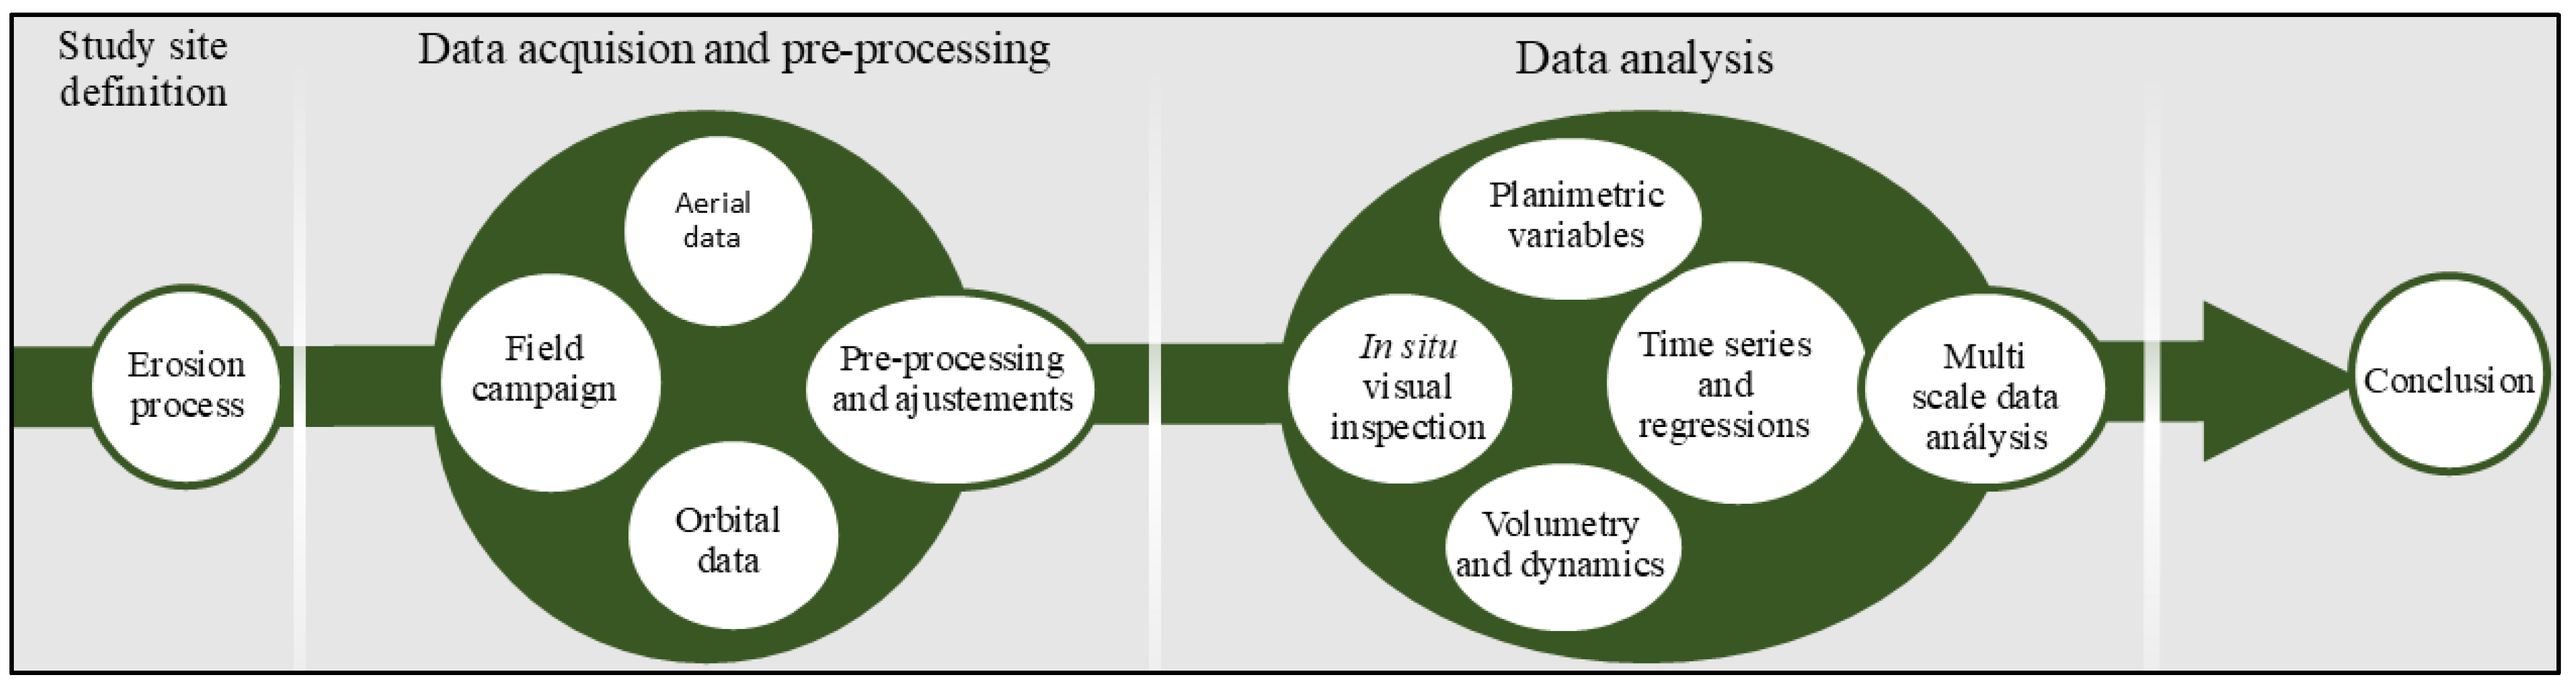
2.3. Data Analysis Procedures

Initially, the gully expansion was visually interpreted and mapped, supported by orbital, airborne, and UAV images. This step involves identifying important elements within the gully, such as shape, soil strata, land use, and land cover (anthropic use). Thus, color compositions of the RGB orbital images were created, complemented with field photographs and videos.
Because of the absence of GCPs, a careful manual procedure was adopted to define the gully shoulder lines for each date. The same specialist carried out the process using the GEP true-color RGB composition. Additionally, some pseudo-invariant targets were used as references (e.g., trees and fences). The lower stream section was used as a reference based on the triangulation of the invariant target position. Due to the absence of GCPs throughout the entire period for precise georeferencing of the images, the gully boundaries were used cautiously, respecting the possible displacements inherent to the positioning method of orbital and aerial images (e.g., viewing and illumination geometry). This careful manual procedure allowed for a reduction in viewing and illumination effects on the gully shoulder lines, resulting in a more precise area and volume calculation.
Regression equations (linear, 2nd-order polynomial, and logistic models) were developed based on the gully area to identify the evolution pattern from 1995 to 2024. All available images (orbital, aerial, and UAV) were used. With the result, the R2 value and the RMSE were calculated. Considering the potential for projection into the past, the 95% confidence band and the entire residual analysis of the model were calculated. Additionally, gully area information was obtained from the original photography of the 1995 topographic chart. Finally, the first topographic chart allowed us to evaluate the relative position of the road in 1976.
Another approach involved mapping the position of the highway near the gully (Figure 2), which had been sequentially relocated over the years. Thus, it was possible to identify the gully’s superficial expansion rate and better understand the dynamics of the processes involved (anthropic, superficial, and subsurface drivers). Despite having a topographic map from the 1970s, the mapping of the highway positions was not considered due to the large difference in mapping scale (1:50,000 on the map) and positioning errors (georeferencing without well-defined control points). These data were used as Supplementary Materials (Figure S1).
To obtain volumetric estimates of the lost soil, only 2017 and 2023, for which UAV data were available, were considered. Thus, based on the defined boundaries for each year, the volumetry was calculated for both the entire gully and its specific sectors.
Finally, UAV data generated a DEM for both 2017 and 2023. The relative altimetry information was cross-referenced with the gully shoulder line information. Furthermore, this information served as a basis for discussing the potential advancement of the erosive process toward the subsurface water level. Thus, areas with a higher probability of being affected by the process were identified. These results were discussed in consideration of the hydrodynamic process trends associated with the evolution of the erosive process.
To understand the context of the gully dynamics of the groundwater base level, longitudinal and transverse profiles of the RS-508 highway were developed. For this purpose, the DEM generated from the 2017 UAV images was utilized. The model refers to relative altitudes (without GCP correction). The profile locations aimed to highlight the highway and its potential contribution as an intensifier of the erosive process under study. The DEM of 2023 could not be used because of the presence of vegetation within the gully. Such conditions did not allow for the calculation of practical ground-level surface models.

3. Results

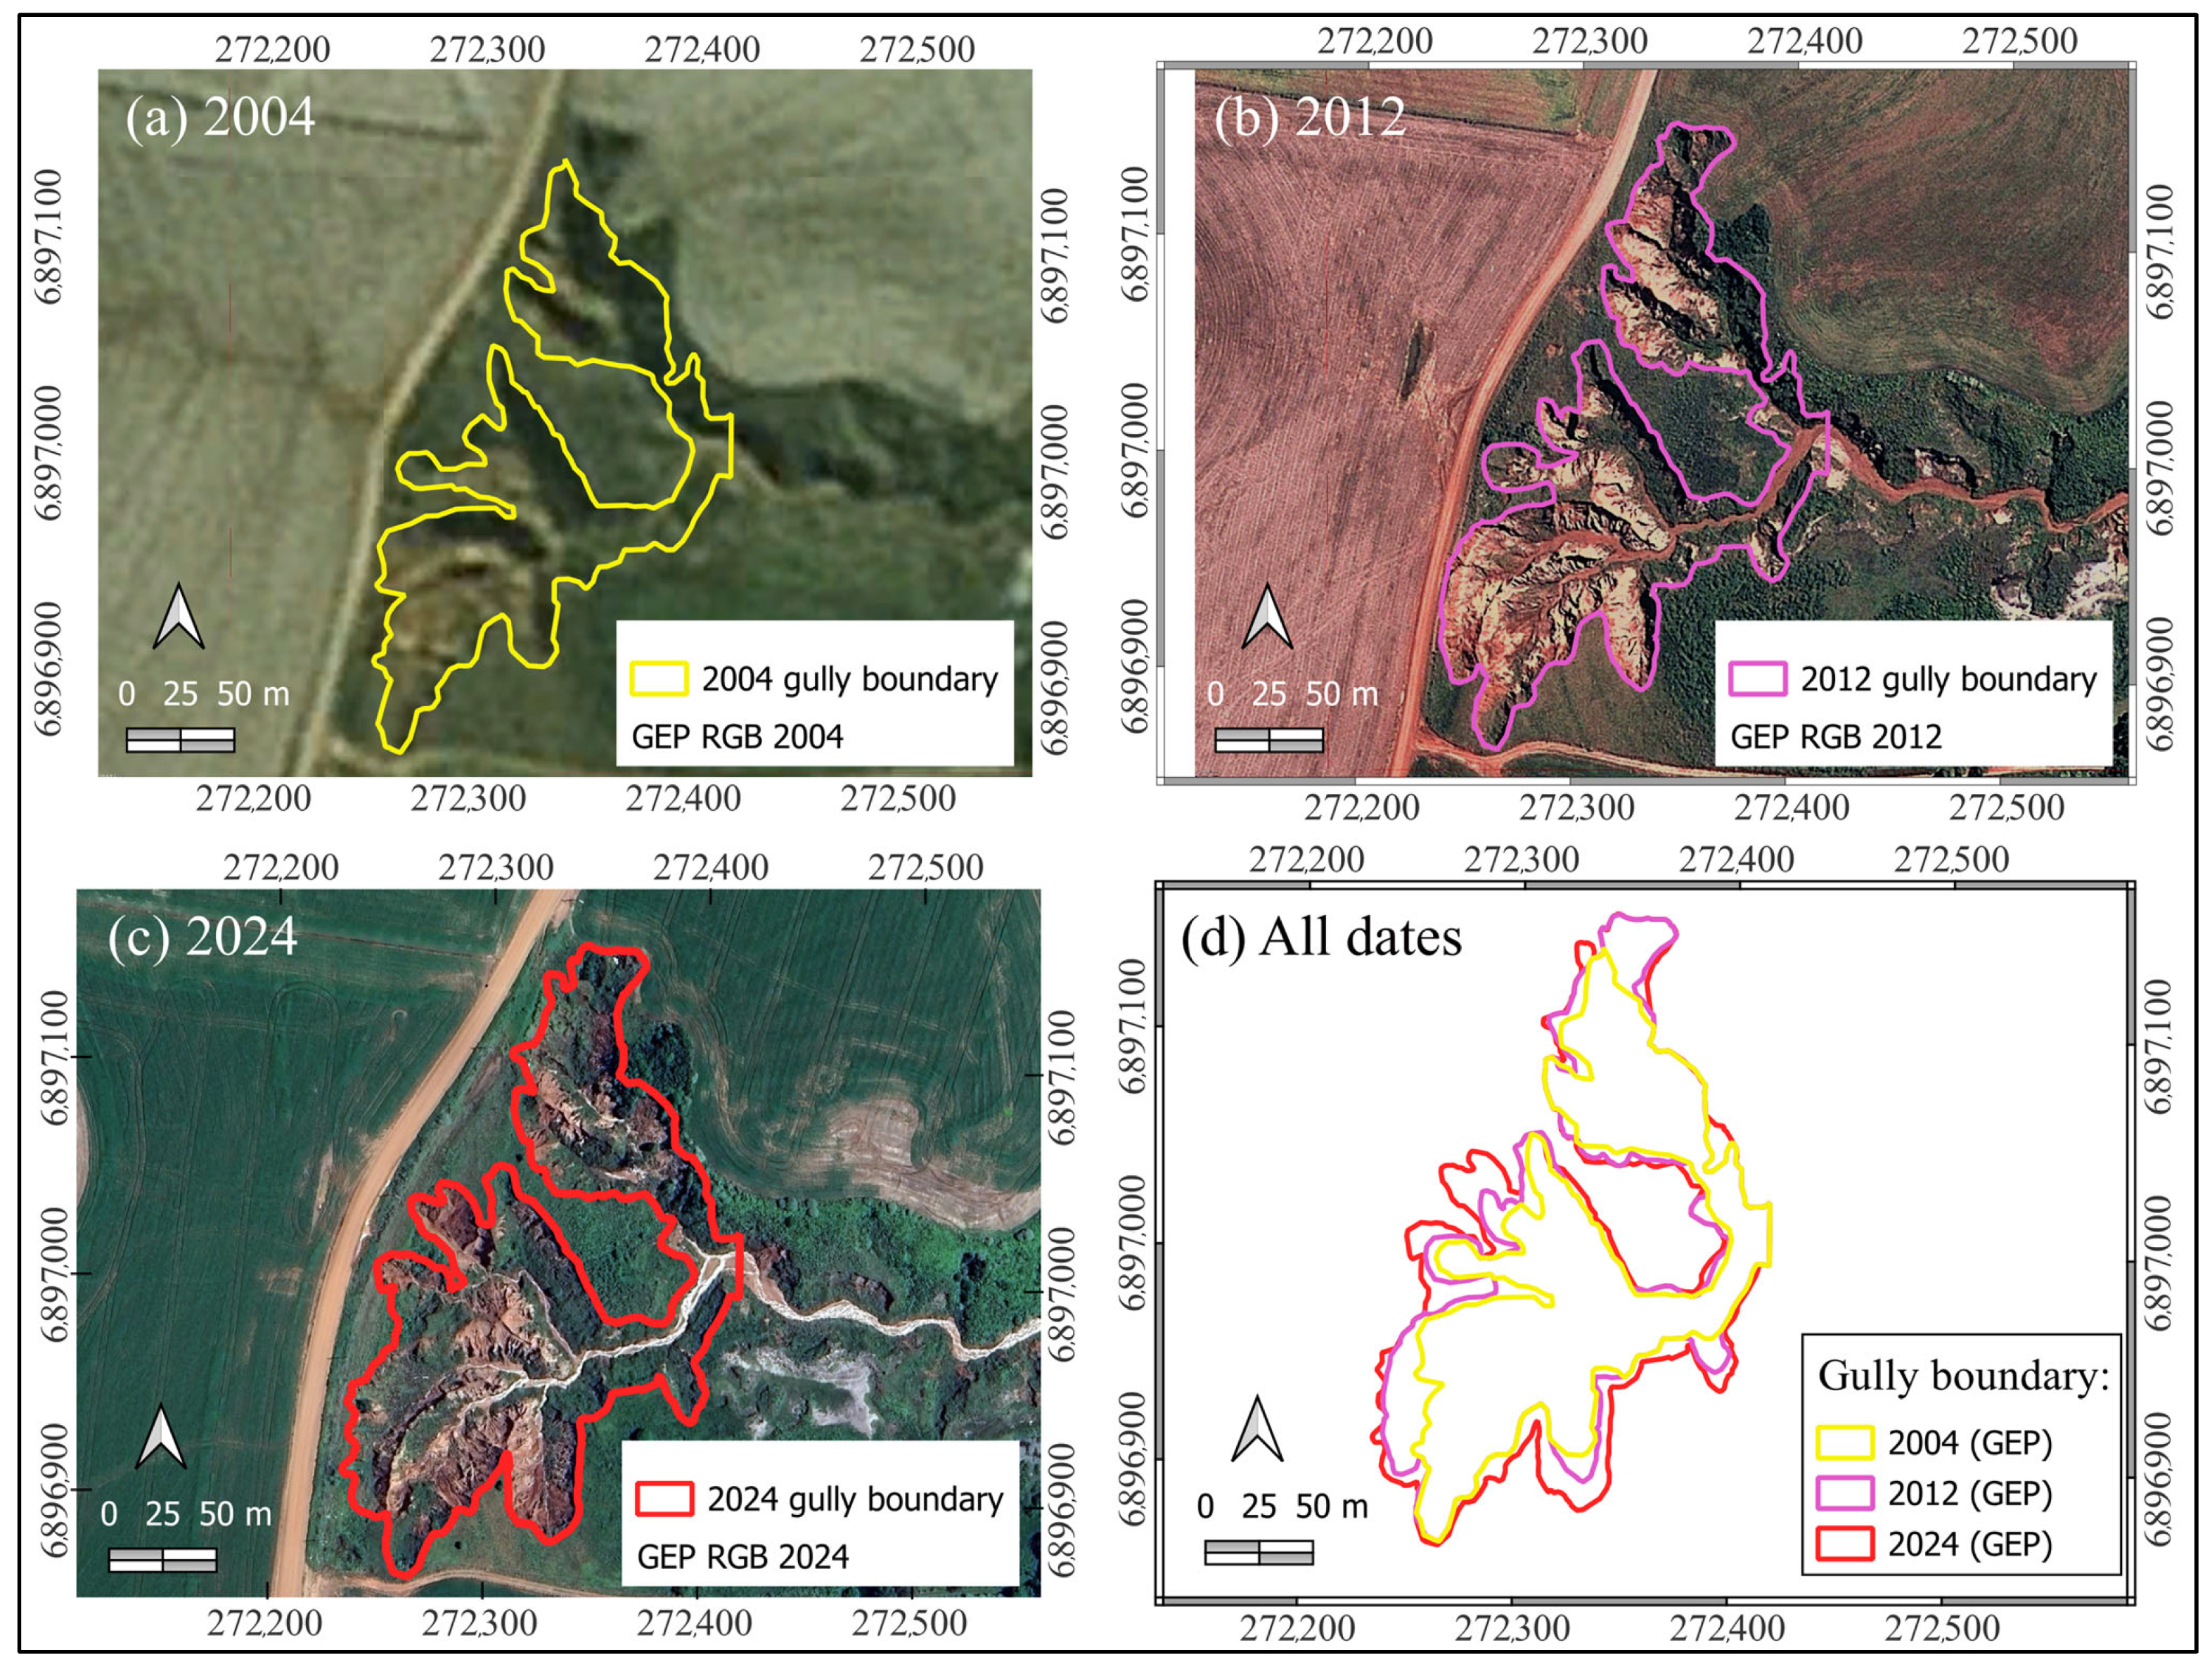
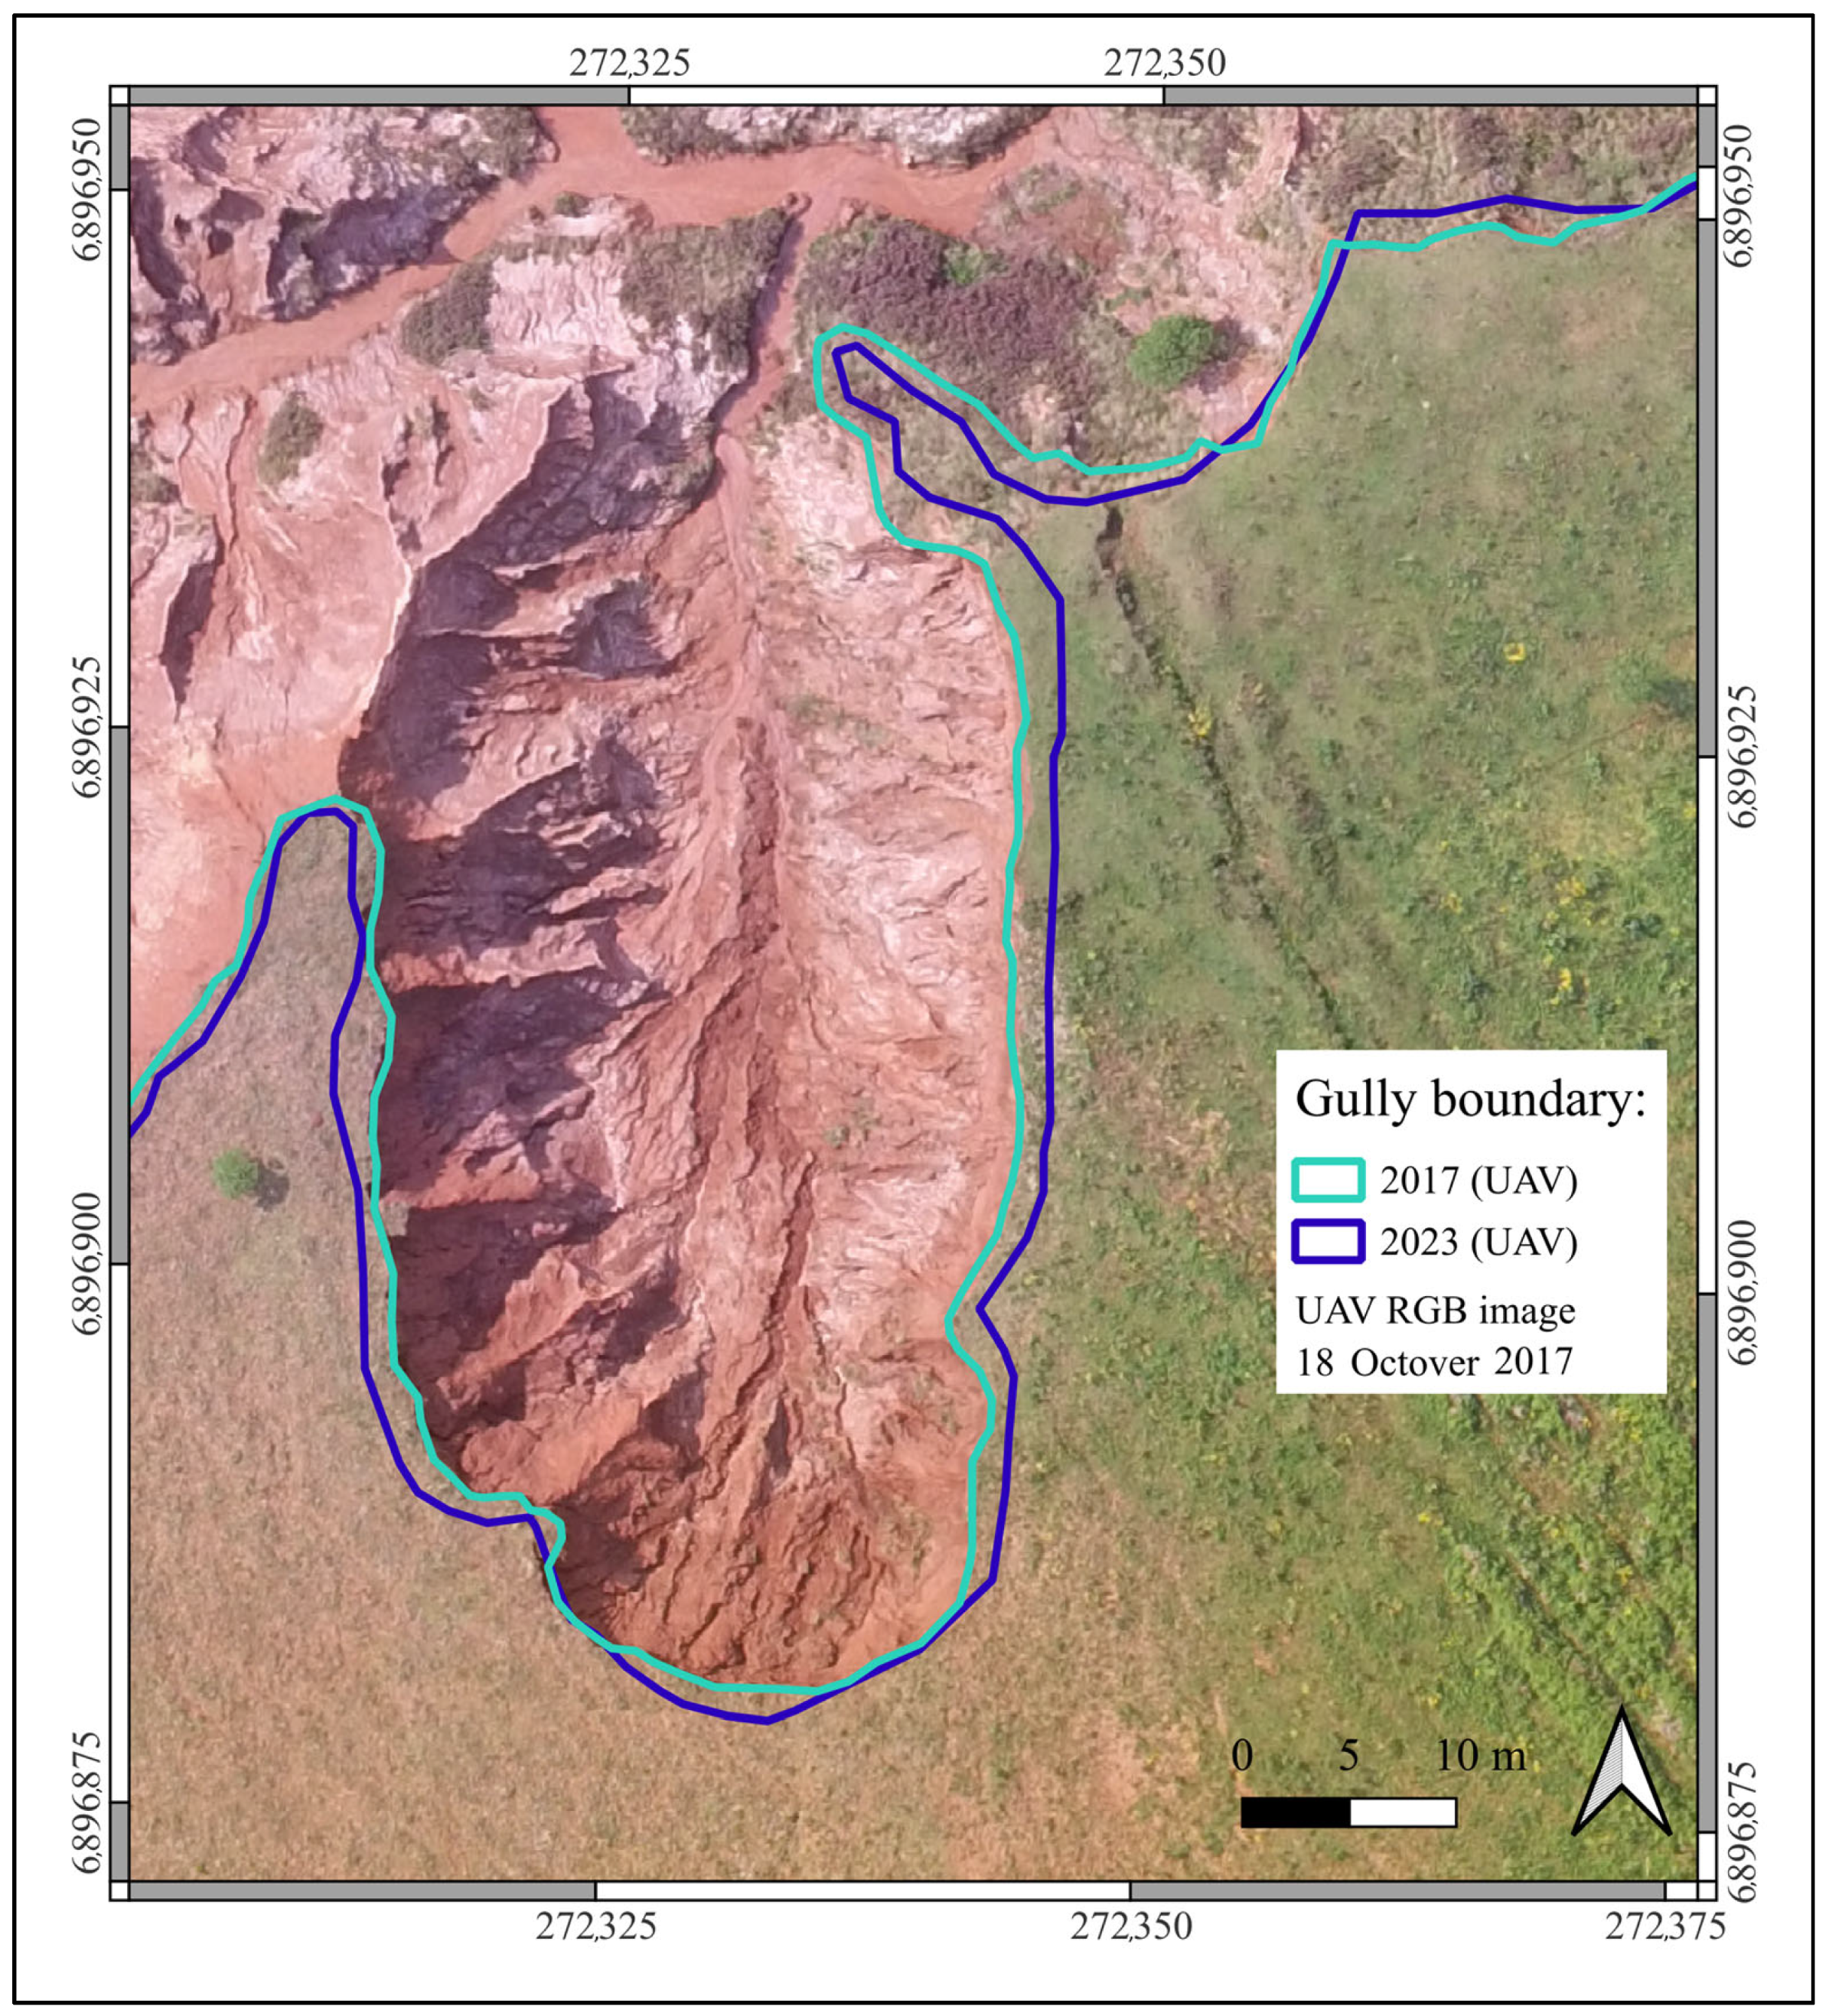
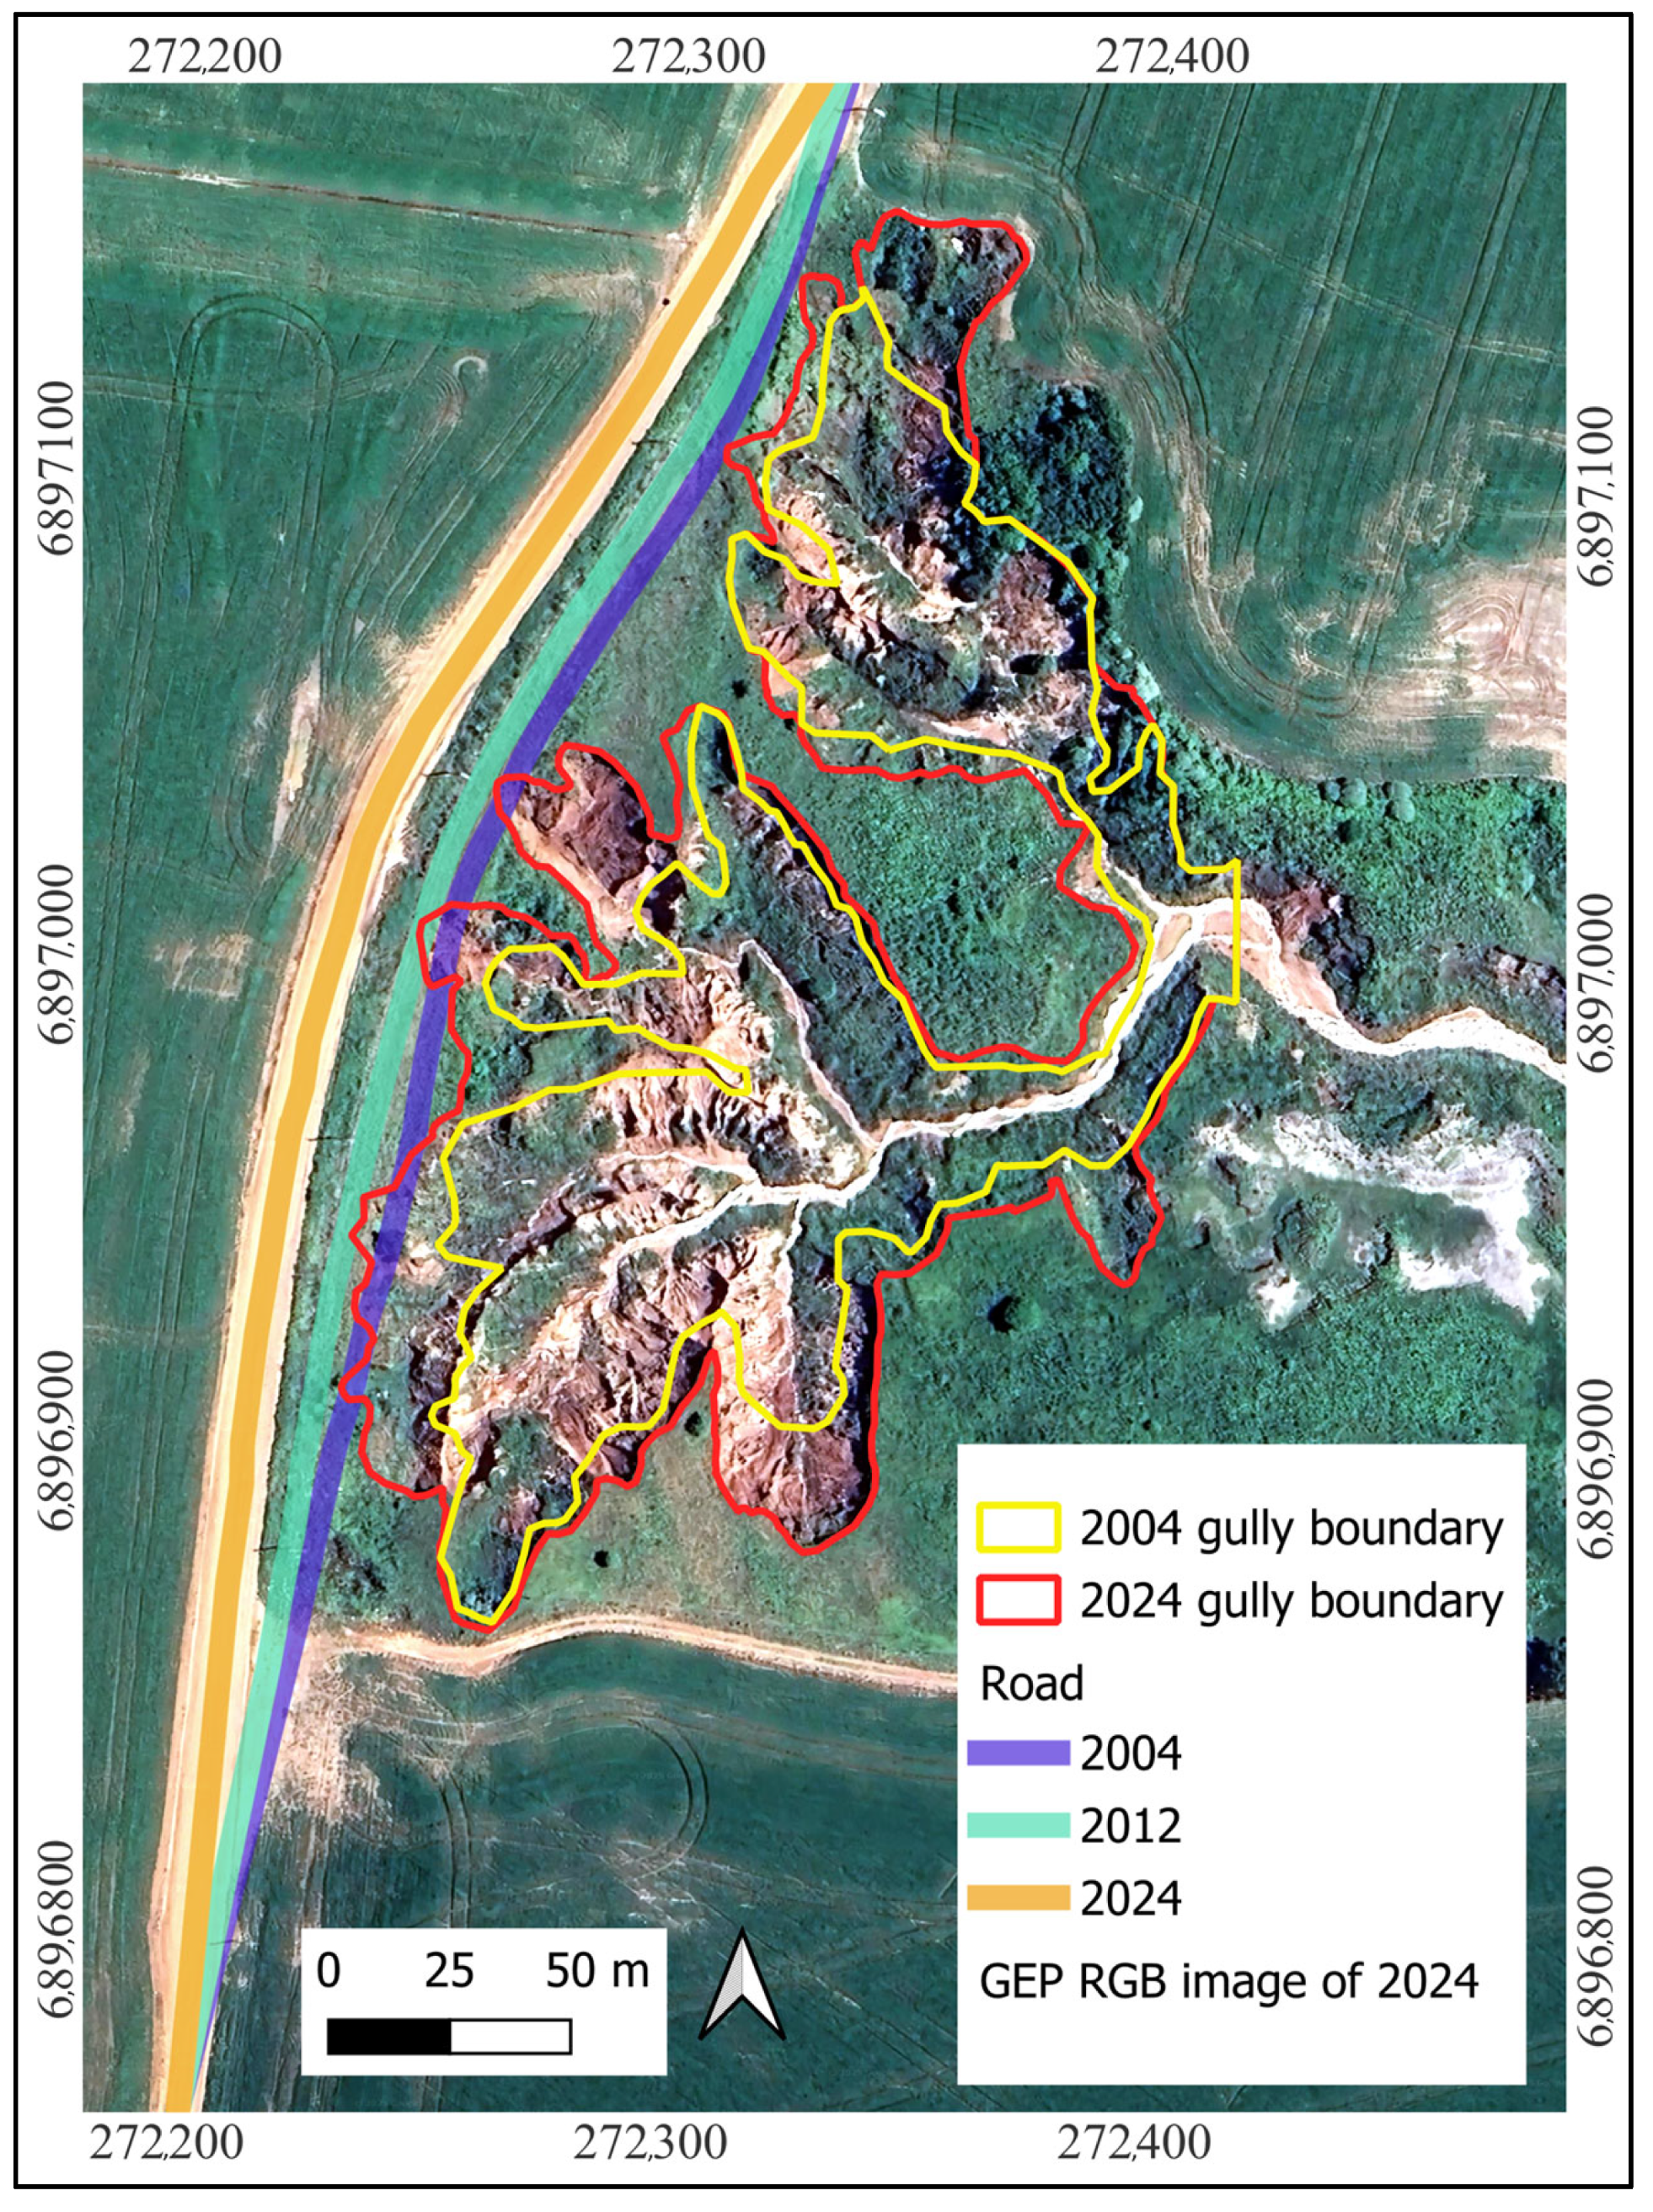
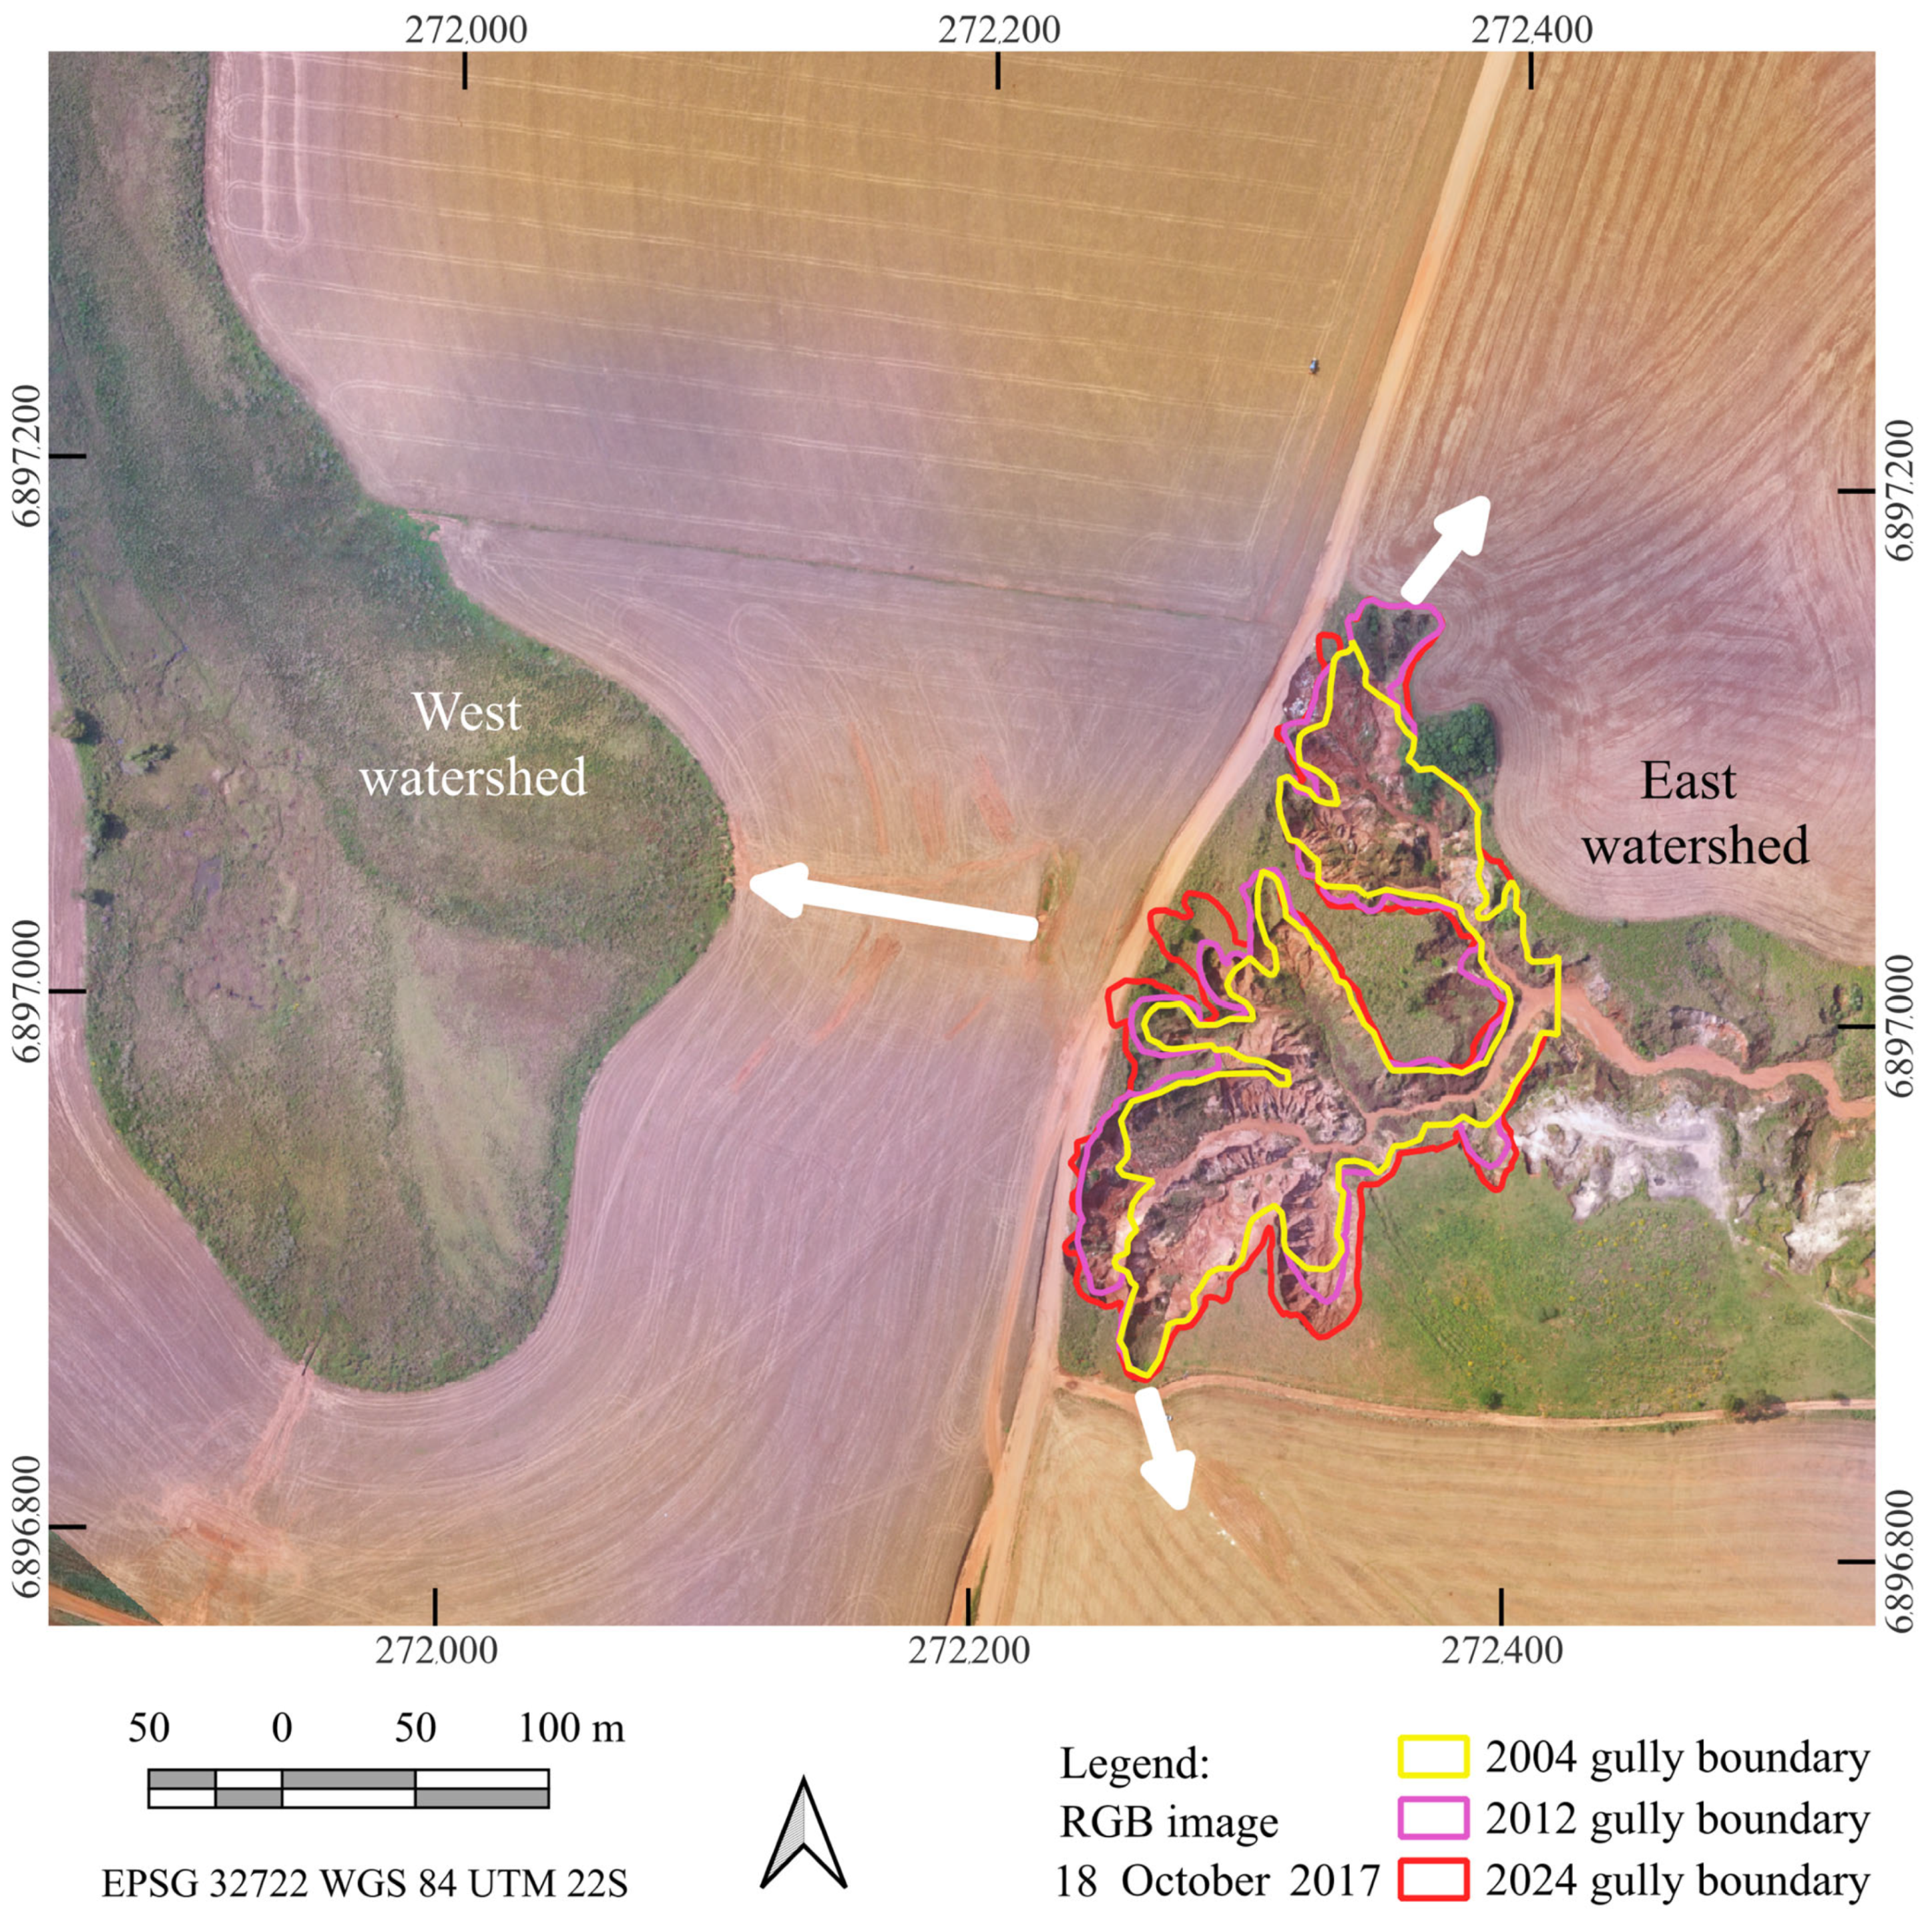
3.1. Gully Planimetric Area from Multiple Remote Sensing Data

The erosive process under study began before the monitored period [39]. In 2004 (Figure 3a), the analyzed fragment encompassed an area of 15,582 m2. In less than a decade, the gully area increased by 4139 m2 (+26.56%, reaching a total of 19,721 m2) (Figure 3b). Also, based on the orbital images of the GEP, in 2024, the gully covered approximately 23,734 m2 (+20.35%) (Figure 3c). Thus, in 20 years, there was an increase of 8152 m2 (52.32%).
Despite the expansion of the area, some sectors of the gully were more active than others (Figure 3d). Thus, using the high-spatial-resolution GEP images, there is a greater expansion to the gully’s north, west, and southern sectors. Also, in some sectors, the evolution of erosive activity was less intense (southwest, east, and northwest). This dynamic can be observed in Figure 4 (the first and last UAV images acquired in this study), where one of the southern sectors of the gully is highlighted. It is verified that only in the last years (2017 to 2024) was the increase in the erosive process lower in relation to the erosion in the previous years, which may be associated with positioning errors between the images (co-registration of the images) or the temporal stabilization of the erosive process.
The RS-508 was relocated thrice between 2004 and 2024 due to erosive advances (Figure 5). Among the direct impacts of the erosive process, the relocation of the road that crosses the watershed’s highest elevation stands out (Figure 6). If the position of the RS-508 in 1976 is considered, based on the topographic map at the 1:50,000 scale, the road would cross in the middle of the gully. Due to the difference in scale in relation to the spatial data considered in this study, a topographic map was added as Supplementary Figure S1.
By mapping the gully’s size (planimetric), a linear regression model was developed to adjust the gully’s area over nearly 30 years (Figure 7 and Supplementary Figure S2). The gully’s evolution pattern was linear (R2 = 0.98 and RMSE = 736 m2). Other nonlinear models were tested (polynomial and logistic), which led to slight improvements in the fit and a small increase in adjustment (R2 = 0.99). However, such models predicted gully erosion beginning after 1980. This disagrees with reports from informal interviews conducted with the study area’s surrounding community, who have informed us that the gully is much older. However, the exact date is still unknown. Therefore, the linear model was adopted thereafter. The boundaries of the confidence band (blue) and prediction band are shown below.
The backward projection of gully evolution creates an indicative date of origin of the erosive process, assuming a linear evolution. The results suggest that the beginning was centered in 1962, with a margin of error of ~±6 years (Figure 8). It should be noted that this process is old, with an unknown initial date. Still, it was visible in 1995, based on the grayscale aerial image (Figure 8), which is the oldest aerial image accessible in this study (Figure 8).

3.2. Volumetry and Advanced Lines of Gully Erosion Processes

Understanding erosive processes requires evaluating rates in conjunction with information on gully dynamics. The average monthly rainfall data from 2000 to 2024 were calculated, showing that October is the rainiest month, while February and August tend to present lower rates (Figure 9a). The monthly accumulated rainfall was generated, covering the UAV and GEP availability data. Rainfall data indicate monthly averages exceeding 150 mm (Figure 9b). The high standard deviation is associated with the irregular rainfall distribution, either due to the absence of measurements or due to stormy months (Figure 9b). Over the 25 years analyzed, several monthly precipitation peaks were identified; however, a cross-correlation with gully area and soil loss was not possible due to the lack of dense image availability. Considering the satellite-derived precipitation images, between 2023 and 2024, the monthly accumulated rainfall exceeded 500 mm.
Considering that extreme rainfall events can intensify the erosive process, it is worth noting that several precipitation peaks occurred before each high-spatial-resolution image was obtained (Figure 9b). It should also be noted that for some months, rainfall data were not obtained, possibly due to failures of the GPM GPM_3IMERGM v07 product, even in the gauge station data.
Although the gully area measurements were measured individually based on manual edge delineation, the visual inspection shows that in specific regions of the gully, significant differences were found between the area measured by the UAV (Figure 10a) and the GEP imagery (Figure 10b), in a short time interval (11.3 months). This was considered in the analysis and discussion. Comparing the UAV data (Figure 10a) to the 2024 GEP data (Figure 10b), it is apparent that the much finer detail that the UAV camera can capture increases the certainty of the gully’s shoulder line delineation.
Considering the sector indicated in Figure 10a, the gully had grown to 6249.7 m3 by 2017, based on an estimation of the volume lost, measured using only UAV data. Making the same measurement in 2023, the volume lost was approximately 7078.3 m3. This relationship indicates that in the evaluated sector, the gully increased by 828.6 m3 over a six-year period, equivalent to a 13.28% increase. It is essential to note that erosion has occurred unevenly among the branches.
The volume of growth (as an increase in void or loss of mass) was calculated across the entire gully using UAV data. The loss rate from 2017 to 2023 (114,092.1 m3 and 108,616.4 m3, respectively) decreased by approximately 5475.7 m3 (4.8%), which is lower than the rates identified in some sectors.
The gully presents lines of advancement towards the area of greater elevation to the north and west (Figure 11). It was verified that two small parts of the gully had already crossed the RS-508 road and coincided with the watershed’s ridge. To the west (Figure 11), the area is covered by vegetation (typical of the region). It has not advanced over the years, despite being surrounded by agricultural plots (smallest white arrow direction). On the other hand, the area to the east (gully) has been continuously advancing towards the west (as indicated by the longest white arrow).
The advancement of the gully from east to west, as indicated by the yellow arrow in Figure 12, reaching the highway (RS-508) reached the surface watershed ridge, as illustrated by the contour lines with relative elevation levels (Figure 12). Observing the variation in the longitudinal altitude of the road, the unevenness leads to large slope indices (Figure 13a). However, when analyzing the cross-sectional profile connecting the two drainage areas, it is verified that the base of the gully is at the same relative altitude as the drainage area on the other side of the RS-508 (Figure 13b).
Considering the topsoil in the ridges (Figure 2 and Figure 12), the analysis of the soil samples revealed an average texture of 34% clay, 56% sand, and 10% silt, characterizing the soil as Sandy Clay Loam. As for the structure, averages of 0.30 m3m3 of micropores, 0.08 m3m3 of macropores, and 1.64 g/cm3 for density were obtained, and total porosity was estimated at 0.38. Such results can be associated with the Tupaciretã formation, which is susceptible to erosion processes [45,46].
The evaluation of the longitudinal (Figure 13a) and transverse (Figure 13b) altimetric profiles of the relative elevation of the road showed smaller longitudinal variations along the road (common on Brazilian unpaved roads) and greater amplitudes in the transversal profile. The results show that on both sides of the road, there is a similar water base level of the spring in each watershed (Figure 11 and Figure 13). Additionally, the longitudinal profile highlights the presence of an elevated valley, which facilitates water flow in the roadside gullies up to the outlet.

4. Discussion

4.1. Planimetric and Volumetric Variables and Gully Evolution

A gully located in southern Brazil was selected to evaluate the potential of combining multi-source and multi-temporal field, UAV, conventional aerial, and Google Earth Pro (GEP) orbital data to assess the advances of erosive processes and their delineation [60]. Since the study utilized low-cost or freely available data, a relatively low-cost protocol is proposed, which may facilitate its adoption by the scientific community. The type of data source (aerial, UAV, or GEP) demonstrates different strengths. UAV data proved more effective for delineating shoulder lines, consistent with the findings of Zhang et al. [20]. GEP data offers significant potential for retrieving historical imagery with high spatial resolution, while UAV data excels in capturing fine details and providing accurate erosion assessments. However, for GEP data, gully features smaller than five meters may be less accurately represented [20]. Overall, a good agreement was observed between UAV and GEP data, aligning with the results reported by Borelli et al. [61].
An almost linear increase of more than 50% in the gully area was observed, although it is not the usual [62]. This pattern can be associated with the period of data availability and is consistent with the results presented by other authors [63,64]. This pattern enables reasonable forecasting of gully evolution and optimizes management practices [2,11], reducing costs [8,9].
The evolution of the gully is associated with the type of soil in the region, which is characterized as sandy, dry, and acidic [33,63], despite the limited number of samples. Anthropic actions have likely favored the expansion of the erosion process [17,20,30,31]. Downstream of the gully, construction sand is manually extracted. This process may have been initiated by ancient locals, which has contributed to the gully’s formation in association with the area’s natural fragility [39]. The road also intensifies the physical processes acting on the soil structure and influences the water flow [17].
Results presented by Sangiovo [39] indicate that the process began before the 1970s, in concordance with the proposed linear model (Figure 7). However, logistic and second-order polynomials indicated a turning point after 1980. Caution is necessary for the use of the model, given the lack of validation of the model, as well as the linearity of the proposed model [62]. When evaluating the topographic chart of the 1970s, the spring is located at the most downstream point of the study area, and no evidence of erosive processes is presented, given the 1:50,000 scale of the official mapping (Supplementary Figure S1). The relative stagnation in the evolution of the gully at certain points in the time series may be related to the degree of disturbance specific to anthropogenic actions, the level of soil fragility, and extreme rainfall events.
UAV and GEP data effectively monitored the gully area and the depth of cross-sectional profiles and sectors, even without the use of control points [61,65]. However, the effectiveness of the volume soil loss estimates with the UAV DTM data depended on the land cover (low vegetation within the gully). In areas without vegetation cover, the volumes of eroded soil can be estimated confidently. When the volume of soil lost from the gully was estimated for the entire region, several problems arose, leading to unexpected results, including a reduction in the volume of soil lost. This can be partially explained by the relatively low positional accuracy of our UAV data. Future studies should consider using a more accurate georeferencing approach, either by using Ground Control Points (GCPs) or survey-grade UAVs capable of generating photogrammetric products with sub-decimetre GSD and positional accuracies.
The soil loss between 2017 and 2023 was estimated at 1934.7 tons per year. The expectedly low soil loss value of 4.8% indicates that the method for estimating volumetry with UAV data has some limitations associated with vegetation removal in the DEM. These limitations can be attributed to the emergence of small-sized vegetation (bushes) within the gully from 2017 to 2023, thereby reducing the internal volume of the gully [66]. Methods for removing vegetation were tested, but due to their small size, they were not efficient and required further tests and adjustments [67]. Environments with higher spectral contrast between vegetation and substrate, as well as those with sparse vegetation, tend to facilitate this procedure [68].
Additionally, problems were identified with the geometry of the photographs selected by the SfM algorithm, which varied as a function of solar illumination. In this case, orthogonal lighting is desirable for UAV acquisitions. Finally, errors during the manual border delimitation can propagate into the volume estimates.

4.2. Geomorphological Analysis of the Gully

The trend of the gully advancing from east to west (Figure 12 and Figure 13) shows an ongoing process that will reach the water base level. The presence of the road (RS-508, Figure 6) is an important anthropogenic factor in accelerating the erosive process in association with extreme rainfall events (Figure 10). The greater depth of the central furrows suggests a significant movement of solid sediments, possibly due to rainwater runoff. Some sectors of the gully experience energy reduction, resulting in a deposit of sediments within the gully. The erosion process advancements are facilitated by the topsoil characteristics (Sandy Clay Loam soil) in association with the ridge position between two watersheds. A detailed visual inspection of the images (Figure 11) reveals slump features on the erosion slope, as well as the presence of ducts, indicating a process of recent evolution. The results represent a cost-effective and scalable approach to overcoming the limitations of traditional methodologies [6,16]. Such a workflow, based on manual edge delineation and automatic image processing, can be implemented and adopted for monitoring gullies in southern Brazil.
From the perspective of modeling the geomorphological process, obtaining piezometric measurements at the ridge near RS-508 can aid in understanding the position of the groundwater divide. In addition, intensifying soil characterization studies is fundamental for the future implementation of methods for controlling and containing erosive processes supported by mechanical or bioengineering methods [69].

4.3. General Constraints of the Study

Among the limitations of the process applied in the study is the need to improve the processes of co-registration of high-spatial-resolution images from multiple sensors using GCPs or image registration algorithms. A process of aligning photographs of different dates, followed by the separation of dates for generating dense cloud, DEM, and orthomosaic, has been proposed in the literature [68,69]; however, it was not effective in the present study. The results suggest an advancement over traditional methods despite their ease of installation and affordable value; however, some measurements can be uncertain, and there are not many studies that prove their accuracy [14,70]. Also, morphometric index-based approaches can be adopted and are contingent upon the quality of the input data [71].
Accurate terrain modelling was also challenging and sensitive to the filtering method for ground point extraction and DEM generation [72]. Even with sparse and small vegetation, the ground point algorithm could not adequately remove the vegetation, which impacted the estimated volume of soil loss. This problem could be even more challenging in gullies with dense vegetation, as reported in other regions of southern Brazil where eucalyptus is cultivated within the gully. Such a scenario creates a homogeneous surface that reduces the identification of matching points as well as ground point discrimination [6,16,69,72,73].

5. Conclusions

The combined use of high-spatial-resolution data of GEP and UAVs proved effective for mapping and monitoring the expansion of the erosive process in southern Brazil. GEP-based estimates indicated more than a 50% increase in the gully area over 25 years, which was corroborated by submetric UAV spatial resolution data.
UAV-derived 3D modeling enabled the precise delineation of gully shoulder lines and boundary boundaries, as well as the estimation of soil loss, although dense vegetation within the gully complicated volumetric assessments.
The erosive process exhibits a linear east-to-west progression toward the base level, suggesting potential stabilization upon reaching the watershed shoulder lines. These findings underscore the need for targeted mitigation strategies to curb further soil degradation and support land rehabilitation efforts.

Supplementary Materials

The following supporting information can be downloaded at: https://www.mdpi.com/article/10.3390/agriengineering7070212/s1, Figure S1: topographic chart. Overlay of the gully shoulders lines mapped using GEP, Conventional Aerial data (DSG), and UAV data from 200 to 2024 on the topographic chart of 1976 (scale 1:50000, CONDOR - SH-22-V-A-II-1 - Index map code 2916-1). The topographic chart was created by the Brazilian Directory of the Geographic Service (DSG). The yellow box indicates the UAV and GEP coverage used to evaluate the gully; Figure S2: Evolution of the gully area in the period from 1995 to 2024, based on manual mapping carried out on Google Earth Pro (GEP, red squares and dots), aerial (DSG, black) and Unmanned Aerial Vehicles (UAV, green) images.

Author Contributions

Conceptualization, F.M.B. and M.A.M.; methodology, F.M.B., R.T., A.C.A.C., T.C.H., and W.G.; software, F.M.B., V.L., T.V.M.S., and W.G.; validation, F.M.B., M.A.M., and E.F.B.; formal analysis, F.M.B., E.d.C.d.L.F., V.L., and A.A.O.; investigation, F.M.B., L.J.C.S., and V.L.; resources, F.M.B.; data curation, F.M.B., M.A.M., and W.G.; writing—original draft preparation, F.M.B., T.V.M.S., and E.R.d.N.; writing—review and editing, F.M.B., V.L., and A.A.O.; supervision, F.M.B., L.J.C.S., and M.A.M.; project administration, F.M.B.; funding acquisition, F.M.B. All authors have read and agreed to the published version of the manuscript.

Funding

This research was funded by Conselho Nacional de Desenvolvimento Científico e Tecnológico (CNPQ), grant numbers 478085/2013-3; 305452/2023-1; 317538/2021-7, and Fundação de Amparo à Pesquisa do Estado do Rio Grande do Sul (FAPERGS), grant numbers 23830.388.22048.19092016.

Data Availability Statement

The data presented in this study are available upon request from the corresponding author, as the study area is private property.

Acknowledgments

To the Federal University of Santa Maria (UFSM) and Federal University of Paraná (UFPR) to assist field campaigns.

Conflicts of Interest

The authors declare that they have no conflicts of interest.

Abbreviations

The following abbreviations are used in this manuscript:
UAVUnmanned Aerial Vehicle
GEPGoogle Earth Pro
DSGBrazilian Directory of Geographic Service
EMBRAPABrazilian Agricultural Research Corporation
RGBRed–Green–Blue
GCPGround Control Points
DEMDigital Elevation Model
DTMDigital Terrain Model

References

  1. Flexor, G.; Kato, K.Y.; Leite, S.P. Agri-Food Globalization and Food Security in Brazil: Recent Trends and Contradictions. J. Peasant. Stud. 2024, 51, 1022–1045. [Google Scholar] [CrossRef]
  2. Avni, Y. Gully Incision as a Key Factor in Desertification in an Arid Environment, the Negev Highlands, Israel. Catena 2005, 63, 185–220. [Google Scholar] [CrossRef]
  3. Vrieling, A. Satellite Remote Sensing for Water Erosion Assessment: A Review. Catena 2006, 65, 2–18. [Google Scholar] [CrossRef]
  4. Vrieling, A. Mapping Erosion from Space; Erosion and Soil & Water Conservation Group, Department of Environmental Sciences, Wageningen University and Research Centre: Wageningen, The Netherlands, 2007; pp. 926–9495. ISBN 9789085045878. [Google Scholar]
  5. Simões, M.; Ferraz, R.P.D.; Lumbreras, J.F.; Coelho, M.R.; Baca, J.M.; de Freitas, P.L.; Lima, E.d.P.; Kuchler, P.C.; Almeida, M.B.F. De Mapa de Vulnerabilidade dos Solos à Erosão Hídrica do Brasil—2019 (Primeira Aproximação) [CNPS]. Available online: https://geoinfo.dados.embrapa.br/catalogue/#/dataset/2997 (accessed on 16 January 2025).
  6. Lal, R. Soil Degradation as a Reason for Inadequate Human Nutrition. Food Secur. 2009, 1, 45–57. [Google Scholar] [CrossRef]
  7. Haruna, S.I.; Nkongolo, N.V. Cover Crop Management Effects on Soil Physical and Biological Properties. Procedia Environ. Sci. 2015, 29, 13–14. [Google Scholar] [CrossRef]
  8. Krynke, M. Management Optimizing the Costs and Duration Time of the Process in the Production System. Prod. Eng. Arch. 2021, 27, 163–170. [Google Scholar] [CrossRef]
  9. Dummer, J.; Verdum, R. Controle Estrutural Nos Processos Erosivos Hídricos e Na Arenização, Bacia Hidrográfica Do Arroio Miracatu—Rio Grande Do Sul. Rev. Bras. De Geomorfol. 2023, 24, 1–27. [Google Scholar] [CrossRef]
  10. Milton, L.E. A Review of Gully Erosion and Its Control; Soil Conservation Authority: Kew, Australia, 1971. [Google Scholar]
  11. Natural Resources and Water Government—NRW Gully Erosion Assessment and Control Guide. Available online: https://www.lls.nsw.gov.au/help-and-advice/natural-resource-management/waterways/gully-erosion-assessment-and-control-guide (accessed on 16 January 2025).
  12. Peter, K.D.; d’Oleire-Oltmanns, S.; Ries, J.B.; Marzolff, I.; Hssaine, A.A. Soil Erosion in Gully Catchments Affected by Land-Levelling Measures in the Souss Basin, Morocco, Analysed by Rainfall Simulation and UAV Remote Sensing Data. Catena 2014, 113, 24–40. [Google Scholar] [CrossRef]
  13. Arabameri, A.; Asadi Nalivan, O.; Saha, S.; Roy, J.; Pradhan, B.; Tiefenbacher, J.P.; Thi Ngo, P.T. Novel Ensemble Approaches of Machine Learning Techniques in Modeling the Gully Erosion Susceptibility. Remote Sens. 2020, 12, 1890. [Google Scholar] [CrossRef]
  14. Hessel, R.; van Asch, T. Modelling Gully Erosion for a Small Catchment on the Chinese Loess Plateau. Catena 2003, 54, 131–146. [Google Scholar] [CrossRef]
  15. Stroosnijder, L. Measurement of Erosion: Is It Possible? Catena 2005, 64, 162–173. [Google Scholar] [CrossRef]
  16. Poesen, J.; Nachtergaele, J.; Verstraeten, G.; Valentin, C. Gully Erosion and Environmental Change: Importance and Research Needs. Catena 2003, 50, 91–133. [Google Scholar] [CrossRef]
  17. Bouramtane, T.; Hilal, H.; Rezende-Filho, A.T.; Bouramtane, K.; Barbiero, L.; Abraham, S.; Valles, V.; Kacimi, I.; Sanhaji, H.; Torres-Rondon, L.; et al. Mapping Gully Erosion Variability and Susceptibility Using Remote Sensing, Multivariate Statistical Analysis, and Machine Learning in South Mato Grosso, Brazil. Geosciences 2022, 12, 235. [Google Scholar] [CrossRef]
  18. Rademann, L.K.; Trentin, R.; Robaina, L.E.D.S.; Breunig, F.M. Avaliação Da Dinâmica De Bancos De Areia Com Imagens De Alta Resolução No Rio Areal Do Limeira, Sul Do Brasil. RAEGA-O Espaço GeográFico Álise 2023, 57, 3. [Google Scholar] [CrossRef]
  19. Wang, B.; Zhang, Z.; Wang, X.; Zhao, X.; Yi, L.; Hu, S. The Suitability of Remote Sensing Images at Different Resolutions for Mapping of Gullies in the Black Soil Region, Northeast China. Remote Sens. 2021, 13, 2367. [Google Scholar] [CrossRef]
  20. Zhang, C.; Wang, C.; Long, Y.; Pang, G.; Shen, H.; Wang, L.; Yang, Q. Comparative Analysis of Gully Morphology Extraction Suitability Using Unmanned Aerial Vehicle and Google Earth Imagery. Remote Sens. 2023, 15, 4302. [Google Scholar] [CrossRef]
  21. Zgłobicki, W.; Poesen, J.; Cohen, M.; Del Monte, M.; García-Ruiz, J.M.; Ionita, I.; Niacsu, L.; Machová, Z.; Martín-Duque, J.F.; Nadal-Romero, E.; et al. The Potential of Permanent Gullies in Europe as Geomorphosites. Geoheritage 2019, 11, 217–239. [Google Scholar] [CrossRef]
  22. Toro, F.G.; Tsourdos, A. UAV or Drones for Remote Sensing Applications; MDPI-Multidisciplinary Digital Publishing Institute: Basel, Switzerland, 2018; ISBN 9783038970910. [Google Scholar]
  23. Prudkin, G.; Breunig, F.M. DRONES E CIÊNCIA: Teoria e Aplicações Metodológicas, 1st ed.; Prudkin, G., Breunig, F.M., Eds.; FACOS UFSM: Santa Maria, RS, Brazil, 2019; ISBN 9788583840770. [Google Scholar]
  24. Radoglou-Grammatikis, P.; Sarigiannidis, P.; Lagkas, T.; Moscholios, I. A Compilation of UAV Applications for Precision Agriculture. Comput. Netw. 2020, 172, 107148. [Google Scholar] [CrossRef]
  25. Pajares, G. Overview and Current Status of Remote Sensing Applications Based on Unmanned Aerial Vehicles (UAVs). Photogramm. Eng. Remote Sens. 2015, 81, 281–330. [Google Scholar] [CrossRef]
  26. Verdum, R. Approche Géographique Des “Déserts” Dans Les Communes de São Francisco de Assis et Manuel Viana, Etat Du Rio Grande Do Sul, Brésil. Ph.D. Thesis, Université de Toulouse Le Mirail, Toulouse, France, 1997. [Google Scholar]
  27. Kasecker, T.P.; Ramos-Neto, M.B.; da Silva, J.M.C.; Scarano, F.R. Ecosystem-Based Adaptation to Climate Change: Defining Hotspot Municipalities for Policy Design and Implementation in Brazil. Mitig. Adapt. Strateg. Glob. Change 2018, 23, 981–993. [Google Scholar] [CrossRef]
  28. Hall, O. Remote Sensing in Social Science Research. Open Remote Sens. J. 2010, 3, 1–16. [Google Scholar] [CrossRef]
  29. Guerra, A.J.T.; Jorge, M.D.C.O. Processos Erosivos e Recuperação de Áreas Degradadas; Oficina de Textos: São Paulo, Brazil, 2013; ISBN 9788579750793. [Google Scholar]
  30. Guerra, A.J.T.; Fullen, M.A.; Bezerra, J.F.R.; Jorge, M.D.C.O. Gully Erosion and Land Degradation in Brazil: A Case Study from São Luís Municipality, Maranhão State. In Ravine Lands: Greening for Livelihood and Environmental Security; Springer: Singapore, 2018; pp. 195–216. [Google Scholar]
  31. Castillo, C.; Gómez, J.A. A Century of Gully Erosion Research: Urgency, Complexity and Study Approaches. Earth Sci. Rev. 2016, 160, 300–319. [Google Scholar] [CrossRef]
  32. Robaina, L.E.d.S.; De Paula, P.M.; Trentin, R. Soil Degradation and Developments of the Sands in Ibicui Basin—RS—Brazil. Soc. Nat. 2005, 1, 215–223. [Google Scholar] [CrossRef]
  33. Suertegaray, D.M.A.; Oliveira, M.G. Sandization, Sand Spots and Land Use Planning (Arenização, Areais e Políticas de Ordenamento Territorial). Cad. Geogr. 2018, 38, 69–76. [Google Scholar]
  34. Trindade, J.P.P.; de Quadros, F.L.F.; Pillar, V.D. Vegetação Campestre de Areais Do Sudoeste Do Rio Grande Do Sul Sob Pastejo e Com Exclusão Do Pastejo. Pesqui. Agropecu. Bras. 2008, 43, 771–779. [Google Scholar] [CrossRef]
  35. Cabral, T.L.; Nummer, A.V.; Bateira, C.V. Morphometric Indicators as Support for the Classification of Gullies in Hydrographic Sub-Basins in the Cacequi Municipality, RS (in Portuguese—Indicadores Morfométricos Como Suporte Para a Classificação de Voçorocas Em Sub-Bacias Hidrográficas No Município de Cacequi, RS. Rev. Bras. Geomorfol. 2020, 21. [Google Scholar] [CrossRef]
  36. Rademann, L.K.; Trentin, R.; Robaina, L.E. Characterization and Analysis of Gully Erosion in Southern Brazil with the Assistance of Unmanned Aerial Vehicle. Mercator 2022, 21, e21022. [Google Scholar] [CrossRef]
  37. Gaberti, M.M.; Robaina, L.E.d.S.; Trentin, R. Relação Entre Condicionantes Ambientais e Ocorrência de Voçorocas No Município de Capão Do Cipó/RS. Geografia 2023, 33, 189–207. [Google Scholar] [CrossRef]
  38. Coulon, F.K.; Gamermann, N.; Formoso, M.L.L. Considerações Sobre a Gênese Da Formação Tupanciretã. Pesqui. GeociêNcias 1973, 2, 79. [Google Scholar] [CrossRef]
  39. Sangiovo, S. Degradação Ambiental Por Processos Erosivos No Município de Palmeira Das Missões—RS; UFSM: Frederico Westphalen, Brazil, 2015. [Google Scholar]
  40. Alvares, C.A.; Stape, J.L.; Sentelhas, P.C.; De Moraes Gonçalves, J.L.; Sparovek, G. Köppen’s Climate Classification Map for Brazil. Meteorol. Z. 2013, 22, 711–728. [Google Scholar] [CrossRef]
  41. Beck, H.E.; McVicar, T.R.; Vergopolan, N.; Berg, A.; Lutsko, N.J.; Dufour, A.; Zeng, Z.; Jiang, X.; van Dijk, A.I.J.M.; Miralles, D.G. High-Resolution (1 Km) Köppen-Geiger Maps for 1901–2099 Based on Constrained CMIP6 Projections. Sci. Data 2023, 10, 724. [Google Scholar] [CrossRef] [PubMed]
  42. EMBRAPA (Empresa Brasileira de Pesquisa Agropecuária) Solos. Sistema Brasileiro de Classificação de Solos; EMBRAPA (Empresa Brasileira de Pesquisa Agropecuária) Solos: Rio de Janeiro, Brazilm, 2013; Volume 1, p. 353. ISBN 978-85-7035-198-2. [Google Scholar]
  43. Instituto Brasileiro de Geografia e Estatística (IBGE). Land Use and Cover in Brazil; Instituto Brasileiro de Geografia e Estatística (IBGE): Rio de Janeiro, Brazil, 2020. [Google Scholar]
  44. Secretaria de Planejamento, Ordenamento e Gestão do Rio Grande do Sul. Produção Agropecuária e Estrutura Fundiária Atlas Socioeconômico Do Rio Grande Do Sul; Secretaria de Planejamento, Ordenamento e Gestão do Rio Grande do Sul: Porto Alegre, RS, Brazil, 2019. [Google Scholar]
  45. Ruppel, K.M.V.; Dani, N.; Amoretti Lisboa, N. Evolução Morfotectônica e Megageomorfológica Das Formações Pós Gondwânicas Santa Tecla e Tupanciretã No Rio Grande Do Sul. Rev. Bras. Geomorfol. 2023, 24. [Google Scholar] [CrossRef]
  46. Menegotto, E.; Sartori, P.L.P.; Maciel Filho, C.L. Nova Sequência Sedimentar Sobre a Serra Geral No Rio Grande Do Sul. Bol. Inst. Solos Cult. 1968, 1, 1–19. [Google Scholar]
  47. Instituto Brasileiro de Geografia e Estatística (IBGE). Manual Técnico Da Vegetação Brasileira, 2nd ed.; IBGE Instituto Brasileiro de Geografia e Estatística: Rio de Janeiro, Brazil, 2012. [Google Scholar]
  48. Instituto Brasileiro de Geografia e Estatística—IBGE Base de Dados de Geociências 2025—Downloads. IBGE: Rio de Janeiro, Brazil. Available online: https://www.ibge.gov.br/geociencias/downloads-geociencias.html (accessed on 2 May 2025).
  49. DJI—Dà-Jiāng Innovations Matrice 100: The Quadcopter for Developers—DJI. Available online: https://www.dji.com/matrice100?site=brandsite&from=nav (accessed on 7 May 2018).
  50. DJI—Dà-Jiāng Innovations All Phantom Products- Intelligent Drones—DJI. Available online: https://www.dji.com/products/all-phantom?site=brandsite&from=landing_page (accessed on 7 May 2018).
  51. Teixeira, P.C.; Donagemma, G.K.; Fontana, A.; Teixeira, W.G. Manual de Métodos de Análise de Solo, 3rd ed.; Embrapa: Brasília, DF, Brazil, 2017; ISBN 978-85-7035-771-7. [Google Scholar]
  52. Agisoft, L. Рукoвoдствo Пoльзoвателя Agisoft Metashape; Agisoft: St. Petersburg, Russia, 2024; Available online: https://www.agisoft.com/ (accessed on 15 April 2025).
  53. Westoby, M.J.; Brasington, J.; Glasser, N.F.; Hambrey, M.J.; Reynolds, J.M. ‘Structure-from-Motion’ Photogrammetry: A Low-Cost, Effective Tool for Geoscience Applications. Geomorphology 2012, 179, 300–314. [Google Scholar] [CrossRef]
  54. Jonathan, L.; Carrivick, M.W.; Smith, D.J.Q. Structure from Motion in the Geosciences; Wiley-Blackwell: Singapore, 2016; ISBN 978-1-118-89584-9. [Google Scholar]
  55. QGIS.org, 2025. QGIS Geographic Information System v3.40. QGIS Association. Available online: http://www.qgis.org (accessed on 15 April 2025).
  56. Wang, X.W.; Wang, F. The Precision of Google Earth Map Analysis with the Coordinates of IGS Stations. Int. Arch. Photogramm. Remote Sens. Spat. Inf. Sci. 2020, XLII-3/W10, 1053–1056. [Google Scholar] [CrossRef]
  57. Vianna, L.F.d.N.; Perin, E.B.; Ricce, W.d.S.; Massignan, A.M.; Pandolfo, C. Bancos de Dados Meteorológicos: Análise Dos Metadados Das Estações Meteorológicas No Estado de Santa Catarina, Brasil. Rev. Bras. Meteorol. 2017, 32, 53–64. [Google Scholar] [CrossRef]
  58. Huffman, G.J.; Stocker, E.F.; Bolvin, D.T.; Nelkin, E.J.; Tan, J. GPM IMERG Final Precipitation L3 Half Hourly 0.1 Degree × 0.1 Degree V06 (GPM_3IMERGHH); Goddard Earth Sciences Data and Information Services Center (GES DISC): Greenbelt, MD, USA, 2019. [Google Scholar]
  59. Funk, C.; Peterson, P.; Landsfeld, M.; Pedreros, D.; Verdin, J.; Shukla, S.; Husak, G.; Rowland, J.; Harrison, L.; Hoell, A.; et al. The Climate Hazards Infrared Precipitation with Stations—A New Environmental Record for Monitoring Extremes. Sci. Data 2015, 2, 150066. [Google Scholar] [CrossRef]
  60. Borrelli, P.; Matthews, F.; Alewell, C.; Kaffas, K.; Poesen, J.; Saggau, P.; Prăvălie, R.; Vanmaercke, M.; Panagos, P. A Hybrid in Situ and On-Screen Survey to Monitor Gully Erosion across the European Union. Sci. Data 2025, 12, 755. [Google Scholar] [CrossRef]
  61. Reece, D.A.; Lory, J.A.; Haithcoat, T.L.; Gelder, B.K.; Cruse, R. Using Google Earth Imagery to Target Assessments of Ephemeral Gully Erosion. J. Asabe 2023, 66, 155–166. [Google Scholar] [CrossRef]
  62. Sidorchuk, A. Models of Gully Erosion by Water. Water 2021, 13, 3293. [Google Scholar] [CrossRef]
  63. Mawe, G.I.; Landu, E.L.; Imwangana, F.M.; Hubert, A.; Dille, A.; Bielders, C.L.; Poesen, J.; Dewitte, O.; Vanmaercke, M. What Controls the Expansion of Urban Gullies in Tropical Environments? Lessons Learned from Contrasting Cities in DR Congo. Catena 2024, 241, 108055. [Google Scholar] [CrossRef]
  64. Wang, J.; Zhang, Y.; Chen, C.; Li, K. Spatial Variation in Gully Expansion Rate in a Loess-Covered Tableland Region Based on Systematic Sampling and High-Resolution Image Interpretation. Catena 2024, 236, 107756. [Google Scholar] [CrossRef]
  65. Titti, G.; Napoli, G.N.; Conoscenti, C.; Lombardo, L. Cloud-Based Interactive Susceptibility Modeling of Gully Erosion in Google Earth Engine. Int. J. Appl. Earth Obs. Geoinf. 2022, 115, 103089. [Google Scholar] [CrossRef]
  66. Krein Rademann, L.; Trentin, R. Novas Geotecnologias Aplicadas Ao Estudo Geomorfológico: Exemplo de Morfometria Da Voçoroca Do Areal, Cacequi-RS. GeoTextos 2020, 16. [Google Scholar] [CrossRef]
  67. Ma, H.; Zhou, W.; Zhang, L. DEM Refinement by Low Vegetation Removal Based on the Combination of Full Waveform Data and Progressive TIN Densification. ISPRS J. Photogramm. Remote Sens. 2018, 146, 260–271. [Google Scholar] [CrossRef]
  68. Ding, J.; Li, Z.; Zhang, H.; Zhang, P.; Cao, X.; Feng, Y. Quantifying the Aboveground Biomass (AGB) of Gobi Desert Shrub Communities in Northwestern China Based on Unmanned Aerial Vehicle (UAV) RGB Images. Land 2022, 11, 543. [Google Scholar] [CrossRef]
  69. Fernandes, M.M.; José, M.B.; Vieira, M.V.A.; Nascimento, C.C.F.; Almeida, A.Q. Litter Stock in Different Areas in the Process of Ecological Restoration Intercropped with Eucalyptus in the Brazilian Atlantic Forest (Estoque de Serapilheira Em Diferentes Áreas Em Processo de Restauração Ecológica Consorciadas Com Eucalipto Na Mata Atlântica Brasileira). Rev. CiêNcias AgroveterináRias 2024, 23, 763–770. [Google Scholar] [CrossRef]
  70. Jugie, M.; Gob, F.; Virmoux, C.; Brunstein, D.; Tamisier, V.; Le Coeur, C.; Grancher, D. Characterizing and Quantifying the Discontinuous Bank Erosion of a Small Low Energy River Using Structure-from-Motion Photogrammetry and Erosion Pins. J. Hydrol. 2018, 563, 418–434. [Google Scholar] [CrossRef]
  71. Willett, S.D.; McCoy, S.W.; Perron, J.T.; Goren, L.; Chen, C.-Y. Dynamic Reorganization of River Basins. Science 2014, 343, 1248765. [Google Scholar] [CrossRef]
  72. Escobar Villanueva, J.R.; Iglesias Martínez, L.; Pérez Montiel, J.I. DEM Generation from Fixed-Wing UAV Imaging and LiDAR-Derived Ground Control Points for Flood Estimations. Sensors 2019, 19, 3205. [Google Scholar] [CrossRef]
  73. Meng, X.; Shang, N.; Zhang, X.; Li, C.; Zhao, K.; Qiu, X.; Weeks, E. Photogrammetric UAV Mapping of Terrain under Dense Coastal Vegetation: An Object-Oriented Classification Ensemble Algorithm for Classification and Terrain Correction. Remote Sens. 2017, 9, 1187. [Google Scholar] [CrossRef]
Figure 1. Flowchart with the main methodological steps for the use of multiscale data to characterize and monitor gullies.
Agriengineering 07 00212 g001
Figure 3. Identification of the erosive process in the years (a) 2004, (b) 2012, (c) 2024, and (d) its temporal evolution, using high-spatial-resolution images of the GEP as a basis.
Agriengineering 07 00212 g003
Figure 4. The south section of the gully erosion process evolution, considering the time scale of the UAV data. The true color RGB image of 2017 is used as the background.
Agriengineering 07 00212 g004
Figure 5. The advance of the erosion front over the 20 years, based on GEP images from 2004, 2012, and 2024. The center of the road was used to correct the geometric displacements of the images. Yellow, cyan and purple lines refer to 2004, 2012 and, 2024, respectively.
Agriengineering 07 00212 g005
Figure 6. Change in the road position due to the evolution of the erosive process between 2004 and 2024. The boundaries of the gully are identified by the yellow and red lines for the years 2004 and 2024, respectively. The mapping was carried out based on high-spatial-resolution images from the GEP.
Agriengineering 07 00212 g006
Figure 7. Backward projection of the erosive process evolution in the gully, based on multiple remote sensing free data. High-spatial-resolution orbital data (from Google Earth Pro, GEP), Unmanned Aerial Vehicles (UAVs), and aerial imagery (DSG) data were utilized. Linear fit (red dashed line) and a linear projection (cyan continuous line) were applied. All area mappings were performed manually by the same analyst.
Agriengineering 07 00212 g007
Figure 8. A monochrome aerial image of the study area was taken in 1995 and acquired by the Army Geographic Service Division (DSG). The georeferencing process utilized large features, such as the 2024 orbital image (GEP).
Agriengineering 07 00212 g008
Figure 9. Variation of (a) the 25-year average monthly rainfall with the standard deviation and (b) the monthly accumulated precipitation over the 25 years. The blue vertical lines indicate the acquisition date of the images used to map the gully. Precipitation data were obtained from the product GPM GPM_3IMERGM v07 [58].
Agriengineering 07 00212 g009
Figure 10. The gully perimeter is delimited based on (a) UAV image from 2023 (shoulder lines in blue) and (b) GEP from 2024 (red). Both images have different spatial resolutions.
Agriengineering 07 00212 g010
Figure 11. The larger context of the gully and its relationship with the surrounding geomorphological processes. RGB image acquired with Matrice 100 UAV in 2017. The gully boundaries for the three evaluated dates and the preferred direction of advancement are indicated by the length of the white arrows.
Agriengineering 07 00212 g011
Figure 12. Details of the process of advancing the gully from east to west, with the indication of the relative altimetric elevations (contour lines with an equidistance of 2 m) and gully limits in 2017 and 2023. RGB image acquired with Matrice 100 UAV in 2017. The arrow indicates the preferred direction of the erosive process flow.
Agriengineering 07 00212 g012
Figure 13. Profile (a) longitudinal (vector 1 red line) and (b) transverse (vector 2 red line) related to RS-508. The relative digital elevation model of the UAV was used. The excerpts of the transects superimposed on the RGB ortho-mosaic are presented, along with the position of the photograph taken by the X3 Matrice 100 camera, in 2017 (blue points).
Agriengineering 07 00212 g013
Disclaimer/Publisher’s Note: The statements, opinions and data contained in all publications are solely those of the individual author(s) and contributor(s) and not of MDPI and/or the editor(s). MDPI and/or the editor(s) disclaim responsibility for any injury to people or property resulting from any ideas, methods, instructions or products referred to in the content.

