Article

Evaluation of a Prototype Variable-Frequency Soil-Moisture and EC Probe

1
Faculty of Agriculture, Saga University, Saga 840-8502, Japan
2
Department of Irrigation and Water Management, Bangladesh Agricultural University, Mymensingh 2202, Bangladesh
3
CSIRO Environment, Black Mountain Science and Innovation Park, Canberra, ACT 2601, Australia
*
Author to whom correspondence should be addressed.
AgriEngineering 2025, 7(3), 50; https://doi.org/10.3390/agriengineering7030050
Submission received: 29 January 2025 / Revised: 10 February 2025 / Accepted: 11 February 2025 / Published: 20 February 2025

Abstract

:
Measuring surface soil moisture is vital for understanding water availability, agricultural productivity, and climate change impacts, as well as for drought prediction and water resource management. However, obtaining accurate data is challenging due to the lack of reliable probes that work across diverse soil types and conditions. This study evaluated a prototype dielectric probe developed by Daiki Rika Kogyo Co., Ltd., Saitama, Japan, through controlled laboratory experiments. The probe measures the real and imaginary parts of dielectric permittivity over 10–150 MHz in a 5.6 cm diameter, with a 2 cm length volume, achieving a ±2% accuracy for the real part of oil–ethanol and ethanol–water mixtures (3.26–79). The imaginary part of the dielectric permittivity of aqueous solutions is convertible into electrical conductivity (EC) with reasonable accuracy. For variably saturated sand, the real part is convertible to a volumetric soil-moisture content (≥0.10 m3m−3) using a custom equation. The probe’s variable-frequency measurements reduce the limitations of fixed-frequency approaches, accounting for the EC, clay, porosity, and organic matter effects. With its VNA principle and simultaneous measurement of dielectric properties, it offers innovative capabilities for addressing water management, agriculture, and climate prediction challenges.

1. Introduction

Soil moisture is an important ecohydrological parameter. It regulates many land-surface processes, such as the earth’s water, energy, and carbon cycles [1,2,3,4,5]. It is also vital for modeling applications related to energy balance, like numerical weather forecasting, climate prediction, radiative transfer modeling, global change modeling, and satellite data validation [6,7,8]. Soil-moisture data are necessary for efficient water management through proper irrigation scheduling [9,10,11] and optimizing irrigation management. It also helps in promoting climate-sensitive socio-economic activities by increasing the ability to predict regional water availability and seasonal climate [12]. Appropriate soil-moisture probes or sensors are useful decision-making tools for agricultural managers, irrigation practitioners, and researchers [13]. Thus, the accurate measurement of soil moisture is crucial. A significant amount of research has been carried out in the past few decades to develop and evaluate different technologies for measuring the soil moisture via a dielectric constant (relative dielectric permittivity, referred to as dielectric permittivity). The major approaches include electrical capacitance or frequency-domain reflectometry (FDR), electrical impedance or amplitude-domain reflectometry (ADR), time-domain transmission (TDT), and time-domain reflectometry (TDR) [14,15,16,17]. These devices work by sending an electromagnetic signal to a probe inserted into the soil. When the signal reflects (as in TDR), reaches the end of a loop-probe (as in TDT), or changes its frequency (as in FDR), it is detected and analyzed. The time required for the signal (in TDT and TDR) or the frequency of the reflected wave (in FDR) varies with the soil’s dielectric permittivity [18]. Many probes have been developed, but electromagnetic probes are widely used for in situ soil-moisture measurement [19] due to their ease of use and good data-logging capabilities. In agriculture, TDR probes are the most popular. They determine the real part of the bulk dielectric permittivity of the soil to estimate the volumetric soil-moisture content and the bulk soil electrical conductivity (EC) from the signal impedance. However, a major challenge is the need for soil-specific calibration for very saline, clayey, and organic soils due to the attenuation of the TDR signal and the empirical nature of linking the dielectric permittivity to the soil moisture. These factors limit the use of conventional TDR in these soils.
The soil porosity, clay content, organic matter, ionic charges (salinity), and temperature significantly influence the imaginary part of the soil dielectric permittivity [20,21]. These factors affect the real part of the dielectric permittivity without changing the total amount of water in the soil. The clay content, temperature, and salinity affect the real part of the dielectric permittivity due to the dielectric dispersion through the interphase phenomena and the Maxwell–Wagner effect. Clay particles have charged surfaces that interact with water molecules and ions, creating a structured water layer with different dielectric properties than bulk water. This interaction alters the system’s dielectric behavior at the interfaces between different phases. The Maxwell–Wagner effect occurs due to the polarization at interfaces between materials with different dielectric constants (e.g., clay particles and water), enhancing the dielectric permittivity at low frequencies due to the charge accumulation at these interfaces.
Higher temperatures increase the soil’s electrical conductivity by enhancing the ion mobility, leading to higher dielectric losses and affecting the real part of the dielectric permittivity through energy dissipation. Salinity influences dielectric permittivity through ionic polarization, increased conductivity, and enhanced Maxwell–Wagner polarization. Due to these effects, most soil-moisture probes based on dielectric measurements perform poorly in heavy clay, saline, vertic, and stony soils. These probes also have small sampling volumes and high costs, and require close soil–probe contact [22]. In the past, improvements were attempted by focusing on measuring the real part of the dielectric permittivity at high frequencies (>100 MHz) to address problems associated with the imaginary part [23]. However, these probes can only partially reduce errors from the imaginary part’s contribution but cannot eliminate them. Ref. [24], without modifying the probe, corrected the TDR-measured apparent dielectric permittivity by developing a rational relation between the apparent and actual dielectric permittivity, incorporating the effect of EC.
By examining the market for soil-moisture probes and the growth in ‘Agri-Tech’, ref. [22] concluded that most new soil-moisture probes available commercially in the last decade are based on already developed dielectric techniques. Only a few new methods for measuring soil moisture have been adopted in the last two decades. Ref. [25] introduced a frequency-domain approach for measuring soil moisture. This method uses measurements of the wideband scattering-parameter of soil samples placed into a measurement cell constructed with an EIA 1-5/8” coaxial transmission line. This cell is connected to a Vector Network Analyzer (VNA). By measuring the scattering parameters, the dielectric spectrum of the soil sample is determined. A VNA measures the frequency response of a component or a network composed of many components, both passive and active. The fundamental principle of a VNA is to measure the amplitude and phase of both incident and reflected waves at the various ports of the device under test. VNAs are commonly used in high-frequency technology laboratories worldwide to characterize radio frequency components, devices, circuits, and sub-assemblies by measuring scattering parameters.
To overcome the high cost of TDR (around 4000 €, depending on the model), ref. [26] proposed using a mini Vector Network Analyzer (miniVNA) for soil-moisture measurement. The miniVNA is a significant advancement in electromagnetic technology, with a relatively small size and a fraction of the cost (between 50 € and 100 € per unit) of standard tabletop VNAs [27]. The VNA-based soil-moisture probes investigated in this study have not been commercialized yet, but are currently under development. Manufacturers are continuously developing model probes, and researchers are evaluating them to find design improvements. Measuring the soil dielectric spectrum over a broadband requires large-diameter coaxial transmission-line cells connected to a VNA. Methods for characterizing the dielectric spectrum of materials using a coaxial transmission-line cell involve a VNA and measure the scattering parameters of the sample [28]. These cells are widely used for soil dielectric spectrum characterization [29,30] because they allow for larger sample volumes than open-ended probes. However, coaxial transmission-line cells are not suitable for practical field use.
In this study, we evaluated a soil-moisture-EC model probe, designed using VNA principles (hereafter called VNA-based probe), in laboratory experiments during the probe’s final development stage. The probe has five-rod waveguides attached to a probe head. It provides the real and imaginary parts of the dielectric permittivity of liquids and porous media over 10 to 500 MHz. We assessed the accuracy of the dielectric and EC measurements by the probe over this frequency range to identify the suitable frequency or frequency range for commercial manufacturing. The proper installation of the probe in soil and interpretation of data require knowing the sampling volume. This volume is the soil around the probe where changes in water content affect readings [31]. We experimentally determined the probe’s sampling volume.

2. Theoretical Background

The complex relative dielectric permittivity (also known as the dielectric constant), denoted as ε, of dielectric materials is described by [32]:
ε = ε r j ε i
where εr is the real part and εi is the imaginary part of the relative dielectric permittivity, both being frequency-dependent, and j is the imaginary unit (√(−1). The real part of the dielectric permittivity is the highest at zero frequency and decreases as the frequency increases, reaching 1 at very high frequencies. The imaginary part of the dielectric permittivity is zero at both low and high frequencies but peaks when ωτ = 1, where ω is the angular frequency of the applied electric field (in radians per second) and τ is the relaxation time of the dielectrics [32]. The relaxation time indicates how long it takes for charges in dielectrics to become neutralized through conduction.
The real part of the dielectric permittivity describes the energy stored in dielectrics due to polarization, while the imaginary part describes the energy loss in dielectrics. The imaginary part includes energy loss from frequency-dependent dielectric polarization (εp) and from ionic conduction (εii) when free ionic charges are present in the dielectrics. According to [33], the ionic conduction loss is expressed as σ/ωεo, so the imaginary part of the relative dielectric permittivity can be expressed as follows:
ε i = ε p + ε i i = ε p + σ ω ε o
where σ is the low frequency (~dc) electrical conductivity (Sm−1) due to ionic conduction, ω (= 2πf) is the angular frequency of the applied electric field (rad s−1), f is the cyclic frequency of the electric field (Hz), and εo is the dielectric permittivity of free space (8.85 × 10⁻¹² F m−1). The polarization loss is zero at dc and, hence, the electrical conductivity due to polarization loss is also zero but increases as the frequency increases. Some researchers, like [34], assumed that the losses from polarization and ionic conduction are similar. These investigators combined these two losses into the imaginary part of the dielectric permittivity, representing them as an equivalent electrical conductivity (σeq):
ε i = σ e q ω ε o

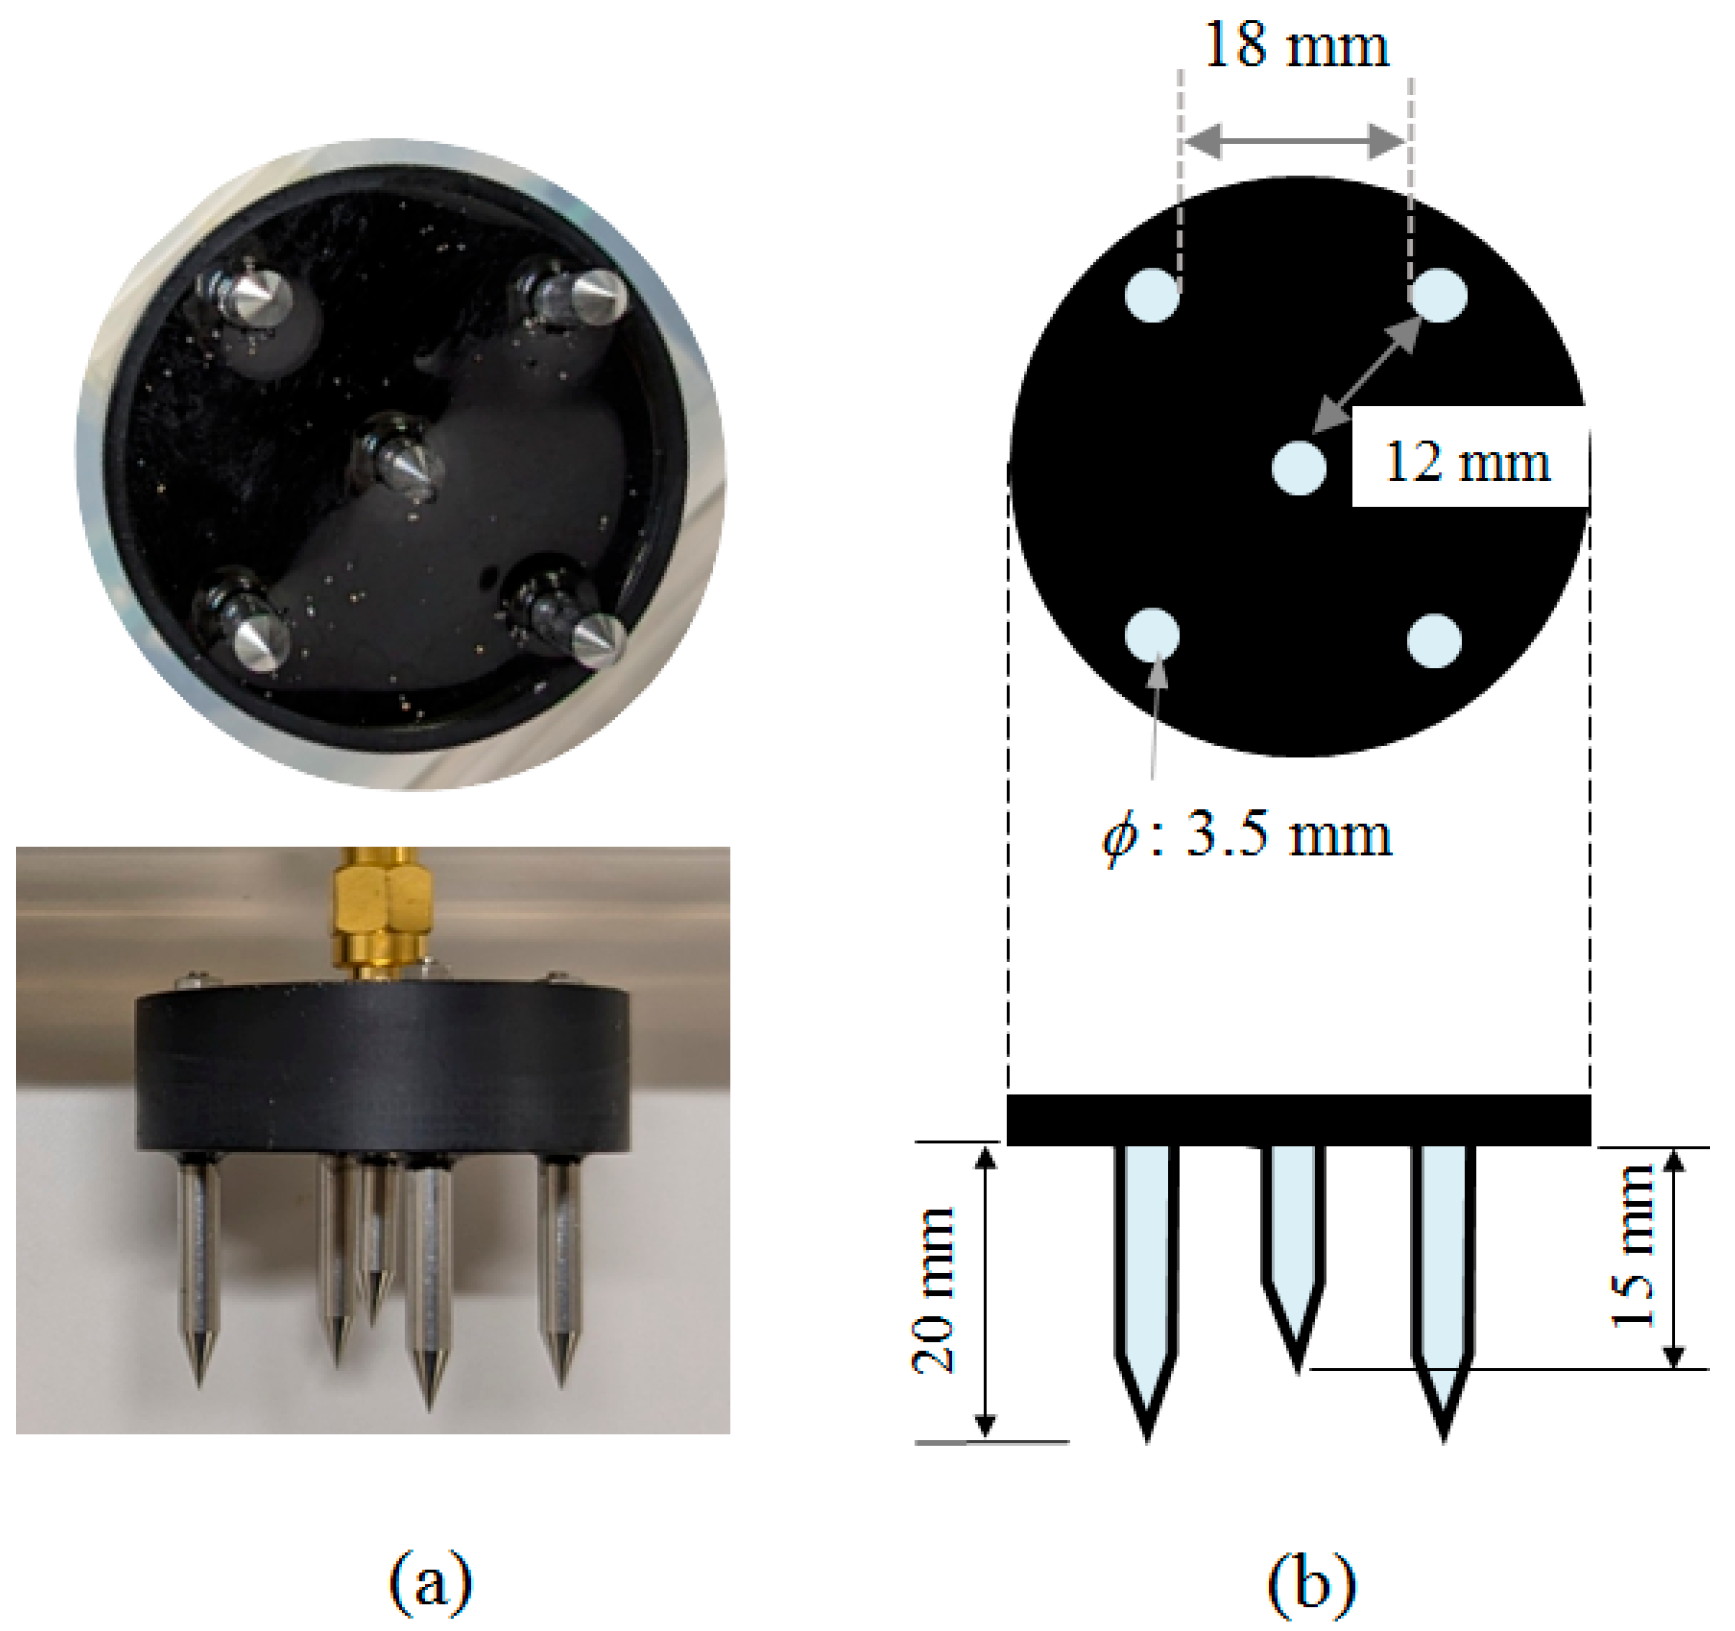
3. Description of the Probe

Daiki Rika Kogyo Co., Ltd. in Japan has created a new prototype of a dielectric probe using the VNA principle. This probe has five rods made of stainless steel, with one central rod and four outer rods, plus an electrode base and an SMA connector as illustrated in Figure 1. The five rods act like a coaxial cell. A key feature of this probe is its use of a variable load, which helps measure the scattering parameter of a sample around the rods. The variable load is an adjustable component that changes the impedance at the end of the coaxial cell. This adjustment improves the measurement accuracy by fine-tuning the impedance, affecting the scattering parameters and the material properties of the sample. The probe measures the complex scattering parameter S11, which shows how much of a signal is reflected by an impedance change in a system. This parameter is linked to the dielectric properties of the materials between conductors. The S11 data are used to determine the dielectric permittivity, which is calculated using the ‘Open-Water-Liquid (OWL)’ calibration method. Tests were carried out on various materials, such as water, oil, ethanol, and sand, over a frequency range of 10 to 500 MHz. The results helped assess the probe’s accuracy and identify the best frequency range for measurements. The probe’s design was initially based on trial and error without electromagnetic simulations so as to obtain a good shape regular signal. The company plans to finalize the probe design and make a first batch with different sizes and shapes for various frequencies. The probe’s major advantage is its compact and affordable design, which uses the VNA principle in a portable format. It can measure high-speed signals and is compatible with SDI-12 protocol dataloggers, including those from Campbell Scientific, Inc., and can be controlled by low-cost microcontroller boards like Arduino or M5Stack.

4. Materials and Methods

4.1. Sampling Volume Measurement

The sampling volume of the probe was determined in distilled water and air by positioning it vertically. A cylindrical transparent plastic pot with a diameter of 15 cm and a height of 10 cm was used. This pot was placed on a screw-driven jack and filled with distilled water to a depth of 9 cm. The jack could raise or lower the pot as needed. The probe was mounted on a stand and clamp and placed vertically above the water surface in the pot, centering the core rod of the probe in the middle of the pot. Initially, the probe was set so that its end was 5 cm above the water surface, a distance confirmed by a pre-trial to be outside the probe’s influencing zone. Then, the pot was raised in small increments and the real and imaginary parts of dielectric permittivity were measured at each step over the entire frequency band. This process continued until the probe was submerged to a depth (described in results) where no further changes in the probe’s outputs were observed. With the probe fully submerged (with the core rod 7.5 cm from the cylinder wall), the dielectric measurements were recorded. Next, the pot was moved horizontally on the jack in small increments and dielectric measurements were taken each time. This horizontal movement and measurement continued until no further changes were seen in the probe outputs. All measurements were performed in the laboratory at 22.0 ± 0.5 °C.

4.2. Dielectric Permittivity Measurement in Oil–Ethanol and Ethanol–Water Mixtures

These measurements aimed to check how accurately the VNA-based probe measures dielectric permittivity in materials with different permittivity. We used non-saline liquids to avoid interference from EC, which affects dielectric measurements through the imaginary part. We prepared four rapeseed oil and ethanol mixtures in cylindrical plastic pots, each with a 15 cm diameter and 10 cm height, holding 1.5 L each. The mixtures had oil-to-ethanol volume ratios of 1:0, 5:1, 3:2, and 1:2. We also prepared seven ethanol and distilled water mixtures in similar pots, with ethanol-to-water volume ratios of 1:0, 4:1, 3:2, 2:3, 3:7, 1:4, and 0:1. After preparation, the samples were kept in the laboratory for 3 days at 22.0 ± 0.5 °C to ensure they were well-mixed and equilibrated at room temperature. The EC of the samples was very low, ranging from 1.1 to 3.4 µS cm−1. We measured the real and imaginary parts of dielectric permittivity by inserting the probe vertically into each sample. The probe was mounted on a stand and the samples were placed on a screw-driven jack. We took three measurements for each sample across the probe’s frequency range (10 to 500 MHz); the results were consistent. We also measured the samples’ dielectric permittivity using a Programmable Network Analyzer (PNA-L) (N5230A by Agilent Technologies, Santa Clara, CA 95051, USA). When the VNA was unavailable later in the study, we estimated the real part of dielectric permittivity for the oil–ethanol mixtures based on a previous study by [35] and used these values to compare with the probe’s measurements.

4.3. Dielectric Permittivity Measurement in Electrolyte Solutions

This measurement had two goals: (i) to evaluate the imaginary part of the dielectric permittivity for estimating the EC from it, and (ii) to assess how EC affects the real part of dielectric permittivity measured by a VNA-based probe. The procedure was the same as for measuring dielectric properties in non-saline liquids like oil–ethanol and ethanol–water mixtures, but, here, we used electrolyte solutions. We prepared seven electrolyte solutions by mixing NaCl with distilled water in cylindrical plastic pots (15 cm diameter and 10 cm height). Distilled water was included as a standard for comparison. The solutions were left in the laboratory for 3 days at 22.0 ± 0.5 °C to ensure uniform mixing and equilibrated at room temperature. The NaCl concentrations in the solutions were 64, 320, 640, 1280, 2560, 3840, and 5120 mg L−1, which corresponded to EC values of 0.149, 0.709, 1.43, 2.65, 5.08, 7.26, and 9.58 dSm−1 at 22 °C. Each sample volume was 1.5 L. We measured the real and imaginary parts of the dielectric permittivity of these electrolyte solutions and distilled water using the same probe and procedure as for the non-saline liquid mixtures.

4.4. Dielectric Permittivity Measurement in Sand

Fine sand (Toyoura Standard Sand from Japan, with 99.6% sand, 0.3% silt, and 0.1% clay, and an average bulk density of 1.5 gcm−3) was washed three times with distilled water to remove any salt or impurities, and then dried in an oven at 105 °C for 24 h. We used a transparent cylindrical plastic pot with a height of 4.3 cm and a diameter of 9.3 cm, which was closed at the bottom, as the soil sample holder. The pot was large enough to fit the probe’s volume, as described in Section 4.1. We inserted the probe into the pot through a pre-cut hole at the bottom and sealed it with silicon. The pot was mounted upright with a stand and clamp. We determined the inner volume of the pot (282.3 cm3 without the probe rods) by filling it with a measured amount of water. Six samples of oven-dried sand, each weighing 390.9 g (to fill the sampler completely at a bulk density of 1.38 gcm−3), were prepared. Distilled water was mixed with these samples to achieve volumetric water contents of 0.05, 0.10, 0.15, 0.20, 0.25, and 0.30 m3m−3. Each sample was placed in a polyethylene bag, sprayed with the required amount of water, and mixed thoroughly for 15 min while keeping the bag closed to prevent evaporation. The water-mixed samples were left at 22 °C for 2 days to ensure even soil–water mixing. The sample holder, with the probe fixed upright, was filled with wet sand and compacted intermittently to maintain a dry bulk density of 1.38 g cm−3. After filling, the top of the sample holder was covered with a polyethylene sheet to prevent water loss through evaporation. We measured the real and imaginary parts of the dielectric permittivity of the sand samples using a VNA-based probe. After the measurements, each sample was transferred to a pre-weighed aluminum tray, weighed, and then dried in the oven. The volumetric water content of each sample was calculated from the weights of the wet and oven-dried samples and the volume of the sampler.

4.5. Data Analyses

(a)
EC estimation from the imaginary part of dielectric permittivity
The imaginary part of dielectric permittivity, denoted as εi (from Equation (2)), in NaCl solutions is composed of two components: dielectric polarization loss and ionic conduction loss. We analyzed the εi spectra obtained from these solutions to explore their correlation with the electrical conductivity, EC, measured separately using a standard EC meter (EC850 Portable Conductivity Meter, Apera Instruments Co., Ltd., Xuhui District, Shanghai, China). During this analysis, we estimated the ionic conduction loss (σ/ωεo, as defined in Equation (2)) and isolated the polarization loss (εp in Equation (2)) by subtracting the ionic conduction loss from the measured εi spectra. To determine the relationship between the imaginary part of dielectric permittivity and the known ECs of the solutions, we examined various models, including the linear relationship expressed in Equation (3), as well as exponential and power law models. Through this evaluation, we identified the model that best describes the relationship between the imaginary part of dielectric permittivity and EC, which can then be applied to estimate EC based on the probe-measured εi values.
(b)
Soil-moisture content determination
Many models have been proposed to correlate bulk soil dielectric permittivity with soil-moisture content [36] and references therein, including [37,38,39]. To calculate the volumetric soil-moisture content (θ) in wet sand, we used the real part of the dielectric permittivity (εr) measured by the probe. We applied the equations provided by [37,40] as
θ = 5.3 × 10 2 + 2.92 × 10 2 ε 5.5 × 10 4 ε 2 + 4.3 × 10 6 ε 3
and
θ = 0.1138 ε r 0.1758
The calculated soil-moisture contents were compared with the measured soil-moisture contents of the sand samples over a range of frequencies from 10 to 500 MHz.
(c)
MBE, RMSE, and % error calculations
We assessed the accuracy of dielectric permittivity measurements for oil–ethanol and ethanol–water mixtures, and NaCl solutions by comparing the probe’s readings with independently measured values (with PNA-L machine) across its operating frequency range. We also compared the electrical conductivities (ECs) of the electrolyte solutions, estimated from the imaginary parts of dielectric permittivity (using Equation (3)), with the ECs measured independently. Additionally, we compared gravimetrically measured water contents with those determined from the probe-measured real part of dielectric permittivity over the entire frequency band using the equations from [37,40]. These comparisons were evaluated using Mean Bias Error (MBE), Root-Mean-Square Error (RMSE), and percent error between the probe-measured values and the known values. The MBE indicates whether the probe tends to overestimate or underestimate, while the RMSE shows the overall agreement between the probe-measured values and the known values. We calculated the MBE and RMSE as
M B E = P i O i N
and
R M S E = P i O i 2 N
where Pi represents the estimated value of the ith observation Oi, and N denotes the total number of observations. In this study, Pi refers to either the probe-measured real part of the dielectric permittivity or the estimated EC derived from the probe-measured imaginary part of the dielectric permittivity. Conversely, Oi signifies the independently measured real part of the dielectric permittivity (a constant) for each liquid at a low-frequency range where dielectric polarization loss is negligible, or the independently measured EC for each electrolyte solution. This analysis helps identify the frequency or frequency range where the probe-measured real parts of the dielectric permittivity are closest to their known values, thereby revealing the accuracy of estimating EC from the imaginary part of the probe-measured dielectric permittivity.

5. Results

5.1. Probe Outputs

The probe measures the real and imaginary parts of the dielectric permittivity of a medium within its sampling volume over a frequency range of 10 to 500 MHz. For ethanol–water mixtures, the real part of the dielectric permittivity, measured with a PNA-L, remains almost constant from 10 to 500 MHz (Figure 2). However, the VNA-based probe shows significant changes in the real part starting around 120 MHz. It increases for ethanol–water ratios of ≤4:1 but decreases for ratios ≥ 3:2. Both the ethanol–water and oil–ethanol mixtures’ real parts rise to a peak between 110 MHz and 290 MHz and then slightly decrease before stabilizing at higher frequencies. For oil–ethanol mixtures, the real part of the dielectric permittivity increases after 90 MHz. For imaginary parts, the VNA produces noisy outputs with negative values below 100 MHz and then shows a nonlinear increase at higher frequencies. The probe’s imaginary parts gradually increase up to 200–240 MHz, then decrease rapidly before rising again. The probe’s outputs change abruptly at 170 MHz and between 340 MHz and 360 MHz compared to the PNA-L outputs. These changes might be due to resonance effects, implying that certain probe dimensions can create unwanted resonances at specific frequencies, leading to abrupt changes or artifacts in the dielectric measurement. However, the probe’s measurements of both the real and imaginary parts align with the VNA’s results up to 150 MHz, suggesting that 10–150 MHz may be the most suitable operating frequency for the probe.

5.2. Sampling Volume of the Probe

The VNA-based probe’s outputs did not change much until its tips touched the water surface while being lowered from air. Immersing the probe beyond the 2 cm length of the probe rods did not affect the output either. This suggests that the probe’s sampling volume is equal to the length of the probe rods, and the probe head or space beyond the rod tips does not impact the dielectric measurements. Figure 3a shows the comparison between the real part of the dielectric permittivity measured by the probe and its actual (PNA-L)/theoretical [35] value for different diameters of the sampling volume over 10–150 MHz. Except for frequency-dependent variations, the measured values are close to the actual values up to a 2.1 cm distance between the probe’s core rod center and the sample holder wall. The measured dielectric permittivity remains consistent up to a 2.8 cm distance but decreases as this distance decreases. The percentage error range between the measured and actual dielectric permittivity values is ±1% over 10–120 MHz and −1% to 2% over 10–140 MHz (Figure 3b). This indicates that the probe’s bulk sampling volume is a cylindrical shape around the core rod with a 5.6 cm diameter. Since the electric field weakens more in water compared to the lower-permittivity media like soil-water systems, the probe’s sensitivity zone is larger in the lower-permittivity media. Therefore, the sample diameter in a soil-water system would be larger than 5.6 cm.

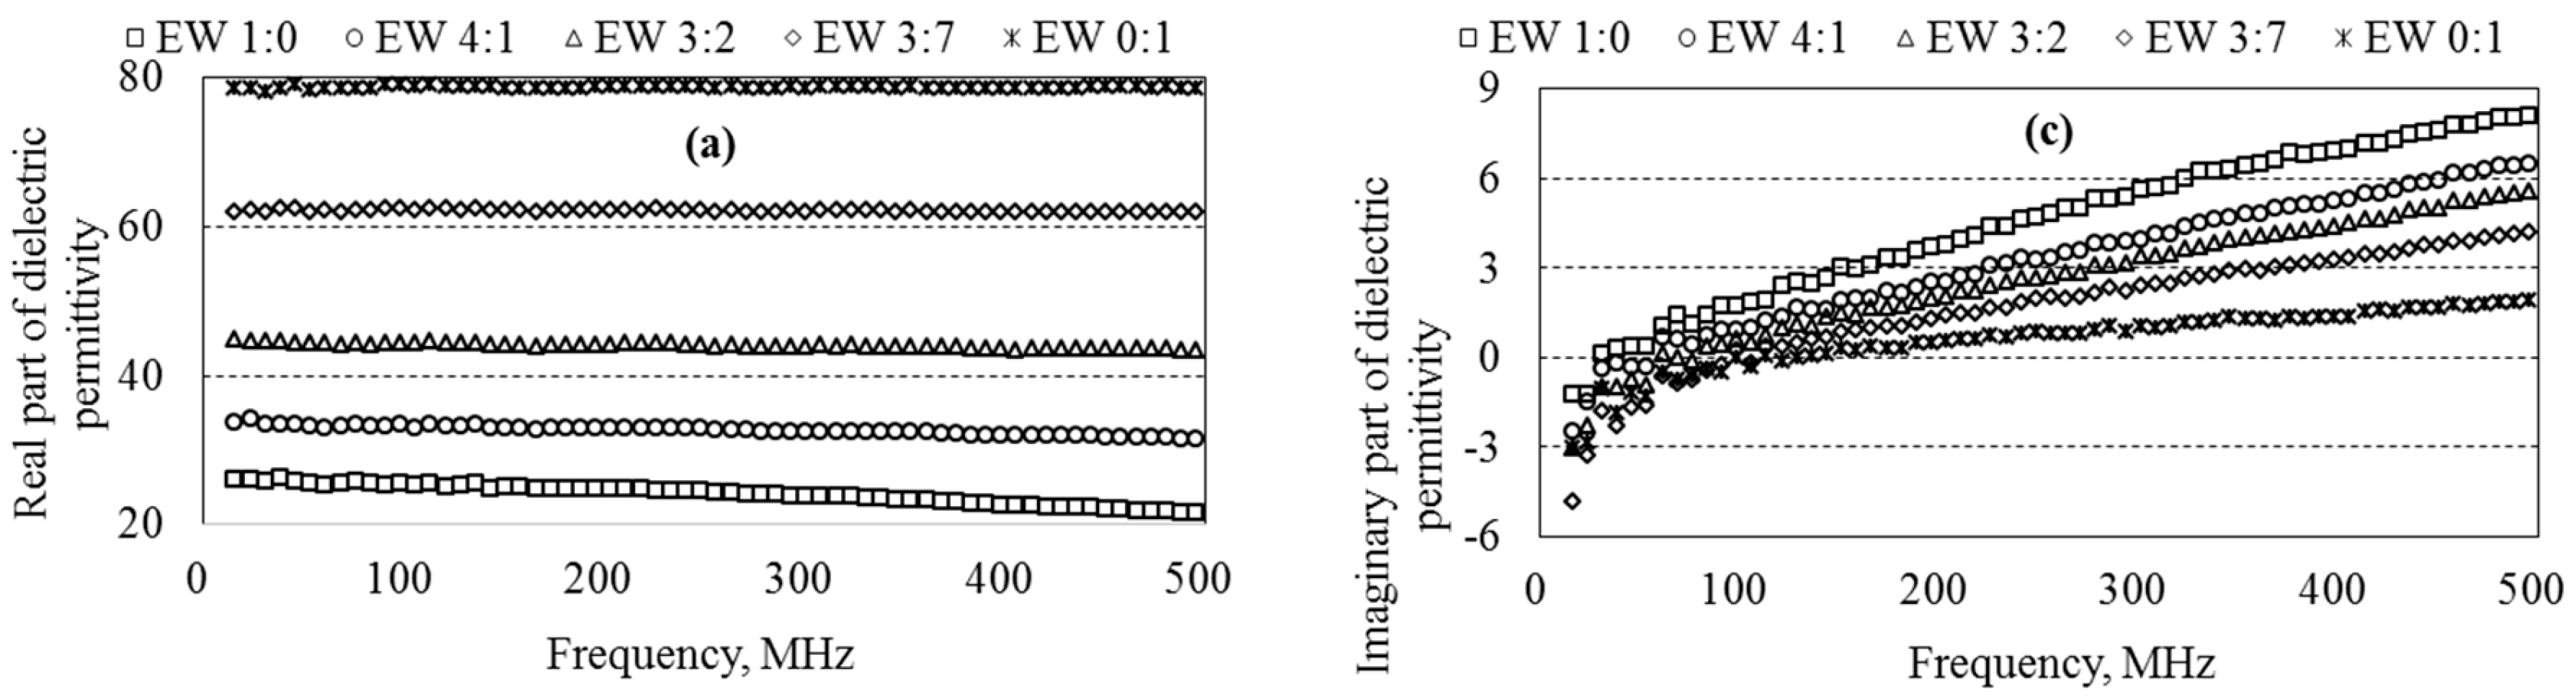
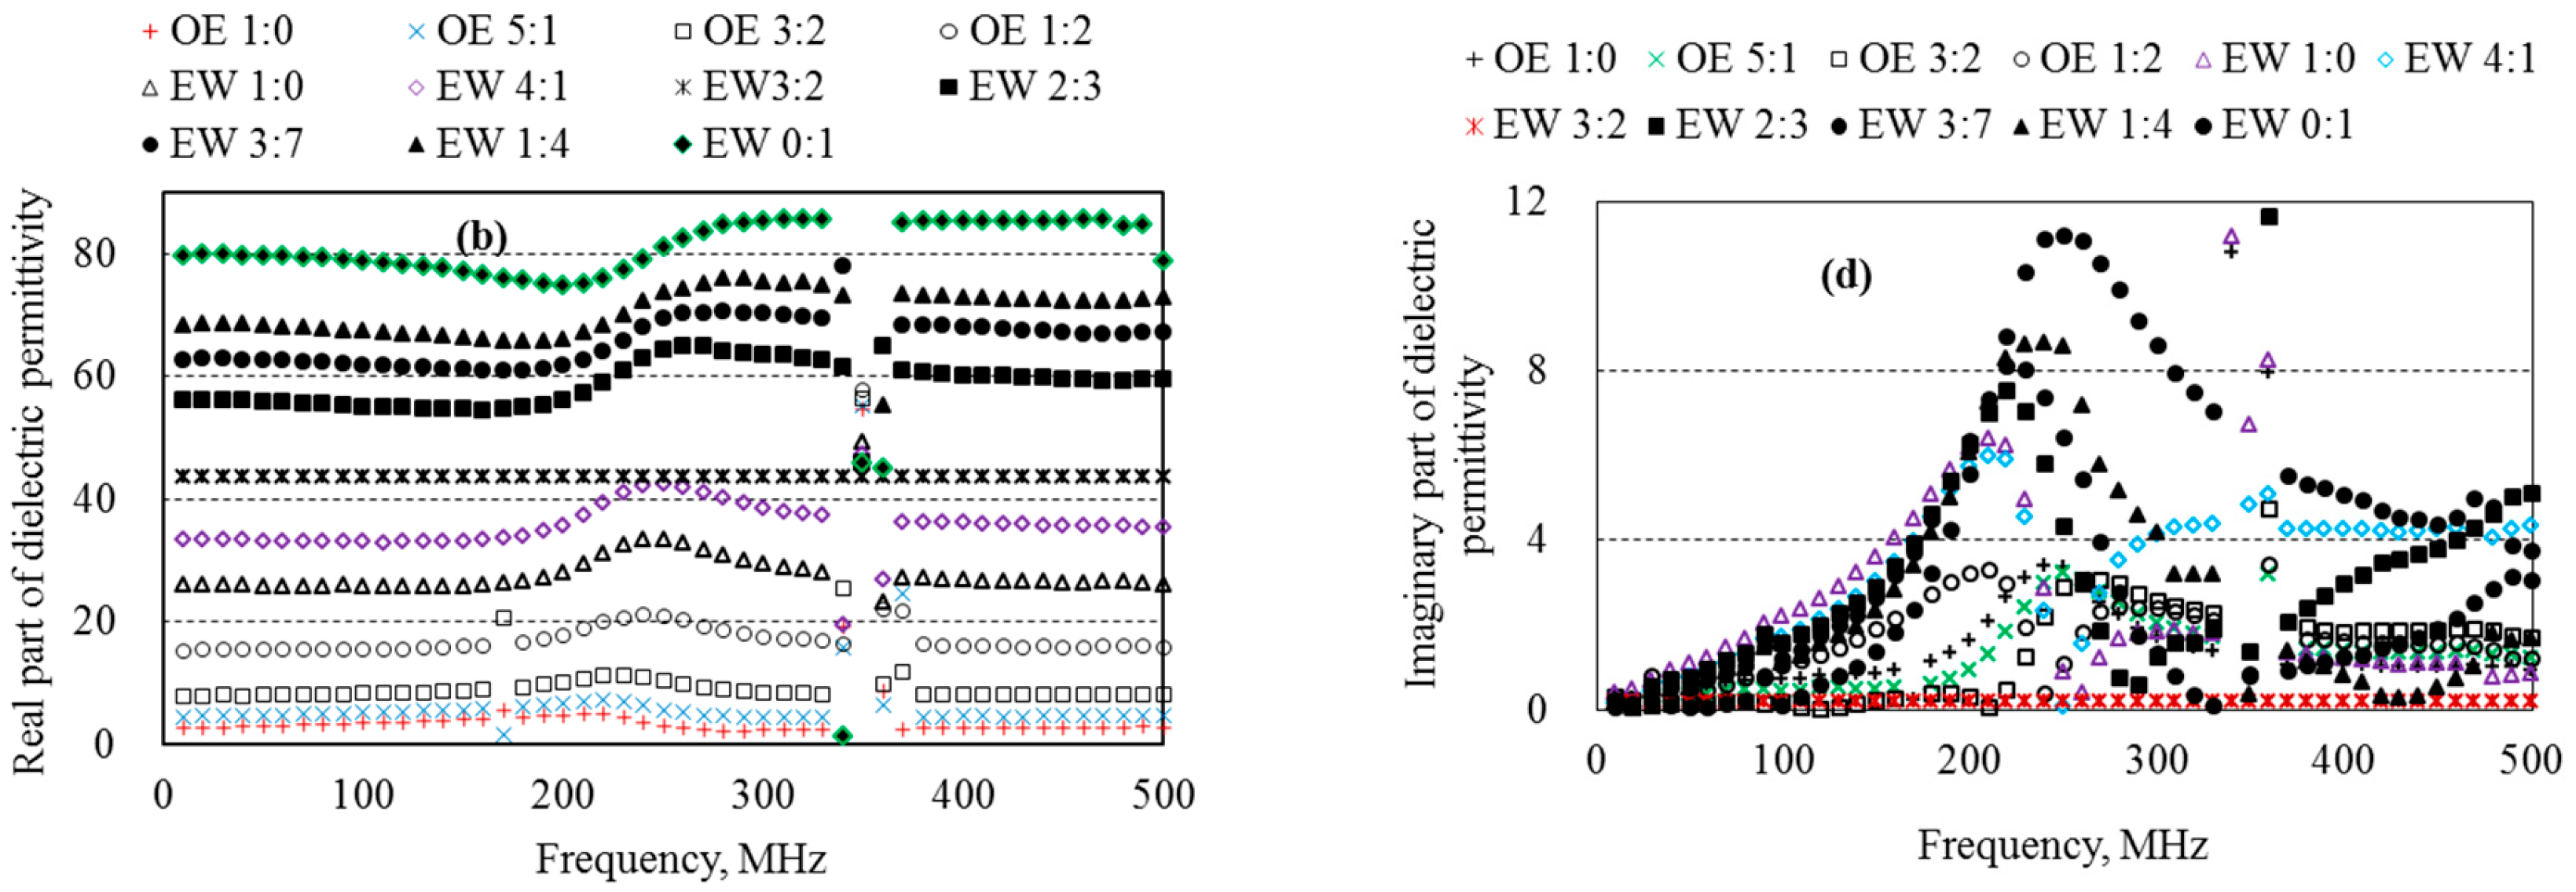
5.3. Dielectric Permittivity of Ethanol–Water Mixtures

Figure 4a shows the percentage error between the dielectric permittivity measured by the probe and PNA-L for ethanol–water mixtures. The probe accurately measures the real part of dielectric permittivity across a wide range (from 3.26 in oil to 79 in distilled water) up to a certain frequency. The measurement error by the probe is within ±2% up to 150 MHz, except for the 1:4 ethanol–water mixture where the error is between −2% and −4% below 70 MHz. The RMSE between the probe’s measurements and known values (from PNA-L) is between 0.7 and 0.9 from 10 to 150 MHz, but it increases rapidly after that. The probe showed no bias in measurements over this frequency range; the MBE ranges from 0.95 to −0.73 (Figure 4b). The potential sources of error in dielectric measurements using the probe include electrode polarization, ionic conductivity, frequency dependence, and probe limitations. Electrode polarization causes a charge accumulation at electrode interfaces, distorting measurements, particularly at low frequencies. High ionic concentrations result in conduction losses, impacting permittivity readings. Variations in frequency influence material interactions, leading to changes in permittivity values. Additionally, the probe design and calibration may introduce measurement inaccuracies.

5.4. Dielectric Permittivity of Aqueous Solutions

The real part of the dielectric permittivity in aqueous solutions depends on both the frequency and EC of the solutions (Figure 5a). At 10 MHz, solutions with an EC between 0.709 dSm−1 and 5.08 dSm−1 have a higher dielectric permittivity than distilled water. However, this dielectric permittivity decreases slowly over 10 to 40 MHz and is similar to that of distilled water from 40 to 150 MHz. For solutions with an EC of 7.26 dSm−1 or higher, the real part of the dielectric permittivity increases by more than 5% compared to distilled water (Figure 5b).

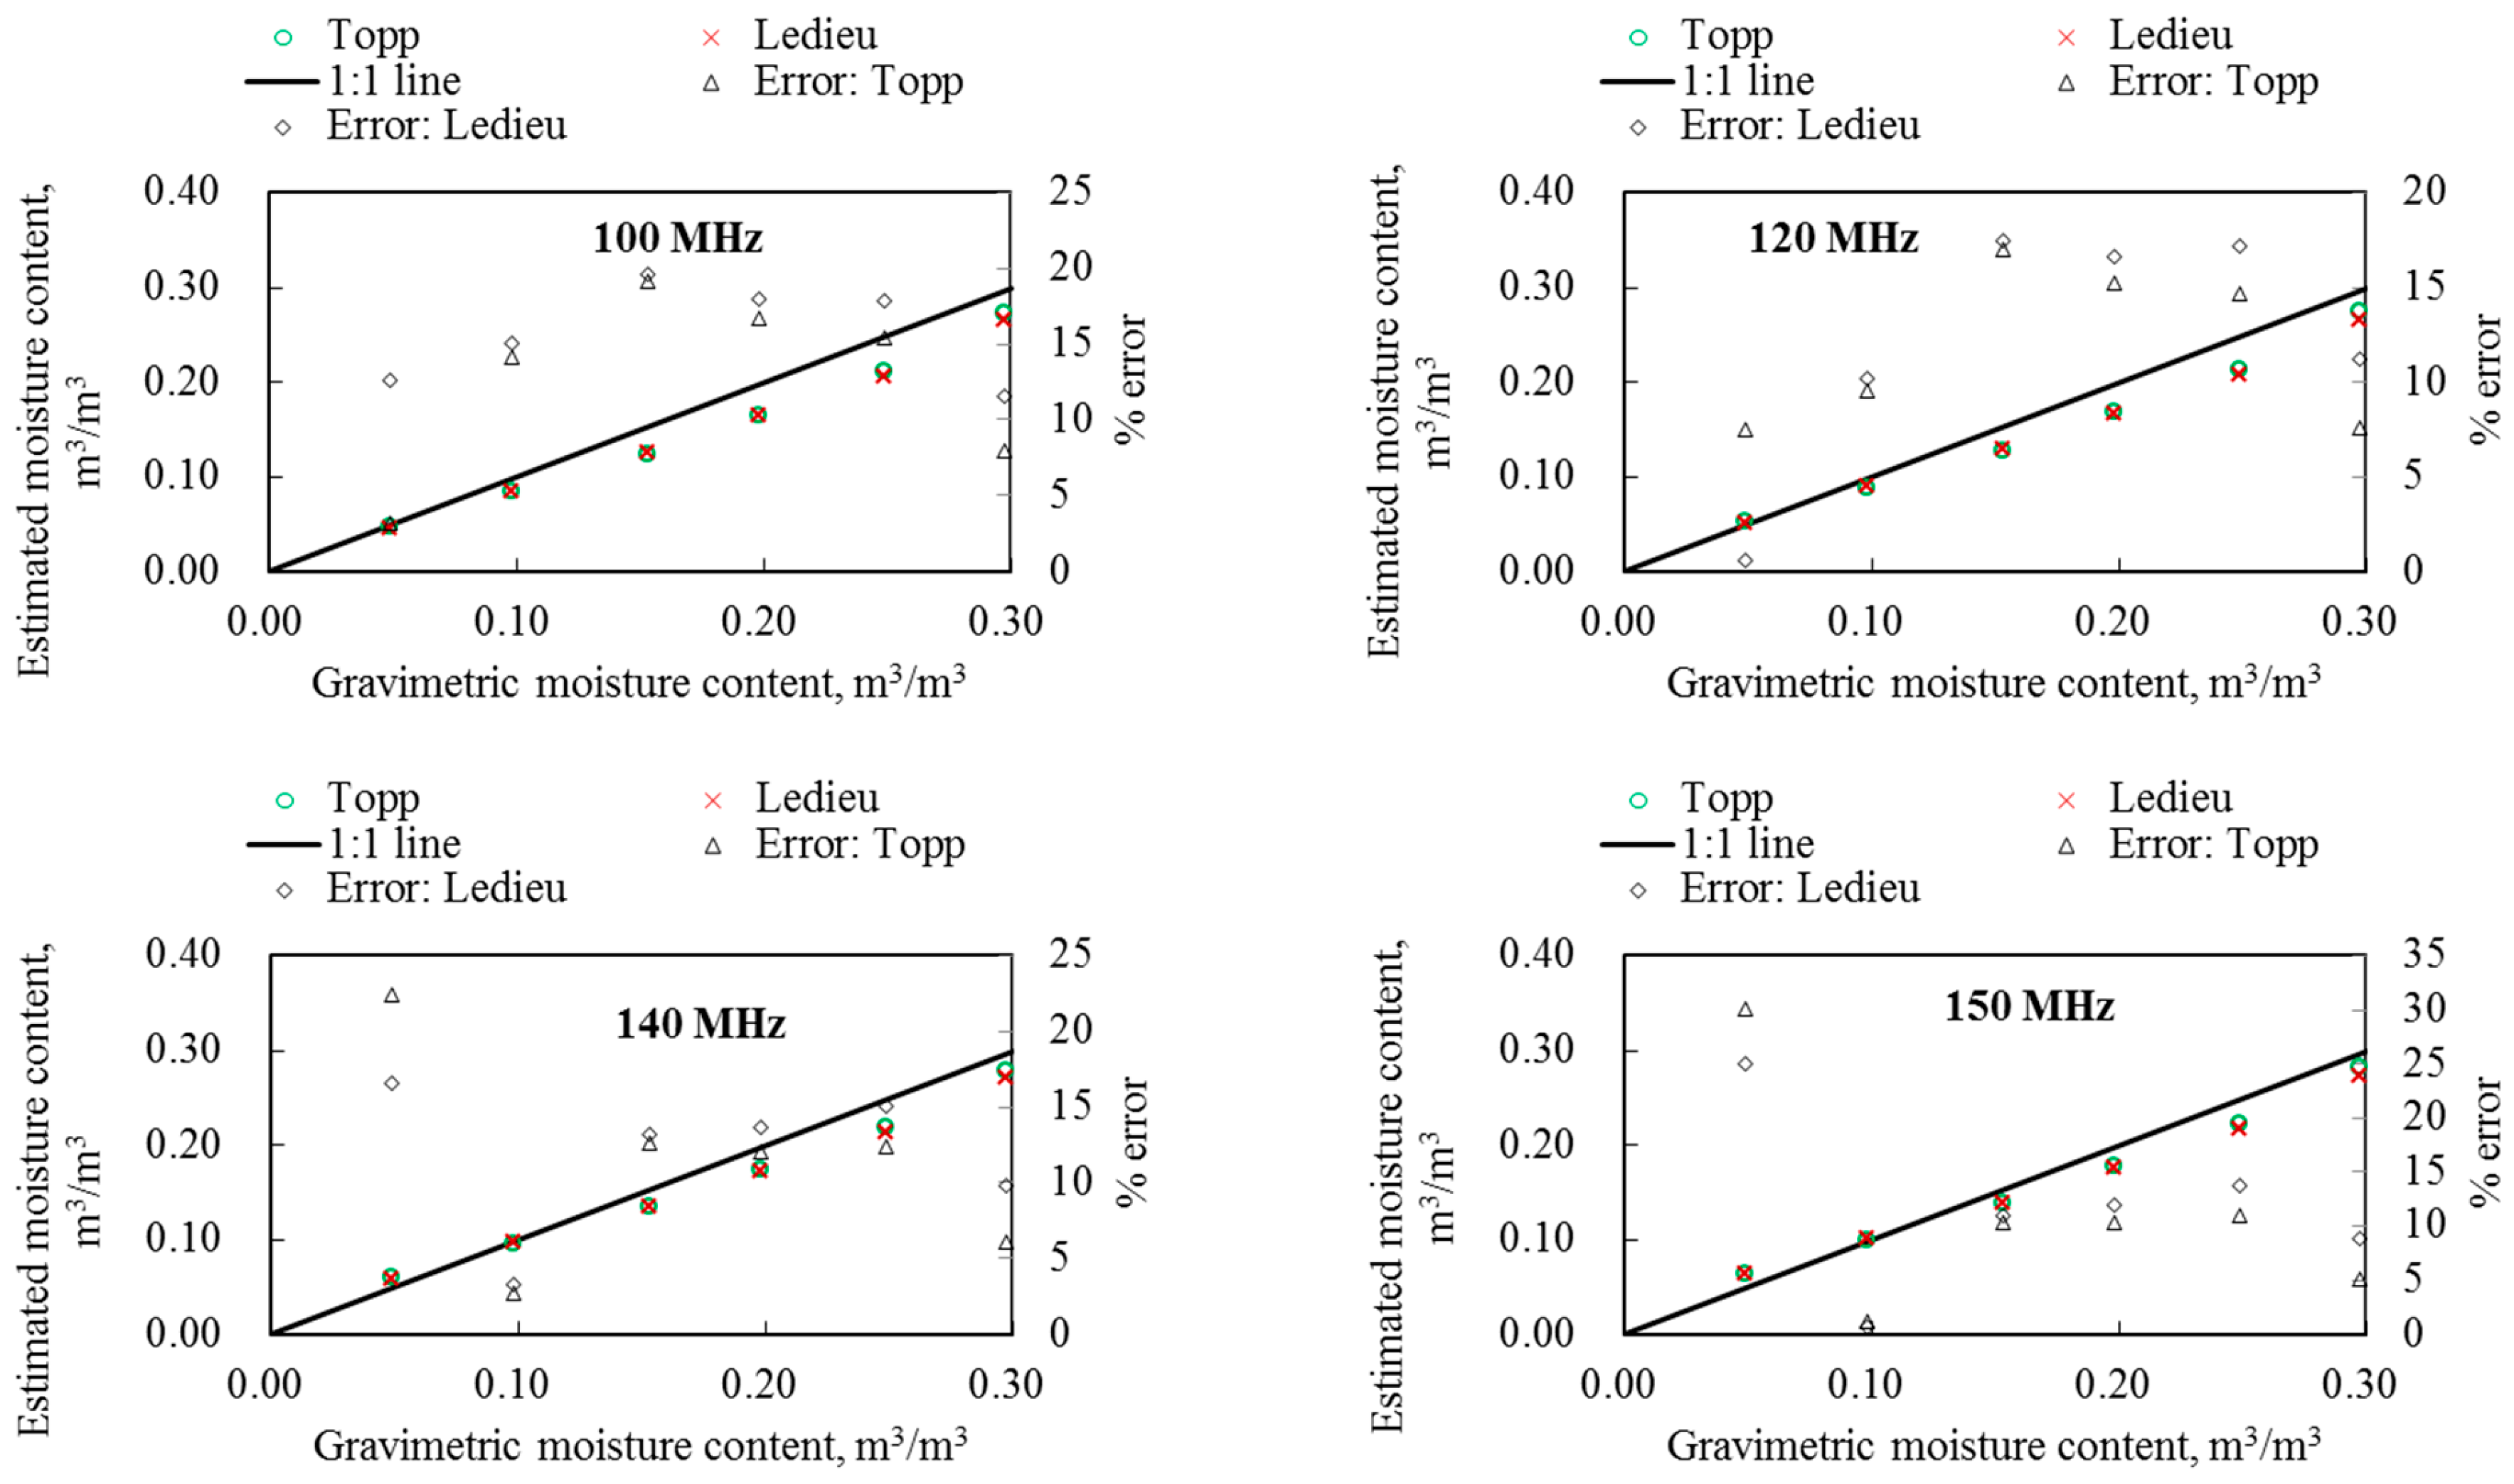
5.5. Dielectric Permittivity and Water Content of Sand

The real parts of the dielectric permittivity for six sand samples with different moisture levels (0.05 to 0.30 m3m−3) increase slowly as the frequency increases (Figure 6a). This increase might not be physical and could be due to issues with the probe or its calibration. The imaginary parts of the dielectric permittivity in wet sand with distilled water reflect the energy loss from polarization, mostly of water molecules, as there are no free ions in the sand. Generally, the imaginary part increases with the frequency, but, for three samples with a higher moisture content, it first decreases at low frequencies before increasing at higher frequencies (Figure 6b). Below 60 MHz, the imaginary part decreases with the frequency, but it starts to increase slowly at higher frequencies. Over the range of 10 to 150 MHz, the real parts of the dielectric permittivity are mostly unaffected by changes in the imaginary parts.
The empirical equation of [37] (Equation (4)) was used to estimate the moisture contents in sand samples, but these estimates varied with the frequency, leading to some errors compared to gravimetric measurements (Figure 7). The percent error was large and positive at low frequencies, large and negative at high frequencies, and minimum or nonexistent in the mid-frequency range, depending on the moisture content of the samples (Figure 7a). For samples with lower moisture contents, the error was small at lower frequencies, while, for higher moisture contents, the error was small at higher frequencies. Assuming the [36] equation is appropriate for the sand, the positive MBE at lower frequencies and the negative MBE at higher frequencies (Figure 7b) indicate that the equation underestimates the soil-moisture content at lower frequencies and overestimates it at higher frequencies from the probe-measured dielectric measurements. The RMSE between the gravimetrically measured soil-moisture content and the estimate from Equation (4) is within ±0.04 m3m−3 over the frequency range of 10–150 MHz. Similar results were obtained using Equation (5) of [40]. These findings are consistent with the dielectric measurements in ethanol–water mixtures (Figure 4). Therefore, the real part of the dielectric permittivity measured by the probe over 10 to 150 MHz is expected to reflect the actual dielectric permittivity of the soil samples and provide a reliable soil-moisture content using any suitable model. This was verified by comparing the soil-moisture contents estimated by Equations (4) and (5) for various frequencies (20, 40, 60, 80, 100, 120, 140, and 150 MHz) with those measured gravimetrically (Figure 8). The mean deviation between the estimated and measured soil-moisture contents is (25.0 ± 15.9) % at 0.05 m3m−3 and between (10 ± 2.5)% and (20 ±11.3)% for other soil-moisture contents. The mean deviation ranges from 11 to 24% with a standard deviation of 4 to 10% for Equation (4) and from 12 to 29% with a standard deviation of 5 to 15% for Equation (5). Both the mean deviation and standard deviation decrease with increasing frequency.
Equations (4) and (5) consistently underestimated the soil-moisture contents at all frequencies. Since these equations were developed for time-domain reflectometry (TDR) instruments with a much higher effective frequency band (in the GHz range) than the tested VNA-based probe, discrepancies in the estimates are expected. A custom equation tailored to the tested probe at the examined frequencies would likely be more accurate. However, since this study only tested the probe in sand, future research will be needed to develop a reliable custom equation by testing the probe in various soil textures. This will be addressed in a future study, potentially following improvements to the probe.

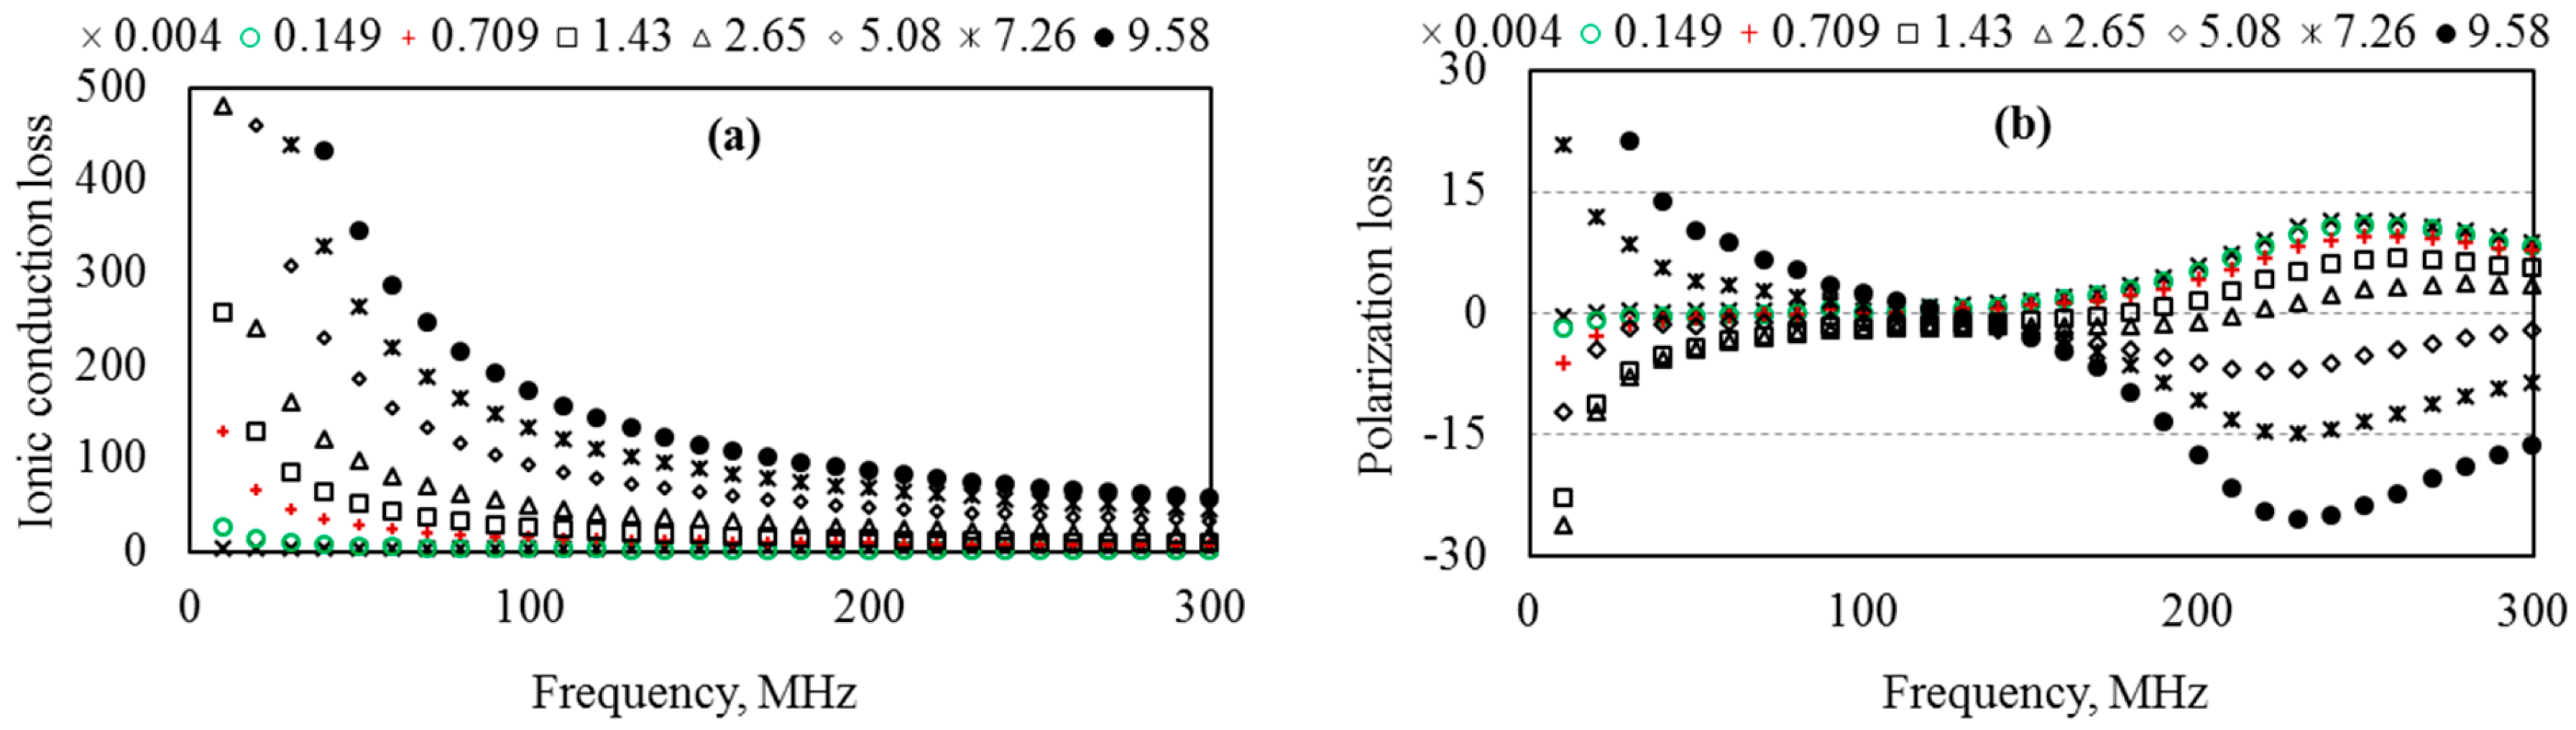
5.6. Energy Loss in Aqueous Solutions

Energy loss in dielectric materials happens mainly through ionic conduction and polarization. These losses depend on frequency. In aqueous solutions, ionic conduction loss is high at low frequencies but decreases as frequency increases (Figure 9a). This loss also rises with the EC of the solutions. When the EC is 2.65 dSm−1 or less, the polarization loss shows some irregularities at low frequencies (Figure 9b). This polarization loss is small at frequencies below 100 MHz and insignificant between 100 MHz and 150 MHz. Therefore, in the frequency range of 10 to 150 MHz, the total energy loss in aqueous solutions is mostly due to ionic conduction. This information can help estimate the EC of these solutions.

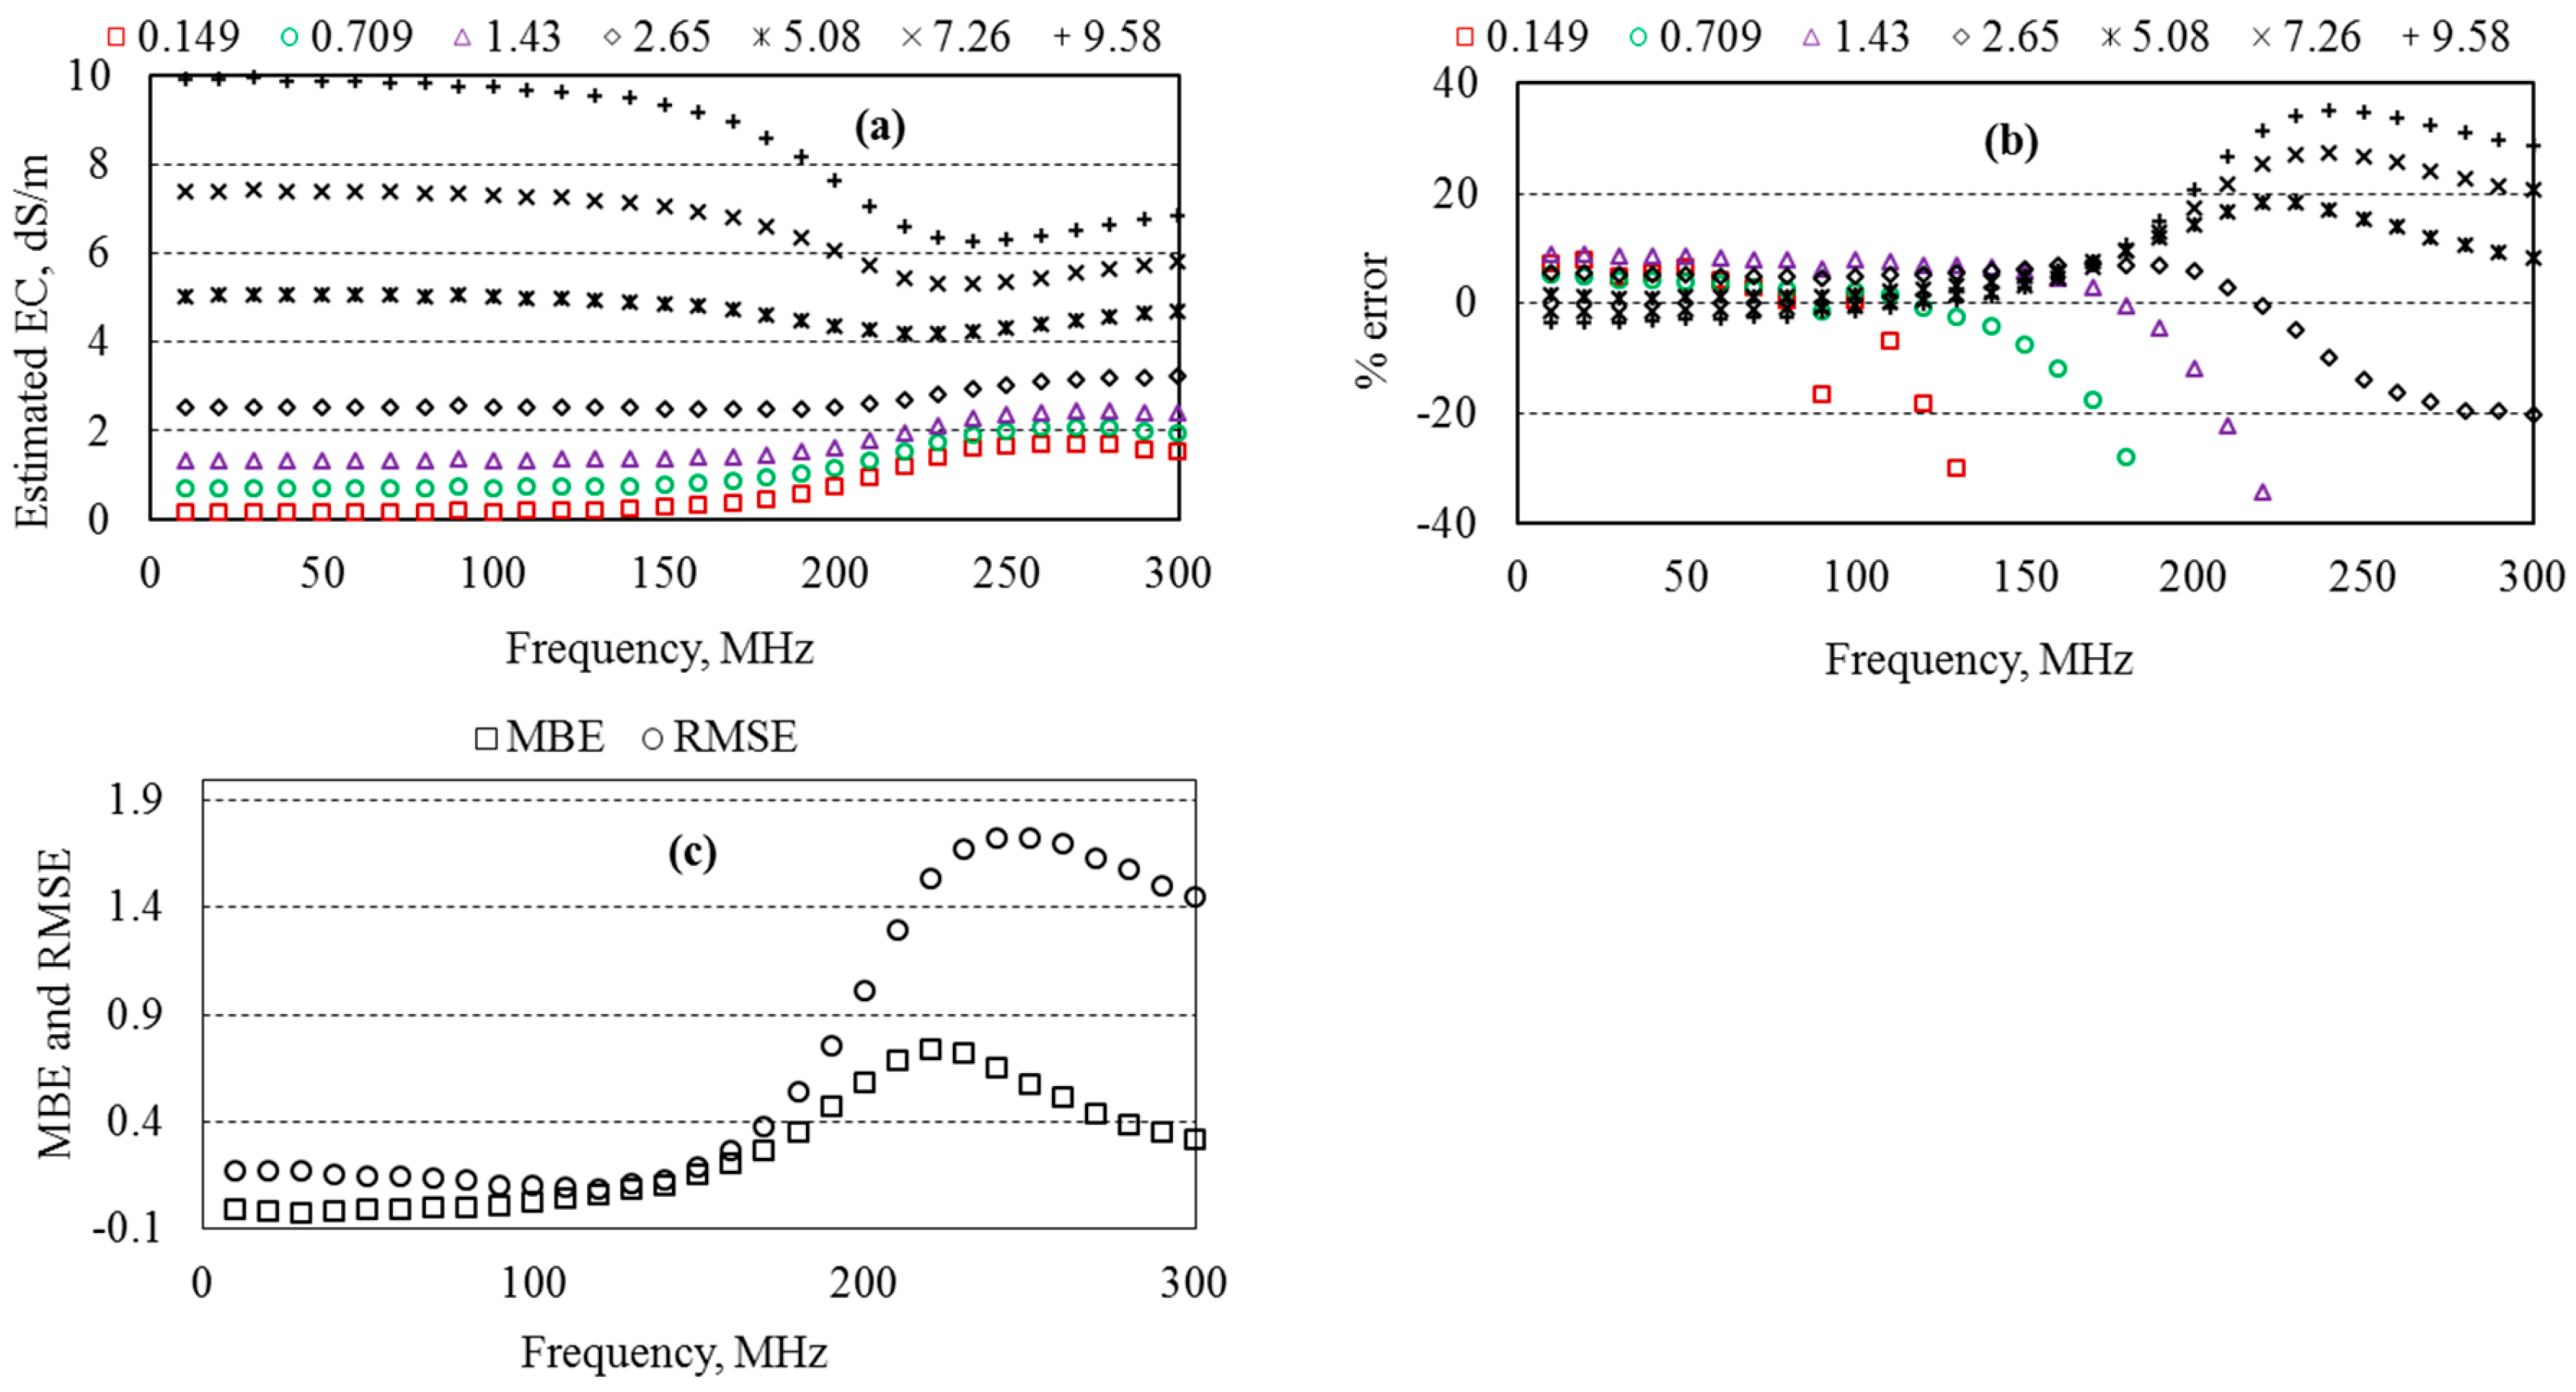
5.7. Estimated EC of Aqueous Solutions

The electrical conductivities of aqueous solutions, ECs, estimated from the imaginary part of their dielectric permittivity, remain mostly unchanged for frequencies below 150 MHz (Figure 10a). However, for three solutions with higher ECs, the ECs decrease somewhat above 100 MHz. Above 150 MHz, two distinct trends emerge: the EC increases for solutions with EC ≤ 2.65 dSm−1 and decreases for solutions with an EC ≥ 5.08 dSm−1, up to 240 MHz, before changing again at higher frequencies. The percent errors in the estimated ECs, compared to independently measured ECs, are within ±5% between 60 MHz and 150 MHz, except for solutions with ECs of 0.149 and 1.43 dSm−1, for which the errors are larger above 100 MHz (Figure 10b). The mean bias errors, MBEs, between the estimated and measured ECs are less than ±0.18 below 150 MHz and almost zero over 10 to 100 MHz (Figure 10c). This indicates that the VNA-based probe does not show any bias in measuring the imaginary part of the dielectric permittivity and the ECs of aqueous solutions. The root-mean-square errors, RMSEs, between the probe’s measurements and independent measurements are less than 20% over 10 to 150 MHz, showing a good match between the data sets. The relationships between ECs and the imaginary parts of the dielectric permittivity, whether using exponential or power law models (not described since did not provided good fit), did not reveal a unique relation and are, therefore, not shown.

6. Discussion

6.1. Important Features of the Probe

The probe being investigated measures both the real and imaginary parts of the dielectric permittivity by using the S11 scattering parameter with a VNA. In contrast, the existing probes only measure the real part of the dielectric permittivity by looking at the reflection or transmission coefficients of an electric pulse. This new probe operates in the frequency range of 10 to 500 MHz, with accurate data from 10 to 150 MHz. These features—using the VNA principle and measuring both the real and imaginary parts of the dielectric permittivity—can improve our understanding of soil dielectric measurements. As technology and the Internet of Things (IoT) advance, understanding how soil moisture interacts with sensing elements becomes crucial. Improving soil-moisture measurement is important. Current probes measure soil moisture using the real part of the dielectric permittivity. The main methods for dielectric measurement include frequency-domain reflectometry, amplitude-domain reflectometry, time-domain transmission, and time-domain reflectometry. The effectiveness of soil-moisture probes varies with these methods. Despite advancements in materials and accuracy [41], soil-moisture measurements still face challenges. Soils with free ions (like saline soils) or adsorbed ions (like clay) affect the imaginary parts of the dielectric permittivity, which, in turn, influences the real parts [24,42]. Ionic effects are more significant at lower frequencies (Figure 5). Measuring dielectric properties over a range of frequencies, rather than just one, can improve accuracy and minimize ionic effects [43]. Therefore, the VNA-based prototype probe shows potential for enhancing soil-moisture measurements, especially with further development.

6.2. Optimum Measurement Frequency of the Probe

The dielectric measurements were taken across a range of materials, from oil with a dielectric permittivity of 3.26 to distilled water with a dielectric permittivity of 79, and an EC from 0.004 to 9.58 dSm−1. These measurements showed that the real and imaginary parts of the dielectric permittivity change with frequency, which is typical for most materials at lower frequencies. The probe used for these measurements operates best between 10 MHz and 150 MHz. Its output can vary depending on the dielectric permittivity of the media. For materials with a low dielectric permittivity, the probe may underestimate the real part at low frequencies and overestimate it at high frequencies (Figure 4). For materials with a high dielectric permittivity, it tends to overestimate only at high frequencies. For media with free ions, like NaCl solutions, the probe shows frequency-dependent results (Figure 5). For solutions with an EC ≤ 5.08 dSm−1, the probe’s readings are almost constant over 60 to 150 MHz. In variably saturated wet sand, the probe’s readings of the dielectric permittivity change slightly with frequency up to 150 MHz (Figure 6a). Below 40 MHz, the imaginary part of the dielectric permittivity is usually very small, except for soil with a moisture content ≥ 0.15 m3m−3, where it can be slightly higher (Figure 6b). The probe is mainly used to measure the soil moisture by evaluating the real part of the dielectric permittivity. Comparing soil-moisture estimates from the probe with gravimetric measurements shows that the 20 to 150 MHz frequency range is effective for this purpose. Overall, the best accuracy for dielectric measurements in the materials tested is achieved within the 20–150 MHz range. This aligns with the frequencies used by most capacitance probes, such as the EC-5 probe, which typically operates at 70 MHz to reduce the impact of the salinity, soil texture, and temperature on measurements. Future improvements may expand this effective range of the tested probe.

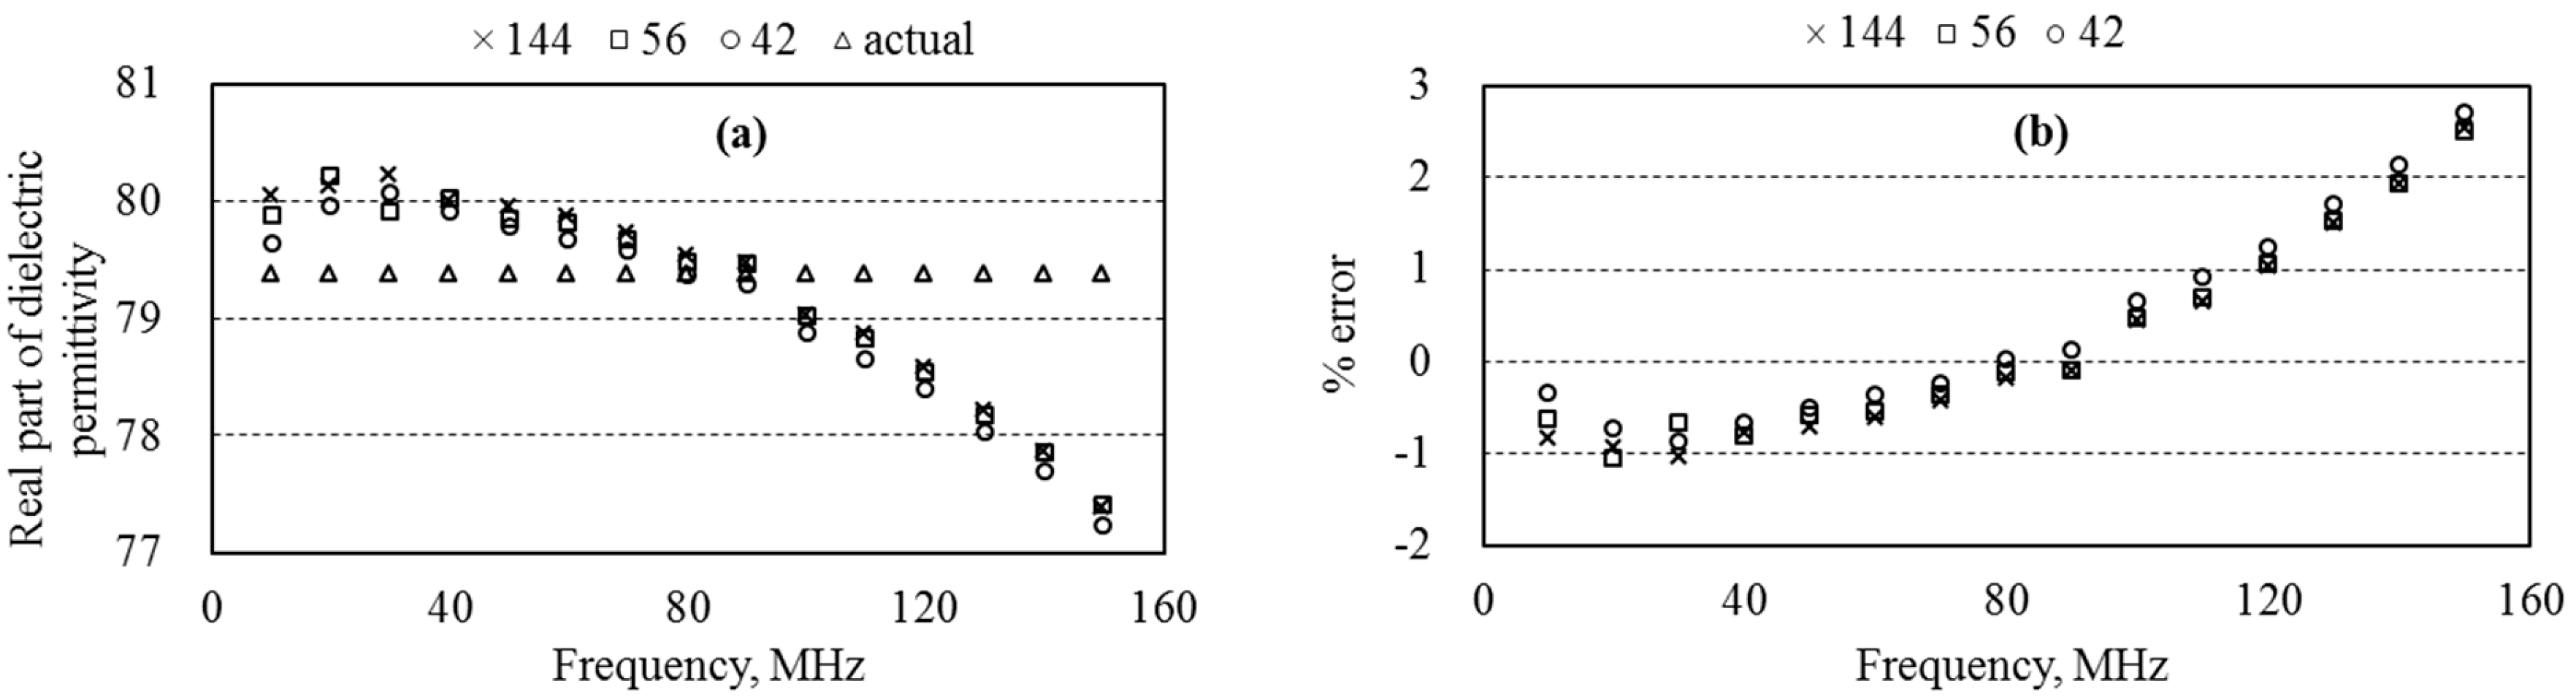
6.3. Measurement Accuracy

To be useful and widely adopted, a probe must make measurements accurately. Several factors affect the accuracy of dielectric measurements in soils, including the probe’s sampling volume, frequency, EC-effect, temperature, and calibration equations. The tested probe’s sensitivity is limited to the length of its rods (2 cm) and extends up to 2.8 cm across the probe’s length. Beyond this, its sensitivity drops. We found this sampling volume by testing with air and water, which have very different dielectric values. Therefore, the probe would not be sensitive to measurements outside this volume. The real part of the dielectric permittivity can be measured accurately up to 150 MHz with an error of ±2%, except in ethanol–water mixtures where the error ranges from −2 to −4 below 70 MHz. The errors in estimating the water content in wet sand from the dielectric permittivity using [37,40] models are consistent over 20 to 150 MHz. For ethanol–water mixtures, the imaginary part of the dielectric permittivity, which represents energy loss, is negligible below 150 MHz. In aqueous solutions, ionic conduction loss decreases at higher frequencies, while polarization loss is minimal between 100 MHz and 150 MHz.
Increasing the ionic conductivity in NaCl solutions raises the real part of the dielectric permittivity. This effect is linked to the imaginary part of the dielectric permittivity and the ionic conductivity. For saline soils, it is important to measure the real part of the dielectric permittivity in salt-free conditions because the salinity affects the dielectric measurement but not the water content directly. The VNA-based probe can measure both the real and imaginary parts of the dielectric permittivity at suitable frequencies, allowing it to capture the impact of the soil EC accurately.
The study aimed to evaluate the VNA-based probe’s performance in dielectric measurements. We measured the dielectric properties in variably saturated sand and used two calibration models (Equations (4) and (5)) to estimate the soil moisture. Both models underestimated the moisture content, suggesting the need for a custom calibration equation. Other probes, like FDR and TDR, are accurate to around 3% with soil-specific calibrations but can be much less accurate with standard calibrations, sometimes resulting in errors of up to 115% for clayey soils [43].
The reliability of the prototype probe in the open field depends on its unified integration into an automated system capable of real-time data acquisition and analysis. Given its broad frequency range (10 to 500 MHz) and ability to measure both real and imaginary components of the dielectric permittivity, the probe offers significant advantages over fixed-frequency alternatives. To ensure a consistent performance across diverse field conditions, an automated system should incorporate sensor calibration, environmental compensation, and wireless data transmission. The probe’s sensitivity to soil characteristics, influenced by factors such as free ions, clay composition, and organic matter, highlights the need for adaptive algorithms that can process and interpret field data effectively. Additionally, the probe’s robust design suggests it can withstand the mechanical and environmental stresses of open-field deployment. By integrating it into an automated system with real-time monitoring capabilities, the probe’s versatility and accuracy can be fully leveraged, improving the reliability and scalability of soil moisture and electrical conductivity assessments in practical agricultural and environmental applications.

6.4. Further Development of the Probe

An ideal soil-moisture probe, in terms of operational practicality, should possess several key characteristics: (a) cost-effectiveness, (b) affordability of data logging, (c) ease of use, and (d) telemetry capabilities. Accuracy in measurement remains a challenge that requires ongoing development. In major soil-moisture measurement approaches—such as frequency-domain reflectometry, amplitude-domain reflectometry, time-domain transmission, and time-domain reflectometry—the real part of dielectric permittivity is influenced by the imaginary part. This imaginary component is affected by the temperature, salinity, clay composition, organic matter, and porosity [18,20]. Temperature significantly affects dielectric measurements, especially in saline soils, by altering the soil water conductivity, permittivity, and ion mobility. Higher temperatures generally increase the ionic conductivity, leading to elevated dielectric loss and potential measurement inaccuracies. While capacitance probes that measure at frequencies above 70 MHz can reduce but not completely eliminate the impact of the imaginary part, the frequency range for measurements is a crucial factor for the further improvement of the probe by the developers (Daiki Rika Kogyo Co., Saitama, Japan). Additionally, the probe must be equipped with a controller to interface with other devices, allowing for the integration into IoT systems and enabling automation in various practical applications such as irrigation optimization, slope failure detection, and agricultural drought monitoring [19]. Future iterations of the probe are expected to offer higher precision, lower costs, and enhanced integration for diverse applications and scenarios.

7. Conclusions

The accuracy of dielectric permittivity and soil-moisture content measurements with the most currently used probes changes with different frequencies due to variations in the soil moisture and electrical conductivity. This study investigates a new prototype probe that uses a Vector Network Analyzer, VNA, to measure both the real and imaginary parts of dielectric permittivity across a frequency range of 10 to 500 MHz. The imaginary part, which is influenced by free ions, clay composition, and organic matter in soils, offers valuable insights for estimating these factors. Unlike fixed-frequency probes, this prototype can measure at various frequencies, reducing the limitations of fixed-frequency measurements. The probe’s capability to measure soil-moisture content and electrical conductivity across a broad frequency range provides accurate and flexible insights, enhancing the optimization of irrigation management in agricultural water management. This adaptability would enable precise measurements of soil moisture and electrical conductivity under diverse field conditions. Its robust design is expected to ensure reliable performance, even in challenging environments. Nevertheless, the probe needs further development to switch between frequencies during measurements and to connect to data loggers via the SDI-12 protocol. This would enable control by low-cost microcontrollers like Arduino or M5Stack. Note that this study did not assess the effect of temperature on dielectric measurements. To account for this in future studies or probe development, the plausible ways are as follows: to implement temperature-correction models to adjust dielectric readings, measure dielectric properties across temperature gradients to refine correction algorithms, or integrate real-time temperature measurements with dielectric probes for on-the-fly adjustments. The study used sand, a simple type of soil. The probe’s performance in more complex soils, such as clayey or organic soils, is still being evaluated. Ongoing experiments aim to assess its effectiveness across a broader range of soil textures.

Author Contributions

Conceptualization, M.A.M. and H.M.; methodology, M.A.M.; data measurement, N.M. and Y.H.; data analysis, M.A.M.; writing—original draft preparation, M.A.M.; writing—review and editing, M.A.M., H.M. and M.M. All authors have read and agreed to the published version of the manuscript.

Funding

This research received no external funding.

Data Availability Statement

Dataset available on request from the authors.

Acknowledgments

During this work, the corresponding author held an invitation fellowship of the Japan Society for the Promotion of Science (JSPS), Japan, and was on leave from the Bangladesh Agricultural University (BAU) at Mymensingh. The authors gratefully acknowledge the assistances of both the JSPS and BAU authority in carrying out this research. Acknowledgements are also due to Daiki Rika Kogyo Co., Ltd. and the Tokyo Metropolitan Industrial Technology Research Institute, who, together, developed the probe that was evaluated in this study.

Conflicts of Interest

The authors declare no conflicts of interest.

References

  1. Bai, L.; Long, D.; Yan, L. Estimation of surface soil moisture with downscaled land surface temperatures using a data fusion approach for heterogeneous agricultural land. Water Resour. Res. 2019, 55, 1105–1128. [Google Scholar] [CrossRef]
  2. Fisher, R.A.; Koven, C.D. Perspectives on the future of land surface models and the challenges of representing complex terrestrial systems. J. Adv. Model. Earth Syst. 2020, 12, e2018MS001453. [Google Scholar] [CrossRef]
  3. Harmsen, E.W.; Mecikalski, J.R.; Reventos, V.J.; Álvarez Pérez, E.; Uwakweh, S.S.; Adorno García, C. Water and energy balance model GOES-PRWEB: Development and validation. Hydrology 2021, 8, 113. [Google Scholar] [CrossRef]
  4. Tavakol, A.; McDonough, K.R.; Rahmani, V.; Hutchinson, S.L.; Hutchinson, J.S. The soil moisture data bank: The ground-based, model-based, and satellite-based soil moisture data. Remote Sens. Appl. Soc. Environ. 2021, 24, 100649. [Google Scholar] [CrossRef]
  5. Rasheed, M.W.; Tang, J.; Sarwar, A.; Shah, S.; Saddique, N.; Khan, M.U.; Imran Khan, M.; Nawaz, S.; Shamshiri, R.R.; Aziz, M.; et al. Soil moisture measuring techniques and factors affecting the moisture dynamics: A comprehensive review. Sustainability 2022, 14, 11538. [Google Scholar] [CrossRef]
  6. Njoku, E.G.; Jackson, T.J.; Lakshmi, V.; Chan, T.K.; Nghiem, S.V. Soil moisture retrieval from AMSR-E. IEEE Trans. Geosci. Remote Sens. 2003, 41, 215–229. [Google Scholar] [CrossRef]
  7. Owe, M.; de Jeu, R.; Holmes, T. Multisensor historical climatology of satellite-derived global land surface moisture. J. Geophys. Res.—Earth Surf. 2008, 113, F01002. [Google Scholar] [CrossRef]
  8. Zhang, P.; Chen, G.; Wu, J.; Wang, C.; Zheng, S.; Yu, Y.; Li, Y.; Li, X. The application and improvement of soil–water characteristic curves through in situ monitoring data in the plains. Water 2022, 14, 4012. [Google Scholar] [CrossRef]
  9. Kelly, T.D.; Foster, T.; Schultz, D.M.; Mieno, T. The effect of soil-moisture uncertainty on irrigation water use and farm profits. Adv. Water Resour. 2021, 154, 103982. [Google Scholar] [CrossRef]
  10. Song, J.H.; Her, Y.; Yu, X.; Li, Y.; Smyth, A.; Martens-Habbena, W. Effect of information-driven irrigation scheduling on water use efficiency, nutrient leaching, greenhouse gas emission, and plant growth in South Florida. Agric. Ecosyst. Environ. 2022, 333, 107954. [Google Scholar] [CrossRef]
  11. Vervoort, R.W.; Fuentes, I.; Brombacher, J.; Degen, J.; Chambel-Leitão, P.; Santos, F. Progress in developing scale-able approaches to field-scale water accounting based on remote sensing. Sustainability 2022, 14, 2732. [Google Scholar] [CrossRef]
  12. Stefanova, A.; Hesse, C.; Krysanova, V.; Volk, M. Assessment of socio-economic and climate change impacts on water resources in Four European Lagoon Catchments. Environ. Manag. 2019, 64, 701–720. [Google Scholar] [CrossRef] [PubMed]
  13. Kukal, M.S.; Irmak, S.; Sharma, K. Development and application of a performance and operational feasibility guide to facilitate adoption of soil moisture sensors. Sustainability 2019, 12, 321. [Google Scholar] [CrossRef]
  14. Bobrov, P.P.; Belyaeva, T.A.; Kroshka, E.S.; Rodionova, O.V. Soil moisture measurement by the dielectric method. Eurasian Soil Sci. 2019, 52, 822–833. [Google Scholar] [CrossRef]
  15. Kargas, G.; Soulis, K.X. Performance evaluation of a recently developed soil water content, dielectric permittivity, and bulk electrical conductivity electromagnetic sensor. Agric. Water Manag. 2019, 213, 568–579. [Google Scholar] [CrossRef]
  16. Saeed, I.A.; Wang, M.; Ren, Y.; Shi, Q.; Malik, M.H.; Tao, S.; Cai, Q.; Gao, W. Performance analysis of dielectric soil moisture sensor. Soil Water Res. 2019, 14, 195–199. [Google Scholar] [CrossRef]
  17. Szerement, J.; Woszczyk, A.; Szypłowska, A.; Kafarski, M.; Lewandowski, A.; Wilczek, A.; Skierucha, W. A seven-rod dielectric sensor for determination of soil moisture in well-defined sample volumes. Sensors 2019, 19, 1646. [Google Scholar] [CrossRef]
  18. Blonquist, J.M.; Jones, S.B.; Robinson, D.A. A time domain transmission sensor with TDR performance characteristics. J. Hydrol. 2005, 314, 235–245. [Google Scholar] [CrossRef]
  19. Aringo, M.Q.; Martinez, C.G.; Martinez, O.G.; Ella, V.B. Development of low-cost soil moisture monitoring system for efficient irrigation water management of upland crops. IOP Conf. Ser. Earth Environ. Sci. 2022, 1038, 012029. [Google Scholar] [CrossRef]
  20. Grisso, R.; Alley, M.; Holshouser, D.; Thomason, W. Precision Farming Tools: Soil Electrical Conductivity; Virginia Polytechnic Institute and State University: Blacksburg, VA, USA, 2009. [Google Scholar]
  21. Walthert, L.; Schleppi, P. Equations to compensate for the temperature effect on readings from dielectric DecagonMPS-2 andMPS-6 water potential sensors in soils. J. Plant Nutr. Soil Sci. 2018, 181, 749–759. [Google Scholar] [CrossRef]
  22. Hardie, M. Review of novel and emerging proximal soil moisture sensors for use in agriculture. Sensors 2020, 20, 6934. [Google Scholar] [CrossRef] [PubMed]
  23. Robinson, D.A.; Campbell, C.S.; Hopmans, J.W.; Hornbuckle, B.K.; Jones, S.B.; Knight, R.; Ogden, F.; Selker, J.; Wendroth, O. Soil moisture measurement for ecological and hydrological watershed-scale observatories: A review. Vadose Zone J. 2008, 7, 358–389. [Google Scholar] [CrossRef]
  24. Wyseure, G.C.L.; Mojid, M.A.; Malik, M.A. Measurement of volumetric water content by TDR in saline soils. Eur. J. Soil Sci. 1997, 48, 347–354. [Google Scholar] [CrossRef]
  25. Lauer, K.; Wagner, N.; Felix-Henningsen, P. A new technique for measuring broadband dielectric spectra of undisturbed soil samples. Eur. J. Soil Sci. 2012, 63, 224–238. [Google Scholar] [CrossRef]
  26. Qiwei, Z.; Zainuddin, M.F.; Ahmad, A.F.; Obays, S.J.; Abbas, Z. Development of an affordable soil moisture sensor system with Mini-VNA tiny and smartphone. J. Sci. Technol. 2019, 27, 1121–1129. [Google Scholar]
  27. Moret-Fernández, D.; Lera, F.; Latorre, B.; Tormo, J.; Revilla, J. Testing of a commercial vector network analyzer as low-cost TDR device to measure soil moisture and electrical conductivity. CATENA 2022, 218, 106540. [Google Scholar] [CrossRef]
  28. Lewandowski, A.; Szypłowska, A.; Wilczek, A.; Kafarski, M.; Szerement, J.; Skierucha, W. One-port vector network analyzer characterization of soil dielectric spectrum. IEEE Trans. Geosci. Remote Sens. 2019, 57, 3661–3676. [Google Scholar] [CrossRef]
  29. Lewandowski, A.; Szypłowska, A.; Kafarski, M.; Wilczek, A.; Barmuta, P.; Skierucha, W. 0.05–3 GHz VNA characterization of soil dielectric properties based on the multiline TRL calibration. Meas. Sci. Technol. 2017, 28, 024007. [Google Scholar] [CrossRef]
  30. Bobrov, P.P.; Repin, A.V.; Rodionova, O.V. Wideband frequency domain method of soil dielectric property measurements. IEEE Trans. Geosci. Remote Sens. 2015, 53, 2366–2372. [Google Scholar] [CrossRef]
  31. Limsuwat, A.; Sakaki, T.; Illangasekare, T.H. Experimental Quantification of Bulk Sampling Volume of ECH2O Soil Moisture Sensors. Doctoral Dissertation, Colorado State University, Libraries, Fort Collins, CO, USA, 2009. [Google Scholar] [CrossRef]
  32. Kasap, S.O. Electronic Materials and Devices; McGraw-Hill: New York, NY, USA, 2006. [Google Scholar]
  33. Cheng, D.K. Field and Wave Electromagnetics; Addison & Wesley: Reading, MA, USA, 1989. [Google Scholar]
  34. Topp, G.C.; Zegelin, S.; White, I. Impacts of the real and imaginary components of relative permittivity on time domain reflectometry measurements in soils. Soil Sci. Soc. Am. J. 2000, 64, 1244–1252. [Google Scholar] [CrossRef]
  35. Mashimo, S.; Umehara, T.; Redlin, H. Structures of water and primary alcohol studied by microwave dielectric analyses. J. Chem. Phys. 1991, 95, 6257–6260. [Google Scholar] [CrossRef]
  36. Mukhlisin, M.; Saputra, A. Performance evaluation of volumetric water content and relative permittivity models. Sci. World J. 2013, 2013, 421762. [Google Scholar] [CrossRef] [PubMed]
  37. Topp, G.C.; Davis, J.L.; Annan, A.P. Electromagnetic determination of soil water content: Measurements in coaxial transmission lines. Water Resour. Res. 1980, 16, 574–582. [Google Scholar] [CrossRef]
  38. Roth, K.; Schulin, R.; Fluhler, H.; Attinger, W. Calibration of time domain reflectometry for water content measurement using a composite dielectric approach. Water Resour. Res. 1990, 26, 2267–2273. [Google Scholar] [CrossRef]
  39. Robinson, D.A.; Jones, S.B.; Blonquist, J.M., Jr.; Friedman, S.P. A physically derived water content/permittivity calibration model for coarse-textured, layered soils. Soil Sci. Soc. Am. J. 2005, 69, 1372–1378. [Google Scholar] [CrossRef]
  40. Ledieu, J.; De Ridder, P.; De Clerck, P.; Dautrebande, S. A method of measuring soil moisture by time-domain reflectometry. J. Hydrol. 1986, 88, 319–328. [Google Scholar] [CrossRef]
  41. Yu, L.; Gao, W.R.; Shamshiri, R.; Tao, S.; Ren, Y.; Zhang, Y.; Su, G. Review of research progress on soil moisture sensor technology. Int. J. Agric. Biol. Eng. 2021, 14, 32–42. [Google Scholar] [CrossRef]
  42. Szypłowska, A.; Szerement, J.; Lewandowski, A.; Kafarski, M.; Wilczek, A.; Skierucha, W. Impact of soil salinity on the relation between soil moisture and dielectric permittivity. In Proceedings of the 2018 12th International Conference on: Electromagnetic Wave Interaction with Water and Moist Substances (ISEMA), Lublin, Poland, 4–7 June 2018; pp. 1–3. [Google Scholar] [CrossRef]
  43. Zawilski, B.M.; Granouillac, F.; Claverie, N.; Lemaire, B.; Brut, A.; Tallec, T. Calculation of soil water content using dielectric-permittivity-based sensors–benefits of soil-specific calibration. Geosci. Instrum. Methods Data Syst. 2023, 12, 45–56. [Google Scholar] [CrossRef]
Figure 1. (a) Photograph of a VNA-based probe, and (b) physical dimensions and spacing of the probe rods.
Agriengineering 07 00050 g001
Figure 2. Variation of the real and imaginary parts of dielectric permittivity of rapeseed oil–ethanol (OE) and ethanol–distilled water (EW) mixtures measured with (a,b) PNA-L, and (c,d) the probe over 10 to 500 MHz frequency.
Agriengineering 07 00050 g002aAgriengineering 07 00050 g002b
Figure 3. (a) The real part of dielectric permittivity of distilled water measured by the VNA-based probe for different (144, 56, and 42 mm) diameters of the samples (2-times distances between the center of the core rod and wall of the sample holder) along with the theoretical [35]/actual (from PNA-L) dielectric permittivity at the measurement temperature (22.5 °C), and (b) % error between the probe-measured dielectric permittivity and actual dielectric permittivity of distilled water.
Agriengineering 07 00050 g003
Figure 4. Comparison of percent (%) error between real part of dielectric permittivity of (a) ethanol–distilled water mixtures (EW) (at ratio of 1:0, 4:1, 3:2, 2:3, 3:7, 1:4, and 0:1) measured with the VNA-based probe and VNA machine, and (b) comparison of the mean bias error (MBE) and root-mean-square error (RMSE) between the real part of dielectric permittivity measured by the two methods.
Agriengineering 07 00050 g004
Figure 5. (a) Variation of real part of dielectric permittivity of distilled water and seven aqueous solutions of NaCl over 10 to 300 MHz, and (b) percent variation of the real part of dielectric permittivity of the aqueous solutions with respect to that of distilled water.
Agriengineering 07 00050 g005
Figure 6. (a) Real and (b) imaginary parts of dielectric permittivity in washed sand wetted with different (0, 0.05, 0.10, 0.15, 0.20, 0.25, and 0.30 m3/m3) moisture contents.
Agriengineering 07 00050 g006
Figure 7. (a) Percent error, and (b) mean bias error (MBE) and root-mean square error (RMSE) between gravimetrically measured moisture contents and those calculated by the empirical equation of [36] (Equation (4)).
Agriengineering 07 00050 g007
Figure 8. Estimated soil-moisture contents with the empirical equations of [37,40] (Equations (4) and (5)) versus gravimetric soil-moisture contents along with % error between the estimated and gravimetric soil-moisture contents at 20, 40, 60, 80, 100, 120, 140, and 150 MHz frequency.
Agriengineering 07 00050 g008aAgriengineering 07 00050 g008b
Figure 9. Variation of (a) ionic conduction and (b) polarization losses in distilled water and seven aqueous solutions of NaCl over 10 to 300 MHz.
Agriengineering 07 00050 g009
Figure 10. Variation of (a) the estimated electrical conductivity (EC) from the imaginary part of dielectric permittivity of seven aqueous solutions of NaCl, (b) percent (%) error between the estimated and known (independently measured) ECs, and (c) mean bias error (MBE) and root-mean square error (RMSE) between the estimated and known ECs over 10 to 300 MHz frequency.
Agriengineering 07 00050 g010
Disclaimer/Publisher’s Note: The statements, opinions and data contained in all publications are solely those of the individual author(s) and contributor(s) and not of MDPI and/or the editor(s). MDPI and/or the editor(s) disclaim responsibility for any injury to people or property resulting from any ideas, methods, instructions or products referred to in the content.

