1. Introduction
The development of smart cities is closely linked to the use of Internet of Things (IoT) devices. This enables rapid exchange of data between city systems and rapid response to received signals. IoT systems improve city operations, optimize energy and water consumption, improve waste management, help regulate traffic, and contribute to sustainable urban development. Integrating IoT technologies in smart cities is crucial for urban functionality and security and plays a key role in optimizing energy consumption [
1]. IoT sensors enable real-time monitoring and adaptive control of energy use in public infrastructure, transportation, and residential buildings. For example, smart lighting systems adjust illumination based on pedestrian movement and ambient conditions, reducing unnecessary energy consumption. Moreover, IoT-driven smart grids facilitate dynamic load balancing, optimizing integrating renewable energy sources into urban energy networks. These energy-related applications align with the broader goals of sustainable smart cities, reducing both costs and environmental impacts. The deployment of IoT devices has been met with resistance from residents, who are primarily concerned about their privacy, data security, and the high cost of infrastructure development. However, city authorities are pushing for the development of this technology, so that there can be continuous progress in urban development, improving functionality and safety [
2]. City governments are trying to assess whether residents accept IoT technology in urban spaces. A lack of acceptance can reduce the benefits that can result from its implementation. Understanding citizens’ expectations and concerns helps to better design the technology according to residents’ needs. Statistical methods, such as structural equation modeling (SEM) and the Technology Acceptance Model (TAM) [
3], along with its extensions and related models like the Unified Theory of Acceptance and Use of Technology (UTAUT) [
4], are commonly used to assess the acceptance of IoT technologies in smart cities. Data for these methods are collected through surveys, where questions indirectly measure latent factors such as perceived usefulness of technology and perceived ease of use. Depending on the research problem, various indirect factors are added to the structural models based on the specifics of the issue [
5]. Factors important for technology acceptance in smart cities were added to the model. Yi and Zou added the residents’ well-being factor to the TAM model [
6]. Yeh added factors such as trust and perceived risk, privacy, and security [
7]. Anam et al. added to the TAM model attitude toward technology, interest in technology, use of public applications, and prior experience with technology use [
8]. Additionally, hedonic motivation, social influence, smart governance, and price value were considered [
9,
10]. Sepasgozar et al. added to the TAM model perceived security, relative advantages, compatibility work facilitating cost reduction, energy savings and time savings, service quality, and self-efficacy [
11]. Most of the factors considered in technology acceptance models were identified by Marykiyan et al. [
12]. Despite such a large number of models that consider various factors of technology acceptance in smart cities, the models rarely consider respondent groups’ point of view. The influence of moderators selected from among the model factors is often examined. More than six hundred reviewed articles did not identify gender as a moderator in the model. German et al. [
13], in a systematic literature review, present the topic of women’s safety in smart cities. They pointed out that women have different needs in cities, than men and perceive urban reality differently. For women, safety, well-lit streets, and easy access to schools and shops through cars and public transportation are important. Women are concerned about robberies and sexual attacks [
13]. Asteria dealt with the topic of the need to consider gender in the development of social innovation in smart cities. Although the research dealt with smart cities and the IoT technologies used in them, it was conducted from the perspective of social justice, not technology acceptance. Attention was paid primarily to the gender gap in access to IoT technologies in Jakarta. The author believes that smart cities should be planned to provide equal access to urban services for both genders. The author conducted qualitative (interviews) and quantitative (questionnaires) research but used simple statistical methods to evaluate the results. The SEM method was not used in this case. Nevertheless, the article points out that there is a lack of literature on assessing women’s needs in smart cities. It was pointed out that a paradigm shift in thinking about designing smart cities and adapting them to women’s needs is needed [
14]. Osipova and Hornecker address women’s safety in smart cities but do not mention women’s acceptance of IoT technology [
15]. Research on the acceptance of IoT technology in smart cities was conducted by Walczak et al. Based on the survey, a structural model was prepared and presented in the research paper [
16]. The present paper is a continuation of this research. Data collected during this survey were used to test gender differences in IoT technology acceptance.
The purpose of this study was to analyze the differences in the acceptance of IoT technology in smart cities by men and women. The basis of the analysis was the technology acceptance model [
3] supplemented by additional constructs affecting the acceptance of IoT technologies in smart cities. The study focused on the use of IoT sensors to adapt the city to the needs of people with special needs. In addition, it noted that the data collected by the sensors were processed in the vicinity of the sensors, in edge computing mode, which should ensure their anonymity [
16].
Research on the differences between men’s and women’s perceptions of IoT technology is important because the two genders have different requirements and expectations, different things are important to them, and an information campaign should be prepared differently for each party. In addition, it was noted that if the technology is used to help others, there is an increase in acceptance for it across the entire population. It will be interesting to see whether such a relationship exists for both genders.
In the paper, a structural model was prepared, and the results were evaluated in a subdivision of men and women. Descriptive statistics were calculated for each gender model, and relationships between latent factors of the two models were determined. The results indicated that women had more confidence in IoT technology than men. Confidence increased the use of technology for environmental purposes and to help people with disabilities. Women were more likely than men to find IoT technology useful and safe. Men were less trusting, were concerned about safety, and did not pay attention to the use of technology to protect the environment. The paper concludes with a discussion of the results and conclusion.
2. Related Works
Understanding IoT acceptance factors is crucial for designing effective smart city initiatives. Previous studies have examined IoT adoption in various contexts, such as smart homes, education, and specific industries, often utilizing established models like TAM and UTAUT. However, a significant limitation of previous research is the insufficient focus on gender as a key factor in technology adoption. This gap limits our understanding of how different demographic groups perceive and engage with IoT technologies.
Additionally, several studies have employed SEM to analyze IoT adoption. Comparing these models provides valuable insights into key acceptance determinants and highlights the necessity of incorporating gender differences in smart city research.
Table 1 presents a comparative analysis of key studies in the field, outlining their focus, theoretical models, and consideration of gender. This comparison underscores the need for our research, which explicitly investigates gender differences in IoT acceptance within smart cities using SEM to provide deeper insights into trust, safety, and environmental awareness.
As shown in
Table 1, most previous studies have examined IoT acceptance in contexts such as smart homes [
17,
19,
26,
28], food packaging [
22], banking [
18], workplaces [
20], and higher education [
30]. While these studies provide valuable insights, many have utilized SEM to explore IoT adoption, primarily focusing on general consumer behavior without accounting for demographic moderators such as gender, particularly in the context of smart cities.
Notably, only a few studies [
18,
25] consider gender as a factor in IoT adoption; however, they do not specifically address smart city environments.
This study addressed this critical gap by examining how gender influenced IoT acceptance in smart cities. Using SEM, we assessed gender-based differences in trust, perceived safety, and environmental awareness, which are particularly relevant factors for urban IoT applications. Our findings contribute to a more comprehensive understanding of IoT adoption and offer valuable insights for policymakers aiming to develop more inclusive smart city initiatives.
3. Materials and Methods
For the analysis, the structural equation modeling (SEM) method was used, which is based on variance-covariance matrix analysis and related statistical techniques. Data analysis was carried out using AMOS v. 27 and SPSS v. 7. In SEM, latent variables are represented by observable variables, each measured through corresponding survey questions. Typically, multiple observable variables are needed to describe a single latent variable, meaning that one theoretical construct is captured by several survey items. To gather the necessary data, a survey specifically designed for SEM analysis was administered to residents of smart cities. Notably, the Senate Ethics Committee of Warsaw University of Technology gave the survey a positive ethical evaluation.
The questionnaire included a title, the purpose of the study, a set of statements with responses scaled on a Likert scale, and general questions asking respondents about their age, gender, and education. The population survey used a 5-point Likert scale ranging from 1, strongly disagree, to 5, strongly agree, with a midpoint of the scale of 3, neither agree nor disagree. For this study, 5 latent constructs measured by 23 survey questions were used.
The survey was conducted in the Polish towns of Warsaw and Plock. The questionnaire was posted on the Warsaw University of Technology website. Information about the survey was distributed to the academic community of the Warsaw University of Technology and to the residents of Plock and Warsaw. The survey was anonymous. The respondents were asked for consent to participate in the survey before completing it. One could withdraw from completing the questionnaire at any time. A convenience sampling method was used. Anyone who found out about the survey could fill it out. Although the survey was not representative, it allowed the assessment of opinions about IoT technology in smart cities. The survey was conducted in the first half of 2022, with more than 1600 respondents. A total of 288 complete records were selected from the dataset. Twenty-four people chose not to specify their gender. The study only considered men’s and women’s opinions, and all analyses were concerned with assessing differences between men and women. Other genders were not considered. The sample size of 264 respondents met the commonly accepted criteria for SEM. Prior research suggested that a minimum of 100–200 participants was sufficient for reliable SEM analysis [
31,
32], and the rule of 10 participants per observed variable [
33] was also satisfied. Therefore, the sample size was considered adequate for this study. The respondents’ age and gender structure is presented in
Table 2. All percentages were calculated for a total number of respondents = 288; therefore, the total value was 92% (264/288).
Although age was not directly analyzed as a variable in the structural model, the demographic characteristics of the sample, including age distribution, are provided for transparency and to illustrate the representativeness of the study population. While this study primarily focused on gender differences in IoT technology acceptance, reporting age data helps contextualize the sample composition. Future research could explore potential age-related effects on technology acceptance.
In order to build a structural model, key dimensions were identified to characterize the acceptance of the use of IoT technology by residents of smart cities:
PU, perceived usefulness of IoT devices in a smart city;
AC, acceptance of the use of IoT technology;
TT, trust in IoT-based technology noting that data were collected anonymously, in edge computing mode;
PS, safety of residents;
PA, acceptance of data collection by IoT devices for environmental purposes.
The analysis was carried out at a significance level of 0.05. The variables PU2, AC3, TT1, PS1, and PA4 used in the structural model, marked as PU, AC, TT, PS, and PA, were considered the most representative. The survey also indirectly assessed respondents’ awareness of IoT technologies in energy management [
34]. While the primary focus was on safety and acceptance, certain variables, such as perceived usefulness (PU) and pro-environmental attitudes (PA), related to the broader implications of IoT for energy efficiency. Respondents who highly rated environmental applications of IoT (PA group) were likely to support energy-efficient urban solutions, including smart grids, intelligent building management systems, and AI-driven energy optimization. These technologies rely on data collection and processing mechanisms similar to those examined in this study, suggesting that acceptance of environmental IoT applications may extend to energy-saving solutions. This connection highlights the potential for IoT adoption strategies to emphasize energy efficiency as a key societal benefit, an aspect that could be further explored in future research. Perceived usefulness is the extent to which respondents believe that IoT devices can improve a city and help make it better suited to the needs of people with disabilities [
35,
36]. Residents do not use the technology directly but are only observed by city sensors. Models on the acceptance of monitoring technology were used to prepare the survey [
37]. Support for the use of IoT technology in the city was measured by the AC construct [
38,
39]. This is the outcome variable of the model assessing the level of acceptance of IoT technology. Trust in IoT technology (TT) closely relates to data security [
40]. Residents increasingly worry about being monitored, fearing violations of privacy, as well as the collection, processing, and transmission of their data to unauthorized parties. In addition, inadequate software updates for IoT devices raise concerns about potential vulnerabilities to hacking [
41]. As IoT technology advances, the use of edge computing is becoming more common. This approach processes data closer to where they are generated, supposedly ensuring anonymity [
42]. However, citizens question whether the collected data are truly anonymous [
43] and whether they might be shared without authorization [
44]. Ultimately, these concerns about data privacy and security can weaken trust and adversely influence perceptions of overall security [
45]. The PS factor includes an assessment of respondents’ conviction that the data collected by IoT sensors will keep them safe. IoT sensors can improve pedestrian safety on roads and sidewalks by warning of oncoming vehicles [
44]. People with disabilities can also benefit. Blind people can receive instructions on how to get around, and people with mobility impairments can be instructed on which path to take. In case of an emergency, city services can be automatically notified, and tourists can be informed about the possibilities of moving around the city [
46]. The PA factor measures support for pro-environmental use of IoT sensors. With the use of urban sensors, it is possible to place green areas in the places most frequented by residents. The data can also be used to increase environmental concern [
47]. Waste management, noise control, energy consumption monitoring, water quality control, and biodiversity assessment are just some of the opportunities for using IoT sensor data [
48,
49,
50]. Survey statements for each dimension are stated in
Table 3.
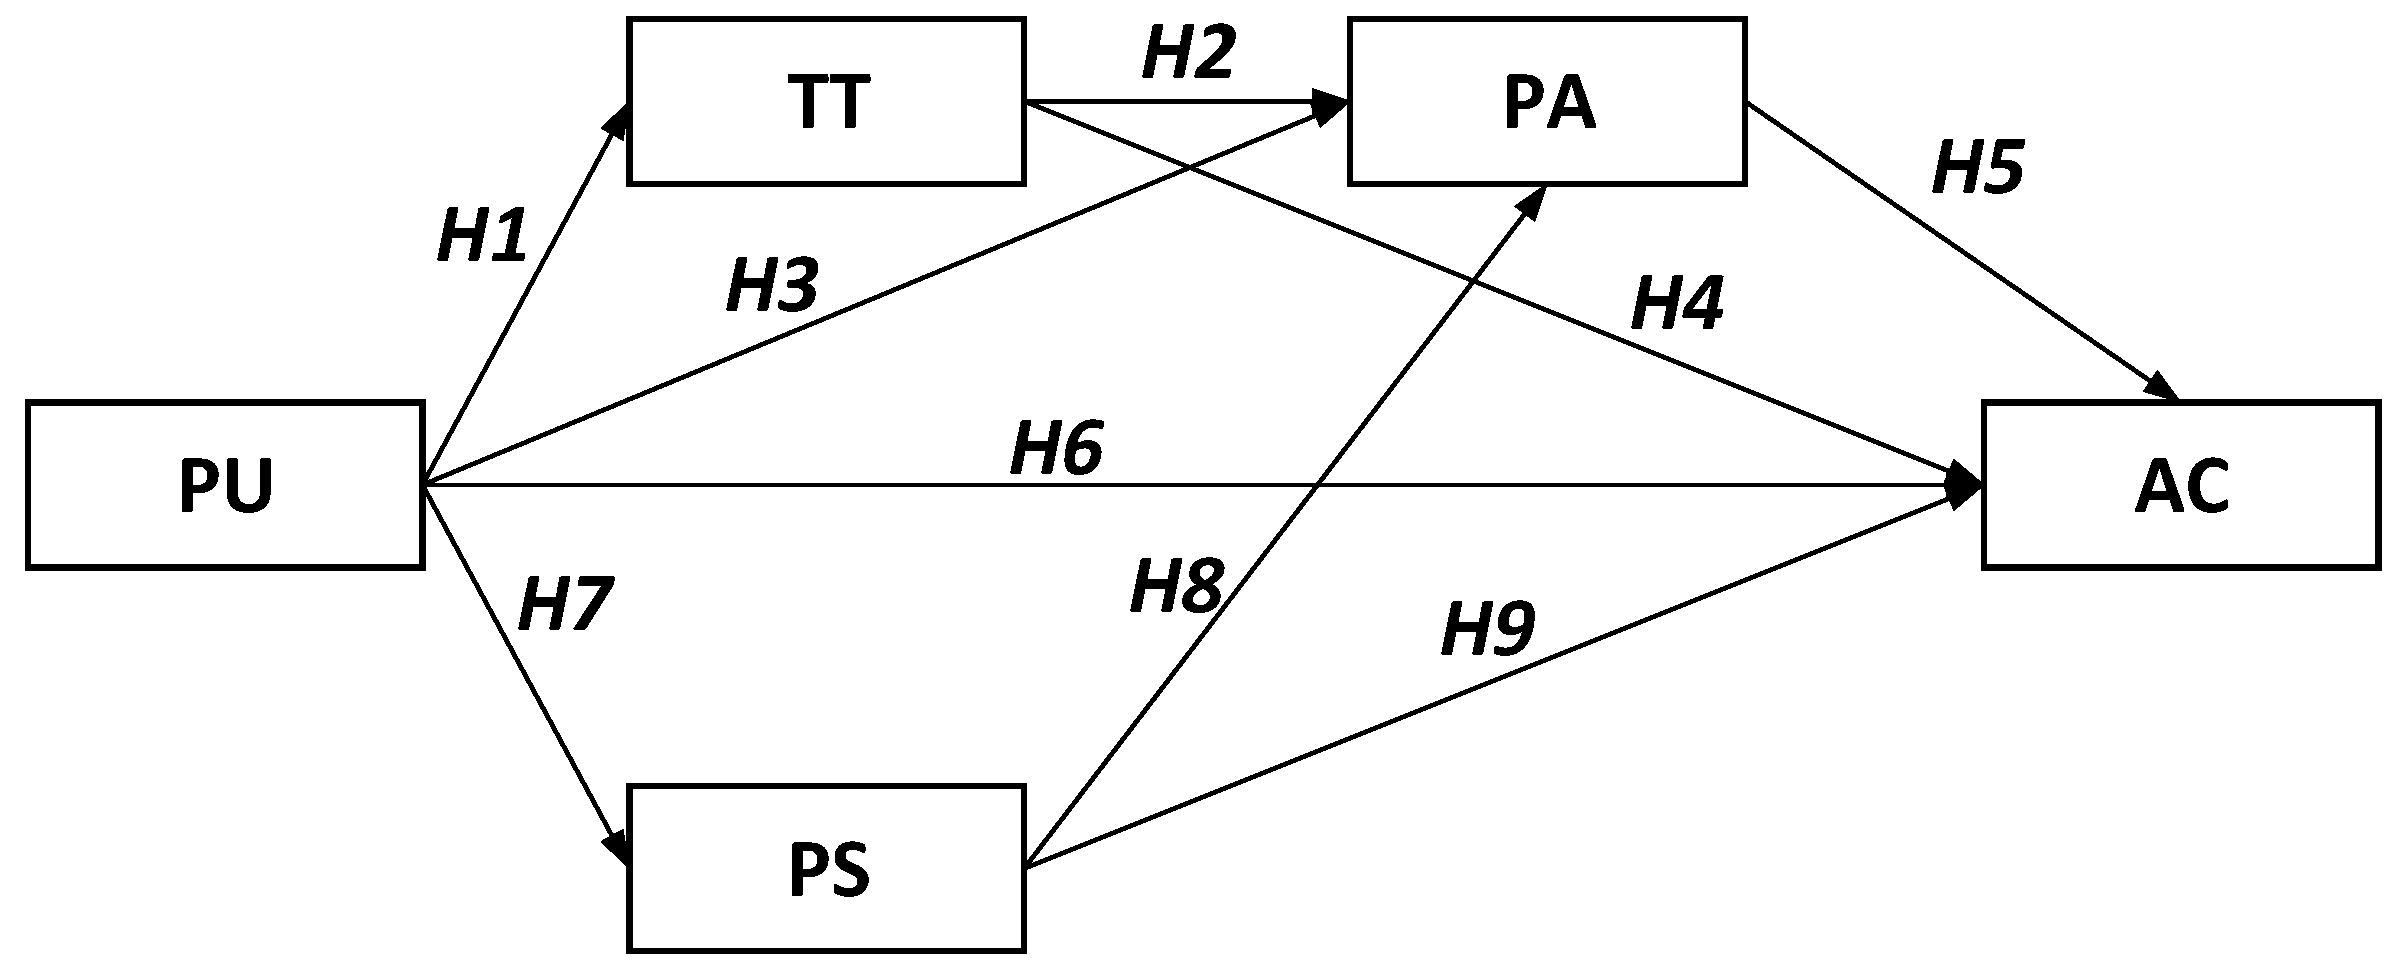
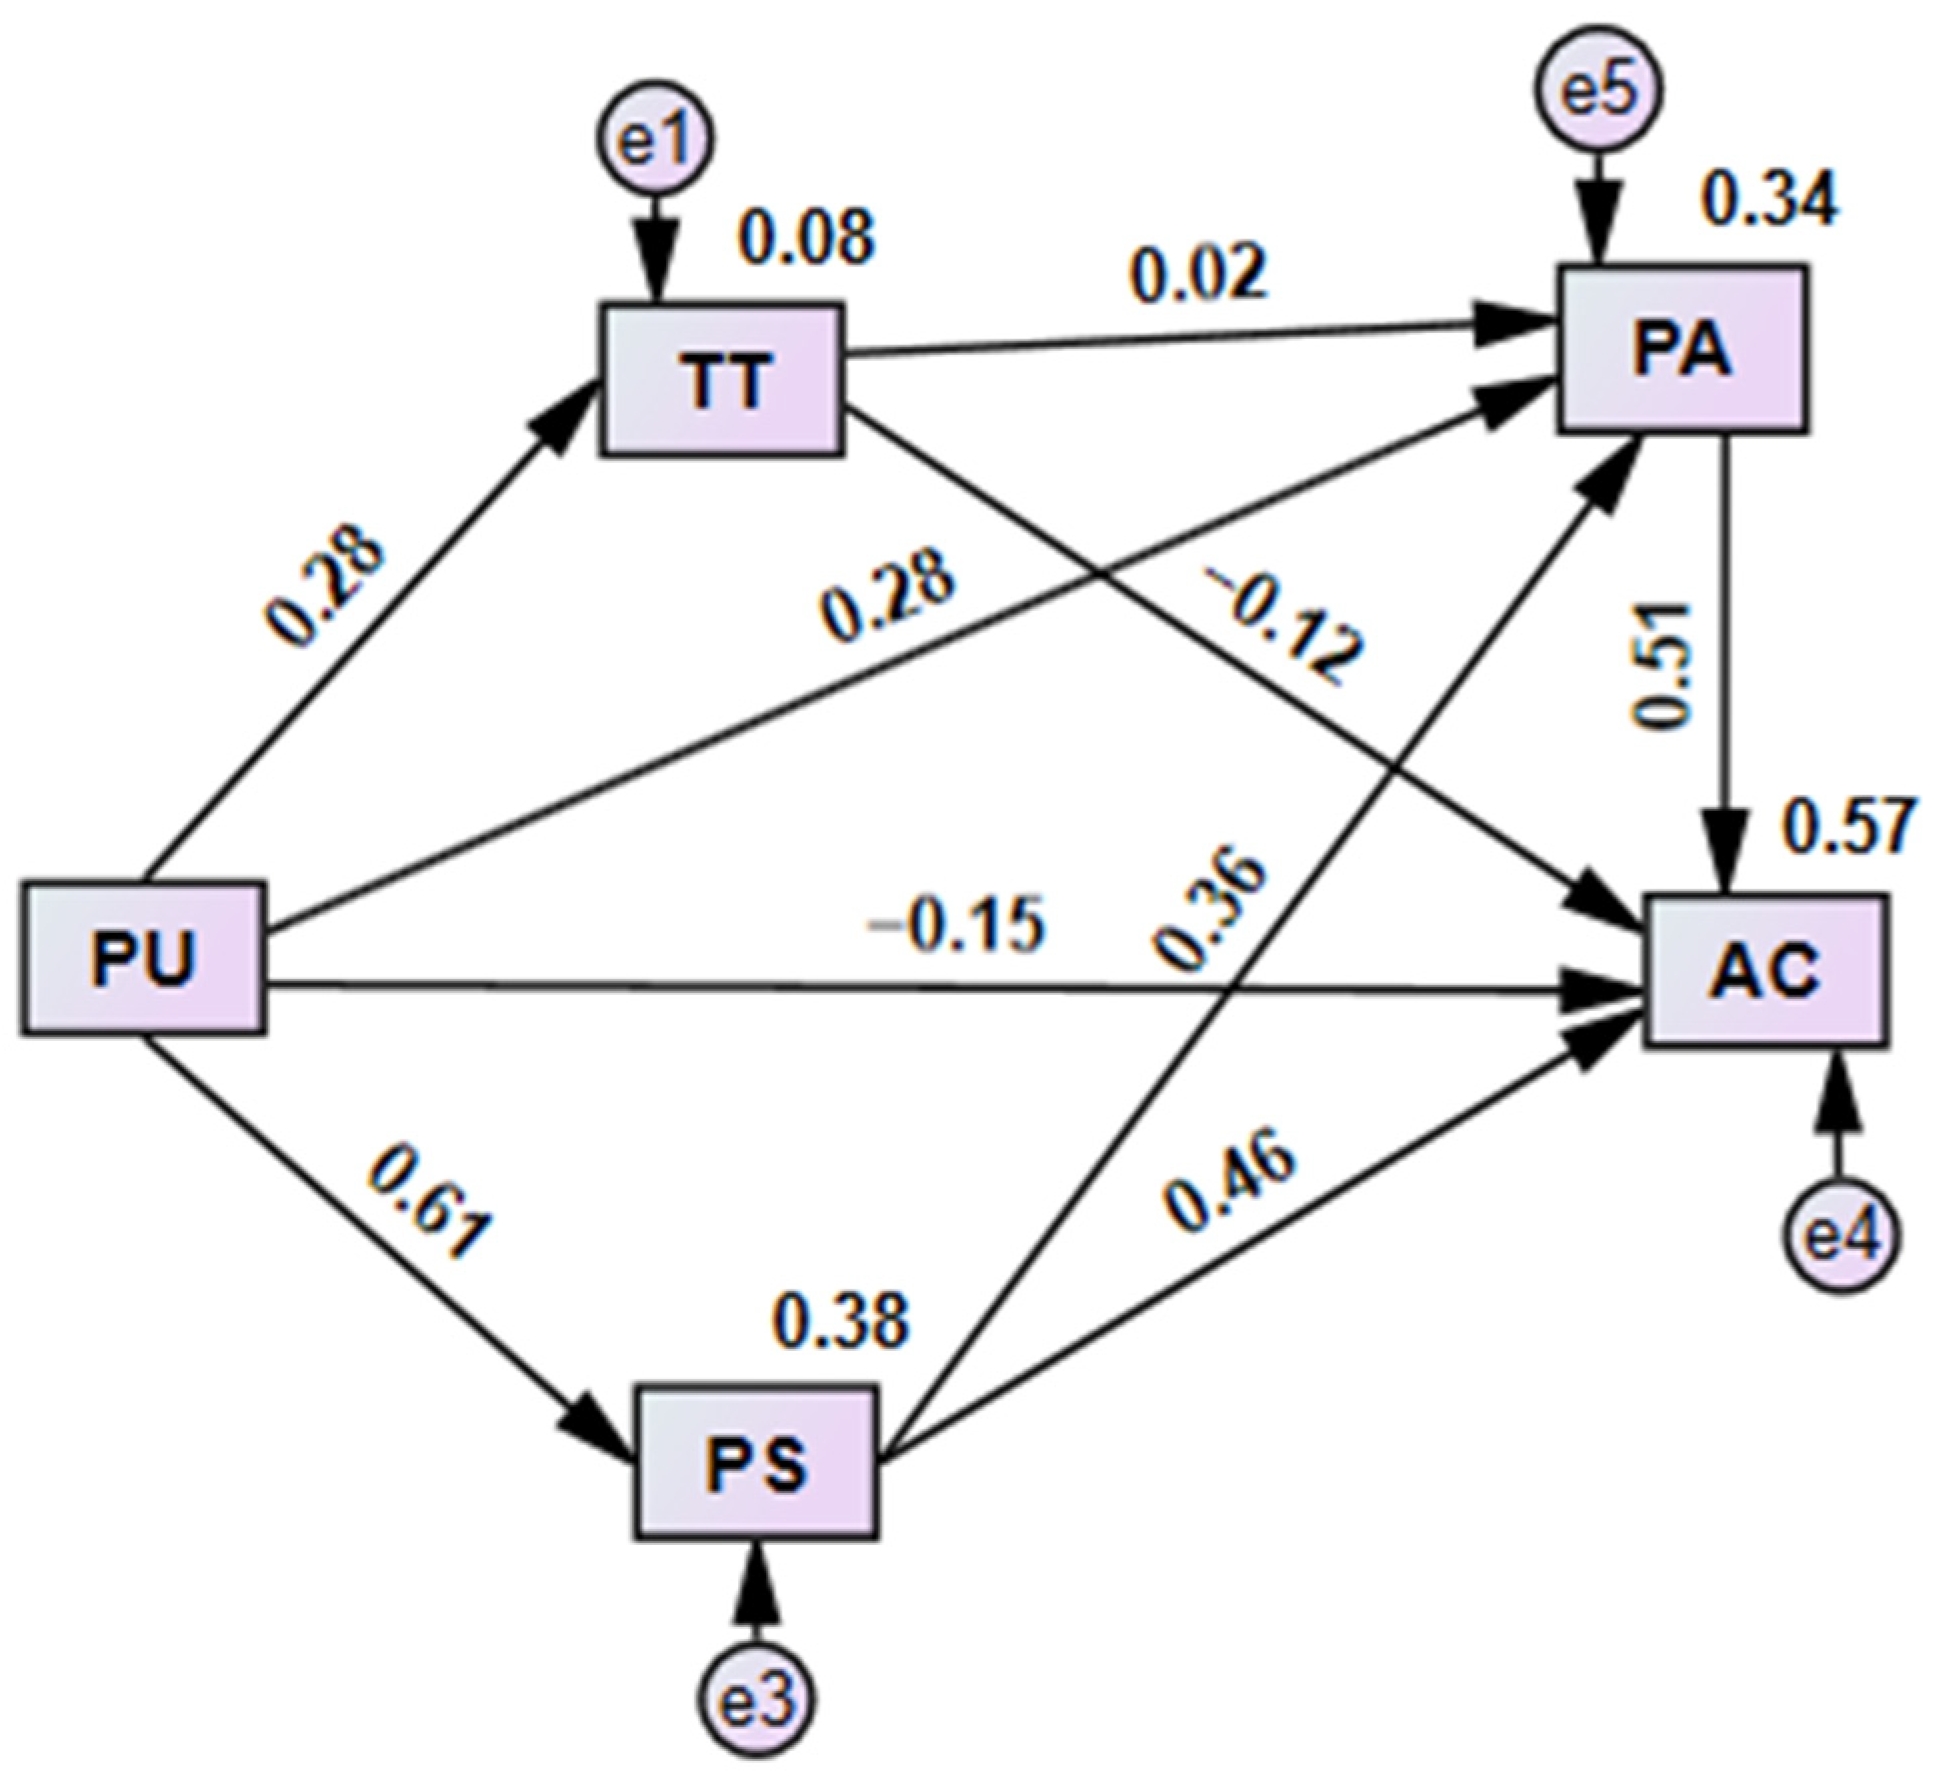
The structural model took into account the influence of mediating variables. The basic model considered the influence of mediating variables as shown in
Figure 1. The model was tested from the point of view of differences between men and women. Separate tests were conducted for each group.
The research hypotheses focused on the mediating effects of trust, perceived safety, and pro-environmental attitudes in the acceptance of IoT technology in smart cities. Based on the structural equation model presented in
Figure 1, we examined the following key hypotheses:
H8: The perceived usefulness of IoT sensors (PU) influences their acceptance (AC).
H9: Using IoT sensors for environmental purposes (PA) influences the acceptance of them (AC).
H10: Trust in IoT technology (TT) mediates the relationship between the perceived usefulness of IoT sensors (PU) and the acceptance of them (AC).
H11: Using IoT sensors for environmental purposes (PA) mediates the relationship between the perceived usefulness of IoT sensors (PU) and the acceptance of them (AC).
H12: Both trust in IoT technology (TT) and using IoT sensors for environmental purposes (PA) mediate the relationship between the perceived usefulness of IoT sensors (PU) and the acceptance of them (AC).
H13: The perceived safety (PS) mediates the relationship between the perceived usefulness of IoT sensors (PU) and the acceptance of them (AC).
H14: Both the perceived safety (PS) and using IoT sensors for environmental purposes (PA) mediate the relationship between the perceived usefulness of IoT sensors (PU) and the acceptance of them (AC).
For clarity, we have omitted the first seven hypotheses (H1–H7) and focus on mediation effects (H10–H14) as these provide the most relevant insights into the acceptance of IoT technology. This approach aligns the hypothesis descriptions with
Figure 1 and improves the logical flow of the manuscript.
Descriptive statistics were calculated for all survey questions. The survey was designed for SEM analysis, but additionally, respondents were directly asked a question about acceptance of smart city technology. The statement “I believe that city authorities should finance the development of smart technologies in my city” had three responses: yes, no, and not sure. This made it possible to check for differences in responses between genders. Using Pearson’s Chi-square test, a test probability was determined, the value of which, at a significance level of 0.05, indicated whether there were significant differences between the responses of men and women. The null hypothesis for the evaluation of the nominal variable “smart city support” and the nominal variable “gender” stated that there were no differences between the responses of both genders. The alternative hypothesis stated that there were statistically significant differences between the responses of respondents of both genders. If the p-value was greater than 0.05, there was no basis for rejecting the null hypothesis; if it was smaller than 0.05, the null hypothesis of equivalence of responses could be rejected, and the alternative hypothesis of significant differences between the responses of both genders could be accepted.
Based on the survey questions, a structural model was prepared, taking into account direct and mediated relationships. Group analysis was conducted for two groups: women and men. In addition, a moderation analysis was conducted. The effect of gender on the value of the model’s regression coefficients was assessed for each model path and for mediation paths.
4. Results
Descriptive statistics were calculated for the variables collected during the survey, as shown in
Table 4. Statements PU1 through PU5 explored how participants perceived the usefulness of IoT sensors in improving urban design and services. In the perceived usefulness (PU) questions, the mean values ranged from 3.53 to 4.05. In particular, PU4 (mean, M = 4.05, standard deviation, SD = 1.12) and PU1 (M = 4.02, SD = 1.24) showed the most agreement, suggesting that respondents generally perceived urban sensor data as useful for improving urban services. PU5, focusing on the introduction of greenery based on monitoring data, showed the lowest mean within the PU construct (M = 3.53, SD = 1.43) but still leaned toward a positive assessment. Standard deviations ranged from 1.123 to 1.431, indicating a moderate dispersion of responses. The skewness values indicated a left-skewed distribution, shifted toward rating IoT sensors as useful. The PU variables showed a skewness ranging from −1.18 (PU1) to −0.48 (PU5), indicating an overall skew toward positive evaluation, with PU1 being the most left-skewed.
Statements AC1 through AC4 assessed participants’ acceptance of various IoT applications. Respondents most strongly supported the use of data to improve parking services (AC2, M = 4.43, SD = 0.96) and to adapt infrastructure to residents’ needs (AC3, M = 4.24, SD = 1.05). The lowest standard deviations of these variables indicated a strong consensus among respondents. The use of cameras for personalized services (AC4; M = 2.36, SD = 1.59) received much lower support, indicating a reluctance to support more privacy-invasive forms of surveillance. The skewness values were strongly negative for most items, such as AC2 (−1.925), indicating acceptance of the use of IoT technology, with the exception of AC4 (0.711), reflecting disagreement with anonymously observing people to offer products.
Items related to trust in technology (TT) were more varied. While respondents expressed moderate to high trust in sensors collecting environmental and accessibility-related data (e.g., TT3 for parking occupancy, M = 3.86, SD = 1.07), they were less trusting of surveillance offering products and services (TT4; M = 2.56, SD = 1.43). The skewness of all variables was negative, ranging from −0.518 for acceptance of data collection for adapting the city to the needs of people with disabilities (T2) to −0.9 for acceptance of data collection for parking monitoring (T4). The results suggest that trust depends on the perceived purpose and anonymity of data collection.
Statements related to perceived safety (PS) consistently received high support. Respondents strongly agreed that urban monitoring could facilitate a safer environment for various user groups, including people with disabilities, pedestrians, and tourists. Items such as PS4 (M = 4.35, SD = 0.79) and PS5 (M = 4.35, SD = 0.73) received the highest scores within this construct, indicating a strong belief in the potential of IoT solutions to improve security. This was also evidenced by the low skewness value for all PS variables.
A deeper analysis of the PA construct revealed strong public support for IoT applications that enhanced sustainability, including energy efficiency [
51]. Respondents who rated PA variables highly also showed a greater tendency to accept IoT in other domains, suggesting that energy-related benefits could motivate broader IoT adoption. Specifically, 90% of respondents supported IoT-driven waste management (PA2: M = 4.58, SD = 0.70), and 85% supported using sensors to design eco-friendly urban spaces (PA3: M = 4.30, SD = 0.95). Given the role of IoT in energy optimization, such as demand-response systems in smart grids or AI-powered building management, these findings suggest a potential pathway for increasing acceptance of IoT-based energy solutions. These high averages suggest a positive view of the environmental applications of intelligent city data. All PA variables had low skewness, indicating support for data collection for environmental purposes.
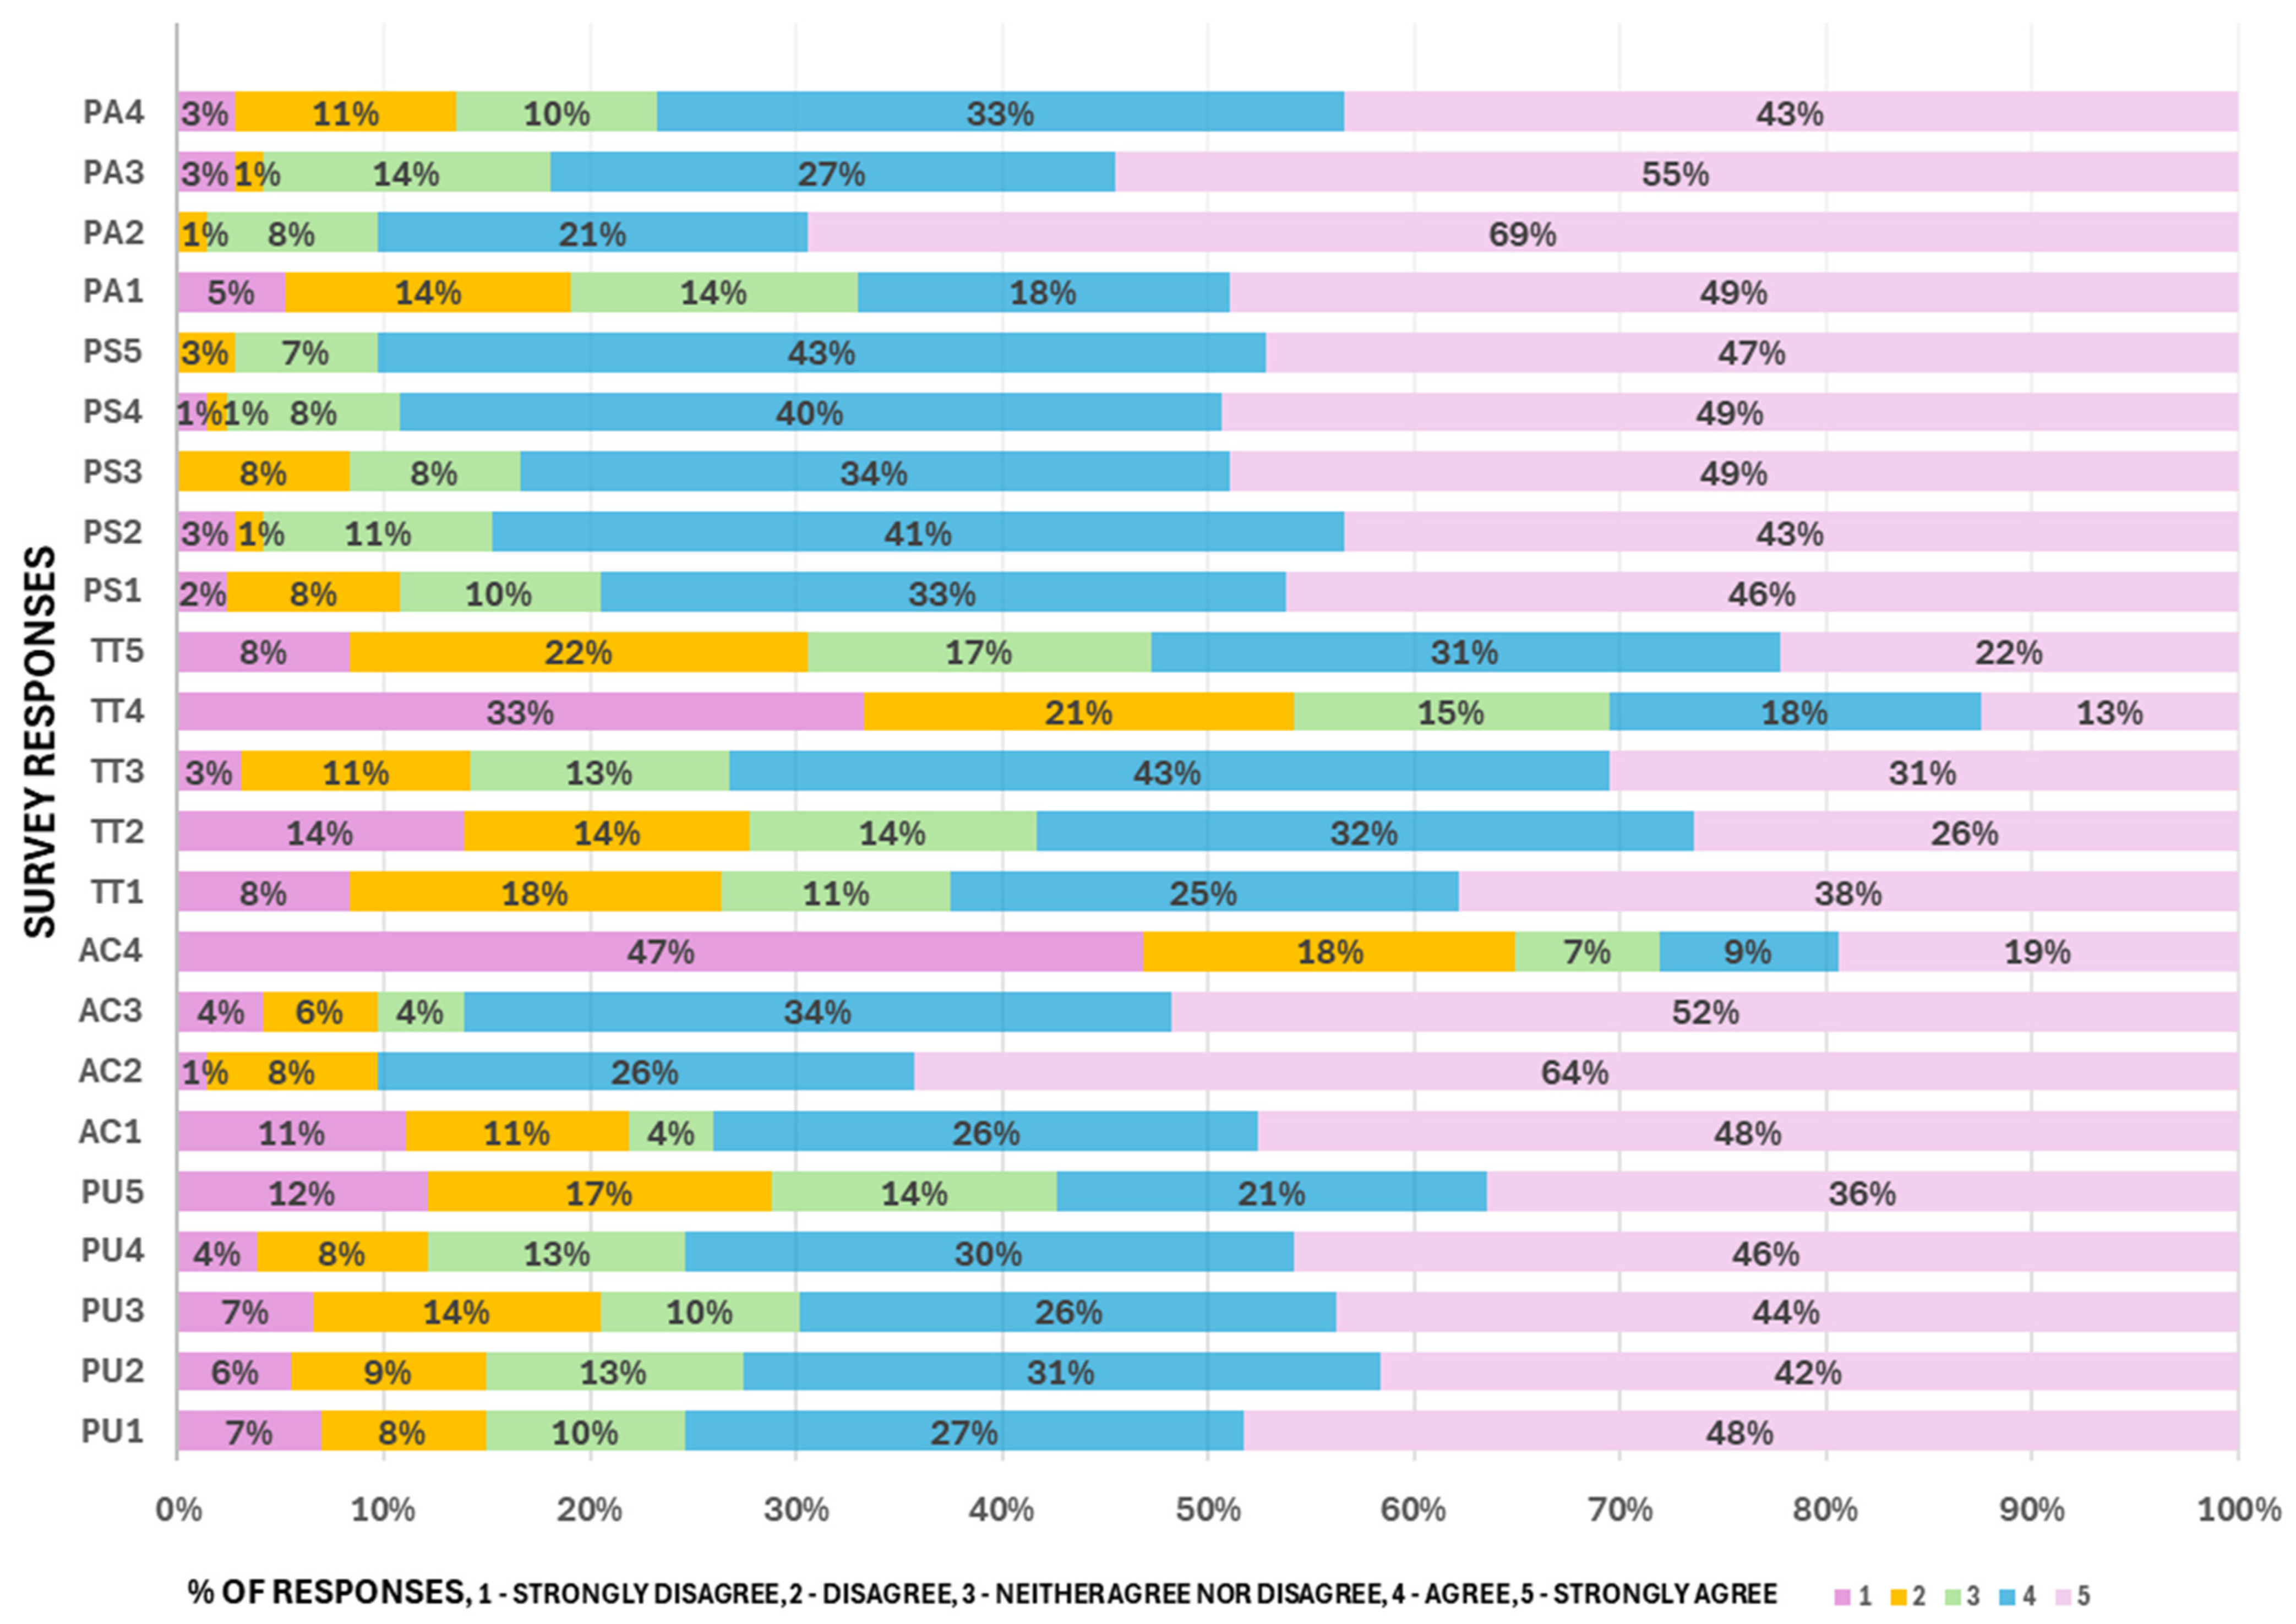
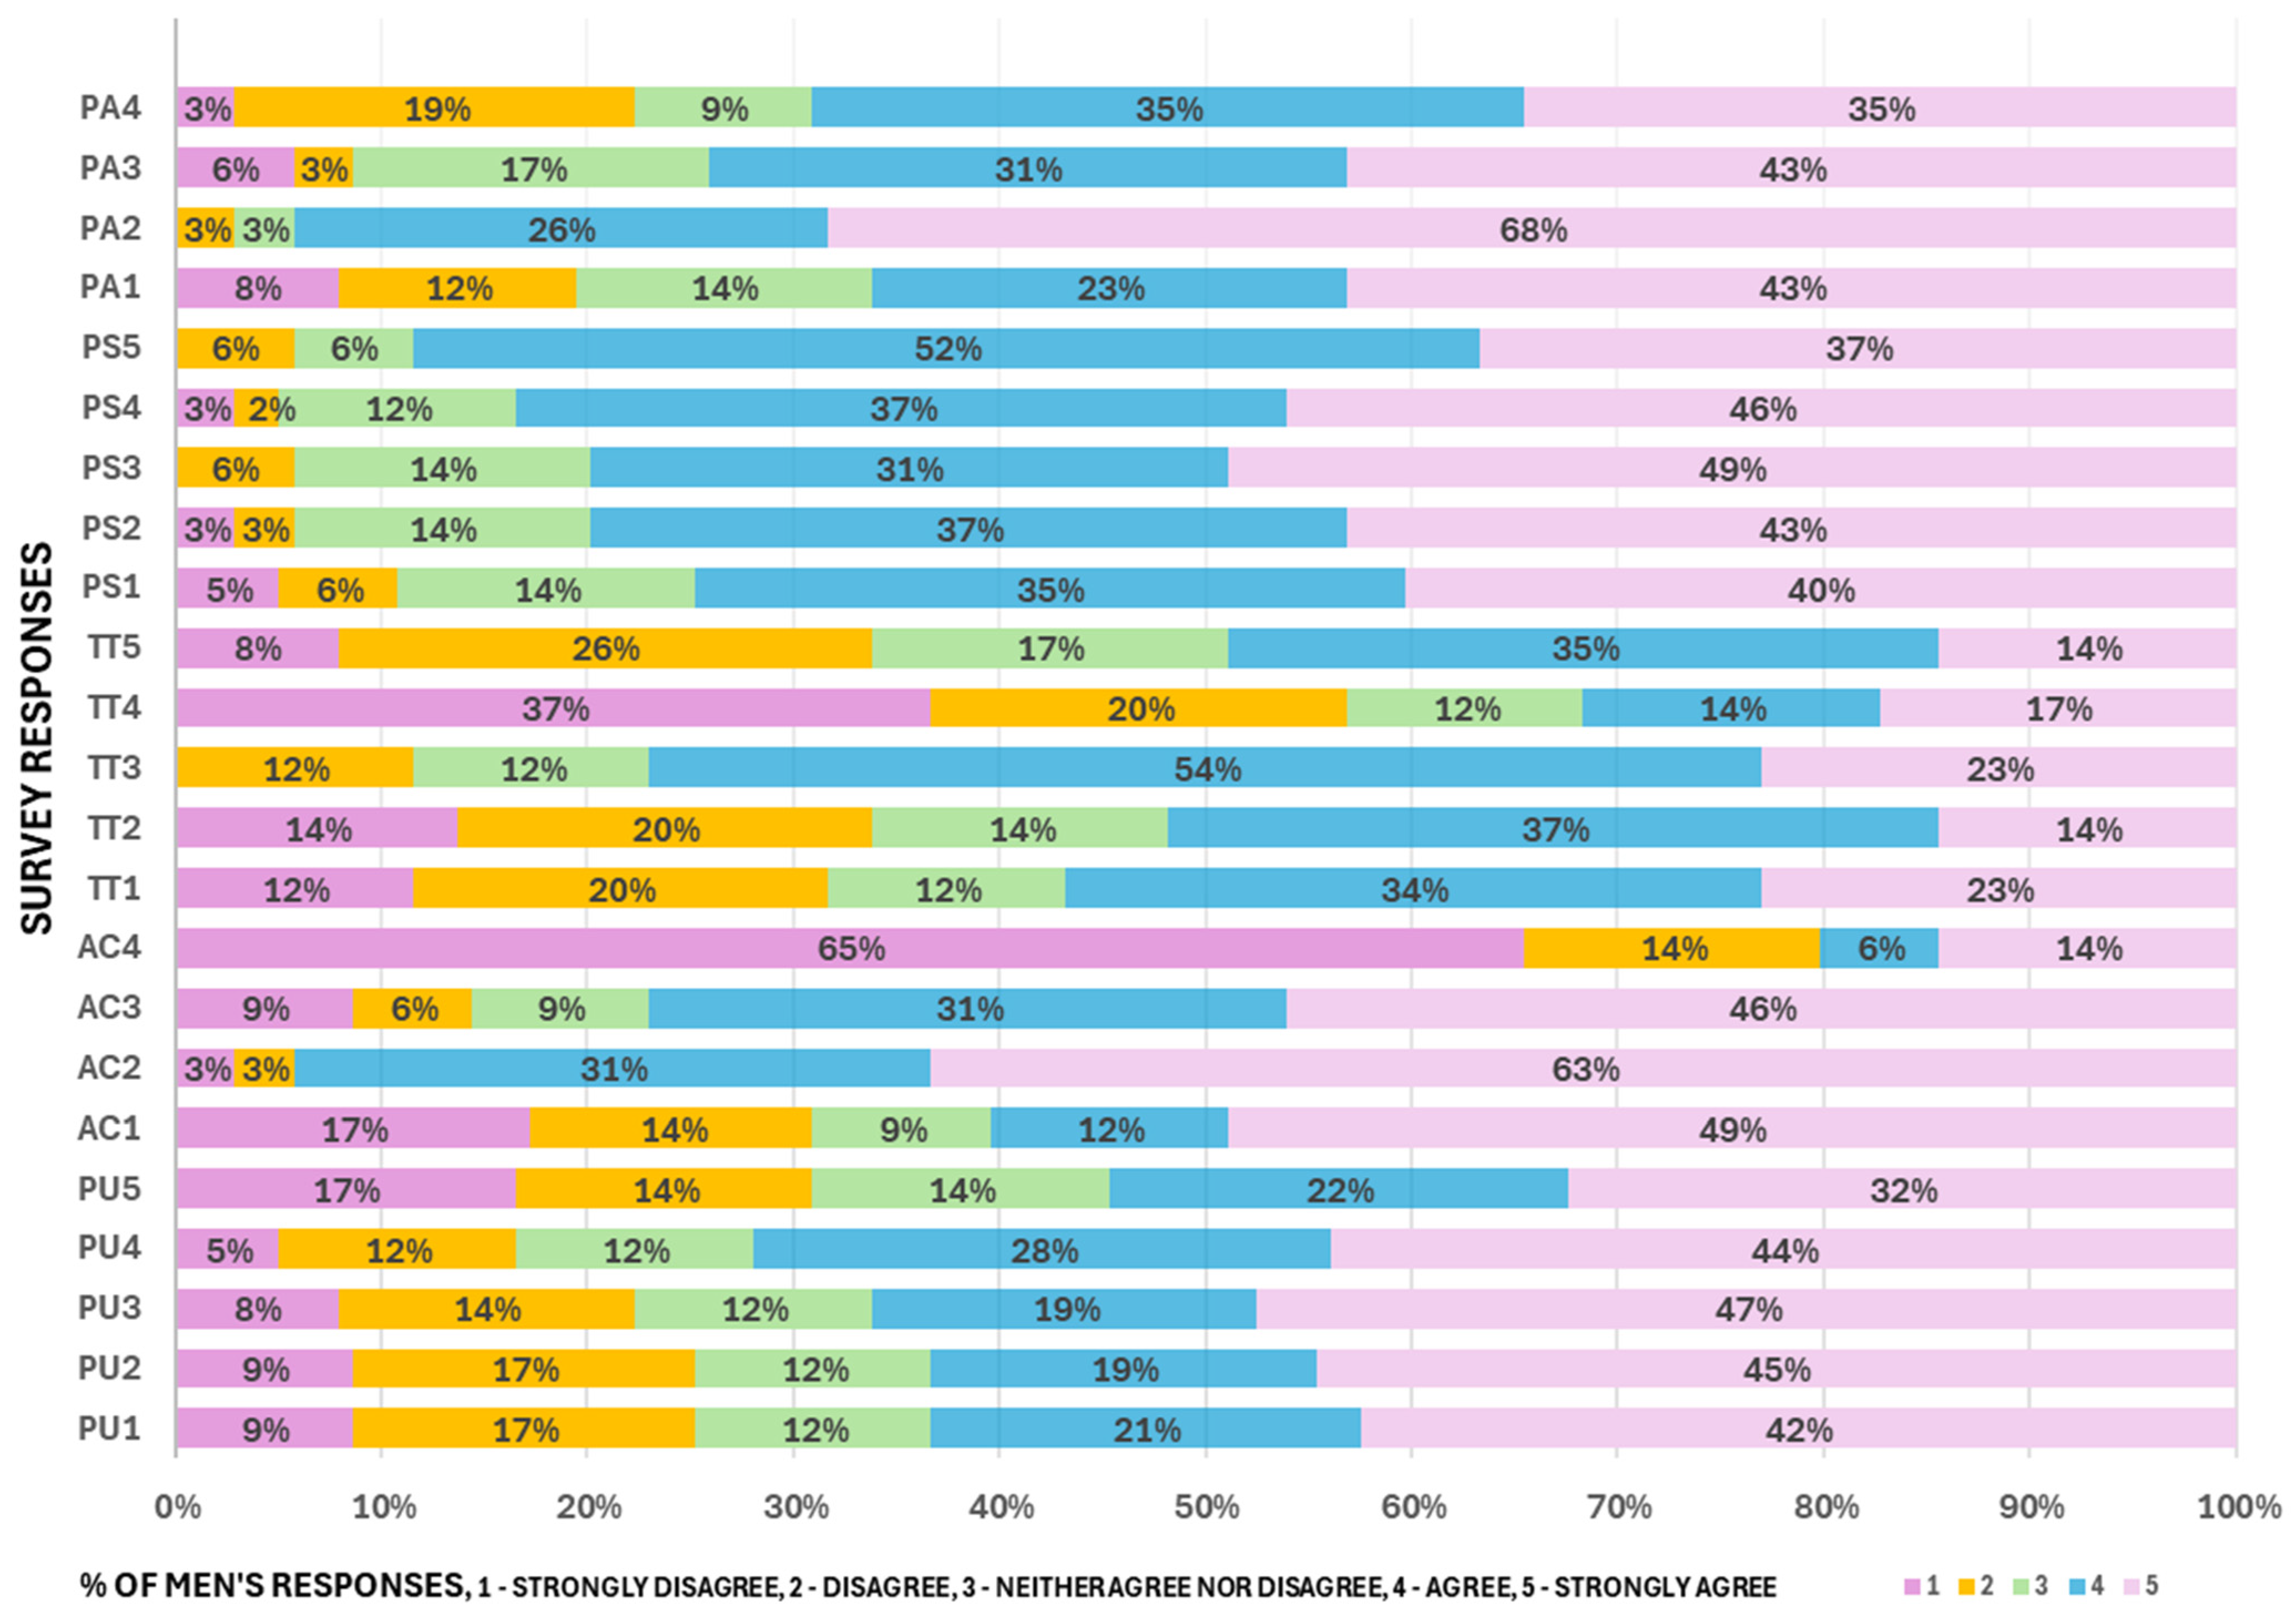
The structure of survey responses is shown in
Figure 2. For all of the variables in the PU group, respondents generally supported the idea that urban surveillance and sensor data could improve city design and meet the needs of different groups: young children, wheelchair users, and the blind. Respondents also supported the broader idea that sensor data could spur the creation of new urban services. While enthusiasm was slightly lower for the use of surveillance to inform green space deployment (PU5), the overall pattern remained overwhelmingly positive. The pattern of responses for the PU variables indicated strong support for using sensor data and surveillance to guide urban planning. Participants largely agreed that such a data-driven approach could increase accessibility, integration, and service offerings in the urban environment.
Trust in technology (TT) varied widely depending on the perceived purpose and intrusiveness of data use. Applications clearly focused on collective benefits and relatively impersonal data, such as monitoring air quality or parking spaces (TT1 and TT3), enjoyed broad support (60–70%). Respondents generally saw them as civic, discrete, and legitimate uses of technology. When the goal was to help individuals, whether people with disabilities or visitors to the city, support remained positive, at over 50%. Some respondents appeared unsure whether the intended benefits outweighed potential concerns about privacy or surveillance. About 30% of respondents expressed such concerns. Incorporating technology to customize offerings for residents or to introduce commercial services aroused considerable distrust (TT4). Only 30% of respondents supported such a solution. More than 50% of respondents did not support such use of technology and did not trust it for such applications. This hesitancy suggested that participants drew the line when they sensed that the use of technology may move away from shared benefits to personalized marketing or the desire for profit. Respondents distinguished between technology uses based on perceived intrusiveness, desirability, and civic value. While they were more open to trusting sensors that provided widespread and tangible public benefits, they were particularly cautious when an application entered areas that appeared more commercialized or privacy-sensitive.
Respondents rated all statements in the PS group positively, with 80–90% of people believing that the use of IoT technology would help ensure the safety of residents in smart cities. Intersection warning systems, sidewalk sensors, and navigation aids had the potential to make urban environments safer for various user groups, including people with disabilities, people with special needs, pedestrians, and tourists. Respondents supported the use of IoT sensor data for environmental purposes; 67% to 90% supported such use of the technology. Whether it was increasing green space (PA1), improving waste collection (PA2), promoting sustainable urban design (PA3), or helping residents take care of the environment (PA4), most respondents recognized and supported the potential positive impacts of IoT sensor data on the environment. Environmental initiatives were widely accepted and seen as important and worthy of praise and application of urban sensor technology.
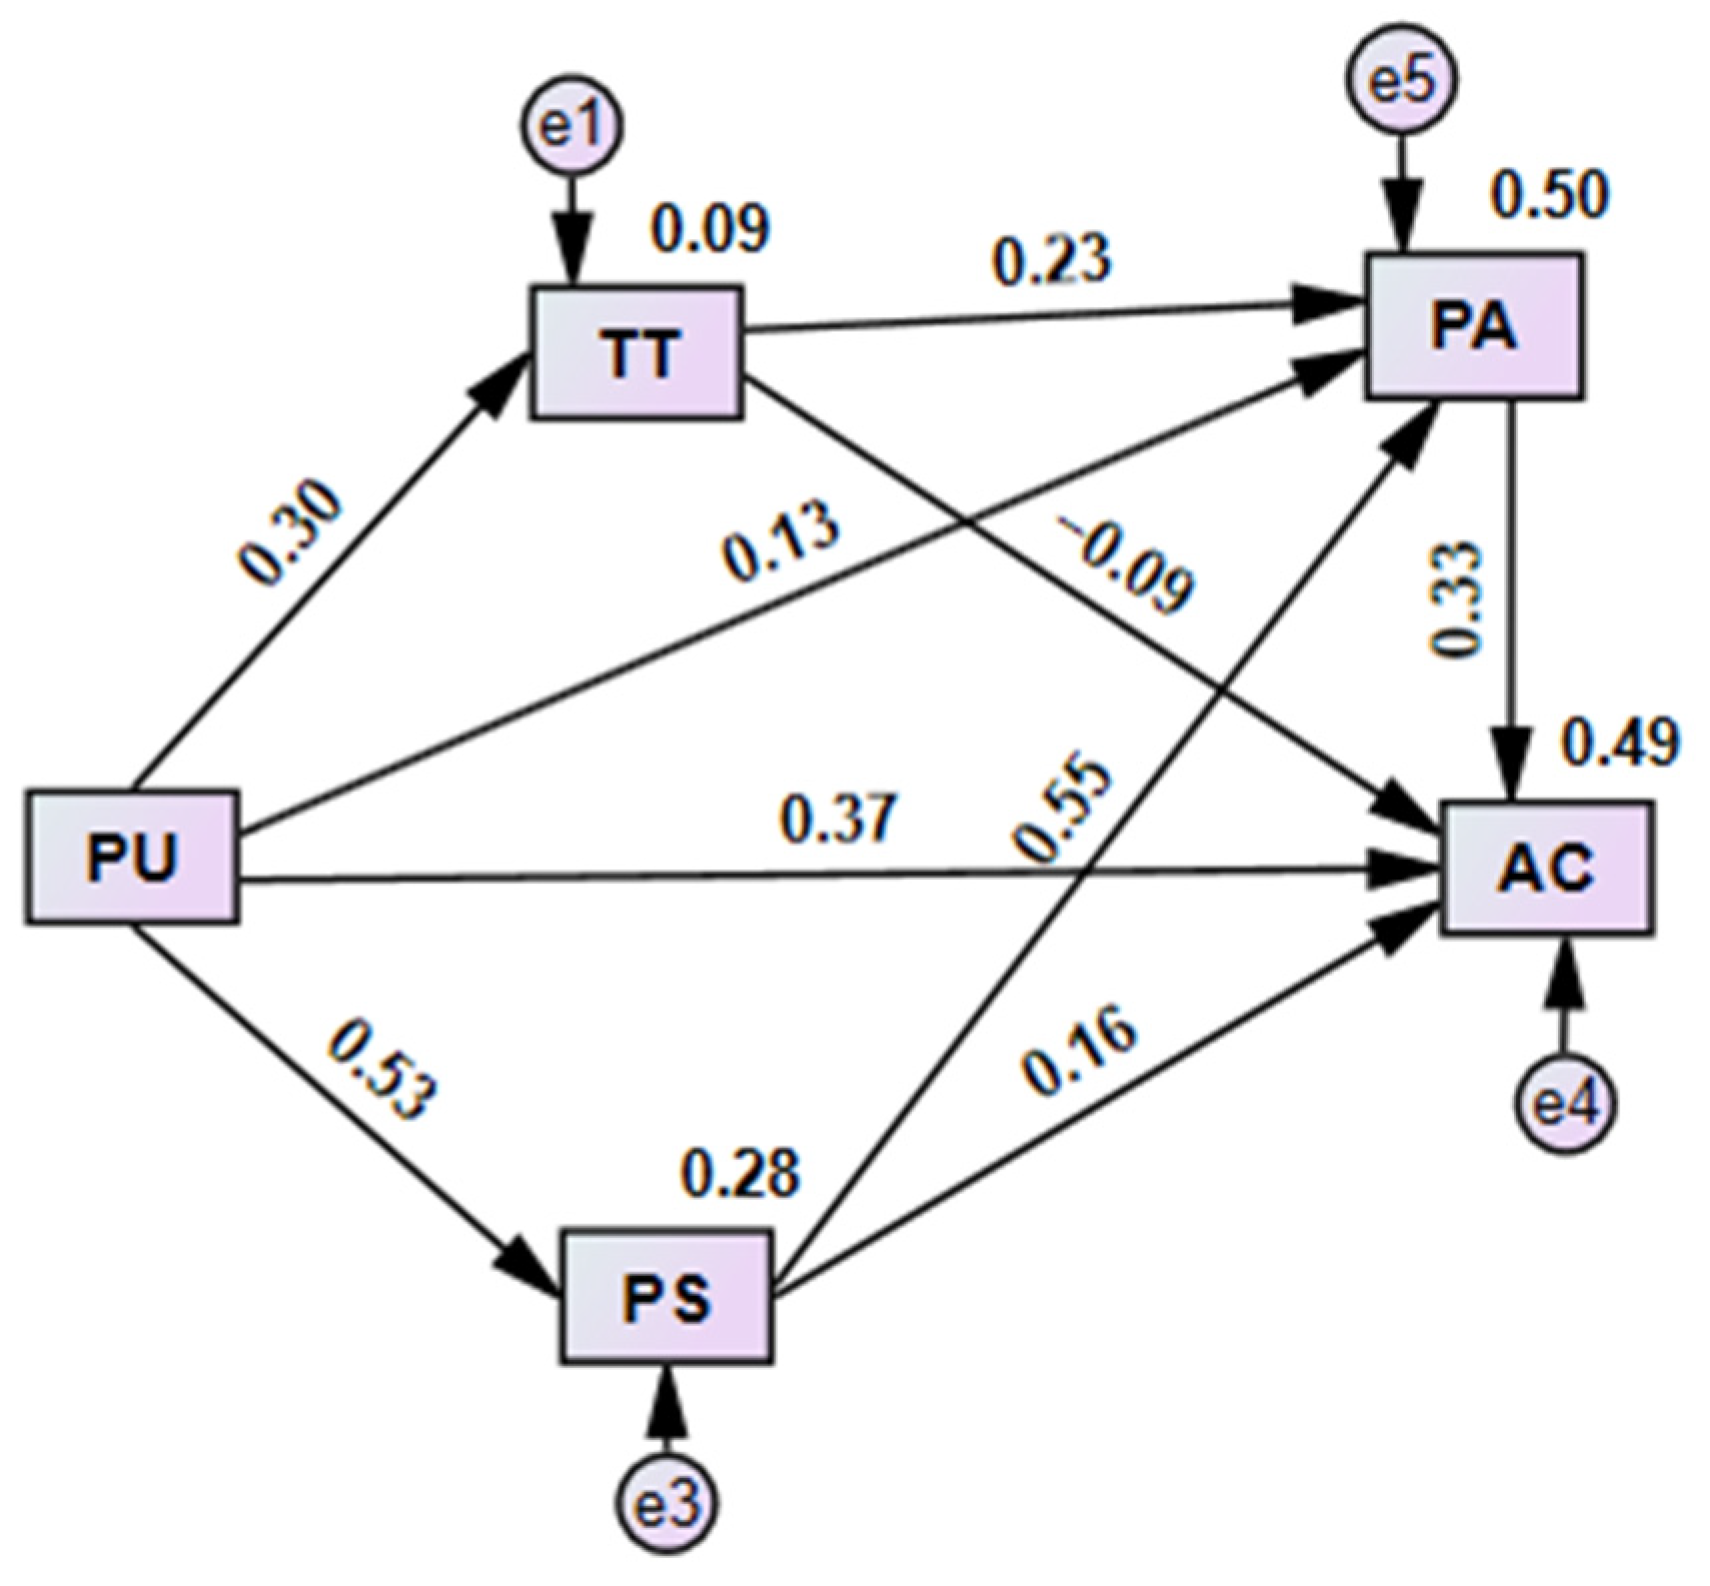
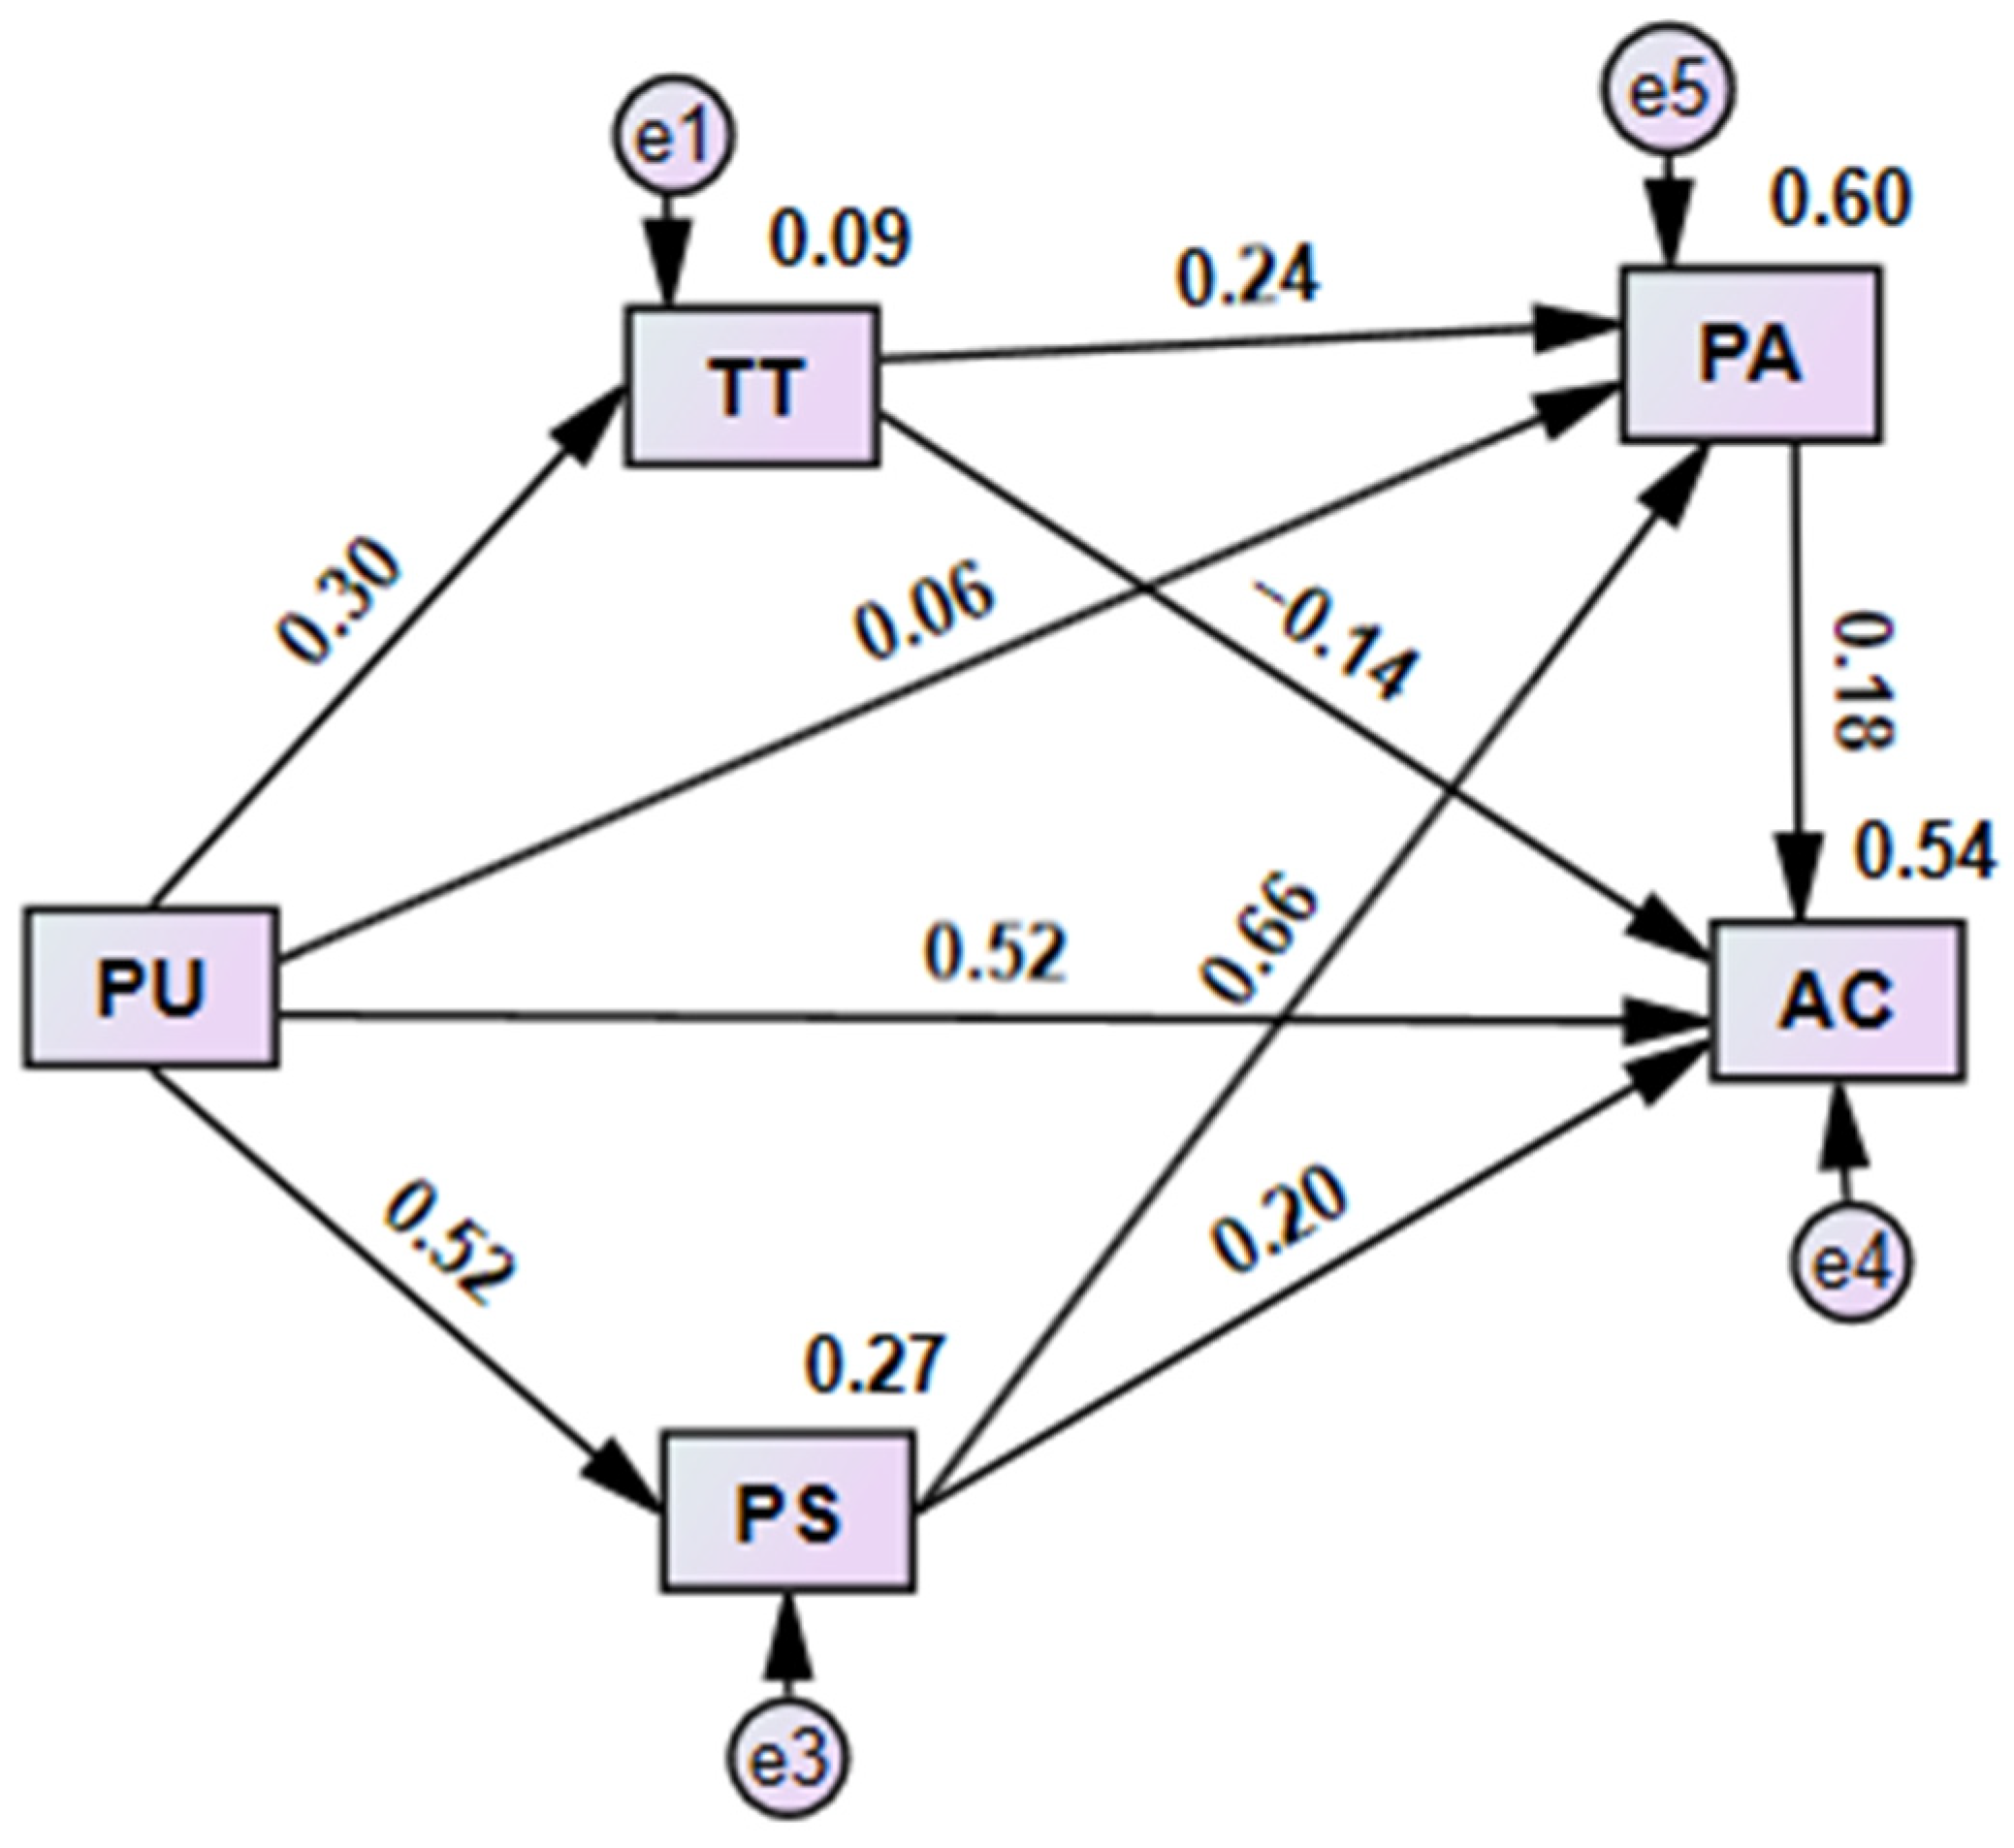
The structural model presented in
Figure 3 was well aligned with the observed data. Standard indices of the model’s fit quality indicated a good fit. The minimum discrepancy parameter, the ratio of the chi-square test value CMIN and the number of degrees of freedom DF, CMIN/DF = 0.188 < 5, with the number of degrees of freedom DF = 1 and the
p-value = 0.665 > 0.05, indicated that the implied covariance structure of the model was not significantly different from the observed data. Since chi-square was sensitive to the sample size, a small value accompanied by a
p-value above 0.05 indicated a close fit of the model to the data. The model’s incremental fit indices, the comparative fix index, CFI = 1 > 0, and the normed fit index, NFI = 1 > 0, indicated that the model reproduced the covariance structure well. The root mean square error of approximation, RMSEA = 0, indicated the quality of the model’s fit to the population covariance matrix. Values less than 0.05 indicated a close fit and were acceptable. Based on the goodness of fit indicators, it could be assumed that the model reflected the data well [
52,
53]. The general model explained 49% of the variance in technology acceptance.
Analysis of the structural model allowed the calculation of standardized regression coefficients and their significance on model paths. The results are shown in
Table 5. Direct and indirect standardized regression coefficients and their
p-values are summarized here. If the calculated probability for a path was smaller than the significance level,
p < 0.05, it could be assumed that the link between the variables was significant, and it was possible to infer the strength of the relationship. It was checked whether the variables in the paths of the model mediated the relationship between the initial and final variables.
A gender group analysis was performed for the general model shown in
Figure 3. All paths of the structural model were tested for differences between men’s and women’s groups.
Table 6 presents the standardized regression coefficients for each group and their
p-values. To compare differences between groups, a CR (critical ratio) coefficient was calculated as the ratio of the difference of the non-standardized regression coefficients for the two groups to the square root of the sum of the squares of the standard errors of the non-standardized regression coefficients of the two groups. If the absolute value of the coefficient was greater than 1.96, at a significance level of 0.05, the difference between the parameters for the two groups was statistically significant.
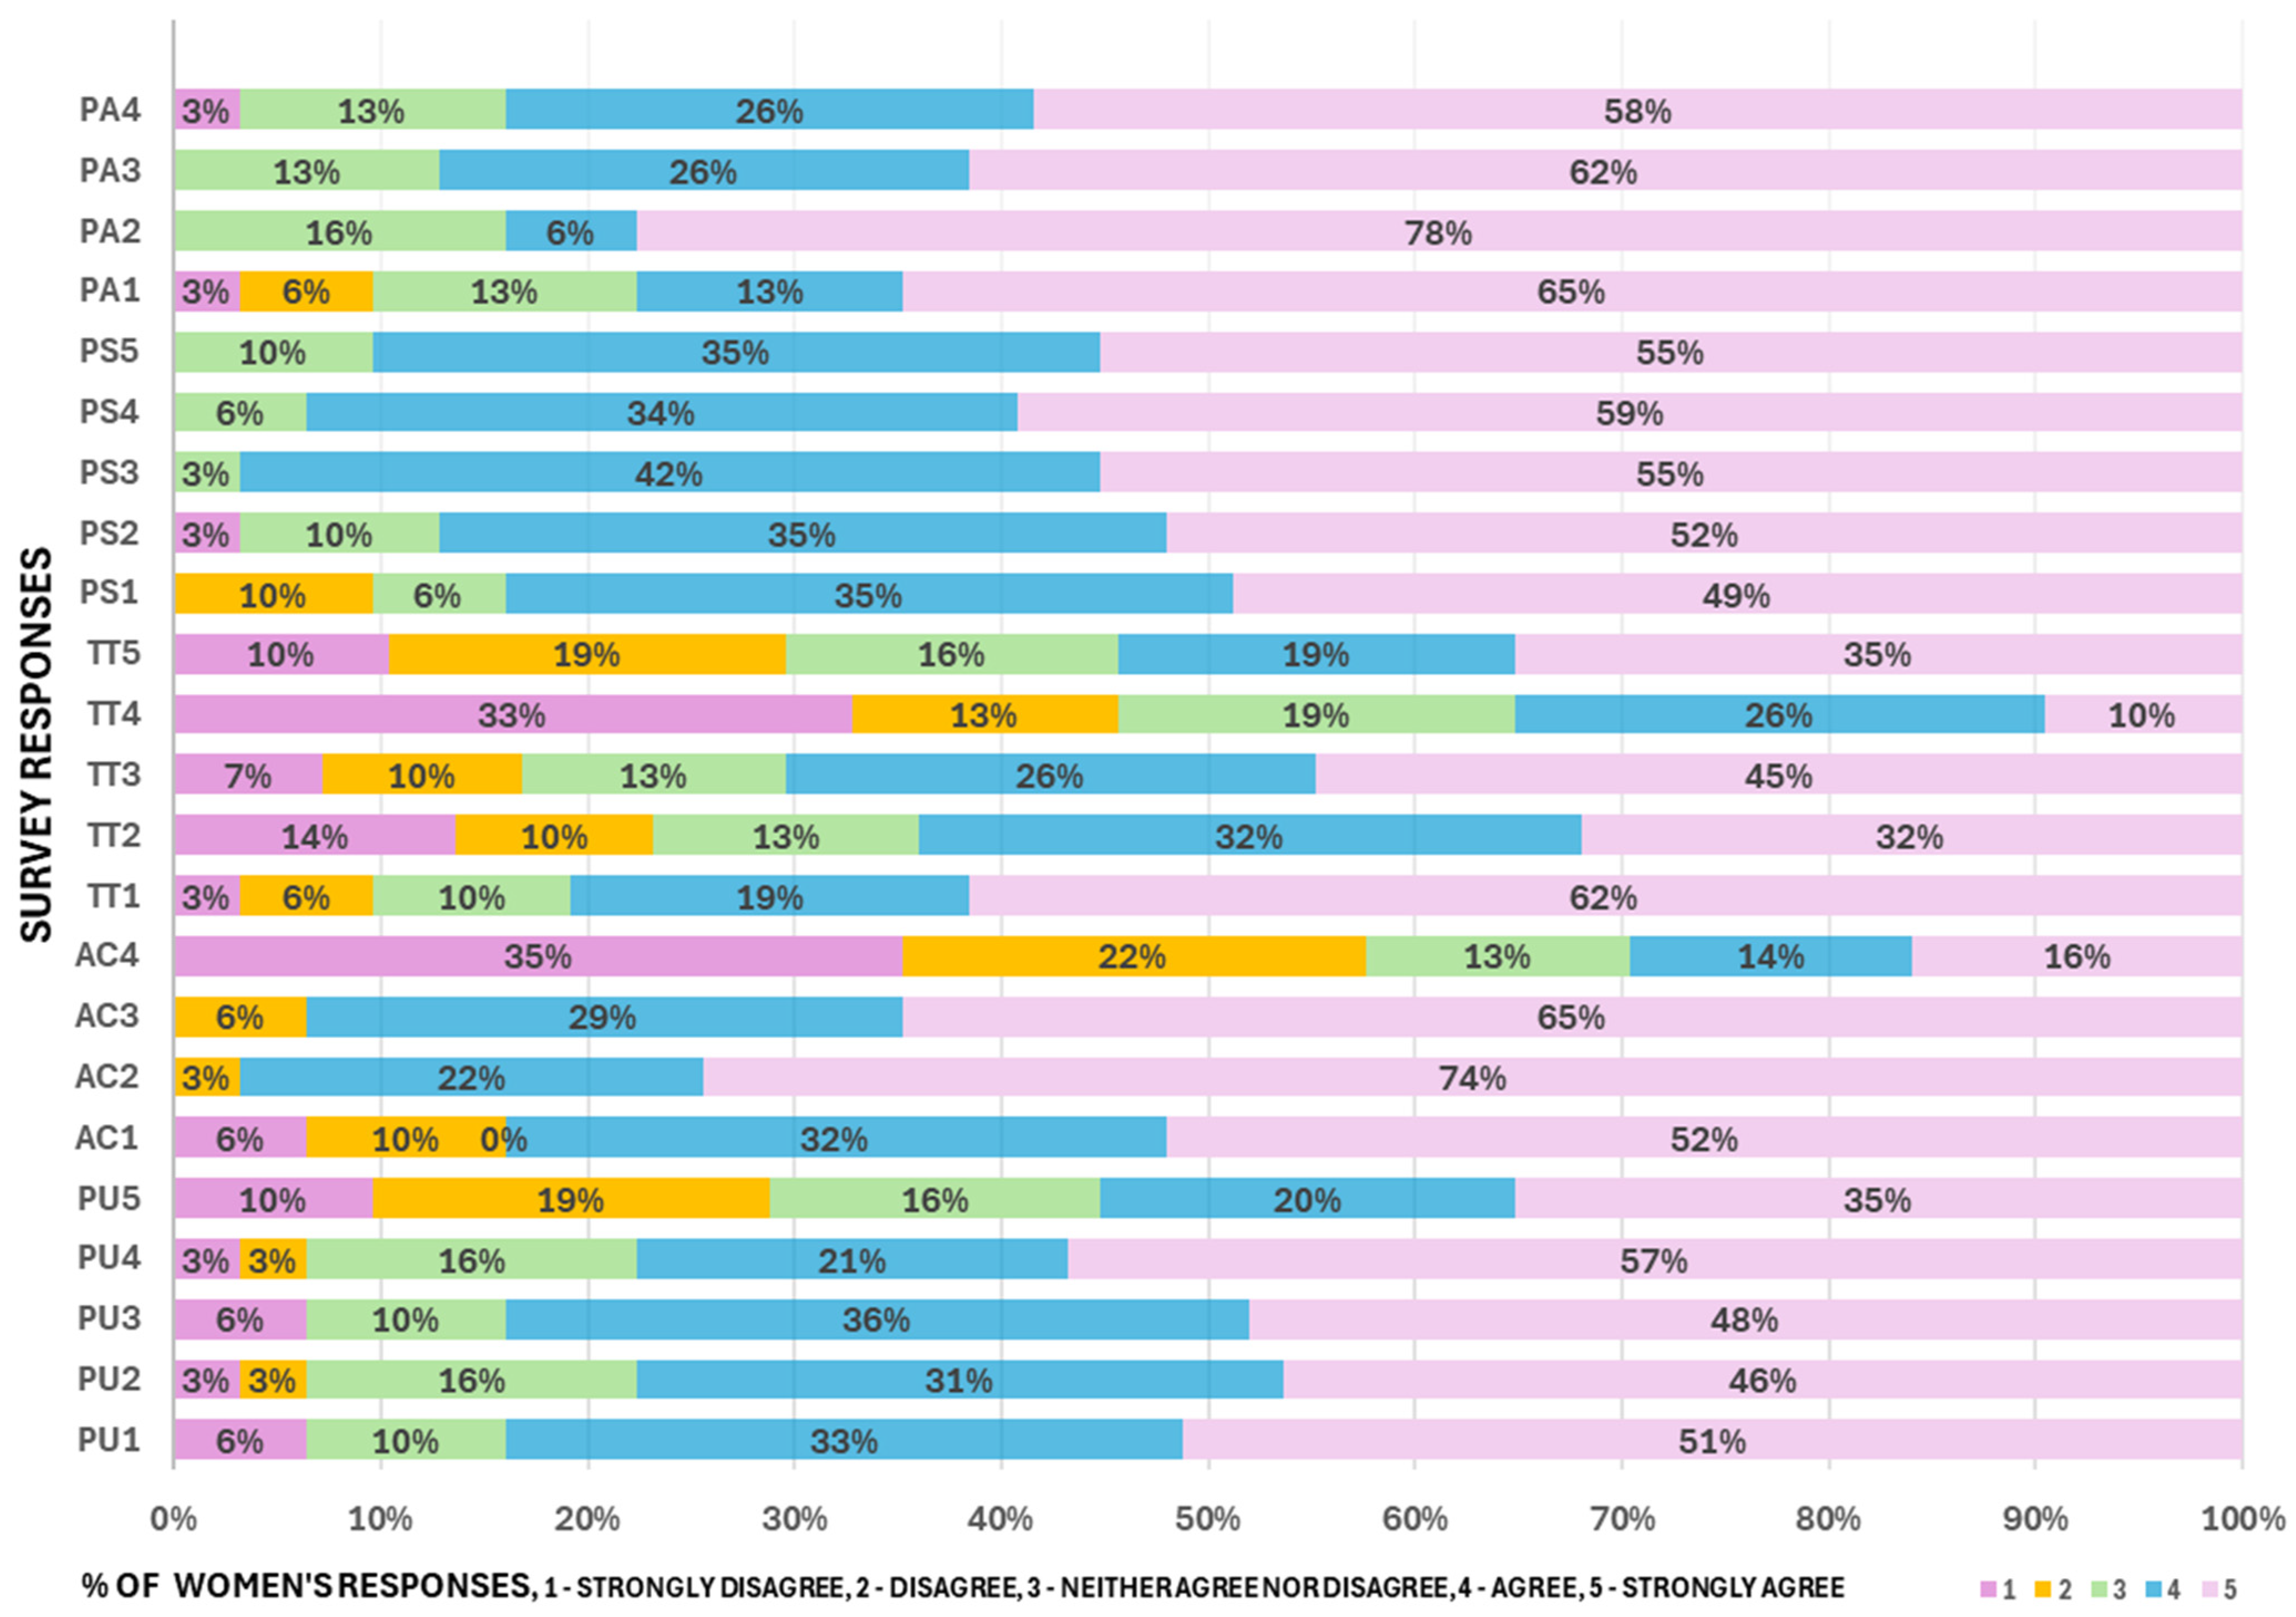
The coefficients of the two model paths for men and women were significantly different (paths PS→PA and PA→AC), and the TT→PA, TT→AC, and PU→AC paths for the women’s model and the PU→PA path for the men’s model were insignificant, so comparing the models for these paths was impossible. Due to the large differences between the models for women and men, separate structural models were prepared for each gender to evaluate their characteristics. Additionally, women’s and men’s responses to individual survey statements were compared. Descriptive statistics of women’s responses are summarized in
Table 7, and men’s responses are summarized in
Table 8. The distribution of women’s responses is shown in
Figure 4, and the distribution of men’s responses is shown in
Figure 5.
Table 9 shows the significance of differences in mean responses between men and women. If the Pearson’s Chi-square-test probability was less than 0.05, there were foundations for rejecting the null hypotheses of equality of means.
On average, women rated each of the survey’s statements higher. For most statements, the differences between the responses of men and women were significant. Only the variables PU5, AC2, and PS2 were found to be non-significant (p-value > 0.05). Women generally reported higher means across all PU items. For example, the mean (M) of PU1 for women was 4.22 (SD = 1.07), while for men, it was 3.72 (SD = 1.38). Variance in responses was consistently lower for women compared with men, suggesting less variation in women’s responses. Similarly, women reported greater agreement for AC statements, for instance, for AC2 (M = 4.68, SD = 0.64), compared with men (M = 4.49, SD = 0.88). Men exhibited greater variability in acceptance-related items (e.g., AC1 variance = 2.54 vs. 1.47 for women). It should be noted that the responses for the AC4 statement were significantly lower, for both women and men, than for the other variables in the AC group. Women rated the AC4 statement higher (M = 2.53, SD = 1.484) than men (M = 1.89, SD = 1.478), and the variance in the women’s group was very similar to that in the men’s group. Women’s trust in IoT systems was higher for the TT groups, e.g., TT1 (M = 4.30 vs. 3.37 for men) and TT2 (M = 3.59 vs. 3.19 for men). Women showed greater acceptance for data collection purposes, with significantly higher scores for all items, for instance, PA1 (M = 4.23 for women, 3.99 for men). Men’s responses indicated a wider spread of data. As in previous cases, women reported higher perceived safety in all items, e.g., PS4 having a mean of 4.49 (SD = 0.71) for women compared with 4.03 (SD = 1.12) for men. Men showed a broader spread of responses, as indicated by higher variances.
The results of the responses to the statement “I believe that city authorities should finance the development of smart technologies in my city” are shown in
Table 10. The results were gathered in the variable “smart city support” and are presented in a contingency table with a breakdown of women’s and men’s responses. The Chi-square statistic was determined at the 0.05 level of significance (Chi-square = 16.23, DF = 2,
p < 0.001). Based on the test probability value, it could be assumed that there were significant differences between the responses of men and women.
To compare the structure of women’s and men’s responses across the Likert scale categories (from strongly disagree to strongly agree), the analysis focused on the distribution of percentages of responses in each category for the same set of variables. For the PU statement, women’s responses were skewed toward agreement and strong agreement for PU1–PU4 (e.g., for PU1, 27% agree and 48% strongly agree). PU5 showed lower agreement (21% agree and 36% strongly agree) and higher neutral responses (14% neither agree nor disagree). For men, statements PU1–PU4 had similar trends but with a smaller percentage of strongly agree (e.g., for PU1, 21% agree and 42% strongly agree). PU5 showed an even distribution across the scale, with fewer respondents strongly agreeing (32% strongly agree) compared with women. For statements in the AC group, women’s responses were overwhelmingly positive, particularly for AC2 (64% strongly agree) and AC3 (52% strongly agree). AC4 had a larger share of neutral responses (7% neither agree nor disagree) and disagreement (18% strongly disagree). For men, a similar pattern could be seen, for AC2 and AC3 but with slightly less strongly agree responses (for AC2, 63%, and for AC3, 46%). The AC4 responses showed greater polarization, with 31% disagree and 14% strongly disagree. Women’s responses for the TT group of statements were concentrated in positive categories for TT1–TT3 (e.g., for TT1, 25% agree and 38% strongly agree). TT4 and TT5 showed higher neutral and negative responses (e.g., for TT4, 33% strongly disagree). For men a wider spread of responses could be seen, for instance, for TT1–TT3, with less agreement compared with women (e.g., for TT1, 34% agree and 23% strongly agree). TT4 and TT5 exhibited higher levels of disagreement (37% disagree for TT4). In the PA group of statements, women represented high levels of agreement and strong agreement, particularly for PA1 and PA4 (49% strongly agree for both). Neutral responses were minimal, and disagreement was negligible. Similar trends could be seen for men but with fewer strongly agree responses (e.g., for PA4, 35% strongly agree). In the case of women, a very positive skew could be seen, especially for PS4 and PS5, where over 90% of responses were in the agree or strongly agree categories. PS2 had slightly more neutral and negative responses compared with the other safety variables. Men represented similar overall patterns but with a higher share of neutral and negative responses (e.g., for PS5, 43% strongly agree vs. 49% for women).
Additionally, structural models were prepared for each gender. The results of the path analysis for women are shown in
Table 11, and those for the men’s model are shown in
Table 12. The structural models for women and men showing standardized regression coefficients are presented in
Figure 6 and
Figure 7, respectively.
As with the overall model, the structural models for men and women reflected the data well. The number of degrees of freedom for both models was DF = 1. The values of the Chi-square (CMIN) statistic for women and men were 1.438 and 0.116, respectively. The CMIN/DF ratio should be less than 5. For women it was 1.438, and for men it was 0.116. The probability value of PCLOSE should be greater than 0.05 and was appropriate for both models. For women it was 0.3, and for men it was 0.774. The relative comparison measures CFI = 0.998 and NFI = 0.994 for women and CFI = 1 and NFI = 1 for men should be greater than 0.9. The RMSEA coefficient for women was equal to 0.059, and for men it was 0 (should be smaller than 0.1), inferring a good fit between the two models [
52,
53]. The model explained 54% of the variance in acceptance of IoT technology for men and 57% of the variance for women.
5. Discussion
Considering the characteristics of the model’s variables, it could be concluded that women saw IoT technology as promising for use in smart cities. Additionally, women reported higher levels of trust, security, and acceptance regarding IoT technology compared with men. Also, the use of IoT technology for environmental purposes had more support among women. Women showed stronger support for data collection initiatives for environmental purposes, but the overall patterns were similar between genders. These results were in line with previous research suggesting that women considered safety as the most important factor. Both genders agreed strongly on safety-related variables, but women were more likely to indicate strong agreement, especially for variables related to safety for pedestrians and people with disabilities. Women had a more pragmatic approach to IoT technology than men, and they also had a higher level of trust in new technology than men. Significant differences in trust were observed, where men reported higher disagreement or neutrality, especially for statements related to anonymous data collection and navigation systems (TT4 and TT5). All but three statements (PU5, AC2, and PS2) were rated significantly higher by women than by men. Men’s responses were more diverse than women’s. There could be seen more frequent disagreement and neutral responses, suggesting greater polarization in men’s attitudes. These findings suggested that women were generally more accepting and trusting of IoT technologies, which may be driven by their greater emphasis on safety and usefulness. This gender-based disparity could have implications for designing IoT-based systems and tailoring marketing strategies to target diverse gender groups effectively.
A group analysis of the structural model according to the women’s group and the men’s group, shown in
Figure 1, indicated that there were significant differences between genders in the acceptance of IoT technology in the smart city. Therefore, the women’s group and the men’s group were considered separately. Descriptive statistics and response structure were determined for each group. Also, a structural model was prepared considering only women’s responses and only men’s responses. In the general model, the effect of gender on the different paths of the structural model was determined.
Broader socio-cultural factors and traditional gender roles may influence these gender differences in IoT acceptance. Prior research suggests that women often prioritize safety and community well-being in technology adoption, whereas men may be more driven by perceived usefulness and personal efficiency. Cultural norms regarding privacy concerns and risk perception could also shape these attitudes. Future studies should investigate how socio-cultural expectations impact the acceptance of smart city technologies.
Based on an analysis of the responses in the contingency table (
Table 10) between men’s and women’s responses to the smart city technology acceptance question, it could be concluded that 14% more women than men supported the city’s funding of smart city technology (113 women and 99 men supported this statement). This indicated women’s greater support for smart city technology. Women did not rate the financing of the technology negatively; no woman gave a negative answer, while four men thought the technology should not be financed with city funds. Three times fewer women (12) had doubts about the use of the technology compared with the number of men (36).
For all general model paths, direct relationships between variables were significant. All H1 to H9 hypotheses for general model were accepted. The perceived usefulness of a technology positively predicted trust in it. Based on the standardized regression coefficient, the relationship could be considered medium (β = 0.229). The relationship between perceived usefulness and perceived safety was strong (β = 0.531). The higher residents rated the usefulness of IoT sensor data, the safer they felt. The perceived usefulness had a positive but small effect on pro-environmental attitudes (β = 0.130). The influence of residents’ perception of usefulness on the acceptance of IoT technology could be rated as strong (β = 0.369). The greater the awareness of the usability of IoT sensor data, the greater the acceptance of its use. Trust in technology, to a medium degree, influenced pro-environmental attitudes (β = 0.228). As trust increased, respondents were more likely to support data collection for environmental purposes, but these attitudes were very much influenced by residents’ perceived safety (β = 0.548). The safer residents felt, the more willing they were to support data collection by IoT sensors for pro-environmental purposes. Using data to monitor and improve the environment positively influenced the acceptance of the technology (β = 0.334). The greater the support for data collection, the greater the support for the technology. Also having a positive but small impact on acceptance of IoT technology was the perceived safety of residents in a smart city (β = 0.159). The relationship between trust in and acceptance of the technology was of concern. The relationship was significant and small but negative (β = −0.093). The model’s correlations indicated the more respondents knew about technology, the less they supported it. It should be noted that the correlation was very weak. While trust positively influenced environmental attitudes, it had a small negative direct effect on acceptance. This suggested that trust in technology alone did not automatically translate into acceptance of all its applications. Respondents may trust the technology’s technical merits but still have concerns that limit their acceptance. The strongest path to raising acceptance seemed to be via perceived usefulness and the resulting sense of safety and environmental benefits. Acceptance was higher when respondents believed the IoT solutions were genuinely beneficial, enhanced personal and community safety, and contributed to environmental improvements.
A comparison of the structural model for men and women showed statistically significant differences in ratings of the impact of perceived technology safety (PS) on acceptance of data collection for pro-environmental purposes (PA). For women, this relationship was of relatively high importance (β = 0.358), while for men it was very important, and the relationship was strong (β = 0.664). There was also a big statistically important difference in the perception of the relationship between acceptance of data collection for pro-environmental purposes (PA) and acceptance of technology (AC) between the women’s and men’s groups. Women paid attention to environmental protection and the possibility of improving the environment through the use of IoT technology (β = 0.507), while men paid less attention to this; the relationship here was weak and positive (β = 0.178). The differences between PU→TT, PU→PS, and PS→AC paths were statistically insignificant. For both women and men, perceived usefulness of technology (PU) had a significant impact on perceived safety (PS). The regression coefficient values were 0.614 for women and 0.517 for men. Also of relatively high importance to both men and women was the impact of the perceived usefulness of IoT technology (PU) on its security and trust in it (TT). The higher the perceived usefulness, the higher the trust in the technology. The regression coefficients for men and women were 0.283 and 0.303, respectively. Although the regression coefficient for the PS→AC path was higher for women (0.465) than for men (0.203), this difference was statistically insignificant. Thus, it could be concluded that the impact of respondents’ perceived safety on the acceptance of IoT technology in smart cities, in both the women’s and men’s groups, was high. For the remaining paths, differences between genders could not be compared, because for one gender the regression coefficients on the model paths were insignificant. It was only possible to assess the preference of a particular gender and compare the result with the result for the general model. For women, the relationships between the variables TT→PA, TT→AC, and PU→AC were not significant, while for men the relationship between the variables PU and PA was not significant. The effect of trust in technology (TT) on its acceptance (AC) in the general population was negative and low (β = −0.093), while in the men’s group the value was much lower (β = −0.143). For women, the acceptance was also negative but not significant. This means that the more men knew about technology, the less they accepted it. The less one knew about the technology, the more they accepted it. However, confidence in technology (TT) affected the acceptance of data collection for environmental purposes (PA). The β coefficient for the population was equal to 0.228, and for men the value was not far from that for all respondents (β = 0.241). Similarly, in this case, the relationship between the TT and PA variables was not significant for women. This meant that men who had confidence in technology had a medium level of acceptance of IoT technology in smart cities. For women, the quality of technology was insignificant and had no effect on other variables. The impact of the usefulness of technology (PU) in technology acceptance (AC) for women was insignificant, while for men the relationship was strong and positive (β = 0.523). This meant that technology usefulness was very important for men. For women, the usefulness of technology (PU) was significant for its use for environmental purposes (PA) (β = 0.281) and was higher than in the general population (β = 0.13). For men, this relationship was insignificant.
For men, the association between trust in technology and its use for environmental purposes was moderately significant. The other regression coefficients of the model did not differ for men and women and were similar to those of the general model. Knowing the differences in perceptions of technology could help promote it. It is worth targeting women with a message on the link between the usefulness of technology, its safety, and its pro-environmental capabilities, while when preparing a message for men, it is important to pay attention to the usefulness of technology and its reliability.
These findings indicated that public perception of IoT technology was strongly influenced by its perceived societal and environmental benefits. The significant correlation between PA and AC variables suggested that acceptance of IoT-based environmental applications could extend to IoT-powered energy solutions, such as smart grids, real-time energy monitoring, and AI-driven energy optimization. Previous studies have shown that smart energy systems leveraging IoT and AI can reduce urban energy consumption by up to 60% [
54,
55,
56]. Thus, integrating energy-efficient IoT applications into smart city planning and emphasizing their environmental impact in public communications may enhance overall acceptance. Furthermore, the observed gender differences in PA responses suggest that women with more significant support for pro-environmental applications may also be more receptive to IoT-based energy solutions. Future studies should investigate whether this trend extends to smart home energy management and electric vehicle infrastructure.
The analysis of mediation in the general model indicated that all relationships were indirect (partial mediation). This meant that both the direct effects of the model and indirect dependencies were significant. All mediating hypotheses for general model (H10 to H14) were accepted. The results indicated a complex network of relationships in which perceived usefulness influenced acceptance of IoT technologies through multiple mediators. Specifically, trust in technology, perceived safety, and pro-environmental attitudes served as key mediating variables, creating several “serial mediation” paths. The significance and direction of these indirect effects provided an understanding of how people arrived at greater acceptance. Trust in technology negatively mediated the relationship between perceived usefulness and technology acceptance. The effect was very small (β = −0.028) but significant. This relationship was also mediated by pro-environmental attitude and perceived safety. The effects were very small but positive (β = 0.043 and β = 0.085). When respondents perceived IoT technology as more useful, they tended to develop greater trust in it, which in turn enhanced their pro-environmental attitudes. Strengthened environmental attitudes then led to increased acceptance. Both trust in technology and pro-environmental attitudes mediated the relationship between perceived usefulness and technology acceptance; however, the mediating effect was small (β = 0.159). Perceiving the technology as useful increased the sense of safety, which significantly boosted pro-environmental attitudes. In turn, these positive environmental attitudes led to higher acceptance. Both perceived safety and pro-environmental attitudes positively mediated the relationship between perceived usefulness and technology acceptance. The relationship was medium (β = 0.291). The strength of the indirect effect varied based on the level of perceived safety and pro-environmental attitudes. The strongest and most consistent route to increased acceptance was through improving perceived usefulness, which elevated perceptions of safety and environmental benefits. Safety and environmental attitudes, in particular, formed a powerful bridge to acceptance. A pro-environmental attitude repeatedly appeared as a crucial mediator, meaning that convincing people of the environmental value of IoT technologies is a highly effective way to garner their eventual acceptance. Trust in technology alone is not a guaranteed precursor to acceptance. It must be coupled with the perception either that the technology enhances safety or that it positively impacts the environment. This highlights the complexity of the acceptance process: people do not simply trust and then accept, but trust combined with tangible social or environmental benefits fosters true acceptance.
Hypothesis 10 for the women’s model was supported. Here, full mediation occurred as the relationship between the PU and AC variables was not statistically significant, and the total regression coefficient on the PU→TT→AC path was statistically significant. This meant that in the case of women, trust in technology (TT) affected the relationship between perceived usefulness (PU) and acceptance of technology (AC). The effect was very small, negative (−0.034), and slightly higher than in the general model (−0.028). Higher trust reduced acceptance modestly. The same was true for the men’s model. Here, too, hypothesis 10 was confirmed, but the partial mediation occurred in the men’s model. The mediating effect of trust in technology on the PU→AC path was significant but very small and could be neglected for the general model and for both the women’s and the men’s models.
Hypothesis H11 for women was confirmed. Perceived usefulness (PU) had an indirect effect on technology acceptance through using the technology for pro-environmental purposes (PA). The effect (β = 0.143) was higher than in the general model (β = 0.043). For the men’s model this indirect effect was insignificant. Again, it could be confirmed that for women the pro-environmental effect was important, which by 15% strengthened the relationship between perceived usefulness and technology acceptance.
Hypothesis H12 for the women’s model was not statistically significant. For women, the combined effect of trust in technology (TT) and pro-environmental use (PA) was not significant. For the men’s model, the effect was significant (β = 0.073), higher than in the overall model (β = 0.068) but negligibly small.
Hypothesis H13 was confirmed for all structural models. In the case of the general model, the indirect relationship between the perceived usefulness of technology and its acceptance through the safety of city residents was negligibly small (β = 0.085), but for women the impact was large (β = 0.286). Positively perceived safety by 28% increased the acceptance of technology. For the men’s model, the effect was three times smaller (β = 0.105). This means that for women, safety is very important, and this should be highlighted when communicating IoT technology in smart cities to this segment of the population.
Hypothesis H14 was confirmed only for the women’s model. For the men’s model, the relationship was not statistically significant. For women, both safety and the environmentally friendly use of technology increased technology acceptance. The relationship between perceived usefulness (PU) and acceptance (AC) was strengthened by 22% for women. In the general model, the effect was stronger (29%). Again, this relationship confirms how important safety and environmental well-being are to women.
6. Conclusions
The research presented in this paper can be used to design and implement smart city initiatives that are more inclusive and responsive to the needs of different groups of residents, in this case, women and men. By understanding gender-specific perceptions, they can create policies that increase the acceptance and effectiveness of IoT technologies in urban environments.
The research described in this paper was conducted to find out the opinions of Warsaw and Plock residents about IoT technology being introduced into cities. It is important to note that the survey focused on the use of technology for the purposes of universal design, i.e., designing and operating a city in such a way that it is friendly to all residents: older adults, people with disabilities, and parents with young children. Research on the general respondents was presented in the paper of Walczak et al. [
16]. They found that unfavorable attitudes toward IoT technology changed if the technology was to help residents. Respondents reported privacy concerns and distrust of technology that was not frequently serviced and updated, but empathy toward groups with increased support needs prevailed, and attitudes grew significantly. The present study used the above research but conducted the analysis for groups of men and women. Descriptive statistics and complex structural equation modeling were used for the analysis. Gender differences in acceptance of IoT technology were identified. Women showed greater acceptance, trust, and security awareness compared with men. More women than men were interested in and accepted IoT technology. Both genders disagreed with surveillance. Women indicated more trust in technology, but men were the ones who had more trust in IoT sensors placed in parking spaces. Women were significantly more supportive of data collection by IoT sensors to help vulnerable people. They were more supportive of data collection for environmental purposes than men. In all cases, the variance of men’s responses was greater than women’s.
Structural models for men and women explained more than 50% of the variance and confirmed the observations of the descriptive statistics. Women were more supportive of the introduction of IoT technology into smart cities than men. Men were more cautious and conservative. The use of technology to help people with disabilities and for environmental purposes did not have as significant an impact on them as it did on women. Perceived usefulness was the primary factor that increased trust, safety, and environmental support in both groups, which in turn promoted acceptance. Safety and environmental support were key mediators. For both genders, perceived security influenced the acceptance of data collection by IoT devices; the influence was stronger in the men’s group.
The research presented here has many limitations. The research was not representative, because a large enough sample of residents was not surveyed, but the structure of the respondents matched that of the urban population. A larger, representative survey sample would have allowed for more detailed conclusions. While this study primarily focused on gender differences, we recognize that additional demographic factors, such as age, education level, technological experience, and socioeconomic status, could further enhance the model’s explanatory power. Incorporating these variables in future research would allow for more precise isolation of gender effects and minimize potential confounding influences. A more comprehensive analysis including these factors could provide deeper insights into the determinants of IoT acceptance in smart cities, leading to more targeted and practical policy recommendations. The analysis focused on gender differences in the perception and acceptance of IoT technology. For a complete picture of public acceptance, it would be useful to analyze the survey sample across other demographic cross-sections. The model explains only a little more than 50% of the variance, so it would be worth supplementing the model with other variables.
Further research should address the reasons for gender differences and explore other demographic factors that may affect IoT acceptance. The results of this study suggest that IoT technology acceptance in smart cities is influenced by trust and safety perceptions and its perceived contribution to sustainability [
56]. Given the strong public support for pro-environmental applications of IoT, there is an opportunity to leverage this acceptance to promote energy-efficient solutions such as AI-powered demand-side management, adaptive street lighting, and IoT-enhanced energy storage. Future research should explore the direct relationship between IoT acceptance and energy applications and potential differences in public perceptions of smart energy systems versus other urban IoT solutions. This can help develop more inclusive and effective solutions for smart cities. In addition to examining the differences between men’s and women’s perceptions of IoT technology, it is worth assessing the differences between groups distinguished by education, age, and urban needs. This will further help design cities to the needs of all residents. Such studies are worth conducting over an extended period of time, so that changes in perceptions of the technology and responses to the information message can be observed. As the models adopted in the study explained a little more than half of the variance, it is worth supplementing them with other variables such as urban quality of life, public safety, sustainability, environmental protection, and general urban living conditions. Such studies are also worth conducting in multiple cities and regions to obtain a comparison and information on how the local context affects residents’ perceptions of technology. The research presented here was only about IoT technology. Many other technologies such as artificial intelligence and blockchain are currently being applied to smart cities. Also, knowledge of the acceptance of these technologies can be useful for city governments.


