Article

Prospective Design and Evaluation of a Renewable Energy Hybrid System to Supply Electrical and Thermal Loads Simultaneously with an Electric Vehicle Charging Station for Different Weather Conditions in Iran

by
Hossein Kiani
1,
Behrooz Vahidi
1,
Seyed Hossein Hosseinian
1,
George Cristian Lazaroiu
2,* and
Pierluigi Siano
2,3
1
Department of Electrical Engineering, Amirkabir University of Technology (Tehran Polytechnic), Tehran 1591639675, Iran
2
Department of Power Systems, National University of Science and Technology POLITEHNICA Bucharest, Splaiul Independenței Street No. 313, 060042 Bucharest, Romania
3
Department of Management and Innovation Systems, University of Salerno, 84084 Fisciano, Salerno, Italy
*
Author to whom correspondence should be addressed.
Smart Cities 2025, 8(2), 61; https://doi.org/10.3390/smartcities8020061
Submission received: 4 March 2025 / Revised: 28 March 2025 / Accepted: 1 April 2025 / Published: 7 April 2025
(This article belongs to the Special Issue Energy Strategies of Smart Cities)

Abstract

:

Highlights

The paper deals with the analysis of nine real locations for implementing hybrid renewable energy sources in the presence of an electric charging station to simultaneously cover electrical and thermal loads.
What are the main findings?
  • Planning and functioning of hybrid renewable energy sources in different locations function of main grid presence, available local renewable energy sources, and small-scale classical sources to balance simultaneously electrical and thermal loads.
  • Modeling and optimization of nine location designs for electric vehicles charging stations under specific renewable energy sources locally available.
What is the implication of the main finding?
  • Optimal configuration of EVs in planning hybrid renewable energy systems.
  • Analysis of proposed various configurations under different climate conditions: cold/mountain, hot/arid climate, hot/humid, moderate/sea climates.

Abstract

The global demand for transportation systems is growing due to the rise in passenger and cargo traffic, predicted to reach twice the current level by 2050. Although this growth signifies social and economic progress, its impact on energy consumption and greenhouse gas emissions cannot be overlooked. Developments in the transportation industry must align with advancements in emerging energy production systems. In this regards, UNSDG 7 advocates for “affordable and clean energy”, leading to a global shift towards the electrification of transport systems, sourcing energy from a mix of renewable and non-renewable resources. This paper proposes an integrated hybrid renewable energy system with grid connectivity to meet the electrical and thermal loads of a tourist complex, including an electric vehicle charging station. The analysis was carried on in nine locations with different weather conditions, with various components such as wind turbines, photovoltaic systems, diesel generators, boilers, converters, thermal load controllers, and battery energy storage systems. The proposed model also considers the effects of seasonal variations on electricity generation and charging connectivity. Sensitivity analysis has been carried on investigating the impact of variables on the techno-economic parameters of the hybrid system. The obtained results led to interesting conclusions.

1. Introduction

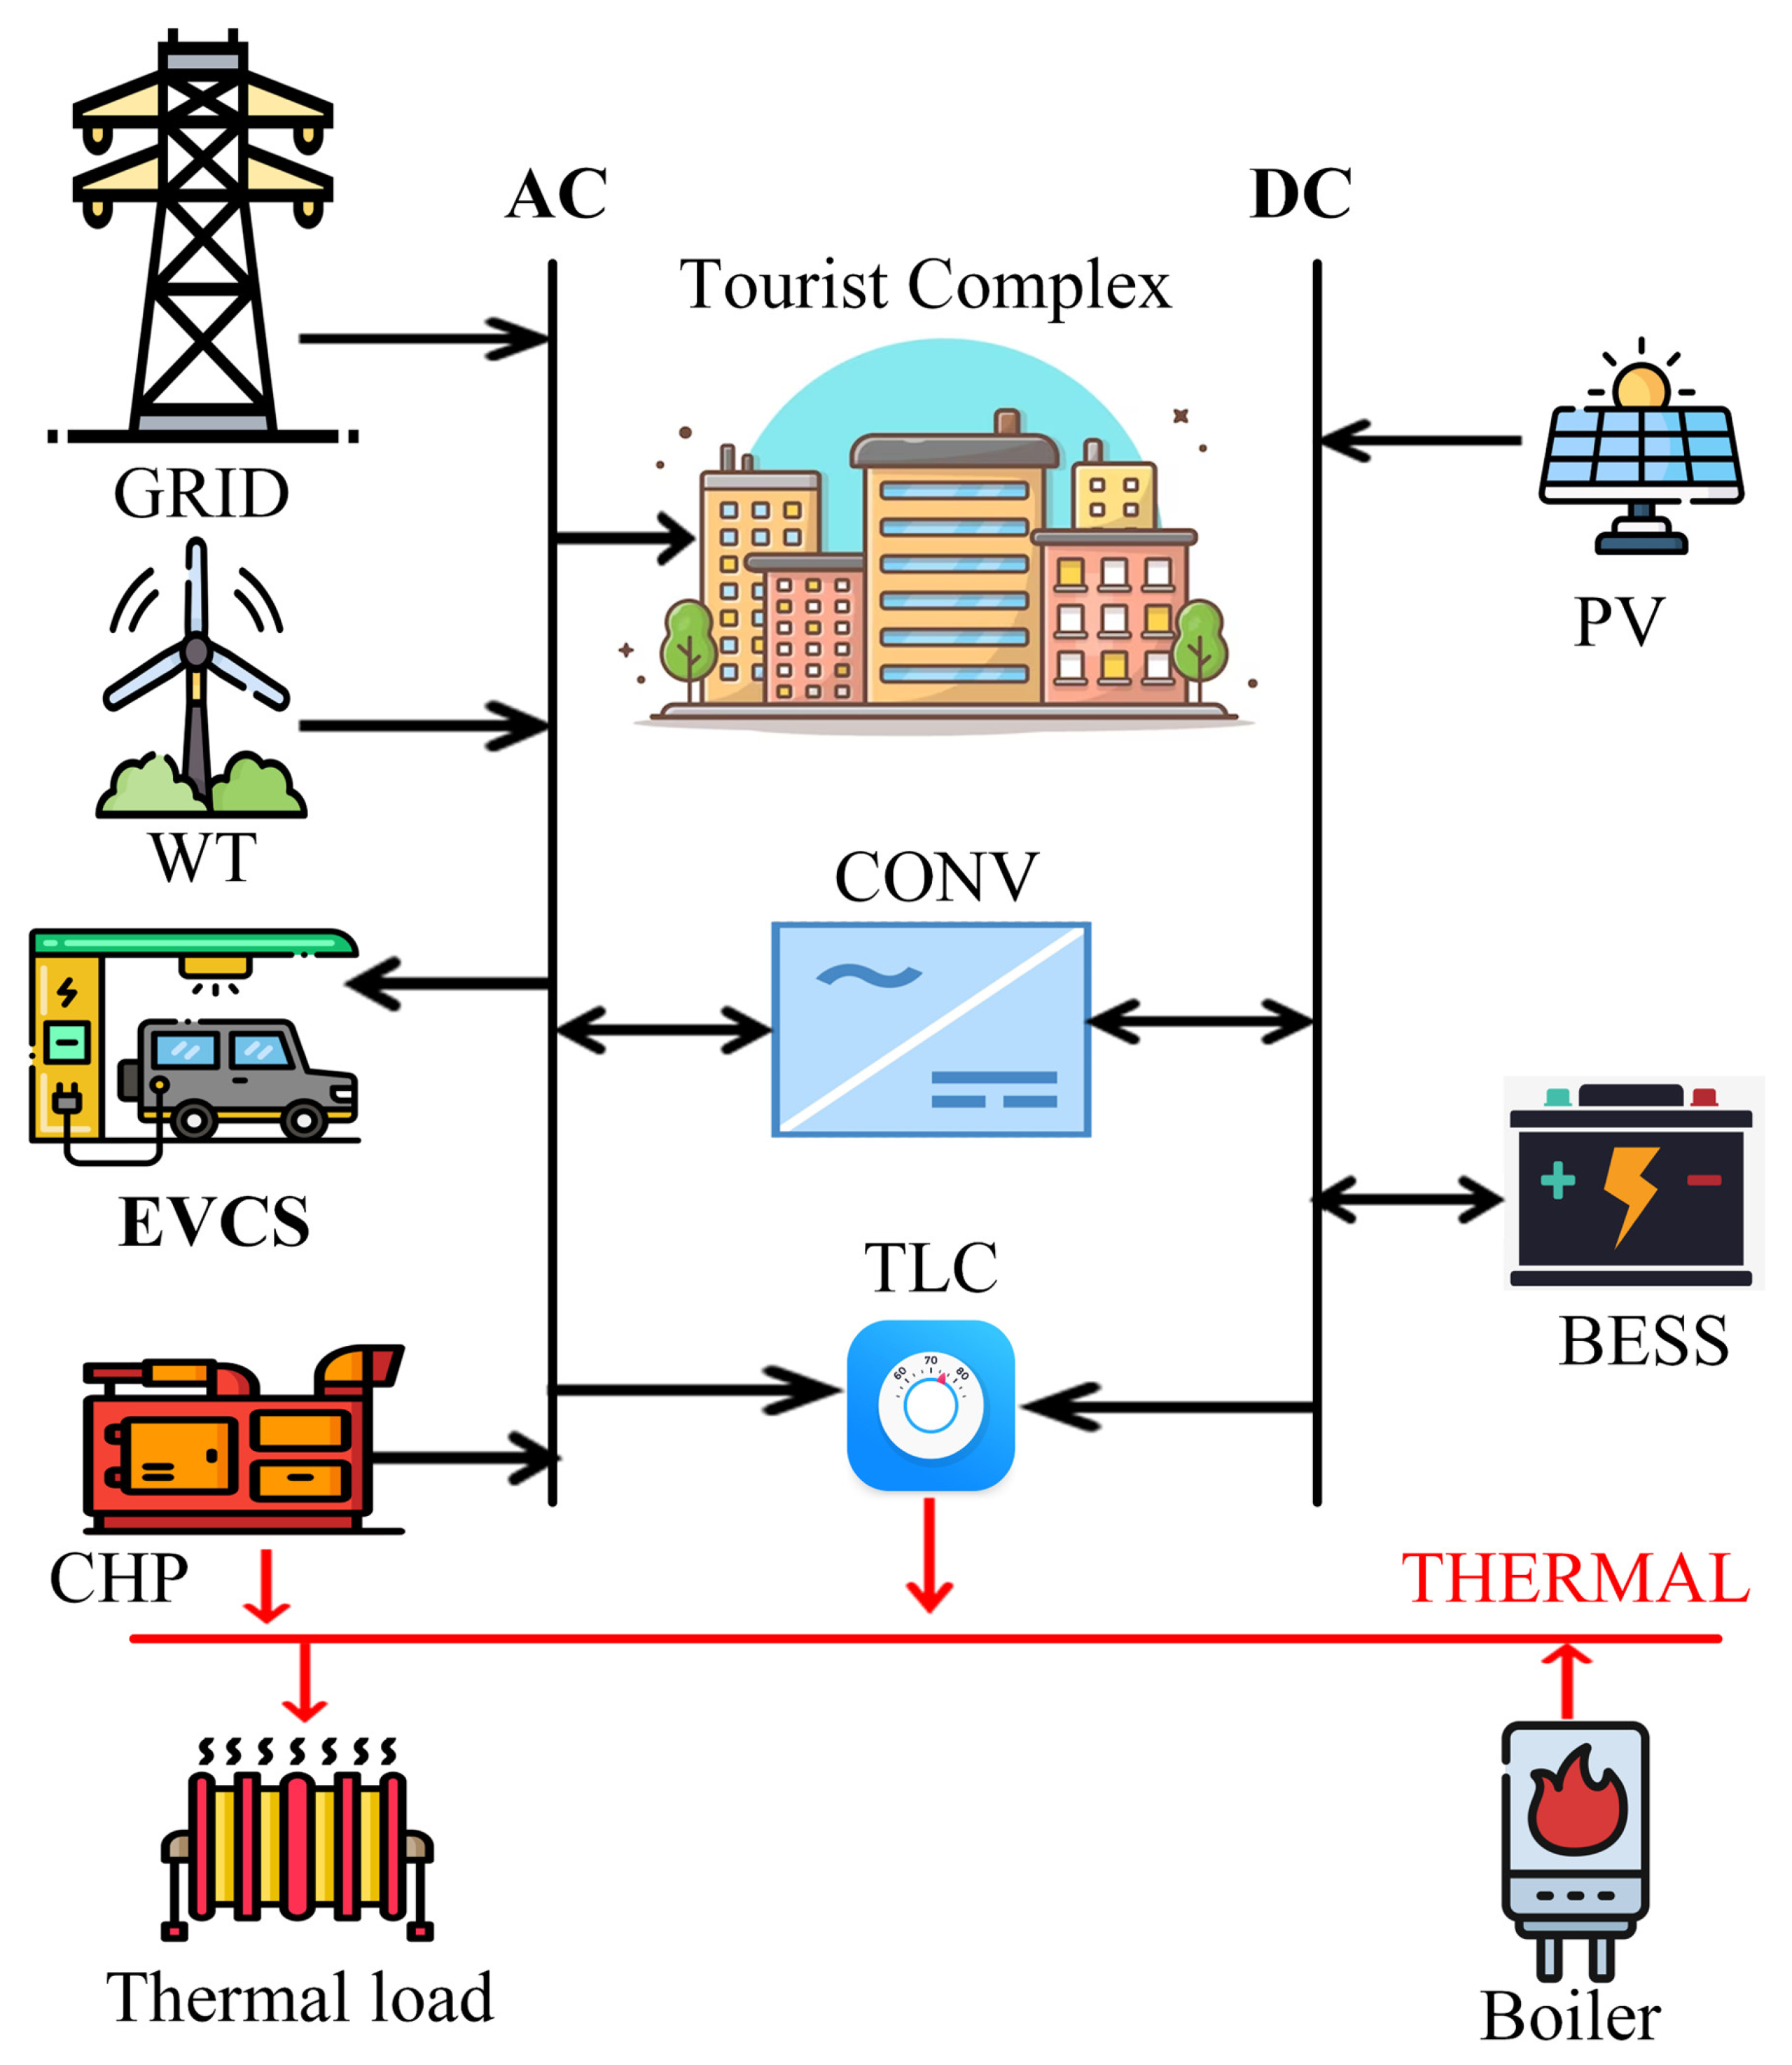
1.1. Microgrid Configuration and Architecture

1.1.1. Hybrid Renewable Energy Sources

In recent years, population increase and technological advancements have significantly increased energy consumption, particularly in the electricity sector [1,2]. Currently, a substantial portion of the world’s electricity is generated from fossil fuels [3]. However, due to economic and environmental concerns, these sources are insufficient to meet future energy demands [4]. In this regard, Figure 1a offers a comprehensive breakdown of Iran’s in 2022 primary energy resources, highlighting that fossil fuels account for nearly 99% of the country’s total energy supply. In parallel, Figure 1b illustrates the energy sources utilized for electricity generation, revealing that 94% of Iran’s electricity is generated from fossil fuel-based power plants, primarily gas and steam turbines, while only 4% is derived from renewable sources such as wind, solar, and hydroelectric power. Furthermore, a detailed analysis of Iran’s final energy consumption is presented in Figure 1c, which highlights that the residential, industrial, and transport sectors represent the largest consumers of energy. Finally, Figure 1d elaborates on the final electricity consumption, indicating that the industrial, residential, and commercial sectors collectively account for the highest electricity demand [5]. Renewable energy sources (RESs) have emerged as viable alternatives to fossil fuels [6]. However, when used independently to supply local loads, they pose challenges including high venture costs and low supply security due to their intermittent and unpredictable nature. To overcome these limitations, a new concept called hybrid RES (HRESs) has been introduced [3,4,7]. HRESs integrate RESs, traditional energy sources, and energy storage systems to supply local loads in both contexts of grid-connected and stand-alone modes. In the stand-alone mode, HRESs are particularly useful in remote and rural areas, where the mains supply is difficult to extend. When renewable generation falls short of demand, backup sources provide an additional supply, while excess RESs can be stored in the storage systems for future use. This combination offers higher security of supply compared to standalone RESs [8,9]. In the grid-connected mode, HRESs are commonly used in places such as cities, hospitals, universities, and factories. In this setup, HRESs can withdraw energy from the grid and charge storage systems when grid electricity prices are low and then meet local demand or sell excess energy back to the grid during periods of high electricity prices function of HRES benefit strategies [10]. As a result, HRES provide greater economic benefits than standalone RES systems. Furthermore, HRES enhance the penetration of RES and reduce the cost of energy (COE), reducing GHG emissions, and improving electricity access in remote and rural regions. These characteristics align with the three pillars of sustainable development: economic, environmental, and social [4,11,12]. One of the main challenges in implementing HRES is optimizing the system components and determining the capacity of renewable energy sources, like wind turbines (WTs) and photovoltaic panels (PVs), of storage systems, and of generators and converters to minimize the operational costs or maximize the owner benefits under various operating and capacity constraints. Various optimization tools and methods have been proposed in the literature to address this challenge and for planning HRESs [13,14].

1.1.2. Electric Vehicle Charging Stations

Currently, most passenger vehicles in Iran are internal combustion engine vehicles (ICEVs), which are significant contributors to GHG emissions, leading to environmental concerns and accelerating climate change. The transportation sector is responsible for almost 24% of all CO2 emissions, with passenger vehicles contributing 45.1% and road freight vehicles 29.4% of the total CO2 emissions [15]. The rising prevalence of fossil-fuel-powered vehicles and their environmental impact have driven countries to consider alternative fuel vehicles, including fuel cell, biodiesel, compressed natural gas-based vehicles, hybrid electric vehicles (EV), plug-in hybrids, and battery EVs (BEVs) [16,17]. Among these, BEVs have gained prominence due to advancements in battery technology and subsequent decreases in unit costs, which have greatly expanded their market share [18]. The shift towards EVs has reshaped consumer preferences and stimulated developments in EV infrastructure, especially regarding the placement of electric vehicle charging stations (EVCSs) and the integration of RESs [19,20]. Strategically locating EVCSs is essential for supporting the widespread adoption of EVs and fostering sustainable transportation systems. Various factors must be considered when selecting EVCS locations [21,22], including accessibility, population demographics, traffic patterns, and grid infrastructure. In urban settings, factors such as traffic congestion, grid stability, population density, and rental costs often affect EVCS siting, whereas along highways, additional criteria like accessibility, coverage area, rest facilities for travelers, and RES integration come into play [23,24]. Incorporating RESs into EVCS infrastructure offers a valuable opportunity to support environmentally sustainable mobility and is central to EVCS site selection [25,26]. Using RESs such as solar and wind not only reduces the carbon footprint of EVCSs but also strengthens grid resilience and promotes energy independence [27]. Moreover, integrating renewables at EVCS sites reduces demand on the grid, which helps prevent potential overload [28], and supports participation in peakshaving and demand response programs under fluctuating demand or electricity prices [29]. This approach enhances grid sustainability and resilience, particularly when paired with energy storage systems [30]. Additionally, using RES can optimize energy consumption and reduce long-term charging costs [31].
In this regard, one of the most widely used instruments for optimal sizing of HRES components is the HOMER software, developed by the National Renewable Energy Laboratory (NREL) in the United States [10].

1.2. Literature Review

1.2.1. Hybrid Renewable Energy Sources

Ref. [32] investigated the viability and capacity of implementing a microgrid in the Shad-Abad industrial estate located in Tehran, Iran. The study had three primary objectives: ensuring the secure and dependable operation of CNC machines, minimizing the expenses associated with constructing and operating the microgrid, and optimizing the utilization of RESs to decrease air pollutants, notably CO2. The primary aim of [33] was to introduce a novel hybrid system including integrating diesel and battery and RES technologies to meet the energy demands of a rural area located in the Gobi Desert of China. The key optimization objectives included minimizing load probability loss, reducing CO2 emissions, and optimizing the annual cost of the system. Additionally, an enhanced iteration of the elephant herd algorithm was employed for the optimization process. Ref. [34] examined two system designs and compared them with the unconnected setup. These interconnected systems included elements like WTs, PVs, battery banks, DG, or diesel-based CHP units, boilers, and thermal storage tanks. The study identified the optimal setup considering various combinations of key factors such as RES intensity, thermal to ED ratio, and diesel fuel price. Ref. [35] investigated the capacity to meet the combined electricity and TL requirements of a stand-alone community using different hybrid system configurations. These configurations used solar PV, WT, micro gas turbine (MGT), and lithium-ion battery technologies. The examination involved the utilization of surplus energy, reclaimed waste heat, and diverse power management strategies utilizing the HOMER software. The objective of the research was to suggest a pragmatic model for developing RESs suitable for various climates in Iran, with a specific focus on a tourist building. The model incorporated boilers fueled by NG and a geothermal heat pump to effectively meet the TL requirements of the building [36]. The study proposed an efficient strategy formulation for optimizing a grid-connected HRESs, considering the growth rates of both electric and TLs. The optimization process employed the HOMER software [37]. The paper introduced a multi-objective planning approach using fuzzy decision making for an islanded hybrid system (IHSs) that incorporates RESs, CHP, boilers, electric, and Thermal Energy Storage Systems (TESSs). The primary objective of the framework was to minimize both the total annual operating costs and the pollution generated by the system [38]. In [39], an optimal power planning and techno-economic-environmental analysis of an HRES has been designed to simultaneously meet electrical and thermal loads. The goal was to minimize GHG emissions, cost of energy (COE), and annual net present costs (NPCs). In [40], a novel heuristic optimization technique was introduced, proposing a transactive approach for deliberate pricing of DERs within distribution networks. The optimization concentrates on minimizing both the overall network loss and GHG emissions. The paper highlighted social indicators, such as job creation and social acceptance, alongside traditional economic, technical, and environmental criteria when designing HRES [41].
In [11], the techno-economic feasibility of a stand-alone HRES, incorporating solar, wind, biogas, syngas, and hydrokinetic energy with battery storage, was examined for powering a university campus in India. In [42], the authors advocate for the technical planning and deployment of VRE systems across different regions within an HRES. The system can model both centralized and decentralized VRE scenarios.

1.2.2. Electric Vehicle Charging Stations

In [43], the behavior of urban drivers in determining the location and size of charging stations was analyzed, and strategies for the installation of various charger types were proposed. A lack of accessible and adequate EVCS infrastructure serves as a psychological barrier to the widespread adoption of EVs. To promote the integration of EVs into the mobility ecosystem, EVCS should be distributed uniformly and efficiently along highways [44]. In [45], a cost-minimization strategy for EVCS planning on highways in Germany was proposed, revealing the effectiveness of the method in different scenarios. In [46], the location and sizing of charging stations by considering urban traffic density and installation costs was optimized. In [47], a collaborative planning investigation is undertaken regarding grid-connected PV and storage microgrids with EV integration across diverse scenarios, employing the HOMER software. This study evaluated the microgrid economics using NPC and levelized COE as indicators in multiple scenarios. Additionally, CO2 emissions and the fraction of RES served as indicators for assessing the environmental impact and cleanliness of the microgrid. Ref. [48] employed a Multi-Objective Particle Swarm Optimization (MOPSO) algorithm to examine the optimal assessment of microgrid resources in two different conditions, considering the presence or absence of an electric vehicle. Furthermore, the uncertain behavior of the electric vehicle was assessed using Monte Carlo simulation. The research proposed deploying an HRES combining PV, WT, and battery technologies, connected to the grid to product electricity for supermarkets situated in three different cities in Morocco. Additionally, EV charging stations were incorporated into the parking lots of these supermarkets [49]. The proposed HRES, utilizing these three battery technologies—lead-acid (LA), zinc-bromine (ZnBr), and lithium-ion (Li-ion)—were compared based on system size, economic considerations, technical performance, and environmental sustainability [50]. The study discussed in [51] explored the techno-economic viability of an EVCS, taking into consideration the presence of RESs across six locations that represent varied geographic and climatic conditions in Nigeria. The research investigated the optimal power planning for a self-contained HRES. The system was designed to concurrently meet both electrical and TDs. Additionally, the study examined an EV parking lot (EVPL), considering both non-smart and smart charging strategies [52]. The aim of the study was to evaluate the technical and financial viability of EVCSs powered by both RESs and grid energy. By optimally sizing system components, the study sought to establish an environmentally sustainable charging infrastructure, minimizing the levelized electricity costs and total net present costs [53]. Ref. [54] investigated various setups of HRESs suitable for charging EVs in Abu Dhabi, UAE. Additionally, the suggested battery-grid-PVs-WT system exhibited the highest integration of RESs and led to decreased CO2 emissions. In the investigation detailed in [55], a WT-PV hybrid energy EVCS is conceived and optimized using HOMER. The sizing approach is adaptable for implementation globally. Ref. [56] discussed the environment-centric optimal design of an EVCS that integrates photovoltaic energy with ESSs. The study not only considered battery features and their role in life cycle emissions but also minimized carbon emissions during the charging process. The optimization process involved a multi-objective GA for determining the optimal quantity of electric power supply equipment and a MILP algorithm. Ref. [57] examined the design and performance assessment of an EVCS utilizing hybrid energy at four sites Denmark. The proposed EVCS was evaluated using the HOMER software, considering the integration of DERs and diesel generators. Techno-economic performance parameters, CO2 emissions, and fuel consumption were analyzed and compared across the four locations. Ref. [58] employed algorithms, MOPSO and the Non-Dominant Sorting GA II (NSGA-II), to develop five distinct case studies (CSs) incorporating DERs, Demand Response Programs (DRP) and EVs, aimed at minimizing life cycle cost (LCC), loss of power supply probability (LPSP), and CO2 emissions. Ref. [59] explored an EV workplace charging station featuring a hybrid system incorporating a flywheel and photovoltaic (FL-PVHS). The study focused on optimizing the sizing and operational costs of the HRES to enhance the appeal and cost-effectiveness of integrating these DERs. Ref. [60] introduced a holistic framework aimed at encouraging renewable energy project owners and presents three categories of incentives: capital-driven, production-oriented, and grid assistance incentives. The objective was to minimize NPC, taking into account power balance and grid constraints. Ref. [61] conducted a review of diverse optimization algorithms applied in the design of EVCSs, specifically focusing on Renewable Generation Sources (RGSs) in both grid-connected and off-grid energy systems. Ref. [62] integrated and optimized a combined power supply system comprising solar and wind energy sources, alongside backup and storage equipment such as a DG and a BESS with DRP. The objective was to enhance the reliability of sustainably meeting load demand. The research focused on optimizing and evaluating the cost and benefits of these hybrid systems for stand-alone demand supply across four regions in Iran with varying climatic differences: Zahedan, Kerman, Birjand, and Hamedan. In [63], authors proposed an evolution-based approach for locating EVCSs in intercity networks, accounting for population, traffic density, and social network activity, and validated the approach using real-world data from the United States. Reference [64] aims to compare various real-world objectives, ranging from minimizing active power losses and voltage drops to maximizing EV profits, optimizing the balance between distribution grid power quality and VPP profitability through a bi-level modeling approach. In reference [65], the authors introduce an intelligent Type-2 Fuzzy Logic Controller (IT2FLC) designed to optimize Hybrid Microgrid (HMG) systems, particularly in the context of fluctuating renewable energy outputs and inconsistent EV charging behaviors, which may lead to grid instability and higher operational costs. In reference [66], the authors propose the systematic development of a Model-based Universal Controller (ULM) with an Enhanced State Observer (ESO) to address issues such as frequency deviation, specifically for controlling the Load Frequency Control (LFC) in a Multi-Microgrid (MMG) including EVs. The authors in [67] propose a robust dynamic load alteration attack manipulating EV loads to destabilize the power grid, formulated using feedback control theory and linear matrix inequalities (LMIs), incorporating grid uncertainties. In [68], researchers address the joint monitoring of the State of Charge (SOC) and State of Health (SOH) under constrained and insecure communication. A predictive framework is developed, integrating attack detection strategies using the intersection over union (IOU) of estimated and predicted ellipsoids. Furthermore, a brief overview of recent research details on IHRESs and EVCSs is given in Table 1.

1.3. Research Gap

Considering Iran’s energy structure, which was discussed in the introductory section, it is evident that the country’s energy system predominantly relies on fossil fuels. Given the critical challenges associated with fossil fuel consumption, including resource depletion, environmental pollution, and energy security concerns, as well as the global transition toward renewable, clean, and sustainable energy sources, conducting a study on the integration of hybrid renewable energy systems is essential. Moreover, considering the transportation sector’s heavy reliance on hydrocarbon-based fuels and its substantial contribution to climate change, implementing innovative strategies to mitigate this dependence is imperative. In this regard, integrating electric vehicle charging infrastructure within tourism complexes not only curtails the environmental footprint of the transportation sector but also serves as a pivotal step in establishing the technical and economic infrastructure essential for accelerating Iran’s energy transition.
In this regard, given the extensive demand for HRESs, addressing the challenge of optimal system design and energy management becomes imperative for the effective deployment of such systems. However, the existing literature reveals several identified gaps in this regard:
  • Typically, both electrical and thermal energy are consumed concurrently in various usage zones. Nonetheless, there is a limited amount of research addressing the concurrent provision of different types of energy, including renewables, within IHRESs. Heating requirements are frequently fulfilled using non-renewable sources like conventional boilers.
  • Furthermore, most studies examined only a restricted range of design possibilities, overlooking a comprehensive analysis of all potential designs.
  • As a pragmatic and effective approach for mitigating environmental pollution, the adoption of EVs is rapidly gaining traction in modern society. Since EV batteries require charging from the power grid, they should be regarded as a unique category of consumer and/or storage device. It is worth mentioning that the inclusion of EVs in the planning phase of IHRESs, considering diverse geographical and climatic factors, has received less attention in recent research endeavors.
  • Only a limited number of scientific papers have explored the influence of EV demand and charging patterns on the optimization of IHRESs design.

1.4. Contributions

Given the extensive demand for HRESs, addressing the challenge of optimal system design and energy management becomes imperative for the effective deployment of such systems. However, the existing literature reveals several identified gaps in this regard.
The analysis of existing literature reveals various control strategies and innovative concepts, with research focusing on addressing grid resilience through the integration of energy management techniques. Nevertheless, there exists significant potential for research and study in the techno-economic analysis of integrating a hybrid microgrid within the EV landscape. The paper outlines its primary contributions and research objectives as follows:
  • Suggesting an effective approach to plan the capacity and optimal functioning of a IHRESs linked to the grid, incorporating RESs, CHP, and a boiler. This system is designed to simultaneously fulfill the electricity and thermal requirements of a tourist resort complex, including the changing needs of EVs, all while minimizing the overall cost. This planning is executed through the utilization of HOMER GRID modeling and optimization tools.
  • Evaluation of the optimal design of IHRESs performance concerning different factors such as costs (NPC, energy cost, initial cost, and operating cost) and emissions (CO2 pollution, fuel consumption).
  • The research involves modeling and optimizing nine distinct designs for charging/refueling stations, considering the renewable resources accessible in the specified city.
  • A suggested optimal energy configuration for a dependable EVCS integrates renewable energy sources and a national network. The proposal is based on a thorough examination of various discrete locations chosen as case studies. To the authors’ knowledge, no prior study has explored such detailed and diverse considerations in the mentioned locations.
  • Among the strategies, one sample pertains to Ahvaz, sharing similarities in climate with Arab nations around the Persian Gulf. Additionally, another strategy focuses on Ardabil, mirroring the climate of countries such as Azerbaijan and Armenia. Consequently, this study offers a foundational framework applicable to multiple countries.
The article is structured as follows: Section 2 presents technical-economic and geographical data. Section 3 discusses the energy management system and optimization methods. Section 4 provides a comprehensive analysis of the impacts of each alteration on the survey results. Finally, a concise conclusion is offered in Section 5.

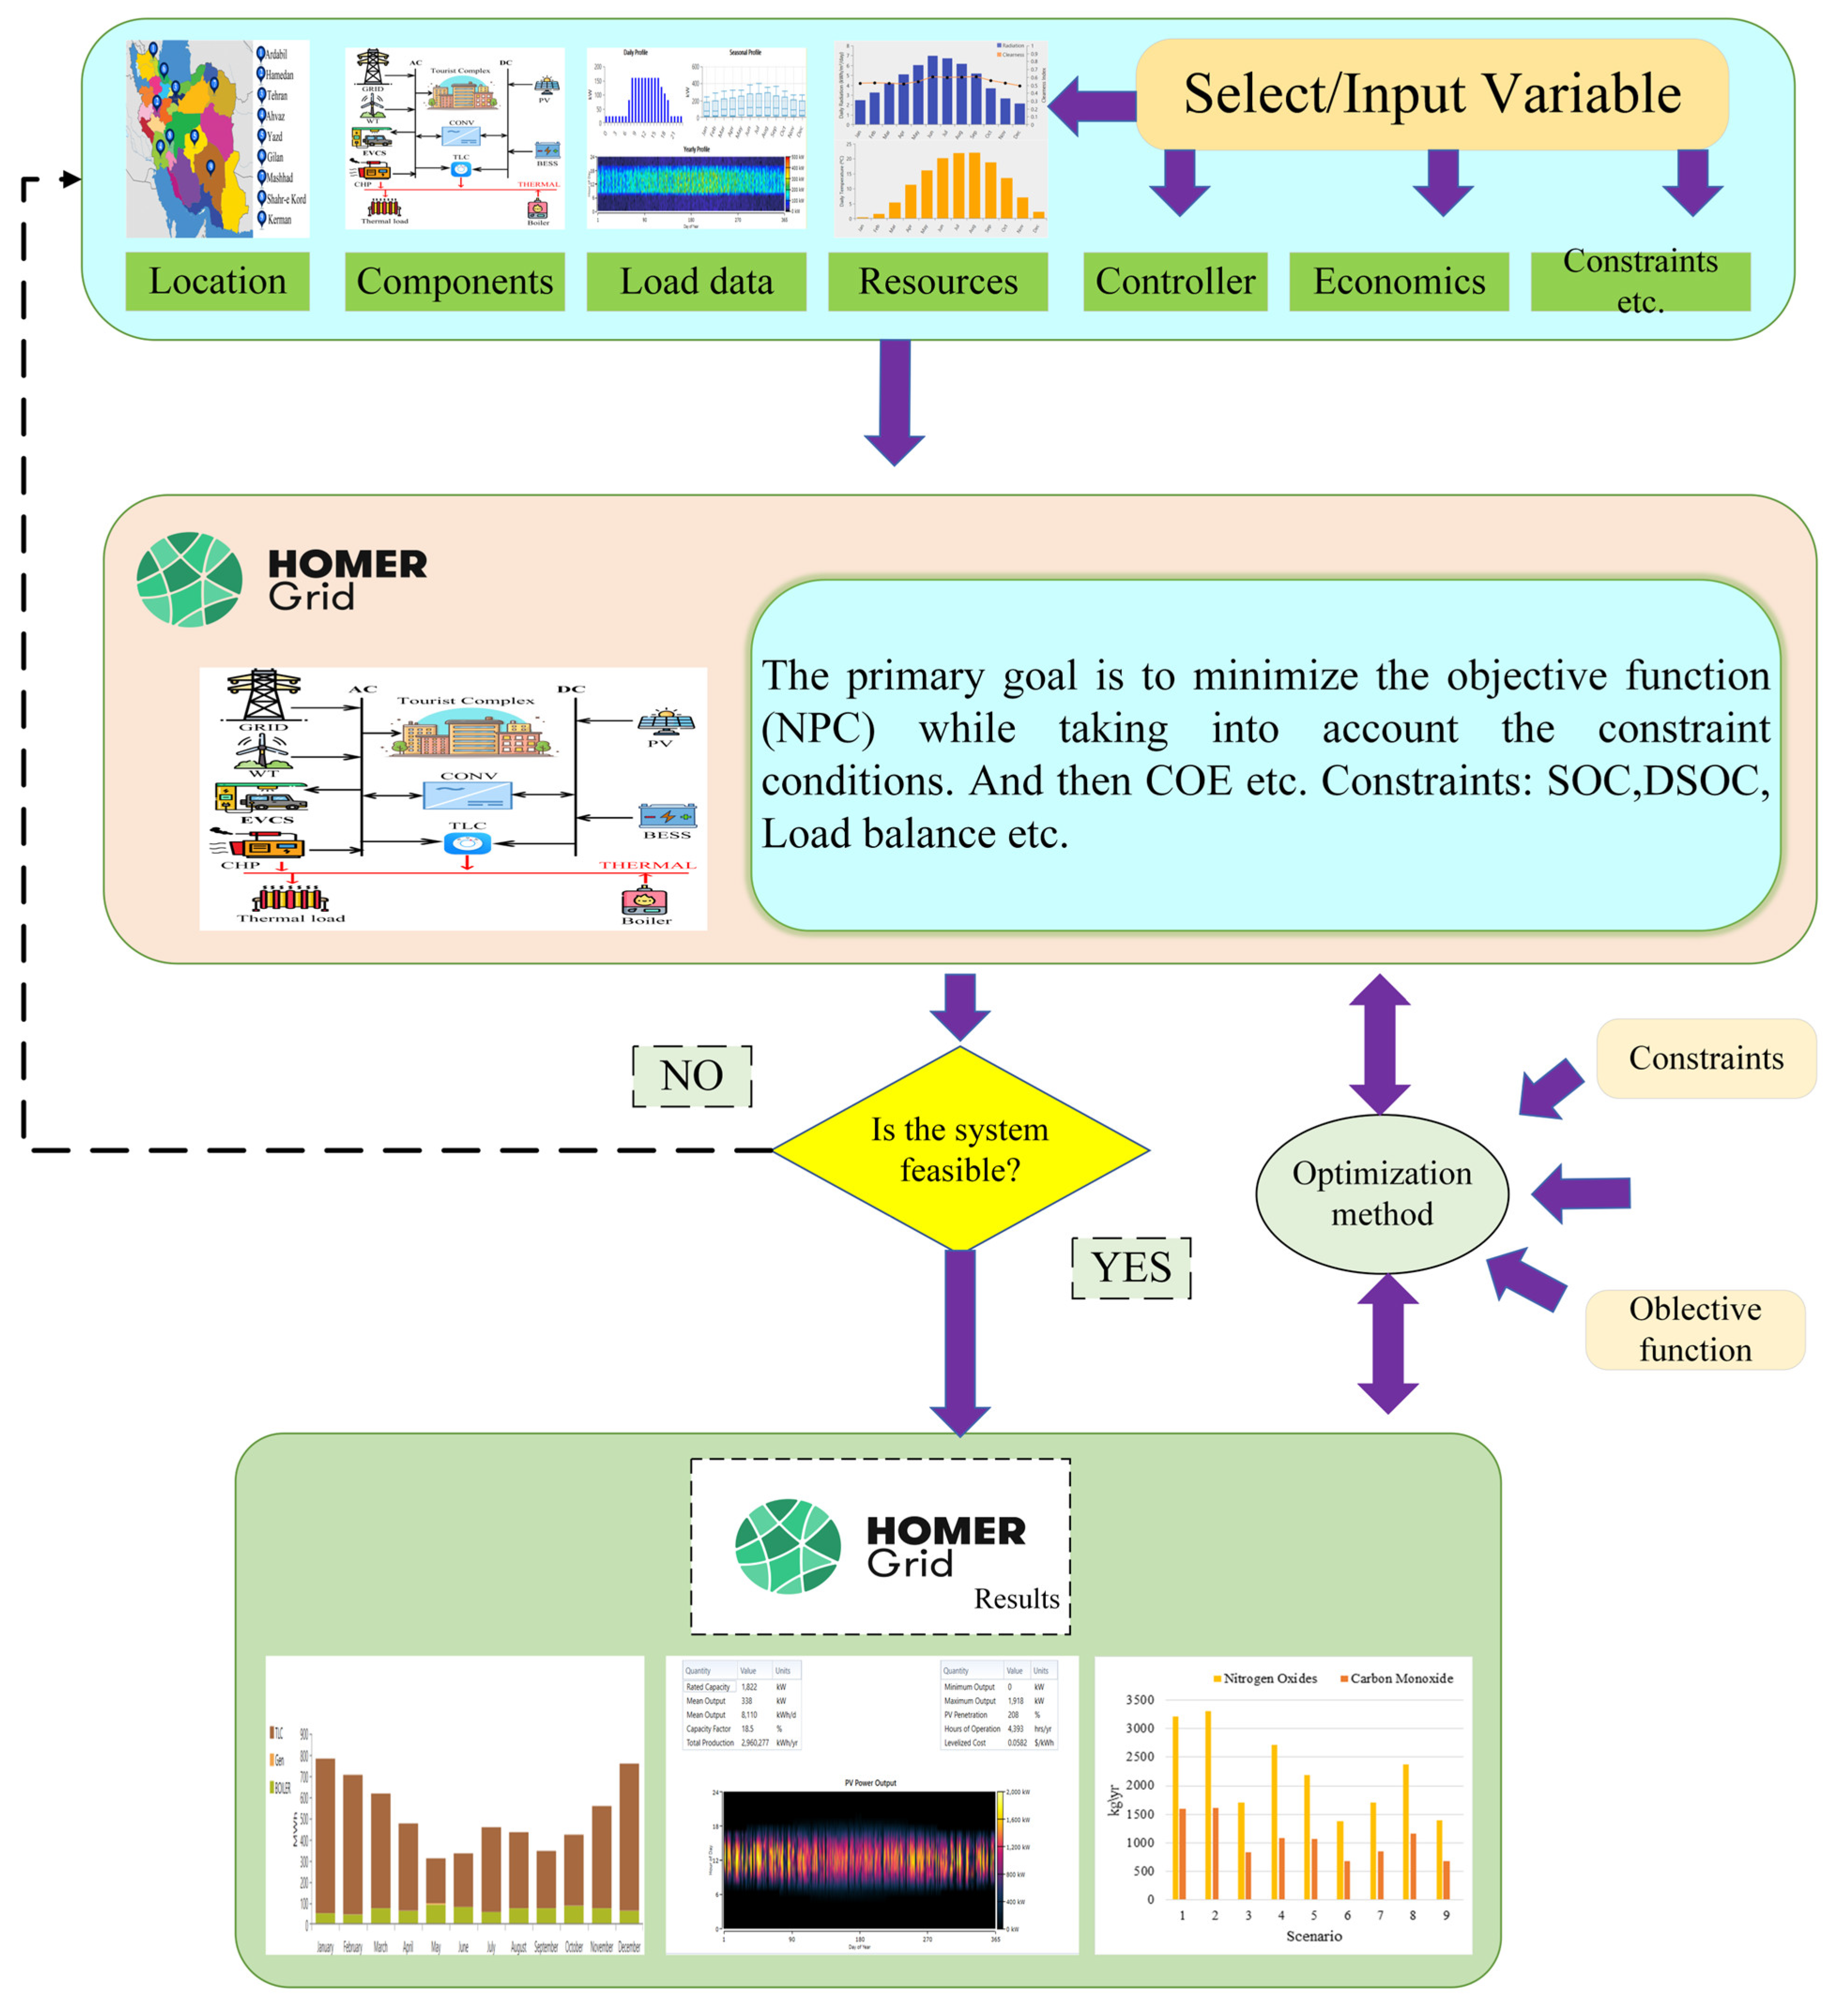
2. Methods and Input Data

The objective of this article is to perform a comprehensive analysis, encompassing technological, economic, and environmental factors, to explore the integration of renewable energies, either fully or partially, to fulfill the electricity and heat requirements, alongside assessing the performance of EVCS, using a hybrid energy setup for a medium-sized tourist complex. Also, the research employs the HOMER Grid software, developed by the NREL in the United States, employing its microgrid features along with grid search and private optimization techniques to evaluate the feasibility of the presented environmentally sustainable RES-based framework. The analysis process, depicted in a flowchart within the HOMER Grid software, along with the design outline, is illustrated in Figure 2.
The optimization assessment and achievements are based on various constraints, the objective function, and decision variables. As illustrated in Figure 3, the study considers nine locations in Iran for the proposed microgrid analysis. The evaluation and comparison of energy production, load supply, NPC battery SOC, Levelized Cost of Electricity (LCOE), initial project cost, project operating cost, and other factors are performed for each location. The proposed system architecture includes PVs, WTs, DG, BESSs, converters, boilers, TLC, and EVCS loads. The proposed system operates as a grid-connected system, as depicted in Figure 4. PV solar and WTs are prioritized due to their reliability among various RESs. DG contributes to system reliability; furthermore, the EVCS load is facilitated through an AC power outlet. This architecture integrates both AC and DC buses to supply the combined load, with a bidirectional converter regulating power flow between solar PV, WTs, batteries, and DG. Feasibility assessment and comparative analysis are conducted across different locations.

2.1. Input Location Data and Meteorology for IHRES
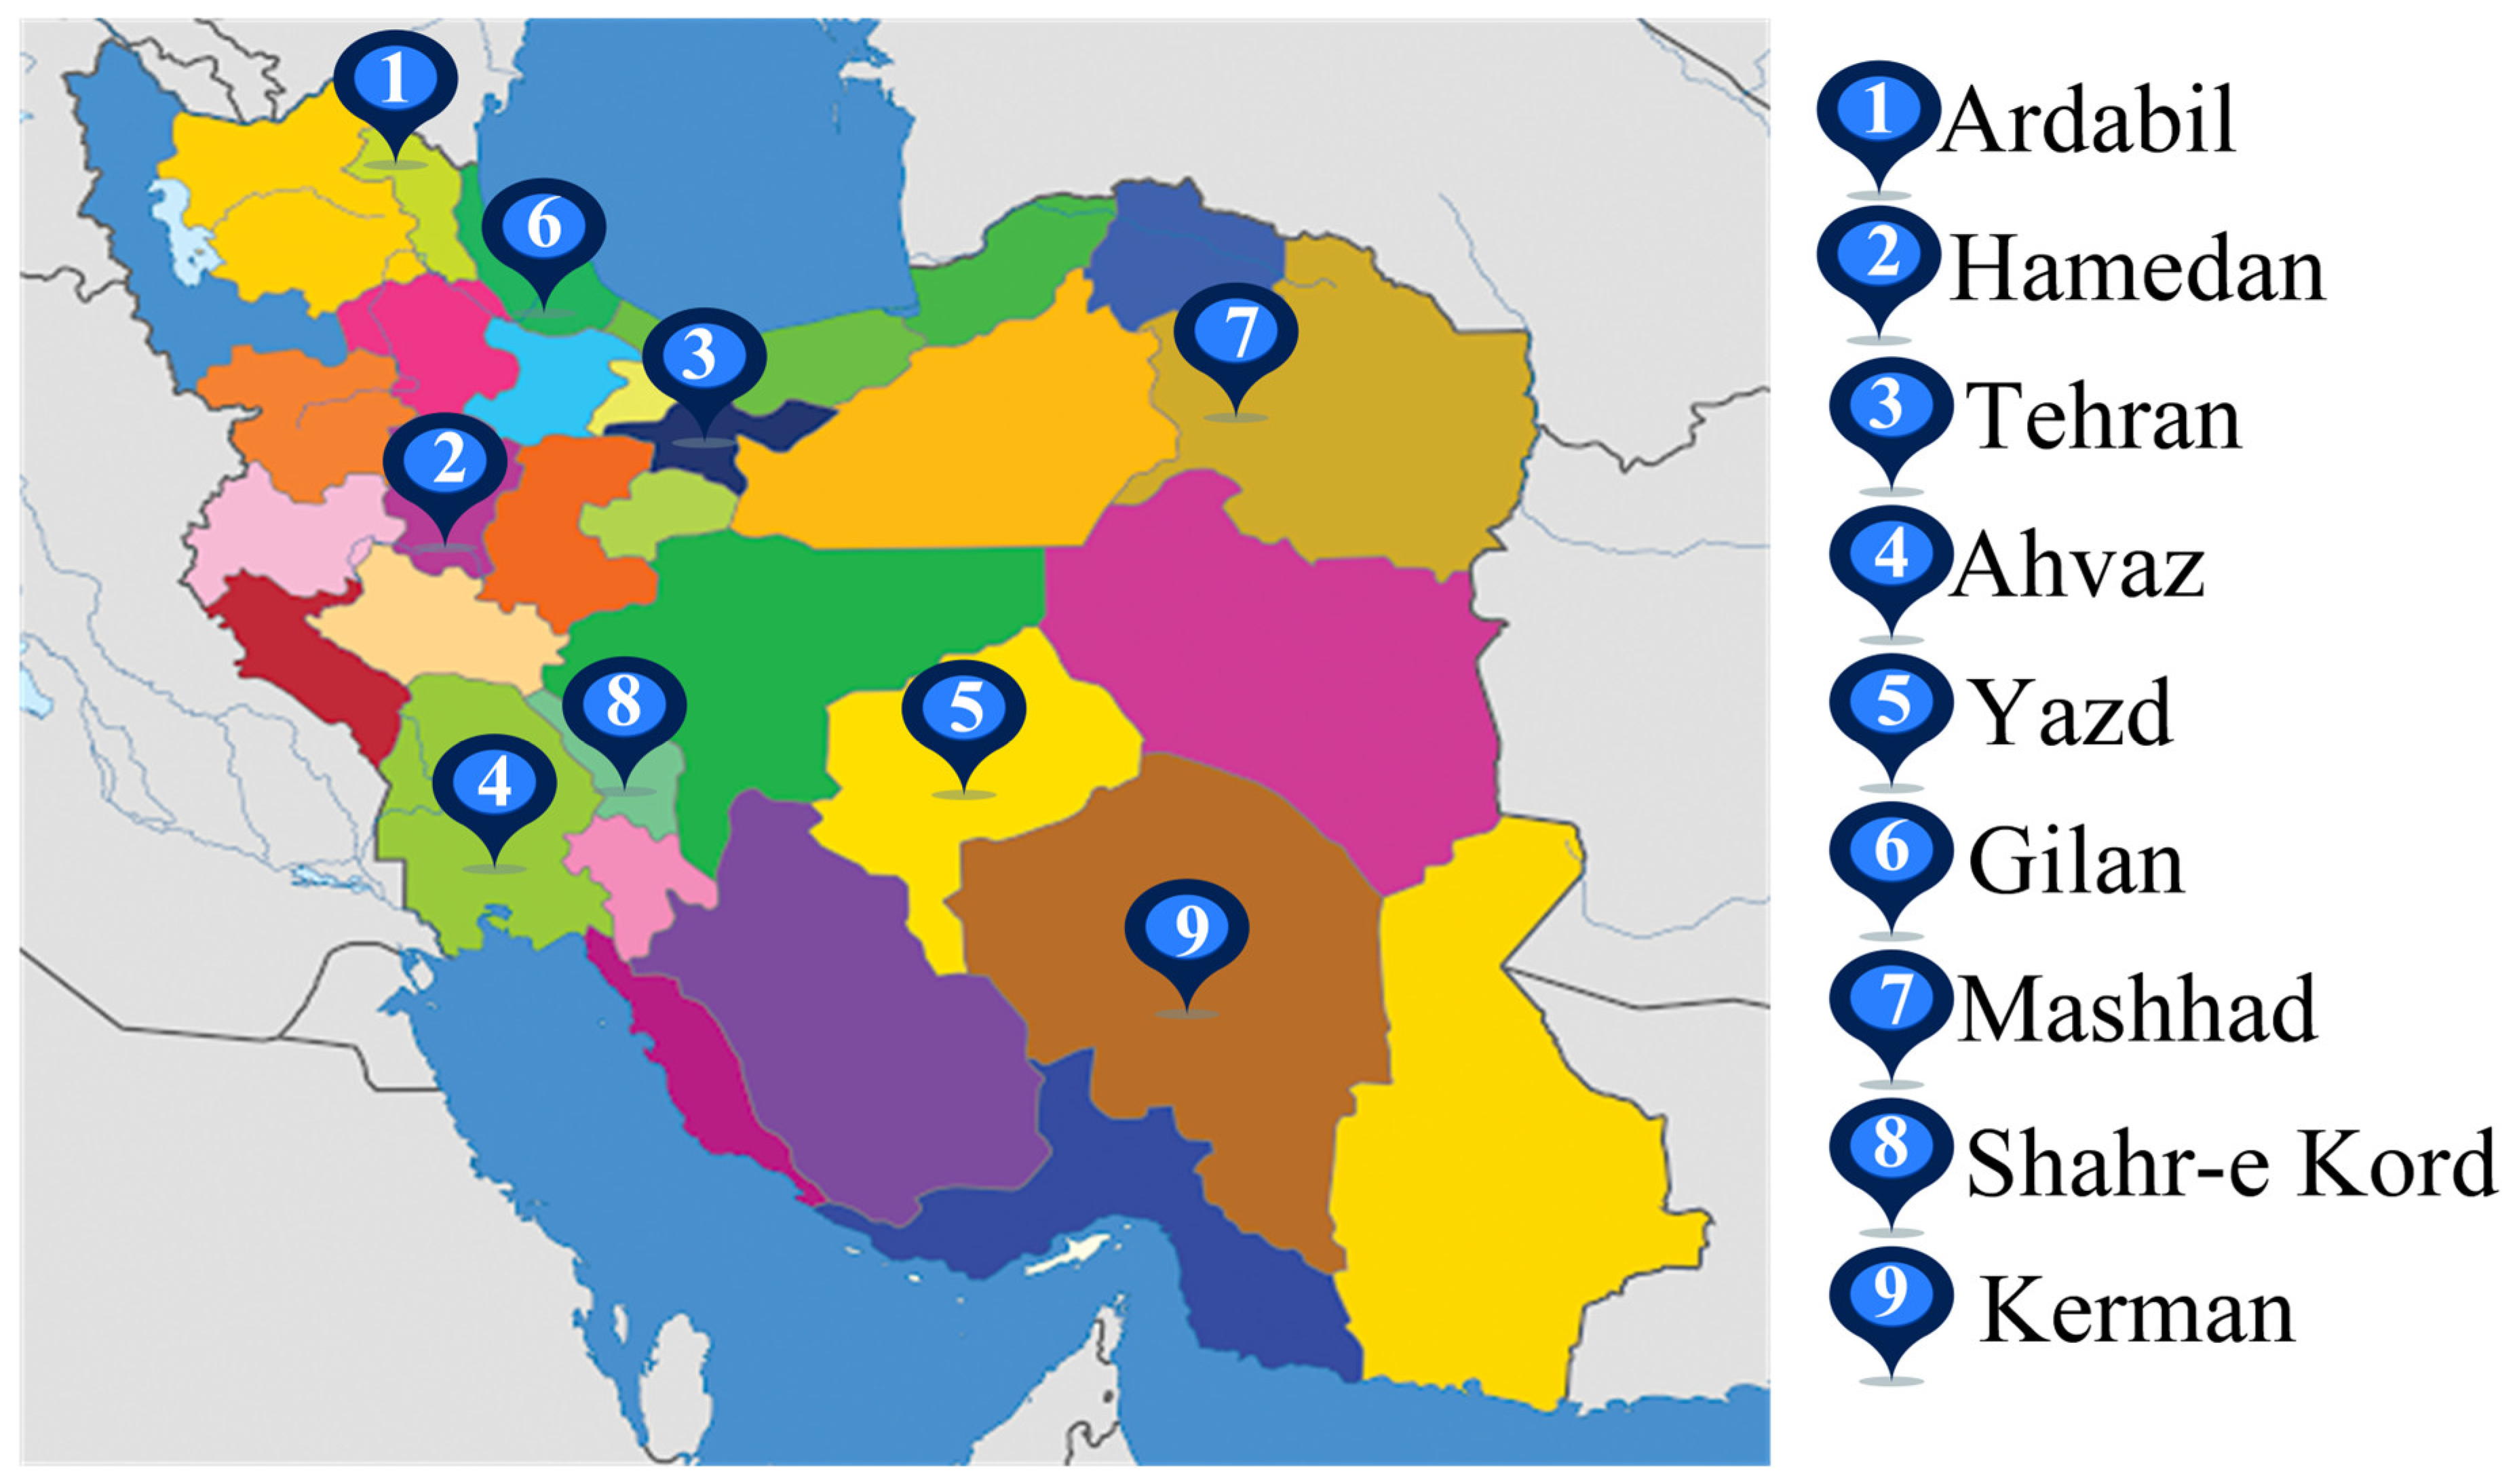
2.1.1. Location

As indicated in Figure 3, we have examined nine locations, including the following:
  • Ardabil, Hamadan, Shahrekord, and Mashhad (Binalud), characterized by cold and mountainous climates;
  • Yazd and Kerman, known for hot and arid climates;
  • Ahvaz, experiencing hot and humid conditions;
  • Gilan (Manjil), featuring a moderate and humid Caspian climate;
  • Tehran, with a moderate climate.
In this context, this study systematically evaluates diverse locations with distinct climatic conditions to assess their renewable energy potential. Ardabil, characterized by a cold and mountainous climate, exhibits substantial solar and wind potential during different months. Hamedan and Shahrekord share similar conditions but offer significantly higher solar irradiation, making them ideal for analyzing the impact of temperature variations on photovoltaic (PV) system performance. In this context, Mashhad benefits from both strong solar irradiation and considerable wind energy potential, particularly in Binalud, supporting a diversified combined HRES. Furthermore, Yazd and Kerman, located in Iran’s arid desert regions, provide high solar energy potential, facilitating a comparative analysis of temperature effects on the HRES energy mix relative to Hamedan and Shahrekord. In this regard, Ahvaz, with its hot and humid climate, is particularly suited for PV deployment, whereas Manjil in Gilan province stands out due to its exceptional wind energy potential, making it an optimal site for wind turbine integration. Lastly, Tehran, with its moderate climate, is evaluated as a suitable location for solar PV implementation.
This research highlights the influence of meteorological and geographical factors on the design, optimization, and feasibility of HRES configurations. By systematically categorizing regions based on their climatic attributes, the study provides critical insights for strategic energy planning and sustainable infrastructure development, enabling efficient utilization of renewable resources tailored to site-specific conditions.
Additionally, essential data regarding sunlight intensity and wind patterns are presented in Figure 5 [63] and Figure 6. Given the utilization of WTs and PVs within the proposed microgrid, the quantity of sunlight and wind speed (WS) are pivotal factors guiding the design of our system.

2.1.2. Meteorological Data

Figure 6 provides meteorological data such as WS, ambient temperature, and solar irradiance across various months of the year [69]. In Figure 6a, the selected study sites are depicted in relation to WSs. Furthermore, these locations undergo variations in average temperatures and solar radiation throughout the annual cycle. Figure 6b,c illustrate the daily temperature in degrees Celsius and solar radiation in kW hours per square meter, respectively.

2.1.3. Electrical and Thermal Load

This paper considered two different types of load, namely electric and TLs, for further simulations. As the hotel within the tourism complex is hypothetical, it is envisioned as a mid-range establishment with 60 rooms. Additionally, there are other areas within the complex that consume energy, such as corridors, the lobby, and the kitchen. The initial phase involved determining the dimensions and energy usage of the hypothetical hotel, a process elaborated in [70]. To calculate the overall energy consumption of the tourism complex, the average consumption of hypermarkets and other stores (approximately 600 kWh/day), derived from field studies, is incorporated into the hotel’s consumption.
Hotel   area = 100 × 60 = 6000   m 2 = 64 , 583.4   f t 2
Hotel   consumption = 14 × 64 , 583.4 365 = 2477.2   kWh day
Tourist   Complex   consumption = 3077.2   kWh day
A considerable proportion of the hotel’s TD comprises the provision of hot water, heating, and cooking amenities. The calculation of the building’s TL involved an assumption that the TD exceeds its ED by a factor of 1.5 [35]. Furthermore, the condition of power balance, considering the available resources and the determined load, is described in (4).
P P V t + P B E S S d c h t + P D G t + P W T t + P G R I D t = P L O A D t + P B E S S c h t           t [ 1 , 8760 ]
Figure 7 displays monthly patterns in EL and TL. As shown in Figure 7a, electric consumption peaks during warmer months, notably in July, with a consideration for a 10% daily load variation. In Figure 7b, it is evident that thermal consumption escalates in colder months due to the necessity for natural gas heating, while warmer months experience lower thermal consumption.
In this study, scaled data have been employed for both computational analysis and the representation of electrical and thermal loads. The scaling process involves multiplying each baseline data point by a common scaling factor, yielding an annual average value that aligns with the predefined target annual mean.
To determine this scaling factor, the scaled annual mean value is divided by the baseline annual mean. This approach ensures that the scaled dataset preserves the fundamental shape and statistical characteristics of the original data while differing in magnitude. By default, the scaled annual mean is equivalent to the baseline annual mean. Consequently, when these values are identical, the scaled and baseline datasets remain unchanged.

2.2. Component of the HRES

2.2.1. PV Array

PVs harness solar energy to generate electricity. Further, these sources are naturally intermittent and do not generate power at night when sunlight is unavailable. Earlier research indicates that PV systems have promising potential as RESs in Iran, given the nation’s annual average of over 280 sunny days, spanning more than 90% of its land area [39,70]. The output power of the array, accounting for Maximum Power Point Tracking (MPPT) efficiency and operational factors, can be calculated using (5) as follows [39,70,71,72,73,74]:
P P V = M p × M s × P mod u l e × η M P P T × η o t h
In this study, the impact of temperature on PVs has been examined to achieve more accurate results.

2.2.2. WT

WT systems capture the renewable energy of wind to produce electricity. Iran’s research priorities emphasize the advancement of WT systems. Various wind farms, such as those in Manjil and Binalood, have been established in suitable regions. This investigation also examines the potential use of WT systems as RESs for HRSs. The power output of the WT is determined by (6), where CWT represents the WT power coefficient, r is the air density (kg·m−3), and V indicates the instantaneous wind speed (m/s) [35]:
P W T = 1 2 × ρ × A × V 3 ( t ) × C W T × 10 3
Because wind speed varies considerably depending on weather conditions, the power output of the WT at time, t, denoted as PWT(t), is determined by a function of wind speed, as calculated using (7) [35]:
P W T ( t ) = 0 ,             V ( t ) V c u t i n   or   V ( t ) V c u t o u t P r V 3 ( t ) V c u t i n 3 V r 3 V c u t i n 3   , V c u t i n < V ( t ) < V r P r ,               V r < V ( t ) < V c u t o u t
Here, V(t), Vr, Vcutin, Vcutout, and Pr denote wind speed (m/s), rated wind speed (m/s), cut-in wind speed (m/s), cut-out wind speed (m/s), and rated power output (kW), respectively [35].

2.2.3. BESS

BESSs function as reserve energy sources, capable of storing surplus electricity generated by RESs and dispensing it as required. Due to their lack of emissions, they emerge as a practical substitute for alternative backup resources such as DERs, which releases GHGs. The output of the BESS can be calculated using the following expressions [71]:
0 P c h P R
0 P d c h P R
S O C min S O C ( t ) S O C max
S O C ( t ) = S O C ( t 1 ) ( 1 σ ) + P c h η c h Δ t P d c h Δ t η d c h

2.2.4. Disel Generator (CHP)

The system integrates a CHP unit to provide electricity during periods of low renewable generation while simultaneously recovering heat. The active power of the CHP unit (denoted as Pchp in kW) at hour, h, is examined as a decision variable, and its best value is identified by the solver based on the constraints. Equation (12) establishes a permitted range for changes, defining the operational boundaries. The thermal power (denoted as Hchp in kW) is determined by an index of the power, as expressed in (13). This expression incorporates efficiency parameters (ηto, ηloss, and ηheat) representing the turbine, losses, and thermal efficiency in the CHP, respectively. Since the CHP unit generates both electrical output and thermal output, operational limits are specified for each. Constraint (12) outlines the electrical operation limit, while Constraint (14) defines the thermal operation limit, considering the permissible range of changes in the CHP’s thermal power, where χchp represents the ratio of heating capacity to electrical capacity in the CHP. Expression (15) describes the annual fuel cost (operation) of the CHP, with FuelCchp representing the fuel demand price (in $/kWh), and αchp and βchp serving as coefficients for the fuel demand curve. Finally, the capacity limit (size) of the CHP unit is articulated in (16), with Pchp representing the maximum installable capacity for the CHP unit (in kW) [38]. Additionally, Table 2 outlines the maintenance schedule for generators.
0 P c h p ( h ) P c h p max
H c h p ( h ) = 1 η t o η l o s s . η h e a t η t o × P c h p ( h )
0 H c h p ( h ) χ c h p P c h p max
O p r C c h p = 365 × C F × h = 1 24 F u e l C c h p × α c h p P c h p max + β c h p P c h p ( h )
0 P c h p max P ¯ c h p

2.2.5. Boiler

A boiler is used to fulfill TD in cases where electric heating or storage is unavailable. Essentially, the boiler serves as a contingency heat source, capable of supplying any necessary amount of TL as required. It is presumed that the boiler operates on NG, which is the predominant type in regions with established NG infrastructure. The efficiency of the boiler is defined as 85%, and the gas price is considered as 0.03 USD/m2. The computation for determining the boiler’s power is carried out as outlined in [34]:
H b = L t h ( t ) η b
Furthermore, the calculation for fuel demand is detailed as follows [43]:
V f u e l = 3600 × H b L H V

2.2.6. Converter

Electric converters are pivotal components in hybrid energy systems as they enable power exchange between AC/DC and DC/AC. In systems integrating RESs and BESS, these converters are indispensable. This necessity arises from the fact that RESs and BESS typically produce DC power, whereas electric loads necessitate AC power. Consequently, this study centers on a bidirectional converter, which includes both a rectifier and an inverter, tailored to convert DC to AC power and vice versa. The efficiency of these converters can be delineated as follows [34]:
P I N V , O U T = η I N V P D C
P R E C , O U T = η R E C P A C

2.2.7. TLC

The TLC allows excess electrical generation to fulfill the demand on the thermal bus. In systems with a TL, the inclusion of a TLC is discretionary. Nevertheless, its absence results in unused surplus electrical production.

2.2.8. Electric Vehicles Charge Station (EVCS)

Because electric cars constitute a limited market in Iran, there are insufficient data available on the actual performance of charging stations. A dynamic visitation pattern takes place, varying between weekdays and weekends. The technical specifications of the EVCSs situated in the outskirts of the tourist complex are outlined in Table 3. The most critical parameter in this context is the number of EVs that can be charged at the station per hour. The primary goal of optimizing the sizing of various charging station components (PV, WT, CHP, etc., as depicted in Figure 1) is to ensure that local generation and energy storage can meet a significant portion of the EV charging requirements at the most cost-effective investment.

2.3. Economic and Technical Data

For effective planning of the IHRES, it is essential to consider both objective economic and technical data. These analyses encompass significant economic factors such as interest rates, inflation, and project lifespan, detailed in Table 4. Given the variable nature of inflation and discount rates, employing long-term average values offers the most accurate results. Additionally, Table 5 and Table 6 outline the economic components and technical specifications of the system’s elements. In HOMER, the boiler’s computations focus solely on the price of NG, without accounting for capital or maintenance expenses [72]. It is worth noting that all generators, including CHP and the electric boiler, utilize natural gas for energy production.
The cost of solar PV is expected to decline as the implemented capacity rises. In this paper, the price to reduce by 93%, 66%, and 54% for installations of 10 kW, 1000 kW, and 2000 kW, in the same order. Refer to Table 7 for the PV prices applied in this system [70].
The price and capacity of a 1 kWh Li-ion battery are presented in Table 8.
Electricity tariff information from the Iranian electricity market for the previous year (8760 h) has been employed to obtain electricity from the grid according to Figure 8 [76]. Additionally, the rate at which electricity is resold to the grid aligns with the guaranteed price set for acquiring surplus electricity from RESs, set at $0.06 [77].
Power plants in Iran predominantly rely on fossil fuels, particularly NG, for electricity generation. As a result, the pollution generated presents a substantial and costly challenge for the government’s efforts in public health. Table 9 and Table 10 document emissions from the grid according to the Iranian national grid and provide insights into emissions from fuel-based resources, indicating that operations involving CHP and the boiler lead to GHG emissions [39].

3. Optimization Method and Energy Management Strategy

This study utilizes the HOMER software to optimize the proposed IHRESs system, leveraging its recognized capabilities for achieving both speed and accuracy in this domain. A recent study conducted by researchers compared the optimization results obtained from HOMER with those from metaheuristic algorithms such as PSO and Artificial Bee Colony (ABC) [78]. The findings revealed that the simulation results generated by metaheuristic algorithms yielded similar system parameters to those obtained through HOMER. The optimization algorithm integrated into HOMER employs non-derivative optimization techniques to identify the system with the lowest cost among various design options. HOMER conducts countless optimizations across a spectrum of input suppositions to evaluate the influences of uncertainties or variations in model inputs. However, employing heuristic methods for optimization presents notable challenges. In HOMER, scenario optimization is performed using a fundamental economic parameter known as NPC.
The main objective of the proposed microgrid configuration is to optimize the sizing of components to minimize the system’s NPC. Economic considerations play a vital role in the design of a microgrid. Incorporating technical constraints can significantly increase the microgrid’s cost. However, reducing costs may jeopardize reliability. There exists a trade-off between reducing system expenses while recognizing the possibility of power shortages and embracing the most cost-effective electrification methods [79,80,81].
The NPC of the microgrid can be represented by (21) as follows [39]:
N P C = C c a p + C r e p + C O & M + C f u e l + C g r i d C R F
In the equations presented, Ccap, Crep, CO&M, Cfuel and Cgrid represent the capital cost, replacement cost, operational and maintenance cost, fuel cost, and the cost of purchasing/selling electricity from/to the upstream grid, respectively.
CRF, is computed using Equation (22) [39].
C R F ( i , n ) = i 1 + i n 1 + i n 1
Equation (23) illustrates the yearly real interest rate (i), determined by both the nominal interest rate (i′) and the expected inflation rate (f) [39,70].
i = i f 1 + f
Microgrids are specifically engineered to provide the most cost-effective COE within specified areas. The COE ($/kWh) can be calculated based on the average NPC using Equation (24).
C O E = N P C N = 1 8760 P N × 1 × ϕ c p v
The objective of the proposed research is to reduce the NPC, consequently leading to the lowest possible COE [39,70].

4. Simulation Results and Discussion

In this section, various situations and most favorable scenarios for a case study were carried on. To assess the different hybrid system configurations outlined in this paper, around one million simulations have been conducted using HOMER Grid software. Throughout the discussed scenarios, the levels of DG and TLC remain consistent. Various devices are systematically arranged and analyzed in different configurations to pinpoint potential arrangements for meeting the demands of electrical and thermal loads, along with EVCSs within the complex.
In the results examination, Ardabil, Hamadan, Tehran, Ahvaz, Yazd, Gilan, Mashhad, Shahr-e kord, and Kerman are denoted as scenarios 1 through 9, respectively.

4.1. Technical Analysis

Currently, the world is severely reliant on fossil fuels for energy, which adversely affects the environment. Accelerating the integration of RES in existing power systems appears as a suitable option to reduce GHG emissions. Reducing dependence on fossil fuels, although challenging, can be achieved through effective policies and planning. By 2050, RES is expected to provide 85.70% of electricity and significantly reduce GHG emissions. This section examines the optimal complementary system for the tourism complex with the objective of cost-effectiveness and reliability. Various technologies such as batteries, boilers, TLC, converter and diesel generators, when combined with PVs and WTs, are analyzed to meet the thermal demand and electrical demand. Table 11 reports the energy output of each configuration, which typically represents a combination of solar and wind technologies. Despite the need for higher renewable capacity, this approach ensures a constant power supply even during periods of peak demand. In addition, the use of multiple components in an HRES decreases the need for extensive installation of renewable technology. In addition, as can be seen in Table 11, in scenarios 6 and 7, when the proposed system has more generation capacity by WTs, the battery capacity is also higher than other scenarios that have less generation capacity by WTs, but the significant point in these two scenarios is the issue of PVs production because in sub-scenario C of scenarios 6 and 7 when only PVs are used as production by renewables, the battery capacity has increased compared to sub-scenarios A and B, the reason for this is that more PVs are dependent on atmospheric and environmental conditions are like the uncertainty of resources. that in sub-scenarios A and B, the diesel generator system is responsible for supporting the system, but in sub-scenario C, batteries are responsible for supporting the system. The highest production capacity of PVs corresponds to scenario 9, which is 312 kW, and the lowest is 4.58 kW, which is for scenario 1.
The highest production capacity of WTs is related to scenarios 6 and 7 because these two places are famous for the windy regions of Iran (Manjil and Binaloud) and the highest productions are related to these two scenarios, and for this reason, the production capacity by PVs is very high in these scenarios. It is less than the rest of the scenarios.
Furthermore, in the scenarios and sub-scenarios where the production capacity of PVs is more and due to the availability of PVs in HREs, we see more capacity in the converter’s sections, which is because of more exchange with the grid. The highest capacity is related to sub-scenario C in scenario 9 and the lowest capacity is related to sub-scenario A in scenario 1.
As reported in Table 11, the lowest amount of renewable fraction corresponds to scenario 3, which is equal to 10.2%, because it is not used in addition to the WT, and the highest amount is equal to 22.7%, which corresponds to scenario 7. The reason for this percentage compared to the rest is the use of three WTs and the acceptable amount of production by PVs.
In this article, diverse scenarios are outlined, and various configurations are compared based on the production quantities of each component in the proposed system. The detailed comparisons are presented in Table 11 to provide a comprehensive understanding of each proposed system. To further elucidate the production levels of individual components of the HRESs across different months of the year, Figure 9 depicts the averaged values.

4.2. Economic Analysis

In this section, the economic evaluation of each HRES is presented. HOMER characterizes LCOE as the mean expense per kWh for the usable electricity energy generated by the system. According to Table 11, the lowest energy cost is related to scenario 7, which is equivalent to 0.0405 dollars per kilowatt hour. In fact, the choice of this scenario as the optimal solution in windy areas also depends on the investors’ decisions on prioritizing economic factors or prioritizing higher efficiency (resulting in lower power losses). Furthermore, the highest value of COE corresponds to scenario 3, which is equal to 0.0511 dollars/kWh; this is the reason for the use of a WT and the production of 178 kW by PVs. The COE operates as an efficient metric for differentiating dissimilar systems; however, HOMER does not prioritize systems solely based on COE. According to Table 11, the initial investment cost in scenario 3 (sub-scenario C) is equal to 0.508 M$, with the elimination of WTs and production by PVs as the only RES in the system with a very small amount of battery capacity and also energy conversion by converters. it will be obtained. Because in this scenario, most of the electricity production by RES is answered by PVs, and it is natural that by removing the costs related to WTs and batteries, this scenario has the lowest initial cost. Because according to Table 5, the costs related to WTs are much higher than the costs related to PVs. Furthermore, in scenario 7 (sub-scenario A), we see the highest initial investment cost, which is equal to 1.35 million, which is due to the high initial cost of the equipment used in these configurations, and the major share of this cost is related to the costs of WTs and then the costs related to the large number of PVs and BESs used in this system configuration. In terms of operating cost, as you can see in Table 11, the highest value is related to scenario 5 (sub-scenario B), which is equal to 43,136 $/year, which can be caused by the high maintenance costs of WT in addition to the maintenance costs of PVs. Because of the effect of heat on the panels, the efficiency of the panels will definitely decrease, and the repair costs will be higher. In addition, we have considered that the lowest operational cost is related to scenario 9 (sub-scenario A), which is equivalent to 19,501 $/year, and one of the reasons for this low cost is the variety of sources of electricity production, as well as the high efficiency of the panels due to good sunlight and low He; the effect of heat on their efficiency and relatively good WS in the region is known.
Finally, what is known as the objective function in HOMER is the minimized NPC; now we will examine this important parameter in the simulation results.
As reported in Table 11, the highest value of NPC corresponds to scenario 7 (sub-scenario A), which is equal to 1.93 M$, the reason for this maximum value compared to the rest of the configurations in Table 11 is the use of three WTs and also production 35.3 kW is due to PVs and costs related to converters and batteries, as well as considering all the costs of these equipment. On the other hand, the lowest NPC corresponds to scenario 2 (sub-scenario C), which is equal to 1.68 M$. The reason for this is the good efficiency of the panels as well as the lack of WT related systems.
Table 11 shows the breakdown of project costs for each scenario along with their corresponding rate of return. Notably, the use of more numbers in WT or PV leads to a significant increase in maintenance costs. However, these resources with batteries lead to a more balanced distribution of costs among the various components of the project. The term salvage refers to selling the equipment’s residual value on the retail market after the end of the project’s life.

4.3. EVCS Analysis

The charging scheduling mechanism is analyzed based on power consumption by EVs, with various interconnected indicators presented in Table 3. This study focuses on the fast-charging mode for both small and large EVs. The average charging time per each time is 15–20 min for small EVs and 20–25 min for large EVs. Detailed examination of the charging schedule reveals that the annual energy usage by EVs is 157,748 kWh, with a peak demand of 700 kW. There are number of times charging sessions provided daily by seven chargers, each with a peak output power of 150 kW for large EVs and 50 kW for small EVs. Due to the full occupancy of chargers upon arrival, an average of 0.1 potential applicants per day are unable to charge. Our ideal EV planning strategy maximizes the quantity of charging times, minimizing missed sessions to about 0.1 per day. The timing of EV charging is carefully selected for all scenarios studied and analyzed; this selection aims to observe the impact on electricity consumption and car charging stations. Additionally, to enhance the relevance of this study, we conduct several analyses considering of the ideal charging planning of EVs for two high-consumption months, July and January, due to the combination of electrical and thermal loads in the system, representing summer and winter, with the 15th day of each month chosen for analysis.
According to Figure 10, the findings indicate that for scenario 1 at the beginning of July, charging times for electric cars are higher during periods when our PV system can generate electricity. However, due to low PV production in scenario 1, grid electricity demand has increased. At 3 p.m., grid demand rises due to car charging and increased consumption from other parts of the tourist complex in the early evening. In January, colder weather leads drivers to prefer electric charging stations over fossil fuel stations, a trend clearly visible in the January scenario 1 figure. Similarly to the previous figure, a significant increase in grid electricity consumption between 4 p.m. and 10 p.m. is observed, corresponding to the peak electricity usage of the tourism complex.
For the second scenario, as shown in Figure 10, the EVCS is used both day and night due to the location of the tourist complex in the Sarab Gian area, which remains busy throughout the day and night because of its mild summer climate. A noteworthy observation in this scenario is the period between 8 a.m. and 4 p.m., where the good potential for solar radiation in the area reduces the electricity demand from the grid. This reduction is attributed to electricity generation by PV and storage in batteries. As in the previous figure, here too, the large increase in grid electricity consumption between 4 pm and 10 pm is due to the beginning of the tourism complex’s electricity consumption peak. For January in scenario 2, unlike the summer data, grid electricity demand increases between 8 a.m. and 4 p.m. as EVs arrive at the charging station. This increase is due to the limited electricity production by PV systems in winter, attributed to the site’s mountainous terrain.
In the July figure for scenario 3, because the scenario is set in the capital of Iran with high car traffic, there is an increase in the number of charging sessions for electric cars and greater use of charging stations. A noteworthy point is between 8 a.m. and 4 p.m., when increased PV production leads to a significant portion of the tourist complex and EVCSs’ electricity being supplied by PVs, reducing grid demand. However, in the January figure, the period from 8 a.m. to 4 p.m. shows an increase in grid electricity demand when cars arrive at the station, due to the low PV production during the winter season.
According to Figure 10, the July curve for scenario 4 shows that electricity generation by PVs is adequate. However, there is an increased demand from the grid between 8 a.m. and 4 a.m. This is because Ahvaz experiences extreme heat, leading residents to use many cooling systems in their homes. Conversely, the January curve for scenario 4 indicates a decrease in grid electricity demand between 8 a.m. and 4 a.m. This is due to favorable sunlight conditions that enable sufficient PV generation, combined with cooler winter temperatures, eliminating the need for heating devices. Consequently, most of the electricity produced by PVs and storage systems is allocated to EVCSs.
According to Figure 10, the July curve for scenario 5 shows that while electricity generation by PVs is adequate, there is an increase in grid demand between 8 a.m. and 4 a.m. This is because Yazd, a desert region in Iran, experiences high temperatures, causing residents to use numerous cooling systems in their homes. Conversely, the January curve for scenario 5 indicates a decrease in grid electricity demand between 8 a.m. and 4 a.m. This is due to favorable sunlight conditions enabling sufficient PV generation and cooler winter temperatures, eliminating the need for heating devices. Consequently, most of the electricity produced by PVs and storage systems is allocated to EVCSs.
In scenario 6 for the month of July, as shown in the figure, the demand from the grid increases significantly between 8 a.m. and 4 a.m. due to the arrival of electric cars at the EVCS station. This increase is more pronounced than in other scenarios, primarily because of low PV production and an increase in tourists in northern Iran, attracted by its moderate and forested climate. Conversely, the demand decreases between 5 and 8 a.m. and 1 and 6 p.m. due to production by WTs. In January, scenario 6 shows a higher grid demand during most hours compared to July, due to reduced renewable energy production and the addition of heating devices. Furthermore, the region’s milder winter weather attracts more tourists and electric cars as a result, further increasing demand. However, from 12 a.m. to 4 p.m., the demand is lower than from 4 p.m. to 11 p.m., thanks to production by WTs.
Additionally, in scenario 7, the impact of the presence of WTs is evident. During intervals such as 6–7 a.m. and 3–5 p.m., the demand from the grid drops to zero, with the total consumption being met by WTs. However, due to low production by PVs from 8 a.m. to 3 p.m., there is an increased demand when cars arrive at the charge station. Furthermore, the January diagram for scenario 7 shows a smoother demand graph from the grid. This is attributed to the production from WTs and the storage in batteries, which can supply part of the required consumption when needed.
According to Figure 10, in the 8th scenario for July, electricity demand rises at 4 a.m. and increases further with the start of the morning. When cars begin charging at 8 a.m.; this additional load contributes to the overall consumption. Consequently, the demand during the 8 a.m. to 4 p.m. period is expected to be higher than during the 4–8 a.m. period. However, due to the region’s strong solar potential and satisfactory PV production, the electricity demand from the grid during this time remains consistent with previous levels. Thanks to the PV systems and storage solutions, the consumption curve has become more stable during this period. Additionally, the January graph for the same scenario highlights the impact of PVs and storage systems. From 8 a.m. to 4 p.m., renewable energy production helps meet part of the load for the tourism complex and electric car charging station, with storage systems providing additional support.
In scenario 9, between 8 a.m. and 4 p.m., as consumers use the charging station, we would typically expect an increase in electricity demand from the grid. However, the PV systems installed at the tourism complex, benefiting from the region’s strong solar radiation, significantly mitigate this demand. Consequently, the grid demand drops to zero between 8 a.m. and 3 p.m. Additionally, the January diagram for scenario 9 shows an increase in grid demand from 2 a.m. to 6 a.m. due to car charging. However, once the sun rises and between 8 a.m. and 4 p.m., the PV systems start generating electricity, reducing grid demand to its minimum. During this period, the electricity required for the charging station is supplied by the PV systems and storage. Given the region’s relatively mild winter temperatures, heating needs are minimal, which further reduces grid demand. From 4 p.m. onwards, however, electricity demand from the grid increases due to the activation of lighting and the ongoing use of the charging station.
It is worth mentioning that the different colors in the charts depicted in Figure 10 clearly represent the number of charging vehicles and their consumption levels at various hours.
In summary, Figure 10 presents a screenshot of the HOMER® Grid interface, illustrating the daily profile for the 15th of July and January. These specific days depict the charging demand of electric vehicles (EVs). Each color code represents the start time and the corresponding energy consumption of EV charging stations within a 24 h period. Furthermore, all charging sessions (indicated by multiple colors) are displayed alongside the grid demand (black) and the grid demand limit (purple).

4.4. Analysis of Energy Policy and Environmental Considerations

This section examines energy policy and environmental considerations, emphasizing Iran’s reliance on fossil fuels. Global energy transitions and the expansion of renewable sources have prompted Iran to align its policies with sustainable development, fostering research in renewable technologies. This study supports broader policy objectives for hybrid renewable energy systems, stressing the importance of effective policy frameworks. A well-designed energy policy should fairly distribute benefits, and ensure practical implementation. These criteria are vital for attracting renewable energy investments, ensuring Iran’s energy transition meets domestic needs while supporting sustainability goals. The study provides insights into planning and implementing renewable energy projects at an operational scale, aiding the shift toward a cleaner energy future. According to the Ministry of Energy in Iran, large consumers must source at least 10% of their demand from renewables. By evaluating various scenarios and sub-scenarios, this study offers practical strategies for meeting this target. Additionally, the necessity of environmentally friendly energy sources is highlighted. As shown in Table 11, renewables consistently exceed the 10% requirement, reinforcing the practicality of the proposed methods. This research contributes to national policy objectives and global environmental sustainability. Future studies will conduct deeper analyses of policy changes to refine methodologies in renewable energy planning.

5. Conclusions, Limitation, and Future Work

5.1. Conclusions

In this paper presents the planning of an HRES consisting of a solar PV, a WT, battery energy storage systems (BESS), DG, converters (CONV), a thermal load controller (TLC), and boilers, along with the ability grid interconnectivity. The goal is to meet the electricity and heating needs of a microgrid that includes a tourism complex and an EVCS.
On the other hand, globally, the adoption of EVs is rapidly increasing to support environmental decarbonization, creating new electricity demand for urban power grids. As more EVs become part of transportation systems worldwide, the need for EV charging stations is growing quickly. In Iran, despite having very few charging stations, the increasing trend of EV usage and development shows that there is still a need for efficient, affordable, and environmentally friendly power supply alternatives for EV charging stations. Grid-connected EVCSs place added strain on the power grid, and charging EVs via traditional networks is costly. A high number of grid-connected EVCSs can adversely affect the quality and reliability of the power grid source. In this regard, we analyzed the techno-economic feasibility, as well as the environmental advantages, of a hybrid PV-wind–battery energy configuration to provide on-grid electricity to an EVCS. Specifically, we used HOMER Grid software to analyze case studies in various cities in Iran, ensuring an optimal match between energy demand and supply for the tourism complex and EVs. Various system structure schemes were modeled to find a composition that fulfills techno-economic constraints while satisfying EVCS demand at a low lifecycle cost. In this paper introduces grid-connected HRES-based highway EVCSs to meet the electricity demands of EVs and the tourism complex, leading to reduced energy costs, minimized net present costs, reduced carbon emissions, and maximized renewable energy usage. The proposed HRES is executed, and several case studies are examined, considering the average load of the charging station, which includes 70% small EVs and 30% large EVs. The simulation is designed to optimize the number of charging sessions. The main findings of the proposed study can be summarized as follows:
The proposed HRES can significantly improve the travel experience of EV users on long-distance and off-grid journeys by providing access to both stand-alone and grid-connected energy for recharging their EVs. The planned EVCS location is situated near a highway, enabling EV users to recharge speedily and efficiently while traveling.
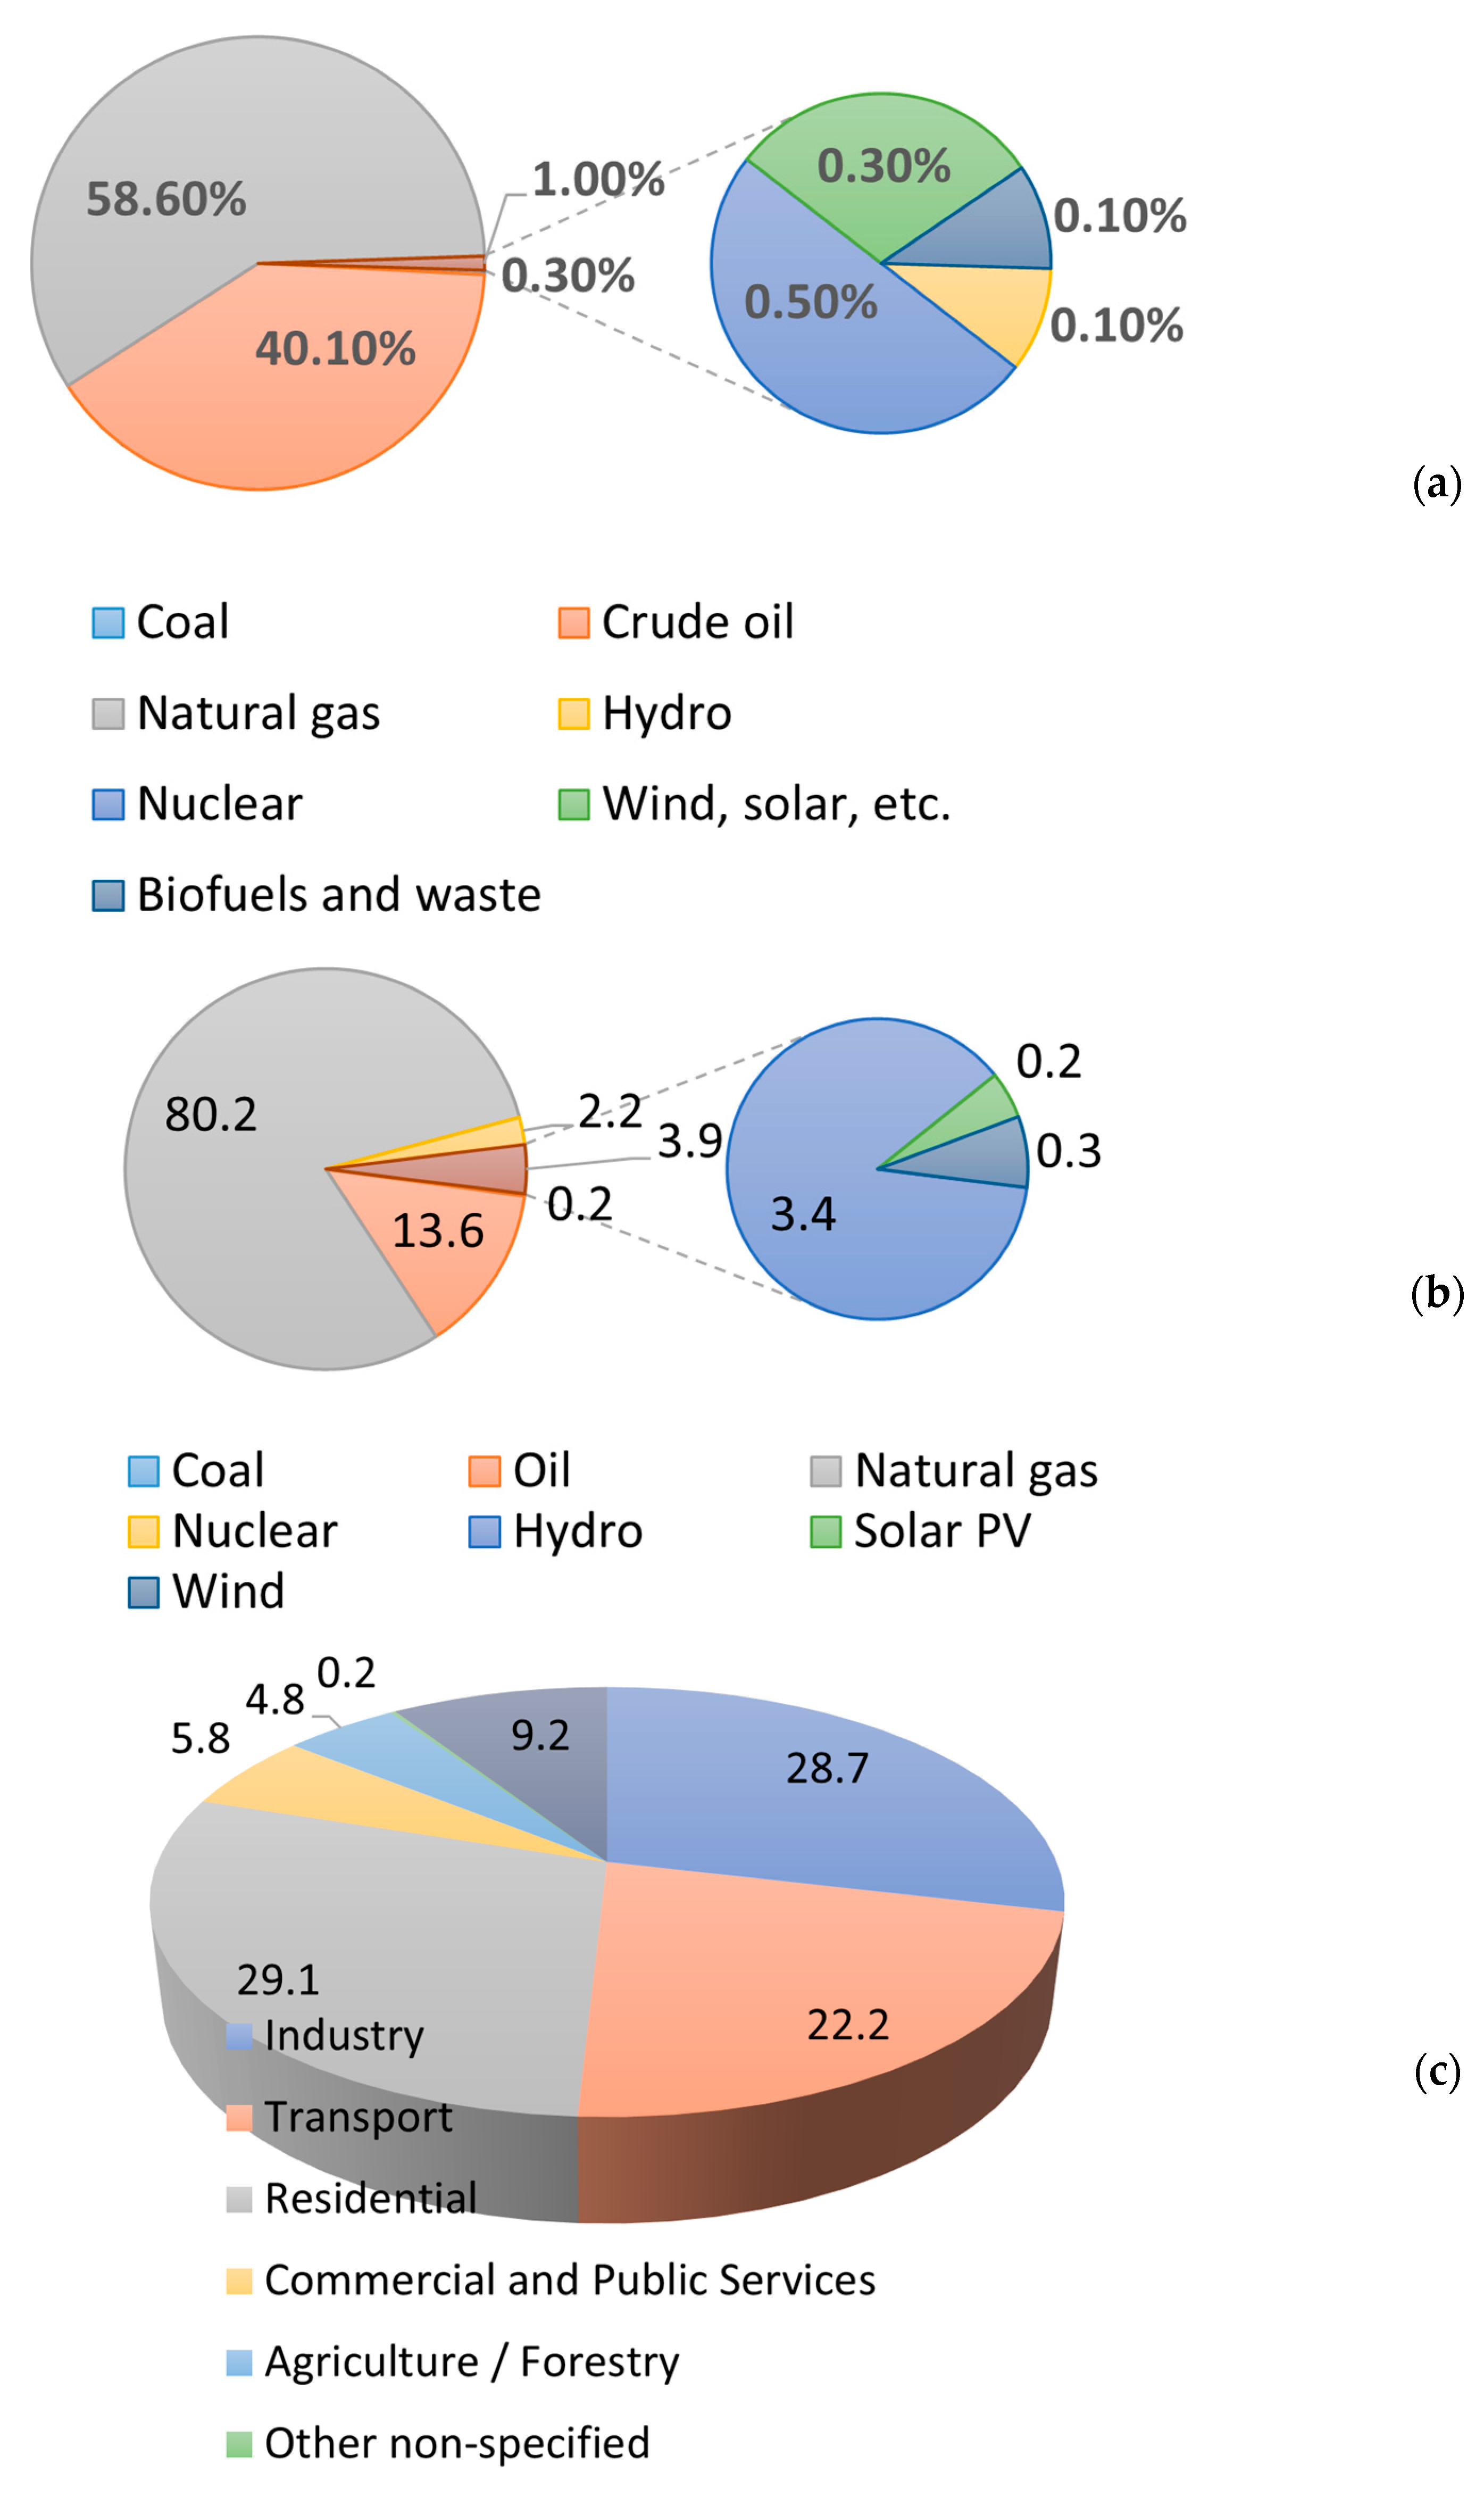
  • Given Iran’s vast gas and oil resources, most of the country’s electrical energy is produced by combustion fossil fuels. Consequently, developing an environmentally optimized RES solution presents a more practical alternative than simply expanding the existing grid.
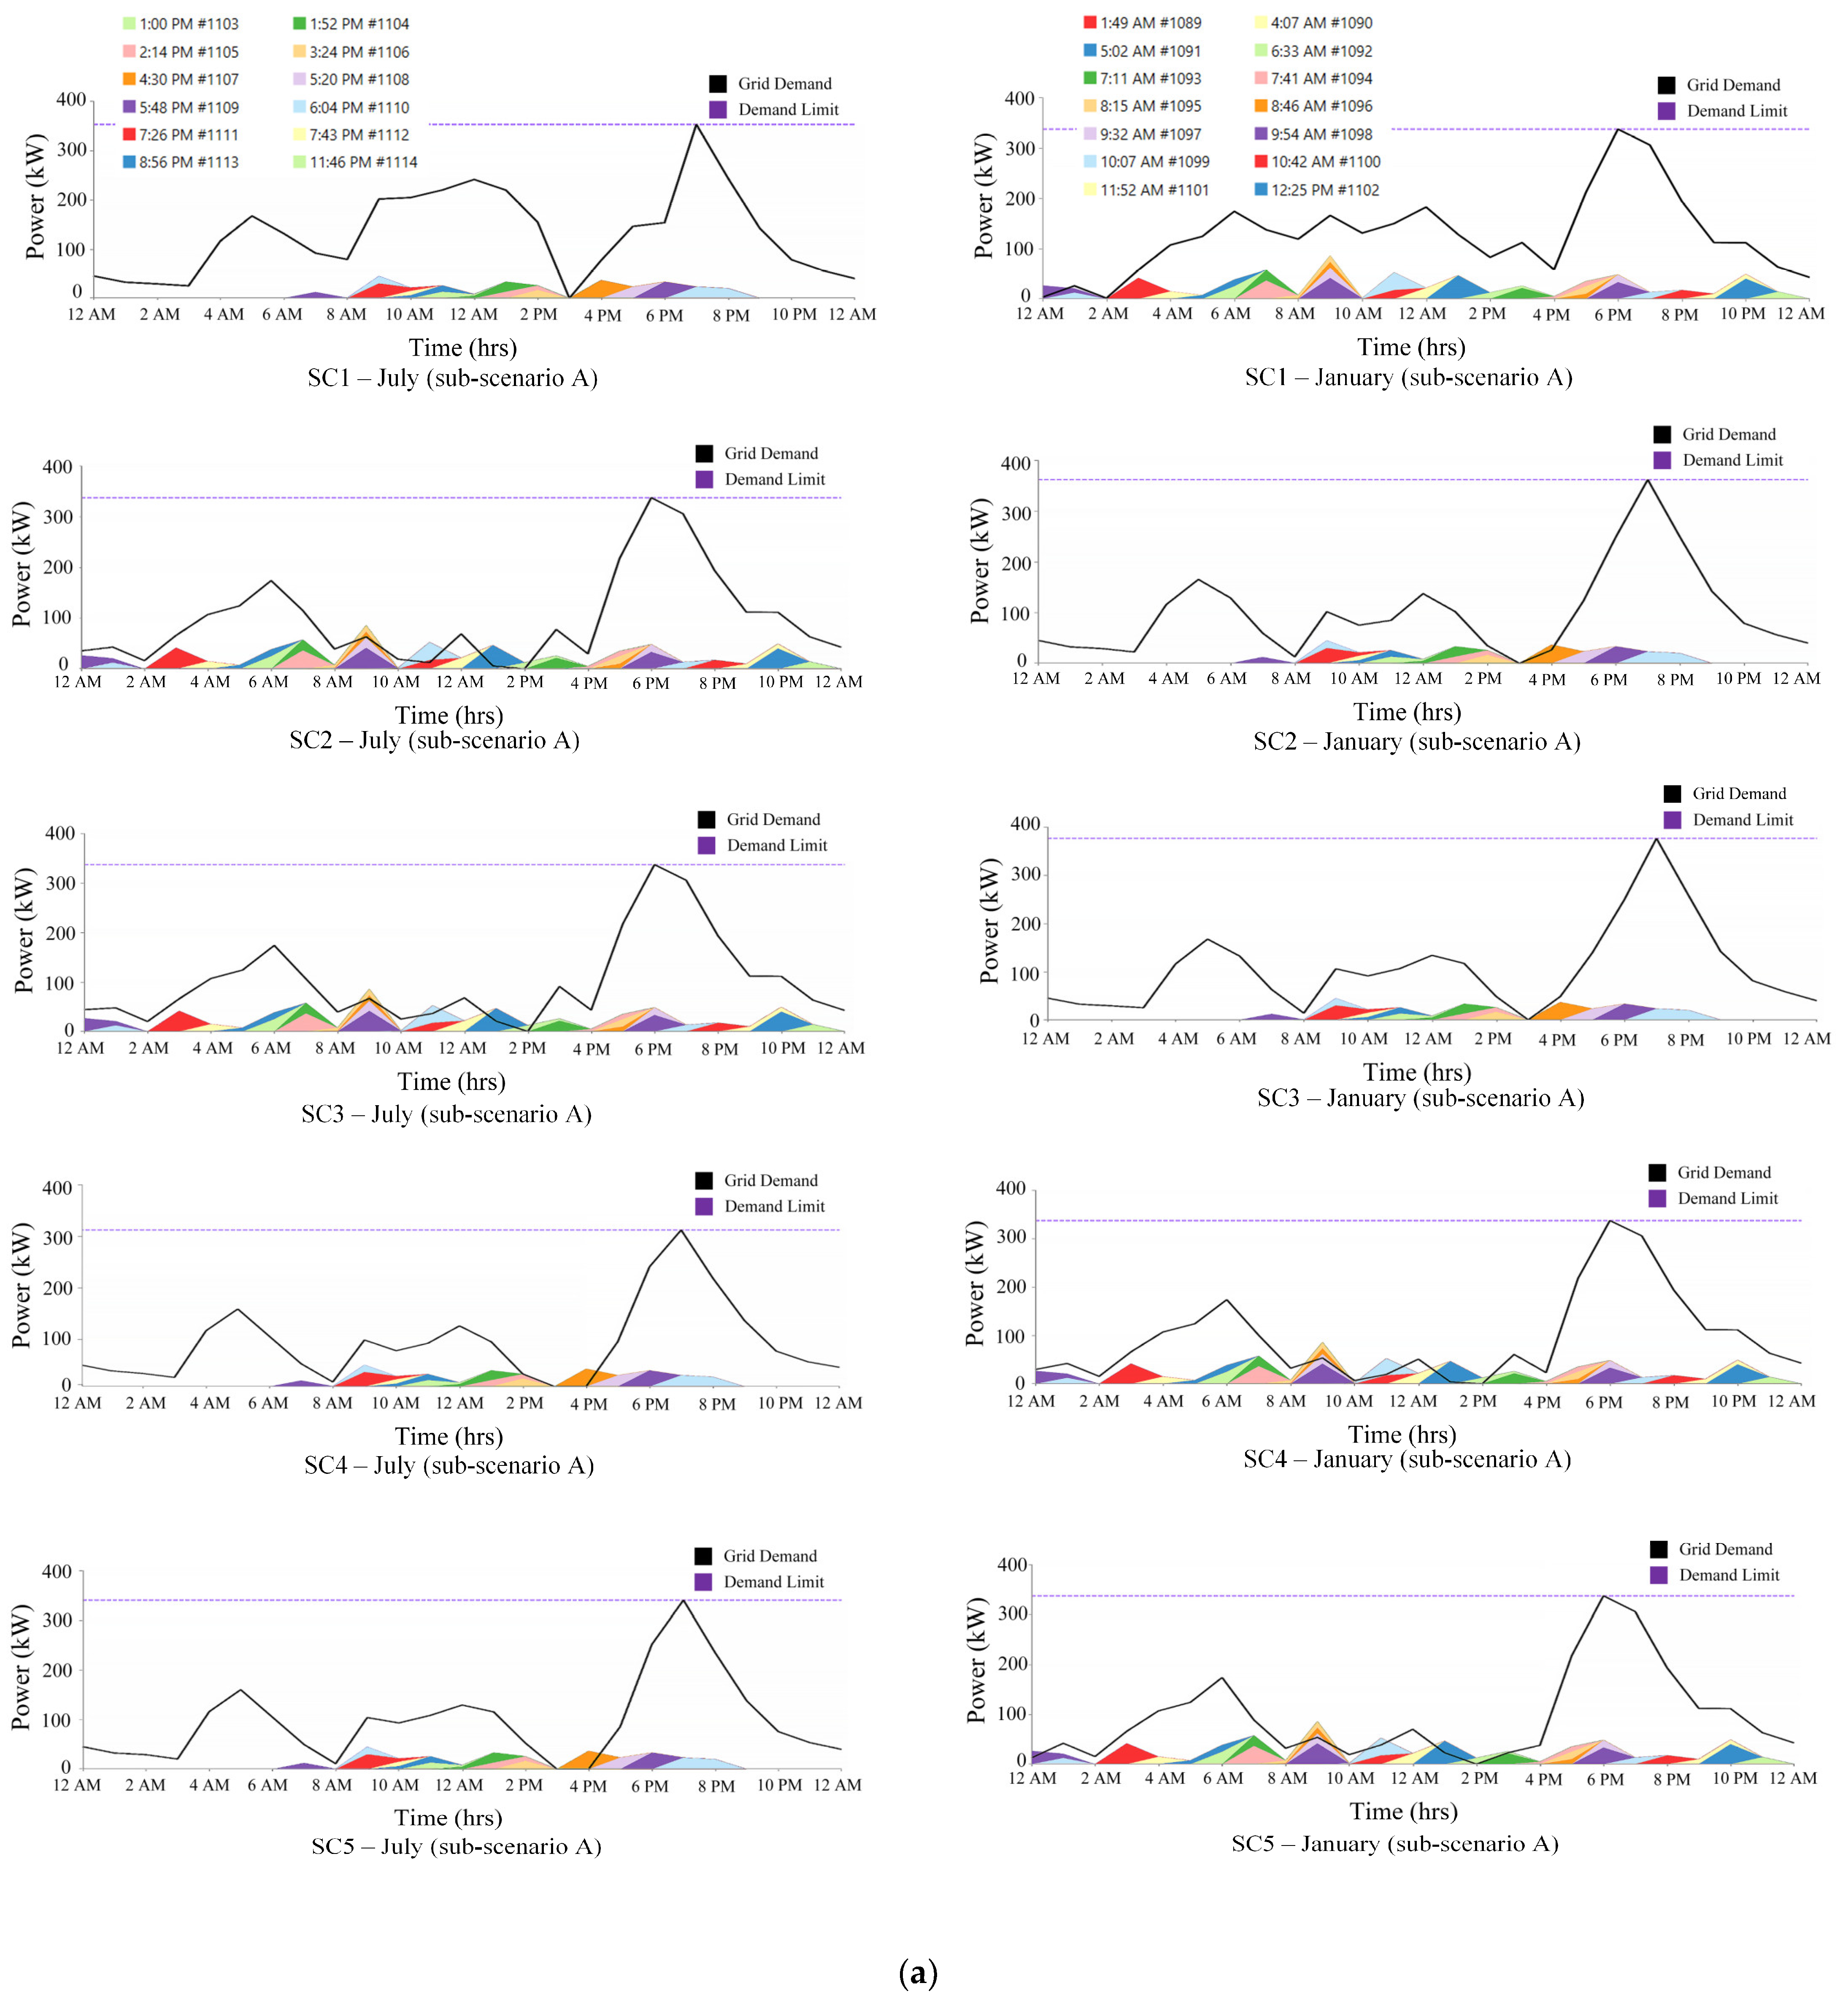
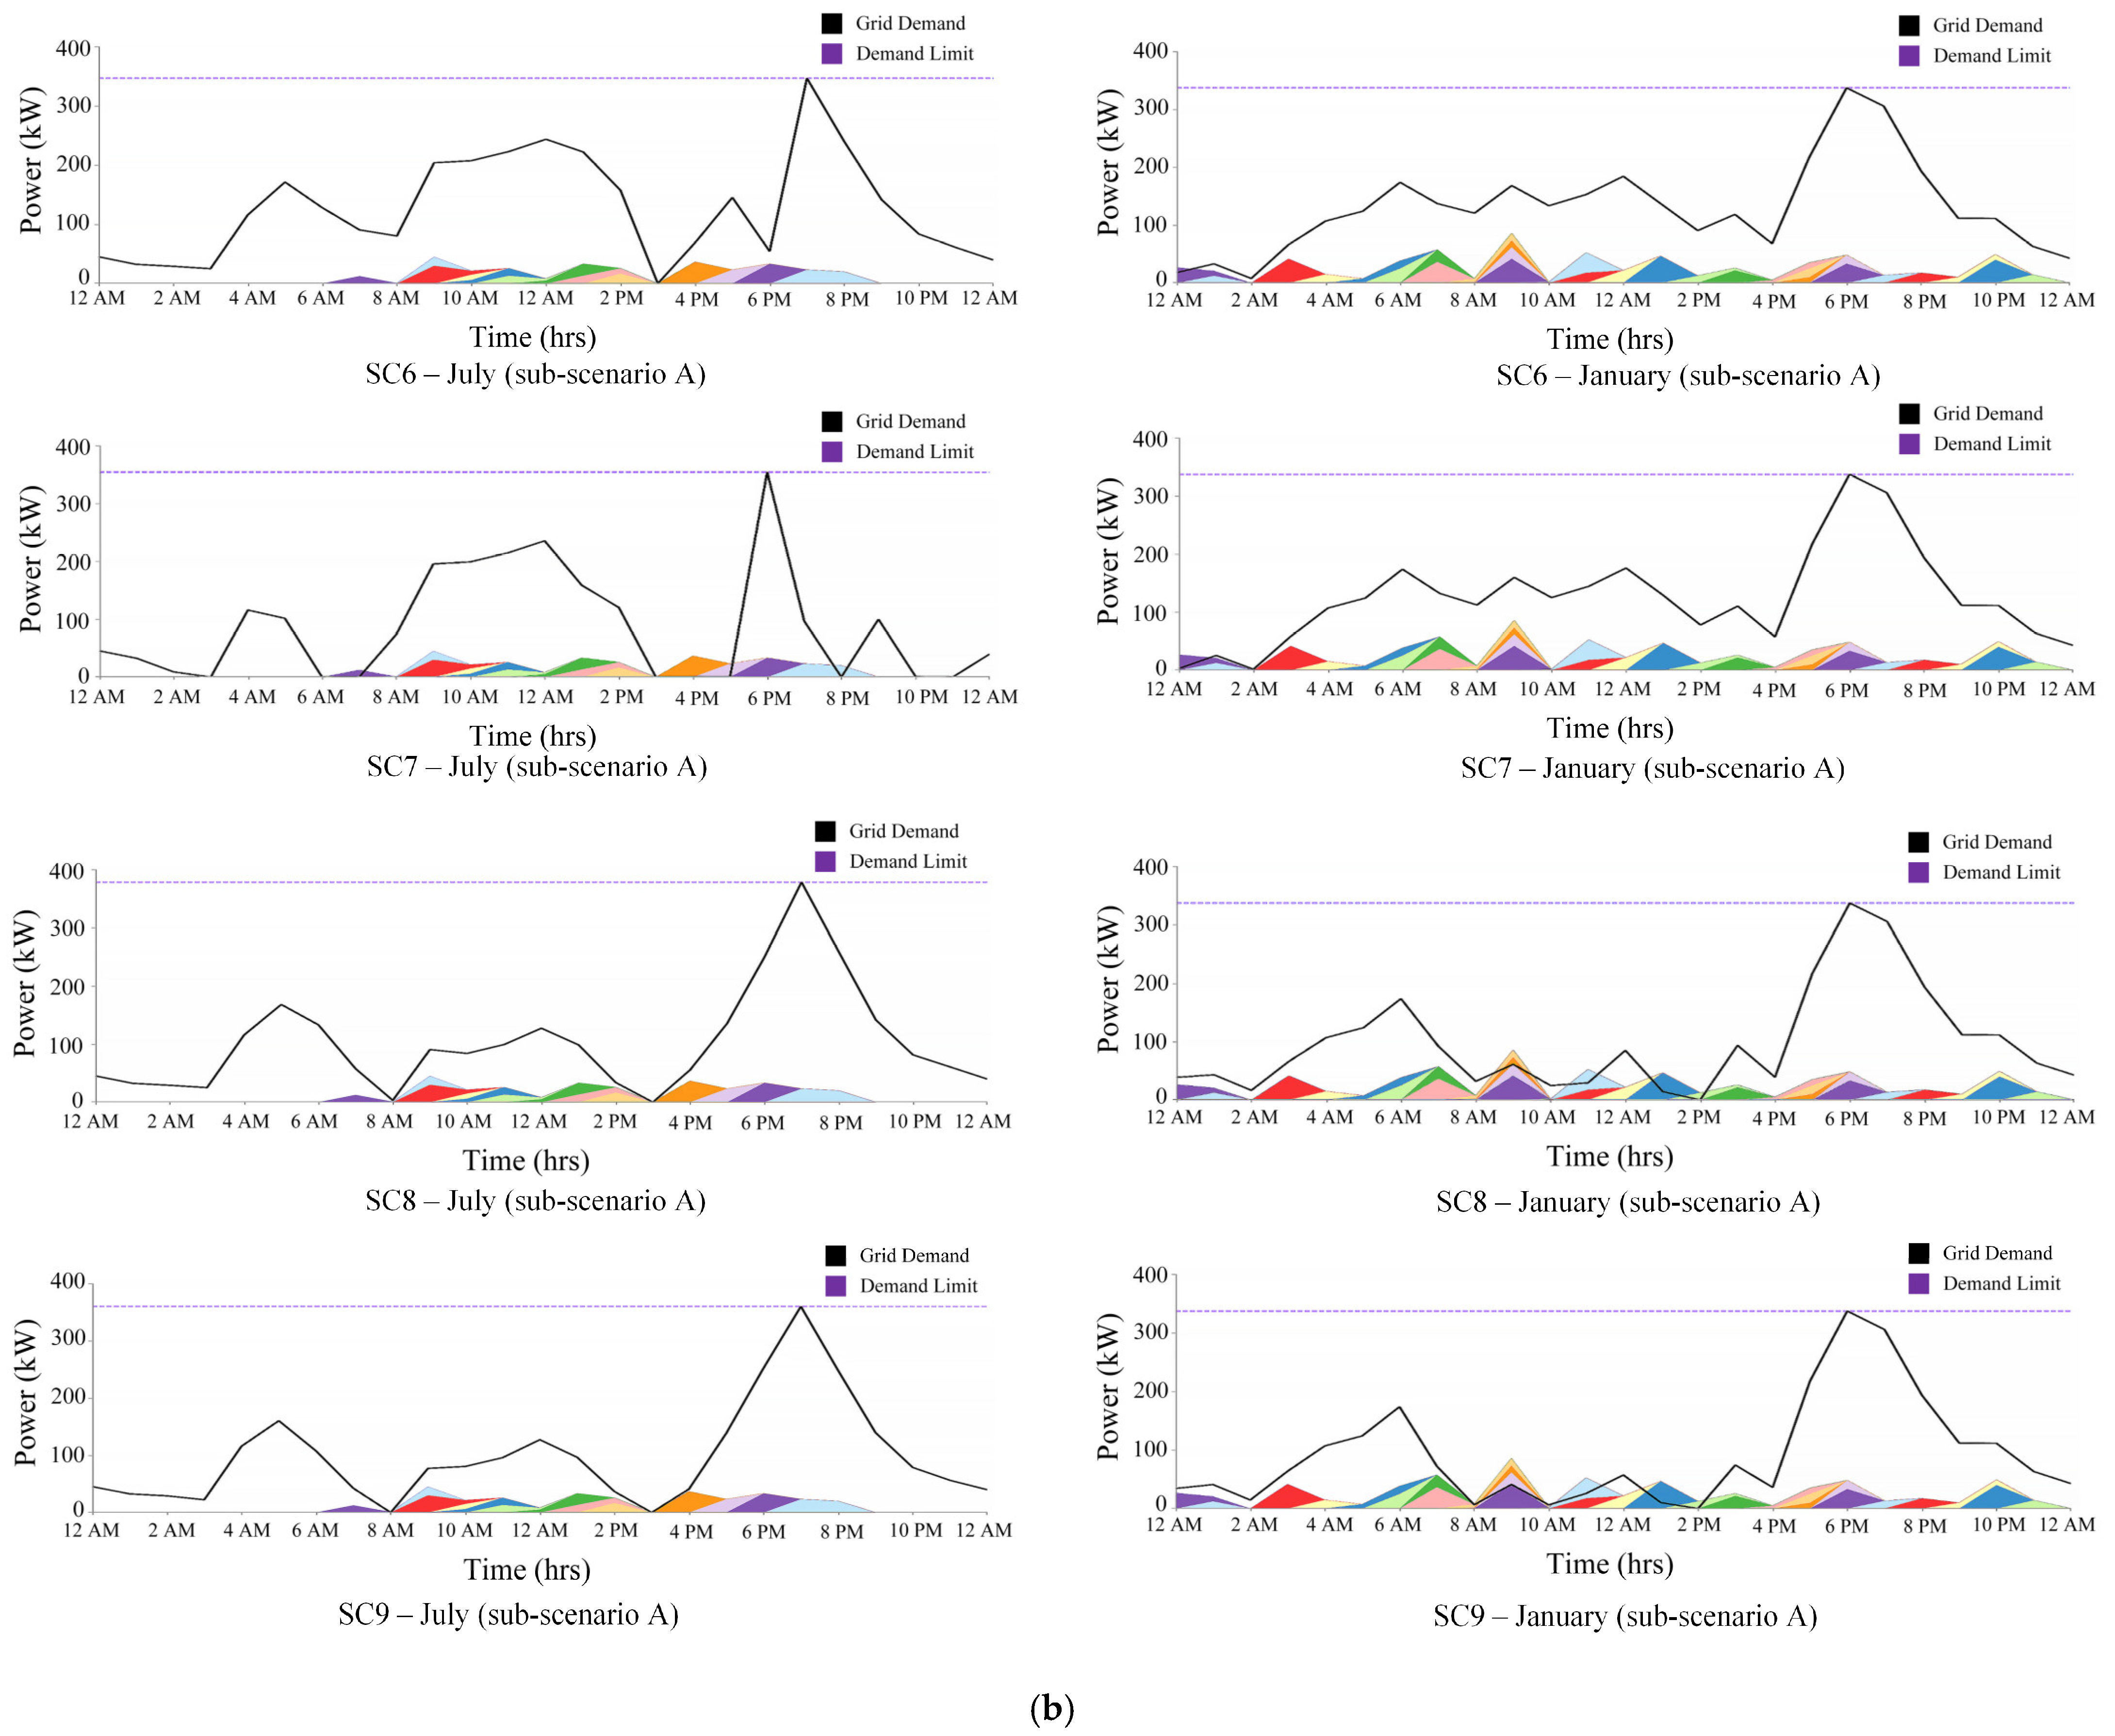
  • Another key finding of the proposed method is achieving the maximum count of occurrences of charging times, with an average of only 0.1 sessions per day where a customer might be unable to charge their EV. Very few sessions were missed on days when EVs were properly scheduled using the proposed model.
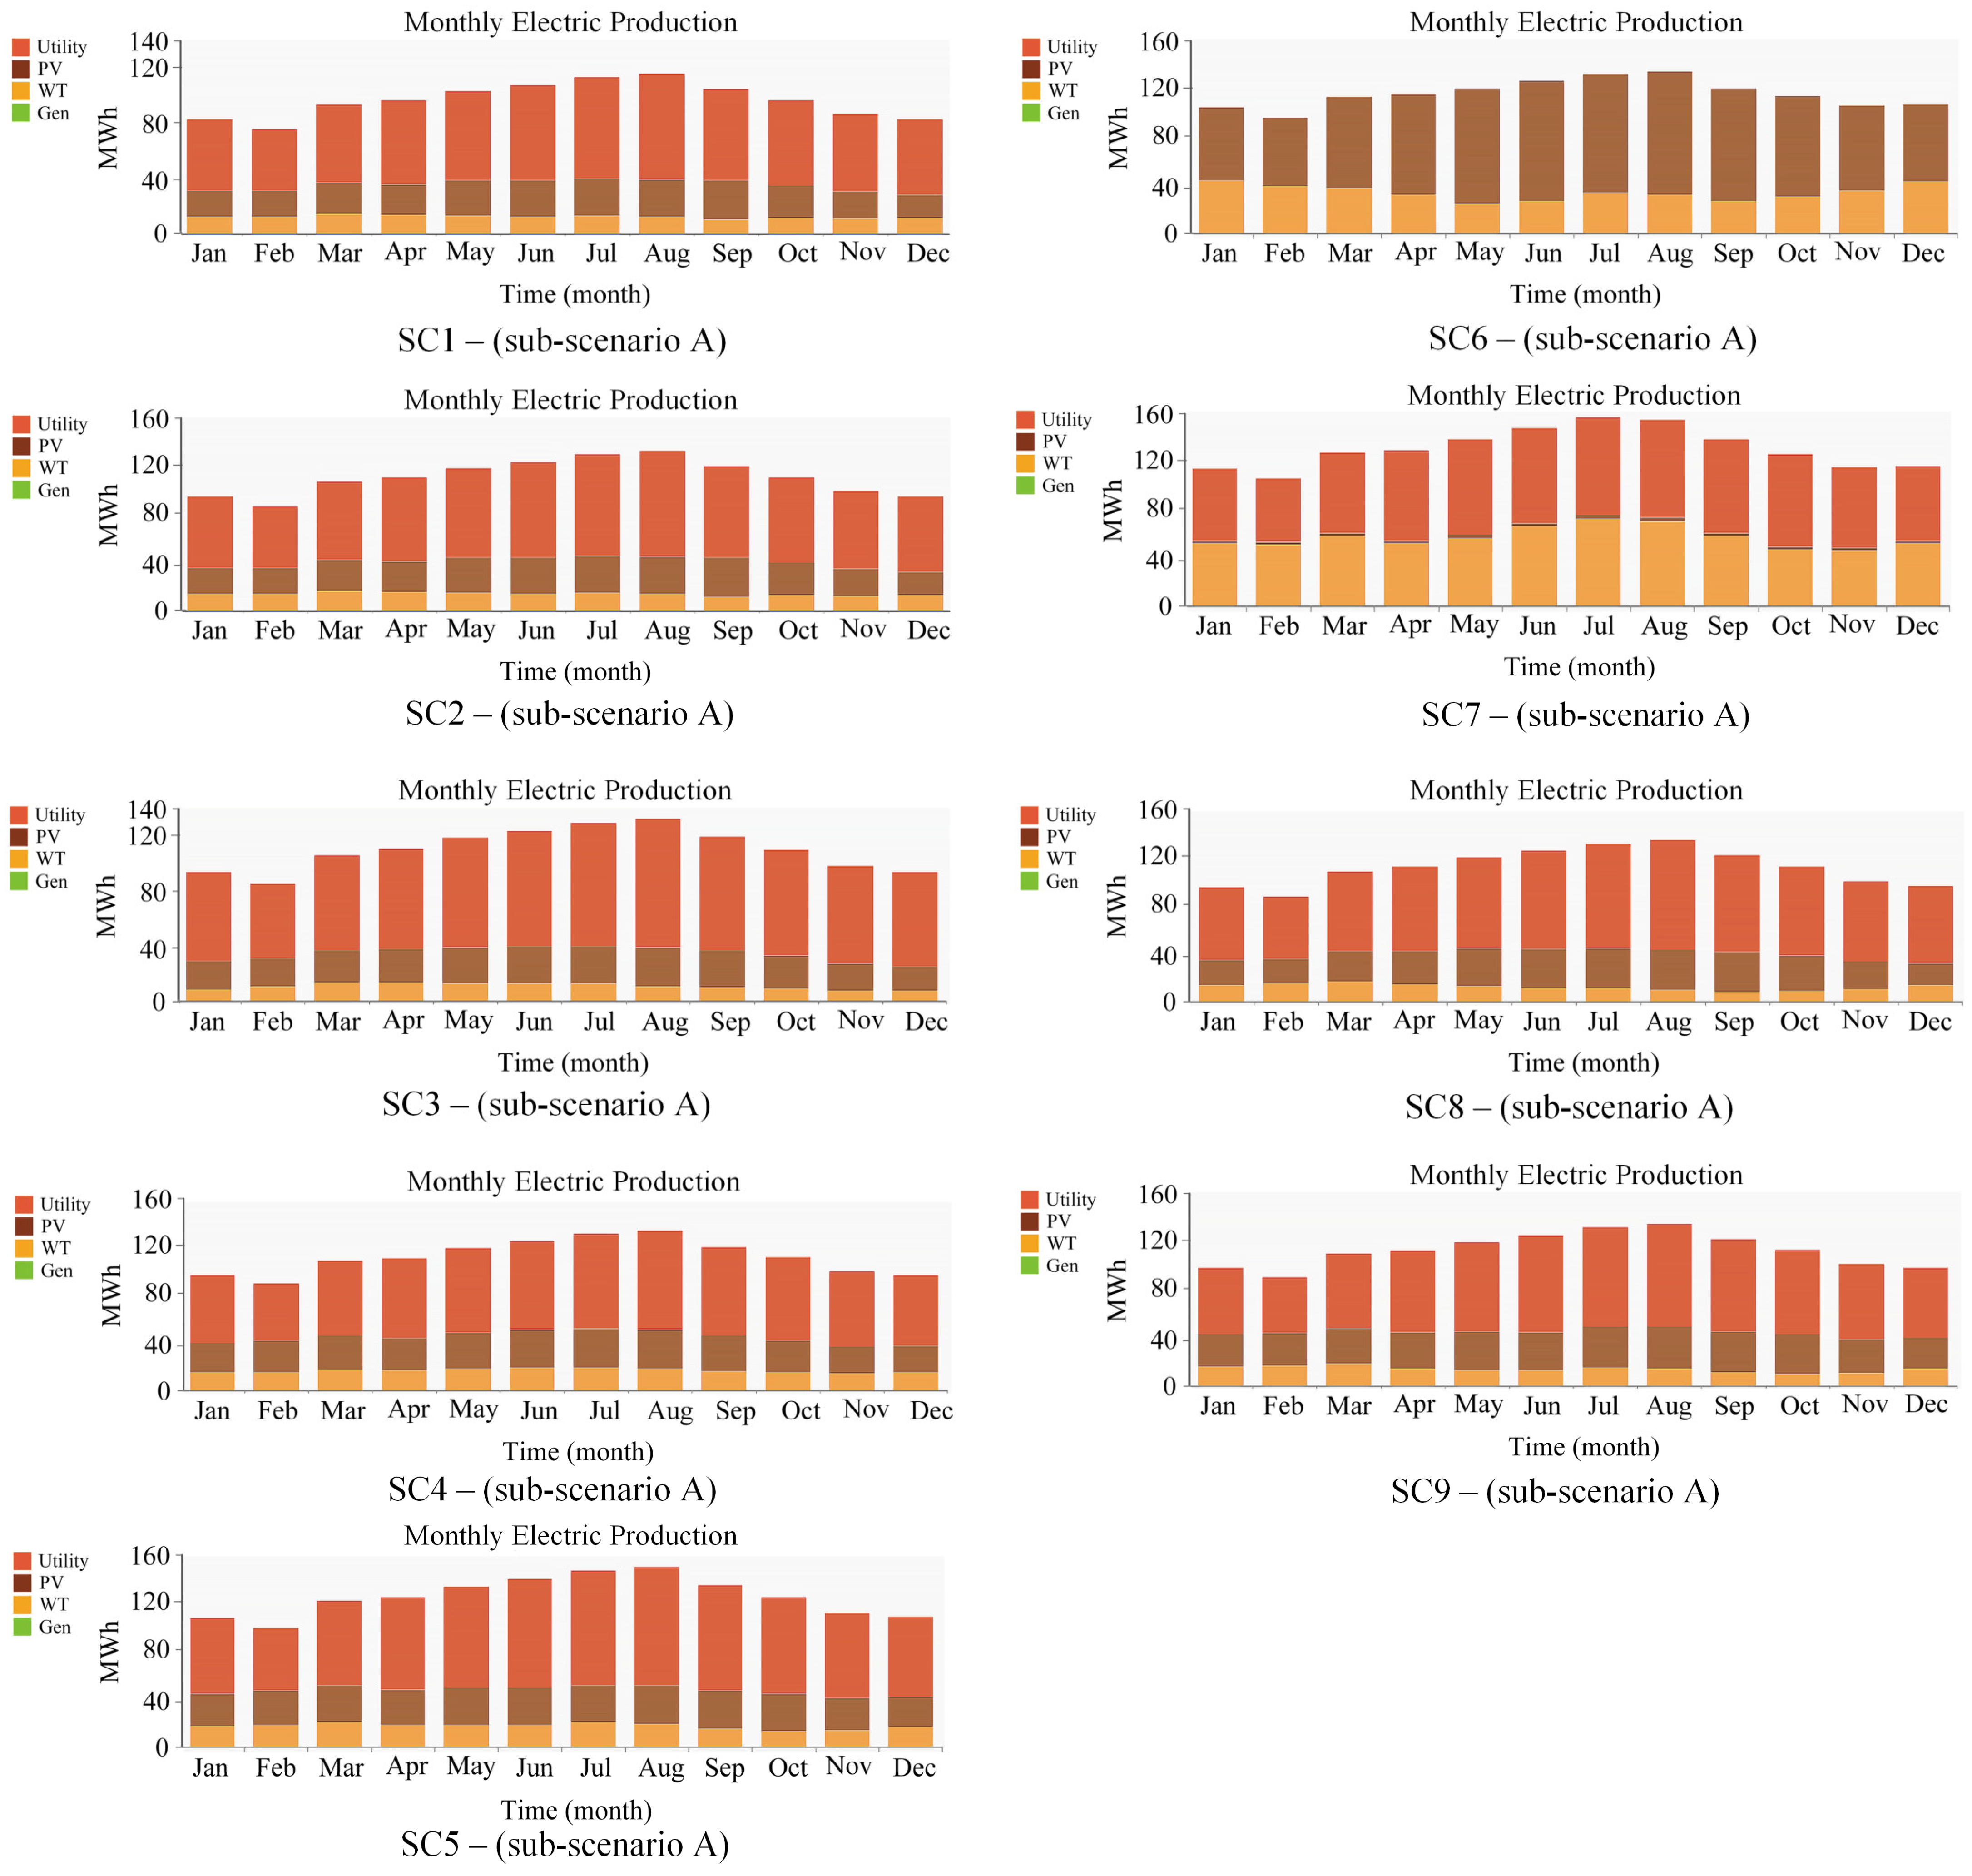
  • Another noteworthy point is the impact of heat on electricity production by PVs. In scenarios 2 and 5, both locations receive a similar amount of sunlight, but the PV output in scenario 2 is about 9.8% higher than in scenario 5.
  • When comparing the highest and lowest NPCs (from scenarios 7 and 2), there is a 12.95% increase, primarily due to the use of more WTs in scenario 7. This suggests that, given Iran’s geographical conditions, using PVs is generally more cost-effective and productive than WTs in most areas of the country.
  • Analyzing the initial costs of different configurations reveals a 62.37% difference between the highest and lowest values, mainly due to the high costs associated with WTs.
  • Incorporating diesel generators into HRESs reduces the need to purchase electricity from the grid, especially in regions like Iran where diesel-based electricity production is cost-effective and fuel prices are stable, thus lowering NPC and COE.
  • The impact of sensitivity variables on costs depends on the values of other sensitivity variables in each case.
  • Although the suggested method and sizing analysis were implemented for several case study in Iran, this strategy and it is findings can be applied worldwide, taking into account location-specific geographical features and climatic data (such as WS and solar radiation).
  • The economic advantages of the RES system at the charging station offer social welfare for EV owners and environmental advantages, such as lower COE for EV charging and reduced GHG emissions. Therefore, investing in an HRES microgrid for the EV sector is valuable in the long term. Further, interaction among EVs opens a new field of study with significant potential for future research.

5.2. Limitations and Future Work

The principal constraint of the presented framework is the substantial capital cost needed to build the RES-based EVCS. However, recent technological advancements in renewable energy technologies (RETs) and other factors have significantly reduced these costs. Furthermore, the recent initiative by the Islamic Republic of Iran government to boost the share of RESs throughout the country suggests that numerous organized programs, policies, incentives, and strategies will be introduced to offer both direct and indirect support for RES and EV infrastructure development. Future research can explore the integration of additional alternative clean energy sources to sustainably meet the charging demand of electric vehicles (EVs). Moreover, future studies could investigate the role of Vehicle-to-Grid (V2G) technology within IEEE 33-bus distribution networks, enhancing grid stability and efficiency. In line with the global energy transition towards clean resources and carbon reduction, renewable technologies such as solar thermal panels can be utilized for heat generation to meet thermal demand. Furthermore, considering the simultaneous supply of electricity and heat, the incorporation of thermal energy storage systems in hybrid renewable energy systems can enhance overall system efficiency and reliability. Studies might also assess the challenges, socio-economic impacts, and opportunities related to EVCS deployment in remote and off-grid areas. Additionally, research could investigate the policies, programs, and incentives required to support widespread adoption of EVs and charging infrastructure within the transportation sector, aiding the nation’s shift toward environmental and economic decarbonization through EV integration.

Author Contributions

Conceptualization, H.K.; methodology, H.K.; software, H.K.; validation, H.K.; formal analysis, H.K.; investigation, H.K.; resources, H.K.; data curation, H.K.; writing—original draft preparation, H.K.; writing—review and editing, B.V., S.H.H., G.C.L. and P.S.; supervision, B.V., S.H.H., G.C.L. and P.S. All authors have read and agreed to the published version of the manuscript.

Funding

The work of George Cristian Lazaroiu and Pierluigi Siano was supported by the grant of the Ministry of Research, Innovation and Digitalization of Romania, project number PNRR-C9-I8-760089/23.05.2023, code CF31/14.11.2022 and project number PNRR-C9-I8-760090/23.05.2023, code CF30/14.11.2022.

Data Availability Statement

Dataset available on request from the authors.

Conflicts of Interest

The authors declare no conflicts of interest.

Nomenclature

Abbreviations
RES Renewable energy source
HRES Hybrid renewable energy source
WT Wind turbine
PV Photovoltaic
DG Diesel generator
TLC Thermal load controller
GHGGreenhouse gases
EVElectric vehicle
EVCSElectric vehicle charge station
NPCNet present cost
COECost of energy
BESSBattery energy storage system
CRFCapital recovery factor
Parameters and variables
PPVOutput power PV
PWTOutput power WT
PDGOutput power DG (CHP)
PBESSOutput power BESS
PGRIDPower grid
MPModules parallel
MSModules series
PmodulePower module
η M P P T Efficiency MPPT
  η o u t Output efficiency
ρ Air density
ACross section
Vcut-inLow cutting speed
Vcut-offHigh cutting speed
VrRated speed
CWTWT power coefficient
i annual real interest rate
i nominal interest rate
f inflation rate
PchPower charge BESS
PdchPower discharge BESS
η c h Charge efficiency
η d c h Discharge efficiency
SOCState of charge
HchpThermal power
LHVLower heating value
η I N V Inverter efficiency
η R E C Rectifier efficiency
CcapCapital cost
CrepReplacement cost
CO&MO&M cost
CfuelFuel cost
CgridGrid cost
PNTotal power in year

References

  1. Batista, N.E.; Carvalho, P.C.; Fernández-Ramírez, L.M.; Braga, A.P. Optimizing methodologies of hybrid renewable energy systems powered reverse osmosis plants. Renew. Sustain. Energy Rev. 2023, 182, 113377. [Google Scholar]
  2. Ayan, O.; Turkay, B.E. Techno-Economic comparative analysis of grid-connected and islanded hybrid renewable energy systems in 7 climate regions, Turkey. IEEE Access 2023, 11, 48797–48825. [Google Scholar]
  3. Altin, C. Investigation of the effects of synthetic wind speed parameters and wind speed distribution on system size and cost in hybrid renewable energy system design. Renew. Sustain. Energy Rev. 2024, 197, 114420. [Google Scholar] [CrossRef]
  4. Khaled, O.; Zahid, M.; Zahid, T.; Ilahi, T. Techno-Economic Feasibility of Hybrid Energy Systems Installation in Pakistan. IEEE Access 2024, 12, 41643–41658. [Google Scholar]
  5. Available online: https://www.iea.org/countries/iran/energy-mix (accessed on 27 March 2025).
  6. Motamedisedeh, O.; Omrani, S.; Karim, A.; Drogemuller, R.; Walker, G. A comprehensive review of optimum integration of photovoltaic-based energy systems. Renew. Sustain. Energy Rev. 2025, 207, 114935. [Google Scholar]
  7. He, Y.; Guo, S.; Dong, P.; Zhang, Y.; Huang, J.; Zhou, J. A state-of-the-art review and bibliometric analysis on the sizing optimization of off-grid hybrid renewable energy systems. Renew. Sustain. Energy Rev. 2023, 183, 113476. [Google Scholar]
  8. Xing, K.; Luo, L.; Lu, S.; Gu, W.; Wang, X.; Bai, Y. Improve operational flexibility of distribution systems using transportable resources. Renew. Sustain. Energy Rev. 2024, 204, 114788. [Google Scholar]
  9. Balaban, G.; Lazaroiu, G.; Dumbrava, V.; Sima, C. Analysing Renewable Energy Source Impacts on Power System National Network Code. Inventions 2017, 31, 1–18. [Google Scholar]
  10. Bahramara, S.; Moghaddam, M.P.; Haghifam, M. Optimal planning of hybrid renewable energy systems using HOMER: A review. Renew. Sustain. Energy Rev. 2016, 62, 609–620. [Google Scholar]
  11. Baruah, A.; Basu, M.; Amuley, D. Modeling of an autonomous hybrid renewable energy system for electrification of a township: A case study for Sikkim, India. Renew. Sustain. Energy Rev. 2021, 135, 110158. [Google Scholar]
  12. Silinto, B.F.; van der Laag Yamu, C.; Zuidema, C.; Faaij, A.P. Hybrid renewable energy systems for rural electrification in developing countries: A review on energy system models and spatial explicit modelling tools. Renew. Sustain. Energy Rev. 2025, 207, 114916. [Google Scholar] [CrossRef]
  13. Mahesh, A.; Sandhu, K.S. Hybrid wind/photovoltaic energy system developments: Critical review and findings. Renew. Sustain. Energy Rev. 2015, 52, 1135–1147. [Google Scholar] [CrossRef]
  14. Upadhyay, S.; Sharma, M. A review on configurations, control and sizing methodologies of hybrid energy systems. Renew. Sustain. Energy Rev. 2014, 38, 47–63. [Google Scholar] [CrossRef]
  15. International Energy Agency (IEA). Transport Sector CO2 Emissions by Mode in the Sustainable Development Scenario, (2000–2030); International Energy Agency: Paris, France, 2022. [Google Scholar]
  16. Zhang, R.; Zhang, J.; Long, Y.; Wu, W.; Liu, J.; Jiang, Y. Long-term implications of electric vehicle penetration in urban decarbonization scenarios: An integrated land use–transport–energy model. Sustain. Cities Soc. 2021, 68, 102800. [Google Scholar] [CrossRef]
  17. Orsi, F. On the sustainability of electric vehicles: What about their impacts on land use? Sustain. Cities Soc. 2021, 66, 102680. [Google Scholar] [CrossRef]
  18. European Commission. European Alternative Fuels Observatory-Vehicles and Fleet. Available online: https://alternative-fuels-observatory.ec.europa.eu/transport-mode/road/european-union-eu27/infrastructure (accessed on 31 December 2024).
  19. Hopkins, E.; Potoglou, D.; Orford, S.; Cipcigan, L. Can the equitable roll out of electric vehicle charging infrastructure be achieved? Renew. Sustain. Energy Rev. 2023, 182, 113398. [Google Scholar] [CrossRef]
  20. Barman, P.; Dutta, L.; Bordoloi, S.; Kalita, A.; Buragohain, P.; Bharali, S.; Azzopardi, B. Renewable energy integration with electric vehicle technology: A review of the existing smart charging approaches. Renew. Sustain. Energy Rev. 2023, 183, 113518. [Google Scholar] [CrossRef]
  21. Zhang, B.; Niu, N.; Li, H.; Wang, Z.; He, W. Could fast battery charging effectively mitigate range anxiety in electric vehicle usage? Evidence from large-scale data on travel and charging in Beijing. Transp. Res. Part D Transp. Environ. 2021, 95, 102840. [Google Scholar] [CrossRef]
  22. Gupta, R.S.; Anand, Y.; Tyagi, A.; Anand, S. Sustainable charging station allocation in the distribution system for electric vehicles considering technical, economic, and societal factors. J. Energy Storage 2023, 73, 109052. [Google Scholar] [CrossRef]
  23. Skaloumpakas, P.; Spiliotis, E.; Sarmas, E.; Lekidis, A.; Stravodimos, G.; Sarigiannis, D.; Makarouni, I.; Marinakis, V.; Psarras, J. A multi-criteria approach for optimizing the placement of electric vehicle charging stations in highways. Energies 2022, 15, 9445. [Google Scholar] [CrossRef]
  24. Csiszár, C.; Csonka, B.; Földes, D.; Wirth, E.; Lovas, T. Location optimisation method for fast-charging stations along national roads. J. Transp. Geogr. 2020, 88, 102833. [Google Scholar]
  25. Nguyen, V.C.; Wang, C.-T.; Hsieh, Y.-J. Electrification of highway transportation with solar and wind energy. Sustainability 2021, 13, 5456. [Google Scholar] [CrossRef]
  26. Yap, K.Y.; Chin, H.H.; Klemeš, J.J. Solar Energy-Powered Battery Electric Vehicle charging stations: Current development and future prospect review. Renew. Sustain. Energy Rev. 2022, 169, 112862. [Google Scholar]
  27. Rehman, A.U.; Ullah, Z.; Shafiq, A.; Hasanien, H.M.; Luo, P.; Badshah, F. Load management, energy economics, and environmental protection nexus considering PV-based EV charging stations. Energy 2023, 281, 128332. [Google Scholar]
  28. Datta, U.; Kalam, A.; Shi, J. Smart control of BESS in PV integrated EV charging station for reducing transformer overloading and providing battery-to-grid service. J. Energy Storage 2020, 28, 101224. [Google Scholar] [CrossRef]
  29. Singh, B.; Kumar, A. Optimal energy management and feasibility analysis of hybrid renewable energy sources with BESS and impact of electric vehicle load with demand response program. Energy 2023, 278, 127867. [Google Scholar]
  30. Reibsch, R.; Gemassmer, J.; Katerbau, T. Low voltage grid resilience: Evaluating electric vehicle charging strategies in the context of the grid development plan Germany. eTransportation 2024, 20, 100323. [Google Scholar]
  31. Trinko, D.; Horesh, N.; Porter, E.; Dunckley, J.; Miller, E.; Bradley, T. Transportation and electricity systems integration via electric vehicle charging-as-a-service: A review of techno-economic and societal benefits. Renew. Sustain. Energy Rev. 2023, 175, 113180. [Google Scholar]
  32. Naderi, M.; Bahramara, S.; Khayat, Y.; Bevrani, H. Optimal planning in a developing industrial microgrid with sensitive loads. Energy Rep. 2017, 3, 124–134. [Google Scholar]
  33. Ashraf, M.A.; Liu, Z.; Alizadeh, A.A.; Nojavan, S.; Jermsittiparsert, K.; Zhang, D. Designing an optimized configuration for a hybrid PV/Diesel/Battery Energy System based on metaheuristics: A case study on Gobi Desert. J. Clean. Prod. 2020, 270, 122467. [Google Scholar]
  34. Kahwash, F.; Maheri, A.; Mahkamov, K. Integration and optimisation of high-penetration Hybrid Renewable Energy Systems for fulfilling electrical and thermal demand for off-grid communities. Energy Convers. Manag. 2021, 236, 114035. [Google Scholar]
  35. Das, B.K.; Hasan, M. Optimal sizing of a stand-alone hybrid system for electric and thermal loads using excess energy and waste heat. Energy 2021, 214, 119036. [Google Scholar]
  36. Hajinejad, A.; Seraj, F.; Jahangir, M.H.; Askari, M. Economic optimization of hybrid renewable energy systems supplying electrical and thermal loads of a tourist building in different climates. Front. Built Environ. 2023, 8, 969293. [Google Scholar]
  37. Qiu, T.; Faraji, J. Techno-economic optimization of a grid-connected hybrid energy system considering electric and thermal load prediction. Energy Sci. Eng. 2021, 9, 1313–1336. [Google Scholar]
  38. Rashid, S.M.; Zare-Ghaleh-Seyyedi, A.; Moosanezhad, J.; Khan, A.A. Multi-objective design of the energy storage-based combined heat and power off-grid system to supply of thermal and electricity consumption energies. J. Energy Storage 2023, 73, 108675. [Google Scholar]
  39. Kiani, H.; Nazari, M.H.; Khorsandi, A.; Abyaneh, H.A.; Hosseinian, S.H. Designing an Optimal Integrated Energy System Including Sustainable Resources for Real-Time Electrical and Thermal Loads Supplying, Considering Grid Interaction. In Proceedings of the 2024 28th International Electrical Power Distribution Conference (EPDC), Zanjan, Iran, 23–25 April 2024; pp. 1–7. [Google Scholar]
  40. Nazari, M.H.; Hosseinian, S.H.; Azad Farsani, E.; Faramarzi, D. An incentive-based policy on minimization of GHG emissions and loss using adaptive group search multi-objective optimization algorithm. Sci. Iran. 2022, 29, 230–246. [Google Scholar]
  41. Homayoun, R.; Bahmani-Firouzi, B.; Niknam, T. Multi-objective operation of distributed generations and thermal blocks in microgrids based on energy management system. IET Gener. Transm. Distrib. 2021, 15, 1451–1462. [Google Scholar]
  42. Weinand, J.M.; Hoffmann, M.; Göpfert, J.; Terlouw, T.; Schönau, J.; Kuckertz, P.; McKenna, R.; Kotzur, L.; Linßen, J.; Stolten, D. Global LCOEs of decentralized off-grid renewable energy systems. Renew. Sustain. Energy Rev. 2023, 183, 113478. [Google Scholar]
  43. Pal, A.; Rangudu, P.; Ravi, S.; Vullikanti, A.K. Using activity patterns to place electric vehicle charging stations in urban regions. In Proceedings of the 2018 IEEE International Parallel and Distributed Processing Symposium Workshops (IPDPSW), Vancouver, BC, Canada, 21–25 May 2018; pp. 1143–1152. [Google Scholar]
  44. Napoli, G.; Polimeni, A.; Micari, S.; Andaloro, L.; Antonucci, V. Optimal allocation of electric vehicle charging stations in a highway network: Part 1. Methodology and test application. J. Energy Storage 2020, 27, 101102. [Google Scholar]
  45. Liu, J.; Peper, J.; Lin, G.; Zhou, Y.; Awasthi, S.; Li, Y.; Rehtanz, C. A planning strategy considering multiple factors for electric vehicle charging stations along German motorways. Int. J. Electr. Power Energy Syst. 2021, 124, 106379. [Google Scholar]
  46. Islam, M.M.; Shareef, H.; Mohamed, A. Optimal location and sizing of fast charging stations for electric vehicles by incorporating traffic and power networks. IET Intell. Transp. Syst. 2018, 12, 947–957. [Google Scholar]
  47. Zhang, Y.; Yan, S.; Yin, W.; Wu, C.; Ye, J.; Wu, Y.; Liu, L. HOMER-based multi-scenario collaborative planning for grid-connected PV-storage microgrids with electric vehicles. Processes 2023, 11, 2408. [Google Scholar] [CrossRef]
  48. Sadeghi, D.; Naghshbandy, A.H.; Bahramara, S. Optimal sizing of hybrid renewable energy systems in presence of electric vehicles using multi-objective particle swarm optimization. Energy 2020, 209, 118471. [Google Scholar]
  49. Allouhi, A.; Rehman, S. Grid-connected hybrid renewable energy systems for supermarkets with electric vehicle charging platforms: Optimization and sensitivity analyses. Energy Rep. 2023, 9, 3305–3318. [Google Scholar]
  50. Muna, Y.B.; Kuo, C.-C. Feasibility and techno-economic analysis of electric vehicle charging of PV/wind/diesel/battery hybrid energy system with different battery technology. Energies 2022, 15, 4364. [Google Scholar] [CrossRef]
  51. Oladigbolu, J.O.; Mujeeb, A.; Imam, A.A.; Rushdi, A.M. Design, technical and economic optimization of renewable energy-based electric vehicle charging stations in Africa: The case of Nigeria. Energies 2022, 16, 397. [Google Scholar] [CrossRef]
  52. Azad, A.; Shateri, H. Design and optimization of an entirely hybrid renewable energy system (WT/PV/BW/HS/TES/EVPL) to supply electrical and thermal loads with considering uncertainties in generation and consumption. Appl. Energy 2023, 336, 120782. [Google Scholar]
  53. Bilal, M.; Ahmad, F.; Rizwan, M. Techno-economic assessment of grid and renewable powered electric vehicle charging stations in India using a modified metaheuristic technique. Energy Convers. Manag. 2023, 284, 116995. [Google Scholar]
  54. AlHammadi, A.; Al-Saif, N.; Al-Sumaiti, A.S.; Marzband, M.; Alsumaiti, T.; Heydarian-Forushani, E. Techno-economic analysis of hybrid renewable energy systems designed for electric vehicle charging: A case study from the United Arab Emirates. Energies 2022, 15, 6621. [Google Scholar] [CrossRef]
  55. Ekren, O.; Canbaz, C.H.; Güvel, Ç.B. Sizing of a solar-wind hybrid electric vehicle charging station by using HOMER software. J. Clean. Prod. 2021, 279, 123615. [Google Scholar]
  56. Bartolucci, L.; Cordiner, S.; Mulone, V.; Santarelli, M.; Ortenzi, F.; Pasquali, M. PV assisted electric vehicle charging station considering the integration of stationary first-or second-life battery storage. J. Clean. Prod. 2023, 383, 135426. [Google Scholar] [CrossRef]
  57. Boddapati, V.; Kumar, A.R.; Daniel, S.A.; Padmanaban, S. Design and prospective assessment of a hybrid energy-based electric vehicle charging station. Sustain. Energy Technol. Assess. 2022, 53, 102389. [Google Scholar] [CrossRef]
  58. Sadeghi, D.; Ahmadi, S.E.; Amiri, N.; Marzband, M.; Abusorrah, A.; Rawa, M. Designing, optimizing and comparing distributed generation technologies as a substitute system for reducing life cycle costs, CO2 emissions, and power losses in residential buildings. Energy 2022, 253, 123947. [Google Scholar] [CrossRef]
  59. Amry, Y.; Elbouchikhi, E.; Le Gall, F.; Ghogho, M.; El Hani, S. Optimal sizing and energy management strategy for EV workplace charging station considering PV and flywheel energy storage system. J. Energy Storage 2023, 62, 106937. [Google Scholar] [CrossRef]
  60. Qadir, S.A.; Ahmad, F.; Al-Motairi, H.; bin Saleh Al-Sada, M.; Al-Fagih, L. Renewable energy incentives for project owners representing communities with heavily subsidised fossil fuel-based electricity. Sustain. Cities Soc. 2024, 101, 105152. [Google Scholar] [CrossRef]
  61. Narasipuram, R.P.; Mopidevi, S. A technological overview & design considerations for developing electric vehicle charging stations. J. Energy Storage 2021, 43, 103225. [Google Scholar]
  62. Sadeghi, H.; Toghraie, D.; Moazzami, M.; Rezaei, M.M.; Dolatshahi, M. Integrated long-term planning of conventional and renewable energy sources in Iran’s off-grid networks. Renew. Energy 2022, 182, 134–162. [Google Scholar] [CrossRef]
  63. Jordán, J.; Martí, P.; Palanca, J.; Julian, V.; Botti, V. Interurban charging station network: An evolutionary approach. Neurocomputing 2023, 529, 214–221. [Google Scholar] [CrossRef]
  64. Türkoğlu, A.S.; Güldorum, H.C.; Sengor, I.; Çiçek, A.; Erdinç, O.; Hayes, B.P. Maximizing EV profit and grid stability through virtual power plant considering V2G. Energy Rep. 2024, 11, 3509–3520. [Google Scholar] [CrossRef]
  65. Aljohani, T. Intelligent type-2 fuzzy logic controller for hybrid microgrid energy management with different modes of EVs integration. Energies 2024, 17, 2949. [Google Scholar] [CrossRef]
  66. Alizadeh, M.; Tightiz, L.; Azimi Nasab, M. Providing an intelligent frequency control method in a microgrid network in the presence of electric vehicles. World Electr. Veh. J. 2024, 15, 276. [Google Scholar] [CrossRef]
  67. Sayed, M.A.; Ghafouri, M.; Atallah, R.; Debbabi, M.; Assi, C. Grid Chaos: An uncertainty-conscious robust dynamic EV load-altering attack strategy on power grid stability. Appl. Energy 2024, 363, 122972. [Google Scholar] [CrossRef]
  68. Xiao, S.; Ding, L.; Ye, M.; Yue, D.; Ge, H. Resource-Efficient and Resilient SOC/SOH Co-Monitoring of EV Batteries With Attack Detection. IEEE Trans. Smart Grid 2025. [Google Scholar] [CrossRef]
  69. NASA Surface Meteorology and Solar Energy. Available online: http://www.nasa.gov (accessed on 31 December 2024).
  70. Kiani, H.; Gharibvand, H.; Nazari, M.H.; Gharehpetian, G.B.; Hosseinian, S.H. Optimal Hybrid Renewable Energy System Design: A Techno-Economic Analysis Across Diverse Sites. AUT J. Electr. Eng. 2025, 57, 185–202. [Google Scholar] [CrossRef]
  71. Amini, M.; Nazari, M.H.; Hosseinian, S.H. Optimal scheduling and cost-benefit analysis of lithium-ion batteries based on battery state of health. IEEE Access 2022, 11, 1359–1371. [Google Scholar] [CrossRef]
  72. Akhtari, M.R.; Baneshi, M. Techno-economic assessment and optimization of a hybrid renewable co-supply of electricity, heat and hydrogen system to enhance performance by recovering excess electricity for a large energy consumer. Energy Convers. Manag. 2019, 188, 131–141. [Google Scholar] [CrossRef]
  73. Toopshekan, A.; Rahdan, P.; Rad, M.A.V.; Yousefi, H.; Astaraei, F.R. Evaluation of a stand-alone CHP-Hybrid system using a multi-criteria decision making due to the sustainable development goals. Sustain. Cities Soc. 2022, 87, 104170. [Google Scholar] [CrossRef]
  74. Mahian, O.; Javidmehr, M.; Kasaeian, A.; Mohasseb, S.; Panahi, M. Optimal sizing and performance assessment of a hybrid combined heat and power system with energy storage for residential buildings. Energy Convers. Manag. 2020, 211, 112751. [Google Scholar] [CrossRef]
  75. Riayatsyah, T.; Geumpana, T.; Fattah, I.R.; Rizal, S.; Mahlia, T.I. Techno-economic analysis and optimisation of campus grid-connected hybrid renewable energy system using HOMER grid. Sustainability 2022, 14, 7735. [Google Scholar] [CrossRef]
  76. Available online: https://www.irema.ir (accessed on 31 December 2024).
  77. Available online: https://www.irema.ir/participants/renewable-energy-and-energy-efficiency-organization-satba (accessed on 31 December 2024).
  78. Singh, S.; Singh, M.; Kaushik, S.C. Feasibility study of an islanded microgrid in rural area consisting of PV, wind, biomass and battery energy storage system. Energy Convers. Manag. 2016, 128, 178–190. [Google Scholar] [CrossRef]
  79. Jordan, D.C.; Kurtz, S.R.; VanSant, K.; Newmiller, J. Compendium of photovoltaic degradation rates. Prog. Photovolt. Res. Appl. 2016, 24, 978–989. [Google Scholar]
  80. Dumbrava, V.; Lazaroiu, G.C.; Leva, S.; Balaban, G.; Teliceanu, M.; Tîrşu, M. Photovoltaic production management in stochastic optimized microgrids. UPB Sci. Bull. Ser. C Electr. Eng. Comput. Sci. 2017, 79, 225–244. [Google Scholar]
  81. Sima, C.A.; Popescu, M.O.; Popescu, C.L. Sensitivity analysis of optimal economic dispatch. UPB Sci. Bull. Ser. C Electr. Eng. Comput. Sci. 2020, 82, 223–236. [Google Scholar]
Figure 1. Energy structure in Iran: (a) Total energy production; (b) Electrical energy generation; (c) Sectors energy consumption; (d) Sectors electricity consumption.
Smartcities 08 00061 g001aSmartcities 08 00061 g001b
Figure 2. Assessment Flowchart and design framework for the proposed hybrid model system.
Smartcities 08 00061 g002
Figure 3. Locations of various places in Iran considered in this research work.
Smartcities 08 00061 g003
Figure 4. Proposed System Architecture.
Smartcities 08 00061 g004
Figure 5. The solar irradiance and WS power across different regions of Iran.
Smartcities 08 00061 g005
Figure 6. Monthly wind speed (a), ambient temperature (b), and solar irradiance (c) for nine selected locations.
Smartcities 08 00061 g006
Figure 7. Monthly profile of electric energy (a) and thermal energy (b) demand.
Smartcities 08 00061 g007aSmartcities 08 00061 g007b
Figure 8. Real time Electricity price during a year in hours (8760 h).
Smartcities 08 00061 g008
Figure 9. Monthly electricity production by different scenarios.
Smartcities 08 00061 g009
Figure 10. Monthly energy production by HRESs and average scheduling of EVCSs, (a) SC 1–5 and (b) SC 6–9.
Smartcities 08 00061 g010aSmartcities 08 00061 g010b
Table 1. A brief overview of recent research in the field of IHRESs and EVCS.
Ref. Load ModelingHybrid Energy SourcesStorage DevicesThermal DevicesEconomicEnvironmentDRPSOLVER
ElectricThermalEVCSPVWTDGCHPBESSFlywheelBoilerTLC
[36]× ××××HOMER
[41]× × ××××TLBO-CSA
[33]××××××××PSO-HOMER
[34]×××××××GA-HOMER
[35]××××××××HOMER
[37]××××HOMER
[38]××××HA
[47]× ××××××HOMER
[48]××××××××MOPSO
[49]××××××××HOMER
[50]×××××××HOMER
[52]××××××××GWO-SCA
[53]×××××××××MSSA
[54]××××××××HOMER
[56]× ××××××MOGA-MILP
[57]××××××HOMER
[58]×××××HOMER-MOPSO
[59]×××× ××××MILP
[60]×××××××××HOMER
[62]××××HOMER
This
study
××HOMER
Table 2. Diesel generator operation and maintenance.
Maintenance Intervals
(Operating Hours)
250500100030004000
Downtime (Hour)20.5111
Table 3. The technical specifications of the EVCS.
ParameterCharger Output PowerNumber of ChargersAverage Charging DurationScaled Average Session PER Day
Value50 kW100.3 h20
Table 4. The project economic data.
ParameterValueRef.
Inflation rate [%]18[65]
Discount rate [%]17.5[65]
Project lifetime [year]25-
Table 5. Economic specification for the components of the proposed HRESs.
ComponentsTypeCapital Cost ($)Replacement Cost ($)O&M Cost ($)Life Time (Year)Ref.
PVFlat plate PV107310731025[75]
BESS1 kWh Lead Acid30021002510[75]
WTXANT-M-21-100 kW210,000210,000350025[39]
CHPAuto size Genset428357215,000 h[73]
CONVERTERSystem converter53047411.315[39]
Table 6. Technical specification for the component of the proposed IHRESs.
ComponentParameterValue
Flat plate PVNominal operation cell temperature47 °C
Temperature coefficient −0.5%/°C
Efficiency at standard test condition13%
Derating factor 80%
Generic 1 kWh Li-Ion [ASM]Nominal capacity1020 AH
Round trip efficiency80%
Max charge current270 A
Max discharge current810 A
Minimum state of charge20%
XANT-M-21-100 kWRotor diameter (m)21 m
Rated capacity100 kW
Hub height35 m
Cut-in wind speed3 m/s
Cut-out wind speed20 m/s
Autosize GensetMin load ratio25%
Fuel curve slope0.236 m3/h/kW
Fuel curve intercept13.1 m3/h
CHP Heat Recovery Ratio80%
Minimum Runtime 30 min
System convertsInverter efficiency 95%
Rectifier efficiency95%
Rectifier capacity100%
Generic boilerEfficiency 85%
Table 7. The capacity and the price of generic flat-panel solar PV.
Capacity
(kW)
Capital Cost
($)
Replacement Cost
($)
O&M
($/Year)
553655365100
1099799979180
1000708,180708,1801500
20001,158,8401,158,8403000
Table 8. The capacity and the price of generic 1 kWh Li-ion [70].
Capacity
(kW)
Capital Cost
($)
Replacement Cost
($)
O&M
($/Year)
5350035000
10700070000
200110,000110,0001800
2000850,000850,00016,000
80003,200,0003,200,00064,000
16,0006,000,0006,000,000112,000
Table 9. Emission production considered for fuel- based resources by HOMER software.
ParameterDGBoilerUnit
Carbon monoxide6.424.4g/m3 of fuel
Particulate matter0.1810.04g/m3 of fuel
Nitrogen oxides13.4712g/m3 of fuel
Table 10. Grid emissions according to the Iranian national grid.
ParameterDGUnit
Carbon dioxide632g/kWh
Sulfur dioxide2.74g/kWh
Nitrogen oxides1.34g/kWh
Table 11. Techno-economic comparison of different scenarios.
Scenario
Number
Renewable
Fraction
(%)
PV
(kW)
WT
100 kW
(Qty.)
Diesel
(kW)
BESS
(Qty.)
ConverterCOE
($/kWh)
Initial
Capital
(M$)
Operating
Cost
($/year)
NPC
(M$)
SC1A12.44.8721.4203.170.04231.3124,0301.69
B17.84.5811.4212.280.04970.64640,4831.72
C10.4262-1.4241460.04700.58641,3021.76
SC2A15.819411.441400.04871.320,8901.78
B16.120411.4101330.04740.71641,4091.68
C14.9290-1.4222190.04590.65641,5771.76
SC3A13.317811.4201160.05111.2823,7741.91
B14.620411.4211330.04970.72141,4481.87
C10.2224-1.4101310.04440.50842,7741.69
SC4A17.119111.4401140.04711.2822,1801.8
B17.120411.4101160.04650.71640,3941.78
C10.3234-1.4131270.04470.52341,5331.70
SC5A16.317511.4801140.04711.2719,9861.80
B17.519511.4811270.04990.73943,1361.88
C15.4245-1.41031480.04680.68643,1811.75
SC6A13.51031.420100.04731.2525,5141.83
B14.416.131.446150.04310.68735,8461.77
C11.6244-1.41621690.05100.65340,7851.89
SC7A21.635.331.447190.04181.3525,3701.93
B22.745.231.45322.10.04050.88734,8791.81
C10.6205-1.4901460.04730.55640,5731.76
SC8A14.920911.4351230.04921.331,2121.87
B16.223311.4801410.04770.74640,7281.82
C15.1312-1.4882030.04440.65839,8471.71
SC9A16.521411.4641270.04791.3219,5011.83
B17.626011.4911690.04660.76938,8621.80
C16.7312-1.41263050.04550.71240,3661.78
Disclaimer/Publisher’s Note: The statements, opinions and data contained in all publications are solely those of the individual author(s) and contributor(s) and not of MDPI and/or the editor(s). MDPI and/or the editor(s) disclaim responsibility for any injury to people or property resulting from any ideas, methods, instructions or products referred to in the content.

