3.2. Electrochemical Behavior
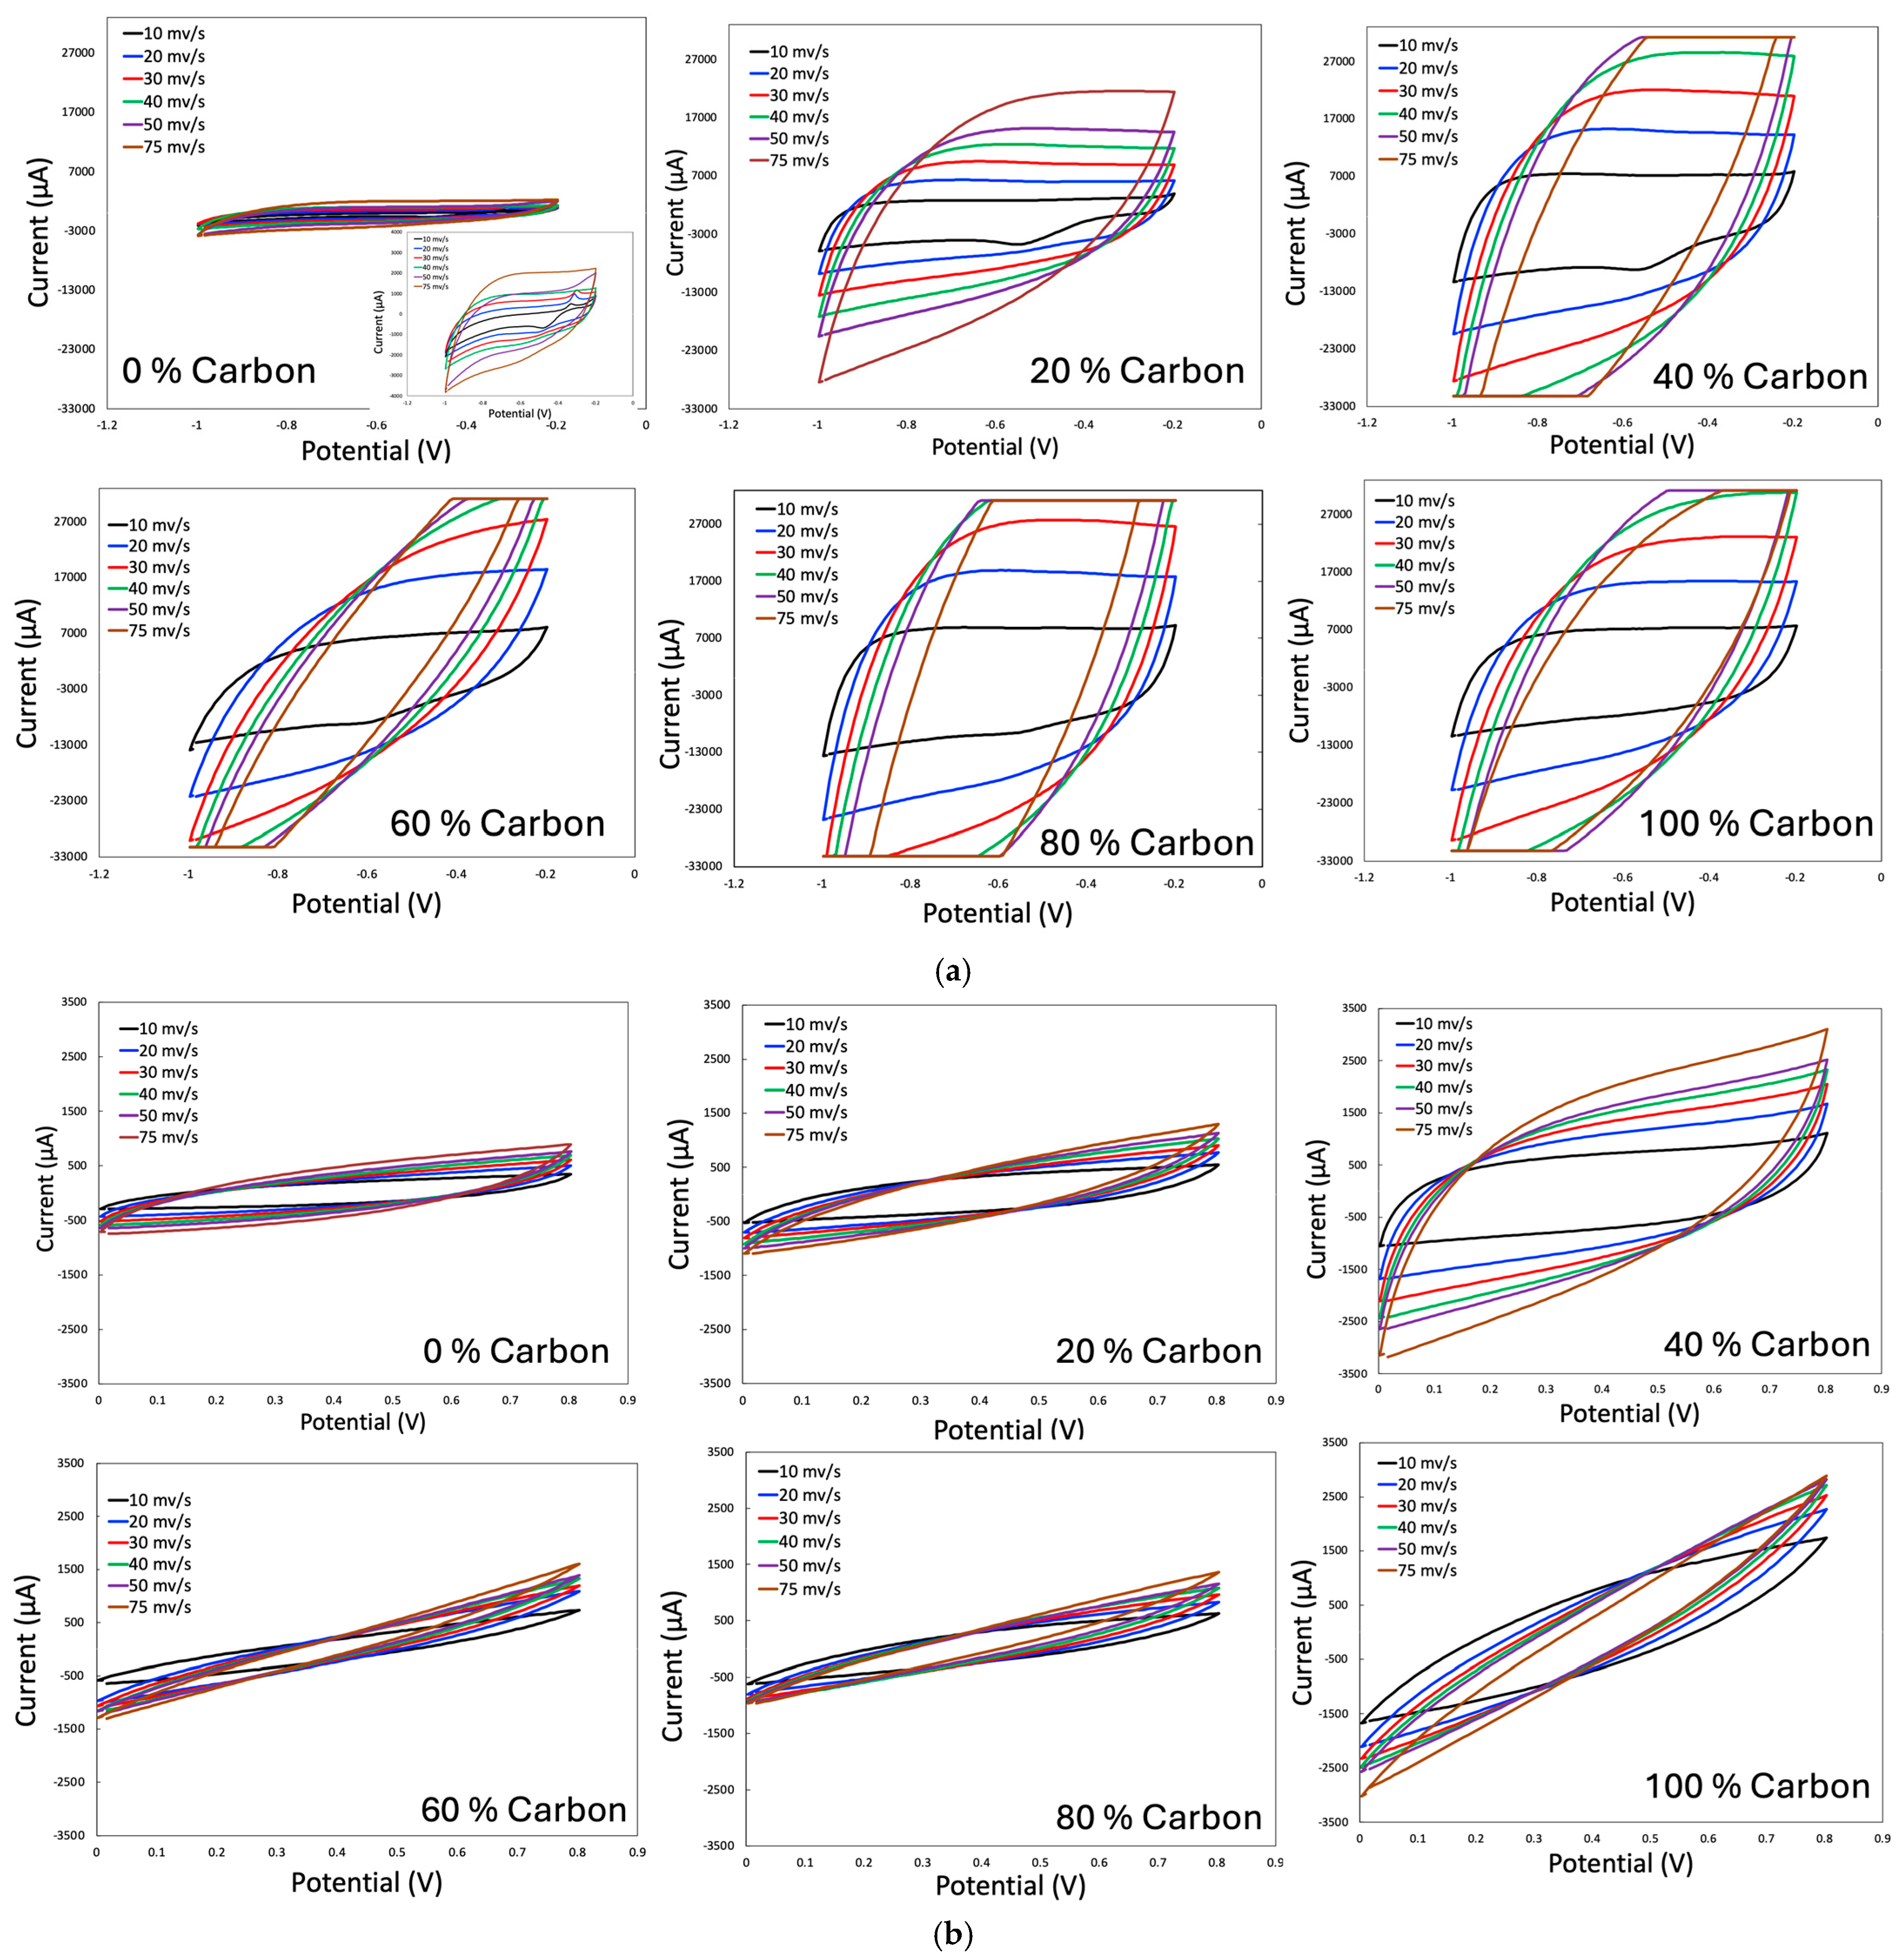
The cyclic voltammetry plots in 6 M KOH, 1 M Na
2SO
4, and the mixture of 1 M Na
2SO
4 and 0.03 M K
3[Fe(CN)
6] are shown in
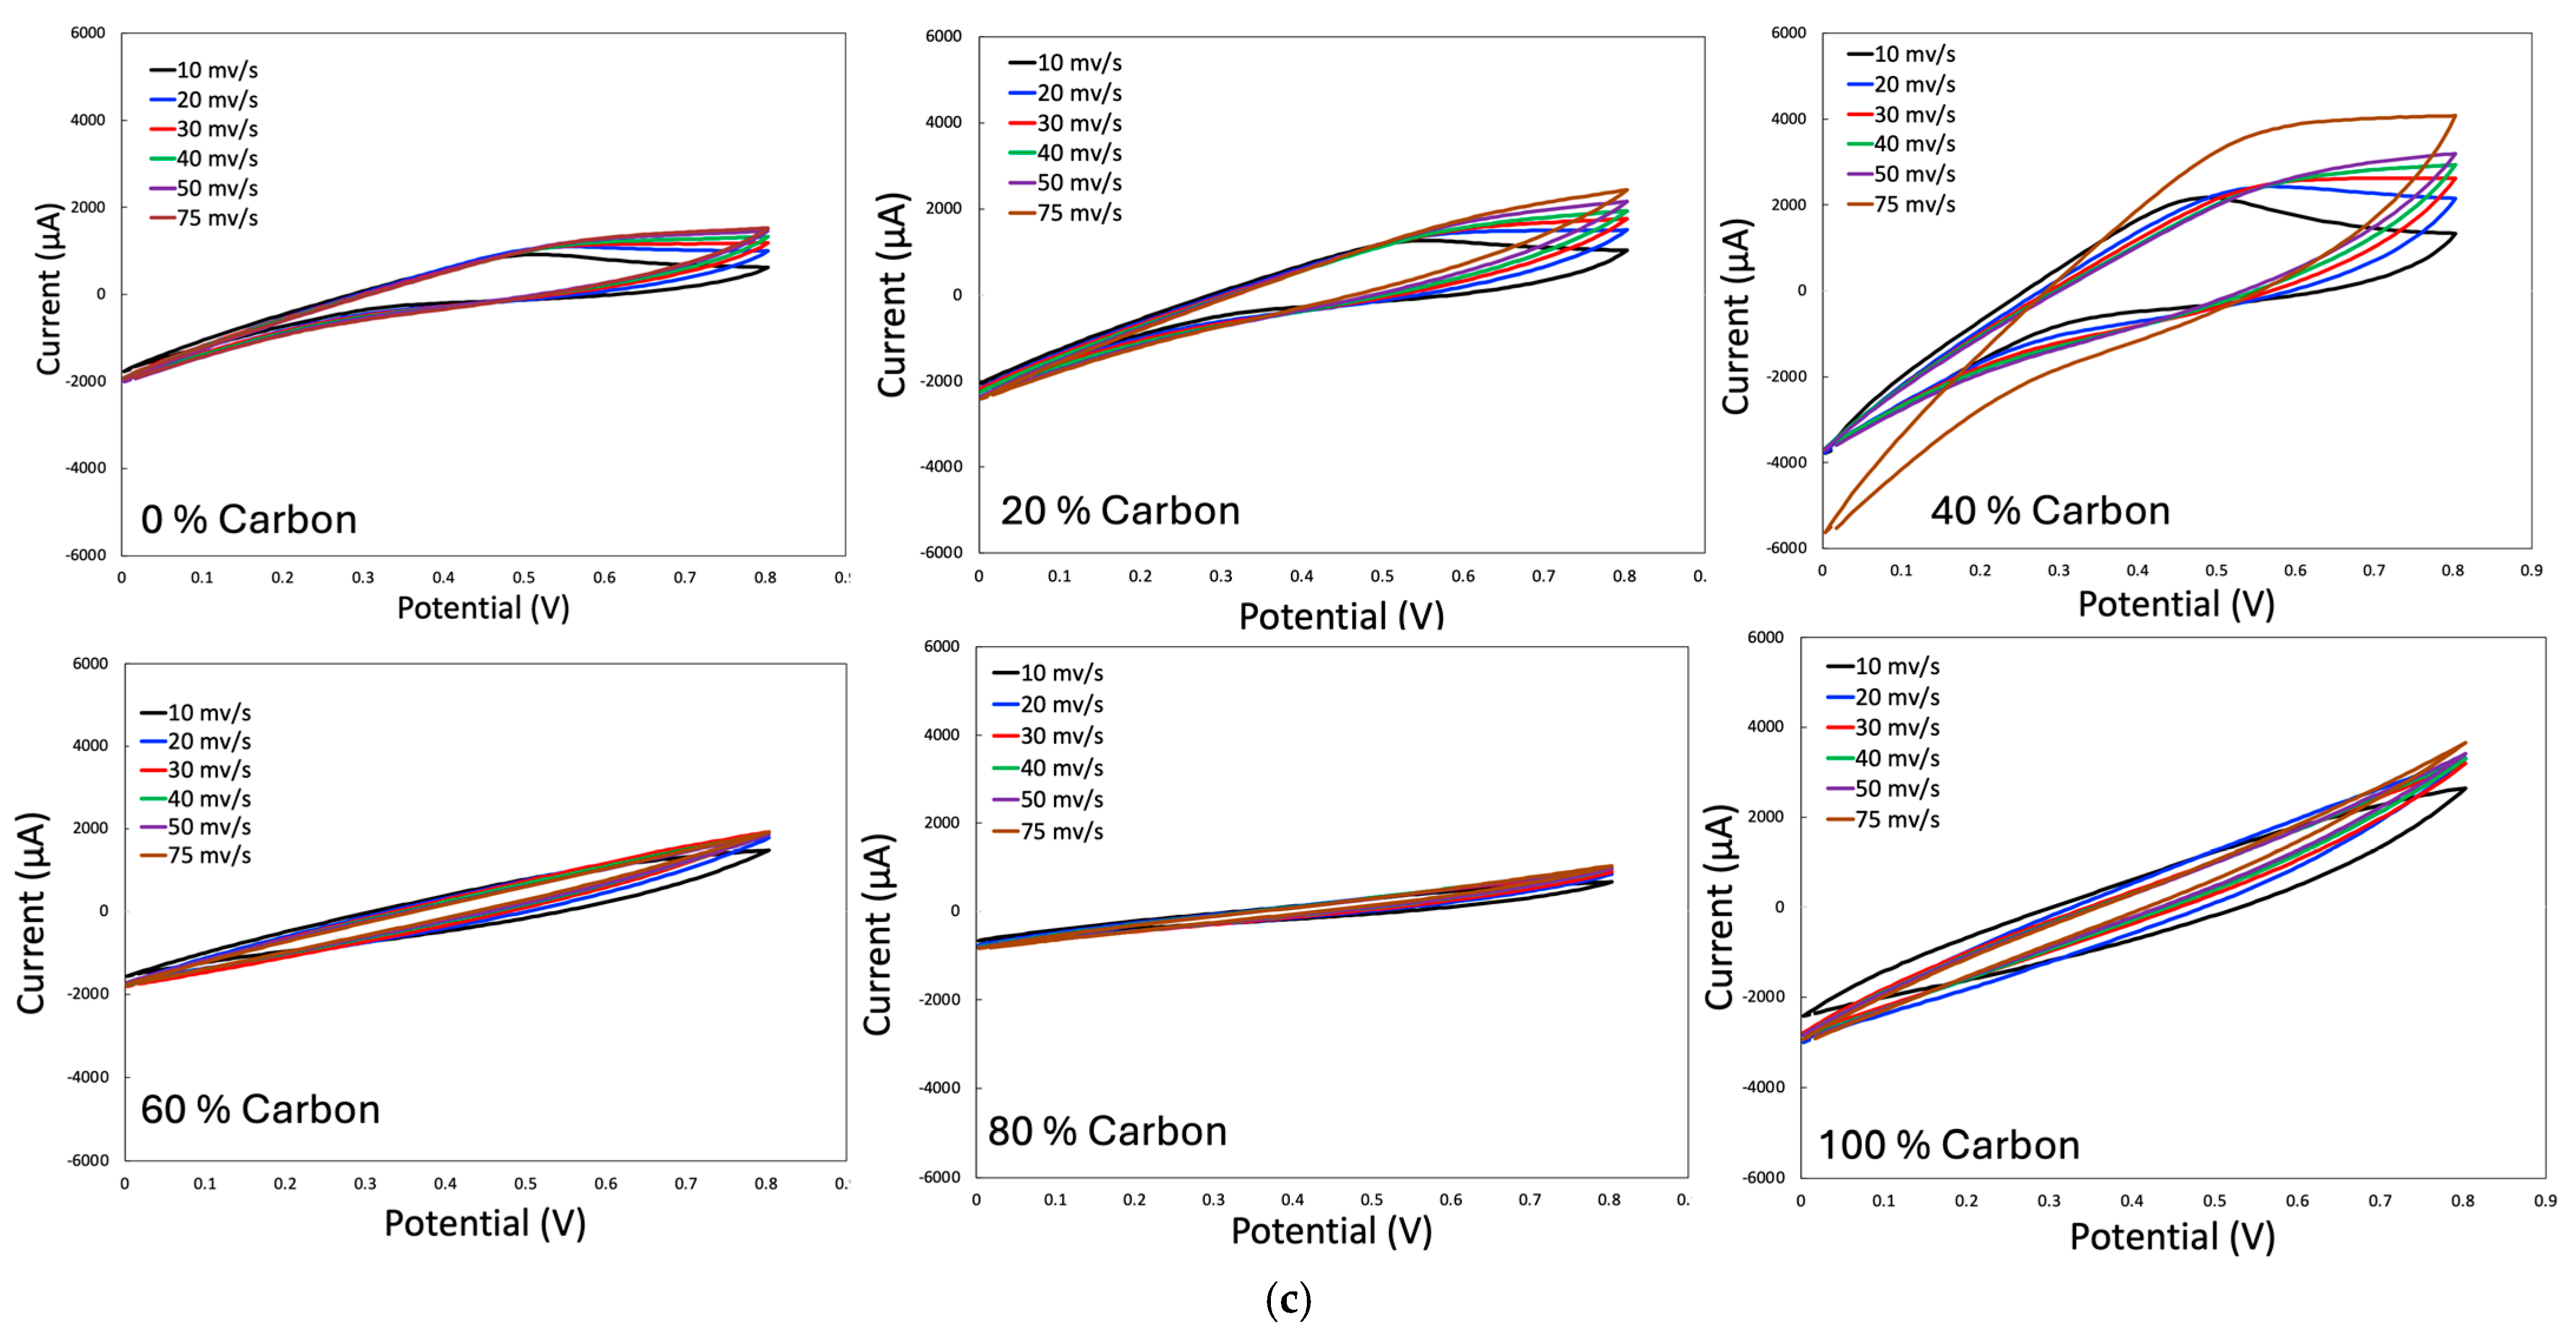
Figure 5a–c, respectively, for the scan rates of 10, 20, 30, 40, 50, and 75 mV/s in all the compositions of porous carbon MnO
2. Specific pseudocapacitance peaks originating from the MnO
2 are observed in all compositions except 100% carbon for KOH-based electrolyte and 0–40% carbon for the mixture of Na
2SO
4 and K
3[Fe(CN)
6]-based electrolytes; no such peaks are observed in pure Na
2SO
4-based electrolytes. It can also be observed that, at high scan rates for the KOH-based electrolyte, a few of the CV plots are truncated as they exceed the maximum current range of the instrument.
In alkaline electrolytes such as KOH, MnO2 typically exhibits pseudocapacitance through fast, reversible faradaic processes occurring at or near the surface, coupled with cation insertion/extraction and/or surface adsorption. The alkaline environment generally provides high ionic conductivity and facilitates rapid charge compensation, which can improve apparent capacitance and rate capability relative to many neutral electrolytes (though the exact behavior depends strongly on MnO2 phase, hydration, crystallinity, and loading). Mechanistically, the redox chemistry is commonly described as the Mn(IV)/Mn(III) redox couple, with charge balance achieved by electrolyte cations (K+) and/or protons associated with structural water/hydroxylated surface groups.
A widely used simplified representation in alkaline media is the K
+-assisted surface/insertion reaction. This scheme is frequently used to describe K
+ insertion/extraction (or adsorption/desorption with partial insertion) as the charge-compensation mechanism during Mn reduction/oxidation in KOH [
15].
In addition to K
+ participation, many MnO
2 materials exhibit proton-coupled processes even in non-acidic electrolytes, often written generically as
In practice, the “H
+” term is often interpreted as proton activity associated with surface –OH groups and structural/adsorbed water, rather than free protons in bulk alkaline solution. The broader idea—pseudocapacitance via reversible Mn valence changes compensated by cations (including K
+) and/or protons—is discussed in mechanistic overviews of MnO
2 electrochemical capacitors [
11,
29,
30].
In neutral “mild” electrolytes such as Na2SO4, MnO2 pseudocapacitance is classically described as surface/near-surface redox accompanied by insertion (or adsorption) of cations from the electrolyte—here, primarily Na+—and frequently with co-participation of protons (again, often from structural/adsorbed water rather than high bulk [H+]). The key point is that charge storage is not purely EDLC; it involves fast faradaic reactions that can still look quasi-rectangular in CV when kinetics are favorable and films are thin.
A common expression used for Na
+-compensated pseudocapacitance is
and, as above, a proton-coupled representation like (2) is also used.
These “mild electrolyte” pseudocapacitive concepts (cation-assisted redox with Mn valence change) are summarized clearly in mechanistic discussions of MnO
2 capacitors [
15,
29]. Experimentally, MnO
2 performance in neutral sulfate electrolytes has been widely reported; for example, MnO
2 nanorods tested in Li
2SO
4/Na
2SO
4/K
2SO
4 show capacitive behavior strongly dependent on the identity of the electrolyte cation, consistent with a cation-involved mechanism rather than purely EDLC [
31]. The absence of pseudocapacitance peaks in CV plots for Na
2SO
4 may suggest that surface adsorption may be the possible cause, which was also demonstrated earlier [
29].
When K
3[Fe(CN)
6] is added to Na
2SO
4, the electrolyte becomes redox-active due to the reversible ferricyanide/ferrocyanide couple:
This reaction provides an additional faradaic charge-storage pathway in the electrolyte itself. In such systems, the measured charge during GCD (and sometimes CV at sufficiently slow scan rates) is no longer attributable solely to MnO
2 (or carbon) pseudocapacitance/EDLC; instead, it becomes a hybrid of electrode pseudocapacitance and electrolyte redox charge. The role of K
3[Fe(CN)
6] as a redox additive that enhances apparent capacitance/energy density in aqueous supercapacitors is widely documented and reviewed [
21,
31,
32].
In the presence of MnO
2, two coupled processes occur during charge/discharge, similar to the reactions provided in (2) and (3) above. However, an electrolyte redox mediation (ferricyanide/ferrocyanide) happens as follows:
The ferri/ferrocyanide couple can act as a redox shuttle/charge buffer, enabling extra charge to be stored and released through reversible solution-phase redox. This can (a) increase apparent capacitance, (b) reduce polarization in some regimes by improving effective charge-transfer kinetics, and (c) strongly accentuate time-scale effects, which is why many systems show much larger “capacitance” in GCD than CV when redox additives are present [
21,
22,
33]. A clear example of K
3[Fe(CN)
6] boosting performance in aqueous supercapacitors is reported for symmetric devices in Na
2SO
4 with a ferricyanide additive, where the additive increases electrolyte conductivity and adds faradaic charge storage through the Fe(CN)
63−/
4− couple. Recent reviews also summarize ferricyanide as one of the most commonly used redox additives in neutral aqueous electrolytes for supercapacitors.
The specific capacitance originated from the CV plots can be calculated as
where
= specific capacitance (F/g);
= area of the CV plot (A.V);
= mass of active material in the electrode (g);
= scan rate (V/s);
= potential window of voltage sweep (V).
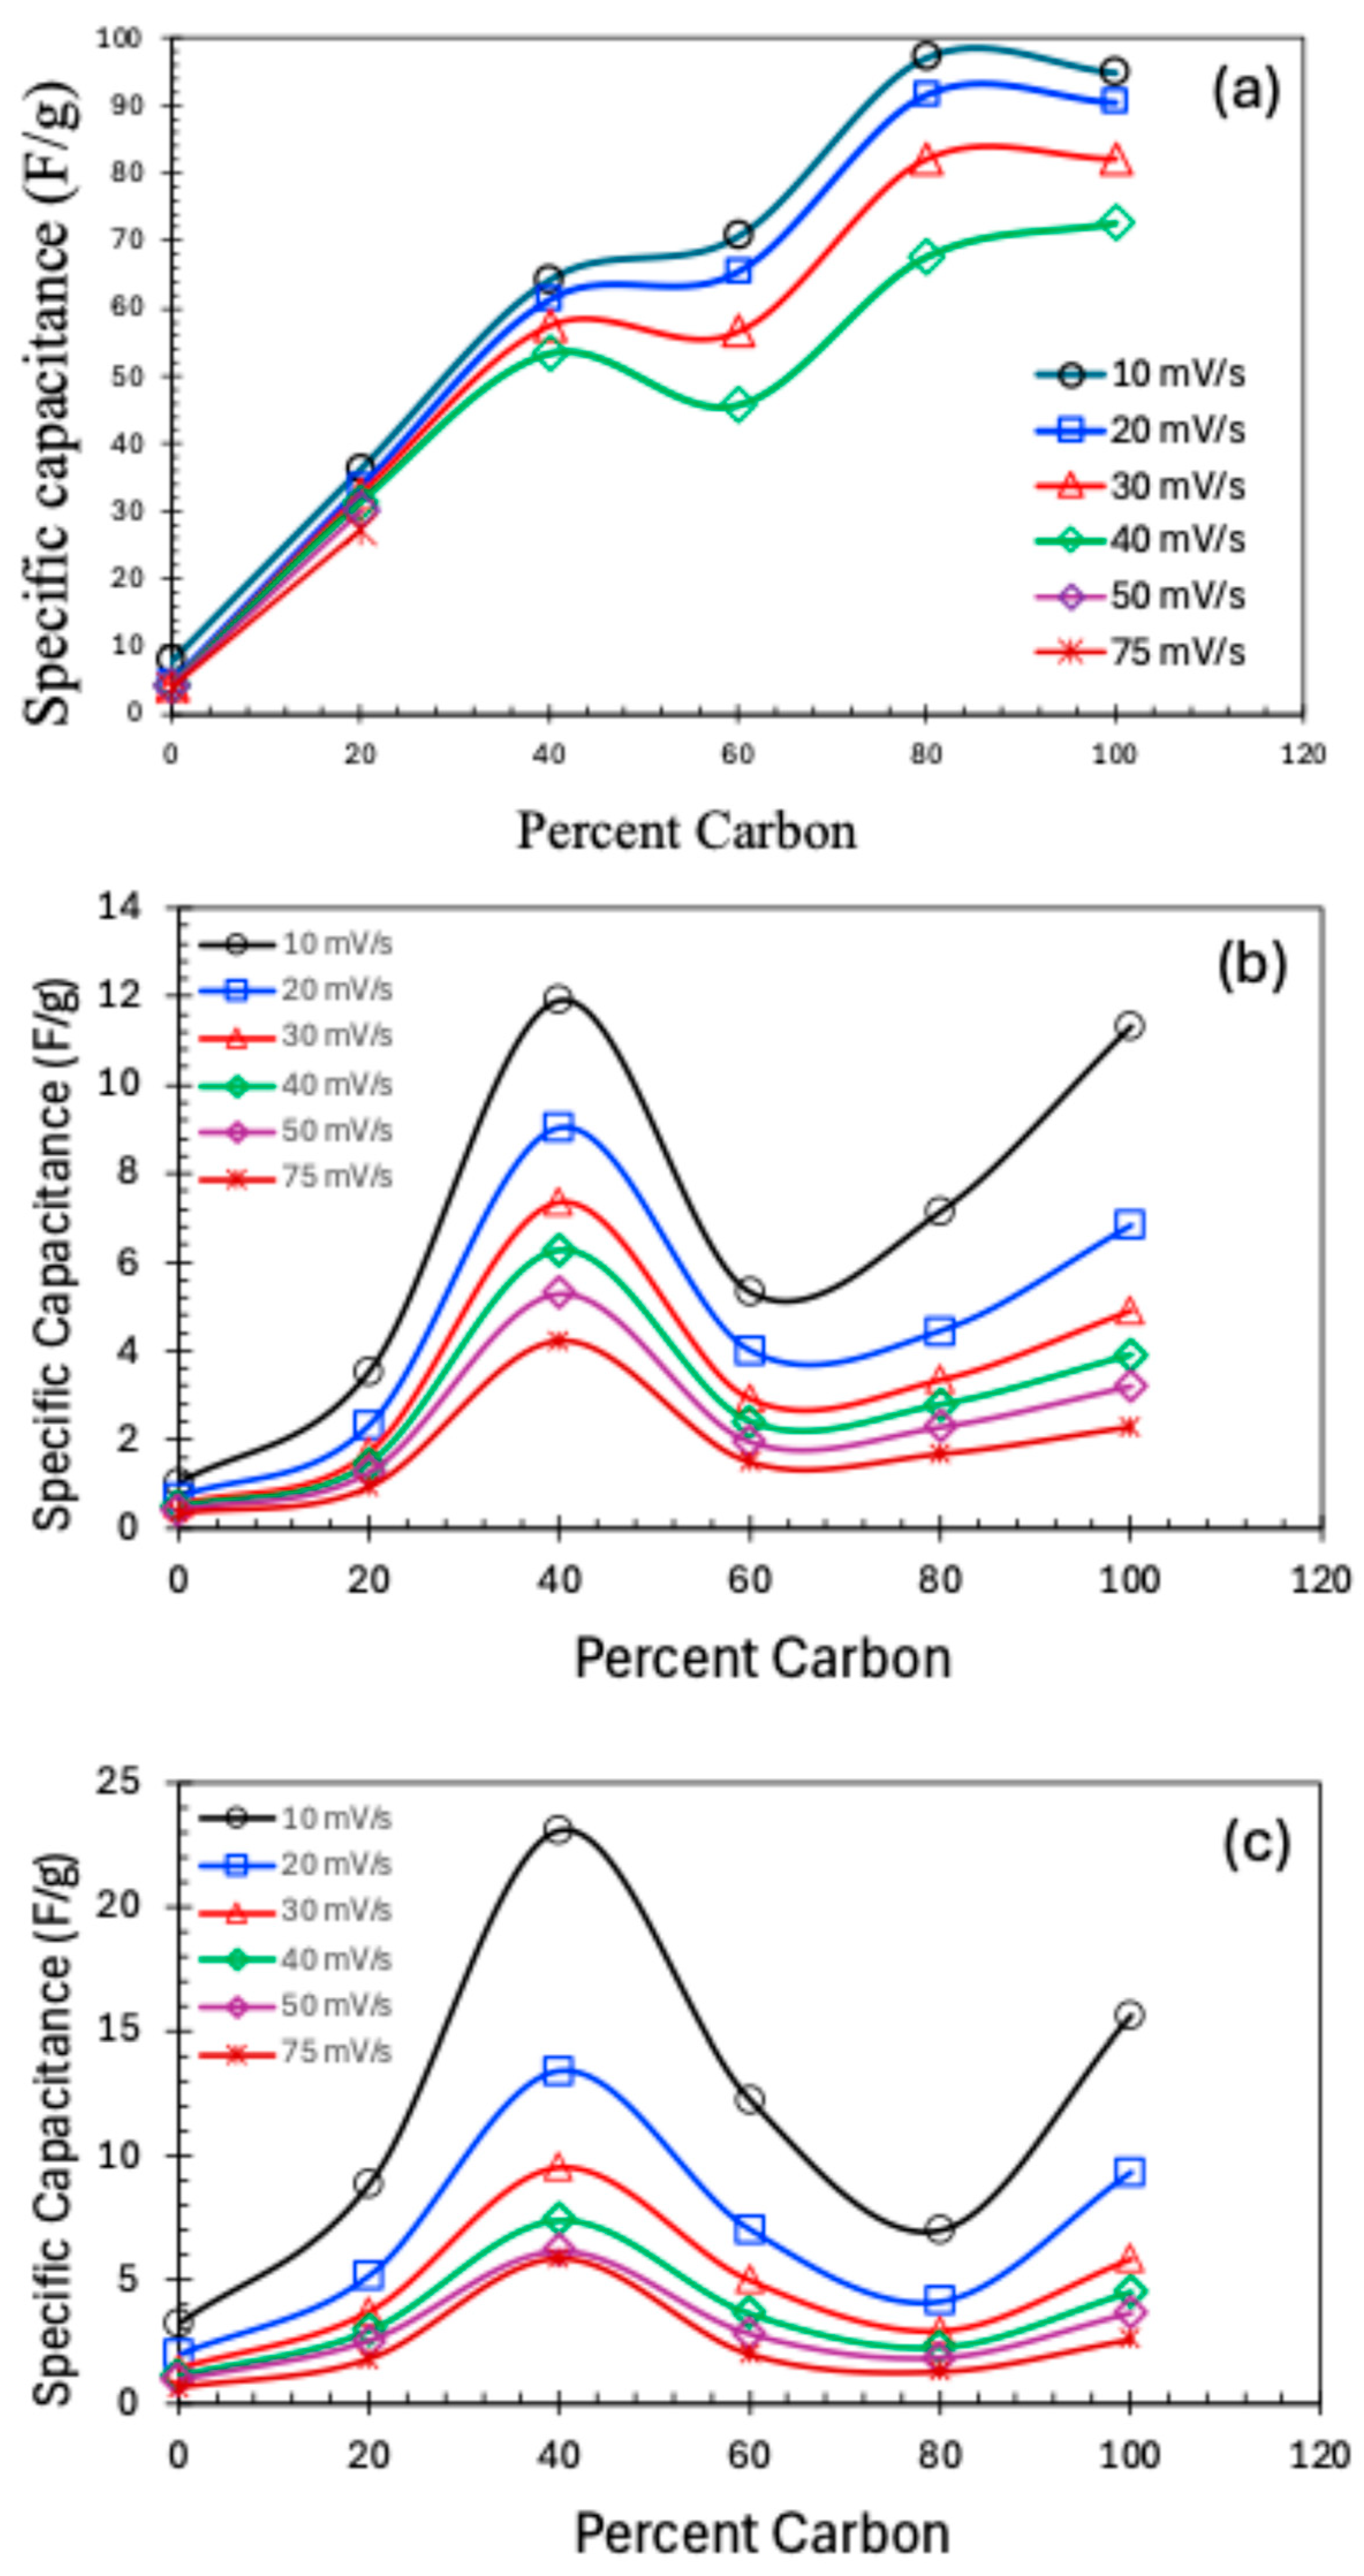
The specific capacitance as a function of carbon percent in the composite electrodes is shown in
Figure 6a–c for KOH and Na
2SO
4 and a mixture of Na
2SO
4 and K
3[Fe(CN)
6] as electrolytes, respectively. In such CV-based capacitance, KOH-based electrolytes demonstrate the highest specific capacitance values, and the capacitance increases with the increase in carbon content. Such behavior suggests that carbon contributes more to the specific capacities compared to the MnO
2, and hence MnO
2 does not have an influence. However, a different scenario is observed for the remaining two electrolytes. For all scan rates and for the two remaining electrolytes, specific capacitance is very low for pure MnO
2, increases with the increase in porous carbon content, and then decreases.
In contrast to MnO2, porous carbon possesses high electronic conductivity and extensive accessible surface area, enabling rapid electron transport and efficient formation of the electric double layer. Consequently, pure porous carbon electrodes typically exhibit higher specific capacitance than pure MnO2, even though MnO2 has a higher theoretical capacitance. This apparent contradiction arises because the theoretical pseudocapacitance of MnO2 is rarely achieved in practice due to poor conductivity, slow ion diffusion, and incomplete utilization of the bulk material. When MnO2 is introduced into a porous carbon matrix, the system becomes electronically heterogeneous. During CV measurements, which rely on rapid potential sweeps, electron transport through MnO2 domains becomes rate-limiting. Even though the surrounding carbon network is highly conductive, electrons must still traverse MnO2 regions to access pseudocapacitive sites. This leads to significant polarization and incomplete redox utilization of MnO2 during CV, particularly at practical scan rates. When mixed with carbon, the conductive carbon framework acts as an efficient current collector, enabling MnO2 particles to participate more fully in faradaic charge storage. The composite of 40% carbon/60% MnO2 demonstrated the highest specific capacitance values. The superior electrochemical performance observed for the composite containing 40% nanoporous carbon and 60% MnO2 might have resulted from an optimal balance between electronic conductivity, ion-transport pathways, and utilization of MnO2 surface sites. At 40% carbon content, this conductive network becomes sufficiently interconnected to effectively “wire” the MnO2 domains, allowing the majority of MnO2 surface sites to participate in fast charge storage. The decrease in specific capacitance at the higher scan rates is a common observation. At higher scan rates, the applied voltage changes faster than ions can diffuse into the micro- and mesoporous networks of the carbon. As a result, charge storage becomes confined mainly to the external surface or larger pores. This limited ionic access leads to incomplete charging and a reduced current response, which in turn lowers specific capacitance and distorts the cyclic voltammetry (CV) profile.
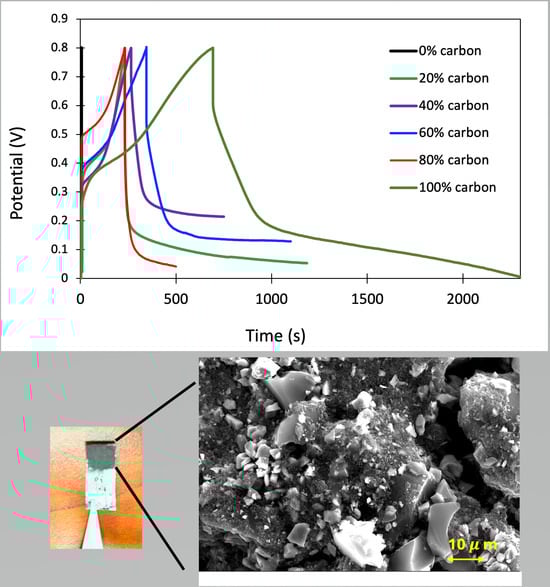
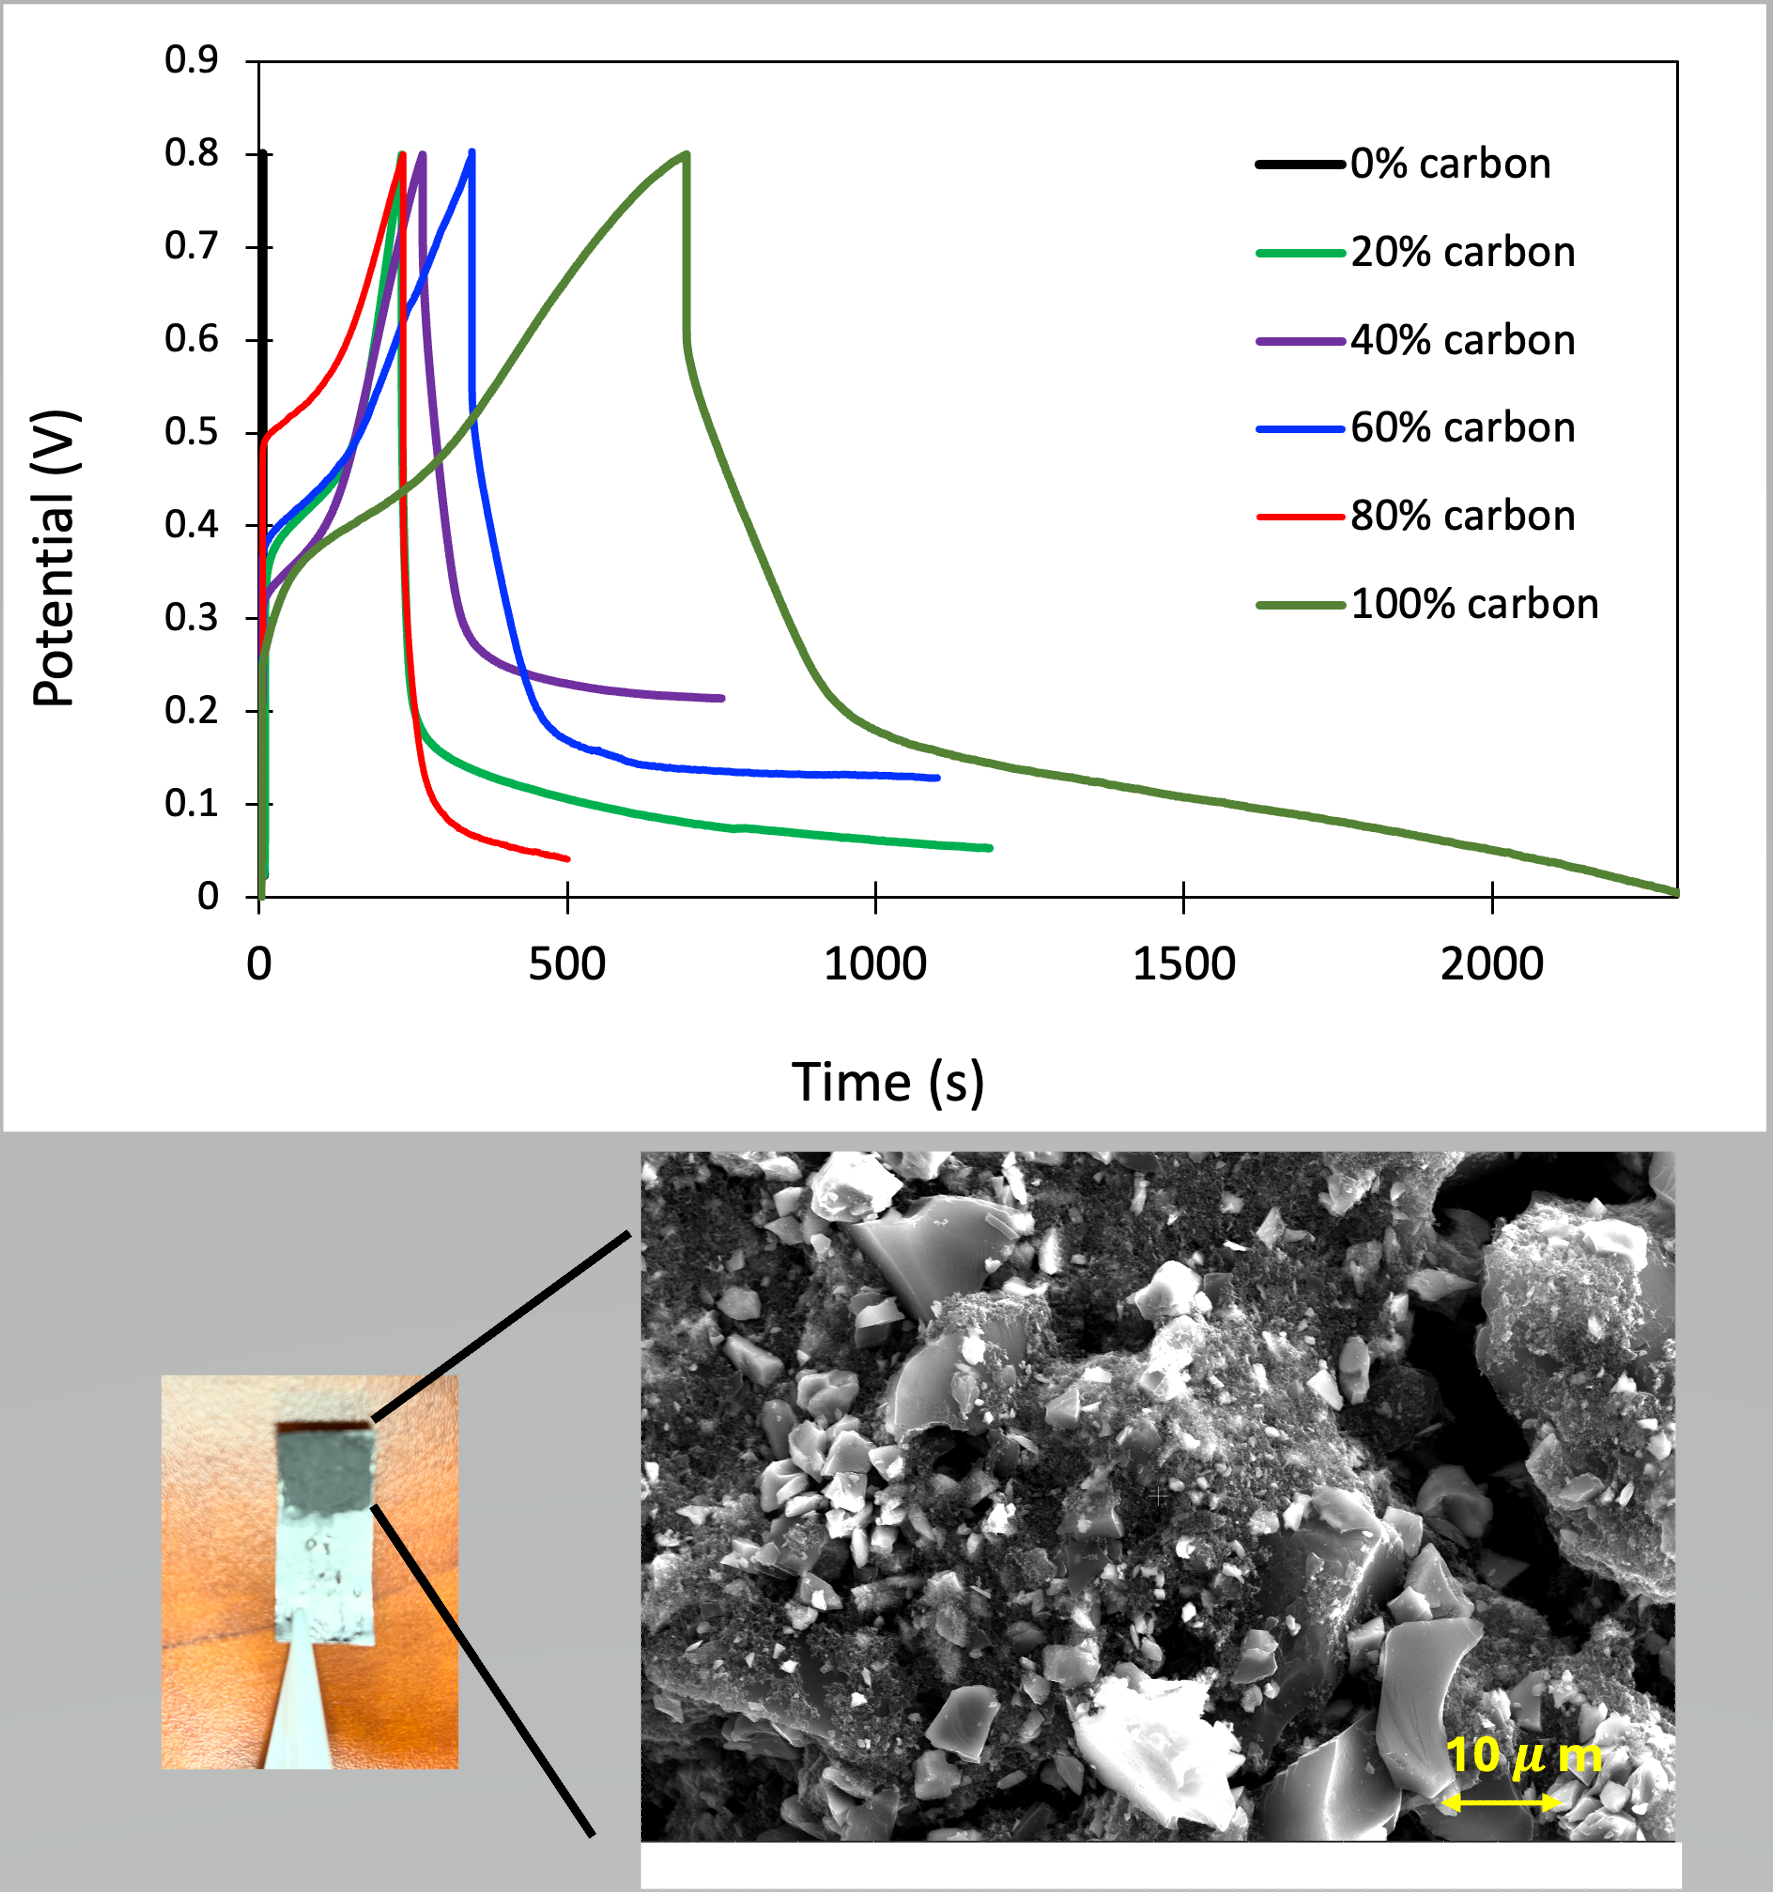
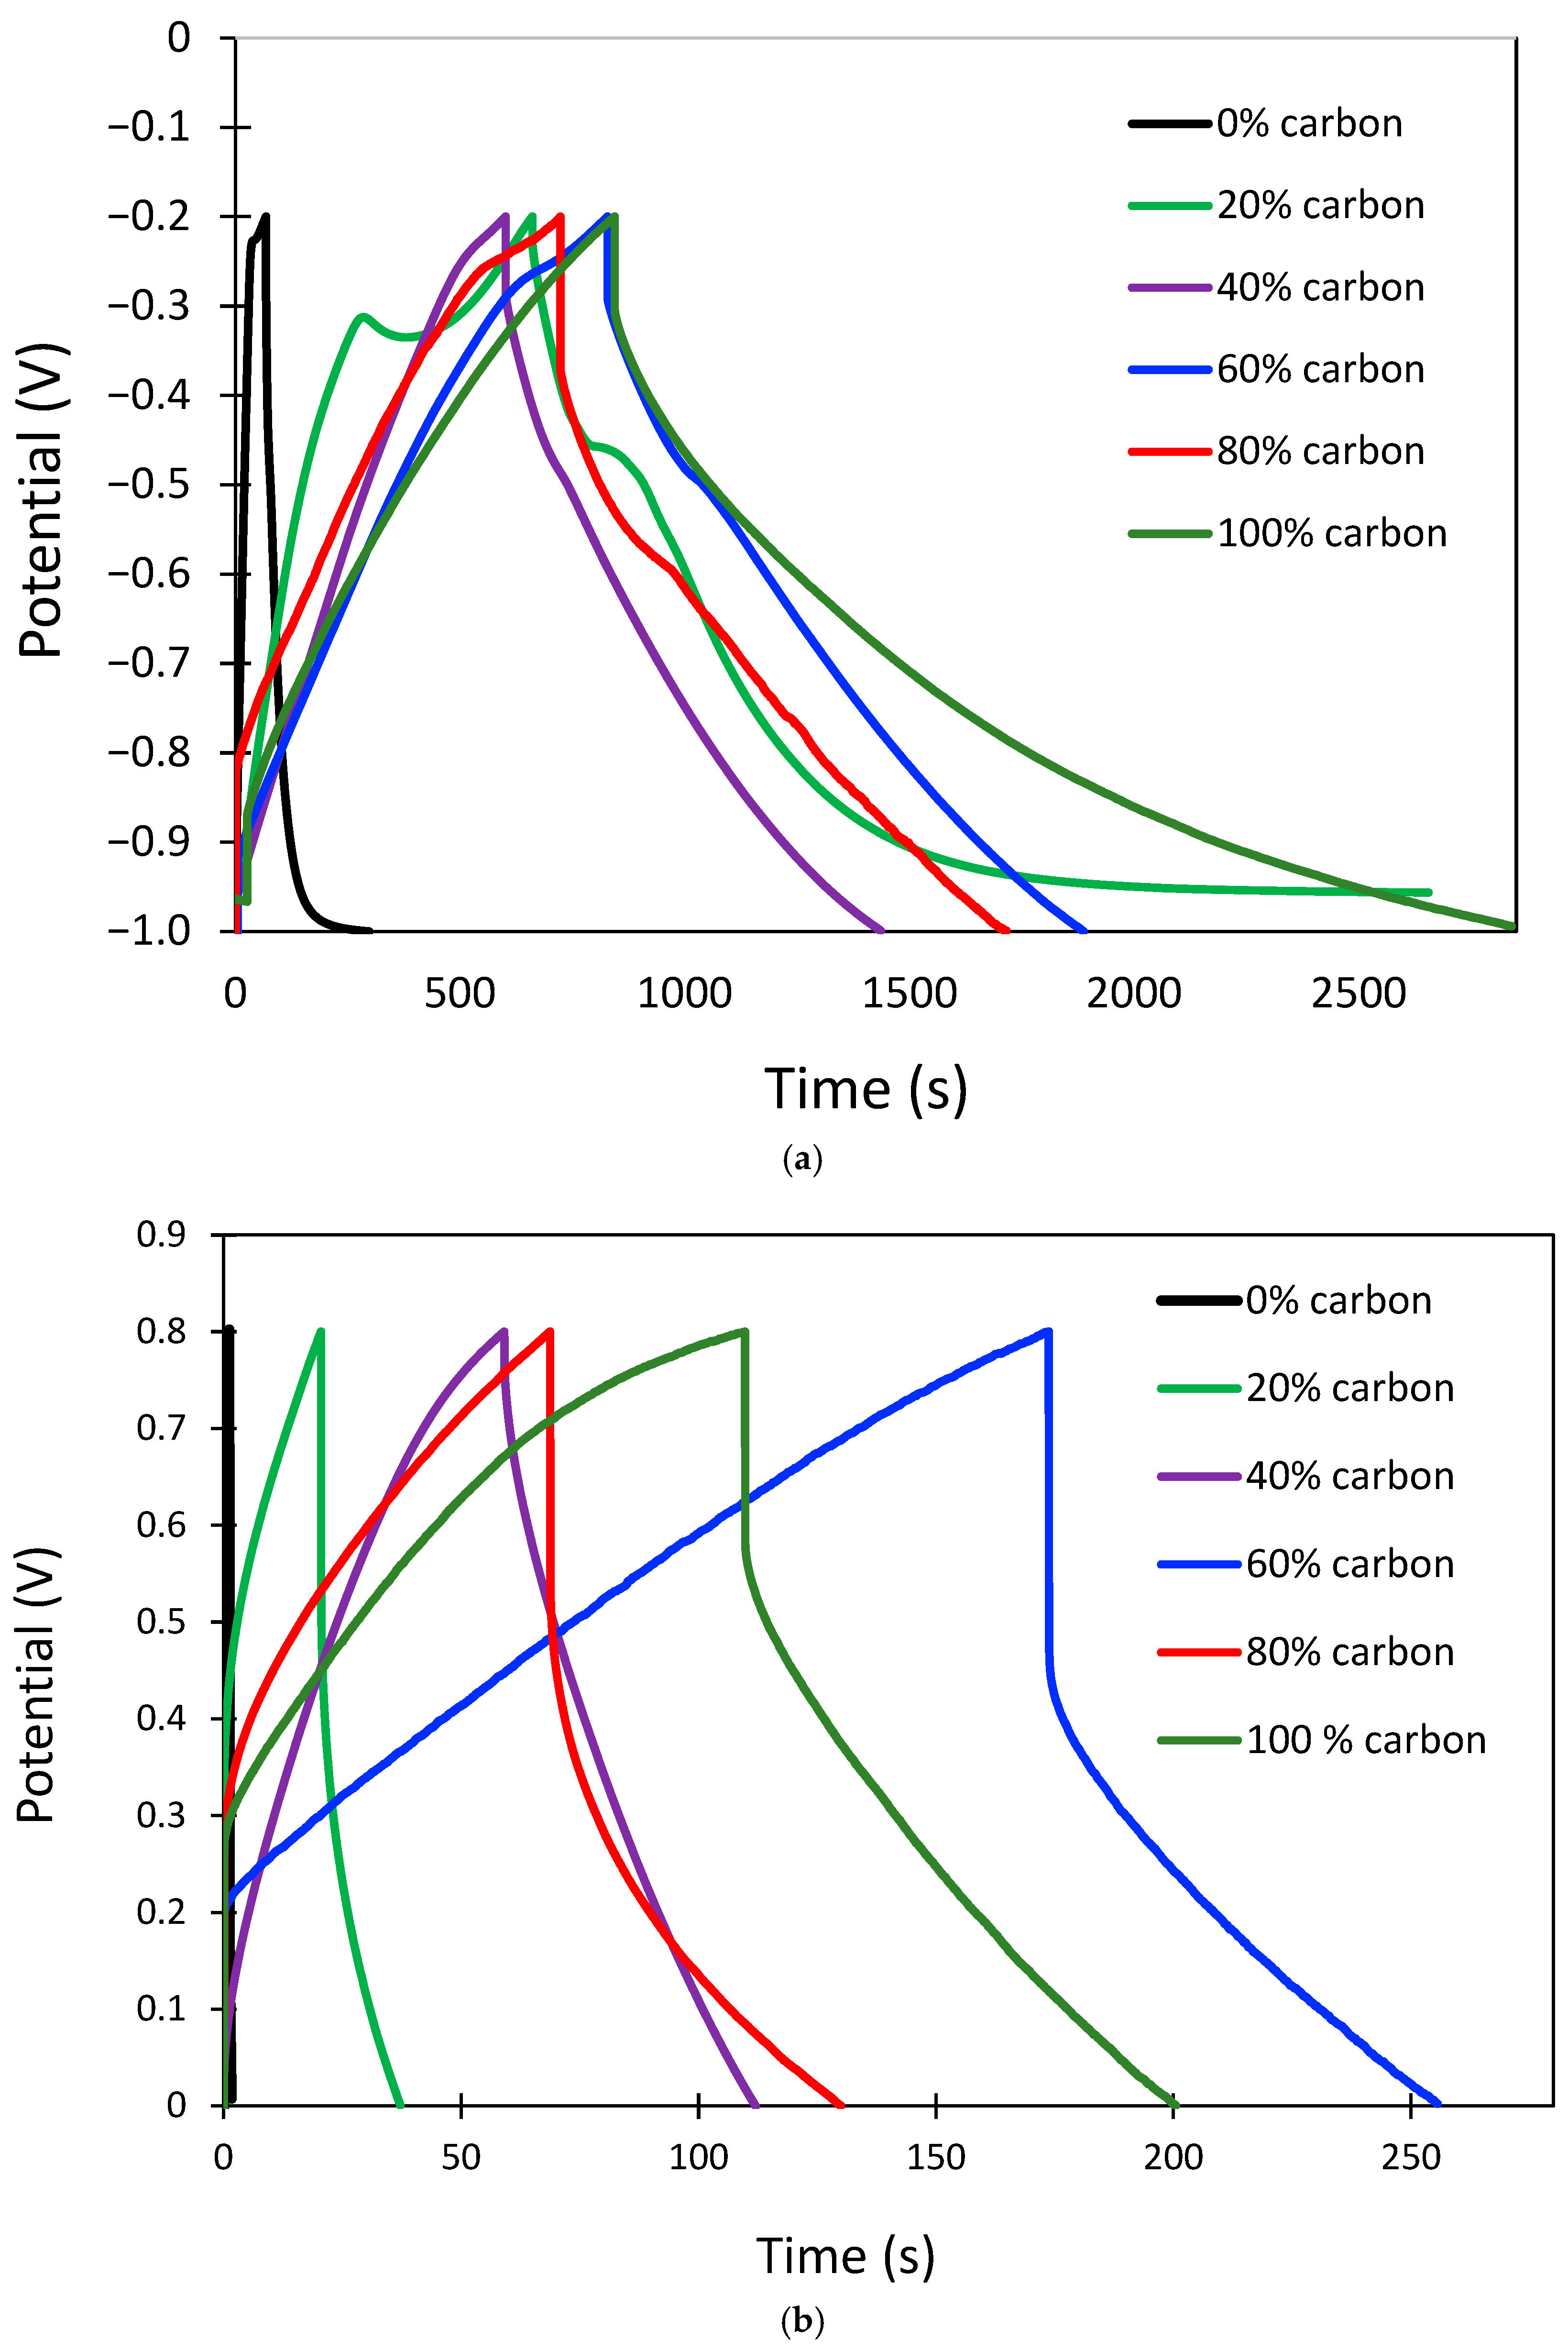
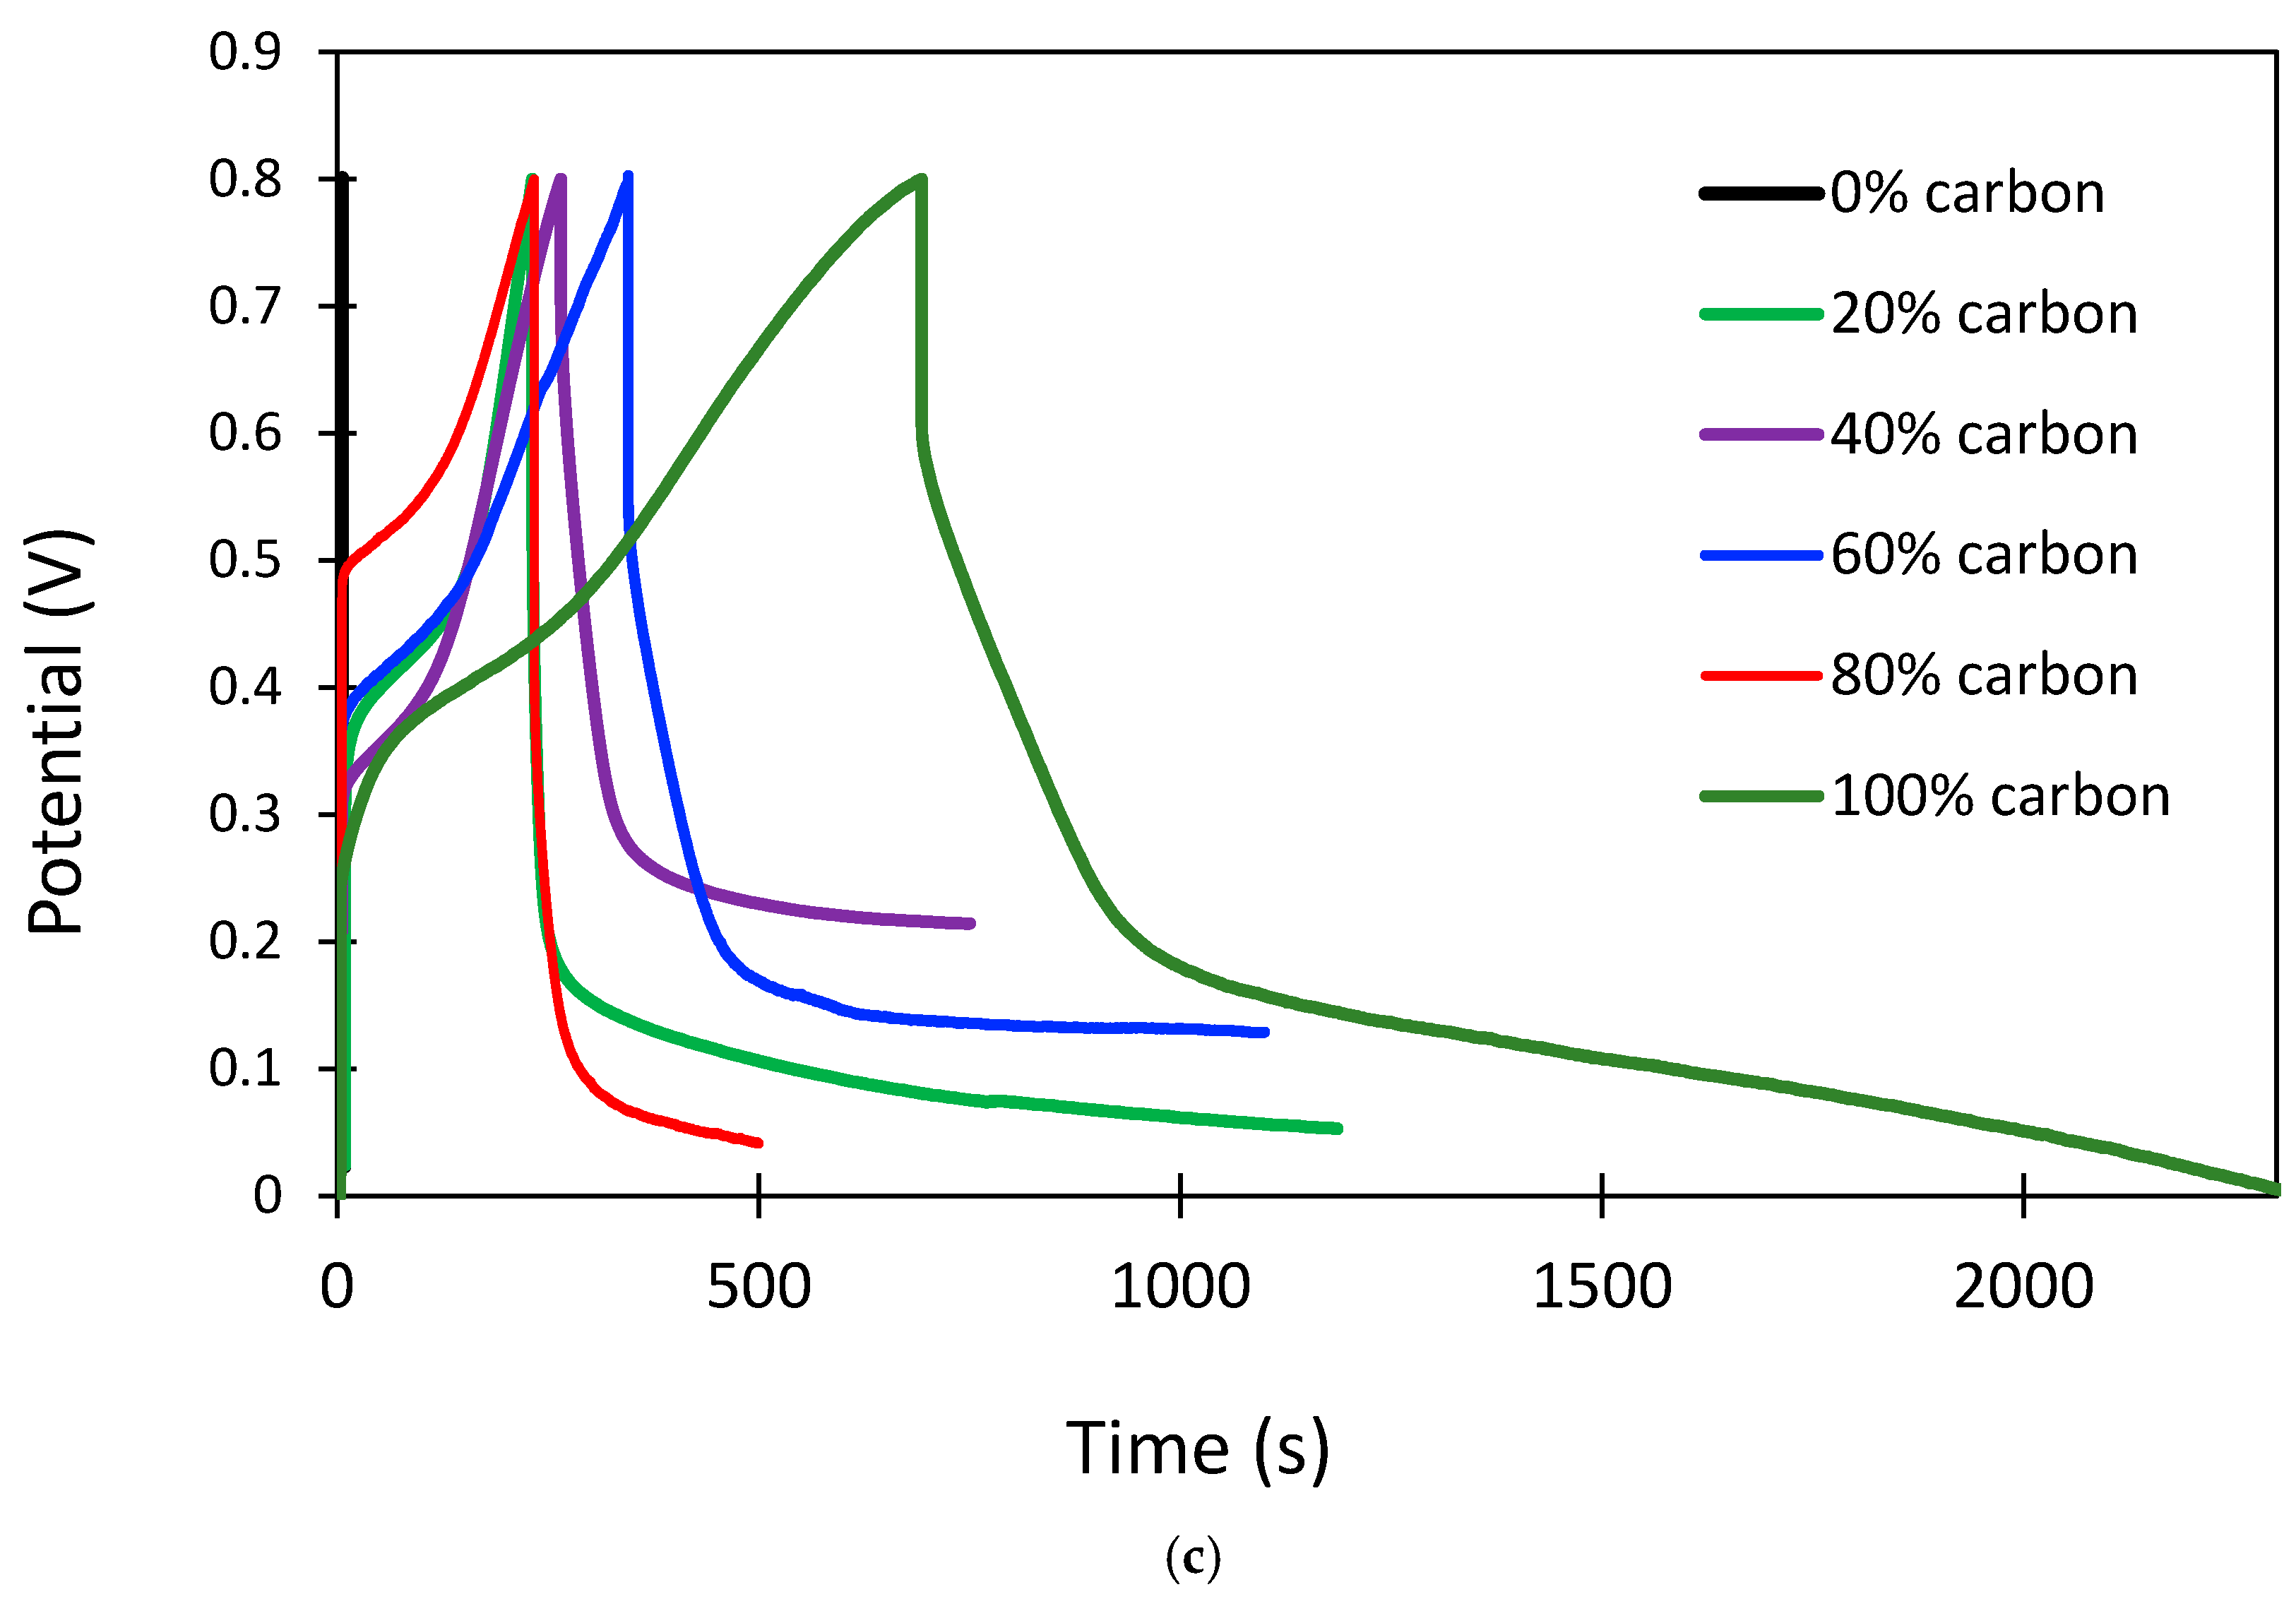
The galvanostatic charge–discharge (GCD) profiles are shown in
Figure 7a–c for KOH and Na
2SO
4 and a mixture of Na
2SO
4 and K
3[Fe(CN)
6] as electrolytes, respectively. The specific capacitance from GCD plots can be calculated as
where
= specific capacitance (F/g);
= current density (current/mass of electrode material) (A/g);
= discharge time (s);
= potential window of charging and discharging (V).
The energy density (E
g) and power density (P
g) can be calculated using the following relations:
where
= energy density (Wh/kg);
C = specific capacitance (F/g);
= potential window of charging and discharging (V).
where
= energy density (W/kg);
= time of discharge (s).
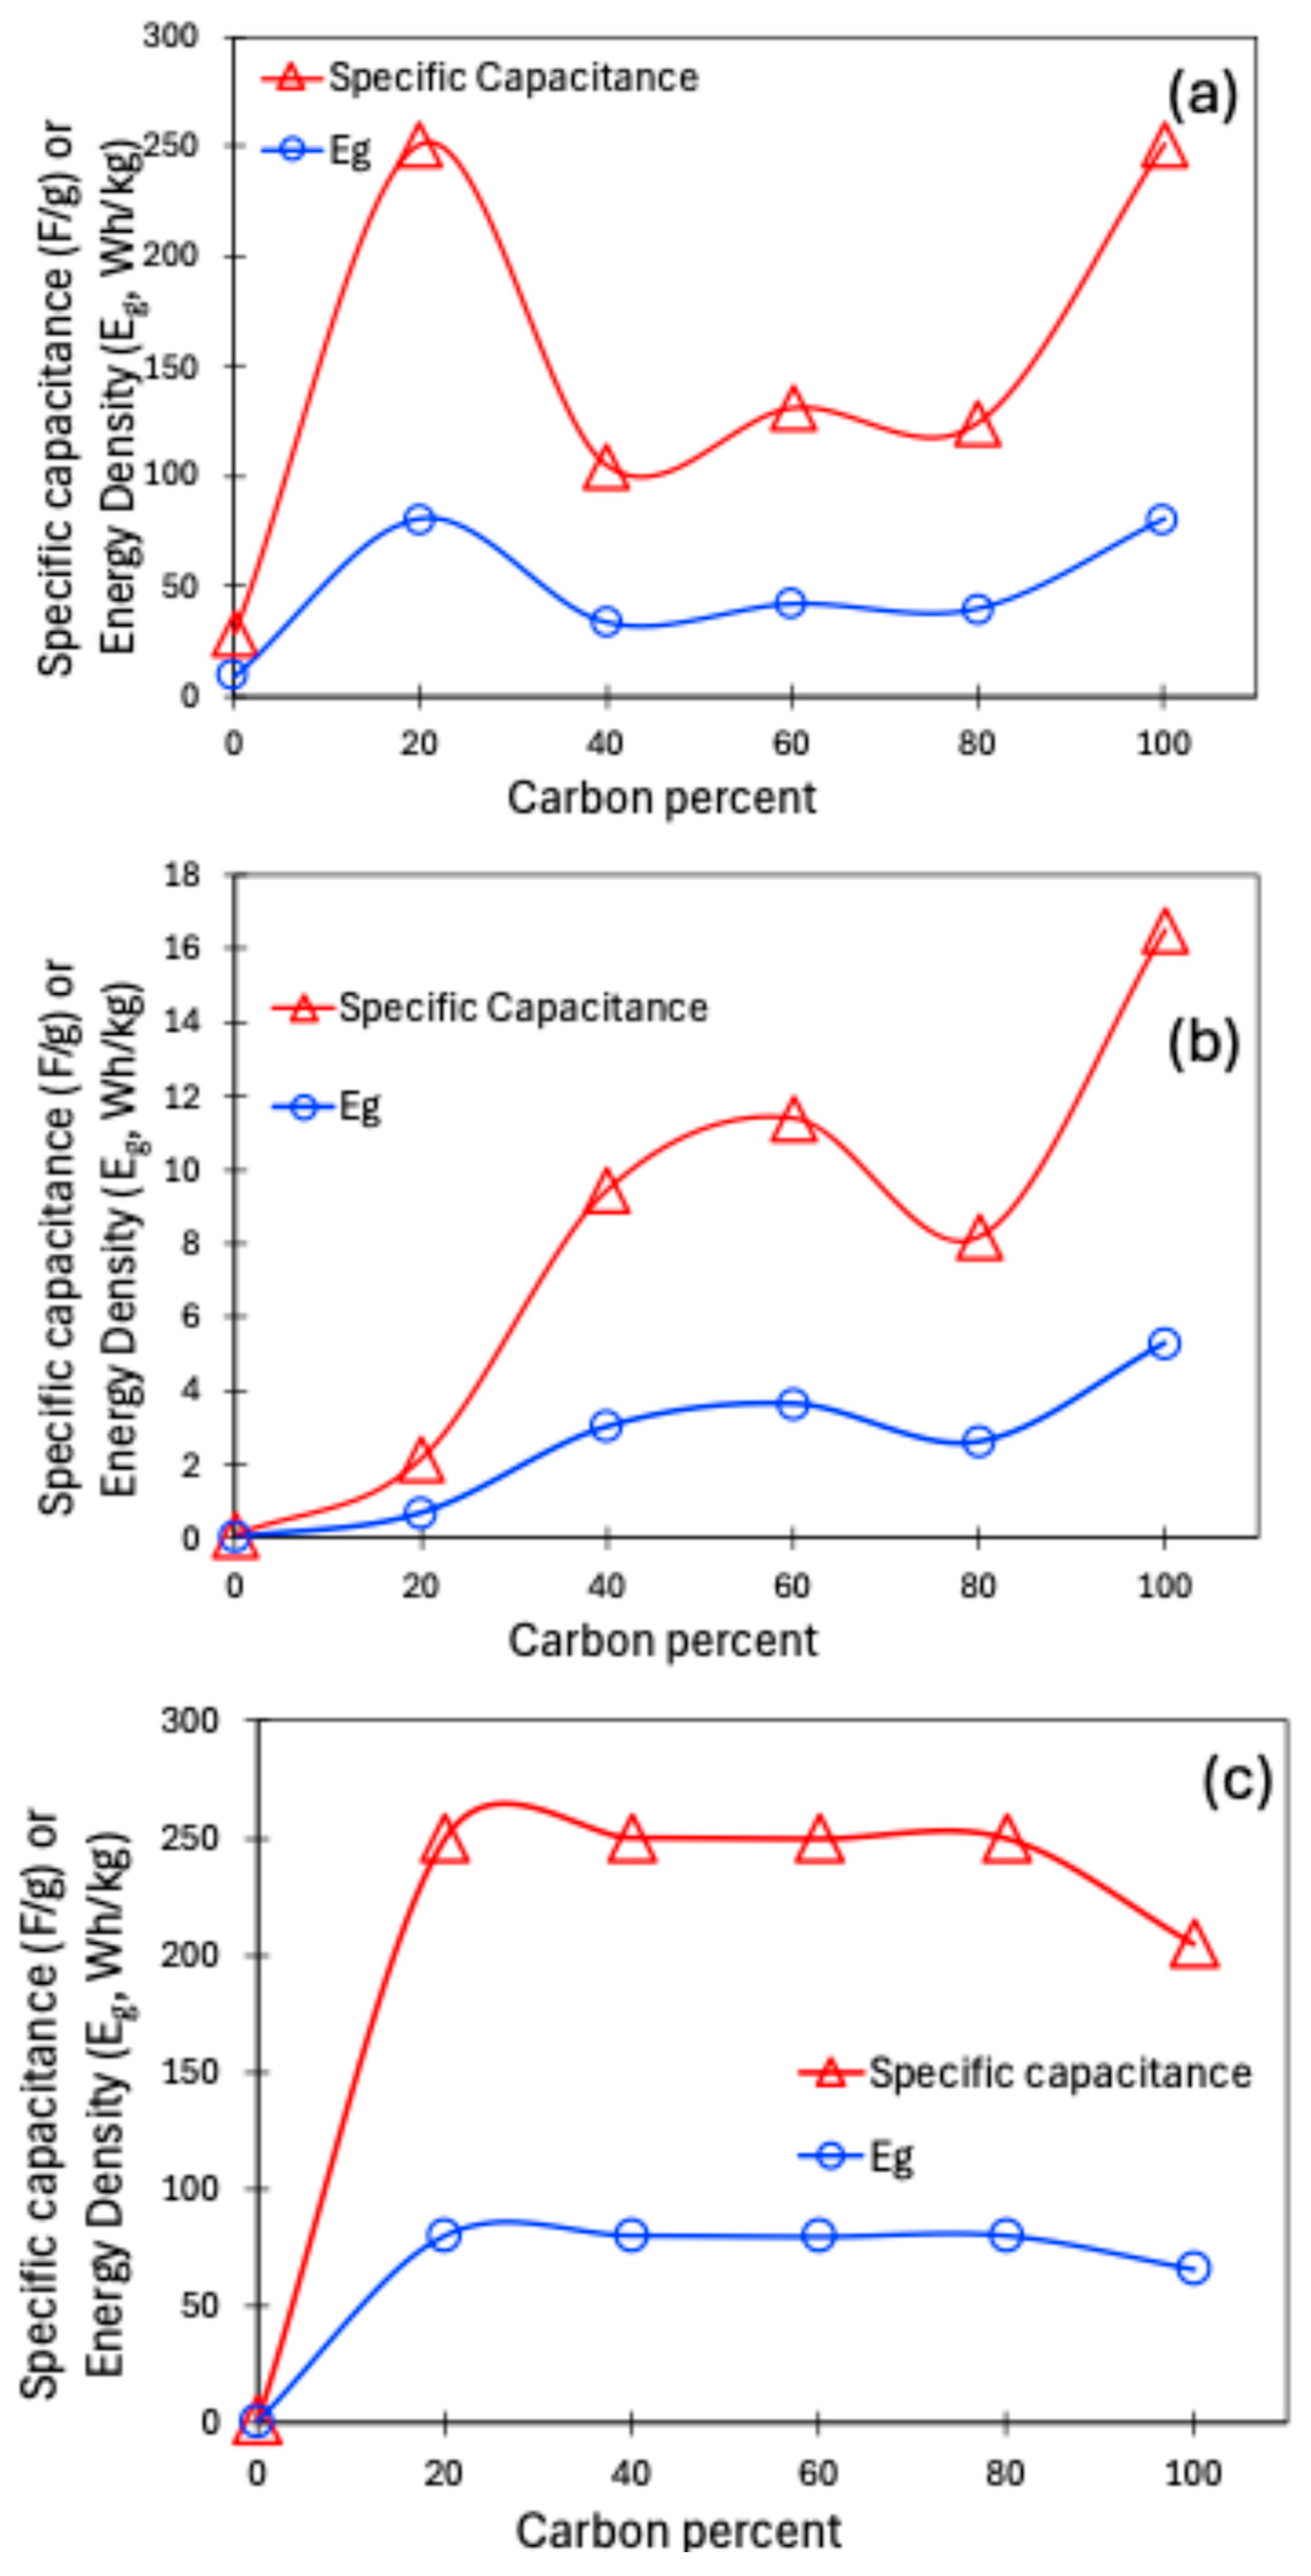
The specific capacitance derived from GCD and E
g as a function of carbon contents are shown in
Figure 8a–c for KOH and Na
2SO
4 and a mixture of Na
2SO
4 and K
3[Fe(CN)
6] as electrolytes, respectively.
In the galvanostatic charge–discharge (GCD) measurements and for Na2SO4 and Na2SO4/K3[Fe(CN)6], the electrode containing 40% carbon also exhibits the most ideal triangular profile characteristic of double-layer capacitance, with minimal voltage distortion and the smallest iR drop. This further confirms the formation of a highly efficient and continuous conductive network at this composition. When the carbon content is below 40%, the MnO2-rich electrodes become electronically resistive, resulting in significant internal voltage loss at the beginning of each charge–discharge step and yielding a pronounced iR drop. The high resistive contribution also distorts the shape of the GCD curves, producing asymmetry and curvature consistent with sluggish electronic transport and kinetically limited redox reactions. Conversely, when the carbon content is too high, although electronic resistance is low, the effective amount of MnO2 contributing to charge storage becomes diluted, leading to lower overall capacitance. The near-ideal GCD behavior at 40% carbon, therefore, reflects the optimal balance between high conductivity and sufficient MnO2 loading, allowing charge to be stored and released uniformly across the electrode with minimal resistive losses. This observation aligns with the CV and EIS data and further demonstrates that 40% carbon/60% MnO2 is the composition that maximizes electrochemical performance in this system.
For the KOH-based electrolyte, the specific capacitance calculated from the GCD plot is around 250 F/g, which is a 20% carbon/80% MnO2 composite and is similar to 100% carbon. This is significantly higher than that measured by cyclic voltammetry. The energy density (Eg) has a similar variation with a maximum value of 80 Wh/kg. For the Na2SO4-based electrolyte, the highest specific capacitance is around 12–15 F/g, which is in a similar range to that obtained from CV plots. The energy density follows a similar pattern, with the values within 4–6 Wh/kg. A completely different pattern is observed for a mixture of Na2SO4 and K3[Fe(CN)6] as electrolyte. A very high specific capacitance is obtained, around 240–250 F/g, within a carbon percentage of 40–80%. This value is one order of magnitude higher than that obtained from a CV plot for the same electrolyte. The energy density also follows the same trend, with values from 60 to 80 Wh/kg. Since all the GCD experiments for Na2SO4 and a mixture of Na2SO4 and K3[Fe(CN)6] as electrolytes were performed at the same current density (0.1 A/g) and potential window (0.8 V), the power density (Pg) attained the same value of 0.04 Wh/Kg.
Cyclic voltammetry probes the electrochemical response over a relatively short time scale, particularly at moderate to high scan rates. In porous electrodes dominated by micropores, ion transport into the internal pore network becomes rate-limiting. Hydrated Na+ ions and, more importantly, the bulky ferricyanide/ferrocyanide ions experience steric hindrance and slow diffusion within the confined pore structure. As a result, a significant fraction of the internal surface area of the porous carbon remains electrochemically inaccessible during the CV experiment. Furthermore, MnO2 pseudocapacitive reactions are kinetically sluggish and diffusion-controlled, leading to incomplete redox participation during rapid potential sweeps. This manifests as distorted or suppressed redox features and a reduced enclosed CV area, ultimately yielding an underestimated specific capacitance.
The presence of K3[Fe(CN)6] further complicates the CV response. Although ferricyanide is electrochemically active, its redox contribution is not fully captured in CV unless extremely low scan rates are employed. At typical scan rates, the electron transfer and mass transport of the ferricyanide/ferrocyanide couple cannot keep pace with the changing potential, resulting in partial utilization of the redox species. Consequently, CV predominantly reflects the EDLC contribution of the carbon and only a fraction of the MnO2 pseudocapacitance and electrolyte redox charge. This explains the low apparent capacitance values obtained from CV measurements. In addition, it should also be noted that when a redox-active electrolyte such as K3[Fe(CN)6] is introduced, an additional faradaic charge-storage pathway becomes available via the reversible Fe(CN)63−/Fe(CN)64− redox couple. Consequently, the total stored charge is no longer solely a property of the electrode material but also includes a substantial contribution from the electrolyte itself.
In contrast, galvanostatic charge–discharge measurements are performed over significantly longer time scales and under a constant current condition. This allows sufficient time for ions to diffuse into the porous network and for faradaic reactions to proceed toward completion. During GCD, the ferricyanide/ferrocyanide redox couple acts as a charge reservoir, continuously accepting and donating electrons throughout the charge and discharge processes. This leads to prolonged discharge times and a substantial increase in the measured charge passed through the system. When the discharge time is inserted into the standard capacitance equation, the additional faradaic charge originating from electrolyte redox reactions is interpreted as an increase in capacitance. Moreover, the longer time scale of GCD allows more complete utilization of MnO2 pseudocapacitance, including ion insertion and surface redox processes that are otherwise kinetically limited in CV. As a result, GCD measurements reflect the combined contributions of EDLC, MnO2 pseudocapacitance, and electrolyte-mediated redox charge storage. The measured capacitance, therefore, represents an apparent or effective capacitance rather than the intrinsic capacitance of the electrode material alone. The pronounced tailing observed in the GCD curves, particularly in the Na2SO4/K3[Fe(CN)6] electrolyte, arises from electrolyte-mediated faradaic redox processes in addition to capacitive charge storage. The Fe(CN)63−/Fe(CN)64− redox couple contributes on a longer time scale than electric double-layer charging, resulting in extended discharge times and an apparent Coulombic efficiency exceeding 100%. This behavior does not indicate enhanced energy efficiency but reflects delayed utilization of redox-active species and pseudocapacitive MnO2 during discharge.
It is important to emphasize that CV and GCD are not equivalent techniques in systems involving redox-active electrolytes and diffusion-controlled pseudocapacitive materials. CV provides insight into kinetic limitations and accessible surface area under dynamic conditions, whereas GCD captures the maximum charge-storage capability under quasi-steady-state conditions. The large discrepancy observed in the present study indicates that the electrode–electrolyte system behaves as a hybrid or redox-mediated supercapacitor rather than a purely electrostatic capacitor. The reason for such behavior lies in the electronic conductivity mismatch, interfacial charge-transfer resistance, and utilization efficiency of the electrochemically active mass. These factors strongly influence how CV and GCD probe the electrode, particularly in composite systems where a poorly conducting pseudocapacitive phase is dispersed within a highly conductive carbon matrix.
It should be noted that the individual contributions of PET-derived carbon and MnO2 within the composite cannot be rigorously deconvoluted, as strong synergistic interactions between the two components lead to coupled charge-storage behavior. Meaningful comparison of individual contributions is therefore limited to the respective single-component electrodes, while the composite response reflects an interdependent, electrolyte-dependent mechanism.
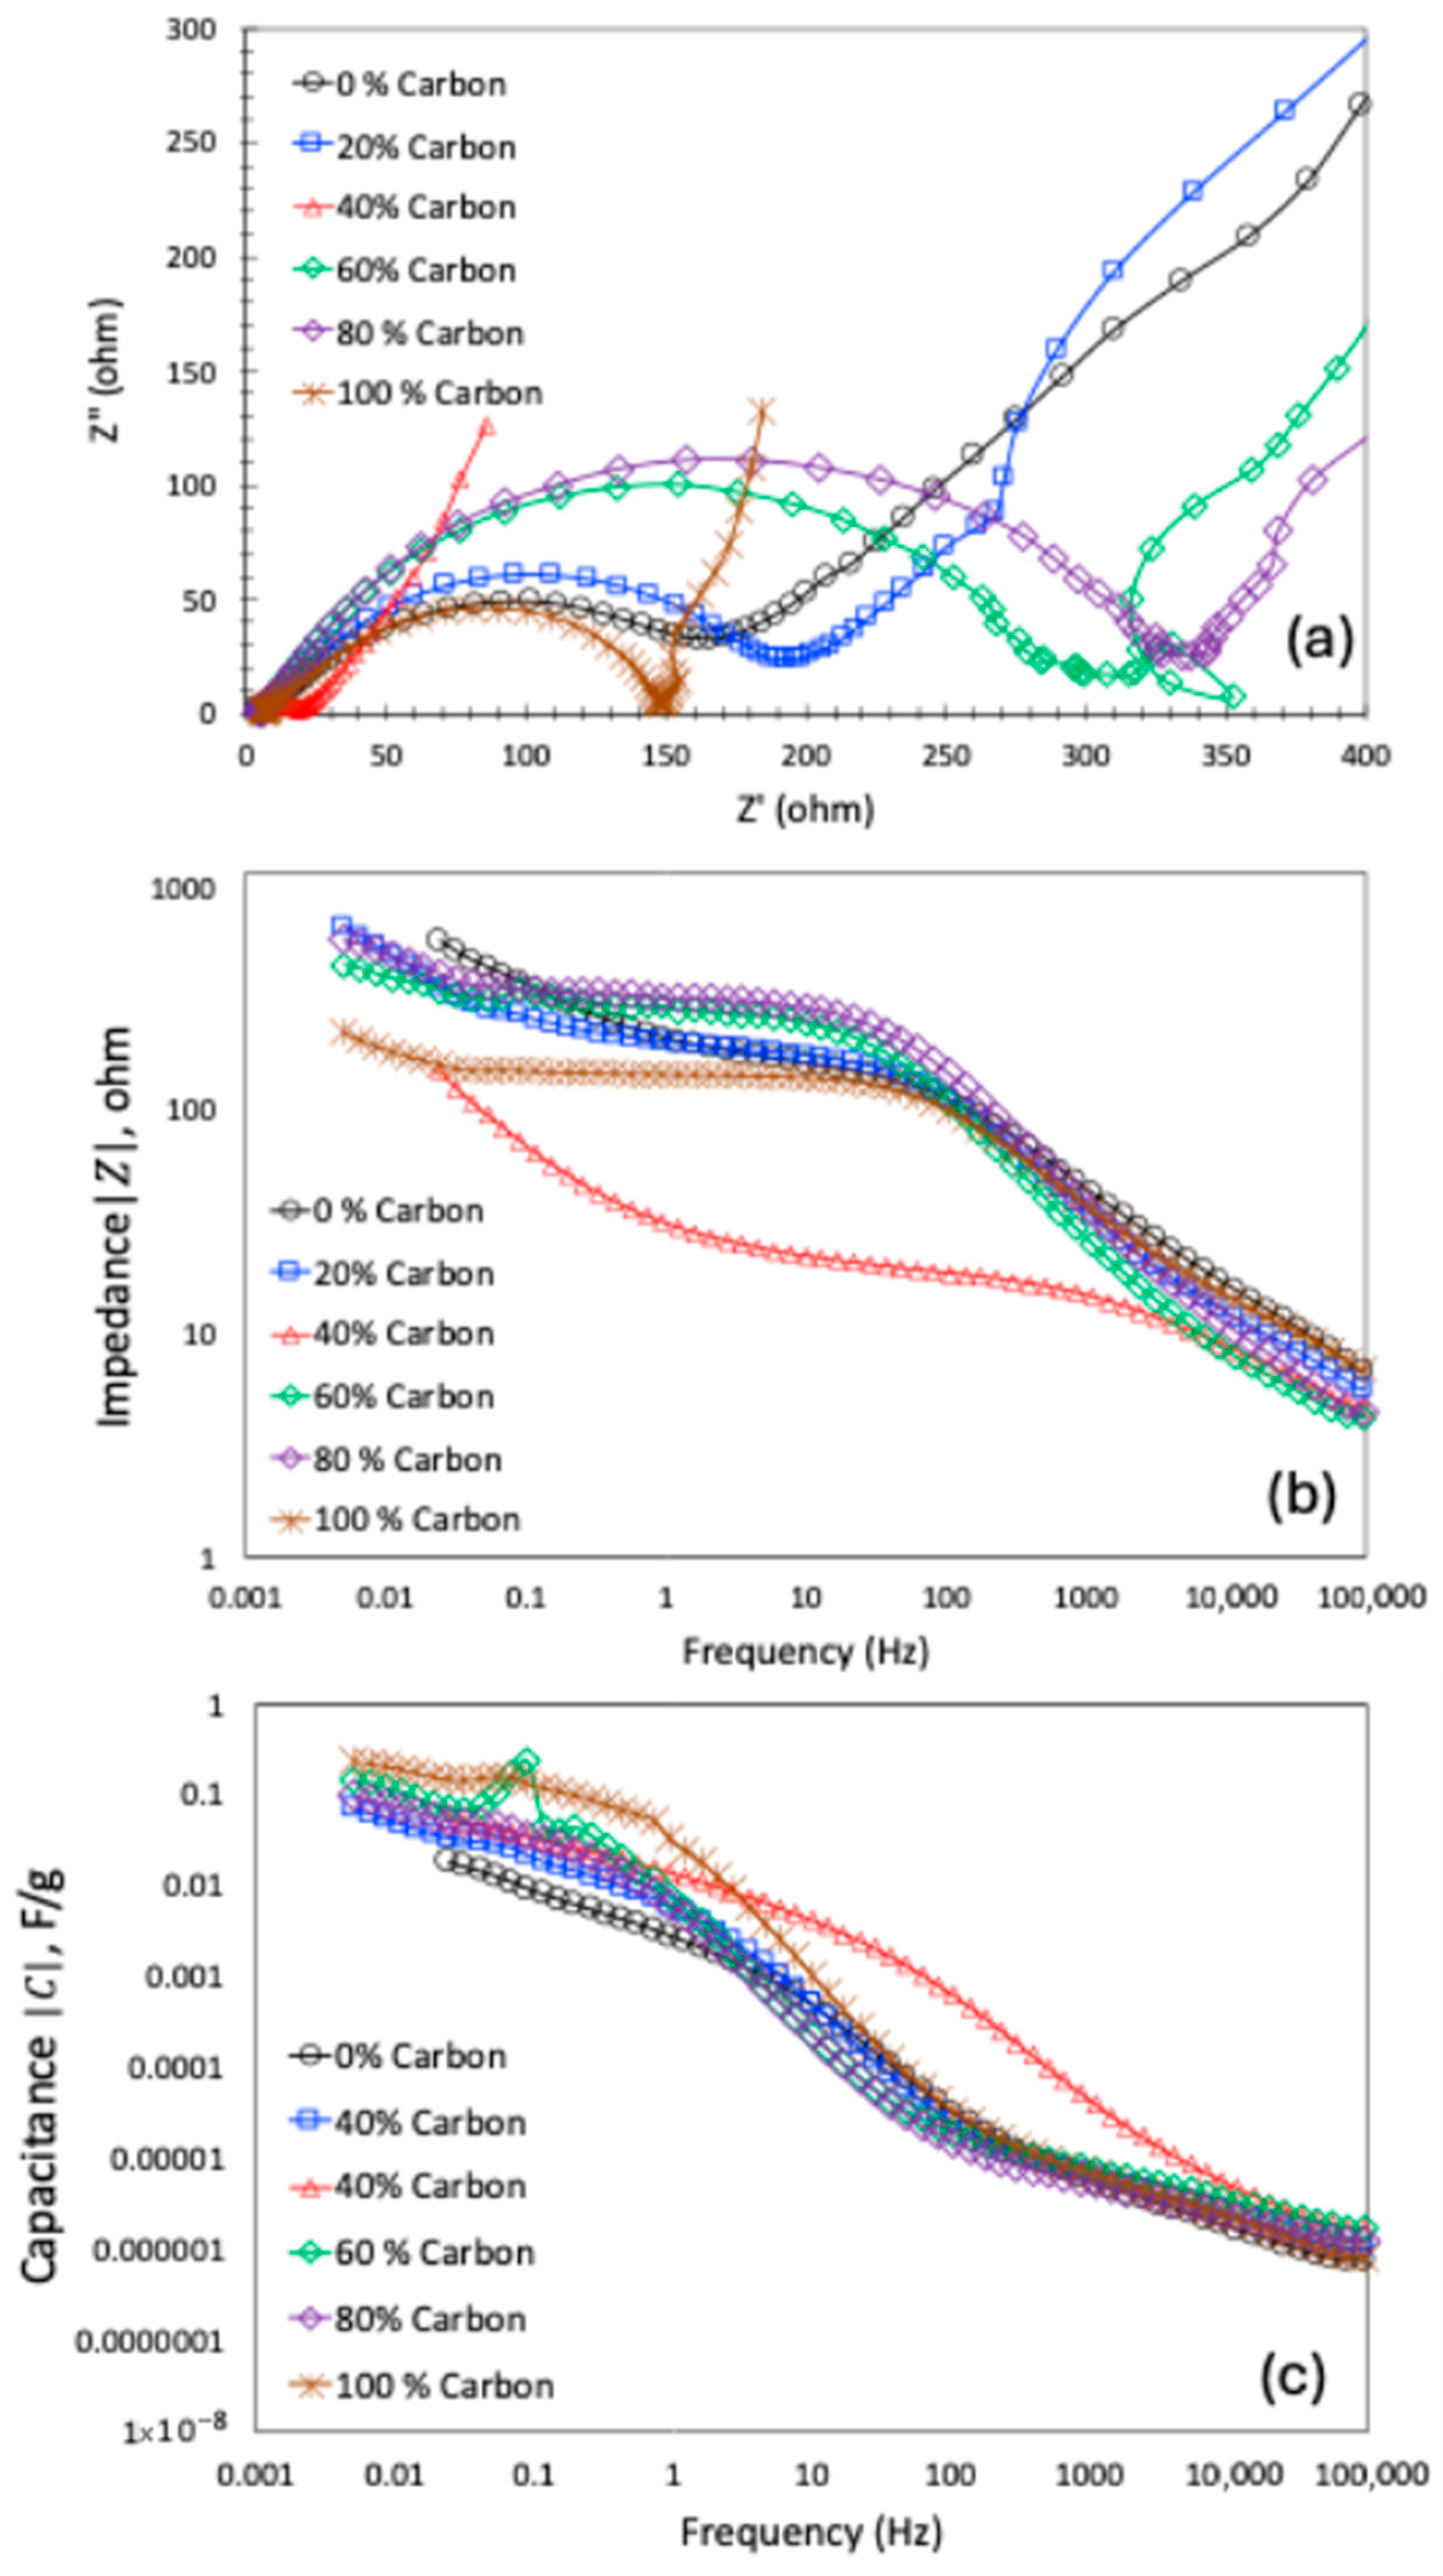
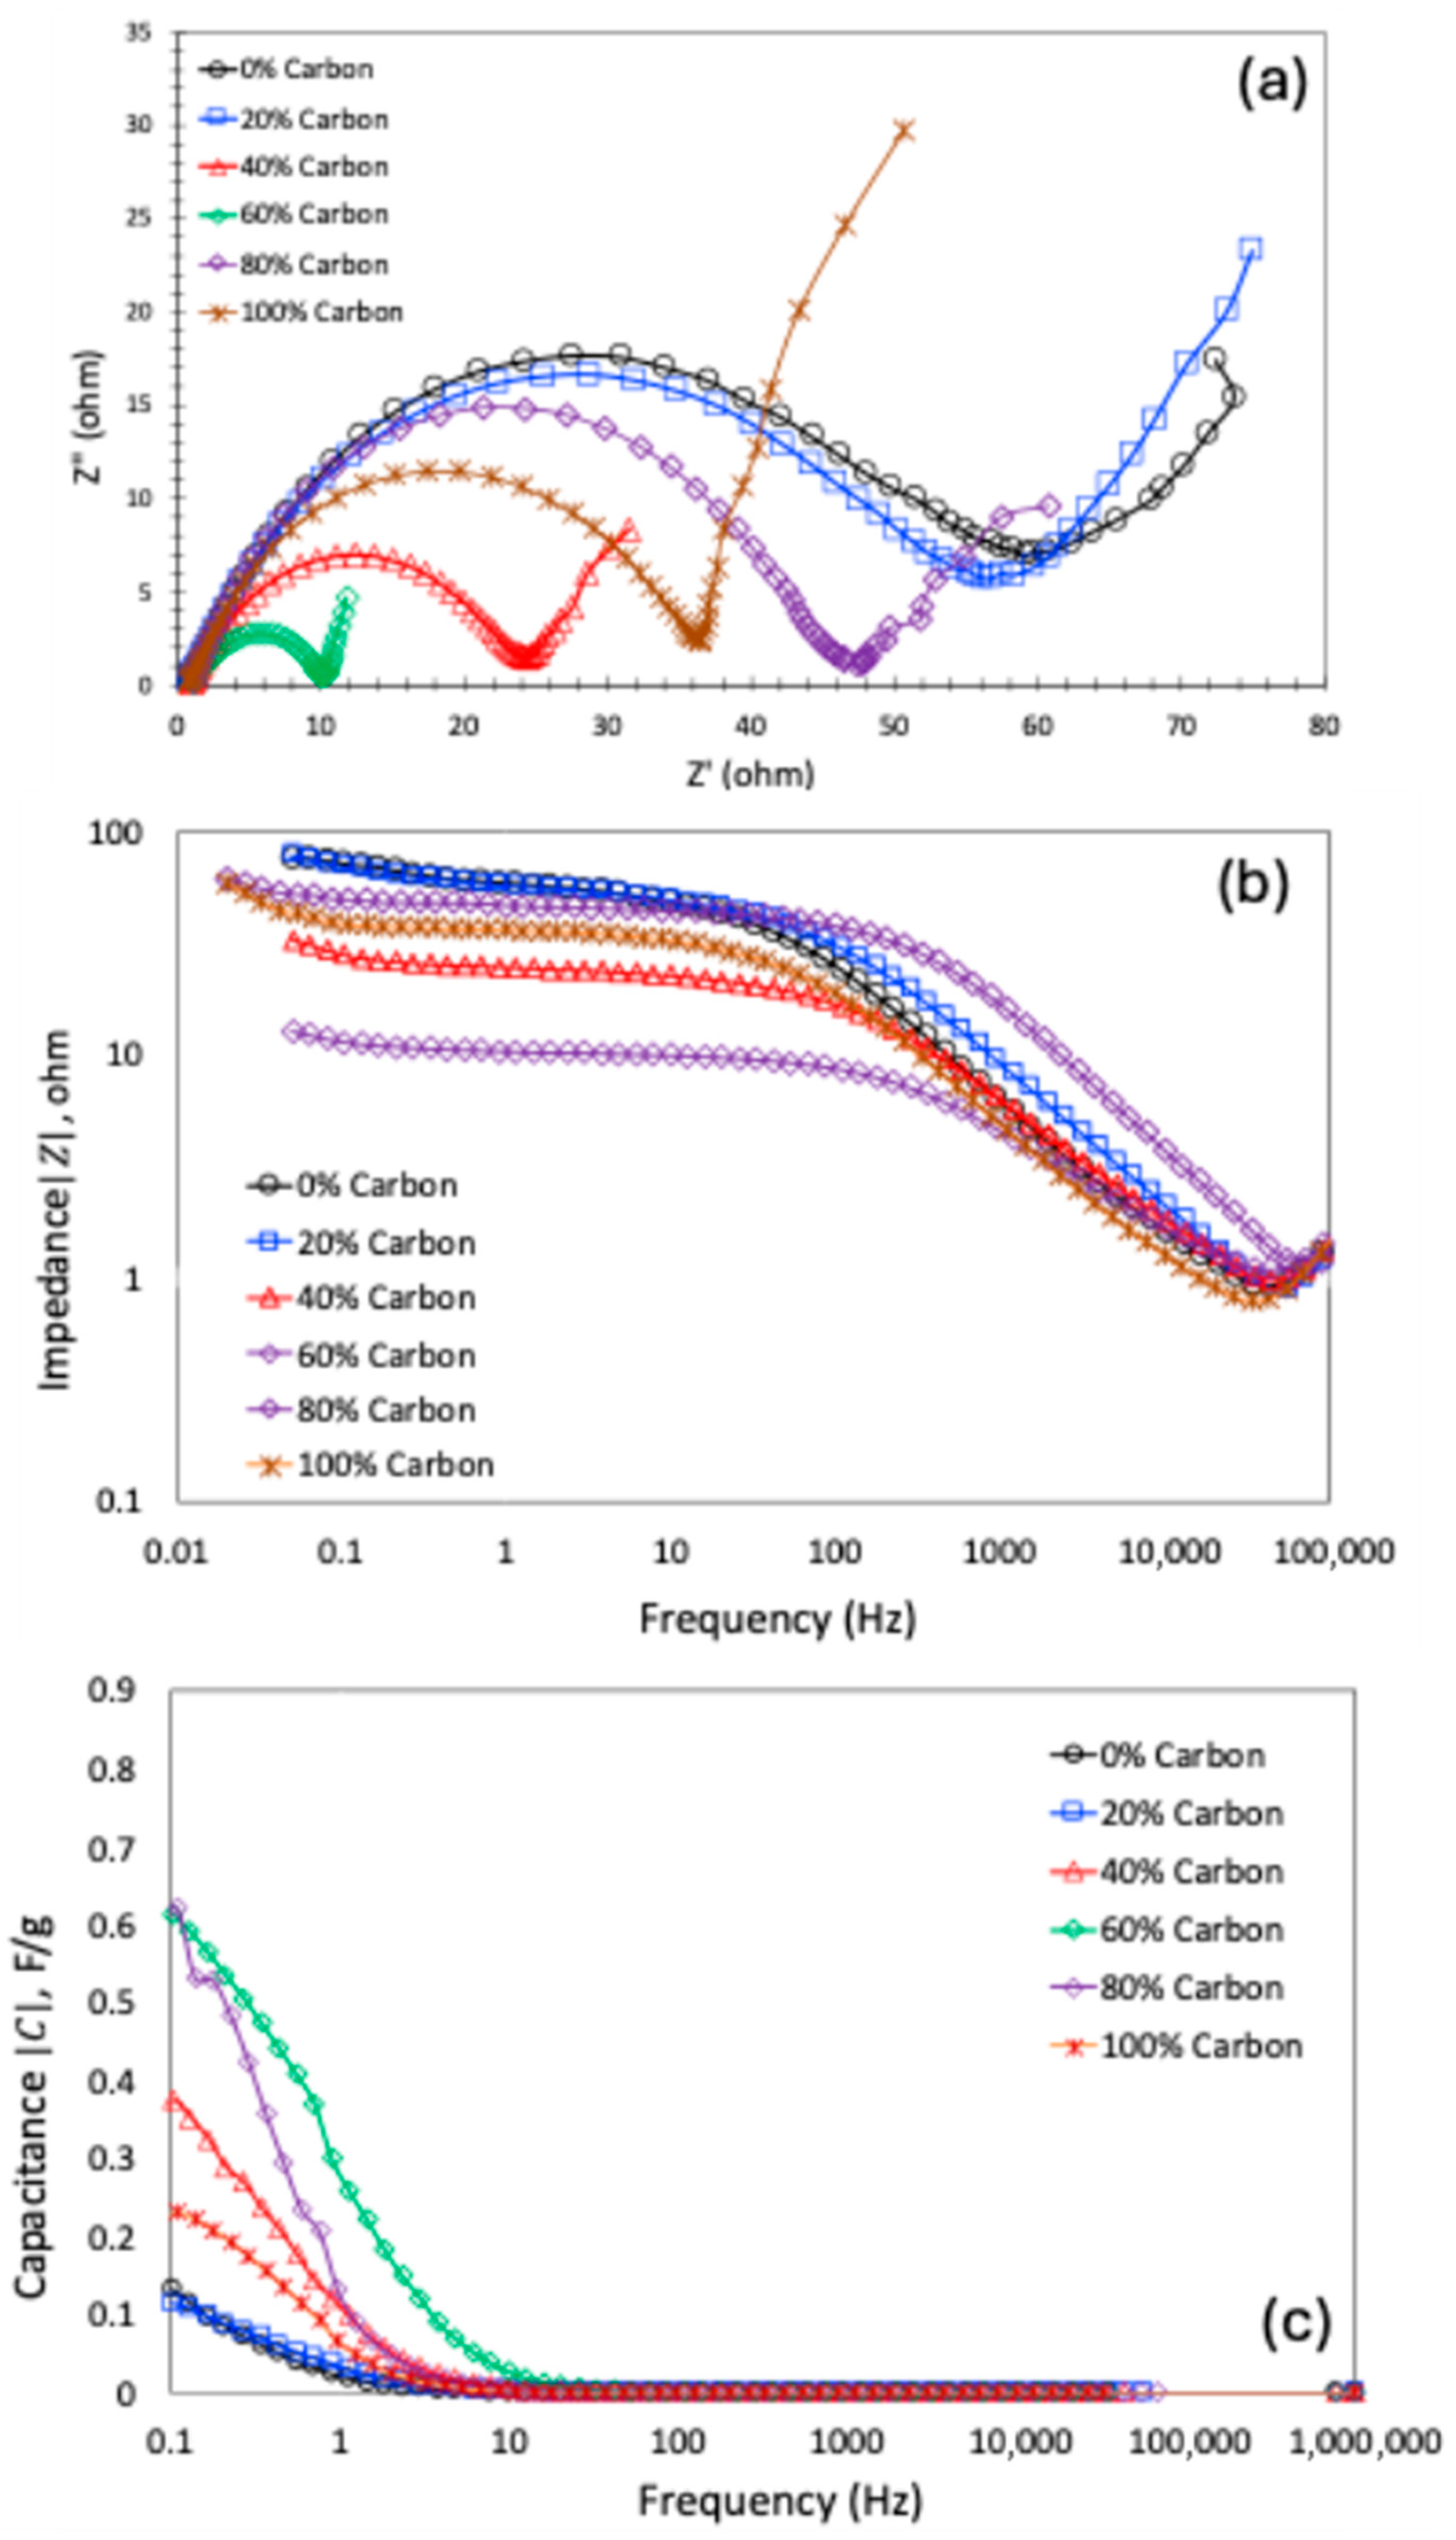
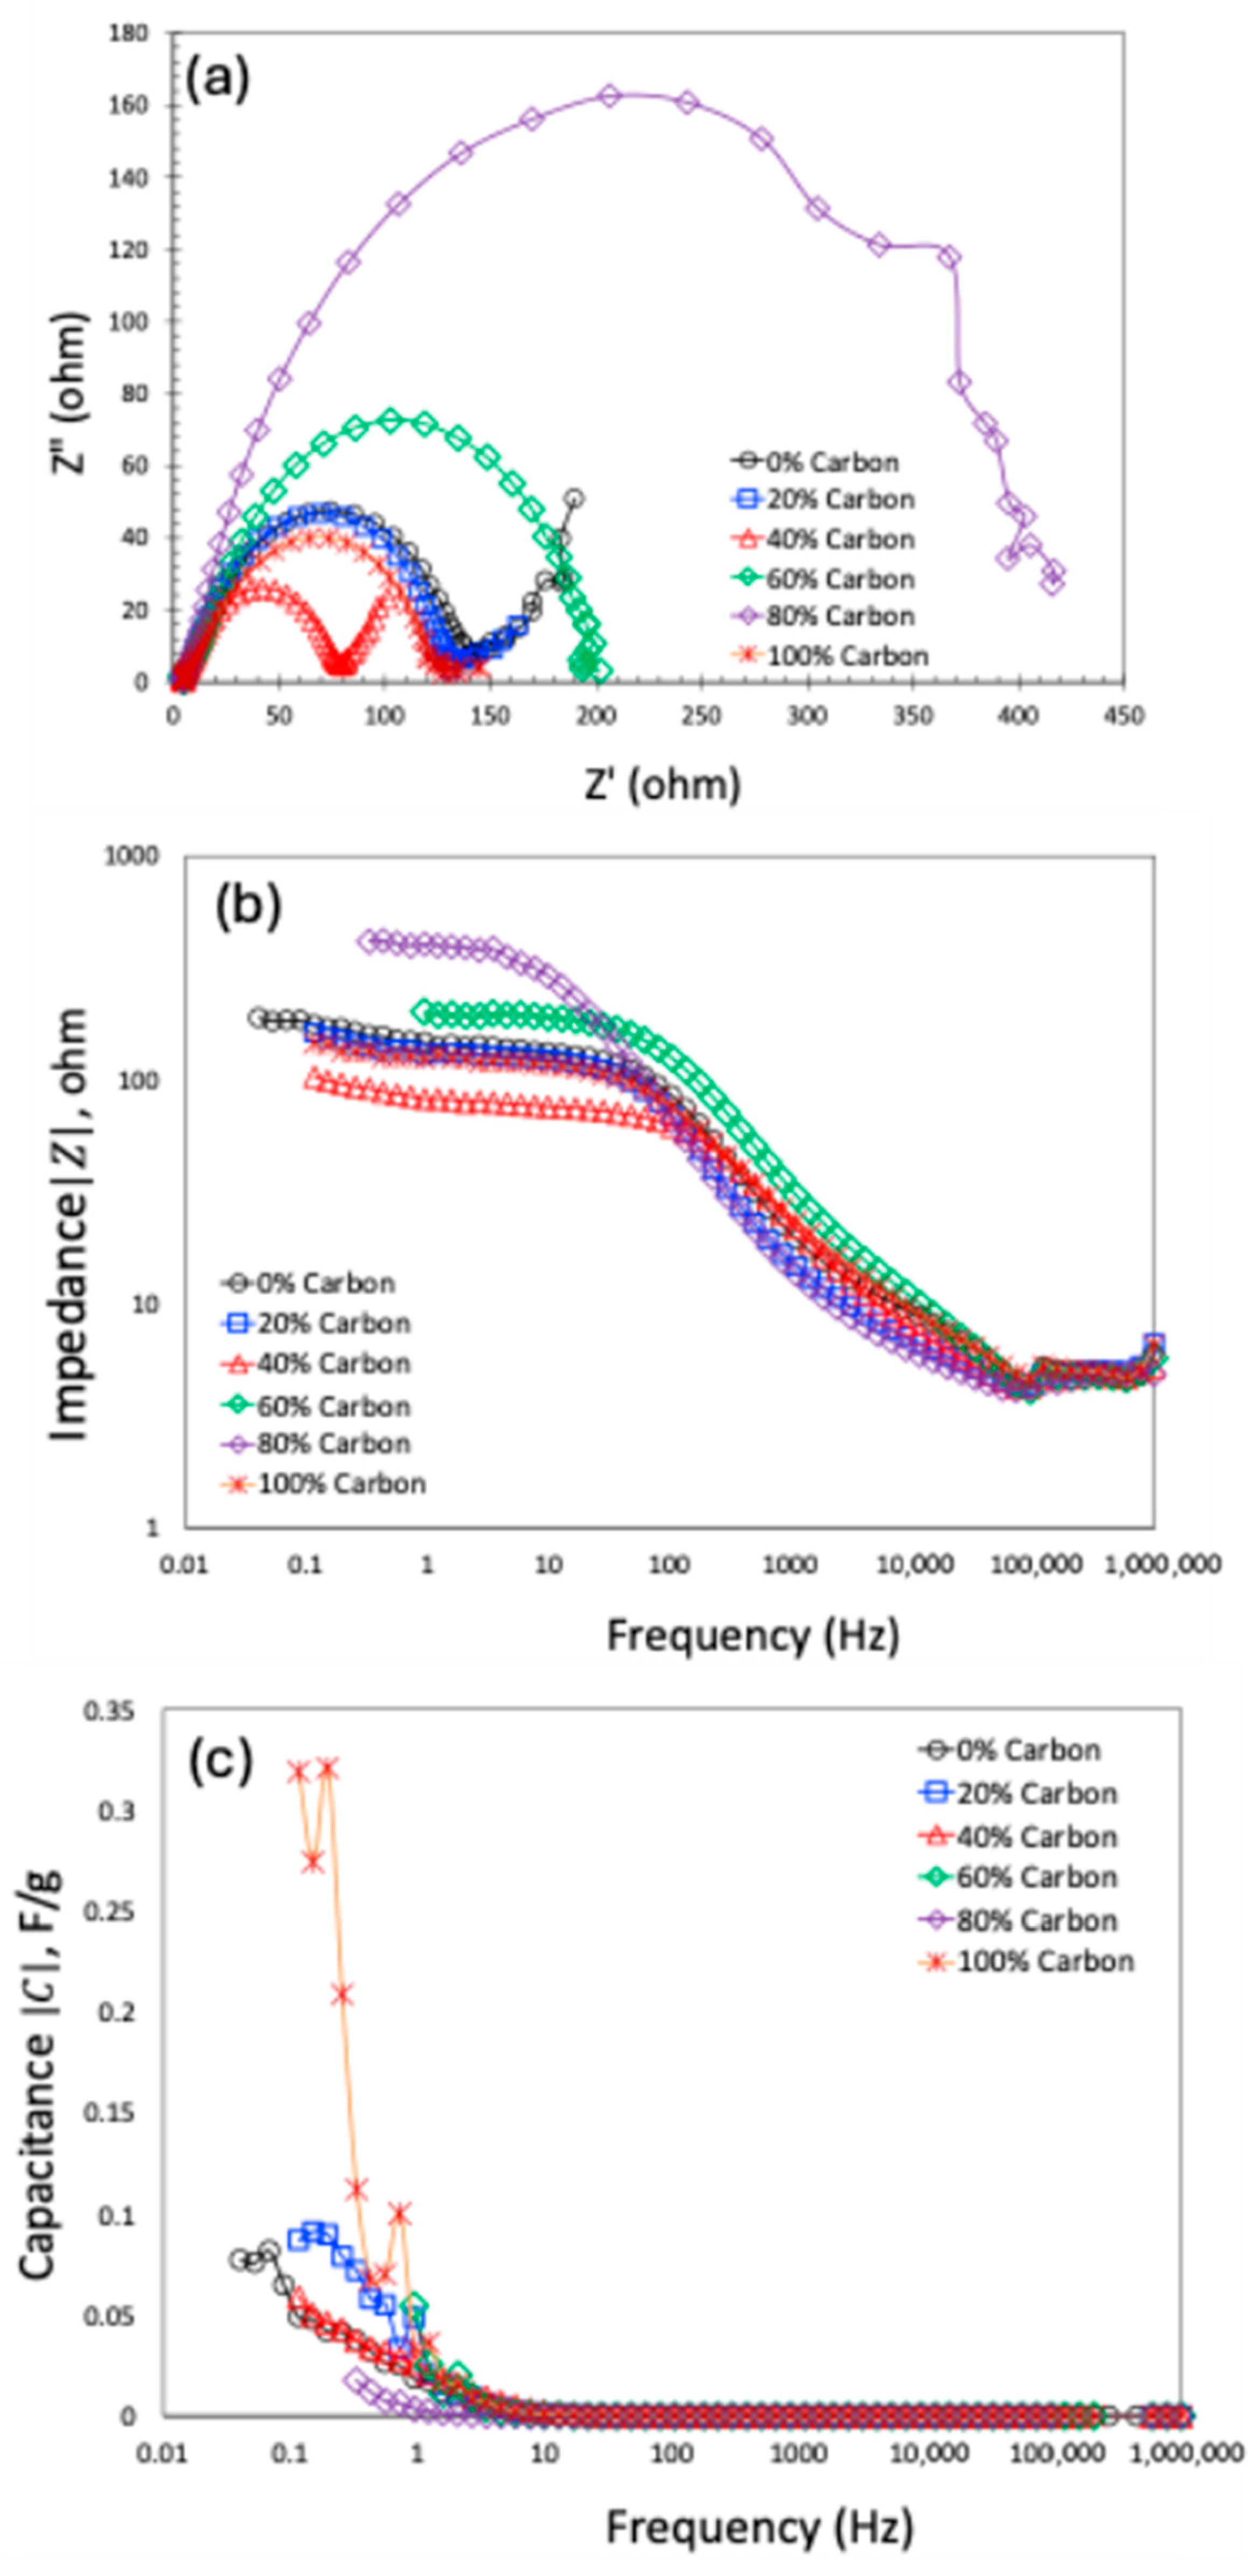
The electrochemical impedance spectroscopy (EIS) data are shown in
Figure 9,
Figure 10 and
Figure 11 for KOH and Na
2SO
4 and a mixture of Na
2SO
4 and K
3[Fe(CN)
6] as electrolytes, respectively. For the Nyquist plots shown in
Figure 9a,
Figure 10a and
Figure 11a and at the high-frequency region, the size of the semicircular feature reflects the electron transport involved in faradaic processes, quantified by the charge-transfer resistance (R
ct). This resistance is strongly influenced by the porous architecture of the carbon electrode, as it depends on both the electrolyte-accessible surface area and the intrinsic electrical conductivity of the material. For KOH and Na
2SO
4, the Nyquist plot shows the typical semicircle at high frequency and a straight line connecting at around 45
angle at low frequency, which signifies Warburg resistance and originates from the ionic diffusion within the porous electrode material. The intersection of the plot with the real axis corresponds to the equivalent series resistance (ESR), which accounts for the inherent resistance of the active carbon material, the ionic resistance of the electrolyte, and the interfacial contact resistance between the electrode and the current collector.
In the Bode plots (
Figure 9b,
Figure 10b and
Figure 11b), the impedance or resistance |Z| decreases with increasing frequency; the impedance values are independent at the lower frequency and show a decreasing nature with the increase in frequency from 10 to 100 Hz. The dependence of capacitance (|C|) on frequency (
Figure 9c,
Figure 10c and
Figure 11c) also exhibits two different regimes for the KOH electrolyte and mixture of Na
2SO
4 and K
3[Fe(CN)
6]-based electrolyte, whereas no two distinct regimes are observed for the Na
2SO
4-based electrolyte. The first zone may be attributed to the penetration of the AC signal in wider pores with the decrease in capacitance values, whereas the second zone signifies the penetration of the same signal in the narrower pores with the leveling of capacitance values [
9,
34]. The distributed dependence of capacitance for the Na
2SO
4-based electrolyte possibly suggests that a smaller fraction of micropores takes part in the AC response.
It is observed that for a mixture of Na
2SO
4 and K
3[Fe(CN)
6] a electrolyte, the straight line (Warburg resistance) is very noisy or absent in the low-frequency zone; even for 60% carbon/40% MnO
2, the end of the semicircle, at the relatively lower frequency, also becomes noisy. In conventional supercapacitors using inert electrolytes, the 45° line in the Nyquist plot is associated with semi-infinite linear diffusion of ions within porous electrodes (Warburg impedance). However, when a redox-active species such as the ferricyanide/ferrocyanide couple is present, the low-frequency impedance response no longer reflects simple ion diffusion. The reversible redox reaction (Equation (5)) introduces faradaic charge transfer and diffusion of redox species in the electrolyte, which competes with or dominates over classical ion diffusion in the electrode pores. Under these conditions, the impedance response transitions from diffusion-controlled Warburg behavior to finite-length diffusion and redox-reaction-limited behavior, which does not yield a clean 45° line [
35,
36]. The pronounced noise observed in the low-frequency region of the Nyquist plot is a known consequence of non-stationary electrochemical processes. Electrochemical impedance spectroscopy formally assumes that the system is linear, time-invariant, and at steady state. Redox-active electrolytes violate these assumptions because the concentration of ferricyanide and ferrocyanide near the electrode surface changes dynamically during the AC perturbation, particularly at low frequencies where the perturbation period is long. As a result, the impedance response becomes unstable and noisy due to slow diffusion of bulky Fe(CN)
63−/
4− ions, local depletion and regeneration of redox species, and coupling between solution-phase diffusion and electrode kinetics. Such low-frequency noise in redox-mediated systems has been widely reported and is often interpreted as a signature of pseudocapacitive or battery-like behavior rather than ideal capacitive behavior [
37,
38,
39]. Additionally, ferricyanide and ferrocyanide ions are large, multivalent species, and their diffusion into micropores is severely hindered. In porous carbon/MnO
2 composites, especially those with high carbon fractions and microporosity, this leads to partial pore blocking, non-uniform ion accessibility, and spatially heterogeneous impedance response. Therefore, instead of a smooth Warburg diffusion tail, the impedance spectrum exhibits scattered points and noise, reflecting stochastic access of redox species to electrochemically active sites. Similar deviations from ideal Warburg behavior in porous carbons with redox electrolytes have been discussed in the context of pore-size/ion-size mismatch [
40,
41]. Therefore, taken together, the absence of a clear 45° Warburg line, the emergence of low-frequency noise, and the instability at the end of the semicircle in Na
2SO
4 + K
3[Fe(CN)
6] electrolyte are hallmarks of a redox-mediated hybrid charge-storage mechanism. The system no longer behaves as an ideal supercapacitor governed by ion diffusion alone; instead, it exhibits characteristics of a mixed capacitive–faradaic system, where electrolyte redox reactions, finite-length diffusion, and interfacial instabilities dominate the low-frequency impedance response.