Review

Structural Characterisation of Disordered Porous Materials Using Gas Sorption and Complementary Techniques

1
Department of Chemical and Environmental Engineering, University of Nottingham, University Park, Nottingham NG7 2RD, UK
2
Department of Chemical Engineering, King Faisal University, P.O. Box 400, AlAhsa 31982, Eastern Province, Saudi Arabia
*
Author to whom correspondence should be addressed.
Surfaces 2026, 9(1), 20; https://doi.org/10.3390/surfaces9010020
Submission received: 16 January 2026 / Revised: 11 February 2026 / Accepted: 12 February 2026 / Published: 17 February 2026
(This article belongs to the Collection Featured Articles for Surfaces)

Abstract

While advanced imaging techniques and ordered porous materials like MOFs have gained prominence, gas sorption remains the indispensable tool for characterizing the multiscale heterogeneity of industrially important disordered solids, such as catalysts and shales. This review examines recent developments in gas sorption methodologies specifically tailored for rigid, disordered porous media. We discuss experimental advances, including the choice of adsorbate and the utility of the overcondensation method for probing macroporosity and ensuring saturation. Furthermore, we critically evaluate theoretical approaches for determining pore size distributions (PSDs), contrasting classical methods with Density Functional Theory (DFT) and Grand Canonical Monte Carlo (GCMC) simulations. Special emphasis is placed on the impact of pore-to-pore cooperative effects, such as advanced condensation, cavitation, and pore-blocking, on the interpretation of sorption isotherms. We highlight how complementary techniques, including integrated mercury porosimetry, NMR, and computerized X-ray tomography (CXT), are essential for deconvolving these complex network effects and validating void space descriptors. We conclude that, while “brute force” molecular simulations on image-based reconstructions are progressing, “minimalist” pore network models, which incorporate cooperative mechanisms, currently offer the most empirically adequate approach. Ultimately, gas sorption remains unique in its ability to statistically characterize void spaces from Angstroms to millimeters in a single experiment.

1. Introduction

1.1. The Continuing Need for Gas Sorption Techniques

Gas sorption continues to be a key pore structural characterization technique, especially for obtaining the specific surface area. However, the emergence of various imaging modalities has provided the potential to obtain full 3D representations of void spaces, even down to nanometer-level resolution [1]. Nevertheless, as will be seen below, gas sorption remains the only pore structural characterization technique that can probe macroscopic (>millimeter-sized) samples over length-scales from hundreds of microns down to angstroms, all in just one single experiment. This reach in length-scale is needed, as many important industrial and natural porous materials have structural heterogeneities over this entire range. Further, gas sorption remains a relatively quick and simple method to determine statistically representative estimates of key void space descriptors, such as specific surface area and pore size distribution (PSD). In this work, the term “sorption” will be used to mean combined adsorption and desorption data obtained during the same experiment.
Due to the recent growth in the popularity of ordered porous solids, such as crystalline metal–organic-frameworks (MOFs) (also known as coordination polymers), there are many recent reviews of gas sorption in such materials [2]. A similar growth in the importance of shale gas and shale oil recovery has also meant that much work, including several recent reviews, has been conducted on gas sorption in shale rocks [1]. However, while certain other types of disordered (amorphous) porous solids remain of substantial industrial importance, recent work on gas sorption in such systems has been relatively neglected. Examples of such materials, with complex porous structures, include heterogeneous catalyst pellets, absorbents, fuel cell electrodes, and membranes. These materials are also often those where gas sorption methods are used extensively for quality control and process monitoring on production plants, and in product specifications. Hence, this review will focus on gas sorption studies in industrially important, rigid, and disordered porous solids, although discussion of recent work in more ordered materials or natural porous solids will also be included where this is of relevance.
The amorphous nature of disordered porous solids raises the question of what exactly constitutes an individual “pore” element within the wider void space. This fundamental question has been considered in more detail previously [3], and thus will only be touched on briefly below, where it becomes relevant.
Some issues in the interpretation of gas sorption data have been reviewed recently [4]. In contrast, this current review will consider different issues, not covered by recent or previous reviews, such as the important, but neglected, pore-to-pore co-operative effects that impact the accuracy of PSDs, and the use of complementary experimental techniques to examine fundamental adsorption processes. It will also consider some issues raised previously, such as how to obtain accurate surface areas, but from a different perspective. However, the review will begin with a brief discussion of the basic physical principles of gas sorption.

1.2. Basic Physical Principles

The basic theory of gas sorption and the methods of experimentation have been described extensively elsewhere [5], and, so, only relevant details will be considered below.
The mechanism of adsorption varies with the size of the pores [5]. In very fine micropores, called ultramicropores, the pore width is comparable with the molecular size, and, so, the pore wall potentials overlap strongly within the void space. In such pores, the onset of adsorption arises at very low pressure in a process called “primary micropore filling” [4]. In larger micropores, where a few layers of adsorbate can be accommodated, called supermicropores, the pore wall potentials still overlap within the central void, but to a lesser extent. The adsorption occurs in such pores, via a process called “secondary micropore filling”, typically over the relative pressure range of 0.1–0.15. In contrast, in mesopores and macropores, the pore wall potential only extends a limited distance into the void space, and, so, the adsorption process typically consists of, initially, monolayer adsorption, where molecules are in direct contact with the adsorbent surface, followed by multi-layer build-up, where molecules adsorb upon each other in a surface film, or in more isolated ganglia. Finally, capillary condensation occurs in the core of the pore and fills it with liquid [4]. The particular nature of the condensation process, and the pressure thereof obtained, depends upon the geometry and interconnectivity of the void space, as will be discussed in more detail below.
The adsorption isotherm is typically halted before reaching bulk saturation (e.g., at a lower relative pressure of ~0.995, rather than 1.0). This is often because commercial apparatus manufacturers sometimes advise against achieving bulk condensation in the sample chamber. Given that (according to the Kelvin equation) the relative pressure for condensation in ever larger pores moves ever closer to unity, then, eventually, it is not possible to obtain the fineness of pressure control needed to distinguish different condensation pressures in very large pores. Further, it is also suggested that it is difficult to achieve capillary condensation in very large pores because of an energetic barrier to the nucleation of condensation linked to the low sorption rate [4]. However, it will be seen below, that gas desorption studies can be performed for materials with very large macropores using the gas overcondensation method.
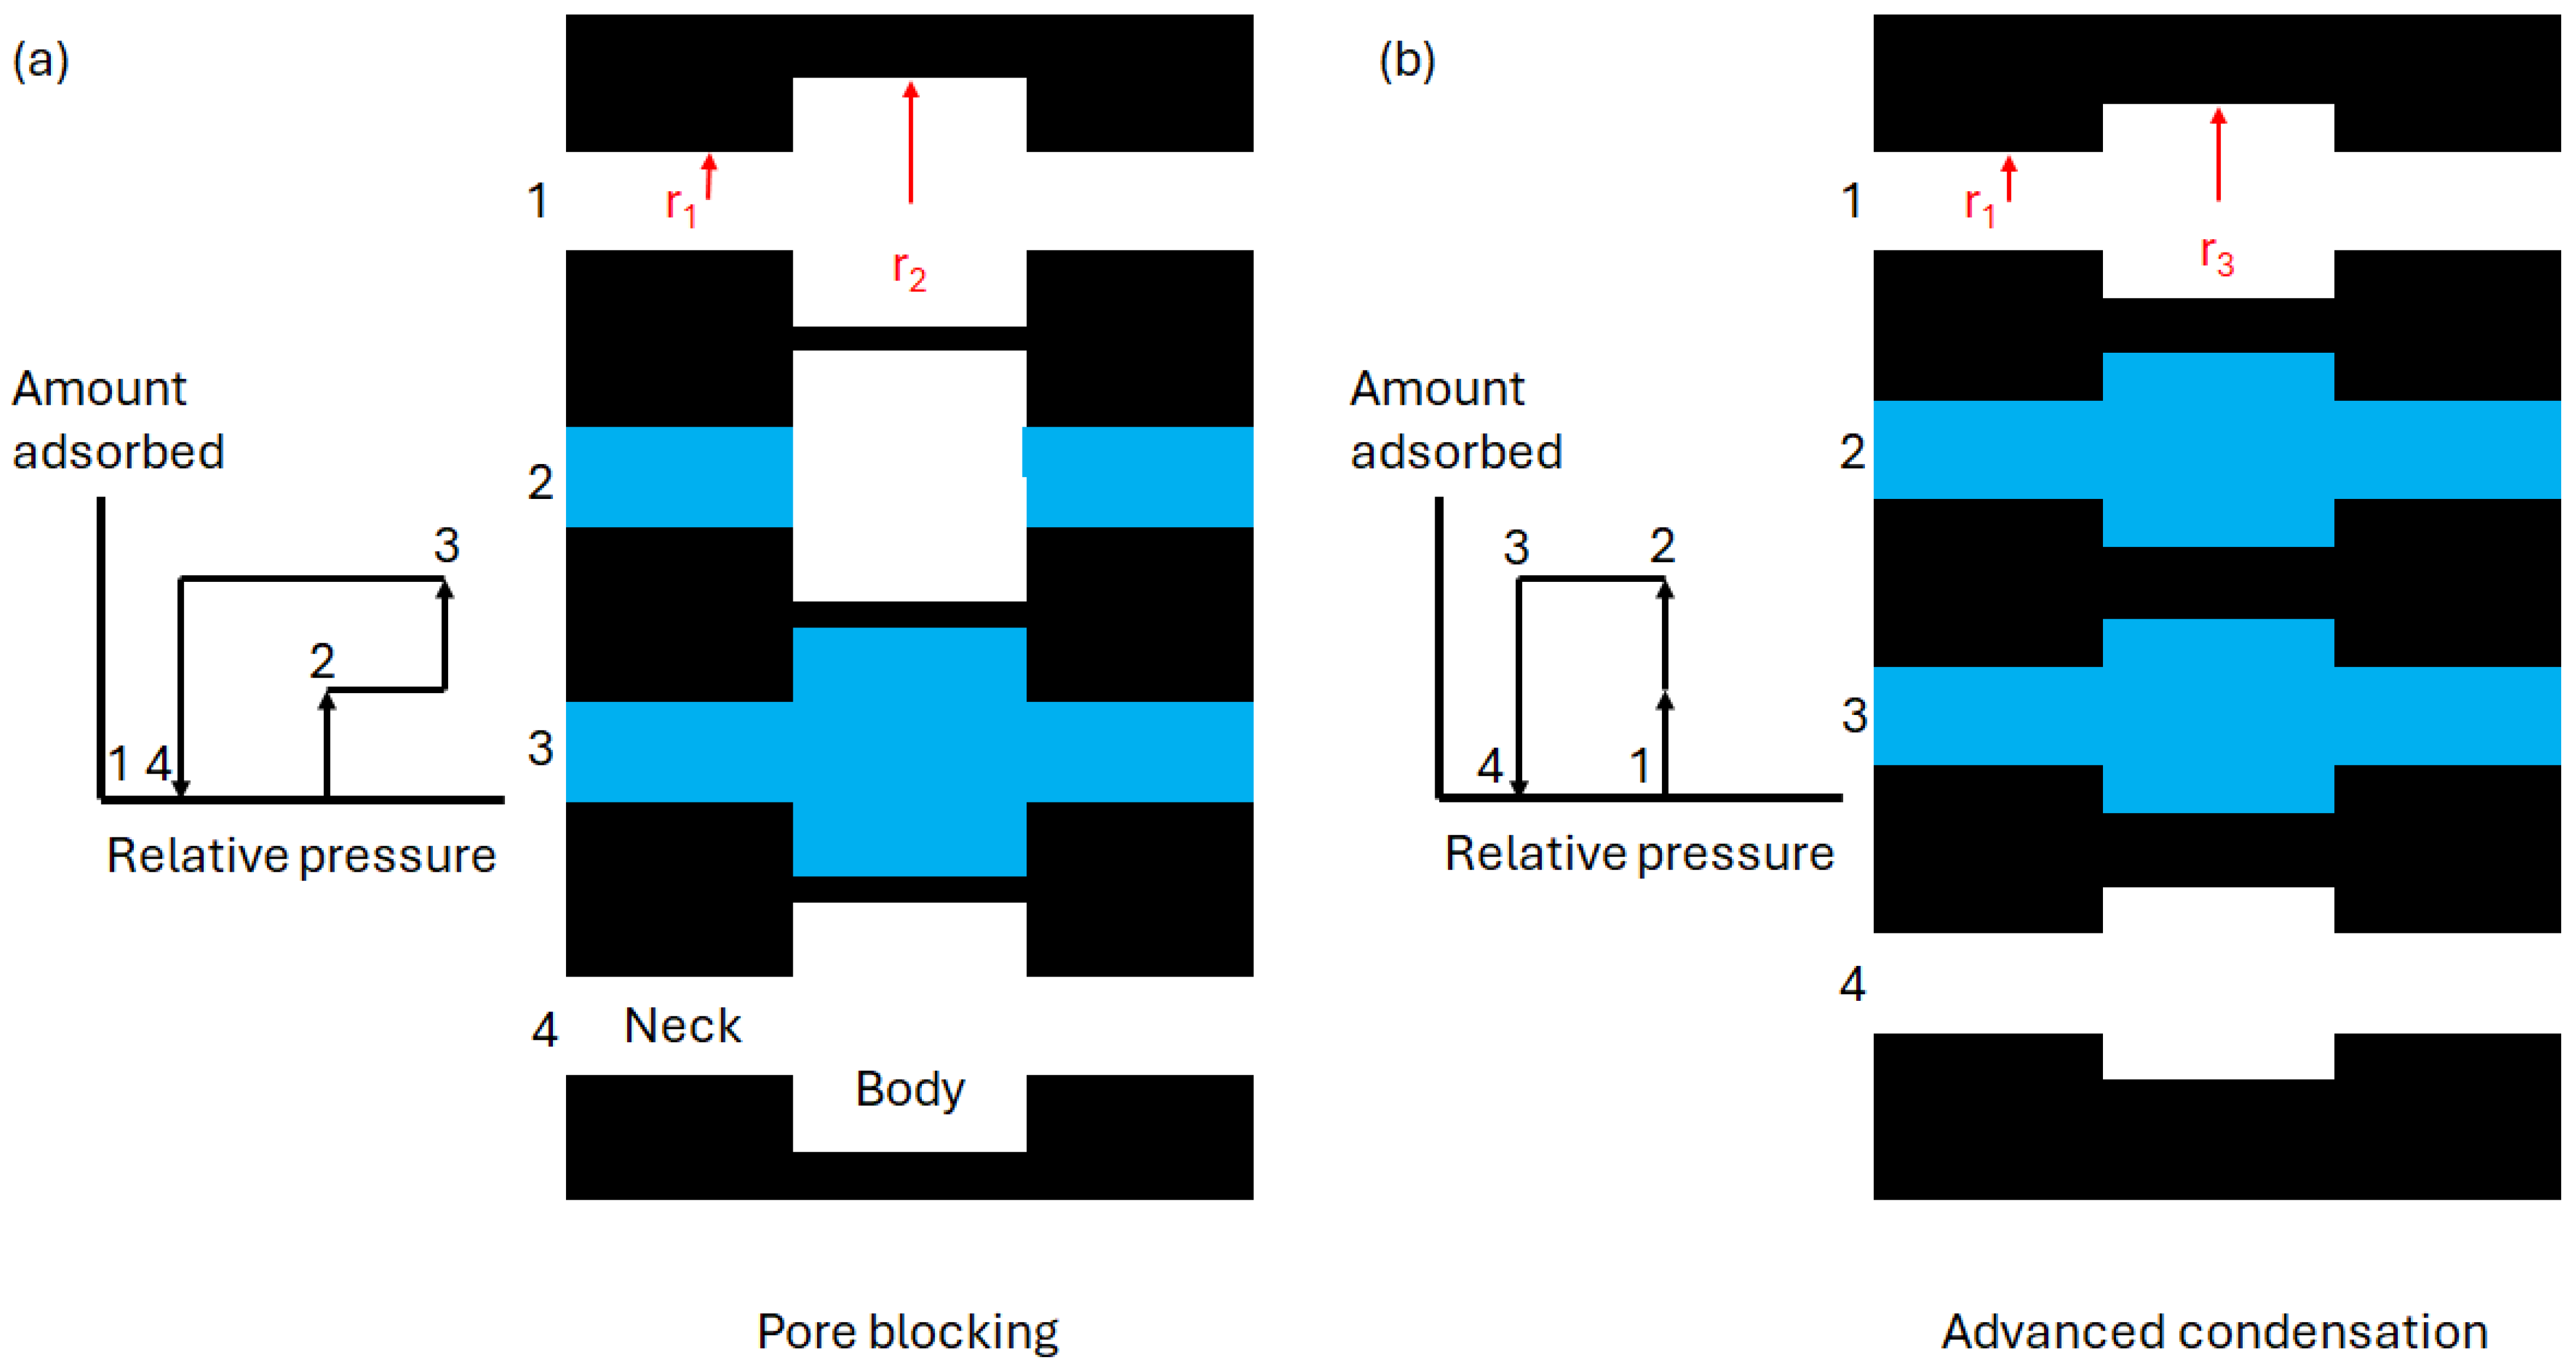
The mechanism of desorption depends upon the geometry of the pores and the degree of interconnectivity between them [5]. For short through cylindrical pores, desorption tends to occur via the retreat of a hemispherical meniscus, corresponding to the thermodynamic equilibrium transition, from the open end of the pore. However, Zelenka et al. [4] proposed that, for an “extremely long” pore, the state of the condensate passes through the equilibrium until it reaches the spinodal point, and cavitation (the formation of bubbles of the vapor phase) begins to occur, although these authors are not specific on what counts as an extremely long pore. In the simplest pore network structure, known as the “ink-bottle” pore, a larger pore body only has access to the vapor phase via one or more narrower pore necks or windows. A window is an extremely short pore neck with no (significant) volume. For example (as seen in Figure 1), a through cylindrical ink-bottle pore consists of a cylindrical shell body sandwiched along its long axis by, and open to, two hollow cylinders with smaller radii than the body. A dead-end, cylindrical ink bottle only has one exit neck and a solid wall at the other end.
In ink-bottle pores, the desorption mechanism depends upon the absolute size of the pore neck and the nature of the adsorbate. For example, for nitrogen, pore necks below a size of ~4 nm will lead to desorption from the pore body via homogeneous nucleation, or cavitation, at a relative pressure of ~0.4–0.5, irrespective of the actual neck or body size, with the neck remaining filled with condensate. It has recently been seen that the cavitation effect can also occur for chemically heterogeneous, as opposed to geometrically heterogeneous, pore structures [6]. A higher surface–adsorbate interaction strength in the “neck” region acts in a similar way to a very narrow pore neck to stabilize the condensate in that region. For larger pore necks in geometric ink bottles, the pore-blocking effect occurs, where metastable condensate is retained in the pore body until the condensate in the neck evaporates (see Figure 1).

1.3. Aims of This Review

The subsequent structure of this review is as follows. Gas sorption experimental techniques continue to evolve, and so, this review will initially discuss recent developments in experimental methods, such as the choice of adsorbate and isotherm temperature, and also novel experimental protocols, such as overcondensation. It will then go on to consider recent developments in methods to determine the key void space descriptors of specific surface area and pore size distribution (PSD). The next section will discuss progress in the fundamental theories of adsorption and data analysis methods, especially in the context of more elaborate gas sorption experiments beyond the simple boundary isotherms. A Discussion section will then attempt to distill key general themes arising from the preceding broader, more detailed survey. Finally, some suggestions for the likely direction of future research will be made, and some overall conclusions drawn.

2. Experimental Developments

2.1. Adsorbent

As mentioned above, the focus of this review is on disordered porous solids. However, it is often suggested that more ordered, templated porous solids can be used as model systems on which to base the interpretation of data for more disordered materials. However, as will be seen below, there are particular physical effects that only arise for complex interconnected void spaces, and, thus, templated materials are of limited use in understanding these issues [7]. Furthermore, it is important to note that even crystalline materials, such as metal–organic frameworks (MOFs), are rarely perfect. As highlighted in the key review by Furukawa et al. [2], real-world MOF crystals often contain missing linkers, structural defects, and faults that introduce significant heterogeneity. Consequently, the methods and theories discussed in this review for disordered media are increasingly relevant for characterizing these real, so-called ‘ordered’ materials, where defects can mimic the behavior of amorphous solids. Further, the use of templated materials for the validation of adsorption theories may lead to a vicious cycle. It might be presumed that the synthesis procedure gives rise to a perfect, model structure, but real syntheses will lead to potentially undetected (via SEM etc.), and, thus, unknown, faults and imperfections in the structure that could impact the form of the sorption data.

2.2. Choice of Adsorbate

Table 1 provides a summary of the properties and key advantages and limitations of the three most commonly used adsorbates, nitrogen, argon, and carbon dioxide.
It has been known for some time that the most commonly used adsorbate, nitrogen, is not non-specific but, due to its quadrupolar moment (see Table 1), can exhibit specific adsorption effects [8]. For example, on partially de-hydroxylated silica surfaces, the nitrogen shows more affinity for surface patches that retain their polar hydroxyl groups. This effect is manifested in an under-estimate of the surface area, via the BET method, and also in an over-estimate of the surface fractal dimension, from the application of the fractal BET or fractal FHH equation to multilayer adsorption, compared to that using a similar method but employing a non-polar hydrocarbon, such as butane, or from SAXS [14].
Carbon dioxide is also a quadrupolar molecule, and the quadrupole moment is larger than for nitrogen (see Table 1). Carbon dioxide is often proposed as an alternate adsorbate to nitrogen and argon for probing microporosity, due to the common isotherm temperatures being larger (typically 273 K versus 77 K or 87 K) and, thence, mass transport limitations being lower. However, the quadrupole moment of carbon dioxide means that it is only really appropriate for non-polar surfaces, such as graphitized carbons [11].
Argon is often used as an alternative adsorbate to nitrogen because the former is ostensibly a more non-specific adsorbate, given the quadrupole moment of nitrogen [9]. However, argon is actually quite polarizable, such that it has even been used as a probe of surface acidity of porous solids [15]. Argon gives rise to slightly smaller modal pore sizes than nitrogen for SBA-15 when using non-local density functional theory (NLDFT) to obtain the PSD for SBA-15 [16] (NLDFT allows for a gradual variation in adsorbate density across a pore diameter, in contrast to the step change in the classical approach, and will be discussed in more detail below in Section 3.2). The discrepancy highlighted, when it arises, seems to be associated predominantly with the adsorption branch. This was attributed to differences in the polarity of the molecules. There is also an issue with argon adsorption performed at liquid nitrogen temperature (77 K), rather than its own normal boiling point (87 K). The nature of the reference state (for the saturated vapor pressure) is uncertain, as it may be a disordered solid rather than a liquid [4]. A similar problem exists for the adsorption of another noble gas, krypton, which is often used to obtain surface areas for low surface area solids [8].
Schlumberger et al. [9] compared the surface areas of three types of silica nanoparticles and a controlled pore glass, obtained from nitrogen adsorption BET, argon adsorption BET, and SAXS Porod analysis. They found that the surface areas from nitrogen were typically over 20% higher than those from argon. The argon BET surface areas agreed, within experimental error, with the SAXS surface areas for three of the samples, but not one of the silica nanoparticles. Schlumberger et al. [9] attributed the discrepancy between the nitrogen and argon surface areas to specific adsorption of the nitrogen on the polar silica surfaces. These authors advocated SAXS as a quicker method of surface area determination than gas adsorption. However, SAXS is not able to distinguish between open and closed porosity without the use of a contrast matching agent (which would mean the loss of the ease and rapidity of the experiment), and all the samples tested by Schlumberger et al. [9] had open porosity. Further, the samples tested by Schlumberger et al. [9] were highly chemically homogeneous. However, X-rays are more scattered off atoms with high electron density, and, thus, the presence of heavy metal atoms, as often occurs for industrial materials such as catalysts, would complicate the interpretation of SAXS data further, thus losing its advantages.
The surface area for silica materials obtained from a BET analysis of argon adsorption at 87 K has also been compared with that obtained from NMR relaxometry using water as the probe fluid [17]. It was found that, for materials with ultramicropores, the surface area was underestimated by argon adsorption when compared with water relaxometry. This discrepancy was attributed to the inability of argon to penetrate the small pores, unlike water. It was thus suggested that relaxometry might be an alternative method for surface area determination. However, relaxometry relies upon a suitable calibration of the surface relaxation strength using a model material with a surface chemistry very similar to the future test materials. Further, the surface relaxation can be substantially affected by paramagnetic impurities, and the test study by Schlumberger et al. [17] was performed on samples that had very low paramagnetic impurities. In contrast, many industrial materials for which a surface area is required, such as heterogeneous catalysts, may have an unknown heterogeneous spatial distribution of significant amounts of paramagnetic impurities (e.g iron) across the surface [18]. The alternative surface area methods proposed by Schlumberger and co-workers [9,17] seem confined to applicability only for certain highly ideal materials.
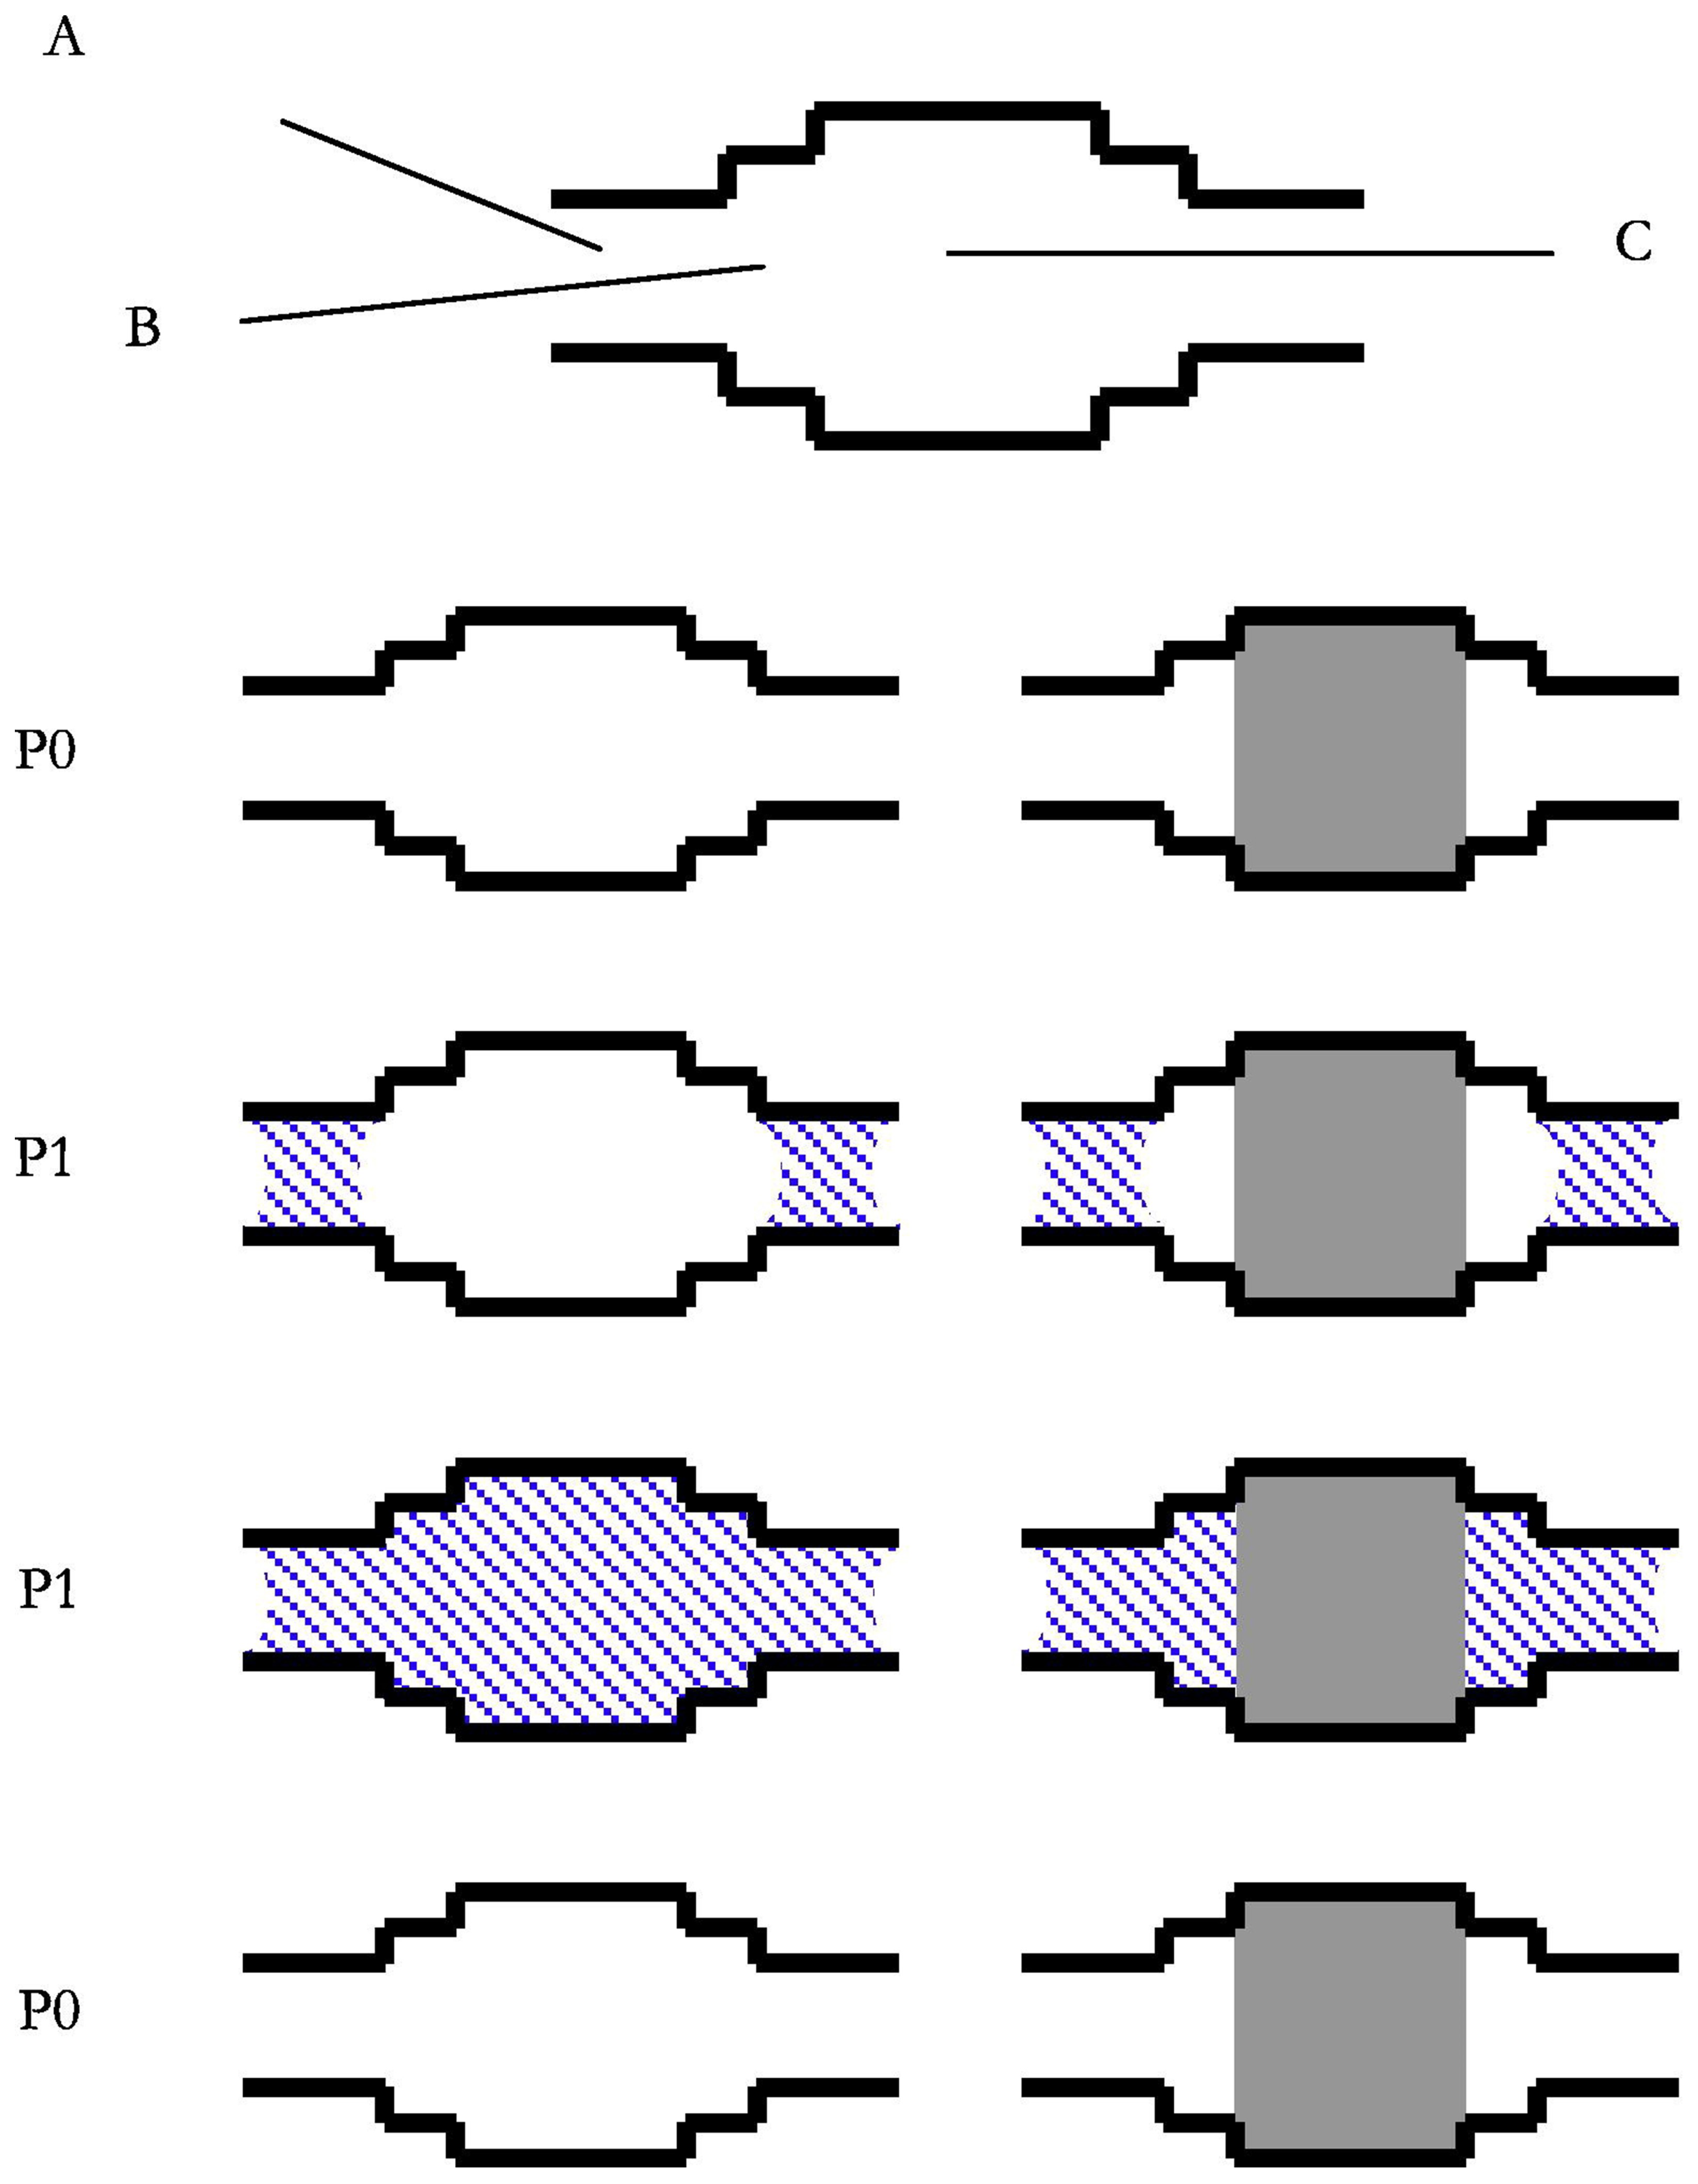
There is a difference in the wetting properties of argon and nitrogen that can be actively exploited. While nitrogen will wet a heavy metal surface, such as frozen mercury, argon will not [19]. This difference has been exploited in the detection of network-based delayed condensation effects [20]. Capillary condensation within a given pore is delayed (to higher pressure) when the pore potential therein is decreased due to missing solid wall segments (which would otherwise create attractive interactions), where other pores (as yet unfilled with condensate) form junctions with the pore in question [21]. The Kelvin equation (and its ilk) and DFT kernels typically assume, say, cylindrical pores with solid walls along their entire length. An assessment of the prevalence of these network-based delayed condensation effects is necessary to establish the accuracy of the PSD. Due to the difference in wetting between nitrogen and argon, when an adjoining side pore is filled with mercury, then the junction looks like a solid wall to nitrogen but not to argon. Hence, the change in capillary condensation pressure for nitrogen, but not for argon, following mercury entrapment in the side pore, reveals the network-delayed condensation effect at work. This effect has been detected for disordered oxide materials [20]. Pore-to-pore co-operative effects such as these tend to be much larger in impact on the accuracy of PSDs for middling-to-large mesopores within disordered networks, compared to the relatively marginal differences arising from the use of the Kelvin equation versus NLDFT [7]. Further, the lack of wetting of heavy metal surfaces by argon suggests that it is potentially unsuitable for pore size characterization of supported metal catalysts [19]. Pore-to-pore co-operative effects will be discussed in more detail below in Section 4.3.
Recently, a comparison of the PSDs from adsorption and desorption branches for both argon and nitrogen has been proposed as a test for cavitation effects. In a relatively short, through cylindrical pore, as found in materials such as SBA-15, capillary condensation tends to arise at the adsorption spinodal, while desorption occurs at equilibrium [22]. Hence, in such limited cases, PSDs derived using these kernels ought to superpose for both isotherm branches and for different adsorbates, given the lack of any other effects [8]. A lack of superposition can indicate the occurrence of another effect, such as cavitation in the desorption, where the critical pressure is relatively independent of pore body size. Cavitation tends to arise when larger pore bodies are shielded by very narrow pore necks less than ~4–5 nm in diameter for nitrogen. The superposition of PSDs will also not occur in the presence of pore-blocking or advanced condensation due to corrugations in the cylindrical pore. It is also noted here that, in longer cylindrical pores and for more complex geometries, adsorption can arise at any location between the equilibrium and spinodal, as will be discussed below in Section 4.1 and Section 4.3.
The cavitation effect prevents the determination of all neck sizes using conventional nitrogen or argon desorption for materials with neck size distributions that extend below ~5 nm. Such a situation arose for hydrothermally treated KIT-5 silica materials [23]. Morishige [23] thus proposed employing water desorption instead in cases where there was cavitation for nitrogen. The KIT-5 pore structure consists of a face-centered cubic array of large spherical cavities joined by narrow cylindrical necks. While the cavities (pore bodies) were generally unaffected by the hydrothermal treatment, the change in the shape of the desorption isotherm with the period of such treatment suggested that the necks were being modified. Indeed, electron tomography results suggested that some connecting channels began to merge and form defects with hydrothermal treatment. However, Morishige [23] suggested that the defects were relatively sparse, and, thus, the overall desorption behavior was still determined by percolation effects. Morishige [23] thus performed percolation modeling of desorption from model lattices akin to the basic KIT-5 pore structure. The model lattices were relatively small (side length 50) because the form of KIT-5 was a fine powder of size ~1 μm. He found that a completely random arrangement of pore neck sizes could not reproduce the shape of the desorption isotherm. However, a better fit to both water and nitrogen desorption isotherms was obtained for models with spatially correlated neck sizes wherein the mean neck size progressively varied from larger to smaller with each successive layer number moving from the exterior boundary inwards. This modeling allowed the full, underlying pore neck size distribution to be determined.
Given the relatively high quadrupole moments of nitrogen and carbon dioxide, and the relatively high cost of liquid argon, Jagiello and Kenvin [24] have proposed the use of oxygen and hydrogen as adsorbates, at liquid nitrogen temperature, to probe polar zeolite materials. This is because the quadrupole moment of oxygen is less than one-third of that of nitrogen, and hydrogen has a very small molecular diameter and, hence, can diffuse quickly into micropores even at cryogenic temperatures. Jagiello and Kenvin [24] found good agreement between the PSDs obtained from individual analysis of oxygen and argon isotherms for zeolites. However, they found that it is necessary to perform a combined analysis of oxygen and hydrogen isotherms because a hydrogen isotherm alone was unreliable for probing zeolite pores larger than 7Å.
For porous materials with very low surface areas (<10 m2g−1), the use of krypton, as an alternative adsorbate to nitrogen and argon, is typically advocated [8]. Laudone and Jones [25] developed kernels using GCMC simulations for determining PSDs for such materials from krypton adsorption, since these had been lacking previously. They tested them on low surface area nuclear-grade graphite materials.

2.3. Temperature of the Isotherm

Structural characterization experiments using nitrogen and argon are usually carried out at the normal boiling point (77 K and 87 K, respectively) since it is easy to use the liquified gas to maintain constant temperature. However, variable temperature experiments provide a way to extract more structural information. For example, narrower mesopores will contribute to hysteresis when the isotherm is performed at lower temperatures than the aforementioned usual (at sea level) boiling points and, thus, can then be used to infer information on pore connectivity [26,27]. If argon sorption is conducted at 77 and 65 K, then the measurement temperature comes below the hysteresis critical temperature for narrower mesopores, and they now contribute to hysteresis. In a mesostructured zeolite Y, the appearance of hysteresis in the argon isotherms for these lower temperatures revealed cavitation effects not seen in the argon isotherm for 87 K. The hysteresis was found to be due to cavitation effects through the use of hysteresis scanning curves. These findings suggested that the smaller mesopores were shielded by micropores.
Due to the rise in interest in shale rocks, more sophisticated techniques for characterizing microporous materials were required. Since nitrogen and argon adsorption are typically performed at 77 K and 87 K, respectively, it is difficult to obtain fully equilibrated isotherms due to slow mass transport. However, carbon dioxide isotherms can be performed at temperatures around 273 K, which offers faster mass transport. Further, carbon dioxide isotherms can be obtained over the pressure range from ultra-high vacuum (P/P0~10−7) to >80 bar. This potentially enables the probing of length-scales from ultra-micropores to large mesopores using just one technique. However, there is a question concerning what the best isotherm temperature is to enable the most comprehensive pore structural characterization. Further, DFT methods are probably inappropriate for probing pore sizes over such a wide range because they only use a simplistic Lennard–Jones model of the carbon dioxide molecule that cannot reproduce its particular behavior in mesopores close to the region of hysteresis observed in pores of sizes larger than 5.5 nm at 273 K [11]. Monte Carlo methods can better capture the specifics of carbon dioxide in such cases. Dantas et al. [11,28] conducted experimental and Monte Carlo simulations of the sorption of carbon dioxide in model templated carbon materials, such as CMK-3, which has some micropores around 1 nm, and through cylindrical pores of a size of ~6 nm. The experimental results [28] showed that, at 185 K and 195 K, only filling of the micropores could be observed, despite the isotherms being measured all the way up to the relevant saturation pressure, perhaps due to difficulty in resolving between a phase transition in the mesopores and the bulk. However, at 210 K, the isotherm exhibited a clear capillary condensation step within the mesopores and Type H1-like hysteresis. Meanwhile, at 220 K, a similar but narrower hysteresis loop is observed. At 240 K, the hysteresis is absent. At the commonly used temperature of 273 K, the capillary condensation step is completely reversible. While the MC simulations generally showed good agreement with experiment for the desorption curve, the condensation step was not well-predicted for any temperature tested except 273 K. Indeed, while the experiment is reversible at 240 K, the simulated isotherm showed hysteresis, indicating a difference in the hysteresis/pore critical temperatures between the simulation and the experiment. This discrepancy was attributed to the big difference in observation times for the real experiment and the simulation, and the inability of the MC simulation to cross the nucleation barrier that arises near the vapor-like spinodal. In later work, Dantas et al. [11] produced a set of kernels for use in a PSD determination of mesoporosity using carbon dioxide adsorption. They also explored whether the hysteresis region of carbon dioxide isotherms could be used for determining further pore structural information, as those for nitrogen and argon are. These authors found that, for CMK-3, the main mesoporous peak in the PSD using carbon dioxide at ~6.5 nm was slightly larger than that obtained for argon and nitrogen. This was attributed to the aforementioned issue of the convergence of the condensation pressure on the bulk value for larger mesopores, and thus the increasing difficulty in accurate measurement. This suggested that lower temperatures than 273 K would be better for a more accurate PSD of mesoporous carbons from carbon dioxide adsorption.

2.4. Overcondensation Experiments

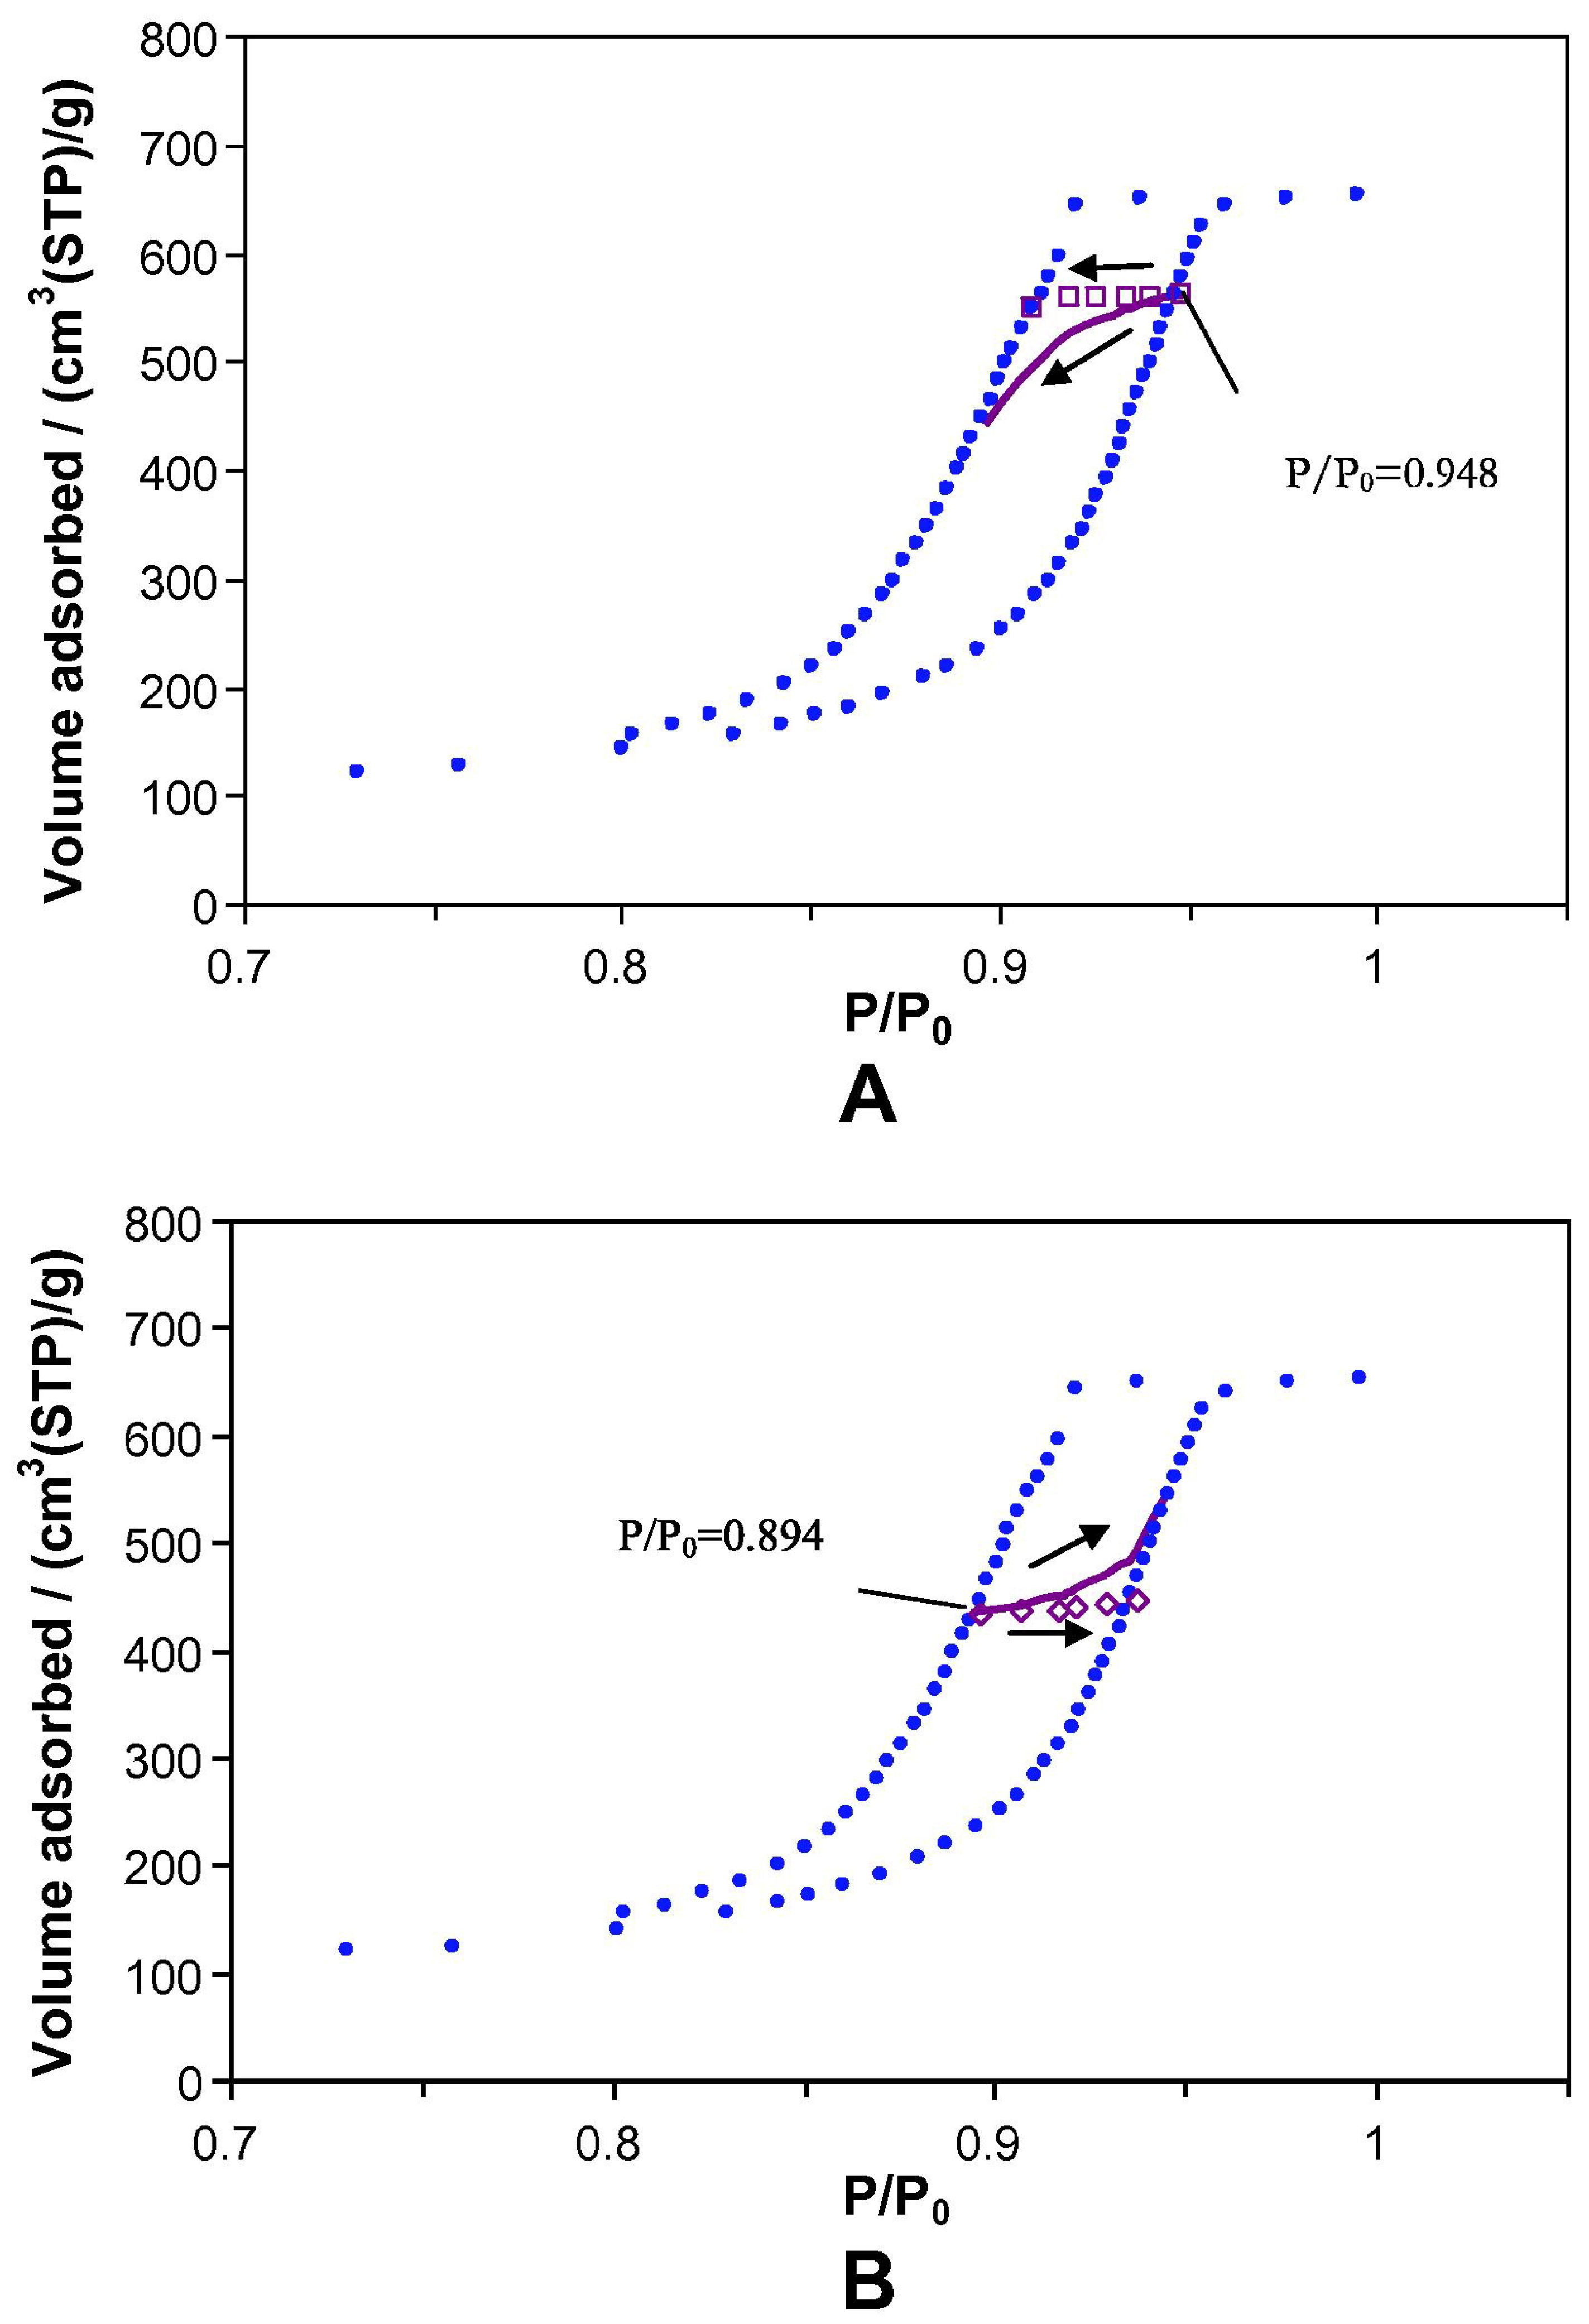
A commercial gas sorption apparatus is often configured such that the sample chamber cannot be flooded with condensate, and so, gas adsorption isotherms are often halted at relative pressures of ~0.995 or thereabouts. This means that the ultimate relative pressure is often insufficient to completely fill the void space of the sample with condensed adsorbate and, therefore, lead the isotherm to plateau off at the top. Hence, a Gurvitsch volume (or total specific pore volume) cannot be accurately measured, and the PSD is artificially truncated at pore sizes of ~200 nm. Further, the macropores left unfilled at the top of the isotherm can lead to an error in the PSD calculation because the thinning of the multi-layer film in these pores is not properly accounted for. The supposed boundary desorption isotherm then becomes a mere scanning curve (see below).
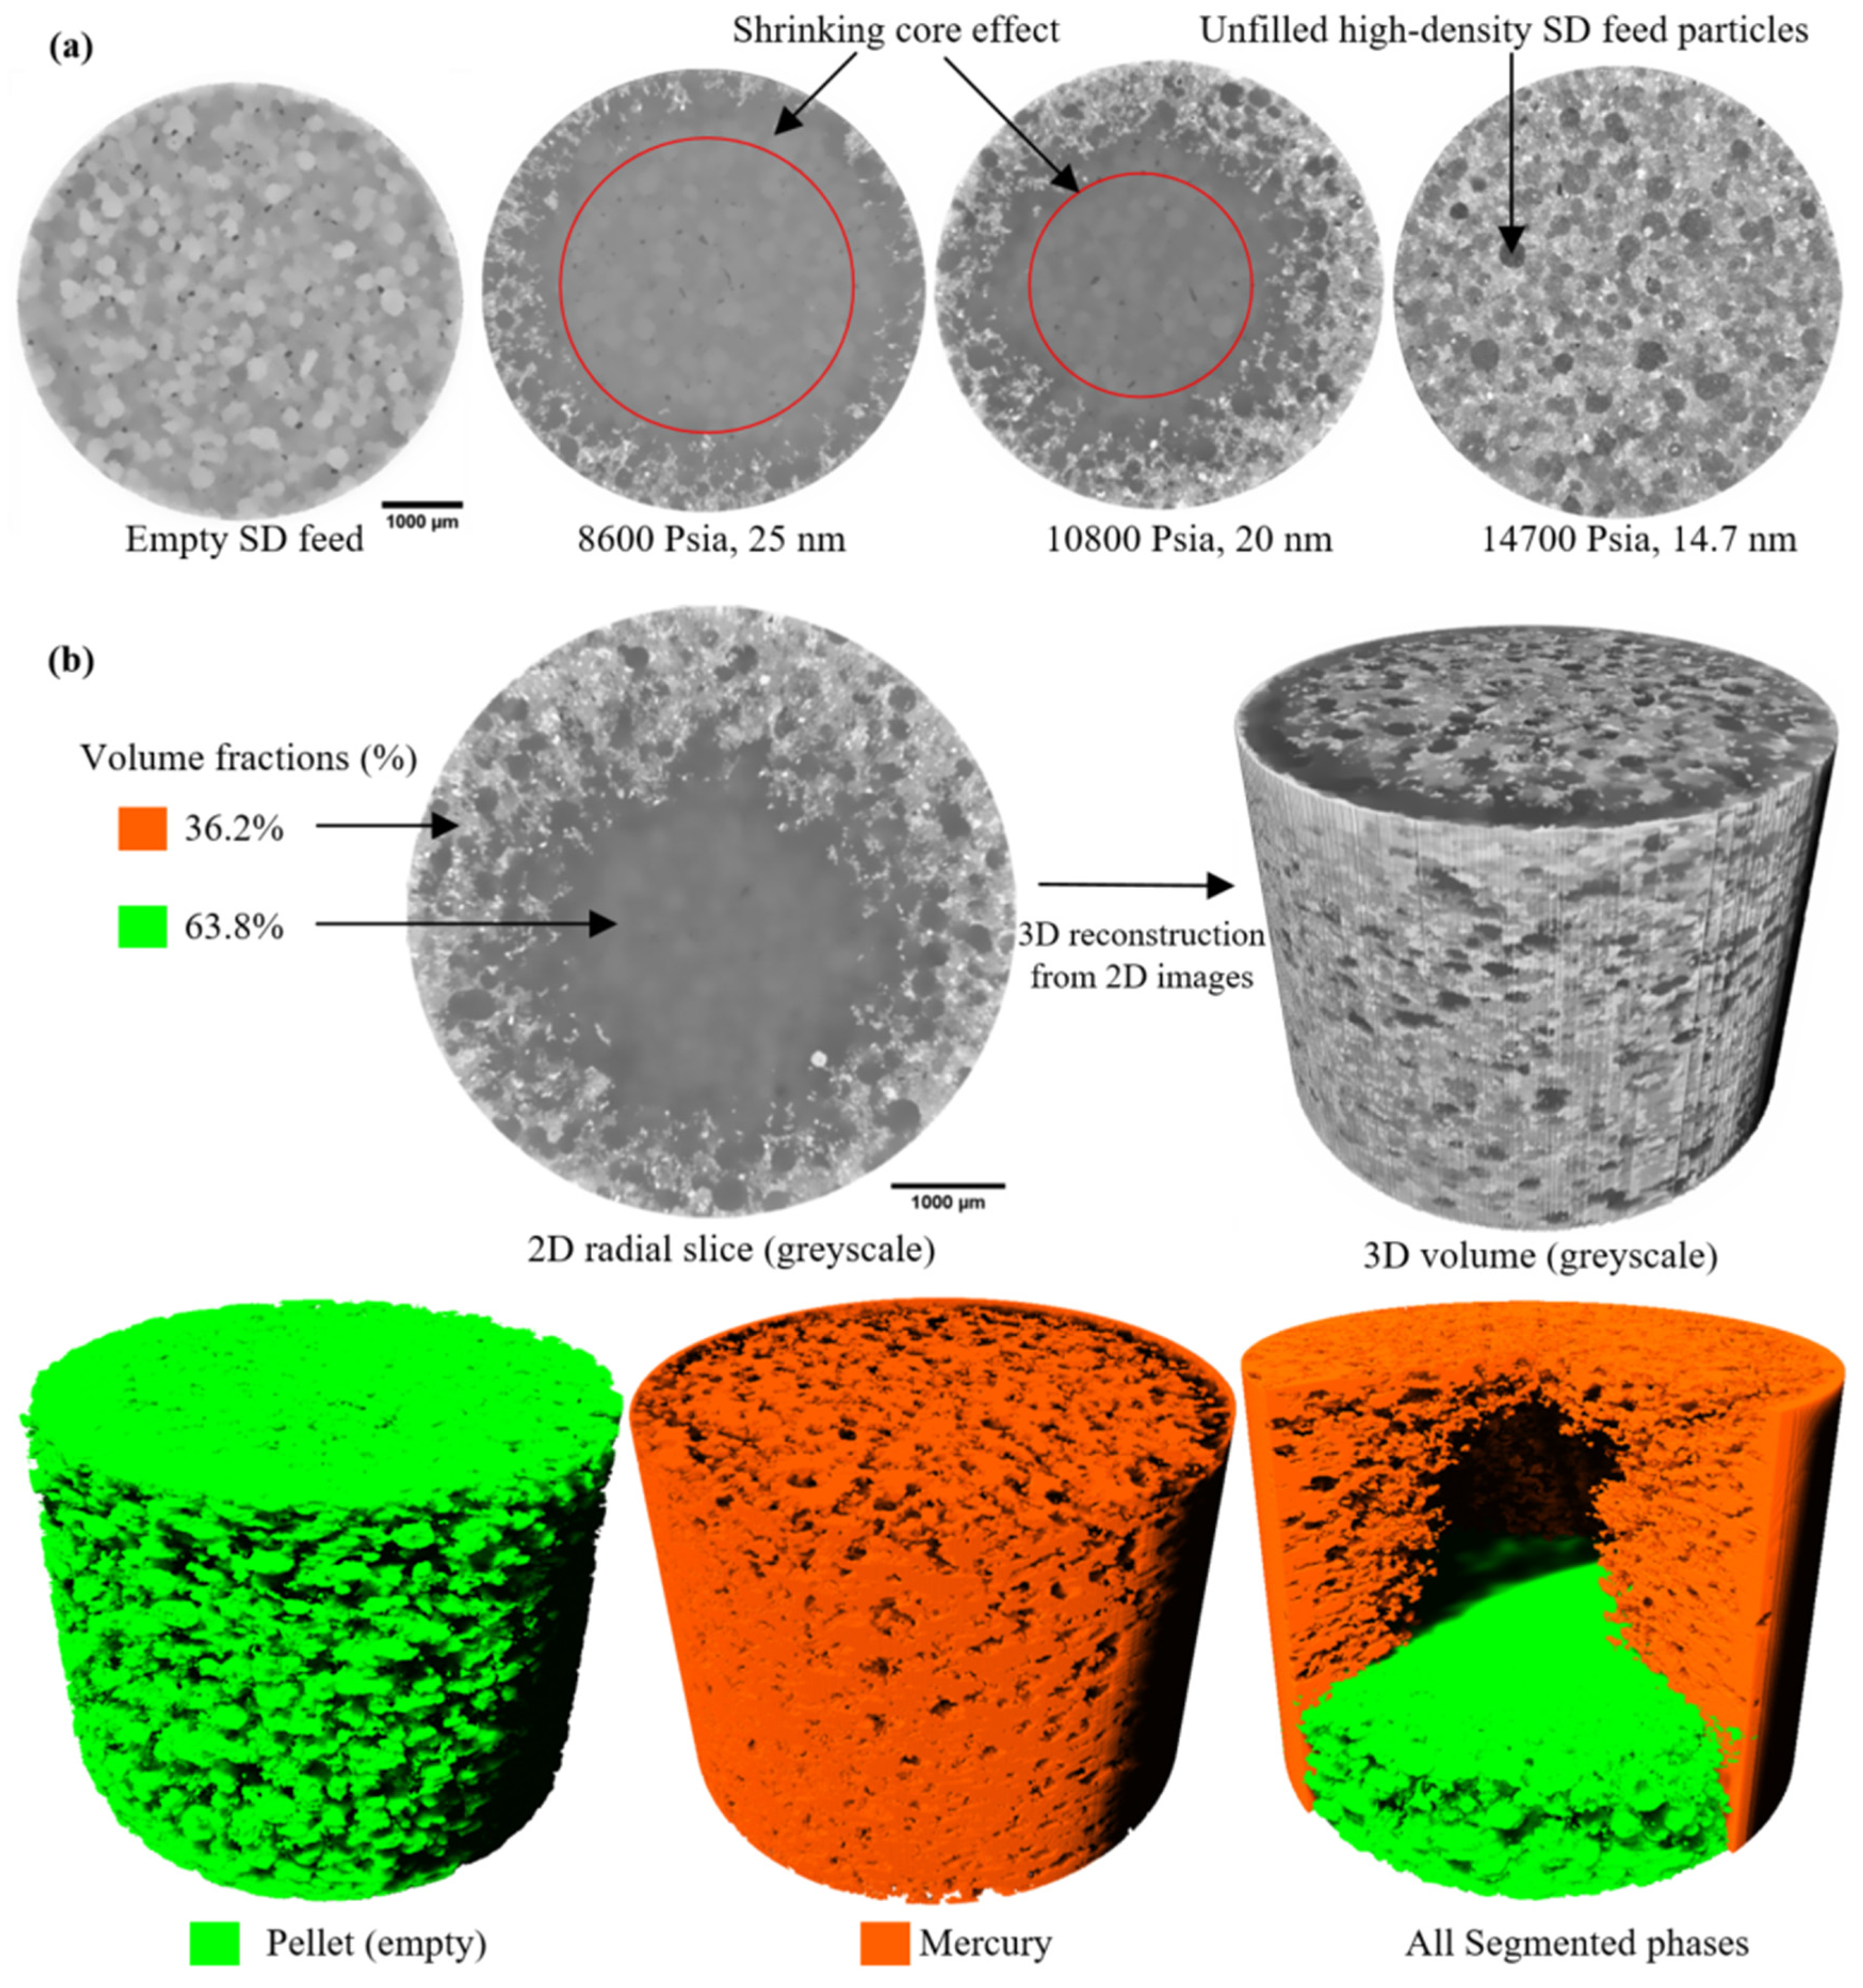
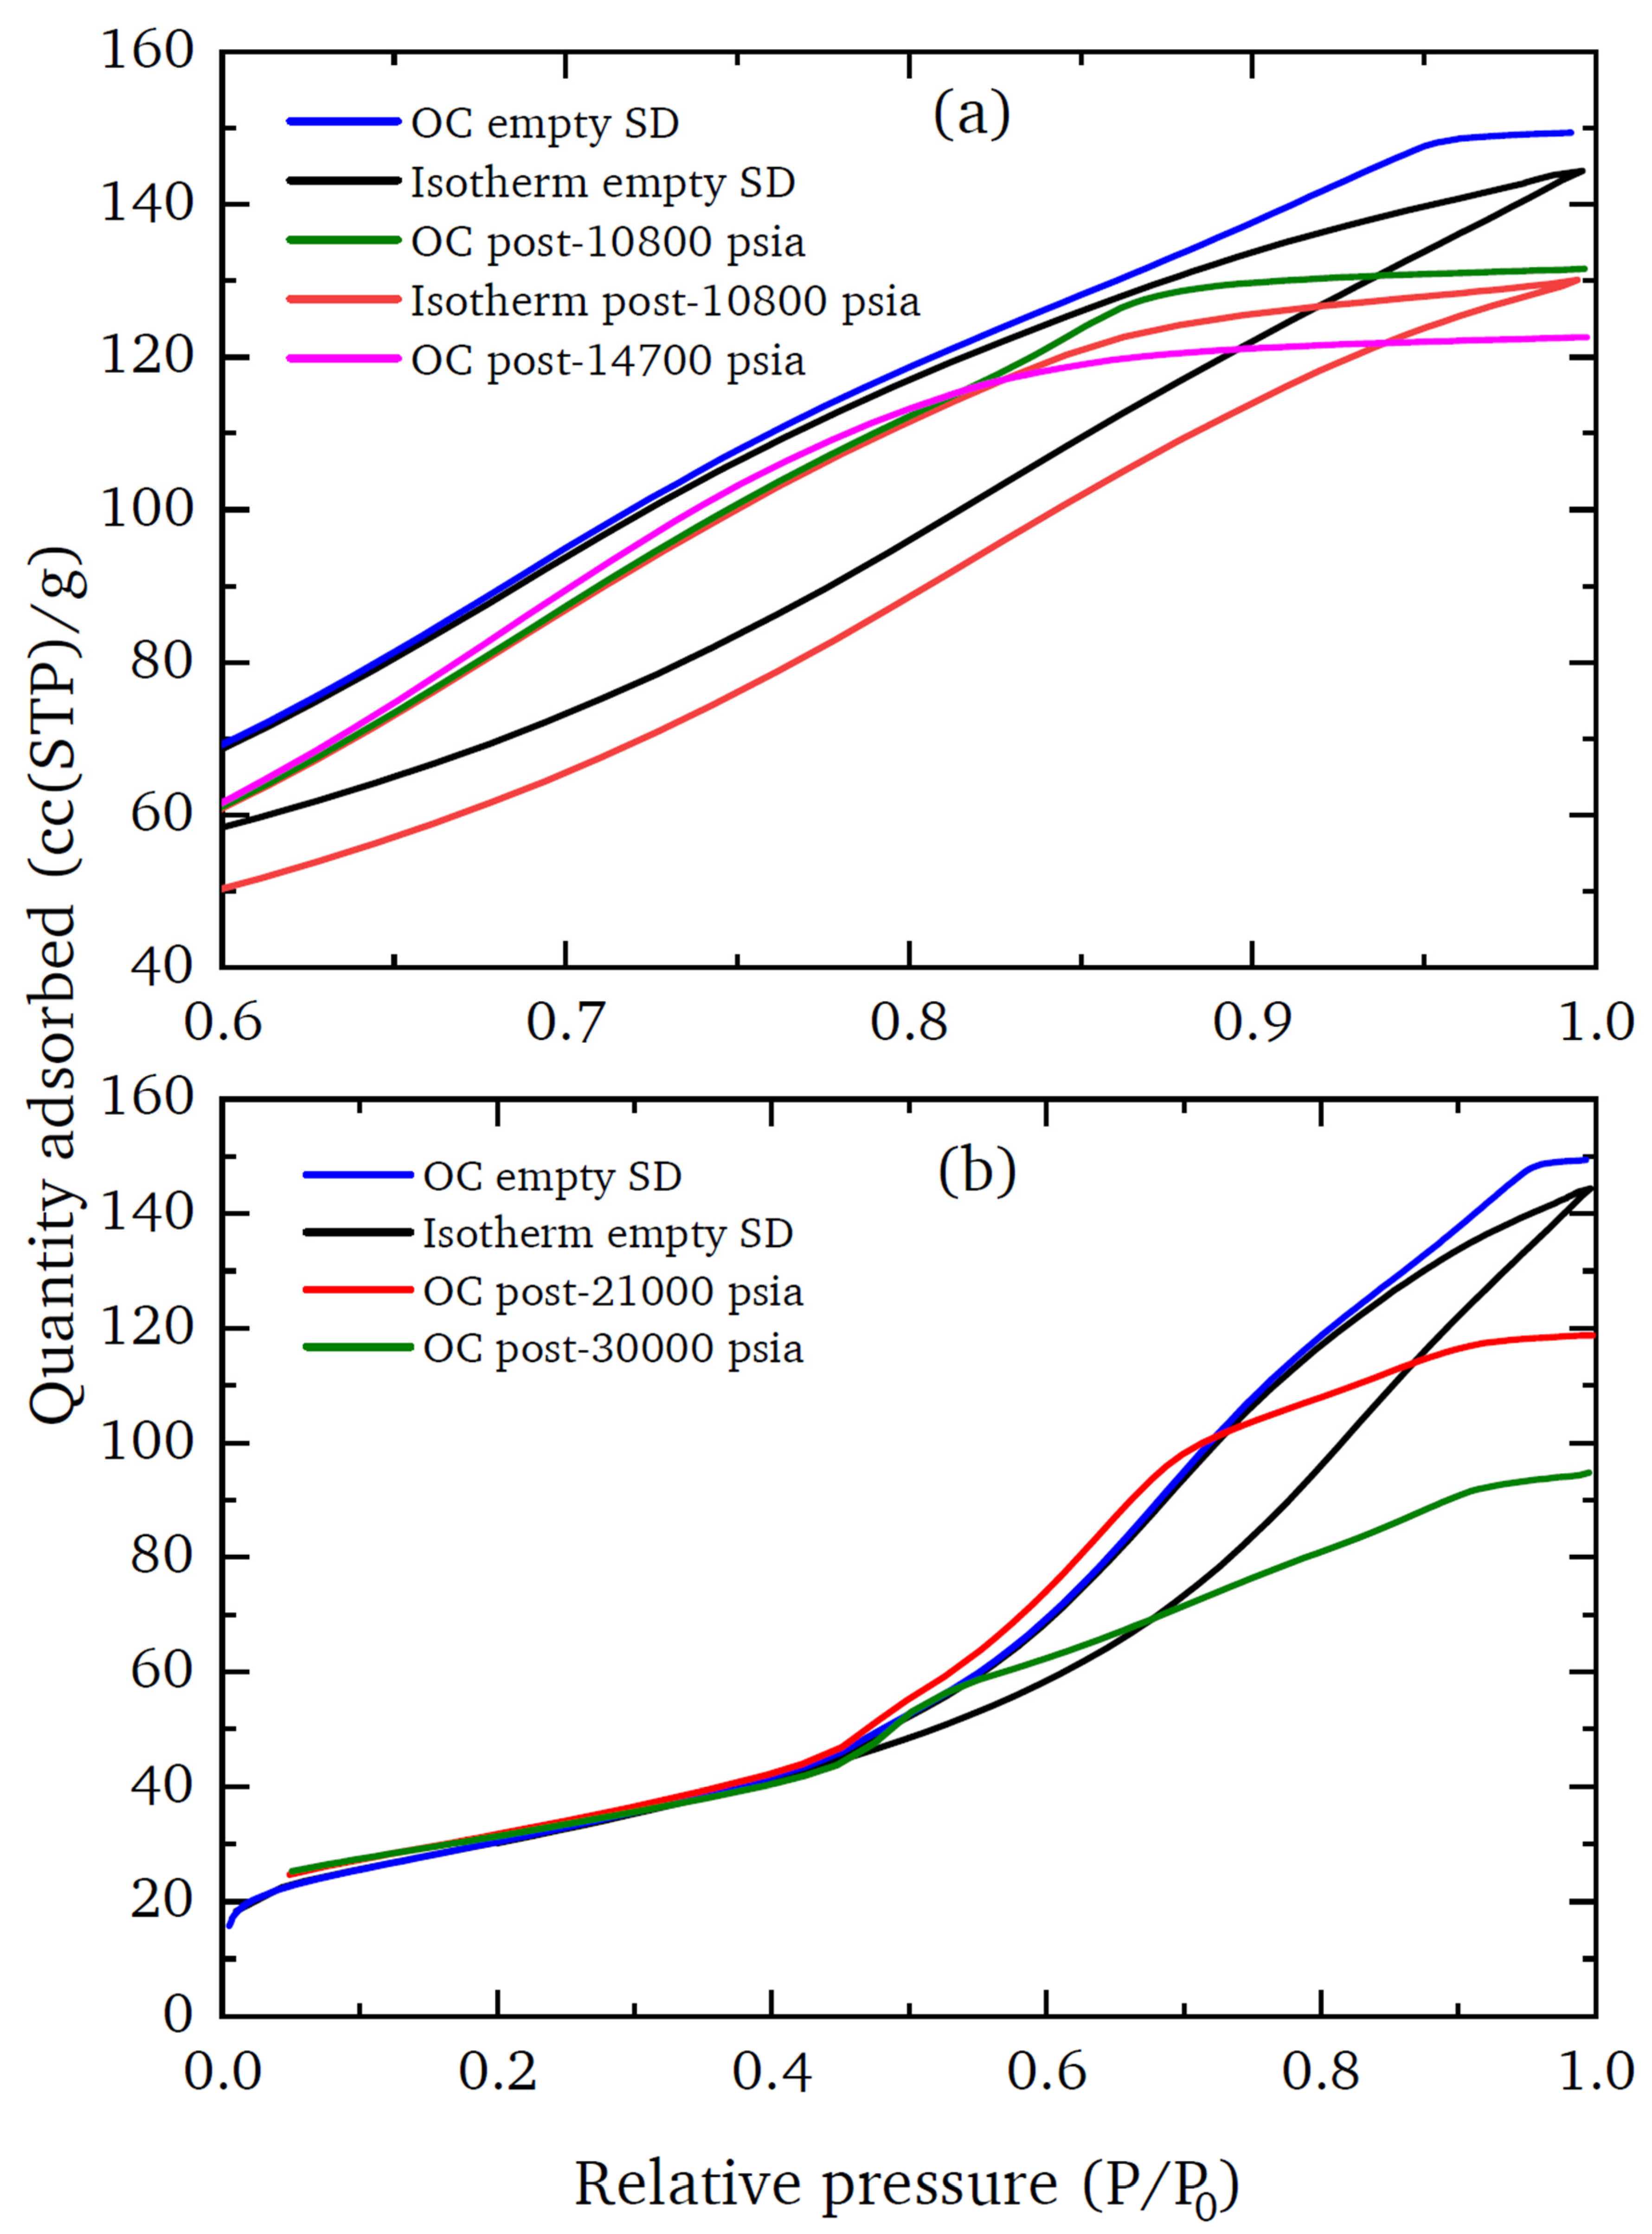
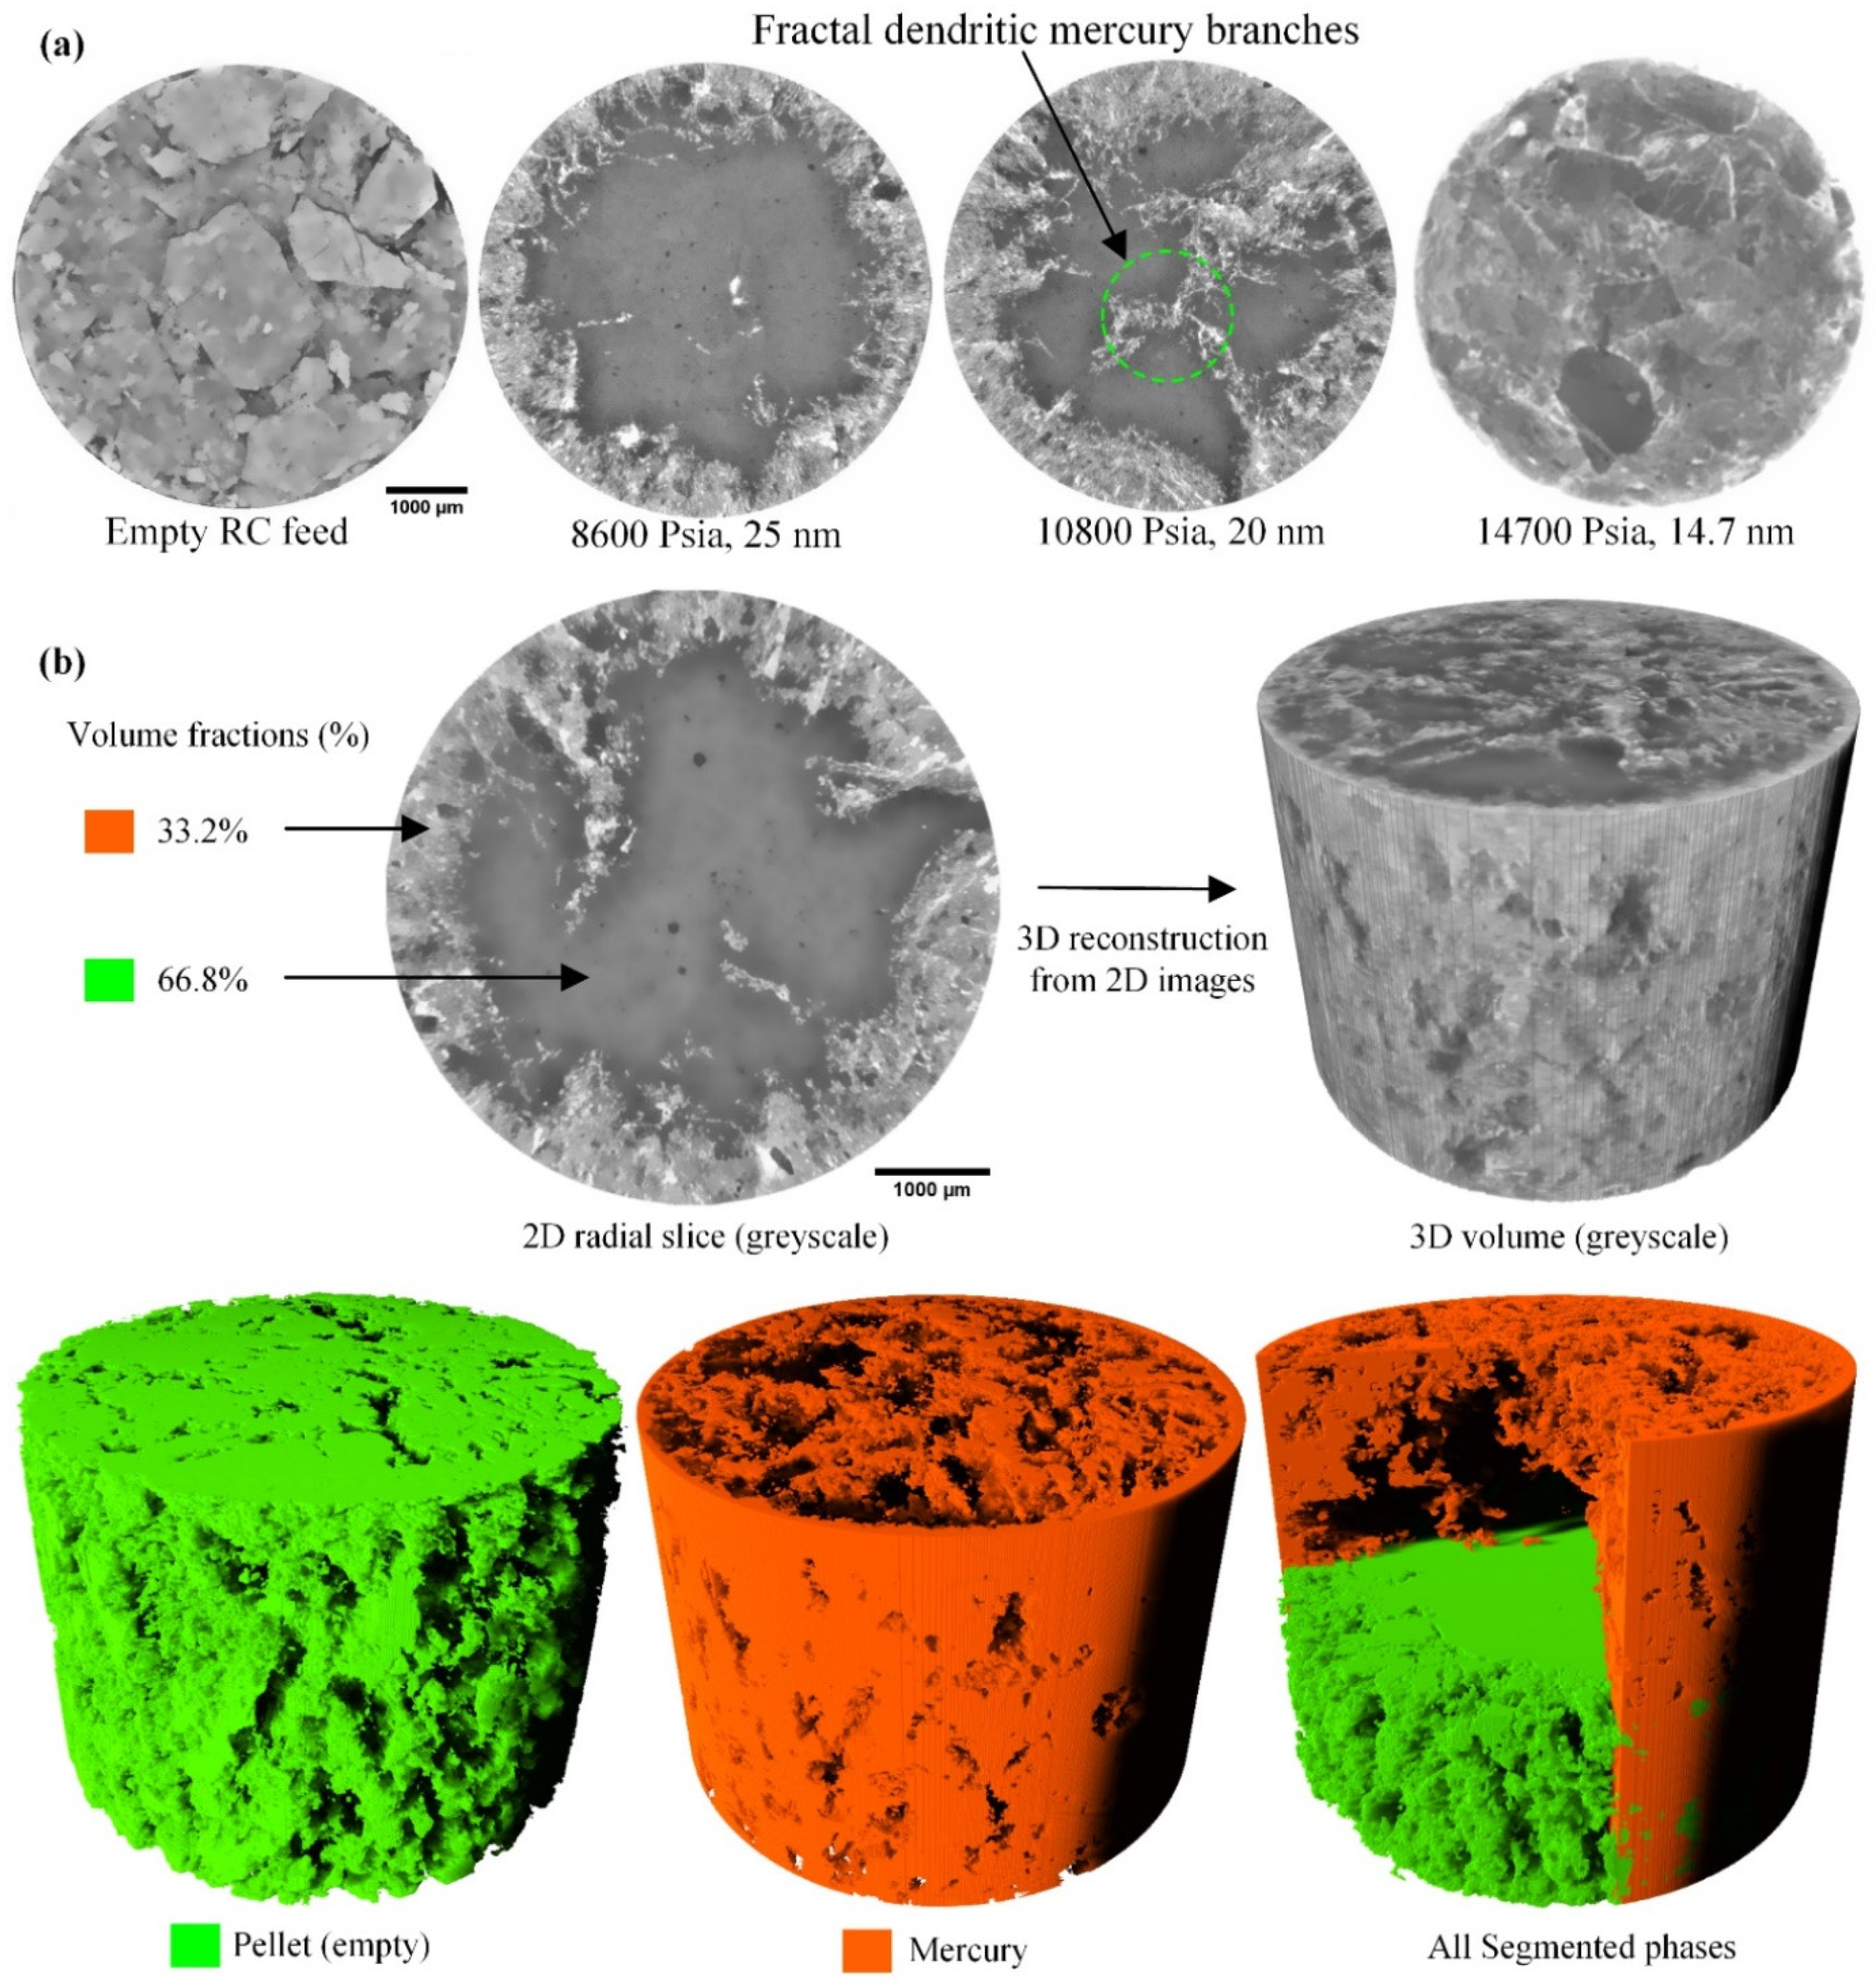
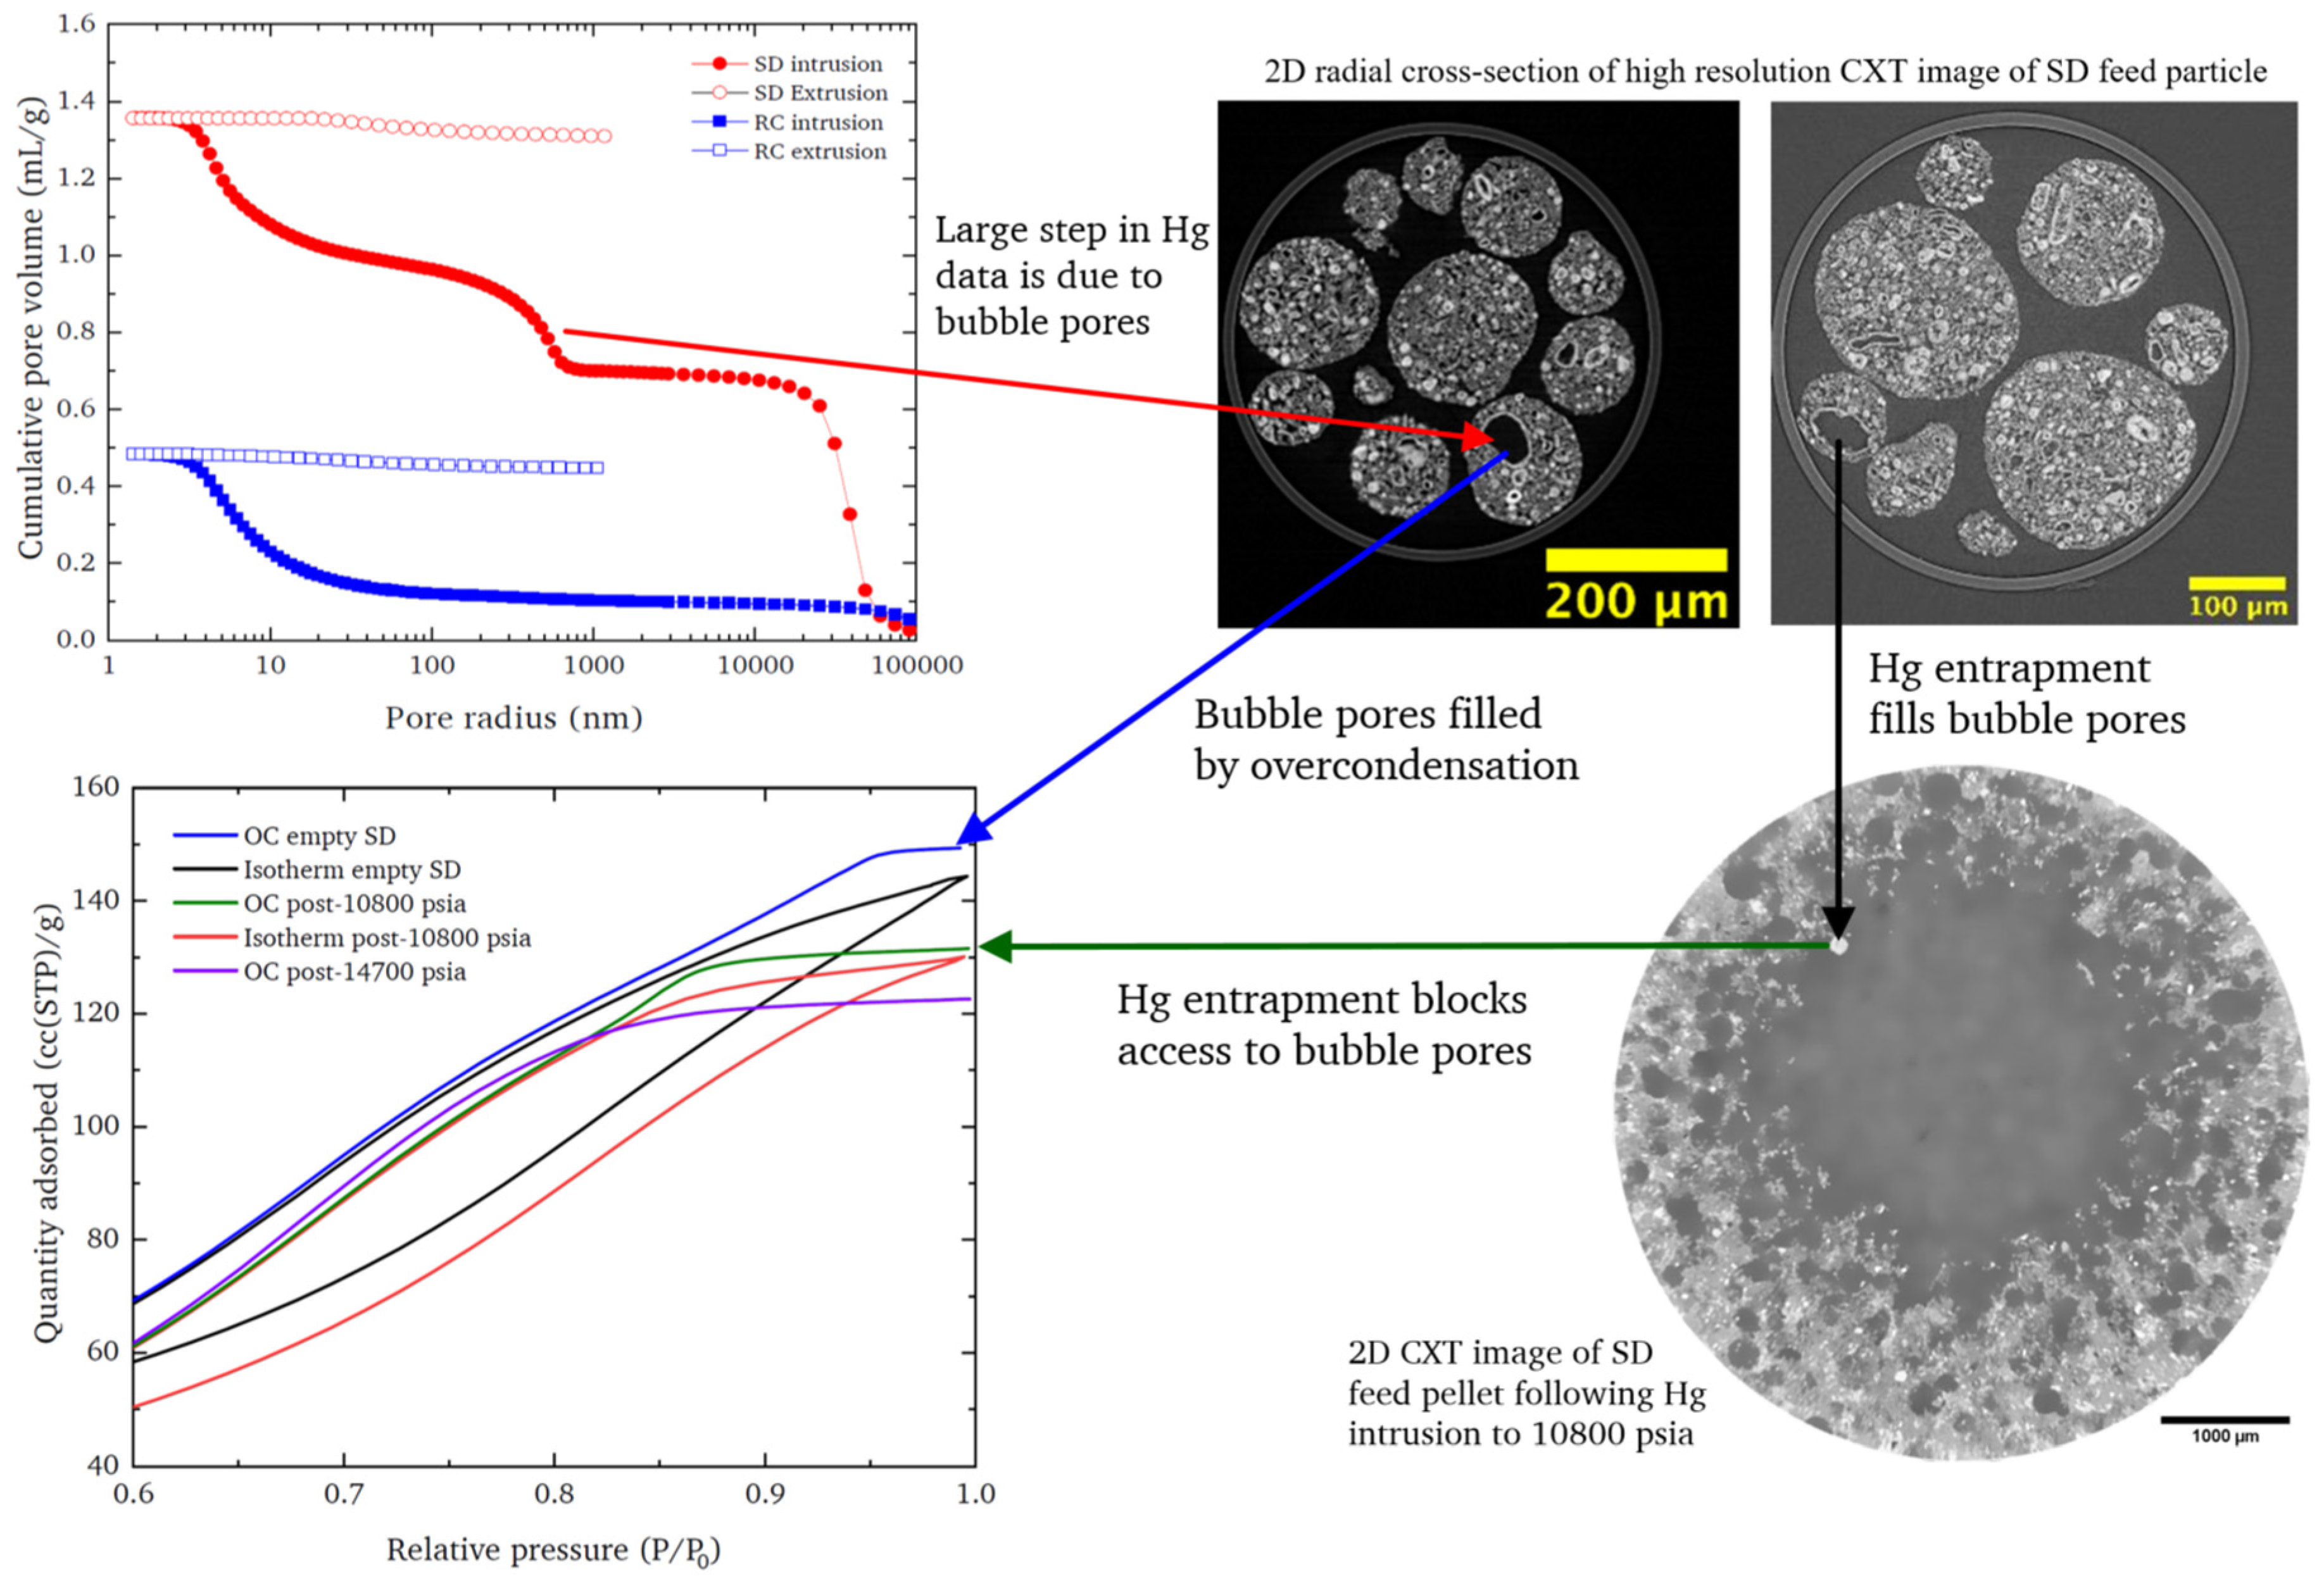
However, the gas overcondensation (OC) (also known as bulk condensation) experiment, originally proposed by Auckett and Jessop [29], and elaborated by Murray et al. [30], permits the obtaining of the correct Gurvitsch volume and the full desorption boundary isotherm from the largest voids (microns to millimeters) down to molecular dimensions (Angstroms). Hence, the limitations on the upper length scale cutoff, potentially probed by gas sorption, often stated in the literature are incorrect [4,27]. Integrated mercury porosimetry experiments performed in series with both conventional and overcondensation experiments, coupled with computerized X-ray tomography (CXT), have revealed the types of porosity missed using conventional isotherms alone but which are detected with OC, such as demonstrated in Figure 2 [31]. For the catalyst pellet in Figure 2, there are so-called “bubble pores” of sizes of the order of tens of microns that are left unfilled at the top of the conventional adsorption isotherm. However, the change in the Gurvitsch volume at the top of the OC isotherm before and after mercury entrapment in the bubble pores shows that the OC experiment does fill these pores successfully.
Mercury porosimetry is often used to probe the macropore sizes not accessible to conventional gas adsorption, and the PSD from it and conventional adsorption are then stitched together [5]. This procedure can have issues since it is necessary to have consistent PSDs in the overlap region, which means that the contact angle chosen for mercury must be compatible with the adsorption kernel or meniscus type chosen for the adsorption (see below Section 3.2). However, the OC method can obtain PSDs over the whole range seamlessly. In particular, OC can probe types of porosity not even accessible to conventional adsorption or mercury porosimetry. Some materials, such as some catalyst pellets [31,32], possess macropores so large that it is not possible to achieve condensation therein using conventional adsorption, so they are missed by a conventional gas adsorption PSD, but, they are also shielded (shadowed) by small pore necks of sizes below the lower cut-off probed by mercury porosimetry (typically 3–4 nm), and so, their void volume is also missing in mercury intrusion PSDs. These types of pores are thus only detected by helium pycnometry or by OC [5,31]. Since the OC method covers the same pore size range as mercury porosimetry, OC can also be used to show that mercury porosimetry has not crushed the sample due to the high pressures used [33].
OC experiments have also been used to demonstrate that the hysteresis loops of Type B, according to the de Boer classification, or Type H3, according to IUPAC classification, often found for shales and similar rock types, are not due to the slit-shaped pores associated with clay-like minerals, as is often claimed, but are mostly just de facto descending scanning curves (see below Section 4.2) due to the macroporosity left unfilled at the top of the conventional adsorption isotherm [33].

3. Pore Structural Descriptor Determination

3.1. Specific Surface Area

The Brunauer–Emmett–Teller (BET) [34] model is still used to determine surface area, even though it was invented in the 1930s. In particular, it is often used as a descriptor with which to compare different porous media. In recent years, it has been applied extensively to new microporous materials such as activated carbons and metal–organic frameworks (MOFs). However, as is obvious from the assumptions of the standard theory, and has been stated previously [10], it is not really appropriate for use with microporous materials at all. This is because the derivation of the standard BET equation assumes an adsorption mechanism of multi-layer build-up and the potential for an infinite number of adsorbed layers. Given that adsorption in many microporous materials occurs via a pore-filling mechanism [5,8,10], these assumptions of the standard BET isotherm model do not strictly apply. Nonetheless, it is still used by some workers for inappropriate materials. Attempts have been made to establish criteria to achieve at least self-consistent, if not physically meaningful, results when applying the standard BET analysis procedure to raw adsorption isotherms [35]. These criteria ensure that the BET constant, which characterizes the affinity of the surface for the adsorbate, is at least positive, and that the relative pressure corresponding to the apparent statistical monolayer capacity from the model is actually within the range of the fitted data. However, recent work has shown that not even these criteria can constrain the results of fitting a given isotherm to a unique value of the BET surface area, given the still remaining leeway in the fit, especially from the chosen fitting range [36]. Therefore, Osterrieth et al. [36] proposed an alternate fitting procedure to provide a repeatable surface area determination for the same isotherm dataset. The additional criterion was that the relative pressure corresponding to the monolayer loading obtained from the standard BET equation must be equal, or as close as possible, to the relative pressure determined from the isotherm data for the monolayer capacity. However, the ability to achieve a repeatable value for the standard BET surface area for a given isotherm dataset does not improve the lack of physical meaningfulness of the descriptor itself for microporous materials.
Zou et al. [37] tested the BET method for microporous and mesoporous carbons using Grand Canonical Monte Carlo (GCMC) simulations of nitrogen adsorption in slit-shaped pores. They performed a BET analysis, including the aforementioned self-consistency criteria [35], on simulated isotherms for pores of sizes from 1 to 20 nm. Zou et al. [37] found that, for micropores, two different relative pressure ranges fulfilled the BET self-consistency criteria, and each gave rise to different surface areas. This finding supports the aforementioned assertion by Osterrieth et al. [36] that the BET self-consistency criteria are not definitive alone in producing a unique surface area from a given adsorption isotherm dataset. Since Zou et al. [37] were using simulated isotherms for model pores, they could compare the BET surface areas with the geometric surface area of the model. They found that, for micropores, the lower relative pressure range of the two possibilities gave rise to the more accurate and lower surface area by the BET analysis. The snapshots from the GCMC simulations showed that the over-estimation of the surface area was due to the system having actually moved beyond complete monolayer coverage and well into multi-layer adsorption at the adsorbate loading corresponding to apparent statistical monolayer coverage from the BET analysis. The discrepancy between areas rose dramatically from only a few percent for mesopores, to 20–120% for micropores of sizes 2-1 nm, respectively. Zou et al. [37] also compared BET and geometric surface areas for composite models consisting of collections of slit-shaped pores that generated combined isotherms that matched experimental isotherms for real carbons. They found that composite models that had micropores had a larger error in BET surface area, as might have been expected from the findings for individual pores.
For porous materials with a mixture of micropores and mesopores, alternative, more physically meaningful data analyses than standard BET analysis are then possible to obtain the surface area. It is often apparent that micropores are present because there is substantial gas adsorbed before the start of the standard BET region at a relative pressure of ~0.05. Given the ready availability nowadays of simple function-fitting software, fitting more complex alternatives to the standard BET model is easily possible. For example, the homotattic patch model [38] can be implemented with at least two components, one of which represents adsorption in the microporosity and another that represents adsorption in the mesoporosity [39]. This would enable separate estimates of the micropore volume and mesopore surface area to be determined. This sort of approach is greatly facilitated because, often, micropore filling processes are over before much multi-layer adsorption on the mesopores has begun, so segregation of the adsorption is relatively straightforward. The mesopore component could also be the fractal version of the BET model that accounts for the surface curvature effects that give rise to deviations from the standard BET model above the so-called “BET region”, in the range where relative pressures > 0.3. This means that there is less of a problem in identifying the correct fitting range of the (standard) BET model. Since the BET model only accounts for multi-layer adsorption, the fitting should halt before the onset of capillary condensation. However, the fractal Frankel–Halsey–Hill (FHH) [14,40] isotherm model can also be applied into the capillary condensation region. The ultimate validity of such composite model analyses for mixed micro- and mesoporous materials has been shown by the analysis of the isotherms for mechanical mixtures of particular microporous and mesoporous materials, in known proportions, where the individual isotherms for the constituent materials are also known [41].
Jagiello et al. [42] have also adopted an approach similarly based upon segregating adsorption contributions between two pore components. These authors considered silica-templated carbon materials where mesopores were left over by etching out of silica templates, and micropores arose from the activation of the carbon walls. With this prior knowledge in mind, they modeled the nitrogen isotherms using 2D non-local density functional theory (NLDFT) for slit-shaped and cylindrical pores. The curved surface of the model pores was used to remove the known artefacts arising with NLDFT for smooth pores (see later). Distributions of the former, with sizes ranging from 0.4 to 50 nm, were fitted to the adsorption data for relative pressures less than 0.2, while distributions of the latter, with sizes ranging from 2 to 50 nm, were fitted to the data for relative pressures greater than 0.2. This composite model fit was found to remove an artefactual peak occurring around 3.5 nm with just a slit-shaped pore model. Once the PSD had been found, the cumulative surface area from the distribution could be found and compared with that from the standard BET method. It was found that the BET surface area was typically less than the cumulative surface area. Jagiello et al. [42] compared the surface areas of the carbon materials oxidized to different degrees. While the modal mesopore size and micro- and meso-pore volumes changed relatively little with the degree of oxidation, the surface areas obtained by both methods increased with oxidation. This may be because the oxidation process roughened the surface. However, this was not checked using, for example, analysis using the fractal version of the BET equation or SAXS. Alternatively, the introduction of polar oxygenated groups onto the carbon surface may have led to a more specific adsorption of quadrupolar nitrogen. Again, this could have been checked by a comparison of the fractal dimension from gas adsorption and SAXS, as has been conducted previously [14].
Choma et al. [43] developed an alternative way to segregate adsorption in the micropores and mesopores of polymer-templated, bidisperse, porous carbons. They determined the mesopore surface area using the αs-method, pioneered by Sing [8], and the reference isotherm for a nonporous carbon, Cabot BP280. They then used this value to extract the partial adsorption isotherm in micropores up to a relative pressure of 0.4. Subsequently, Choma et al. [43] calculated the micropore size distribution from the micropore partial isotherm using 2D-NLDFT for slit-shaped pores and the mesopore size distribution from the residual mesopore isotherm using the Kruk–Jaroniec–Sayari (KJS) [44] method using a statistical film thickness equation for nitrogen obtained from the reference isotherm for Cabot BP280. The PSDs, thence determined, could then be used to obtain the micropore surface area.
Buttersack [45] compared the ability of several types of isotherm equations, including the BET equation and some of its variants, to fit Type II isotherms for the adsorption of a variety of adsorbates (argon, nitrogen, water, n-pentane, and neopentane) on macroporous silica. He found that, based upon a particular statistical analysis, the general cluster sorption isotherm (GCSI) gave rise to the best fits. The GCSI is based upon a conception of adsorption as occurring via the formation of initially isolated clusters that then merge, as opposed to the layer-by-layer adsorption conceived of in the BET model [46]. Buttersack [46] has shown how a surface area can be derived from fits to the GCSI and compared the values obtained with those from the BET model. He found that the GCSI method tended to provide surface areas lower than the BET method, more in line with the suggestions from the GCMC studies mentioned above that imply the BET method may overestimate the statistical monolayer coverage for some adsorbates on some adsorbents. Mechanisms of adsorption involving isolated adsorbate clusters on chemically heterogeneous surfaces have been considered previously, such as by adapting a fractal geometry-based modification of the multi-layer build-up in the standard BET model [47] to account for the similar variation in the adsorbate build-up pattern that would be associated with pyramidal-shaped surface cluster formation [14]. Analysis of isotherm data for nitrogen adsorption on partially-dehydroxylated, amorphous, mesoporous silicas surfaces suggested that, in contrast to the foregoing studies, the standard BET model, rather, underestimated the actual surface area in this case due to specific adsorption of quadrupolar nitrogen in clusters located on local patches of residual polar hydroxyl groups leading to incomplete solid surface coverage at the BET statistical monolayer [14].
He et al. [48] compared the specific surface areas obtained from simulated isotherms on model silicas using either the BET or the zeta adsorption model with either argon or nitrogen as the probe adsorbate. They found that the BET model tended to overestimate the model’s geometric surface area using nitrogen, and underestimate it with argon. However, the zeta adsorption model tended to give rise to similar surface areas for argon and nitrogen, which were both close to the geometric surface area of the model. He et al. [48] attributed the superior performance of the zeta model to its better ability to account for more features of the adsorption process and the sensitivity of the BET surface area to the data fitting range, as mentioned above. However, it is noted that the zeta model has two more material parameters than the standard BET model, and, thus, a better fit over a wider range of relative pressures might be expected, as also arises for the fractal BET model when a third model parameter is added to the standard BET model [5]. A homotattic patch model with two or more BET components, say, would have at least as many parameters as the zeta model, and, thence, has also been found more predictive of an isotherm beyond the standard BET region (relative pressures in the range ~0.05 to ~0.35) [39]. This highlights that isotherm models should be compared on a like-for-like basis, with any difference in the number of adjustable parameters taken into account when assessing the relative quality of fit and the surface area obtained (see below).
Alinaghipour and Falarnaki [49] proposed a modification of the BET theory to take account of either concave or convex surface curvature. They found that their modified theory gave rise to surface areas, typically, lower than the area from the standard BET model. They attempted to validate the new model by predicting the skeletal density of nonporous particles and comparing it with the theoretical value. The level of agreement obtained was mixed, depending upon the particular type of material.
Given the recent critique of the BET surface area, it is often easy to forget past tests of the BET model found in sources such as the classic textbook by Gregg and Sing [8]. For example, they described findings that the heat of adsorption tended to drop substantially, and there is often a local minimum in the entropy of adsorption (associated with the configuration of molecules on the surface) in the region of the BET monolayer capacity, as would be expected from the BET model. The nitrogen BET surface area itself has been compared with values determined from the particle sizes obtained from electron microscopy and scattering methods for finely divided (sizes ~tens of nm) nonporous materials and glass microspheres, and was found to give rise to good agreement, often within a few percent [8]. These findings, perhaps, explain the continued use of the BET model, which sometimes surprises some more recent authors.
Further, for materials with multiple independent indicators of likely cylindrical pore geometry, such as Type H1 hysteresis loops for gas sorption, together with a ratio of the depressions of the melting and freezing points of two in (say, water) cryoporometry/thermoporometry data and (relatively) smooth surfaces from Porod-type analysis of scattering data, it seems reasonable to compare the surface area obtained from a PSD method, such as the BJH algorithm utilizing the Kelvin–Cohan equations (for pore sizes > 10 nm), with that from the BET method, as a test of the consistency amongst methods and, thus, the likely accuracy of each [5]. In such cases, good agreement is often found [5].
However, a key assumption of the BET theory is the energetic homogeneity of the surface. Recent work has shown that the chemical heterogeneity of the surfaces of some materials, such as ancient glasses, has a large impact on the value of surface area obtained from BET analysis [50]. The specific surface areas obtained from data analysis using the homotattic patch model with two different isotherm components were up to twice that obtained using the ISO standard BET method [51]. The average heat of adsorption, derived from a homotattic patch model with Langmuir and Henry’s law components, for nitrogen on the surface of the ancient glass was found to be inversely proportional to the iron content of the glass. It was suggested that the surfaces of the glasses had patches with high heat of adsorption for nitrogen and patches with relatively low heat of adsorption [50]. Any iron located at the surface occupied some of the high heat of adsorption sites and, thereby, lowered the heat of adsorption for nitrogen there, giving rise to the observed correlation.

3.2. Pore Size Distributions (PSDs) and the Application Thereto of Density Functional Theory (DFT) and Grand Canonical Monte Carlo (GCMC) Simulations

The pore size distribution (PSD) is typically a probability density function for a characteristic pore size weighted by volume or number of pores. In this context, the characteristic size of a pore is that which appears to control adsorption and desorption processes. A few studies also consider pore length distributions or some measure of pore anisotropy [52,53].
Methods, such as DFT, offer the potential to analyze a whole isotherm from uptake in very fine micropores to large macropores, all with the same theoretical framework, something that is not possible with “classical” approaches such as the Kelvin–Cohan equations [4].
NLDFT must be calibrated by adjusting the solid–fluid interaction parameters in the model until the predicted adsorption isotherm agrees with the experimental data for a non-porous reference sample, such as fumed silica for silica kernels [54]. Once calibrated for silica surfaces, the NLDFT kernels for regular through cylindrical pores have been tested by a comparison of their predictions against experimental isotherms for model, ordered, and templated porous solids such as MCM-41 and SBA-15, where the cylindrical pore size can be (nominally) determined independently using electron microscopy, bearing in mind the difference in the relative statistical sampling possible between electron microscopy and gas sorption methods. These studies suggested that, in isolated through, cylindrical pores, condensation occurred at the adsorption spinodal, and evaporation occurred at the equilibrium transition [54]. The calculation of the PSD using DFT still assumed the parallel pore bundle model (PPBM), also known as the isolated pore model (IPM).
However, the mechanisms of desorption, in particular, are more complex in porous materials consisting of spherical pore bodies interconnected by narrower pore necks. In such materials, three different mechanisms may control evaporation [54]. For pore bodies near the surface of the sample, desorption may happen at the equilibrium transition. However, for pore bodies deeper within the network, evaporation can be controlled by pore-blocking from the adjoining necks, or, if those necks are smaller than a critical value of ~4–5 nm, then evaporation can occur at the spinodal in the process called cavitation. The application of NLDFT to a complex situation where all these three mechanisms may be in action is thus not straightforward, as conventional commercial software only allows the choice of one mechanism for adsorption and desorption. However, as will be seen below, more recent network modeling approaches incorporating DFT can accommodate multiple mechanisms.
The first sets of kernels for NLDFT were constructed using pore models with smooth, homogeneous surfaces [22]. Since real materials, including the aforementioned templated materials, are not like this, this meant NLDFT tended to give rise to artefacts in the PSD. This was because the smooth surface of the model used to obtain the kernel meant the adsorption in the multi-layer region occurred in successive, more or less complete, monolayers, leading to a step-shaped isotherm. These small steps were akin to capillary condensation transitions and, thus, made it look like there were small pores of the size of ~0.4 nm, even though they did not really exist in the actual porous material under test.
In order to remove the artefacts from NLDFT PSDs, several options have been proposed. These include varying the pore wall thickness for slit-shaped pores, such that there is a distribution of wall thickness [55]. However, it is difficult to fix the parameters of this distribution independently of the sorption data. An alternative strategy was developed in the light of evidence that templated silicas, like SBA-15, had a pore wall density that increased with distance from the boundary of the pore void until it achieved the skeletal solid density [54]. This was because the mesopores were surrounded by a so-called “corona” of micropores within the pore wall. In the quenched solid density functional theory (QSDFT), the pore wall had two zones, which were a zone bounding the pore void where the density increased as a ramp until it met the second zone, where the solid density was constant. The slope of this ramp presented another fitting parameter in the model. For the regular model porous solids, such as SBA-15, the value of the additional fitting parameter can be determined independently from XRD [54]. This means that a good fit can be obtained between the shape of the multi-layer adsorption region for the experimental data and the QSDFT prediction. However, for more amorphous materials, it is typically not possible to determine the additional parameter independently of the gas sorption data.
For the heterogeneous surfaces of thermochemically treated activated carbons, the PSD determined from QSDFT has been compared with that derived from kernels obtained from Grand Canonical Monte Carlo simulations on carbon pores created with a reactive molecular dynamics (RMD) model [56]. The RMD creates structural defects (edges, corrugations, and amorphous regions) in graphite sheets via the removal of atoms occurring through the application of a reactive force field that simulates an oxidative etching process occurring during activation. Differences between the PSDs derived using QSDFT and RMD were observed at low relative pressures corresponding to the filling of ultramicropores [56]. This was attributed to the more comprehensive description of molecular-scale structural defects included in the RMD-produced model.
The NLDFT method only provides an accurate evaluation of the PSD if the nanopore system under investigation is realistically consistent with the chosen kernel [16]. If a porous material consists of regular, isolated through, cylindrical pores, it might be expected that the independent pore model will be appropriate. In such a case, the PSDs from the adsorption isotherm using the spinodal kernel and the desorption isotherm using the equilibrium kernel should overlay each other completely [16]. This has been seen for SBA-15 materials, where the walls are microporous or have smaller mesopores that fill with adsorbate before capillary condensation in the main pores. Remy et al. [16] have observed SBA-15-type materials where the apparent desorption modal pore size is larger than the adsorption modal pore size. They suggested it was associated with delayed condensation [21]. The test whereby the NLDFT PSDs from the adsorption and desorption branches of the hysteresis loop are overlaid to see if they match position and shape is only applicable when the underlying sorption mechanisms match those in the DFT simulation. For adsorption, as mentioned above, it is assumed that this arises at the spinodal, while desorption occurs at equilibrium, for the relevant pore geometry. This means the test only has relatively limited applicability.
The restriction of DFT kernels to regular geometries, such as cylinders and slits, limits their applicability for disordered porous solids. A long-standing question in indirect pore characterization methods has been what the dimensions in the PSD actually correspond to in the real material. Gubbins and co-workers [57] attempted to answer this question for the classical Barrett–Joyner–Halenda (BJH) [58] method using the Kelvin equation for cylindrical pores. For gas sorption isotherms simulated using the GCMC method for pore structures resembling controlled pore glasses (CPG), Gelb and Gubbins [57] found that the PSDs from gas sorption were in good agreement with a geometric PSD, but the BJH [58] PSDs were slightly sharper and systematically shifted, by about 1 nm, to lower pore sizes.
More recently, Corrente et al. [59] have tested the application of the BET, NLDFT, and QSDFT methods to nitrogen adsorption isotherms simulated using GCMC on structural models of microporous only and micro-/mesoporous, amorphous carbons created using the annealed molecular dynamics (AMD) method of DeTomas et al. [60]. Corrente et al. [59] used the same algorithm as that used by Gelb and Gubbins [57] to obtain the geometric surface area and PSD for the model structures. They found that the BET surface areas derived from the simulated isotherms were systematically higher than the geometric areas based upon the Connolly surface. The PSDs obtained from NLDFT and QSDFT were found to be in reasonable agreement with the geometric PSD, despite the former using simple slit-shaped pore models, while the AMD-derived model carbons had curved graphite sheets with defects.
For microporous carbons, GCMC can be used to develop a series of kernels for the construction of the PSD [61]. Vallejos-Burgos et al. [61] employed molecular dynamics using various combinations of annealing (graphitization) temperatures and densities to obtain a range of model carbon structures with differing porosities and levels of short-range order. The porosity of the models was largely determined by the chosen density. However, the models did not include the chemical heterogeneity that can be present in carbons in the form of various functional groups and adatoms. GCMC simulations of nitrogen adsorption were used to produce the kernels from these models. However, in order to account for any adsorption in mesopores, kernels were constructed using the Kelvin equation. Experimental isotherms were then fitted to a linear combination of all these simulated isotherms for 78 model carbons in total. The surface area and PSD for the real material could then be obtained from these parameters for the combination of models suggested by the isotherm fitting. While it was found that the model surface area agreed well with the BET surface area for activated carbon fiber and porous graphene samples, the BET surface area was ~15% higher for carbide-derived carbon and industrial activated carbon samples [61]. This discrepancy was attributed to the deviation of the real materials from the underlying assumptions in the BET model, such as flat surfaces. However, it was not shown whether alternatives to the standard BET theory that relax some of the classical assumptions, such as the fractal BET model [47], could obtain better agreement with the new model. Further validation of the model was attempted by simulating TEM images and carbon dioxide isotherms and comparing predictions with experimental data [61]. The comparison of the model TEM images with the experiment was largely qualitative, and a more comprehensive use of quantitative image analysis and statistics would make this validation more rigorous and discriminative. While the comparison of the simulated carbon dioxide isotherms with the experiment was only presented on linear scales, such that agreement at lower relative pressures below ~0.2 looked reasonable, there were significant deviations observed above this region. Vallejos-Burgos et al. [61] attributed this discrepancy to the lack of chemical heterogeneity in the model and the more specific adsorption of the highly quadrupolar carbon dioxide in real materials. The authors also compared the PSDs obtained from the experimental isotherms using 2D-NLDFT, QSDFT, NLDFT, and the new approach. It was found that the new approach lacked the (known) artefacts common in NLDFT PSDs, and also differed from the QSDFT. This was attributed to the new approach being able to include the effects of variable surface curvature and roughness. However, Vallejos-Burgos et al. [61] made little consideration in this work of the uniqueness of the model structure that their approach provided, given that it was a composite of several different underlying model structures.
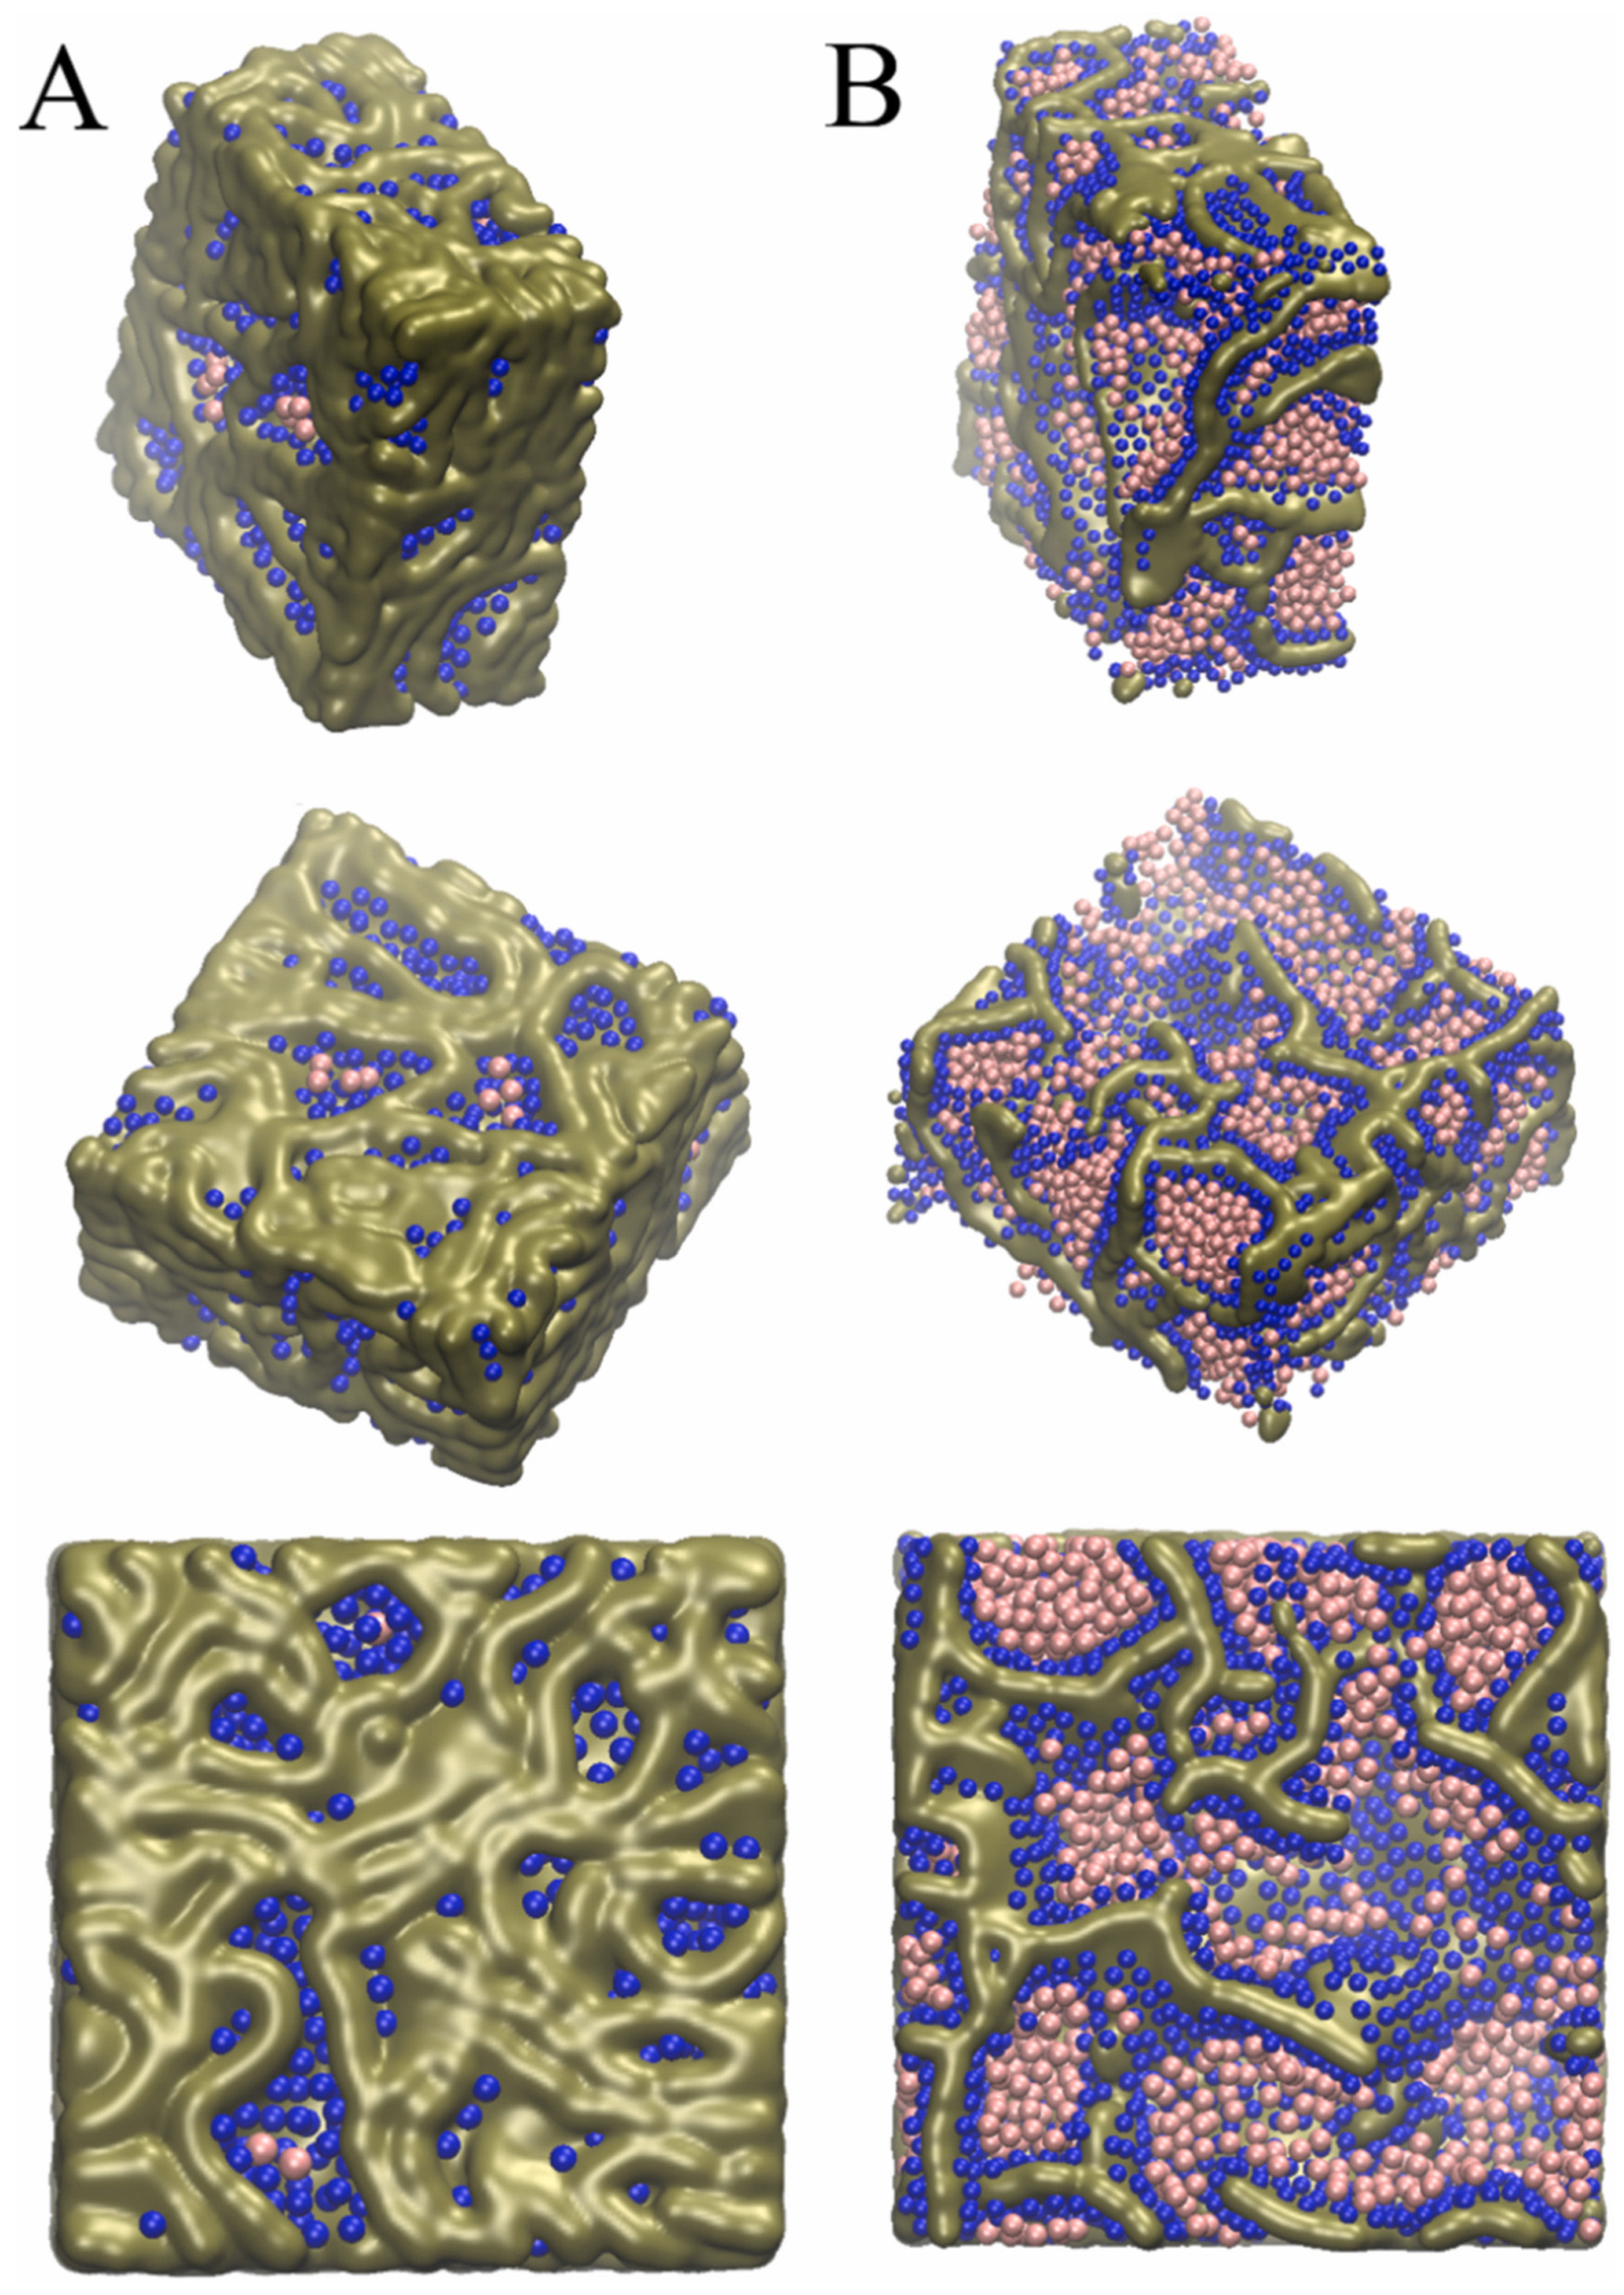
More recently, Kowalczyk et al. [62] performed a similar study using a database of 232 porous carbon models composed of graphene-like units with varying structures, sizes, and degrees of crystallinity. These carbon pore domain models represented void spaces with gyroidal, slit-shaped, zeolite-templated, hierarchical, and disordered graphene-like morphologies. As with previous work [61], isotherms simulated for these structures using GCMC formed the kernels for the fitting of experimental adsorption isotherms. The approach was validated by comparing the geometric PSD for test model carbon structures and that obtained from fitting these kernels to simulated isotherms. The surface area for the kernel models was obtained using graphene-domain theory (GDT) by a Monte Carlo integration method using a hard-sphere probe. For dinitrogen, a hard-sphere diameter consistent with the Lennard–Jones collision diameter used in the GCMC simulations of the nitrogen adsorption isotherms at 77.4 K was used for the surface area determination. The surface areas obtained using the standard BET method, the BET method but with a Rouquerol [35] self-consistency check, and the GDT analysis of the simulated isotherms were compared with the geometric surface area (GSA) for the test carbon models. The standard BET method tended to under-estimate the GSA below ~2000 m2g−1, and over-estimate it above ~2000 m2g−1. The BET–Rouquerol method matched the model GSA up to ~1700 m2g−1 but also overestimated it above ~2000 m2g−1. The GDT method matched the GSA for values up to ~2600 m2g−1. However, for comparisons of the geometric PSD with that obtained from GSD, the latter tended to overestimate the contribution of narrow micropores. In the analysis of experimental isotherms obtained from real carbon samples, the surface areas obtained from the BET–Rouquerol and GDT methods agreed up to ~2500 m2g−1, and thereafter, the BET–Rouquerol method gave rise to higher values than the GDT method. From snapshots of the GCMC simulations on the model carbons, shown in Figure 3, Kowalczyk et al. [62] attributed the discrepancies in surface area between the BET and GDT theories to the former not distinguishing monolayer adsorption from other pore-filling processes. Again, this study did not consider alternate versions of the BET model to the standard, such as those that have limited numbers of adsorbed layers [63].
Hiraide et al. [64] constructed adsorption kernels for nitrogen and argon for determining PSDs for amorphous carbons with rough surfaces using GCMC. The slit-shaped pore model accounted for the energetic contribution to surface heterogeneity created by roughness, but not the geometric effects. Hence, the model did not take account of surface geometric effects on molecular packing, especially for non-spherical molecules like nitrogen. The new kernels still produced the potentially artefactual valley in the PSD around 1 nm. However, their simulations enabled Hiraide et al. [64] to offer an alternative explanation for this feature to that which has been presented previously in the literature. Hiraide et al. [64] proposed that the effect arises from pore-filling behavior, rather than the sudden onset of monolayer formation on smooth surfaces, as had been proposed previously.
More recently, attempts have been made to construct QSDFT kernels for the highly disordered pores of kerogen [65]. Kerogen is a major component of hydrocarbon-bearing shale rocks that also typically contain a clay matrix, quartz, and other mineral grains. Given the complexity of shale rocks, the study by Parashar et al. [65] considered adsorption in just kerogen. Kerogen itself can contain all of micro-, meso-, and macro-pores, and thus needs a PSD determination method that can cope with this wide size range. The QSDFT kernels for kerogen were constructed using GCMC simulations of nitrogen adsorption on the structural models of kerogen. Structural models of bulk kerogen matrix were constructed by randomly placing molecular models of kerogen units within a simulation box and then using energy minimization and molecular dynamics to obtain the equilibrated conformations at 300 K (the temperature typical of shale gas reservoirs). The resultant kerogen matrix model possessed microporosity. GCMC simulations were performed on the kerogen matrix to obtain reference isotherms for adsorption in the microporous matrix.
To model mesoporosity running through this microporous matrix, the bulk kerogen model was split, but without breaking any kerogen molecular units, to form a gap 10 nm across [65]. This resulted in a model mesopore with a microporous “corona”. This model pore was used to obtain GCMC-simulated nitrogen adsorption isotherms that were used to parameterize kernels both from QSDFT and the Derjaguin–Broekhoff–de Boer (DBdB) theory. In order to conduct this, the GCMC-simulated isotherms were split into two components, one being due to the adsorption in the microporous walls and one due to that on the rough surface. The parameters for QSDFT, which included the half-width of the density ramp for the diffuse solid layer (corona region), were obtained from the simulated component for the kerogen wall. The surface adsorption component was used to obtain the disjoining pressure term for the DBdB theory. The pore-filling pressures for the aforementioned parameterized QSDFT and DBdB theory were compared with those for the classical Cohan–Kelvin equation, with the Harkins–Jura t-layer correction, for slit and cylindrical pores [5]. It was found that the Cohan–Kelvin equations predicted a slightly higher condensation pressure for the same-sized pore compared to the QSDFT and DBdB theory. However, the discrepancy reduced substantially with increasing pore size. Further, the standard Harkins–Jura isotherm coincided with the reference isotherm determined from the GCMC simulations on the kerogen models for the relative pressure range 0.05 < P/P0 < 0.5, but deviated for higher pressures, probably due to idiosyncratic differences in surface roughness and heterogeneity for the kerogen model.
While the GCMC simulated isotherm can be used to account for adsorption in the microporosity, QSDFT and DBdB theory are needed to obtain the kernels for mesopores. This is because the Parashar et al. [65] study highlighted the various issues that arise when trying to use GCMC (and also molecular dynamics) simulations for heterogeneous porous materials with disorder ranging over many length scales. For the GCMC simulations in 10 nm slit-shaped pores, complete pore filling due to capillary condensation occurred above bulk saturation because of an insurmountable energy barrier. The condensation, and also evaporation, steps were delayed because of the formation of metastable states, and the restricted fluctuations in the GCMC simulations are insufficient to cross the energy barrier between vapor-like and liquid-like states. The position of the equilibrium transition that is needed for pore structure characterization and lies between the two extremes of the GCMC-produced hysteresis cannot, thus, be determined by GCMC. Further, the more advanced MC methods, such as the gauge-cell approach, which might be able to overcome this issue, are not practicable in larger pores because of the very high computing power requirements. Hence, realistic kerogen structures, let alone the embedding shale, are beyond just molecular simulation methods.
Efforts have been made to try to reconcile the DFT PSD from gas sorption with those from other independent methods. For example, Prehal et al. [66] proposed a method to reconcile PSDs from SAXS with DFT for amorphous carbon structures. In their method, the SAXS data was fitted to a two-point correlation function, and that was then used to reconstruct the porous medium using Gaussian random fields. PSDs were then extracted from this model by two methods. The first was the normal distance method, whereby the perpendicular distances from a given point on the solid wall to the opposing wall were measured and used to construct a histogram of such distances. This distance would correspond directly to the slit width for a regular slit pore. The second approach used was the Degree of Confinement method, which attempted to measure the local pore geometry in the SAXS-derived model, as would be seen by an adsorbed molecule. The Degree of Confinement (DoC) parameter was given by:
D o C = i 1 / R i , C 4 i 1 / R i 4 ,
where Rads < Ri < Rcut-off, with Ri,C being the distance between the center of the adsorbed molecule and the carbon voxel i within the cut-off radius Rcut-off. The sum runs over all voxels larger than the radius of the adsorbed molecule Rads and smaller than the cut-off radius. In order to calculate the DoC parameter from the SAXS model, the latter is populated with adsorbate molecules at random, and the DoC parameter is calculated for each, and a histogram constructed therefrom. This histogram is converted into a PSD based upon pore slit sizes using a separate calibration plot. Slit-shaped pores with differing widths were generated, and the corresponding mean DoC parameter for adsorbate molecules within them was calculated for each. This was then used to construct a calibration plot of mean DoC against slit width. Using this plot, the DoC values from the SAXS model could be converted into slit widths. The comparison of the DFT PSD from gas adsorption with those from the normal distance and DoC algorithms applied to the SAXS model showed that the DoC method gave a better agreement than the normal distance method. However, the degree of success of this method depended upon the applicability of the particular correlation functional form fitted to the SAXS data, since multiple different structures could be consistent with it. The degree of agreement between the PSDs for different activated carbon materials varied, suggesting that some confounding variable between samples was involved. The largest discrepancy was attributed to (closed) void space probed by SAXS that was not probed by the adsorbate molecules. However, the method does hint at the particular aspect of the void space structure, namely the DoC, that is manifested in the slit sizes of the DFT PSD.
Artefacts can arise in DFT PSDs if the coverage of a particular pore size range with kernels is only sparse due to the fitting procedure used to derive PSDs from isotherms with DFT software. If there are not many kernels in a given pore size range, then the PSD will have artificial isolated spikes corresponding to the sparse coverage by kernels. This effect has been found when testing NLDFT for larger pore mesoporous silica [19].
Theories of single-pore hysteresis for through, regular cylindrical pores are characterized by a prediction of a particular width of hysteresis. The width of hysteresis may be described by the power in the exponent needed to superpose the adsorption branch on the desorption branch. For example, according to the classical Cohan [5] equations, the relative pressure for adsorption needs to be squared to obtain the equivalent pressure for desorption. For the Broeckhoff–de Boer (BdB) theory, the exponent is 1.5, and for NLDFT, the exponent is 1.8 [19]. Hence, a test of these theories is to measure the width of an H1 hysteresis loop. Many materials with Type-H1 loops have a hysteresis narrower than NLDFT would predict, i.e., the exponent is less than 1.8 [19]. This cannot be due to pore-blocking, as that would act to increase the width of hysteresis and, thus, increase the exponent above the single-pore figure. This test can be used to determine whether a particular PSD analysis method is appropriate for a given isotherm dataset.
In natural materials, such as shales, the pores vary in both shape and surface energy (of adsorption) due to high degrees of chemical heterogeneity arising from the presence of different types of mineral grains and, also, organic material. Xu and Prodanović [67] developed a random pore bond network with variable pore shapes and surface energies to model coal and shale materials. The descriptors of the network included the surface area, surface energy, PSD, and connectivity. To simulate nitrogen adsorption in heterogeneous systems, they used lattice-based DFT (LDFT). In order to include the organic pores present in shale and coal, they used a so-called “Type-2” network. Typically, a Type-2 network consisted of a pore bond network to represent intra-(grain)particle pores, with individual bonds replaced in some connections by an interconnected cluster of smaller bonds to represent organic pores. However, in order to simplify the calculations, Xu and Prodanović [67] replaced the cluster of small pores by a single-pore bond with a small dimension. In an initial study, Xu and Prodanović [67] used a single-pore shape across the entire network. In the simulations, the overall adsorption of the network was considered to be the composite of individual behaviors of independent pore bonds. However, the simulation of desorption included the pore-to-pore cooperative effects of pore-blocking and cavitation arising from shielding. The PSD and surface energy descriptors were fixed using the adsorption isotherm, and the network connectivity was fixed using the desorption data. It was found that the quality of fit of the model to the raw experimental isotherms was similar, irrespective of the assumed pore shape. However, the selection of a single-pore shape was validated by comparing the model surface area with that from a standard BET analysis of the experimental adsorption isotherm. For the coal sample, the slit-shaped pore model gave the closest surface area to the BET value, as might be expected, while both the slit and cylindrical pore shapes gave similar levels of agreement with BET for the shale sample. Xu and Prodanović [67] also constructed network models with distributions of different pore shapes. These authors obtained the relative fractions of slit-, cylindrical-, and spherical-shaped pores using independent SEM image data. They defined a shape factor G as the ratio of the area to the squared perimeter of 2D pore features within the images and, then, obtained the distribution of this parameter for a given material by combining the image analyses conducted on a sample of SEM images of differing resolutions. They then used these distributions of G to fix the fractions of the three different pore shapes. These pore shapes were then allocated at random to pore bonds across the model network up to the appropriate fractions. The multiple pore shape models were able to obtain much better fits of simulated sorption isotherms to the experimental data than the single shape models. However, the multiple-shaped pore network models gave rise to different pore coordination distributions than the single-shaped pore models. Xu and Prodanović [67] also compared the predictions of adsorption from LDFT with those from lattice-Boltzmann models (LBMs). They found that LDFT and LBM gave rise to similar predicted pore condensation pressures, but LBMs gave rise to smooth adsorption isotherms even for slit-shaped pores, while the LDFT method gave rise to step-shaped isotherms for slit-shaped pores.
Mean-field DFT (MFDFT) can be applied to disordered porous materials with complex void spaces, but the simulations can only be brought into agreement with experiment a posteriori. Since MFDFT is an approximate, lattice-based, coarse-grained model, only qualitative agreement is possible. MFDFT has been used to simulate nitrogen sorption on reconstructions of the void spaces of SBA-15, KIT-6, and an amorphous silica derived from electron tomography images with a resolution of ~0.5–1 nm and a field of view of a few hundred nanometers [68]. The hysteresis region of the simulated isotherms was brought into agreement with the experimental data by adjusting the lattice size unit of the simulation grid, the reduced temperature, and the ratio of fluid–wall to fluid–fluid interaction strength, and also, renormalization of the fluid density at the upper hysteresis closure point. In this way, good overlap could be obtained for both the adsorption and desorption branches of the hysteresis loop for the more ordered SBA-15 and KIT-6 silicas. However, there were then still marked discrepancies for the BET and multilayer regions (at pressures below the lower hysteresis closure point) of the simulated and experimental isotherms. This was attributed to the interaction potential in the MFDFT only being based upon nearest-neighbor interactions, thereby neglecting more complex interactions that are more important at lower amounts adsorbed. Further, even the hysteresis region of the simulated isotherms for the amorphous silica showed discrepancies with the experimental data. In particular, the simulated desorption branch was shifted to a lower relative pressure and possessed a more rugged, less smooth form, compared to the experimental data. This was attributed to finite size effects, since the image-derived lattice was only of volume ~106 nm3 compared to much larger samples in the experiments. The relevance of the finite size effects was demonstrated via an examination of the transitions in the fluid density distribution within the model before and after one of the small steps in the desorption isotherm. This finding highlights the issue of the lack of statistical representativeness of the imaging data with the current capabilities of the equipment, and also the continued utility of adsorption methods. In addition to the boundary curves in the hysteresis region, the MFDFT simulations were also used to predict the form of both the ascending and descending scanning curves. The crossing or converging nature of these curves was accurately predicted by MFDFT. This suggested that MFDFT correctly captured the qualitative nature of the meta-stable states of the adsorbate within the various void spaces tested.
Adsorption/desorption dynamics can be incorporated using dynamic mean-field theory (DMFT) [69]. The observation of apparently anomalous findings from experimental studies of gas sorption in chemically etched porous silicon wafers encouraged DMFT studies of sorption dynamics in very long pores. The experimental studies suggested that hysteresis arose in a closed-end pore system, contrary to the predictions of classical Kelvin–Cohan equations. Further, cavitation was observed at a much higher pressure than is typical. Previous work by Naumov et al. [70] suggested that pore surface roughness may have caused the hysteresis in closed-end pores. Indeed, electron microscopy studies suggest that the chemically etched pores in silicon are not just regular cylinders but have surface corrugations, and even periodic stubby side-channels [69]. The MFDT studies of sorption in very long chains of successivethrough ink-bottle pores have suggested that, due to slow adsorption dynamics, some vapor pockets may still be left in such structures, even when the overall uptake curve might suggest complete pore filling [69]. These vapor pockets can then act as seeds for premature evaporation on commencement of the desorption and thus make the hysteresis appear narrower than would be the case if desorption was limited to initiation from just the exterior pores. These findings suggest another potential explanation for the narrow hysteresis (compared to the predictions of single-pore theories) that has been observed experimentally [19]. Presumably, if very long equilibration times are allowed, this residual vapor effect, resulting from slow adsorption dynamics, can be removed and, thence, detected by a consequent widening in the hysteresis.

4. Theoretical Topics, Modeling, and Related Data Analysis Methods

4.1. Testing Theories of Gas Sorption

Recent work reviewed in this section has shown that, even for templated, model materials, for systems with some disorder, the boundary sorption and scanning curves are insufficient to fully test theories of condensation and evaporation. Additional data is required to distinguish between potential alternative theories. These additional datasets include the use of integrated mercury porosimetry for controlled exclusion of particular regions of the void space via mercury entrapment or the accumulation of sets of isotherms obtained at different temperatures [71,72].
The assertion of the pore size from mercury porosimetry as an accurate independent measure for silicas, against which gas sorption predictions can be assessed, relies upon the use of variants of the standard Washburn equation, where the impact of increased meniscus curvature on surface tension and contact angle terms has been taken into account [5]. This was conducted using calibration of intrusion and extrusion pressures for model controlled pore glass (CPG) materials against electron microscopy data on pore sizes [73,74]. The reliability of such calibrated versions of the Washburn equation for other (silica) materials is determined by their ability to a priori superpose the intrusion and extrusion curves when mercury pressure is converted to pore size [75]. The pore size from calibrated mercury porosimetry can also be validated against mercury thermoporometry [76] and the position of entrapment assessed using CXT [77]. Integrated gas sorption and mercury porosimetry experiments, where isotherms and intrusion–extrusion curves are obtained in series on the same sample, can, therefore, be used to test theories of capillary condensation and evaporation in the same pores that entrap mercury [78]. The condensation and evaporation pressures of nitrogen within the particular pores that entrap mercury can be obtained from the difference between the isotherms from before and after porosimetry.
Bonnet and Wolf [72] considered thermally activated condensation and evaporation processes in cylindrical pores. Their model considered the grand potential of a cylindrical vapor bubble in a pore core lined with a multi-layer liquid film. The analysis of this scenario, which they proposed, allowed the prediction of the critical size for the pore neck of an ink-bottle pore for cavitation to occur for nitrogen and argon at 77 K. They suggested a critical neck size of 3.8 K for nitrogen and 2.8 nm for argon. These values are similar to what has been observed in experiments. Applying their theory to complex porous materials with coupled pores (i.e., disordered pore networks like that in Vycor), Bonnet and Wolf [72] predicted the occurrence of advanced condensation (see Section 4.3) and that most pores fill at (or close to) their equilibrium pressure such that the BJH analysis of the adsorption isotherm would give rise to a reasonably accurate PSD.
Morishige [79] considered the temperature variation of condensation and evaporation in a variety of templated silica materials with regular and corrugated cylindrical pores and compared these experimental measurements with the predictions of a semi-macroscopic theory including the effect of pore size on surface tension. From these studies, Morishige recommended that the routine selection of the desorption branch for the PSD determination of such materials was questionable because evaporation did not always coincide with the equilibrium transition. Morishige [79,80] suggested that, for regular isolated cylindrical pores larger than ~7 nm in diameter, condensation occurred via a nucleation process followed by a growth process, while evaporation occurred via a receding meniscus at equilibrium. For pores in the size range ~7–10 nm, condensation occurred at lower pressure than the adsorption spinodal, and the hysteresis was classified as “developing”. For pores of diameters smaller than ~7 nm, it was condensation that tended to occur close to the equilibrium transition.
In addition, Morishige [80] further tested the semi-macroscopic approach using adsorption data at varied temperatures for a range of templated silica materials. He found that the pore size from TEM for one sample of SBA-15 gave rise to correct predictions of experimental hysteresis branch pressures from activated condensation and equilibrium evaporation. The semi-macroscopic theory predicted that the activated condensation pressure would decrease relative to the adsorption spinodal pressure as the pore size decreased, and this was observed experimentally. However, it is noted that a narrower H1 hysteresis loop than with NLDFT has also been found for relatively wide cylindrical pores of diameter ~14 nm within an amorphous silica [19]. Morishige [80] also found that, for hydrothermally treated SBA-15, and also for KIT-6, the hysteresis loop was narrower than expected from the semi-macroscopic approach for smooth cylindrical pores. He attributed this discrepancy, with the semi-macroscopic approach, to the larger effective pore space in interconnected networks, like KIT-6, than arises in isolated cylinders. This effect of the size of the void space region is similar to what has been suggested previously by Gelb [81], who proposed that for different lengths of long pores, condensation occurs earlier in the very longest ones because, with a larger system volume, there is a higher probability of observing a nucleation event. This result has the same implications for condensation pressure within long pores as the findings from MFDFT simulations by Rigby and Chigada [82] that suggested that condensation occurs at lower pressures in very long pores due to an increasing cumulative pore potential experienced at the middle region of such pores. When the hysteresis loop was wider than expected for a single, isolated cylinder, Morishige [80] attributed this to the advanced condensation and pore-blocking effects that arise in corrugated cylindrical pores, which have been seen previously [19]. However, Morishige [80] proposed that the mean value of the pore size in such a system could be assessed using the semi-macroscopic approach to analyze the temperature dependence of the hysteresis width in the isotherm data.
Shimizu and Matubayasi [83] have developed a statistical thermodynamic fluctuation theory which can both model hysteresis and assess its underlying energetics, unlike, they claim, any other previous approach. The theory can link sorption phenomena like delayed condensation and pore-blocking to the interfacial free energy.

4.2. Scanning Curves and Loops

Scanning curves and loops are additional experiments, beyond the boundary curves, which offer the potential to provide more information on the origins and nature of the hysteresis and/or pore structure through the delivery of a richer dataset [5]. Scanning curves consist of the reversal of the direction of pressure changes when proceeding along one or other of the boundary curves before the destination closure point of the hysteresis loop is reached. The scanning curve can then either descend or ascend back to the previous hysteresis closure point passed. There are typically two main classes of behavior for scanning curves [84]. The scanning curve can cross immediately from one boundary curve to the other, or it can ascend or descend while remaining within the hysteresis loop and only rejoin the boundary curves at the previous hysteresis closure point passed. The former is typically associated with single-pore hysteresis effects in Type H1 hysteresis loops, while the latter is associated with pore-blocking effects in Type H2 hysteresis loops [84]. Some of the uses of scanning data have been reviewed previously elsewhere [5].
While scanning curves provide additional information on hysteresis and pore structure not present in the boundary curves alone, their interpretation can still be ambiguous. Integrated mercury porosimetry experiments, where these are conducted in series with gas sorption scanning experiments, can be used to extract the gas sorption scanning curve behavior for a particular small sub-set of pores, wherein the mercury becomes entrapped, situated within the wider void space of a disordered network, as shown in Figure 4 [77]. This sort of experiment has shown that it is possible to obtain crossing scanning curves not just for isolated, regular cylindrical pores but for throughink-bottle pores within disordered networks (see Figure 5).
Wang et al. [85] have proposed a protocol consisting of very refined hysteresis scanning with up to 38 desorption (descending) scanning curves. They constructed a model of interpretation consisting of arrays of ink bottle and “pyramidal” pores. These both consisted of wider pore bodies connected to narrower pore necks, but differed in which of the two was oriented towards the exterior vapor phase. For ink-bottle pores, the pore neck faced the exterior/bulk vapor phase, while for pyramidal pores, the pore body faced the vapor phase. Wang et al. [85] suggested that the difference in the differential of pore volume with pore size (pressure) between the desorption scanning curves could be used to detect the presence of ink-bottle versus pyramidal pores, and their connectivity within the porous structure. This was based upon the principle that the relative orientation of ink-bottle pores meant they were subject to pore-blocking effects, whereas pyramidal pores were not. However, the pore-filling mechanisms used in the analysis neglected pore-to-pore cooperative effects such as advanced condensation and network-related (as opposed to single-pore) delayed condensation effects (see Section 4.3). As has been shown previously in the literature [19,77], and described above (see Figure 1 and Figure 5), advanced condensation effects on adsorption coupled with pore-blocking on desorption can render through ink-bottle pores indistinguishable from regular through pores, since crossing, rather than descending, scanning curves are then obtained even for ink-bottle pores. Hence, the analysis of Wang et al. [85] will underestimate ink-bottle pores.
Taheri et al. [86] used differential hysteresis scanning to characterize the void space of non-templated, monomodal, amorphous aerogels. This characterization consisted of a classification of mesopores into one of three classes, namely (i) non-restricted pyramidal pores with a window size equivalent to, or larger than, the pore size; (ii) constricted pores with a window smaller than the pore size; and (iii) occluded pores with a window much smaller than the pore size. However, Taheri et al. [86] do not explain the physical reasoning behind how this classification is reached in each case based upon the form of the scanning curves, as the study seems to have used commercial software for the data analysis. Given that the interpretation of scanning curves is underdetermined by the boundary and scanning curves alone, the findings can only be considered an effective pore geometry. Hence, the void space of the real sample may not match the abstract model of the effective pore geometry.
Toncón-Leal et al. [87] studied the structural modifications to SBA-15 silica, following the deposition of iron–cobalt oxide within the material, using boundary and hysteresis scanning curves for argon obtained at 87, 77, and 65 K. Following deposition of the metal oxide, the hysteresis loop changed from Type H1 to Type H5. The upper part of the hysteresis loop retained a similar upper closure point and parallel boundary adsorption and desorption curves. However, the lower hysteresis closure point moved to a lower relative pressure, though it remained above that expected for the onset of cavitation, due to a deviation of the lower part of the boundary desorption isotherm away from the adsorption isotherm. The descending scanning curves typically consisted of two main regions. The upper part consisted of a crossing section, followed by a descending section that ran virtually parallel with the boundary desorption isotherm, and then, followed by a distinct kink, the lower part was another descending region but occurred at a more gentle slope than the upper descending part. The “two-step” form of the boundary and scanning desorption curves were consistent with the deposition of the oxide, leading to some pores being shielded by narrower necks created by the oxide deposit in the pore, while some original unfilled pores were retained. The PSDs obtained from the adsorption isotherms following oxide deposition were not shown, so it is difficult to determine the extent of pore-blocking independent of complementary advanced condensation.

4.3. Pore-to-Pore Co-Operative Effects

As mentioned above, the typical algorithm used to obtain PSDs assumes that the void space has thermodynamically independent pores (i.e., the IPM), such that condensation or evaporation processes in one pore do not influence those in another. The void space structure that meets these requirements has the form of a “wine-rack”-like ordered structure, wherein pores of different diameters are isolated and disconnected from others. Some templated porous materials, like MCM-41, do have this sort of pore structure. However, most industrial adsorbents and catalyst supports are more disordered and, critically, have highly interconnected void spaces. Where pores of different sizes are connected-up, then pore-to-pore co-operative effects may arise, such that phase transitions in one pore affect its neighbors and even more further afield. Cooperative effects during desorption, such as pore-blocking, have been well-known and discussed extensively for some time in the literature. Hence, this review will concentrate on cooperative effects during adsorption.
De Boer [88] was the first to discuss the potential for co-operative effects in interconnected pore systems. He described the so-called “advanced condensation” effect that can arise in a through ink-bottle system, consisting of two cylindrical necks located co-axially on either side of a larger cylindrical pore body (see Figure 1). According to the Kelvin–Cohan equations, in the IPM, condensation will occur, according to a cylindrical sleeve-type meniscus, first in the smaller neck and then in the pore body at a higher pressure. However, in the connected ink-bottle system, once condensation has occurred in the pore necks, they will present a hemispherical meniscus at the end of the pore body. Hence, pore-filling in the pore body can then occur via axial migration of the hemispherical meniscus from the ends to the middle. This would lower the relative pressure needed to achieve pore-filling. Indeed, if the radius of the pore body is less than twice that of the neck, then filling of the pore body can occur at the same pressure step as that of the necks, since, then, the pressure to fill the body via a hemispherical meniscus (if one is present) is lower than needed to fill the neck via cylindrical sleeve meniscus. The classical Kelvin–Cohan equations thus predict a critical ratio of pore body-to-neck sizes for the advanced condensation effect of two [5,7].
However, since the condensation and evaporation pressures in a given pore are, strictly, controlled by the pore potential therein, and the pore diameter is only one factor influencing this, then the critical ratio for advanced condensation may be influenced by other factors too. Indeed, MFDFT simulations have shown that the critical ratio for advanced condensation is impacted by the strength of the adsorbate–adsorbent interaction and the length of the neck, since these affect the pore potential therein [82]. Rigby and Chigada [82] also showed that the degree of pore-blocking (in terms of the decrease in evaporation pressure compared to condensation pressure) on desorption depended upon the adsorbate-adsorbent interaction strength in, and length of, the pore neck. These simulations suggested an explanation for the previous observation of an otherwise anomalously high desorption pressure from ink-bottle pores in a sol–gel silica material [78]. These earlier findings [82], that adsorbate–adsorbent interaction strength in necks affects when pore-to-pore co-operative effects (pore-blocking in this case) will operate in desorption, are similar in implication to the later studies by Puibasset [6] mentioned above, which suggested the same factor affects cavitation.
Pore-to-pore co-operative effects in appropriate templated structures are relatively predictable and their detection straightforward. However, assessing the extent of such effects in disordered porous media is more useful to assess their impact on the accuracy of the PSD and is harder to achieve.
In ink-bottle pores, the advanced condensation effect is limited to pore necks of sizes above a critical ratio to that of neighboring pore bodies, but the corresponding pore blocking effect arises for all ratios of pore body-to-neck sizes. This means the pore-blocking effect can arise without the advanced condensation effect. However, the pore-blocking effect is somewhat directional, in that it only operates in the general direction of the sample exterior along the percolation pathway, whereas the advanced condensation effect can occur in any direction (including towards the interior) [7].
Given that even the simple classical analysis by de Boer [88] has suggested that advanced condensation will significantly narrow PSDs from their true width, it is important to know when these effects are occurring and how significant they are. MFDFT simulations of condensation in disordered systems have suggested that the co-operative pore-filling may be more pervasive than just nearest-neighboring pores, such that a substantial so-called “cascade” of pore filling may arise over an extensive region [89]. Indeed, relaxation time-weighted magnetic resonance images of the spatial distribution of capillary condensation of water within a sol–gel silica pellet with macroscopic heterogeneities in the spatial distribution of local average pore sizes have shown the operation of advanced condensation [90]. NMR relaxation time measurements allow the sizes of adsorbate ganglia to be determined [18]. More details on NMR methods in porous media can be found elsewhere [5]. The relaxation time-weighted samples showed that the largest pores in the system were completely filled with condensate at lower pressures than expected when these pores were neighbored by smaller pores that filled at lower pressures [90]. The NMR relaxation time measurements of the pore sizes in neighboring filled image voxels suggested that the critical ratio may be as large as five, as compared to the aforementioned classical value of two. This difference may be due to the strength of the water–silica interactions. The multi-layer build-up of water in this sample was shown to be similar in form to that of nitrogen in the same material, suggesting that the findings are not just due to unusual adsorption behaviour of water. These findings from MRI suggest that the influence of advanced condensation on adsorption, and thus resultant PSDs, may be more impactful than commonly supposed.
An alternative approach to study the potential for pore-to-pore cooperative effects during adsorption in disordered porous solids is the aforementioned integrated gas sorption and mercury porosimetry method [71]. This technique allows the specific sorption processes occurring within a particular, small sub-set of the void space to be deconvolved from those occurring in the wider, much larger, surrounding pore network, as shown in Figure 2 and Figure 5. In addition, for materials with macroscopic heterogeneities in the local average pore size, such as some catalyst pellets, the presence of advanced condensation can be detected by shifts in the position of the adsorption isotherm following fragmentation of the pellet into particle sizes smaller than the regions of similar pore size, which interrupts the cascade of condensation crossing between them [31].
Attempts have been made to incorporate pore-to-pore cooperative effects into interconnected network models of porous media. Rojas and coworkers have made an extensive study of such effects in pore body-pore neck type networks [21].
Recent efforts have focused on Bethe lattices (also known as Cayley trees) because they allow analytical results to be derived for the filling and emptying of the lattice with condensate. Kikkinides and co-workers [91] and Söllner et al. [92] have both constructed a pore bond network model based upon a Bethe lattice, where they attempted to include some of the pore-to-pore co-operative effects active within interconnected networks. The key difference between the two studies was the choice of theory to represent condensation and evaporation. Kikkinides and co-workers [91] used the Kelvin–Cohan equations, while Söllner et al. [92] used DFT kernels. In the modeling of the adsorption branch, both sets of workers included the advanced condensation effect but neglected the network-based delayed condensation effect because the pore bonds only met at their ends and not partway along their lengths, so the pore bonds were all solid cylinders. Further, network nodes were assumed to have the same size as the largest bond attached. Hence, the potentially complex adsorption behavior that could arise at pore junctions was represented by relatively simple abstract rules. Söllner et al. [92] stated that further research is required to determine whether such simple rules can represent the behavior at network nodes in a realistic way. While Kikkinides and Valiullin [91] assumed that at least (Z-1) pores of a junction of Z pores had to be filled for advanced condensation to potentially occur in the remaining empty pore, these workers attempted to validate these rules using MFDFT simulations of adsorption in very small, regular (i.e., rectangular-lattice shaped), two-dimensional Bethe lattices with a connectivity (Z) of three. It was found that, in these limited geometries, the adsorption process arising from the abstract rules for the operation of nodes matched the findings from MFDFT. However, it is conceivable that, for more connected nodes in three dimensions, a variety of pore bond configurations around the node are possible, which might affect the likelihood of advanced condensation between particular bonds. Determining the potential for advanced condensation would be less ambiguous in pore network models with a substantial local spatial correlation in pore sizes, where the relevant domains then each comprise a local region of interconnected void space of a particular characteristic size that all fills at once (with a simple example being a square grid of uniform pore sizes), and region-to-region phase growth is controlling, rather than individual pore-to-pore [7]. This is because the boundaries between extended spatial domains would contain pore junction configurations of all potential types, any of which could seed the avalanche of advanced condensation.
Kikkinides and Valiullin [91] identified two broad classes of pore-filling and emptying. The first class, denoted (homogeneous) “nucleation”, involved the generation of a new meniscus boundary between liquid and vapor. In pore filling, it was associated with liquid bridge formation, while in emptying, it was associated with cavitation (vapor bubble formation). The second general class of process was denoted “phase growth” and included advanced condensation during adsorption and pore-blocking (vapor percolation) effects during desorption.
Söllner et al. [92] used experimental data to implement cavitation effects into their model. The model included finite-size effects by allowing the generation (number of ramifications) of the finite Bethe lattice to vary. This also allowed for the effect that, while pore-blocking acts only in one direction relative to the network boundary, advanced condensation can act in any direction. However, the model did not allow for variation in the relation between pore diameter and pore length, as it was assumed that the pore number fraction equaled the pore volume fraction. This was equivalent to assuming that pore length was proportional to the inverse square of the pore diameter.
The pore network of Söllner et al. [92] was used to model the boundary isotherms and scanning curves for a range of materials with a range of shapes of hysteresis loops, including Types H1, H2, and H5. Use of the model to fit the data for boundary and descending scanning curves for nitrogen adsorption on KIT-6 confirmed previous findings by Hitchcock et al. [19] that behavior akin to advanced condensation in through ink-bottle-like pores was the reason for narrow H1 hysteresis loops (with parallel boundary adsorption and desorption branches) for interconnected pore networks with pore bodies slightly larger than pore necks. Söllner et al. [92] found that the model fit for KIT-6 was highly sensitive to the choice of pore connectivity but much less sensitive to the choice of lattice size (Bethe lattice generation number). In contrast, for particles of SBA-15 partially covered in a layer of MCM-41, such that they gave rise to a Type H5 hysteresis loop, the fitting of the model to the SBA-15 portion was insensitive to the connectivity value, and this was attributed to the small generation number. As mentioned by Söllner et al. [92], Type V hysteresis loops typically arise where desorption from some parts of the network is controlled by pore-blocking and other parts is controlled by cavitation. Rather than the indirect probing of the components of the network via modeling of the probe gas sorption alone, recent work [39,93] has used pre-adsorption of iodononane in the shielding micropores to directly deconvolve subsequent probe gas desorption behavior for the pore-blocked and cavitating larger pore bodies. The use of iodononane to fill the micropores also meant that the spatial distribution of the micropores could be mapped using CXT.
In further work, Kikkinides and co-workers [94] also compared their Bethe lattice model with experimental results, but for Vycor porous glass. They first validated the extraction of the PSD and connectivity from the isotherm data by implementing their procedure on isotherms constructed for Bethe lattices with known PSD and connectivity to see if these original parameters could be confirmed. These workers generally assumed that the finite-size effects were negligible. Kikkinides et al. [94] compared the PSD and connectivity extracted for isotherms for Vycor obtained by different workers, and also for their modeland using the IPM together with percolation analysis of the desorption isotherm. They found that the size of the difference in connectivity obtained from the two theoretical approaches was similar to the difference in connectivity obtained from isotherms for different samples of Vycor studied by different sets of workers. The volume-average pore size from their model was ~8.4 nm, while the IPM gave ~7.7 nm, which is quite close, though the difference was significant. As might be expected if advanced condensation is occurring, the PSD from the IPM was shifted towards smaller pores compared with the model that took this cooperative effect into account. This work gives an estimate of the impact of the effect. Given that the modal pore size of the Vycor was less than 10 nm, this meant that the adsorbate density profile within the pore started to matter, and a more accurate representation thereof was necessary to accurately predict condensation pressure. Hence, Kikkinides et al. [94] compared the volume-average pore size obtained from their model, but with different solid–fluid interaction potentials for calculating the condensation pressure. They found that the difference in average pore size due to varying the interaction potential was slightly larger than the difference resulting from the use of the IPM, and the difference in connectivity was even higher. These findings suggest that, for modal pore sizes less than 10 nm, the description of single-pore adsorbate density is more important than advanced condensation effects, whereas for larger pores the pore-to-pore co-operative effects are more important [7]. Kikkinides et al. [94] also compared the PSD and connectivity from their model with the corresponding parameters extracted from an image analysis of a 3D reconstruction of the Vycor void space. They suggested that the 3D reconstruction matched the porosity, two-point correlation function, surface area, and mass and pore chord length distributions for TEM and scattering data for real Vycor. The PSD was obtained from the reconstruction using the maximal ball algorithm, and the connectivity was obtained by a skeletonization algorithm. It was found that the geometric PSD was shifted towards larger pore sizes compared with the gas sorption model PSD, while the pore connectivity from an image analysis of the reconstruction was 3.12–3.13, compared to a value of 3.25 obtained from the model analysis of the real gas sorption data. The discrepancies may have arisen because image analysis methods, such as those used by Kikkinides et al. [95], can introduce artefacts, as has been reviewed in detail elsewhere [3,33]. Further, it should be noted that a two-point correlation function is insufficient to properly capture the topological (connectivity) information, as a three-point correlation function is strictly needed to do that. Hence, if a two-point correlation function is found sufficient to reconstruct the topological structure, then the porous material in question must be relatively homogeneous and have some underlying order that lowers the information content needed in the correlation function for accurate topological reconstruction. Further, the correlation length of the Vycor structure was relatively very short, being less than 225 nm, whereas many industrial materials have correlation lengths many orders of magnitude higher, as shown by imaging methods [95]. Therefore, since Vycor represents just one relatively homogeneous, albeit disordered, porous material, it would be interesting to check the Bethe lattice-based model with similar tests but for more heterogeneous materials, and for such materials with a range of pore connectivities, to see if the observed variation in independent measures of connectivity between materials is matched by the Bethe lattice model.
Baroncha et al. [96] expanded the degree of disorder in the Bethe lattice model of Kikkinides et al. [94] by allowing for a variable distribution in the pore coordination number at each lattice node for a given overall pore connectivity. Given that, as the number of generations/layers increases for a Bethe lattice, the number of dangling bonds at the edge of the model increases, thence, Baroncha et al. [96] added interconnections between these dangling bonds to preserve the pore connectivity. Their attempt to account for finite size effects by the designation of a certain fraction of lattice bonds as surface bonds led to some discrepancies in the sorption behaviors of real materials. In desorption, in the model, the gas phase from the model boundary pores can invade two connected pores, which contrasts with what occurs for real boundary pores. Further, during adsorption in the model, liquid can invade the boundary pores from both ends, while this can only occur from one end in real materials. Baroncha et al. [96] extended their analytical framework to predict the form of the sorption isotherms of Kikkinides et al. [94] for Bethe lattices with a distribution of the pore coordination number. They then compared the shape of the hysteresis loop for boundary isotherms for lattice models with the same pore connectivity and spread in PSD, but different distributions of the pore coordination number. They found that variation in the width of the distribution of the pore coordination number alone made no significant difference to the shape of the hysteresis loop. Further, Baroncha et al. [96] found that variation in the width of the distribution of pore coordination number, but with the same pore connectivity and PSD width, also made no significant difference to the shape of scanning curves. From these findings, they proposed that gas sorption experiments may not be able to distinguish void spaces with different topologies but the same pore connectivity. They also suggested that the impact of pore-to-pore co-operative processes declines with the width of the PSD. This is because, in a completely random system, the greater the width of the PSD, then there is less chance that the ratio of neighboring pore sizes will be below the critical ratio for advanced condensation to occur. However, as discussed in previous work [7,90], the advanced condensation effect is accentuated by spatial correlation in pore sizes, such that, where there are macroscopic heterogeneities in local average pore size, then the phase growth, or cascades, of the condensed phase that arises can be seen in magnetic resonance images [90]. Hence, MRI can potentially provide the complementary experimental technique sensitive to the phase configurations that Baroncha et al. [96] suggested was needed to access the large-scale organization of pore networks.
The Bethe lattice used in the aforementioned models does not contain closed loops, and, thus, does not take into account the potential for phase growth to operate around both branches of a loop. Further, for medium-to-large finite Bethe lattices, beyond the sizes mainly studied by Söllner et al. [92], the fraction of surface pores does not decrease as the lattice size increases, as it would do for fully interconnected random pore bond networks. Hence, it is then necessary to add an abstract parameter that corresponds to the fraction of exterior pores in order to reproduce the finite size effects for Bethe lattices [91]. In addition, the Bethe lattice and the corrugated pore models, which are the limit when the connectivity of a Bethe lattice tends to two [97,98,99], do not contain dead-end pores that might act as sites for phase growth during adsorption without the need for a prior homogeneous nucleation process to first generate a (hemispherical in cylindrical pores) meniscus. Kikkinides and Valiullin [91] highlighted that the standard Seaton percolation analysis only assumes the isolated pore (aka parallel pore bundle) model in determining the PSD from the adsorption branch, while including phase growth (vapor invasion percolation) effects in the analysis of the desorption branch. However, this would not lead to any systematic error in the PSD if adsorption were predominantly initiated from dead-end pores and the homogeneous nucleation effects are small, and the PSD analysis, thence, assumed a hemispherical meniscus in the Kelvin–Cohan equations (or an equilibrium kernel in DFT). Kikkinides and Valiullin [91] also highlighted that the isolated pore model will give the correct PSD from adsorption if the pore network is of the pore body–pore neck type, where the critical pressure for advanced condensation in a given pore body exceeds the condensation pressure in any adjoining bond. However, in that case, the condensation will arise via nucleation in all network elements. This suggests that it is important to identify whether homogeneous nucleation or phase growth effects predominate, or there is a mixture, during adsorption within a particular porous medium to know the limits on an IPM PSD.

4.4. Independent Methods of Study of Adsorption

While complementary experimental methods to gas sorption have been alluded to above, these will be discussed in more detail in this section. Given that the condensation or evaporation pressure of an adsorbate ganglion can not be a unique function of pressure and pore size, then an independent measure of the size of the ganglion may help discern novel sorption effects. A variety of complementary methods have been used to study the adsorbed phase in recent years, including, particularly, NMR and scattering methods.
There are a variety of NMR methods that can be used to study the geometry and topology of the adsorbed phase. NMR relaxometry and NMR cryoporometry can be used to independently measure the characteristic size of adsorbed ganglia, while NMR diffusometry can be used to study the interconnectivity of the adsorbed phase. More details on the physical principles and experimental protocols for these methods can be found elsewhere [5]. NMR cryoporometry has been used to detect the location (i.e., which pore sizes it occurs within) and the extent of advanced condensation for water adsorption in a mesoporous sol–gel silica [100]. NMR cryoporometry studies of the adsorbed phase are facilitated by the extremely slow desorption kinetics for the condensate from large (~3 mm) mesoporous pellets. The stability of the condensate content and disposition can be checked gravimetrically before and after NMR and via quick NMR pulse-acquire and relaxation time measurements [100]. Coupled NMR cryoporometry studies have also shown that the onset of advanced condensation was associated with the filling of critical pores in the percolation path, such that they controlled the extent of the interconnectivity of adsorbate ganglia. Further, this work showed that, for the cryoporometry advanced melting effect, analogous to advanced condensation in adsorption, the critical neighboring pore size ratio for the onset of the effect was much higher for the former than the latter. Hence, if advanced condensation occurs within a sample, advanced melting of the adsorbate ganglia will also ensue. This finding shows how advanced melting can be used to study advanced condensation.
NMR methods can be applied to a number of different types of adsorbates, including organic liquids instead of water [101]. This facilitates the study of whether the nature of the adsorbate (and, thence, adsorbate–adsorbent interaction strength) affects certain sorption effects, such as advanced condensation. Further, while advanced melting effects have a critical neighboring pore size ratio above which they do not arise, the pore-blocking effects in desorption do not have this limiting critical ratio, and so, the occurrence of the former does not prevent the detection of the latter when there is a larger difference between shielding necks and shielded pore bodies than the critical value for advanced melting (classically 2). This has allowed NMR cryoporometry to be used to probe the size distribution, and, hence, spatial disposition, of the condensed ganglia at the same amount adsorbed but on either the boundary adsorption or desorption curves. Such studies have shown that, in the middle part of the isotherm hysteresis region, the size distribution, and, thus, spatial disposition, of cyclohexane condensate is different depending upon which boundary curve is considered, as would be expected if pore-blocking effects were operating on the desorption branch. However, in contrast, the cryoporometry melting curves were found to be the same for both the adsorption and desorption branches in the bottom part of the hysteresis loop, just above the lower hysteresis closure point, suggesting the disposition of the condensate ganglia is the same on both branches. A similar result has been found via NMR relaxometry for water sorption hysteresis in an amorphous silica [102]. This similarity in the shape of cryoporometry melting curves, irrespective of whichever gas sorption hysteresis branch is probed, suggested that the hysteresis in the lower part of the loop was dominated by single-pore hysteresis, and, therefore, accompanied by advanced condensation upon adsorption and pore-blocking upon desorption in anythrough ink-bottle pores. It is highlighted that these NMR studies suggest that the mechanism of pore filling is changing along the adsorption branch of the hysteresis loop, and, therefore, the use of just one such mechanism to obtain the PSD would result in an error, the size of which the NMR data can be used to estimate. Further, NMR methods have also been used to understand the form (crossing versus ascending/descending) of the cyclohexane sorption scanning curves [102].
Scattering methods, such as small-angle X-ray or neutron scattering, have been used to study the fundamental processes involved in adsorption in model-templated porous solids, such as SBA-15. The processes discerned included micropore filling, multilayer formation, capillary condensation and hysteresis, and incomplete wetting [103]. The interpretation of scattering experiments using models typically requires some degree of already known order in the void space and adsorption process in order to set the basic parameters of the form and structure factors for the scattering pattern. The pore structure does not necessarily need to be regular, but must have some sort of symmetry, such as the self-similarity of statistical fractal surface roughness or complete randomness. This limits the information that can be obtained for more disordered systems.
However, scattering methods can obtain the chord-length distribution (CLD) for the remaining voids during the sorption process. This enables the sizes of voids being filled or emptied of condensate to be assessed independently of the gas sorption data. Kube et al. [103] studied the physisorption of krypton at 117.8 K in the mesopore network of a silica monolith using SAXS. In particular, they obtained CLDs during the boundary desorption process and for descending scanning curves. The descending scanning curves included examples where, upon initiation partway up the boundary adsorption isotherm, desorption started immediately upon reversing the direction of the pressure changes, but the scanning curve exhibited a trajectory that took it to a point only partway down the boundary desorption isotherm, rather than to the lower hysteresis closure point. Kube et al. [103] suggested that this behavior was impossible for a disordered pore network with a completely random arrangement of pore sizes, since then, pore shielding of some remaining filled larger pores should arise all the way down the descending scanning curve. However, they also considered the variation in average chord length with the amount adsorbed for the boundary desorption and descending scanning curves. These data showed that the average chord length declined more sharply during the crossing section of the descending scanning curve, compared with that for the boundary desorption curve over the same range of amount adsorbed, or the same range of relative pressure. Hence, Kube et al. [103] proposed that this observation was consistent with a spatial distribution of pore sizes that, while being largely random, also possessed some spatial correlation such that the local average pore size declined with distance from the exterior surface. This was because this particular pattern of spatial correlation led to differences in the order of emptying of the largest filled pores towards the top end of the scanning and boundary curves due to local randomness, but it was completely the same at lower relative pressures, even above the lower hysteresis closure point, due to the impact of the longer range spatial correlation.

4.5. Percolation Models

Percolation theory has been used for some time for understanding gas sorption, and an extensive body of work has been carried out, especially employing invasion percolation to model phenomena such as pore-blocking [23,31,91,92,94,96,104,105,106,107,108,109,110,111,112,113,114,115,116,117,118,119,120,121,122,123,124,125,126,127,128,129,130,131,132,133,134,135,136,137,138,139,140,141,142,143,144,145,146]. However, Baroncha et al. [97] suggested that, during desorption, nucleation of the gas phase within an individual pore (cavitation) may also trigger percolation into neighboring pores. Hence, both desorption and adsorption (via advanced condensation) can also involve ordinary percolation processes. A key remaining issue in the application of percolation theory to gas sorption data is the understanding of the meaning and interpretation of the lattice size parameter [104].
The lattice size parameter can be interpreted as directly related to the real pore network itself. Yu et al. [147] used a cubic lattice pore bond network model (PBNM) to model gas sorption isotherms and, ultimately, predict the diffusivity of water vapor. Since pore bonds were considered to intersect only at pore nodes with zero volume, network-based delayed condensation effects were neglected [20,21]. Despite using an interconnected network model, Yu et al. [147] also assumed adsorption occurred in a similar fashion to the independent pore model, and, therefore, neglected pore-to-pore cooperative effects such as advanced condensation. The PSD for the model was calculated by a variety of means. The simplest versions employed the BJH algorithm and the corrected Kelvin equation. To correct the latter, Yu et al. [147] used a corrected version of the Harkins–Jura standard curve. However, to allocate a PSD across the individual bonds of the PBNM, it had to be a number-weighted distribution. In order to convert the pore volume-weighted PSD from the BJH analysis to a pore number-weighted distribution, two different assumptions concerning the relationship between pore diameter and length were tested. It was assumed that either the pore lengths were uncorrelated with pore diameter, as in the original Seaton [117] percolation analysis, and so had a fixed length, or the length of an individual pore was the same as its pore diameter. However, these authors did try to account for deviations from condensation pressures according to the standard Kelvin equation with a Harkins–Jura correction that occurred for small pores and at larger relative pressures above ~0.9. To correct the former Yu et al. [147], either modified the Kelvin equation itself or utilized GCMC-derived PSDs. However, for the GCMC-derived PSDs, it was assumed that pore length was uncorrelated with pore diameter and took a constant value. In order to fix the pore connectivity and lattice size of the PBNM, these authors initially obtained rough values using the improved version of the Seaton [118] percolation analysis that takes into account the impact of surface clusters of larger pores on the shape of the desorption knee. They then refined these initial guesses for these parameters by using the PBNM itself to explicitly predict the desorption isotherms and then optimizing the network parameters to obtain the best fit to the experimental desorption isotherm. Yu et al. [147] found that it is necessary to take into account the impact of surface clusters on desorption in order for the lattice size obtained from percolation analysis to be of a large enough size that its value is physically realistic compared to the likely network sizes in a real material. However, the assumption made concerning the relationship between pore diameter and pore length affects the relative numbers of larger pores in the number-weighted distribution and, thereby, the values of pore connectivity obtained for the same lattice size and sorption isotherms. Further, the value of pore connectivity is critical in determining the network tortuosity, and, thence, the predicted diffusivity. Hence, the assumption made about pore length greatly affected the predicted effective diffusivity for water vapor mass transport. The aforementioned different theoretical descriptions (Kelvin equation, etc.) of adsorption to obtain the PSD from the adsorption isotherm also affect, but to a lesser extent than pore length variation, the ultimate numbers of larger pores and, hence, the value of pore connectivity obtained for the network. These findings also hint that the advanced condensation and network-delayed condensation effects will have a substantial impact, given that they will also influence the number of larger pores obtained for the PSD. Hence, the work of Yu et al. [147] demonstrated the importance of the assumptions used in deriving a PBNM for mass transport simulations in determining the likely accuracy of the vital pore connectivity and, thus, diffusivity.
Some workers have suggested that ‘the effect of surface pores in real porous materials is usually quite small’ [91], but complementary experimental techniques have shown that this assertion is not correct in many cases. Indeed, as has been mentioned above and will also be seen below, the surface pores often dominate desorption behavior, even over pore connectivity. Surface pores have a greater relative incidence, compared to internal/bulk pores, in smaller lattice sizes, and, thus, surface pores are intimately linked with finite-size effects in model networks.
The percolation model lattice size parameter can correspond to features of the porous solid at levels in the structural heterogeneity hierarchy above that of the matrix pores themselves. Integrated mercury porosimetry coupled with CXT can be used to interpret the form of gas sorption isotherms (see Figure 2) for complex, disordered porous materials, such as the tableted catalyst pellets made with spray-dried (SD) feed particles, as shown in Figure 6. The CXT image of a 2D cross-section slice through the middle of the empty cylindrical pellet is shown in the top left of Figure 6. It can be seen from Figure 6 that the original, individual spray-dried feed particles used in tableting (see Figure 2) can still be discerned in the CXT image for the whole pellet. The variation in the grey levels of voxels within the individual feed particles represents variation in density, with brighter, whiter shades representing more dense particles. It might be supposed that the less dense particles may have more porosity and probably also larger pores.
Figure 7a shows the conventional gas sorption and overcondensation isotherms obtained for the empty SD feed pellet. It can be seen that the overcondensation boundary desorption isotherm is characterized by two knees. The upper, sharper knee is at a relative pressure of ~0.95, and the more rounded, lower knee is at a relative pressure of ~0.8. These knees represent percolation thresholds for the invasion percolation of vapor into pore clusters. The structures in the pellet associated with these knees are revealed by integrated mercury porosimetry coupled with CXT after porosimetry. Figure 7 shows examples of gas sorption, conventional, and OC isotherms obtained after mercury intrusion up to various pressures, and Figure 6 shows CXT images through the middle of typical pellets revealing the spatial distribution of mercury that has become entrapped during the porosimetry experiments. In the porosimetry experiments, typically ~80–100% of the intruded mercury becomes entrapped in the samples, such that the entrapped mercury effectively traces the particular regions of the pellet that had been intruded up to a given pressure. It can be seen from the images on the top row of Figure 6 that, as the mercury intrusion pressure is increased progressively up to 14,700 psia (corresponding to a radius of 14.7 nm), the mercury advances as a front (the stages of which are shown roughly by the red circles) until mercury reaches the center of the pellet. However, behind the front, some of the individual SD feed particles are left only partially or completely unintruded with mercury, although the circular intense white dots suggest that a lot of bubble pores (see Figure 2) have become filled with mercury. In the corresponding gas OC desorption data shown in Figure 7a, it can be seen that the sharper, upper desorption knee moves down to a smaller amount adsorbed and a lower relative pressure until it merges with the lower, more rounded desorption knee. Considering the CXT data, this is what might be expected as entrapped mercury progressively fills the pores, starting with the largest accessible from the periphery of the pellet. This forces the percolation threshold to move to lower pore sizes, as the invading vapor phase must find an alternative route into the pellet around the pores filled with mercury. Given that mercury intrusion is also an invasion percolation process, the entrapped mercury also effectively traces the percolating pathway of the vapor phase during desorption from an empty pellet.
Once the mercury front has reached the center of the CXT image, percolation of the overall pellet has been achieved. However, as mentioned above, at that stage, some individual spray-dried feed particles have still not been penetrated. Hence, as mercury is intruded to even higher pressures, the percolation knee in the OC desorption isotherm moves to lower relative pressures as the still unfilled SD feed particles are progressively penetrated and filled as the pressure exceeds their individual percolation threshold. However, even after mercury intrusion to pressures in excess of 21,000 psia, an upper percolation knee still arises in the OC data, which corresponds to the percolating pathway for the vapor retained to the center of the pellet, even after large amounts of mercury entrapment, and gives access to the SD feed particles still unfilled with mercury.
The varying shape of the hysteresis loop seen in Figure 7a can be characterized via a percolation analysis [117]. This involves mapping the hysteresis loop behavior onto the percolation properties of an abstract 3D random pore bond network model which is characterized by a pore connectivity (Z), which is the average number of pore bonds meeting at a lattice node (or the average pore co-ordination number), and the lattice side length (L) (equal to the number of pore bonds along the side of the lattice). The model pore connectivity is related to the width of the hysteresis loop, while the model network lattice size is related to the roundedness of the desorption knee. A wide gas sorption hysteresis loop corresponds to a low pore connectivity in the model lattice and a narrow loop to high connectivity. A sharp, localized desorption isotherm knee corresponds to a very large model network lattice, and a more rounded, smeared-out desorption knee to a smaller model lattice size. The procedure for the percolation analysis is described in more detail elsewhere [31,52,117].
The percolation parameters Z and L can be obtained for hysteresis loops (using OC desorption isotherm and conventional adsorption isotherm) from gas sorption experiments for empty catalyst pellets, and pellets partially filled with entrapped mercury, as shown in Figure 6. This analysis was performed for the three types of methanol synthesis catalyst pellets shown in Table 2 [31,32].
Figure 8 shows CXT images of the empty, high-density (HD) RC pellet and following the intrusion of mercury up to the different pressures indicated. From a comparison of the CXT images in Figure 5 and Figure 7, it can be seen that the pellets tableted from RC and SD feed have very different internal textural appearance, and that the particle sizes (w) of the individual constituent feed particles are different, being typically 1300 and 200 μm, respectively.
The percolation analysis of the gas sorption data for the three different types of pellet listed in Table 2 showed that the apparent lattice size parameter L increased with increased mercury entrapment. This was rationalized based upon the CXT data, as shown in Figure 5 and Figure 7, which showed that the entrapped mercury occupied the surface clusters of larger pores. This entrapment reduced the amount of pellet external surface area, with pores still accessible to the invading vapor phase during desorption. Hence, the apparent external-surface-area-to-internal-volume ratio of the pellet was reduced, which would be equivalent to the pellet appearing to increase in effective size, since this ratio is inversely proportional to pellet size. This same effect is used in the oil industry to obtain capillary pressure curves relevant for larger, full reservoirs from small core samples by covering all but one face of the core with epoxy resin that is impermeable to intruding mercury [148].
The tortuosity for the diffusional mass transfer of gas towards the center of a porous catalyst pellet is related to the deviation from the direct, straight-line route, and thus increased path length, that the molecules must take as they migrate through the disordered, interconnected pore network within the pellet. The occupancy of the surface clusters of larger pores with mercury will increase this path length further due to the necessity of deviations around the blockages. If it is assumed that the consequent relative increase in equivalent network model apparent lattice size is equal to the relative increase in this diffusional path length (and, hence, tortuosity τ), and that the ratio of the overall pellet size (obtained from the ratio of the pellet external surface area (S) to internal volume (V)) to the constituent feed particle size is equivalent to the original model lattice size (L0), then the ratio of the tortuosity for the empty pellet to that after the pellet is partially filled with entrapped mercury is given by [31]:
τ 0 τ = 1 γ ( L L 0 ) w ( S V ) t
where γ is a ratio of geometry factors for the pellet and feed particle, and a value of unity thereof would indicate that the two particles would have the same overall geometry. Equation (2) thus relates parameters obtained from three independent experiments, namely equilibrium gas sorption (L), kinetic gas uptake measurements (τ), and CXT (w). The relevant values of tortuosity have been obtained from nitrogen gas uptake experiments on the types of pellet listed in Table 2, and these data have been found to have the form anticipated from Equation (2) and give rise to a good fit as shown in Figure 9.
Some previous authors [104] have questioned the physical meaning of the lattice size parameter obtained from the Seaton [117] percolation analysis. In the case of the catalyst pellets shown in Figure 9, the dimensionless group wS/V in Equation (2) represents the “conversion factor” between the model lattice parameter and the real pellets. This dimensionless group identifies the particular length scale that is critically controlling the mass transport process probed in the gas uptake experiments, which corresponds to the particle size of the constituent feed particles of the tableted pellets. The CXT images of the pellets indicate that the number of feed particles spanning the pellets is typically on the same order as the values of the lattice size parameters obtained from the percolation analysis (~1–10). Hence, the macro-scale structure of the pellet, over length scales exceeding 100 microns, is dominating the mass transport and gas desorption percolation behavior. Indeed, the filling behavior of the feed particles with mercury, where some particles in the CXT images are full of mercury while others remain devoid of mercury, suggests that the gas sorption domains correspond to regions the size of the feed particles.
It is noted that the percolation analysis used here was the original method described by Seaton [117], employing a universal scaling relation, as opposed to that of Liu et al. [118] mentioned above. This is because the typical apparent lattice sizes thereby obtained for the catalyst pellets were small (L < 10), such that the surface clusters of pores would typically be expected to be connected to the percolating cluster due to the very close proximity of all pores in such a small lattice. In very large lattices, the surface clusters are negligible in size compared to the percolating cluster. It is only in the intermediate lattice sizes, as studied by Yu et al. [147], that surface clusters are separately important.
The findings for the different types of catalyst pellet suggest that, even though the CXT data in Figure 5 and Figure 7 show that the SD and RC feed pellets each have very different internal structures, and the pattern of intrusion of mercury was also very different, being of either a shrinking core or fractal tree form, respectively, the modification of the pore structure engendered by the mercury entrapment that is critical to determining mass transport is captured for both types of pellet by the value of the gas sorption percolation analysis lattice size parameter. This suggests that apparently diverse structures and phenomena can all be accommodated by the same theoretical framework involving percolation in a random pore bond network model. The aforementioned finding that the particular critical length scale in the structural hierarchy within the pellets that is controlling for both gas sorption and mass transport processes corresponds to the pellet particle feed size shows how this key parameter for the pellet fabrication process, to control to produce a desired product, is, perhaps, more immediately evident in this simple PNM than it might be from a more “brute force” approach involving construction of a void space model directly from images and in-depth simulation of the physical processes occurring therein.
The percolation-based approach, and particularly the latter result, has been further validated by the prediction from gas sorption data, using Equation (2), that, following reduction and sintering of the catalyst pellets during subsequent stages in their normal life-cycle, the critical length-scale had changed for the RC feed pellets [149]. This was because the tableting feed, formed by roll compaction, used in the production of whole pellets, were themselves composites (as can be seen in Figure 8a). The constituent particles of the roll compacts (pelleting feed) each shrank slightly in size during reduction and sintering, thereby opening up new macroporosity between themselves over a smaller length-scale w, which was typically of the order of the size of these roll-compact constituents. The change in size of parameter w, predicted from a plot like that given in Figure 9, which used the gas OC data in its construction, was then confirmed from the CXT of the reduced and sintered RC pellets. This work suggests that the ability of OC to probe multiple scales in a structural hierarchy, including sizes much larger than conventional gas sorption, means that it allows the study of changes in the importance of those levels, not just gas sorption, but also complementary mass transport processes.

5. Discussion

From the foregoing survey of the previous literature, it might be considered that the “maximally-realistic” model of adsorption within a porous solid would consist of a representation of the void space derived directly from a single imaging modality with sufficient resolution to detect the molecular-scale surface roughness within individual pores and a field-of-view large enough to encompass larger-scale structural heterogeneities. The representation of the porous medium would also require the incorporation of the surface chemical heterogeneity that impacts adsorption. The modeling of the gas sorption within the structural representation would be performed utilizing a molecular simulation, such as molecular dynamics. Such a model might be expected to be able to predict, for a range of adsorbates, their gas sorption behavior in any conceivable experimental protocol.
However, such a “brute force” approach currently remains unfeasible due to limitations in the computing power available for conducting adsorption simulations in such a detailed structural model of a complex industrial or natural porous material. The brute-force method is limited to materials with very small pore structural correlation lengths (in the few nanometers length-scale range). Further, for materials with structural disorder that will impact sorption processes over many length scales, a suitable single imaging modality currently does not exist. It is also not currently possible to measure surface chemistry in micro- and mesoporosity for macroscopic samples, or even for the likely representative volume. Hence, a different modeling strategy is required.
One approach is Galilean idealization, whereby the maximally realistic model is simplified until it becomes tractable mathematically or via computer simulation [150,151,152]. However, given that it is not yet possible to construct a maximally realistic model in the first place, which can then be simplified, this approach has limited application in adsorption. This contrasts with other physical systems, such as flow in natural porous rocks, where it is often possible to obtain a single (often CXT) image of a macroporous rock sample that does capture the key aspects of the void spaces that control flow processes, namely the pore sizes and interconnectivity [33]. For systems where the sorption processes of interest are dominated by percolation, and thus the key controlling void space descriptors are the same, then the Galilean approach may also be useful. Even if a single image can probe these aspects of the void space, the image data is often such a large dataset that it is simplified by extraction of the equivalent pore network model consisting of more idealized elements, such as cylindrical pore bonds and/or spherical pore bodies, to render it tractable with current computing power to simulate the physical processes therein [33]. The various potential algorithms to perform the extraction process can have issues, such as the lack of retention of the original void space connectivity and the loss of some pores, or even the generation of artefactual pores. These issues have been reviewed in more detail elsewhere [3,33].
The alternative strategy, which has been more commonly adopted in the work surveyed above, is minimalist idealization [150,151,152]. In this approach, the model complexity is built-up by progressively incorporating more structural elements or more sophisticated sorption theories until it becomes fully predictive of the physical process(es) of interest, and/or some experimental or theoretical rationale is used to decide in advance those features of the void space structure that will ‘make a difference to the occurrence or essential character of the phenomenon in question’ [151]. Hence, this type of model makes explicitly clear what the important controlling factors, such as the pellet feed size in the minimalist model mentioned above [31,149], are, but which are much harder to discern from amongst the complexity of maximally realistic models. The minimalist approach to structural modeling is exemplified by the use of pore bond networks in gas sorption. The initial, independent, parallel, pore-bundle (structural) model (PPBM) is complexified by turning it into an interconnected pore bond network, thereby incorporating pore connectivity in addition to pore size as model parameters. If the resulting structural model is still not empirically adequate (predictive of the processes of interest), then it can be further complexified, such as via the incorporation of surface roughness into the pore bonds [153,154,155,156,157].
The model of gas sorption itself can also be progressively complexified. For example, it has been seen above that the simple modeling of capillary condensation and evaporation in individual pore bonds using the Kelvin–Cohan equations can be augmented by the addition of pore-to-pore cooperative effects in networks, such as pore blocking and, more recently, advanced condensation (or cascade) effects [91,92,94,96]. Further, the above survey has shown that a particular avenue for more recent work has been the progressive complexification of the simple slit-shaped pore model for carbon materials to incorporate more of the structural and chemical heterogeneities, present in industrial activated carbons and shale rocks with substantial organic (kerogenic) constituents, that impact the adsorption of more non-specific adsorbates, such as carbon dioxide [56,59,61]. The adsorption process model has also been complexified by using GCMC and various DFT models to construct kernels.
The foregoing survey has suggested two main purposes for ever more empirically adequate modeling of gas sorption in porous solids, though they are linked. One is the direct modeling of industrially and naturally important sorption processes, such as gas separations or gas storage, in order to design new porous materials, and their fabrication, and also achieve control of desired processes occurring therein. A second purpose is to assess the limitations, and thereby circumscribe the accuracy, of simple characterization methods using gas sorption, such as obtaining PSDs, for particular classes of materials.
Many of the studies discussed above have suggested that, particularly for nitrogen adsorption on carbons, the standard BET model tends to overestimate the specific surface area. Several molecular simulation studies have suggested that this is because, at the amount adsorbed corresponding to the apparent statistical monolayer, more nitrogen has actually adsorbed [61]. However, for argon adsorption and nitrogen adsorption on other materials such as partially dehydroxylated silica, the standard BET model tends to under-estimate the specific surface area, so an overall conclusion on a general trend cannot be drawn. In addition, most of the recent studies do not also test the various modifications to the original BET model that have been proposed previously, such as the fractal BET model and the homotattic patch model [5,47]. The application of the fractal BET model for gas adsorption on rough silica surfaces has been validated by, for example, a comparison of the fractal dimension obtained from fitting the isotherm data to that obtained by completely independent methods, such as SAXS [14]. Fractal scaling accounts for the potential for the number of adsorption sites to vary between the initial monolayer and subsequent layers in the multilayer, and, thence, the overprediction of adsorbed amount by the standard BET model. The application of the homotattic patch model to chemically heterogeneous surfaces has been tested for shale rocks [39]. The homotattic patch model accounts for the different extents of multilayer build-up arising on different parts of the internal surface at the same pressure and, so, better predicts the adsorbed amount over a wider range of pressures than the standard BET equation. Hence, over-sweeping statements have sometimes been made concerning the accuracy of surface areas from gas adsorption, without consideration of the alternatives to standard BET analysis.

6. Outlook

As potential computing power improves, the minimalist idealization models can progress ever closer towards the maximally realistic model, such that ever more complex gas sorption processes in ever more disordered systems can be predicted a priori. This will be possible only if the sophistication of new experimental characterization methods, especially for directly determining the particular surface chemistry within individual pores, can keep up with the rise in computing power. In the absence of the former, a posteriori modeling of gas adsorption data for a range of adsorbates with differing specificities might be able to indirectly propose possible surface chemistries.
A promising avenue to accelerate the transition from minimalist to realistic modeling is the integration of artificial intelligence (AI) and machine learning (ML), which can bridge the computational gap between “brute force” molecular simulations and simplified pore network models (PNMs). For instance, ML-assisted potentials have been shown to enable large-scale simulations of porous systems under realistic conditions, capturing microscopic insights into gas adsorption that traditional methods struggle with due to scale limitations [158]. Recent physically motivated ML models now enable the accurate prediction of gas physisorption isotherms in nanoporous materials directly from structural features, effectively solving aspects of the inverse characterization problem [159,160]. Furthermore, active-learning frameworks are optimizing high-throughput screening of adsorption properties with minimal simulations, significantly reducing computational overhead [161]. Generative AI approaches, including diffusion models and Generative Adversarial Networks (GANs), are emerging for the de novo design and realistic 3D reconstruction of nanoporous materials, extending even to disordered systems like porous oxides [162,163,164]. These tools are driving sustainable applications, such as the development of lignin-derived hierarchical porous carbons that achieve record CO2 capture in humid conditions [165]. By 2030, such AI/ML integration could enable routine multi-scale simulations of industrially relevant disordered solids, enhancing both characterization accuracy and material design for catalysis and carbon capture.
The complexification of the combination of PPBM and Kelvin–Cohan equations into PNMs that include pore-to-pore cooperative effects has only been partial so far. The structural models have been limited to either pore bond Bethe lattices or simple pore bond-site models. The incorporation of pore-to-pore co-operative effects has expanded beyond pore-blocking to include cavitation, advanced condensation, and even network-based delayed condensation effects. However, the pore bond networks have room for more sophisticated treatment of the sorption processes arising at complex 3D pore junctions, and, in particular, all network models generally neglect the effects of side-to-end junctions. The impact of these features could be incorporated in the future. These models could then truly assess the likely/typical accuracy of simple characterization approaches, such as BJH PPBM PSDs.

7. Conclusions

Gas sorption remains a key structural characterization method for porous media because it presently still is the only technique whereby macroscopic samples with pore sizes across the whole range, from several hundred microns down to angstroms, can be characterized relatively quickly in a single experiment. Gas sorption also remains one of the few techniques that quickly and cheaply provide statistically representative pore space descriptors for macroscopic samples of highly disordered materials. New modeling approaches are improving the numerical accuracy of these descriptors with little concomitant requirement for experimental elaboration. The modeling work also discerns the inherent limitations of traditional characterization techniques, but thereby mapping their continued usefulness within these limits.

Author Contributions

Writing—original draft preparation, S.P.R. and S.M.; writing—review and editing, S.P.R. and S.M. All authors have read and agreed to the published version of the manuscript.

Funding

This research received no external funding.

Data Availability Statement

No new data were created or analyzed in this study.

Conflicts of Interest

The authors declare no conflicts of interest.

Abbreviations

The following abbreviations are used in this manuscript:
BETBrunauer–Emmett–Teller
BJHBarrett–Joyner–Halenda
DFTDensity Functional Theory
IPMIndependent Pore Model
GCMCGrand Canonical Monte Carlo
LDFTLattice-based DFT
MFDFTMean-Field DFT
NLDFTNon-local DFT
PSDPore size distribution
PPBMParallel pore bundle model
QSDFTQuenched solid density functional theory
SAXSSmall-angle X-ray scattering

References

  1. Arif, M.; Mahmoud, Y.; Zhang, S.; Iglauer, S. X-ray tomography imaging of shale microstructures: A review in the context of multiscale correlative imaging. Int. J. Coal Geol. 2020, 233, 103641. [Google Scholar] [CrossRef] [Scilit]
  2. Furukawa, H.; Cordova, K.E.; O’Keeffe, M.; Yaghi, O.M. The Chemistry and Applications of Metal-Organic Frameworks. Science 2013, 341, 1230444. [Google Scholar] [CrossRef] [Scilit]
  3. Rigby, S.P. Do Pores Exist?—Foundational Issues in Pore Structural Characterisation. Foundations 2024, 4, 225–248. [Google Scholar] [CrossRef] [Scilit]
  4. Zelenka, T.; Horikawa, T.; Do, D.D. Artifacts and misinterpretations in gas physisorption measurements and characterization of porous solids. Adv. Colloid Interface Sci. 2023, 311, 102831. [Google Scholar] [CrossRef] [Scilit] [PubMed]
  5. Rigby, S.P. Structural Characterisation of Natural and Industrial Porous Materials: A Manual; Springer International Publishing: Cham, Switzerland, 2020. [Google Scholar]
  6. Puibasset, J. Cavitation in heterogeneous nanopores: The chemical ink-bottle. AIP Adv. 2021, 11, 095311. [Google Scholar] [CrossRef] [Scilit]
  7. Rigby, S.P. Recent Developments in the Structural Characterisation of Disordered, Mesoporous Solids. JMTR 2018, 62, 296–312. [Google Scholar] [CrossRef] [Scilit]
  8. Gregg, S.J.; Sing, K.S.W. Adsorption, Surface Area and Porosity; Academic Press Inc.: London, UK, 1982. [Google Scholar]
  9. Schlumberger, C.; Scherdel, C.; Kriesten, M.; Leicht, P.; Keilbach, A.; Ehmann, H.; Kotnik, P.; Reichenauer, G.; Thommes, M. Reliable surface area determination of powders and meso/microporous materials: Small-angle X-ray scattering and gas physisorption. Microporous Mesoporous Mater. 2022, 329, 11554. [Google Scholar] [CrossRef] [Scilit]
  10. Thommes, M.; Katsumi, K.; Neimark, A.V.; Olivier, J.P.; Rodriguez-Reinoso, F.; Rouquerol, J.; Sing, K.S.W. Physisorption of gases, with special reference to the evaluation of surface area and pore size distribution (IUPAC Technical Report). Pure Appl. Chem. 2015, 87, 1051–1069. [Google Scholar] [CrossRef] [Scilit]
  11. Dantas, S.; Struckhoff, K.C.; Thommes, M.; Neimark, A.V. Pore size characterization of micro-mesoporous carbons using CO2 adsorption. Carbon 2021, 173, 842–848. [Google Scholar] [CrossRef] [Scilit]
  12. Buckingham, A.D.; Fowler, P.W.; Hutson, J.M. Theoretical Studies of van Der Waals Molecules and Intermolecular Forces. Chem. Rev. 1988, 88, 963–988. [Google Scholar] [CrossRef] [Scilit]
  13. Graham, C.; Imrie, A.; Raab, R.E. Measurement of the Electric Quadrupole Moments of CO2, CO, N2, Cl2 and BF3. Mol. Phys. 1998, 93, 49–56. [Google Scholar] [CrossRef] [Scilit]
  14. Watt-Smith, M.; Edler, K.J.; Rigby, S.P. An Experimental Study of Gas Adsorption on Fractal Surfaces. Langmuir 2005, 21, 2281–2292. [Google Scholar] [CrossRef] [Scilit]
  15. Matsuhashi, H.; Tanaka, T.; Arata, K. Measurement of heat of argon adsorption for the evaluation of relative acid strength of some sulfated metal oxides and H-type zeolites. J. Phys. Chem. B 2001, 105, 9669–9671. [Google Scholar] [CrossRef] [Scilit]
  16. Guillet-Nicholas, R.; Berube, F.; Thommes, M.; Janicke, M.T.; Kleitz, F. Selectively tuned pore condensation and hysteresis behaviour in mesoporous SBA-15 silica: Correlating material synthesis to advanced gas adsorption analysis. J. Phys. Chem. C 2017, 121, 24505–24526. [Google Scholar] [CrossRef] [Scilit]
  17. Schlumberger, C.; Sandner, L.; Michalowski, A.; Thommes, M. Reliable surface area assessment of wet and dry nonporous and nanoporous particles: Nuclear magnetic resonance relaxometry and gas physisorption. Langmuir 2023, 39, 4611–4621. [Google Scholar] [CrossRef] [Scilit]
  18. Hollewand, M.P.; Gladden, L.F. Transport heterogeneity in porous pellets-II. NMR imaging studies under transient and steady-state conditions. Chem. Eng. Sci. 1995, 50, 327–344. [Google Scholar] [CrossRef] [Scilit]
  19. Hitchcock, I.; Malik, S.; Holt, E.M.; Fletcher, R.S.; Rigby, S.P. Impact of Chemical Heterogeneity on the Accuracy of Pore Size Distributions in Disordered Solids. J. Phys. Chem. C 2014, 118, 20627–20638. [Google Scholar] [CrossRef] [Scilit]
  20. Rigby, S.P.; Hasan, M.; Hitchcock, I.; Fletcher, R.S. Detection of the delayed condensation effect and determination of its impact on the accuracy of gas adsorption pore size distributions. Colloids Surf. A 2017, 517, 33–44. [Google Scholar] [CrossRef] [Scilit]
  21. Matadamas, J.; Alférez, R.; López, R.; Román, G.; Kornhauser, I.; Rojas, F. Advanced and delayed filling or emptying of pore entities by vapor sorption or liquid intrusion in simulated porous networks. Colloids Surf. A 2016, 39, 39–51. [Google Scholar] [CrossRef] [Scilit]
  22. Neimark, A.V.; Ravikovitch, P.I. Capillary Condensation in MMS and Pore Structure Characterization. Microporous Mesoporous Mater. 2001, 44, 697–707. [Google Scholar] [CrossRef] [Scilit]
  23. Morishige, K. Estimation of neck size distribution in ordered cagelike materials using nitrogen and water desorption isotherms. J. Phys. Chem. C 2017, 121, 26806–26814. [Google Scholar] [CrossRef] [Scilit]
  24. Jagiello, J.; Kenvin, J. NLDFT adsorption models for zeolite porosity analysis with particular focus on ultra-microporous zeolites using O2 and H2. J. Colloid Interface Sci. 2021, 625, 178–186. [Google Scholar] [CrossRef] [Scilit]
  25. Laudone, G.M.; Jones, K.L. A grand canonical Monte-Carlo simulation for the evaluation of pore size distributions of nuclear-grade graphite from Kr adsorption isotherms. J. Carbon Res. 2023, 9, 86. [Google Scholar] [CrossRef] [Scilit]
  26. Garcia-Martinez, J.; Xiao, C.; Cychosz, K.A.; Li, K.; Wan, W.; Zou, X.; Thommes, M. Evidence of intracrystalline mesostructured porosity in zeolites by advanced gas sorption, electron tomography and rotation electron diffraction. ChemCatChem 2014, 6, 3110–3115. [Google Scholar] [CrossRef] [Scilit]
  27. Schlumberger, C.; Thommes, M. Characterization of hierarchically ordered porous materials by physisorption and mercury porosimetry—A tutorial review. Adv. Mater. Interfaces 2021, 8, 2002181. [Google Scholar] [CrossRef] [Scilit]
  28. Dantas, S.; Struckhoff, K.C.; Thommes, M.; Neimark, A.V. Phase behaviour and capillary condensation hysteresis of carbon dioxide in mesopores. Langmuir 2019, 35, 11291–11298. [Google Scholar] [CrossRef] [Scilit]
  29. Aukett, P.N.; Jessop, C.A. Assessment of connectivity in mixed meso/macroporous solids using nitrogen sorption. In Fundamentals of Adsorption; Kluwer Academic Publishers: Norwell, MA, USA, 1996; pp. 59–66. [Google Scholar]
  30. Murray, K.L.; Seaton, N.A.; Day, M.A. An Adsorption-Based Method for the Characterization of Pore Networks Containing Both Mesopores and Macropores. Langmuir 1999, 15, 6728–6737. [Google Scholar] [CrossRef] [Scilit]
  31. Mousa, S.; Novak, V.; Fletcher, R.S.; Garcia, M.; Mcleod, N.; Corfield, M.; Rigby, S.P. Integration of multi-scale porosimetry and multi-modal imaging in the study of structure-transport relationships in porous catalyst pellets. Chem. Eng. J. 2023, 452, 139122. [Google Scholar] [CrossRef] [Scilit]
  32. Nepryahin, A.; Fletcher, R.; Holt, E.M.; Rigby, S.P. Structure-transport relationships in disordered solids using integrated rate of gas sorption and mercury porosimetry. Chem. Eng. Sci. 2016, 152, 663–673. [Google Scholar] [CrossRef] [Scilit]
  33. Rigby, S.P.; Himona, E. Methods of Pore Structural Characterisation of Sedimentary Rocks and Their Constituent Minerals. Minerals 2024, 14, 756. [Google Scholar] [CrossRef] [Scilit]
  34. Brunauer, S.; Emmett, P.H.; Teller, E. Adsorption of Gases in Multimolecular Layers. J. Am. Chem. Soc. 1938, 60, 309–319. [Google Scholar] [CrossRef] [Scilit]
  35. Rouquerol, J.; Rouquerol, F.; Llewellyn, P.; Maurin, G.; Sing, K. Adsorption by Powders and Porous Solids: Principles, Methodology and Applications; Elsevier: Amsterdam, The Netherlands, 2013. [Google Scholar]
  36. Osterrieth, J.W.M.; Rampersad, J.; Madden, D.; Rampal, N.; Skoric, L.; Connolly, B.; Allendorf, M.D.; Stavila, V.; Snider, J.L.; Ameloot, R.; et al. How Reproducible are Surface Areas Calculated from the BET Equation? Adv. Mater. 2022, 34, 2201502. [Google Scholar] [CrossRef] [Scilit] [PubMed]
  37. Zou, J.; Fan, C.; Jiang, Y.; Liu, X.; Zhou, W.; Xu, H.; Huang, L. A preliminary study on assessing the Brunauer-Emmett-Teller analysis for disordered carbonaceous materials. Microporous Mesoporous Mater. 2021, 327, 111411. [Google Scholar] [CrossRef] [Scilit]
  38. Walker, W.C.; Zettlemoyer, A.C. A dual-surface BET adsorption theory. J. Phys. Chem. 1948, 52, 47–58. [Google Scholar] [CrossRef] [Scilit] [PubMed]
  39. Seely, R.; Liddy, T.J.; Rochelle, C.A.; Fletcher, R.S.; Rigby, S.P. Evolution of the mineralogy, pore structure and transport properties of Nordland Shale following exposure to supercritical carbon dioxide. J. Pet. Sci. Eng. 2022, 213, 110466. [Google Scholar] [CrossRef] [Scilit]
  40. Pfeifer, P.; Wu, Y.J.; Cole, M.W.; Krim, J. Multilayer adsorption on a fractally rough surface. Phys. Rev. Lett. 1989, 62, 1997−2000. [Google Scholar] [CrossRef] [Scilit]
  41. Schneider, P.; Hudec, P.; Solcova, O. Pore-volume and surface area in microporous-mesoporous solids. Microporous Mesoporous Mater. 2008, 115, 491–496. [Google Scholar] [CrossRef] [Scilit]
  42. Jagiello, J.; Chojnacka, A.; Pourhosseini, S.E.M.; Wang, Z.; Beguin, F. A dual shape pore model to analyse the gas adsorption data of hierarchical micro-mesoporous carbons. Carbon 2021, 178, 113–124. [Google Scholar] [CrossRef] [Scilit]
  43. Choma, J.; Jagiello, J.; Jaroniec, J. Assessing the contribution of micropores and mesopores from nitrogen adsorption on nanoporous carbons: Application to pore size analysis. Carbon 2021, 183, 150–157. [Google Scholar] [CrossRef] [Scilit]
  44. Kruk, M.; Jaroniec, M.; Sayari, A. New Approach to Evaluate Pore Size Distributions and Surface Areas for Hydrophobic Mesoporous Solids. J. Phys. Chem. B 1999, 103, 10670–10678. [Google Scholar] [CrossRef] [Scilit]
  45. Buttersack, C. Modeling of type II high-resolution sorption isotherms: Evaluation of different approaches. Colloids Surf. A 2022, 650, 129489. [Google Scholar] [CrossRef] [Scilit]
  46. Buttersack, C. General cluster sorption isotherm: Surface area determination. Phys. Chem. Chem. Phys. 2022, 24, 19473. [Google Scholar] [CrossRef] [Scilit]
  47. Mahnke, M.; Mögel, H.J. Fractal Analysis of Physical Adsorption on Material Surfaces. Colloids Surf. A 2003, 216, 215–228. [Google Scholar] [CrossRef] [Scilit]
  48. He, Z.-T.; Wu, C.-M.; Zhang, W.; Li, Y.-R. Adsorption transition and capillary condensation in mesoporous materials: Experimental and theoretical perspectives for accurate surface characterization. J. Colloid Interface Sci. 2026, 703, 139179. [Google Scholar] [CrossRef] [Scilit]
  49. Alinaghipour, B.; Falarnaki, C. Modified BET theory for actual surfaces: Implementation of surface curvature. Phys. Chem. Chem. Phys. 2023, 25, 8424. [Google Scholar] [CrossRef] [Scilit]
  50. Rigby, S.P.; Stevens, L.; Meersmann, T.; Pavloskaya, G.E.; Rees, G.J.; Henderson, J.; Bryant, S.J.; Edler, K.J.; Fletcher, R.S. Structural and chemical heterogeneity in ancient glass probed using gas overcondensation, X-ray tomography, and solid-state NMR. Mater. Charact. 2020, 167, 110467. [Google Scholar] [CrossRef] [Scilit]
  51. BS ISO 9277:2010; Determination of the Specific Surface Area of Solids by Gas Adsorption—BET Method. International Standards Organisation (ISO): Geneva, Switzerland, 2010.
  52. Rigby, S.P.; Watt-Smith, M.J.; Fletcher, R.S. Simultaneous determination of the pore-length distribution and pore connectivity for porous catalyst supports using integrated nitrogen sorption and mercury porosimetry. J. Catal. 2004, 227, 68–76. [Google Scholar] [CrossRef] [Scilit]
  53. Pomonis, P.J.; Margellou, A. The pore length, the pore number and the pore anisotropy distributions in porous materials. Microporous Mesoporous Mater. 2018, 271, 41–51. [Google Scholar] [CrossRef] [Scilit]
  54. Landers, J.; Gor, G.Y.; Neimark, A.V. Density functional theory methods for characterization of porous materials. Colloids Surf. A 2013, 437, 3–32. [Google Scholar] [CrossRef] [Scilit]
  55. Nguyen, T.X.; Bhatia, S.K. Probing the pore wall structure of nanoporous carbons. Langmuir 2004, 20, 3532–3535. [Google Scholar] [CrossRef] [Scilit] [PubMed]
  56. Lucena, S.M.P.; Oliveira, J.C.A.; Goncalves, D.V.; Silvino, P.F.G.; Dantas, S.; Neimark, A.V. Pore size analysis of carbons with heterogeneous kernels from reactive molecular dynamics model and quenched solid density functional theory. Carbon 2021, 183, 672–684. [Google Scholar] [CrossRef] [Scilit]
  57. Gelb, L.D.; Gubbins, K.E. Pore size distributions in porous glasses: A computer simulation study. Langmuir 1999, 15, 305–308. [Google Scholar] [CrossRef] [Scilit]
  58. Barrett, E.P.; Joyner, L.G.; Halenda, P.P. The Determination of Pore Volume and Area Distributions in Porous Substances. I. Computations from Nitrogen Isotherms. J. Am. Chem. Soc. 1951, 73, 373–380. [Google Scholar] [CrossRef] [Scilit]
  59. Corrente, N.J.; Hicks, E.L.; Kasera, A.; Gough, R.; Ravikovitch, P.I.; Neimark, A.V. Modeling adsorption of simple fluids and hydrocarbons on nanoporous carbons. Carbon 2022, 197, 526–533. [Google Scholar] [CrossRef] [Scilit]
  60. de Tomas, C.; Suarez-Martinez, I.; Vallejos-Burgos, F.; Lopez, M.J.; Kaneko, K.; Marks, N.A. Structural prediction of graphitization and porosity in carbide-derived carbons. Carbon 2017, 119, 1–9. [Google Scholar] [CrossRef] [Scilit]
  61. Vallejos-Burgos, F.; de Tomas, C.; Corrente, N.J.; Urita, K.; Wang, S.; Urita, C.; Moriguchi, I.; Suarez-Martinez, I.; Marks, N.; Krohn, M.H.; et al. 3D nanostructure prediction of porous carbons via gas adsorption. Carbon 2023, 215, 118431. [Google Scholar] [CrossRef] [Scilit]
  62. Kowalczyk, P.; Neimark, A.V.; Furmaniak, S.; Terzyk, A.P.; Kaneko, K. Graphene-domain theory for high surface area nanoporous carbons: Beyond the BET method. Carbon 2025, 245, 120737. [Google Scholar] [CrossRef] [Scilit]
  63. Anderson, R.B. Modifications of the Brunauer, Emmett and Teller equation. J. Am. Chem. Soc. 1946, 68, 686–691. [Google Scholar] [CrossRef] [Scilit]
  64. Hiraide, S.; Yamamoto, K.; Tanaka, H.; Nakai, K.; Watanabe, S.; Miyahara, M.T. GCMC kernel for analyzing the pore size distributions of porous carbons based on a simplified slit-pore model considering surface energetic heterogeneity. Adsorption 2023, 29, 387–399. [Google Scholar] [CrossRef] [Scilit]
  65. Parashar, S.; Ravikovitch, P.I.; Neimark, A.V. Molecular modeling and adsorption characterization of micro-mesoporous kerogen nanostructures. Energy Fuels 2022, 36, 13037–13049. [Google Scholar] [CrossRef] [Scilit]
  66. Prehal, C.; Gratz, S.; Kruner, B.; Thommes, M.; Borchrdt, L.; Presser, V.; Paris, O. Comparing pore structure models of nanoporous carbons obtained from small-angle X-ray scattering and gas adsorption. Carbon 2019, 152, 416–423. [Google Scholar] [CrossRef] [Scilit]
  67. Xu, R.; Prodanovic, M. Effect of pore geometry on nitrogen sorption isotherms interpretation: A pore network modeling study. Fuel 2018, 225, 243–255. [Google Scholar] [CrossRef] [Scilit]
  68. Svidrytski, A.; Hlushkou, D.; Thommes, M.; Monson, P.A.; Tallarek, U. Modeling the impact of mesoporous silica microstructures on the adsorption hysteresis loop. J. Phys. Chem. C 2020, 124, 21646–21655. [Google Scholar] [CrossRef] [Scilit]
  69. Schneider, D.; Valiullin, R.; Monson, P.A. Modeling the influence of side stream and ink bottle structures on adsorption/desorption dynamics of fluids in long pores. Langmuir 2015, 31, 188–198. [Google Scholar] [CrossRef] [Scilit]
  70. Naumov, S.; Valiullin, R.; Karger, J.; Monson, P.A. Understanding adsorption and desorption processes in mesoporous materials with independent disordered channels. Phys. Rev. E 2009, 80, 031607. [Google Scholar] [CrossRef] [Scilit]
  71. Rigby, S.P.; Fletcher, R.S.; Riley, S.N. Characterisation of porous solids using integrated nitrogen sorption and mercury porosimetry. Chem. Eng. Sci. 2004, 59, 41–51. [Google Scholar] [CrossRef] [Scilit]
  72. Bonnet, F.; Wolf, P.E. Thermally activated condensation and evaporation in cylindrical pores. J. Phys. Chem. C 2019, 123, 1335–1347. [Google Scholar] [CrossRef] [Scilit]
  73. Liabastre, A.A.; Orr, C. Evaluation of pore structure by mercury penetration. J. Colloid Interface Sci. 1978, 64, 1–18. [Google Scholar] [CrossRef] [Scilit]
  74. Kloubek, J. Hysteresis in porosimetry. Powder Technol. 1981, 29, 63–73. [Google Scholar] [CrossRef] [Scilit]
  75. Rigby, S.P.; Edler, K.J. The influence of mercury contact angle, surface tension and retraction mechanism on the interpretation of mercury porosimetry data. J. Colloid Interface Sci. 2002, 250, 175–190. [Google Scholar] [CrossRef] [Scilit]
  76. Mousa, S.; Baron, K.; Fletcher, R.S.; Rigby, S.P. Triangulation of pore structural characterisation of disordered mesoporous silica using novel hybrid methods involving dual-probe porosimetries. Colloids Surf. A Phys. Eng. Asp. 2022, 653, 130026. [Google Scholar] [CrossRef] [Scilit]
  77. Hitchcock, I.; Lunel, M.; Bakalis, S.; Fletcher, R.S.; Holt, E.M.; Rigby, S.P. Improving sensitivity and accuracy of pore structural characterisation using scanning curves in integrated gas sorption and mercury porosimetry experiments. J. Colloid Interface Sci. 2014, 417, 88–99. [Google Scholar] [CrossRef] [Scilit]
  78. Rigby, S.P.; Chigada, P.I.; Perkins, E.L.; Watt-Smith, M.J.; Lowe, J.P.; Edler, K.J. Fundamental studies of gas sorption within mesopores situated amidst an inter-connected, irregular network. Adsorption 2008, 14, 289–307. [Google Scholar] [CrossRef] [Scilit]
  79. Morishige, K. Revisiting the nature of adsorption and desorption branches: Temperature dependence of adsorption hysteresis in ordered mesoporous silica. ACS Omega 2021, 6, 15964–15974. [Google Scholar] [CrossRef] [Scilit]
  80. Morishige, K. Pore size distribution analysis using developing hysteresis of nitrogen in the cylindrical pores of silica. Langmuir 2022, 38, 4222–4233. [Google Scholar] [CrossRef] [Scilit]
  81. Gelb, L.D. The ins and outs of capillary condensation in cylindrical pores. Mol. Phys. 2002, 100, 2049–2057. [Google Scholar] [CrossRef] [Scilit]
  82. Rigby, S.P.; Chigada, P.I. Interpretation of integrated gas sorption and mercury porosimetry studies of adsorption in disordered networks using mean-field DFT. Adsorption 2009, 15, 31–41. [Google Scholar] [CrossRef] [Scilit]
  83. Shimizu, S.; Matubayasi, N. Sorption hysteresis: A statistical thermodynamic fluctuation theory. Langmuir 2024, 40, 11504–11515. [Google Scholar] [CrossRef] [Scilit]
  84. Tompsett, G.A.; Krogh, L.; Griffin, D.W.; Conner, W.C. Hysteresis and Scanning Behavior of Mesoporous Molecular Sieves. Langmuir 2005, 21, 8214–8225. [Google Scholar] [CrossRef] [Scilit]
  85. Wang, Z.H.; Huang, J.L.; Jiang, G.C.; Ji, T.; Lin, H.; Mu, L.W.; Zhu, J.H. Quantification of Pore Connectivity in Hierarchically Porous Carbon by Percolation Effect Integrated Differential Hysteresis Scanning. Chem. Mater. 2025, 37, 1337–1348. [Google Scholar] [CrossRef] [Scilit]
  86. Taheri, P.; Lang, J.C.; Kenvin, J.; Kroll, P. Differential hysteresis scanning of non-templated monomodal amorphous aerogels. Phys. Chem. Chem. Phys. 2021, 23, 5422–5430. [Google Scholar] [CrossRef] [Scilit]
  87. Toncon-Leal, C.F.; Villaroel-Rocha, J.; Silva, M.T.P.; Braga, T.P.; Sapag, K. Characterization of mesoporous region by the scanning of the hysteresis loop in adsorption-desorption isotherms. Adsorption 2021, 27, 1109–1122. [Google Scholar] [CrossRef] [Scilit]
  88. De Boer, J.H. The Shapes of Capillaries. In The Structure and Properties of Porous Solids; Everett, D.H., Stone, F.S., Eds.; Butterworths Scientific Publications: London, UK, 1958; p. 68. [Google Scholar]
  89. Detcheverry, F.; Kierlik, E.; Rosinberg, M.L.; Tarjus, G. Mechanisms for Gas Adsorption and Desorption in Silica Aerogels:  The Effect of Temperature. Langmuir 2004, 20, 8006–8014. [Google Scholar] [CrossRef] [Scilit] [PubMed]
  90. Hitchcock, I.; Chudek, J.A.; Holt, E.M.; Lowe, J.P.; Rigby, S.P. NMR Studies of Cooperative Effects in Adsorption. Langmuir 2010, 26, 18061–18070. [Google Scholar] [CrossRef] [Scilit]
  91. Kikkinides, E.S.; Valiullin, R. A new statistical theory for constructing sorption isotherms in mesoporous structures represented by Bethe lattices. J. Phys. Chem. A 2023, 127, 8734–8750. [Google Scholar] [CrossRef] [Scilit] [PubMed]
  92. Sollner, J.; Neimark, A.V.; Thommes, M. Development and application of an advanced percolation model for pore network characterization by physical adsorption. Langmuir 2024, 40, 23146–23168. [Google Scholar] [CrossRef] [Scilit]
  93. Himona, E.; Fletcher, R.S.; Williams, H.E.L.; Rigby, S.P. Pore connectivity and structure-transport relationships in rocks from the Aphrodite gas field. Geoenergy Sci. Eng. 2026, 258, 214311. [Google Scholar] [CrossRef] [Scilit]
  94. Kikkinides, E.S.; Enke, D.; Valiullin, R. Gas sorption characterization of porous materials employing a statistical theory for Bethe lattices. J. Phys. Chem. A 2024, 128, 4573–4587. [Google Scholar] [CrossRef] [Scilit]
  95. Rigby, S.P.; Gladden, L.F. NMR and fractal modelling studies of transport in porous media. Chem. Eng. Sci. 1996, 51, 2263–2272. [Google Scholar] [CrossRef] [Scilit]
  96. Baroncha, G.; Kikkinides, E.S.; Valiullin, R. Accessing structural network features in disordered mesoporous materials via gas sorption measurements. J. Phys. Chem. C 2025, 129, 21197–21206. [Google Scholar] [CrossRef] [Scilit]
  97. Androutsopoulos, G.P.; Salmas, C.E. A New Model for Capillary Condensation−Evaporation Hysteresis Based on a Random Corrugated Pore Structure Concept:  Prediction of Intrinsic Pore Size Distributions. 1. Model Formulation. Ind. Eng. Chem. Res. 2000, 39, 3747–3763. [Google Scholar] [CrossRef] [Scilit]
  98. Schneider, D.; Kondrashova, D.; Valiullin, R. Phase transitions in disordered mesoporous solids. Sci. Rep. 2017, 7, 7216. [Google Scholar] [CrossRef] [Scilit]
  99. Enniful, H.R.N.B.; Schneider, D.; Hoppe, A.; Konig, S.; Froba, M.; Enke, D.; Valiullin, R. Comparative gas sorption and cryoporometry study of mesoporous glass structure: Application of the serially connected pore model. Front. Chem. 2019, 7, 230. [Google Scholar] [CrossRef] [Scilit]
  100. Shiko, E.; Edler, K.J.; Lowe, J.P.; Rigby, S.P. Probing the impact of advanced melting and advanced adsorption phenomena on the accuracy of pore size distributions from cryoporometry and adsorption using NMR relaxometry and diffusometry. J. Colloid Interface Sci. 2012, 385, 183–192. [Google Scholar] [CrossRef] [Scilit]
  101. Shiko, E.; Edler, K.J.; Lowe, J.P.; Rigby, S.P. Probing hysteresis during sorption of cyclohexane within mesoporous silica using NMR cryoporometry and relaxometry. J. Colloid Interface Sci. 2013, 398, 168–175. [Google Scholar] [CrossRef] [Scilit] [PubMed]
  102. Porion, P.; Faugère, A.M.; Levitz, P.; Van Damme, H.; Raoof, A.; Guilbaud, J.P.; Chevoir, F. A NMR investigation of adsorption/desorption hysteresis in porous silica gels. Magn. Reson. Imaging 1998, 16, 679. [Google Scholar] [CrossRef] [Scilit]
  103. Kube, S.A.; Turke, K.; Ellinghaus, R.; Wallacher, D.; Thommes, M.; Smarsly, B.M. Pore size gradient effect in monolithic silica mesopore networks revealed by in-situ SAXS physisorption. Langmuir 2020, 36, 11996–12009. [Google Scholar] [CrossRef] [Scilit]
  104. Rouquerol, F.; Rouquerol, J.; Sing, K. Adsorption by Powders and Porous Solids: Principles, Methodology and Applications; Academic Press: London, UK, 1999. [Google Scholar]
  105. Stauffer, D.; Aharony, A. Introduction to Percolation Theory, 2nd ed.; Taylor & Francis: London, UK, 1992. [Google Scholar]
  106. Stinchcombe, R.B. The branching model for percolation theory and electrical conductivity. J. Phys. C 1973, 6, L1. [Google Scholar] [CrossRef] [Scilit]
  107. Wall, G.C.; Brown, R.J.C. The determination of pore-size distributions from sorption isotherms and mercury penetration in interconnected pores: The application of percolation theory. J. Colloid Interface Sci. 1981, 82, 141–149. [Google Scholar] [CrossRef] [Scilit]
  108. Mason, G. The effect of pore space connectivity on the hysteresis of capillary condensation in adsorption—Desorption isotherms. J. Colloid Interface Sci. 1982, 88, 36–46. [Google Scholar] [CrossRef] [Scilit]
  109. Mason, G. The effect of pore lattice structure on the pore size distributions calculated from sorption isotherms using percolation theory. J. Colloid Interface Sci. 1983, 95, 277–278. [Google Scholar] [CrossRef] [Scilit]
  110. Neimark, A.V. Development of the capillary condensation and desorption theory in mesoporous adsorbents based on the porous structure lattice models. Dokl. Akad. Nauk. SSSR 1983, 273, 384–388. [Google Scholar]
  111. Neimark, A.V. Analysis of capillary condensation and desorption processes by means of percolation theory methods. Colloid J. USSR 1984, 46, 813–819. [Google Scholar]
  112. Zhdanov, V.P.; Fenelonov, V.B.; Efremov, D.K. Determination of pore-size distribution from sorption isotherms: Application of percolation theory. J. Colloid Interface Sci. 1987, 120, 218–223. [Google Scholar] [CrossRef] [Scilit]
  113. Parlar, M.; Yortsos, Y.C. Percolation theory of vapour adsorption-desorption processes in porous materials. J. Colloid Interface Sci. 1988, 124, 162–176. [Google Scholar] [CrossRef] [Scilit]
  114. Parlar, M.; Yortsos, Y.C. Nucleation and pore geometry effects in capillary desorption processes in porous media. J. Colloid Interface Sci. 1989, 132, 425–443. [Google Scholar] [CrossRef] [Scilit]
  115. Ball, P.C.; Evans, R. Temperature dependence of gas adsorption on a mesoporous solid: Capillary criticality and hysteresis. Langmuir 1989, 5, 714–723. [Google Scholar] [CrossRef] [Scilit]
  116. Zgrablich, G.; Mendioroz, S.; Daza, L.; Pajares, I.; Mayagoitia, J.; Rojas, F.; Conner, W.C. Effect of porous structure on the determination of pore size distribution by mercury porosimetry and nitrogen sorption. Langmuir 1991, 7, 779–785. [Google Scholar] [CrossRef] [Scilit]
  117. Seaton, N.A. Determination of the connectivity of porous solids from nitrogen sorption measurements. Chem. Eng. Sci. 1991, 46, 1895–1909. [Google Scholar] [CrossRef] [Scilit]
  118. Liu, H.L.; Zhang, L.; Seaton, N.A. Determination of the connectivity of porous solids from nitrogen sorption measurements. II. Generalization. Chem. Eng. Sci. 1992, 47, 4393–4404. [Google Scholar] [CrossRef] [Scilit]
  119. Liu, H.L.; Zhang, L.; Seaton, N.A. Analysis of sorption hysteresis in mesoporous solids using a pore network model. J. Colloid Interface Sci. 1993, 156, 285–293. [Google Scholar] [CrossRef] [Scilit]
  120. Liu, H.L.; Zhang, L.; Seaton, N.A. Sorption hysteresis as a probe of pore structure. Langmuir 1993, 9, 2576–2582. [Google Scholar] [CrossRef] [Scilit]
  121. Liu, H.L.; Seaton, N.A. Determination of the connectivity of porous solids from nitrogen sorption measurements. III. Solids containing large mesopores. Chem. Eng. Sci. 1994, 49, 1869–1878. [Google Scholar] [CrossRef] [Scilit]
  122. Rajniak, P.; Yang, R.T. A simple model and experiments for adsorption-desorption hysteresis: Water vapor on silica gel. AIChE J. 1993, 39, 773–774. [Google Scholar] [CrossRef] [Scilit]
  123. Vidales, A.M.; Faccio, R.J.; Zgrablich, G. Capillary Hysteresis in porous media. J. Phys.-Cond. Matt. 1995, 7, 3835–3843. [Google Scholar] [CrossRef] [Scilit]
  124. Mann, R.; Yousef, H.N.S.; Friday, D.K.; Mahle, J.J. Interpretation of water isotherm hysteresis for an activated charcoal using stochastic pore networks. Adsorption 1995, 1, 253–264. [Google Scholar] [CrossRef] [Scilit]
  125. LopezRamon, M.V.; Jagiello, J.; Bandosz, T.J.; Seaton, N.A. Determination of the pore size distribution and network connectivity in microporous solids by adsorption measurements and Monte Carlo simulation. Langmuir 1997, 13, 4435–4445. [Google Scholar] [CrossRef] [Scilit]
  126. Rajniak, P.; Soos, M.; Yang, R.T. Unified network model for adsorption–desorption in systems with hysteresis. AIChE J. 1999, 45, 735–750. [Google Scholar] [CrossRef] [Scilit]
  127. Meyers, J.J.; Nahar, S.; Ludlow, D.K.; Liapis, A.I. Determination of the pore connectivity and pore size distribution and pore spatial distribution of porous chromatographic particles from nitrogen sorption measurements and pore network modelling theory. J. Chromat. A 2001, 907, 57–71. [Google Scholar] [CrossRef] [Scilit]
  128. Esparza, J.M.; Ojeda, M.L.; Campero, A.; Dominguez, A.; Kornhauser, I.; Rojas, F.; Vidales, A.M.; Lopez, R.H.; Zgrablich, G. N-2 sorption scanning behavior of SBA-15 porous substrates. Colloids Surf. A 2004, 241, 35–45. [Google Scholar] [CrossRef] [Scilit]
  129. Tsakiroglou, C.D.; Burganos, V.N.; Jacobsen, J. Pore-structure analysis by using nitrogen sorption and mercury intrusion data. AIChE J. 2004, 50, 489–510. [Google Scholar] [CrossRef] [Scilit]
  130. Hoinkis, E.; Röhl-Kuhn, B. Application of percolation theory to the drainage of liquid nitrogen from mesoporous silica xerogel Gelsil 50. Langmuir 2005, 21, 7366–7372. [Google Scholar] [CrossRef] [Scilit]
  131. Ramírez, A.; Sierra, L.; Mesa, M.; Restrepo, J. Simulation of nitrogen adsorption–desorption isotherms. Hysteresis as an effect of pore connectivity. Chem. Eng. Sci. 2005, 60, 4702–4708. [Google Scholar] [CrossRef] [Scilit]
  132. Ramírez, A.; Sierra, L. Simulation of nitrogen sorption processes in materials with cylindrical mesopores: Hysteresis as a thermodynamic and connectivity phenomenon. Chem. Eng. Sci. 2006, 61, 4233–4241. [Google Scholar] [CrossRef] [Scilit]
  133. Soós, M.; Rajniak, P.; Stepánek, F. Percolation models of adsorption-desorption equilibria and kinetics for systems with hysteresis. Colloids Surf. A 2007, 300, 191–203. [Google Scholar] [CrossRef] [Scilit]
  134. Lopez, R.H.; Vidales, A.M.; Ortiz, A.D.; Zgrablich, G. How does a patchy network affect the structure of invading percolation patterns? Colloids Surf. A 2007, 300, 122–128. [Google Scholar] [CrossRef] [Scilit]
  135. Pomonis, P.J.; Armatas, G.S. A Method for the Estimation of Pore Anisotropy in Porous Solids. Langmuir 2004, 20, 6719–6726. [Google Scholar] [CrossRef] [Scilit]
  136. Cimino, R.; Cychosz, K.A.; Thommes, M.; Neimark, A.V. Experimental and theoretical studies of scanning adsorption-desorption isotherms. Colloids Surf. A 2013, 437, 76–89. [Google Scholar] [CrossRef] [Scilit]
  137. Armatas, G.S.; Pomonis, P.J. A Monte Carlo pore network for the simulation of porous characteristics of functionalized silica: Pore size distribution, connectivity distribution and mean tortuosities. Chem. Engng Sci. 2004, 59, 5735–5749. [Google Scholar] [CrossRef] [Scilit]
  138. Ojha, S.P.; Misra, S.; Tinni, L.; Sondergeld, C.; Rai, C. Pore connectivity and pore size distribution estimates for Wolfcamp and Eagle Ford shale samples from oil, gas and condensate windows using adsorption-desorption measurements. J. Pet. Sci. Eng. 2017, 158, 454–468. [Google Scholar] [CrossRef] [Scilit]
  139. Ojha, S.P.; Misra, S.; Tinni, L.; Sondergeld, C.; Rai, C. Estimation of Pore-Network Characteristics and Irreducible Saturations in Wolfcamp and Eagle Ford Shales Using Low-Pressure-Nitrogen-Adsorption/Desorption-Isotherm Measurements. SPE Reserv. Eval. Eng. 2018, 21, 373–391. [Google Scholar] [CrossRef] [Scilit]
  140. Tian, X.; Daigle, H. Permeability prediction from a pore-scale network model constrained by low-pressure nitrogen sorption isotherms. J. Pet. Sci. Eng. 2018, 162, 544–566. [Google Scholar] [CrossRef] [Scilit]
  141. Pinson, M.B.; Zhou, T.; Jennings, H.M.; Bazant, M.Z. Inferring pore connectivity from sorption hysteresis in multiscale porous media. J. Colloid Interface Sci. 2018, 532, 118–127. [Google Scholar] [CrossRef] [Scilit]
  142. Wang, H.S.; Jeulin, D.; Willot, F.; Sorbier, L.; Sorbier, L.; Moreaud, M. Modelling of the microstructure of mesoporous alumina constrained by morphological simulation of nitrogen porosimetry. Colloids Surf. A 2018, 553, 378–396. [Google Scholar] [CrossRef] [Scilit]
  143. Lopez, G.A.L.; Verstraete, J.J.; Sorbier, L.; Glowska, A.; Leinekugel-Le-Cocq, D.; Jolimaitre, E.; Jallut, C. Generation of γ-Alumina Digital Twins Using a Nitrogen Porosimetry Simulation. Ind. Eng. Chem. Res. 2021, 60, 16728–16738. [Google Scholar] [CrossRef] [Scilit]
  144. Ledezma, G.; Verstraete, J.J.; Sorbier, L.; Leinekugel-Le-Cocq, D.; Jolimaitre, E.; Jallut, C. Computational characterization techniques applied to pore network models by using a fast percolation algorithm. Chem. Eng. Sci. 2022, 260, 117812. [Google Scholar] [CrossRef] [Scilit]
  145. Abelly, E.A.; Yang, F.; Ngata, M.R.; Mwakipunda, G.C.; Shanghvi, R.E. A field study of pore-network systems on the tight shale gas formation through adsorption-desorption technique and mercury intrusion capillary porosimeter: Percolation theory and simulations. Energy 2024, 302, 131771. [Google Scholar] [CrossRef] [Scilit]
  146. Margellou, A.; Armatas, G.S.; Kolonia, K.; Pomonis, P.J. Correlation between information entropy and pore connectivity in oxidic materials with random disordered porosity. Phys. Chem. Chem. Phys. 2026, 28, 2575–2584. [Google Scholar] [CrossRef] [Scilit] [PubMed]
  147. Yu, L.; Hsu, W.-L.; Shamin, J.A.; Daiguji, H. Pore network modeling of a solid dessicant for dehumidification applications. Int. J. Heat Mass Trans. 2022, 186, 122456. [Google Scholar] [CrossRef] [Scilit]
  148. Wardlaw, N.C.; McKellar, M. Mercury porosimetry and the interpretation of pore geometry in sedimentary rocks and artificial models. Powder Technol. 1981, 29, 127–143. [Google Scholar] [CrossRef] [Scilit]
  149. Mousa, S.; Novak, V.; Fletcher, R.S.; Kelly, G.; Garcia, M.; Mcleod, N.; Parmenter, C.; Rigby, S.P. Evolution of the pore structure-transport relationship during catalyst reduction and sintering studied by integrated multi-scale porosimetry and multi-modal imaging. Chem. Eng. Sci. 2023, 277, 118880. [Google Scholar] [CrossRef] [Scilit]
  150. Rigby, S.P. The Anatomy of Amorphous, Heterogeneous Catalyst Pellets. Materials 2023, 16, 3205. [Google Scholar] [CrossRef] [Scilit]
  151. Weisberg, M. Simulation and Similarity: Using Models to Understand the World; Oxford University Press: Oxford, UK, 2013. [Google Scholar]
  152. Elliott-Graves, A.; Weisberg, M. Idealisation. Philos. Compass 2014, 9, 176–185. [Google Scholar] [CrossRef] [Scilit]
  153. Mann, R.; Wasilewski, M.C. Towards a fractal computer graphic basis for characterization of catalyst pore structure by image analysis. Chem. Eng. Res. Des. 1990, 68, 177–184. [Google Scholar]
  154. Coppens, M.-O.; Froment, G.F. Diffusion and reaction in a fractal catalyst pore: 1 Geometrical aspects. Chem. Eng. Sci. 1995, 50, 1013–1026. [Google Scholar] [CrossRef] [Scilit]
  155. Coppens, M.-O.; Froment, G.F. Knudsen diffusion in porous catalysts with a fractal internal surface. Fractals 1995, 3, 807–820. [Google Scholar] [CrossRef] [Scilit]
  156. Coppens, M.-O. Characterization of fractal surface roughness and its influence on diffusion and reaction. Colloids Surf. A Physicochem. Eng. Asp. 2001, 187–188, 257–265. [Google Scholar] [CrossRef] [Scilit]
  157. Gheorghiu, S.; Coppens, M.-O. Optimal bimodal pore networks for heterogeneous catalysis. AIChE J. 2004, 50, 812–820. [Google Scholar] [CrossRef] [Scilit]
  158. Vishnyakov, A. Machine Learning in Computational Design and Optimization of Disordered Nanoporous Materials. Materials 2025, 18, 534. [Google Scholar] [CrossRef] [Scilit]
  159. Manitsas, L.; Fanourgakis, G.S. A physically motivated Machine Learning model for accurate gas adsorption predictions in nanoporous materials. Microporous Mesoporous Mater. 2025, 398, 113796. [Google Scholar] [CrossRef] [Scilit]
  160. Park, H.; Yan, X.; Zhu, R.; Huerta, E.A.; Chaudhuri, S.; Cooper, D.; Foster, I.; Tajkhorshid, E. A Generative Artificial Intelligence Framework Based on a Molecular Diffusion Model for the Design of Metal-Organic Frameworks for Carbon Capture. Commun. Chem. 2024, 7, 21. [Google Scholar] [CrossRef] [Scilit]
  161. Osaro, E.; Colón, Y.J. Intelligent screening of porous materials: A review of active-learning approaches in MOF research. Chem. Phys. Rev. 2025, 6, 041307. [Google Scholar] [CrossRef] [Scilit]
  162. Xie, E.; Wang, X.; Siepmann, J.I.; Chen, H.; Snurr, R.Q. Generative AI for design of nanoporous materials: Review and future prospects. Digit. Discov. 2025, 4, 2336–2363. [Google Scholar] [CrossRef] [Scilit]
  163. Datta, J.; Nadimpally, A.; Koratkar, N.; Datta, D. Generative AI for discovering porous oxide materials for next-generation energy storage. Cell Rep. Phys. Sci. 2025, 6, 102665. [Google Scholar] [CrossRef] [Scilit]
  164. Deng, Z.; Sarkisov, L. Engineering Machine Learning Features to Predict Adsorption of Carbon Dioxide and Nitrogen in Metal–Organic Frameworks. J. Phys. Chem. C 2024, 128, 10202–10215. [Google Scholar] [CrossRef] [Scilit]
  165. Barker-Rothschild, D.; Chen, J.; Wan, Z.; Renneckar, S.; Burgert, I.; Ding, Y.; Lu, Y.; Rojas, O.J. Lignin-based porous carbon adsorbents for CO2 capture. Chem. Soc. Rev. 2025, 54, 623–652. [Google Scholar] [CrossRef] [Scilit]
Figure 1. Schematic diagram showing the stages (denumerated) of pore-filling for a through ink-bottle pore (with neck radius r1 indicated by the red arrow) in which there is either (a) pore blocking only, where, because the pore body radius r2 > 2r1, the pore body fills (with condensate indicated in blue) at a higher pressure than the pore neck but they both empty at the same pressure, or (b) advanced condensation and pore blocking, where, because pore body radius r3 < 2r1, both body and neck fill and empty together at the same pressures. Also shown are the corresponding schematic isotherms, with the black arrows indicating condensation (upward pointing arrow) and evaporation (downward pointing arrow) steps. The schematic isotherm in part (b) looks like that for a single regular pore, even though it is actually an ink bottle.
Surfaces 09 00020 g001
Figure 2. Schematic diagram showing how CXT reveals micron-sized voids (denoted “bubble pores”) in the roughly spherical spray-dried (SD) feed particles for a tableted, cylindrical catalyst pellet, which become highlighted by entrapped mercury following porosimetry (data shown top left) on the pellet. The red arrow indicates where the bubble pore was filled with mercury on intrusion. The blue arrow indicates the bubble pores that are left unfilled with condensate at the top of a conventional isotherm but are filled at the top of the overcondensation (OC) isotherm for an empty sample. The green arrow indicates the top of the conventional and OC isotherms obtained after some of the bubble pores have been filled with entrapped mercury. (Reprinted from [31] under Creative Commons CC-BY License).
Surfaces 09 00020 g002
Figure 3. Grand canonical Monte Carlo snapshots depict N2 adsorption in the BET–Rouquerol monolayer for (A) a nanoporous carbon with uniform micropores and (B) a nanoporous carbon with a complex micro-mesoporous structure at 77.4 K (solid is gold). Blue spheres indicate N2 within 0.5 nm of the pore wall (geometric monolayer), while pink spheres represent N2 beyond this region. In Panel (B), the dense filling of nanopore regions with liquid-like N2 demonstrates how the BET–Rouquerol method overestimates monolayer capacity due to cooperative pore-filling effects. (Reprinted from [62] under Creative Commons CC-BY Licence).
Surfaces 09 00020 g003
Figure 4. (A) The desorption scanning curve for all pores (solid purple line) and pores that became filled with entrapped mercury (open purple squares) for sol–gel silica denoted S1. Arrows have been added to indicate the direction of the change in pressure. (B) Adsorption scanning curve for all pores (solid purple line) and pores that became filled with entrapped mercury (open purple diamonds) for S1. Arrows have been added to indicate the direction of the change in pressure. The blue circles are the boundary isotherms. Reprinted from [77] with permission from Elsevier.
Surfaces 09 00020 g004
Figure 5. A pore model where pore size C > B > A, and a gas sorption process is also shown. Condensed gas is shown by the line shading, and entrapped mercury is shown by the solid grey shading. Advanced condensation in pores B and C initiated from pore A means that the hysteresis has apparent single-pore form, and the scanning curves are crossing as in Figure 4. The pressure of the system is shown as P0 or P1, where P1 > P0. Reprinted from [77] with permission from Elsevier.
Surfaces 09 00020 g005
Figure 6. (a) Two-dimensional radial slice CXT images of whole fresh spray-dried pellet following mercury intrusion to a range of pressures. (b) Segmented 3D reconstruction CXT images of a partially mercury intruded fresh SD feed pellet up to 10,800 Psia. The scale bar corresponds to 1000 μm. (Reprinted from [31] under Creative Commons CC-BY Licence).
Surfaces 09 00020 g006
Figure 7. (a) Upper part of hysteresis loop region of conventional sorption isotherms for empty SD feed pellet sample and SD sample following mercury intrusion to 10,800 psia, together with overcondensation boundary desorption isotherms for empty SD sample, and SD samples following mercury intrusion to 10,800 and 14,700 psia. (b) Hysteresis loop region of conventional sorption isotherms for empty SD feed pellet sample and overcondensation boundary desorption isotherms for empty SD sample, and SD samples following mercury intrusion to 21,000 and 30,000 psia. (Reprinted from [31] under Creative Commons CC-BY License).
Surfaces 09 00020 g007
Figure 8. (a) Two-dimensional radial slice CXT images of whole, high-density, roll compacted (RC) pellet following mercury intrusion to the range of pressures indicated. (b) Segmented 3D reconstruction CXT images of a partially mercury intruded fresh RC feed pellet up to 8600 Psia. The green circle indicates a region of a fractal dendritic arrangement of entrapped mercury. The scale bar corresponds to 1000 μm. (Reprinted from [31] under Creative Commons CC-BY License).
Surfaces 09 00020 g008
Figure 9. Plot of Equation (2) (dashed line) for experimental gas sorption data for SD (orange ●), low-density RC (red ■), and high-density RC (grey ■) feed pellets.
Surfaces 09 00020 g009
Table 1. Comparison of common adsorbates for gas sorption characterization of disordered porous solids.
AdsorbateQuadrupole Moment aTypical Isotherm Temperature (T)Key AdvantagesLimitations
Nitrogen
(N2)
−4.777 K
  • Vast comparative database available [8];
  • Covers micro-, meso-, and macropore ranges in one run, including overcondensation;
  • Low cost and readily available.
  • Quadrupole orients on polar surfaces (e.g., oxides), distorting BET area and PSD [9];
  • Slow equilibration in ultramicropores due to low temperature.
Argon (Ar)087 K
  • No quadrupole; interaction is purely dispersive (van der Waals);
  • Distinct wetting behavior helps detect network effects;
  • IUPAC recommended for micropores [10].
  • Significantly more expensive than N2;
  • Can interact with strong surface acidity sites.;
  • Requires 87 K (liquid Ar); 77 K adaptation introduces thermodynamic uncertainty.
Carbon Dioxide (CO2)−14.3273 K
  • High T allows fast diffusion into ultramicropores (<0.7 nm);
  • Can probe mesopores if high-pressure equipment (>1 bar) is used [11].
  • Strong quadrupole interacts heavily with surface heterogeneity;
  • Hysteresis at 273 K is complex to model; often requires Monte Carlo over standard DFT.
a Values in units of × 10−40 C m2. A value of 0 indicates no permanent quadrupole moment. Data sourced from Buckingham et al. [12] and Graham et al. [13].
Table 2. Characteristics of spray-dried (SD) and roll-compacted (RC) feed catalyst pellets [31,32].
SamplePorosity (%)Bulk Density (g/cm3)BET Area (m2/g)Cylinder Dimension (Diameter × Height)
High-density SD47%2.20965.5 × 3.4 mm
RC48%2.30885.6 × 3.5 mm
Low-density SD55%1.93895 × 5 mm
Disclaimer/Publisher’s Note: The statements, opinions and data contained in all publications are solely those of the individual author(s) and contributor(s) and not of MDPI and/or the editor(s). MDPI and/or the editor(s) disclaim responsibility for any injury to people or property resulting from any ideas, methods, instructions or products referred to in the content.