Article

Co-Effect of pH Control Agent and pH Value on the Physical Properties of ZnO Thin Films Obtained by Chemical Bath Deposition for Potential Application in Dye-Sensitized Solar Cells

by
Alphonse Déssoudji Gboglo
1,2,
Mazabalo Baneto
1,2,*,
Komlan Segbéya Gadedjisso-Tossou
1,3,
Ognanmi Ako
1,2,
Ayayi Claude Ahyi
4,5,
Muthiah Haris
6,
Muthusamy Senthilkumar
6,
Kekeli N’konou
7,
Bruno Grandidier
7,
Katawoura Beltako
1,3,
Komi Apélété Amou
1,2 and
Milohum Mikesokpo Dzagli
1,3
1
Centre d’Excellence Régional pour la Maîtrise de l’Electricité (CERME), University of Lomé, Lomé 01BP 1515, Togo
2
Laboratory on Solar Energy, Department of Physics, Faculty of Sciences, University of Lomé, Lomé 01BP 1515, Togo
3
Physics of Semiconductor Materials and Components Laboratory, Department of Physics, Faculty of Sciences, University of Lomé, Lomé 01BP 1515, Togo
4
Physics Department, Auburn University, Auburn, AL 36849, USA
5
National Coalition of Independent Scholars, Battleboro, VT 05301, USA
6
School of Arts and Natural Sciences, Joy University, Raja Nagar, Vadakangulam, Near Kanyakumari, Tirunelveli District 627116, Tamil Nadu, India
7
University of Lille, CNRS, Centrale Lille, Polytechnique Hauts-de-France, Junia-ISEN, UMR 8520 -IEMN, F-59000 Lille, France
*
Author to whom correspondence should be addressed.
Surfaces 2025, 8(3), 46; https://doi.org/10.3390/surfaces8030046
Submission received: 8 May 2025 / Revised: 31 May 2025 / Accepted: 1 June 2025 / Published: 1 July 2025
(This article belongs to the Special Issue Surface Engineering of Thin Films)

Abstract

This study presents the influence of pH control agents and pH value on the physical properties of ZnO thin films obtained by chemical bath deposition. ZnO thin films were synthesized on glass substrates using precursor solutions of different pHs prepared from two bases: sodium hydroxide (NaOH) and ammonia (NH3). The effect of pH values on the morphological, structural, and optical properties of ZnO thin films was investigated using X-ray diffraction (XRD), scanning electron microscopy (SEM), Fourier transform infrared spectroscopy (FTIR), and UV–Visible spectroscopy. XRD results showed that all the synthesized ZnO thin films are polycrystalline and crystallize in a hexagonal wurtzite structure. The crystallite size, calculated using the Debye–Scherrer formula, varied from 10.50 nm to 11.69 nm for ZnO thin films obtained with NH3 and from 20.79 nm to 27.76 nm for those obtained with NaOH. FTIR analysis confirmed the presence of functional groups. SEM images indicated that not only the base but also the pH affects the morphology of the films, giving rise to different granular shapes. Overall, the ZnO thin films obtained with NaOH looked more mesoporous compared to those obtained with NH3. Optical characterization results showed that whatever the base used, the pH of the precursor solution affected the ZnO thin film transmittance. Films synthesized with NH3 exhibited the best transmittance (80%) at pH 8.5, while the best transmittance (81%) of films synthesized with NaOH was obtained at pH 8 in the visible region. Based on optical and morphological properties, ZnO films obtained from NH3 at pH 8.5 are found to be more suitable as photoanodes in dye-sensitized solar cells.

1. Introduction

Dye-sensitized solar cells (DSSCs) are third-generation solar devices that convert light energy into electricity with dyes as active materials. They hold great promise as a low-cost, biocompatible, and non-toxic solution to various environmental and energy challenges [1]. DSSCs are made up of key components such as a photoanode, a dye, an electrolyte, and a cathode. The efficiency of the cell depends on the characteristics of each component [2]. The current focus of DSSCs research revolves mainly around improving light absorption capacity by modifying the dye and improving electric charge carriers collection through adjustments to the electrolyte [3]. In addition, efforts are being made to optimize electron transfer by improving the optical and electrical properties of the electrodes [3].
The most popular DSSC photoanode material is titanium dioxide ( TiO 2 ) [4]. However, it has been shown to be a suboptimal material for charge carrier generation and collection [5,6]. Zinc oxide (ZnO) is an attractive alternative, potentially offering improvement on these and other issues. Both TiO 2 and ZnO have similar electron affinities and band-gap energies, around 3.2 eV and 3.3 eV, respectively [7,8]. However, ZnO has a significantly higher electron diffusivity than TiO 2 [9]. It also has a high electron mobility of 205 cm 2 V 1 s 1   [10], which facilitates efficient electron transport in the semiconductor and reduces recombination rates. Moreover, ZnO has a high exciton binding energy of 60 meV and demonstrates excellent stability against photocorrosion [11,12]. ZnO can be easily synthesized in various morphologies and offers a wide range of possibilities for the design of photoanodes in DSSCs [13,14,15]. Compared to TiO 2 -based DSSCs, ZnO-based DSSCs are expected to have reduced recombination reactions. However, they have not yet reached the efficiency levels of the best TiO 2 devices due to less favorable interfacial energy level alignment and charge carrier collection challenges [13,16].
To address this issue, many studies have focused on different ZnO nanostructures for DSSCs [17]. The morphological characteristics of a semiconductor, including porosity, surface area, pore size, particle diameter, particle shape, and surface facets, play a crucial role in determining the electron diffusion coefficient within the semiconductor and dye adsorption at its surface. Previous studies have revealed that the main factor determining DSSC performance is the dye coverage, which is related to differences in morphology and texture of the host semiconductor matrix [13,17]. Structural modification of ZnO films has been shown to improve charge carrier collection efficiency. Therefore, introducing ZnO mesoporous thin films will enable DSSC to improve absorption by the dyes [13,14].
ZnO thin films have been synthesized using different physical and chemical methods, including physical vapor deposition [18], magnetron sputtering [19], chemical vapor deposition [20], hydrothermal method [21], doctor blade method [22], sol–gel method [23], electrodeposition [24], sonochemical method [25], spray pyrolysis method [7] and chemical bath deposition (CBD) [26,27]. Among these techniques, CBD receives excellent attention due to its significant advantages, such as low-cost, simple methods, and ability to provide large-scale processing for semiconductor devices [28]. However, the final properties of ZnO thin films, such as porosity, morphology, and pore size, are highly dependent on the synthesis conditions, particularly the pH of the chemical bath solution [26,29]. The amount of H + and OH ions in the chemical bath solution plays an important role in controlling the film morphology because this ratio between H + and OH ions affect polymerization of the metal–oxygen bonds during the synthesis [30].
Numerous studies have demonstrated the influence of pH on ZnO nanostructure synthesis and properties. For instance, Vernardou et al. [31] found that pH significantly affects the morphology of ZnO nanostructures, shifting from rod-shaped to prism- and flower-shaped structures. Abdulrahman et al. [32] observed substantial changes in the morphology and optical properties of ZnO nanostructures by adjusting the pH of the growth solution. Narasimha Murthy et al. [29] highlighted the importance of pH control in the fabrication of ZnO thin films by showing that higher pH levels increase the grain size and the optical transparency. Finally, Garcia-Barrientos et al. [33] demonstrated that the small spherical sheets of micro-flower composed of the sheet structure were changed with increased pH values. Although these previous studies have highlighted the critical role of pH, ZnO nanostructures have primarily been synthesized under basic conditions (pH 8–12). However, the question remains: which specific pH values, combined with the chemical nature of the base, are most favorable for synthesizing nanostructured ZnO thin films suitable for photovoltaic applications? Moreover, many of these studies have focused on nanostructures or thick films, often neglecting the combined influence of base type and pH on the synthesis of compact and transparent thin films, which are essential for photovoltaic applications.
In this context, the present work proposes a comparative study of the combined effect of pH and pH-controlling agents (sodium hydroxide or ammonia) on the structural, morphological, and optical properties of ZnO thin films synthesized by CBD. By systematically varying the pH of the precursor solution using two chemically distinct bases, this study aims to elucidate the joint influence of pH level and base type on film quality. This approach provides deeper insights into the growth mechanisms and helps identify optimal synthesis conditions for synthesizing ZnO thin films suitable for potential application in DSSCs.

2. Materials and Methods

2.1. Materials and Reagents

In this study, microscope glass slides were used as substrates to synthesize the different ZnO thin films. All the chemicals, such as zinc nitrate hexahydrate Zn N 2 O 6 .6 H 2 O and hexamethylenetetramine (HMTA) CH 2 6 N 4 , were purchased at ISOCHEM (Princeton, NJ, USA). Ammonia solution [ NH 3 ] (30%) and sodium hydroxide [NaOH] pellets were supplied by SIGMA-ALDRICH MERCK GROUP (Burlington, MA, USA). Ethanol   C 2 H 6 O , acetone   CH 3 2 CO , and distilled water were used during the present research work. All analytical grade (AR) chemicals have a purity above 99% and were utilized without further treatment.

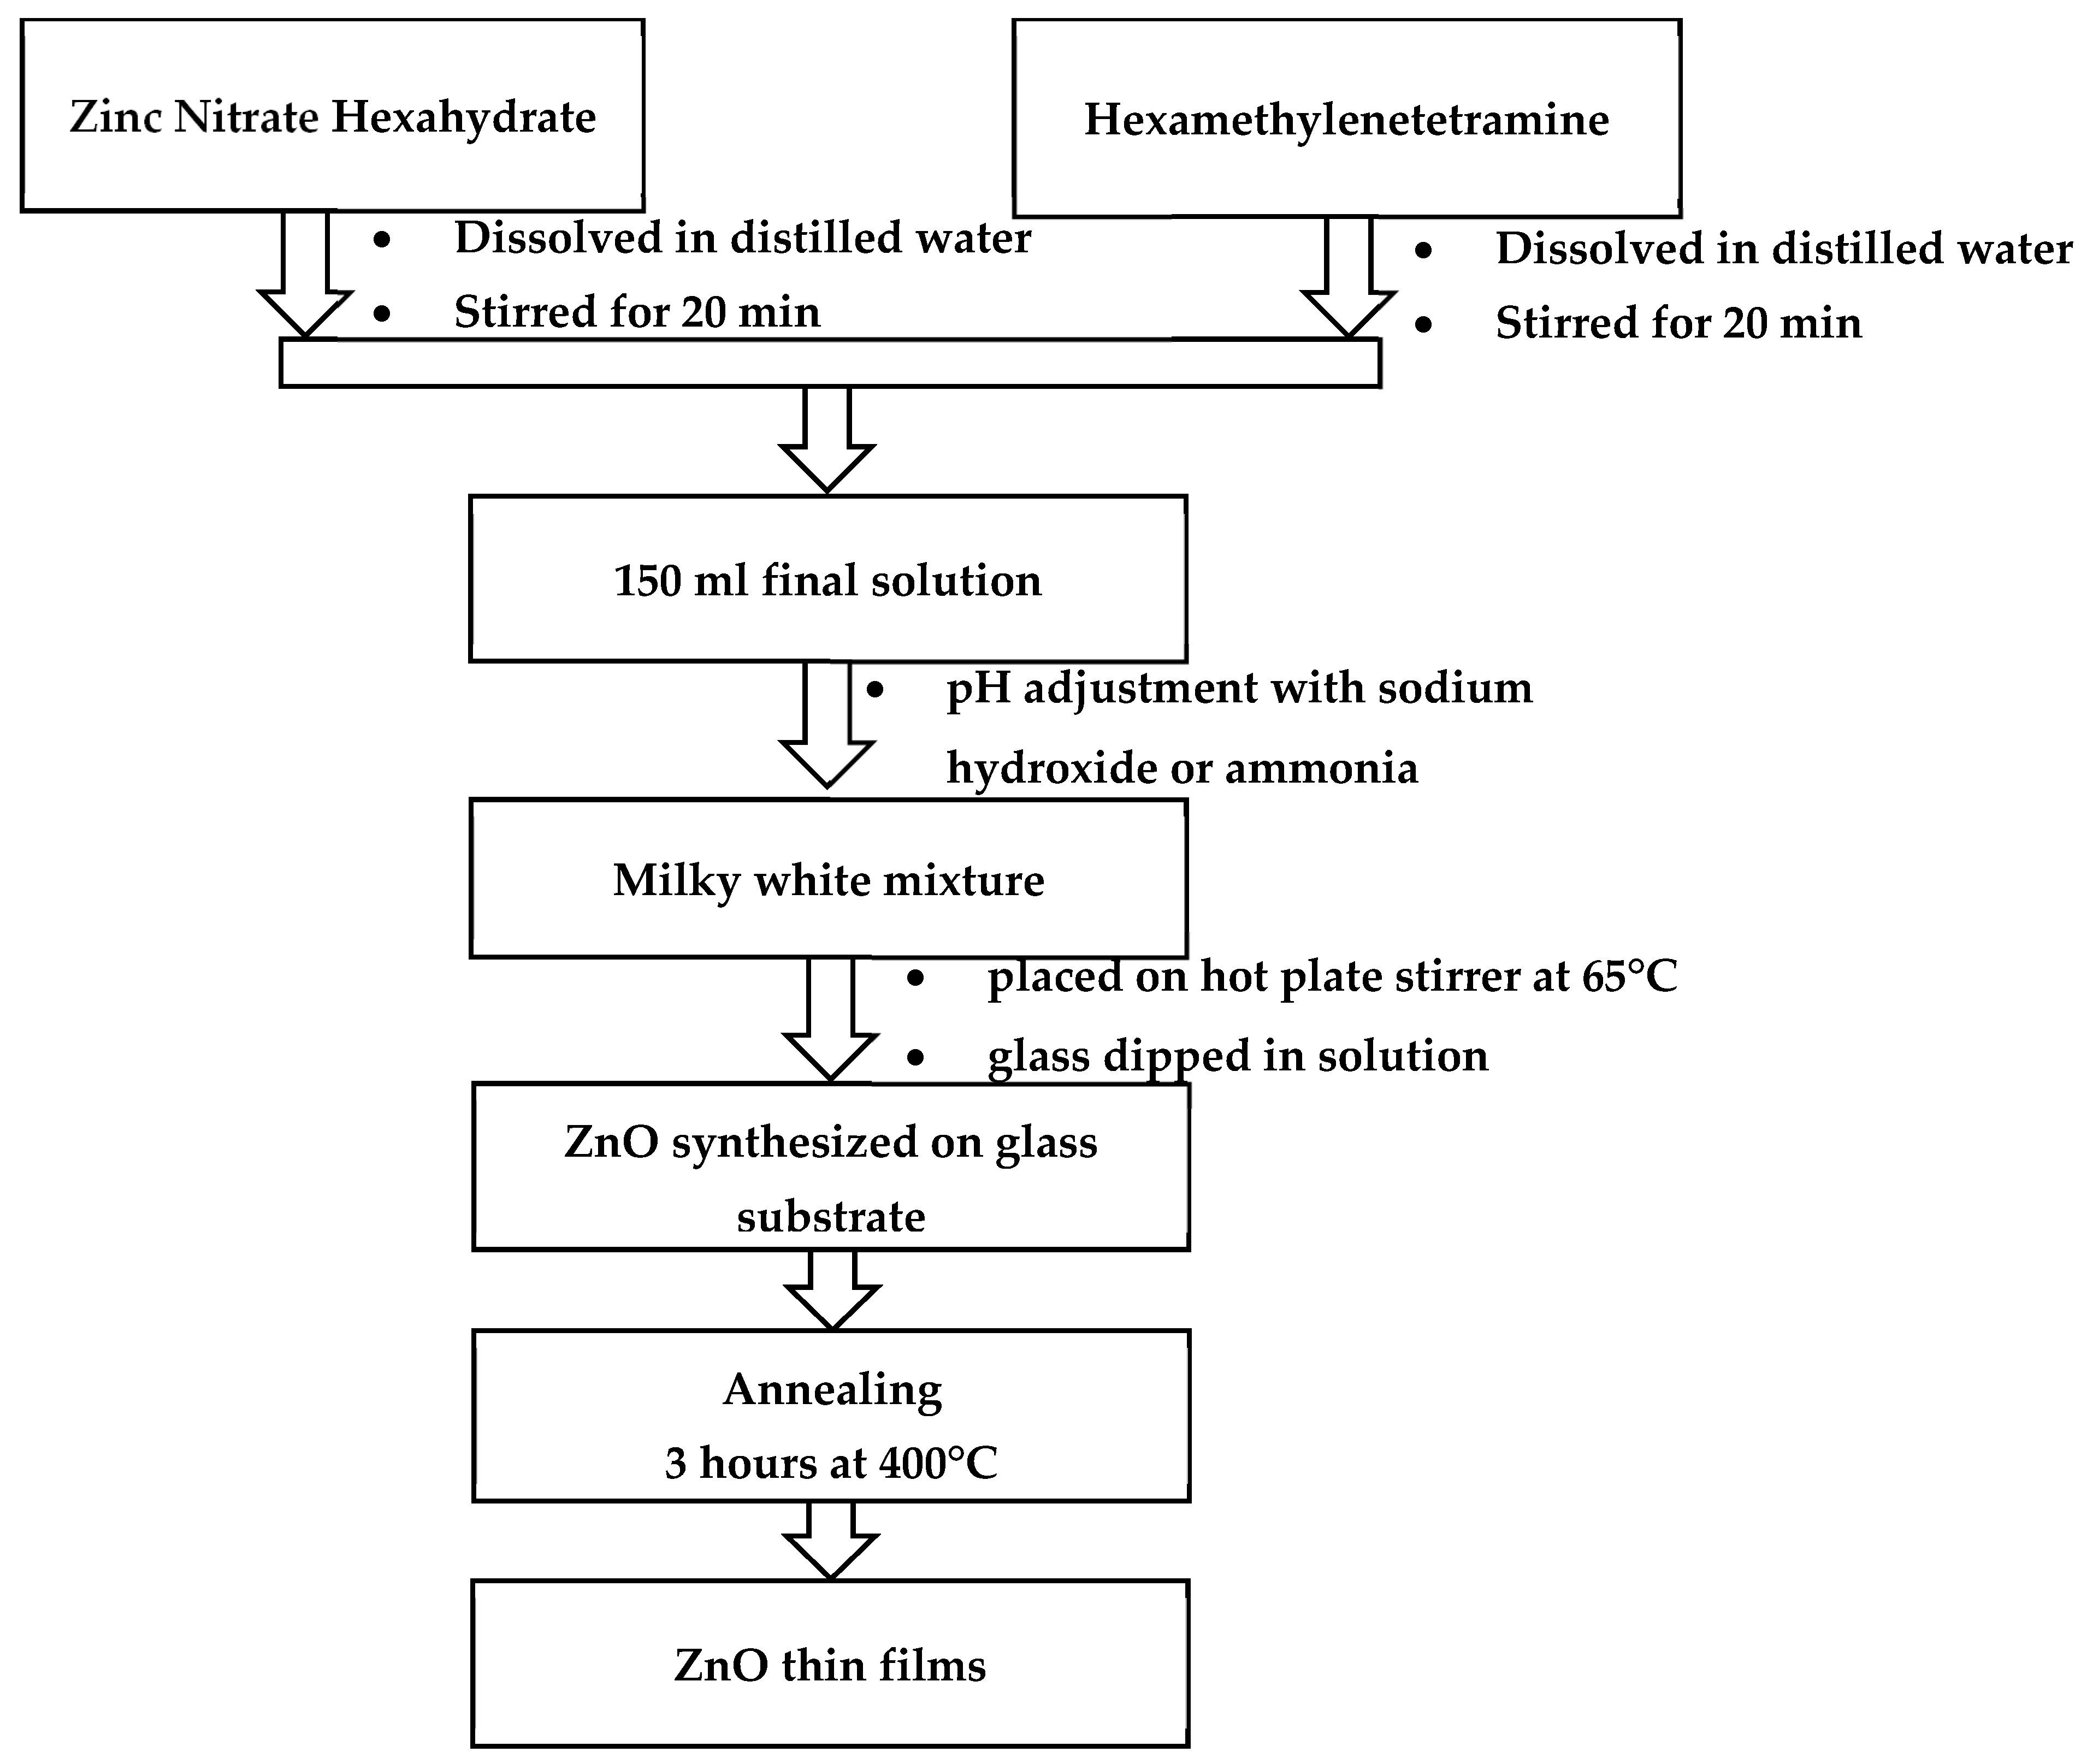
2.2. Synthesis of ZnO Thin Films

ZnO thin films were synthesized by CBD. The bath solution is an equimolar mixture of an aqueous solution of HMTA and an aqueous solution of zinc nitrate hexahydrate. The first step in the deposition process consisted of cleaning the glass substrates with an ultrasonic cleaner using acetone, ethanol, and distilled water for 15 min successively and then drying them under nitrogen gas ( N 2 ). This process produces a clean surface necessary for the formation of the nuclear centers, which initiate the growth of nano-crystallites. The second step in the synthesis process was to prepare complex solutions of zinc nitrate hexahydrate and HMTA, which were used as precursors with distilled water as a solvent.
Figure 1 outlines the complete process of ZnO thin film synthesis. The 0.1M solutions of both zinc nitrate hexahydrate and HMTA were prepared separately and then mixed. To investigate the effect of different pH values on the properties of ZnO thin films, the samples were prepared at pH ranging from 8 to 11 using NH 3 solution and NaOH solution as pH adjusting agent. As a result of the mixing, the complex solution became milky white. It is worth mentioning that in the case of NH3, we observed that above pH 9.5, this white precipitate necessary for ZnO thin film formation disappeared, resulting in a clear solution. So, it was not possible to synthesize ZnO thin films with NH3 above pH 9.5. In contrast, with NaOH, the white precipitate remains present and reactive up to pH 11, allowing exploration of a wider pH range. Therefore, different pH ranges were selected depending on the pH-controlling agent used: with NH3, the pH was set at 8, 8.5, 9, and 9.5, while with NaOH, it was adjusted to 8, 9, 10, and 11. The narrower pH range used with NH3 was chosen to provide a more detailed understanding of how the physical properties of the synthesized ZnO thin films evolve near the threshold pH, beyond which film synthesis is no longer feasible due to the disappearance of the necessary precipitate. The resulting solution was stirred using a hot plate magnetic stirrer to obtain a homogeneous solution. The previously cleaned substrates were then immersed vertically in the solution so that they did not touch the sides of the beaker. The bath temperature and deposition time were maintained at 65 °C and 20 min, respectively. An alcohol thermometer was used to check the temperature, and the deposition time was determined using a stopwatch. Finally, the resultant thin films were removed from the bath at the end of the synthesis process. The synthesized films were dried first in air and then annealed at 400 °C for 3 h. The samples prepared at pH 8, 8.5, 9, and 9.5 using NH 3 solution were named NH3_8, NH3_8.5, NH3_9, and NH3_9.5, respectively. Similarly, the samples prepared at pH 8, 9, 10, and 11 using NaOH solution were named NaOH_8, NaOH_9, NaOH_10, and NaOH_11, respectively.

2.3. ZnO Thin Films Characterization

The structural properties of the synthesized ZnO thin films were investigated using an X-ray Diffractometer system (EMPYREAN and RIGAKU models) with a CuKα wavelength of λ = 1.54059 Å , scanning in the 2θ range from 10° to 90°. The diffractometer reflection was taken at room temperature. Surface morphology was studied using a ZEISS EVO 18 models scanning electron microscope (SEM), performed with a 10 kV operating voltage. The samples were carbon-coated to improve conductivity due to the glass substrates. The optical properties of ZnO thin films were measured at room temperature using a UV–Visible spectrometer (model Perkin-Elmer Lambda 800) with a scanning range from 300 nm to 900 nm. The specific functional groups present in ZnO films were examined using an FTIR spectrophotometer (model Perkin-Elmer Spectrum 3, Massachusetts, USA) equipped with an attenuated total reflectance (ATR) accessory. The results were obtained by maintaining the transmission mode between 400 and 4000 cm 1 with a spectral resolution of 4 cm 1 . The data shown in this study consists of an average of 10 scans.

3. Results and Discussions

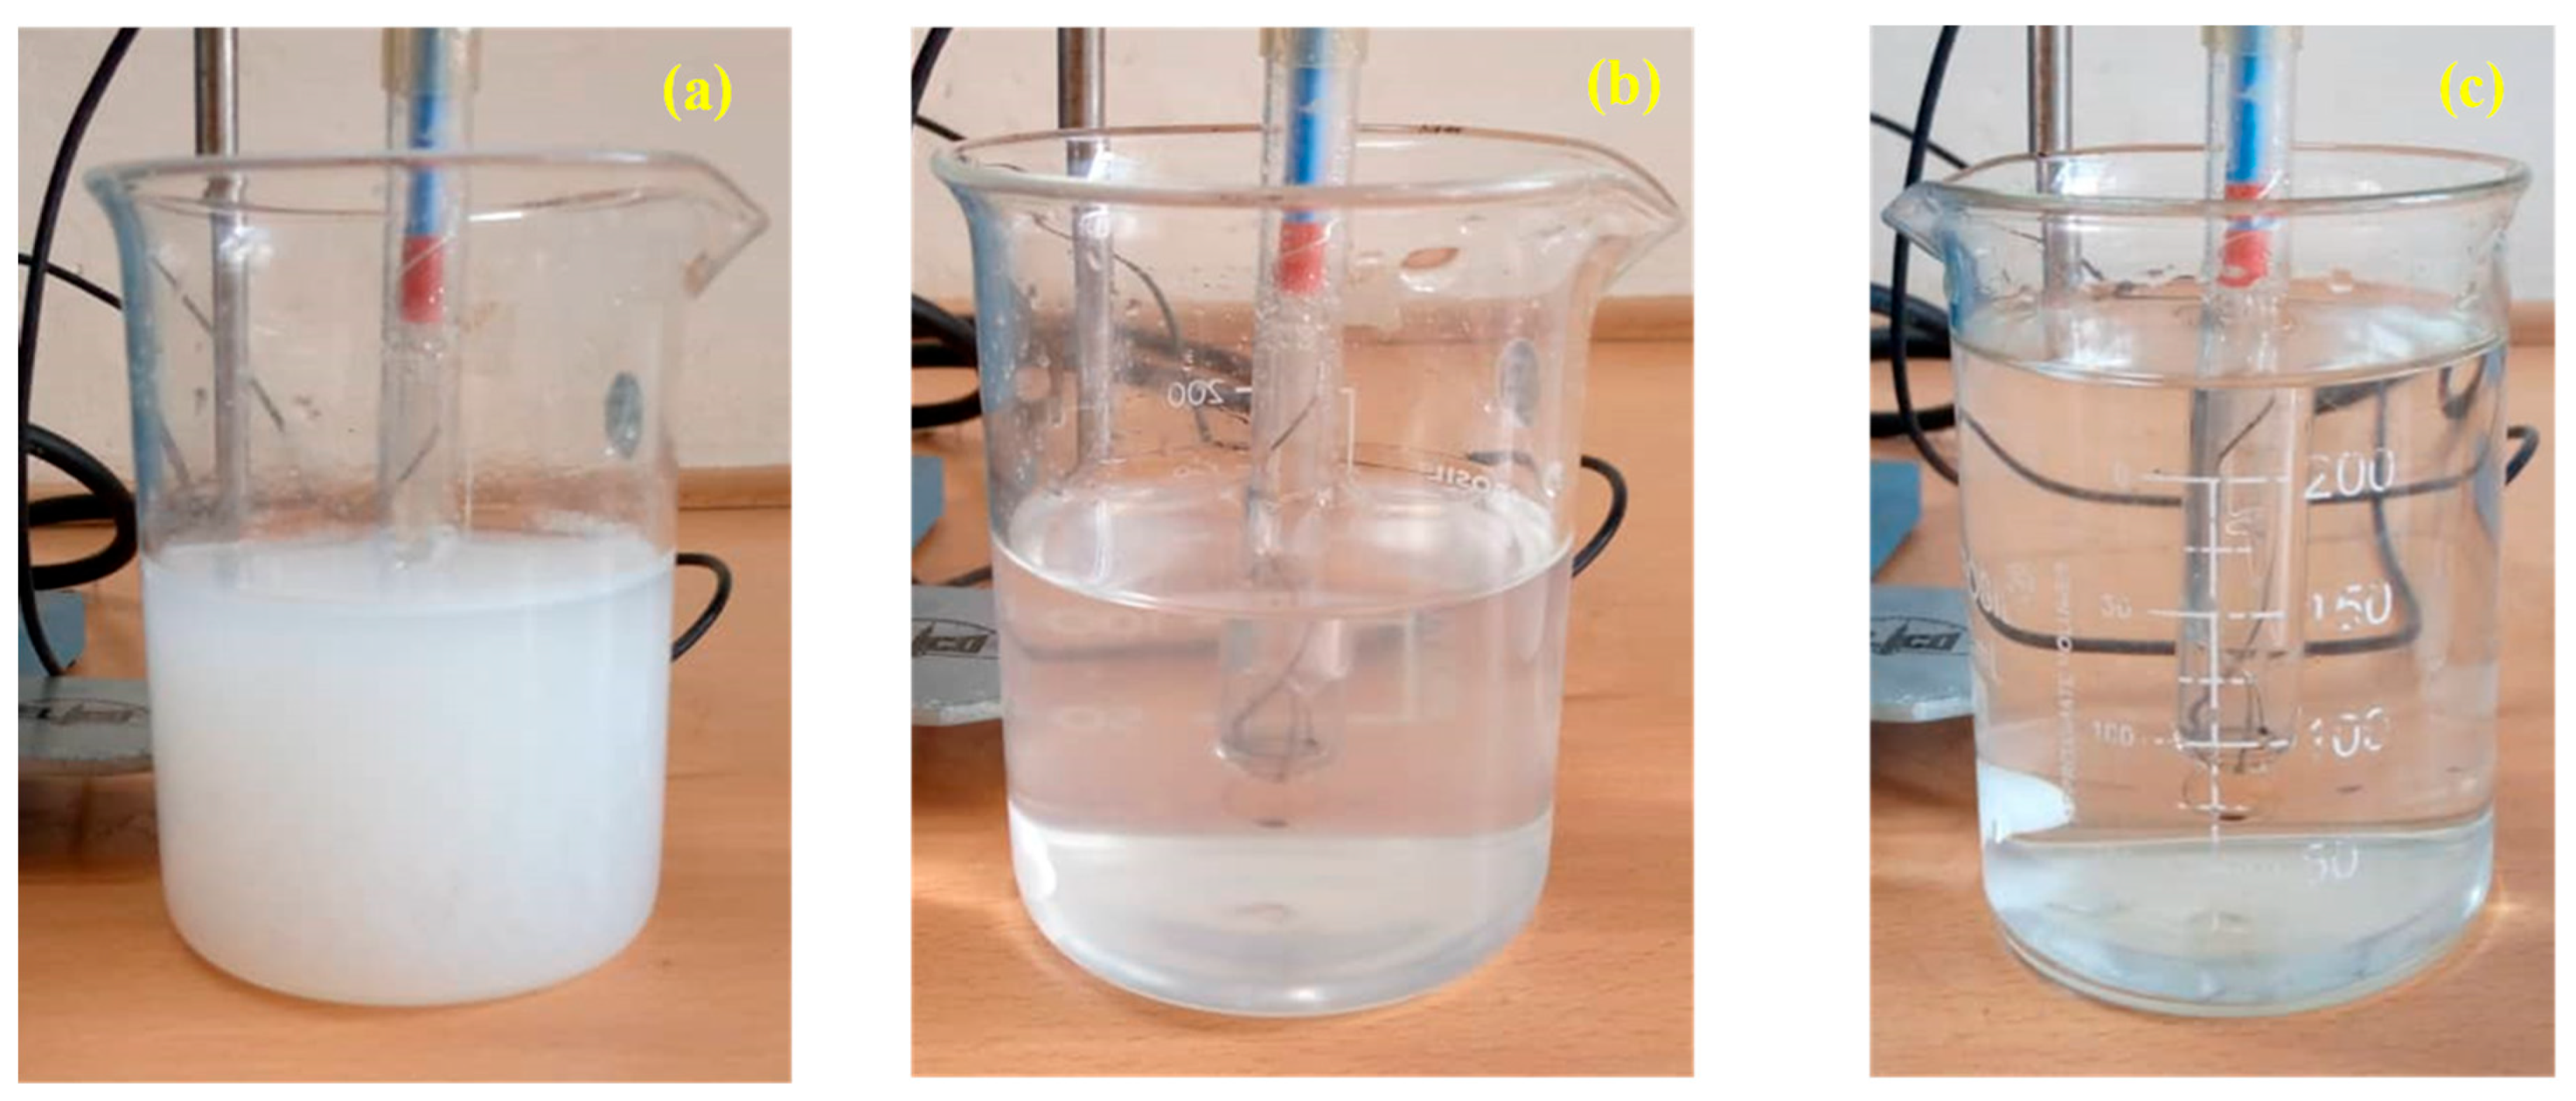
3.1. Impact of Ammonia on pH Adjustment

The objective was to study the effect of pH values ranging from 8 to 11 on ZnO thin film properties. However, in ammonia solutions, when the pH exceeded 9.5, the milky white precipitate necessary for synthesis disappeared (Figure 2), preventing the formation of ZnO thin films.
As can be seen in Figure 2a, for a solution with a pH lower than 9.5, the solution is whitish due to the formation of Z n O H 2 in the solution [34]. According to Rai et al. [35,36], when the pH value of the deposition solution is less than 9, the following chemical reactions are carried out:
N H 3 + H 2 O N H 3 . H 2 O N H 4 + + O H
Z n 2 + + 4 O H Z n O H 4 2
Z n O H 4 2 Z n O H 2 + 2 O H
Z n O H 2 Z n O + H 2 O
As more NH 3 is added, the solution becomes clear. When the pH value of the deposition solution is more than 9, the following chemical reactions take place:
N H 3 + H 2 O N H 3 . H 2 O N H 4 + + O H
Z n 2 + + 4 N H 3 Z n N H 3 4 2 +
Z n N H 3 4 2 + + 2 O H Z n O + 4 N H 3 + H 2 O
According to the above chemical reactions, Z n ( N H 3 ) 4 2 + is the intermediate chemical reaction. So, the disappearance of the white precipitate is caused by the disappearance of the ( Z n O H 2 ) species, which makes the solution clear and transparent at pH > 9.5.
It therefore appears that ZnO thin films crystallized from the chemical reaction that occurred between Z n ( N H 3 ) 4 2 + , OH , and Z n O H 4 2   as described in the above chemical reactions. It can be concluded that adjustment of the pH value of the solution affects the ZnO thin film synthesis process.

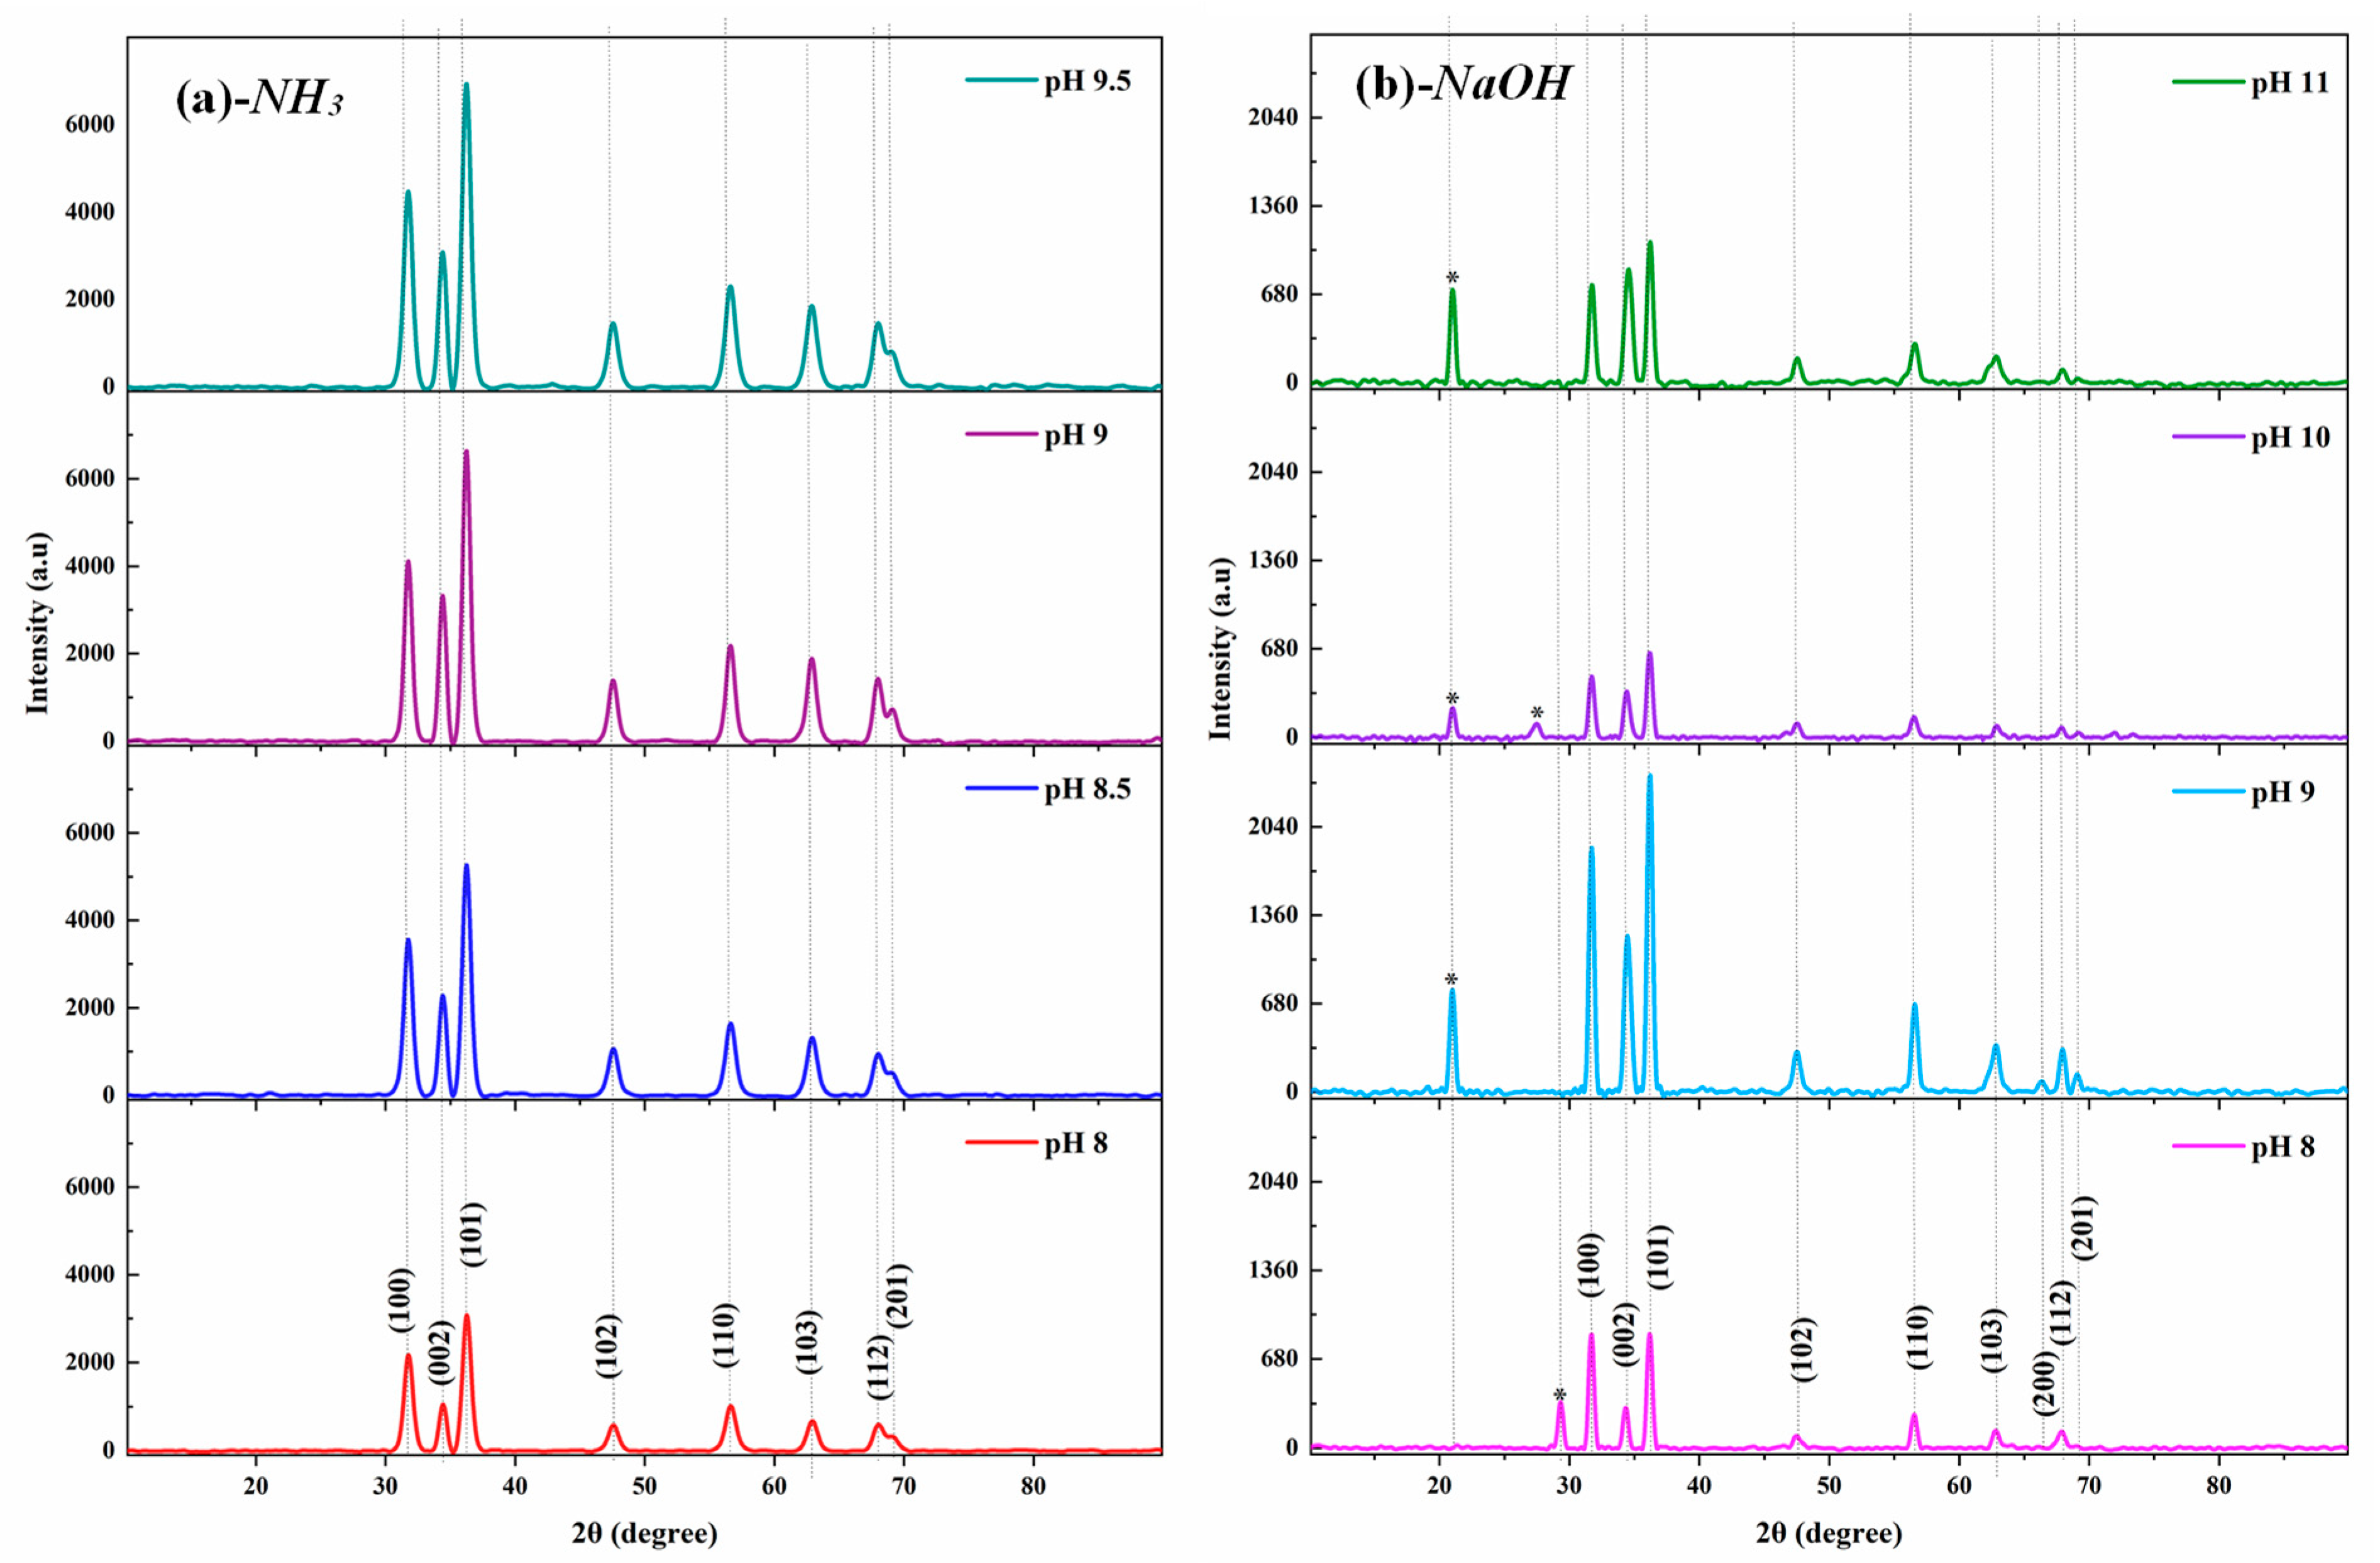
3.2. Structural Characterization

Figure 3 shows the XRD spectra of ZnO thin films for different pH values, using NH 3 (Figure 3a) and NaOH (Figure 3b) as pH-controlling agents. All the diffraction peaks at angles (2θ) of 31.4°, 34.1°, 35.9°, 47.1°, 56.2°, 62.5°, 66.1°, 67.7°, and 68.9° are indexed to the (100), (002), (101), (102), (110), (103), (200), (112), and (201) diffractions planes, respectively. The detected planes correspond to the wurtzite ZnO hexagonal P6(3)mc structure, according to JCPDS card 36-1451 [37].
Moreover, Figure 3a shows that within the detection limit of X-ray diffraction, no other peaks related to impurities appear on the samples obtained using NH 3 at different pH values, confirming that the films synthesized are pure ZnO. On the other hand, Figure 3b shows that impurities diffraction peaks are recorded around 21° and 29° (depending on the pH) for all samples using NaOH. Based on the database of the Match software, these peaks are caused by the additional phase of sodium hydroxide monohydrated ( NaOH . H 2 O ). According to the phase diagram of NaOH in water [38], this complex is formed between 52 °C and 68 °C. The formation of NaOH . H 2 O may be due to an incomplete dissolution of NaOH [39,40].
To assess the degree of preferential orientation of the crystallites from the peak intensities, the texture coefficient ( T C h k l ) was calculated for the first i3 peaks with the greatest intensity using Equation (8) [41]:
T C h k l = I h k l I 0 h k l 1 n I h k l I 0 h k l
where I h k l are the XRD peak intensities obtained from the films, n the number of diffraction peaks considered, and I 0 h k l are the peak intensities of the XRD reference (JCPDS card 36-1451) of the randomly oriented grains.
Calculation of the orientation rate of crystallites in the (100), (002), and (101) planes from the respective diffraction peaks of all the samples reported in Table 1 shows that the synthesized ZnO thin films are oriented without any preferential direction. These results indicate that all these films are polycrystalline, and the c axis preferred orientation is not significant [41]. The sharp diffraction peaks of ZnO thin films suggest a high crystallinity, as reported in the literature [42,43,44]. Furthermore, we attribute the orientation of the crystallites without a preferred direction to two types of nucleation [45]: homogeneous nucleation and heterogeneous nucleation. Homogeneous nucleation occurs as a result of collisions between ions, forming embryos in solution, whereas heterogeneous nucleation occurs as a result of the reaction between the ions and the substrate. Heterogeneous nucleation therefore leads to the formation of a continuous layer on which anisotropic layer growth occurs as a result of the coalescence of embryos formed in solution.
The lattice parameters (a and c) of the synthesized ZnO thin films were calculated using Equation (9), and the plane d-spacing (d) was estimated according to Bragg’s law (Equation (10)) [46]:
a = 1 3 λ sin θ   and   c = λ sin θ
d = λ 2 sin θ
where   λ is CuKα wavelength ( 1.54059 Å )   and   θ is the diffraction peak angle. The calculated lattice parameters (a and c) and d-spacing values for the dominant peak (101) are almost identical to those reported in the JCPDS card 36-1451 for ZnO [38] (Table 2 and Table 3). This result shows that ZnO thin films were elaborated successfully. In addition, the ratio of lattice parameters ( c a ) is almost constant and approximately equal to 1.60 for all samples. This result is in good agreement with the values of bulk wurtzite and indicates that all the films are highly compact [37].
The internal strains ε a and ε c of the ZnO along the a and c axes, respectively, are evaluated using Equations (11) and (12) [47]:
ε a = a a 0 a 0 × 100 %
ε c = c c 0 c 0 × 100 %
where a 0 = 3.249Å and c 0 = 5.206Å are constants of the standard unconstrained ZnO lattice given by JCPDS card 36-145 [37]. Table 2 and Table 3 show variations in the internal strain values ( ε a and ε c ) of ZnO thin films for different pH values. These variations are due to changes in the interplanar spacing values, probably resulting from lattice mismatch and stacking defects between the synthesized ZnO crystal and the glass substrate [29,47]. It can be seen that internal strains of ZnO thin films obtained from NH 3 are very low compared to those obtained with NaOH. Hence, the ZnO thin films obtained using NH 3 have less deformation than those obtained using NaOH. This difference may be attributed to the presence of impurities generated by NaOH in the ZnO crystallites. In addition, for ZnO films grown from NH 3 , the increase in strain with pH values indicates an increased variability in the crystal lattice quality, which could be attributed to the interaction between OH ions and ZnO precursors during synthesis. Conversely, we observe a continuous decrease in internal strain with increasing pH for ZnO films obtained from NaOH. This indicates a more consistent and controlled crystal growth. It is important to mention that the positive sign of internal strain values corresponds to tensile strain, indicating an expansion of the lattice constants, while the negative sign is associated with compressive deformation, corresponding to a contraction of the lattice constants [48]. All the above observations suggest that the choice of the pH control agent and the pH value itself play a crucial role in shaping the ZnO thin film structure.
The crystallite sizes (D) of the films along the dominant peak (101) were calculated using the Debye–Scherer formula presented by Equation (13) [49]:
D = k λ β cos θ
where k = 0.9, θ is the XRD diffraction peak angle, λ = 1.5406Å is the X-ray wavelength, and β is the full width at half peak (FWHM) in radians.
The dislocation density (δ), which induces the impurities (defects) in the crystal, is estimated by Equation (14) [49]:
δ = 1 D 2
FWHM, crystallite size, and dislocation density values of the films along the dominant peak (101) are listed in Table 2 for samples obtained from NH 3 at different pH values and in Table 3 for samples obtained from NaOH. It can be observed that the use of NH 3 induced the smallest crystallite size (10–11 nm), while NaOH leads to the biggest crystallite size (20–26 nm). Conversely, ZnO films obtained from NaOH exhibit lower dislocation density compared to those obtained from NH 3 . The higher basicity of the solution induced by NaOH in comparison with NH 3 accounts for this result, leading to improved stability. In both cases, the crystallite size increases and then decreases when the pH increases. With NH 3 , the size increases slightly from 10.8 nm to 11.7 nm when the pH increases from 8 to 9. Beyond pH 9, crystallite size decreases to 10.6 nm due to the limitation in the formation of Zn OH 2 species. In contrast, with NaOH, the crystallite size significantly varied with a change in the pH. First, the crystallite size increases from 27.0 nm to 27.8 nm when the pH varies from 8 to 9 and then decreases suddenly from 23.6 nm to 20.8 nm with a further increase in the pH from 10 to 11. It indicates that a high pH affects the film’s crystallinity due to the generation of impurities. This result agrees with the XRD analysis, where the peak intensity decreases beyond a pH value of 9.
Additionally, the dislocation density fluctuated as the pH value changed. These fluctuations in dislocation density values can be attributed to variations in crystal size and inner strain resulting from lattice mismatch between the glass substrate and the ZnO films, as well as the aggregation of nanoparticles at different pH values. This underscores the significant influence of pH on the final products of various nanostructures synthesized in aqueous solutions.
The volume (V) of the hexagonal wurtzite cell and the length (L) of the Zn-O bond are estimated from Equations (15) and (16), respectively [32].
V = 3 2 a 2 c
L = a 2 3 + 1 2 u 2 c 2
where ( u ) is the positional parameter of the wurtzite structure that indicates the extent of atom displacement relative to the following plane in the c axis, as expressed with Equation (17) [32]:
u = a 2 3 c 2 + 0.25
Table 2 and Table 3 show slight variations in the values of length (L) of the Zn-O bond and the volume (V) of the hexagonal wurtzite cell in both cases. This observed variation in the values of (V) and (L) is due to changes in the position of the peaks (), as both depend directly on the lattice parameters (a and c). It reveals modifications in the crystal structure of ZnO, influenced by the pH conditions of the growth solution. Since the position of the peaks () is sensitive to changes in lattice dimensions, any variation in the values of (a) and (c) is reflected in the length and volume of the formed ZnO crystals [47].

3.3. Morphological Properties

The surface morphologies of the synthesized samples were characterized by SEM, as depicted in Figure 4. The SEM images showed different morphologies with the pH values and the bases.
The ZnO thin films synthesized at pH 8 using NH 3 (sample NH3_8) looked porous with grains in a nanosheet shape. This structure, while interesting, may have limitations for DSSC due to reduced surface area [17,50]. When the pH was adjusted to 8.5 (sample NH3_8.5), the grains changed to nanoflower shape composed of nanoprisms. This morphology offers a better surface area and electron transport path, which is beneficial for DSSC efficiency [33,51]. This flower morphology facilitates dye adsorption, improving free charge creation. At pH 9 (sample NH3_9), the grains became smaller and took the form of nanospheres. Finally, for the sample obtained at pH 9.5 (sample NH3_9.5), the grain size increased, and the grains resembled nanodisks. Although this structure is innovative, it might pose challenges in optimizing surface area and electron transport in DSSC [17] because the grains are distant and do not form a compact film. The sudden decrease in grain size at pH 9 can be explained by the increase in crystallite size, as reported in Table 3. Indeed, when the crystallite size became bigger, it became difficult for crystallites to agglomerate, leading to the formation of small grains [52]. On the other hand, samples synthesized using NaOH as the pH control agent showed more uniform surface morphology. The sample prepared at pH 8 (sample NaOH_8) revealed grains constituted with particles in an elliptical shape, providing a uniform surface ideal for DSSC [53]. When the pH was adjusted to 9 (sample NaOH_9), we observed an increase in particle size leading to a compact film. The particles became smaller for samples prepared at higher pH values (samples NaOH_10 and NaOH_11). The reduced particle size can be due to the presence of impurities inhibiting the particle growth. On the one hand, this morphology increases the surface area and improves light absorption, which is beneficial for DSSC efficiency [54]. On the other hand, the small particle morphology reduces the mean free path of electrons, affecting DSSC efficiency [55].
These results indicate that both the nature of the base and the value of the pH influence the surface morphology of the film, affecting the grain shape. However, the ZnO thin films obtained with NaOH appear more mesoporous compared to those obtained with NH 3 . The SEM findings confirm the polycrystalline nature and agglomeration of the ZnO thin films deposited on a glass substrate, which also agrees well with the XRD results for all the samples in both cases.

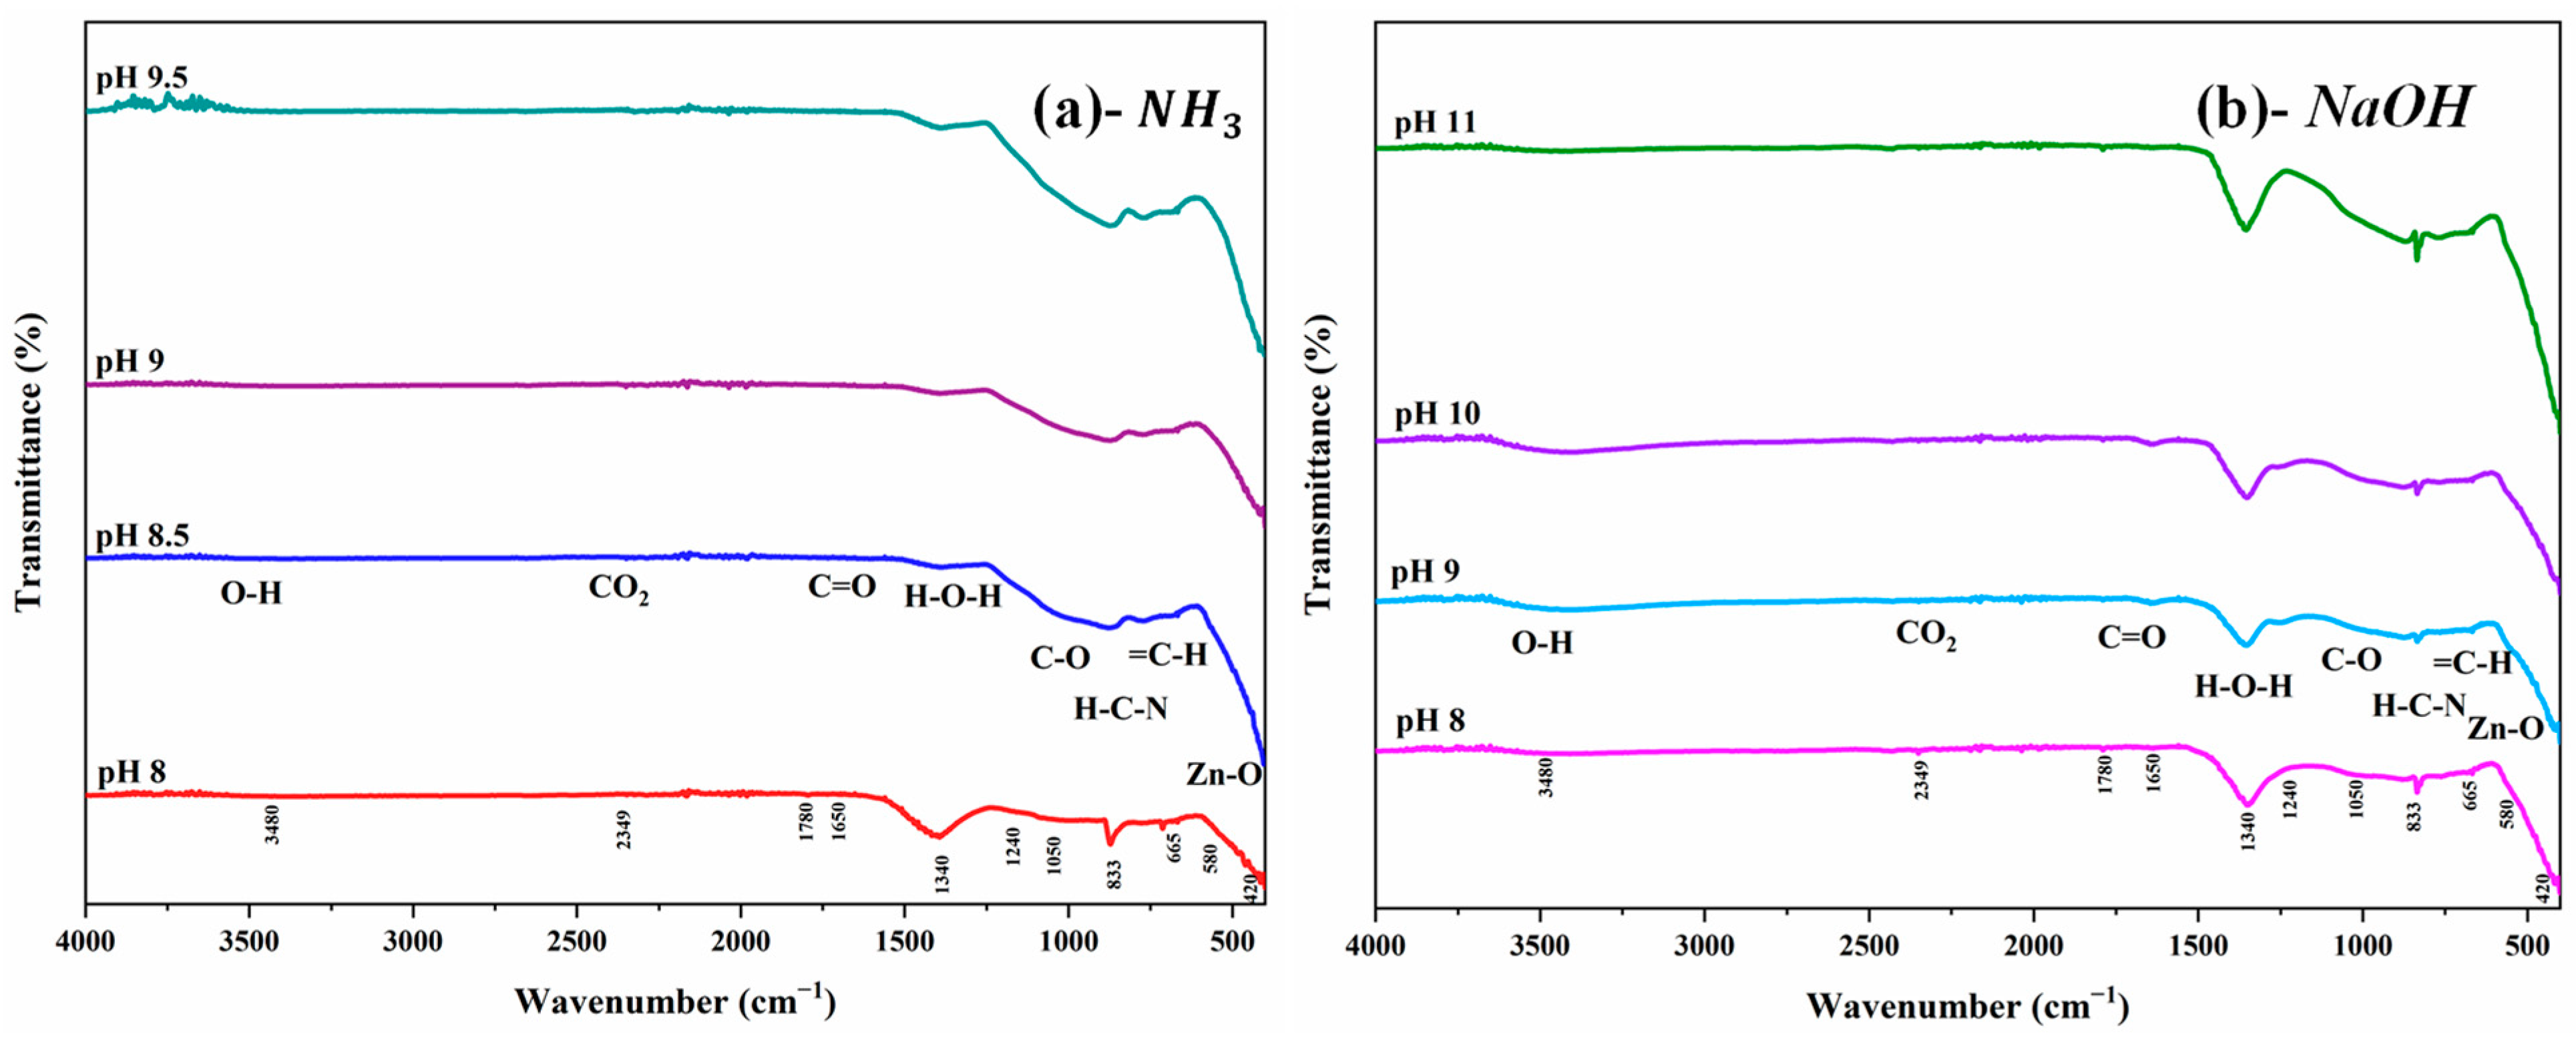
3.4. Fourier Transform Infrared (FTIR) Analysis

To confirm the presence of organic compounds and inorganic species in ZnO thin films synthesized at different pH values, all samples were characterized by FTIR spectroscopy within the range of 4000–400 cm 1 , using the Gladi-ATR (Attenuated Total Reflectance) method. The characteristic peaks exhibited by the FTIR spectra of ZnO thin films synthesized at different pH values are presented in Figure 5.
The characteristic vibrational modes of the Zn-O bond are found between 580 and 420 cm 1 , confirming the formation of ZnO in all the samples. Previous works have shown that the Zn-O absorption peak (stretching vibration) occurs between 700 and 400 cm 1 [42,43,56]. In this study, the shift of the ZnO peak is not consistent for all samples because the size of the ZnO particles changes with pH in both cases. Therefore, the particle size affects the peak shift. These FTIR results support the SEM and XRD results.
The band at 665 cm 1 may be attributed to the =C-H bending vibration. The H-C-N functional group peaks formed at the wavelengths of 833 cm 1 is from HMTA material [57]. The stretching vibrations of the C-O bond of the primary alcohol are observed between 1240 and 1050 cm 1   [56]. Another sharp peak at about 1340 cm 1 is assigned to H-O-H bending vibrations, indicating small amounts of H 2 O in the ZnO nanocrystals [58]. This peak is more intense for samples obtained from NaOH (Figure 5b), showing the hydrophilic behavior of ZnO films. Peaks between 1780 and 1650 cm 1 are associated with the C=O stretching vibrations of amide I and amide II groups. The absorption peak observed around 2349 cm 1 is attributed to the presence of CO 2 molecules in the air [59]. Finally, the broad band at 3480 cm 1 is assigned to the stretching vibration of hydroxyl (OH) groups, likely due to water adsorbed on the surface of the particles [42].

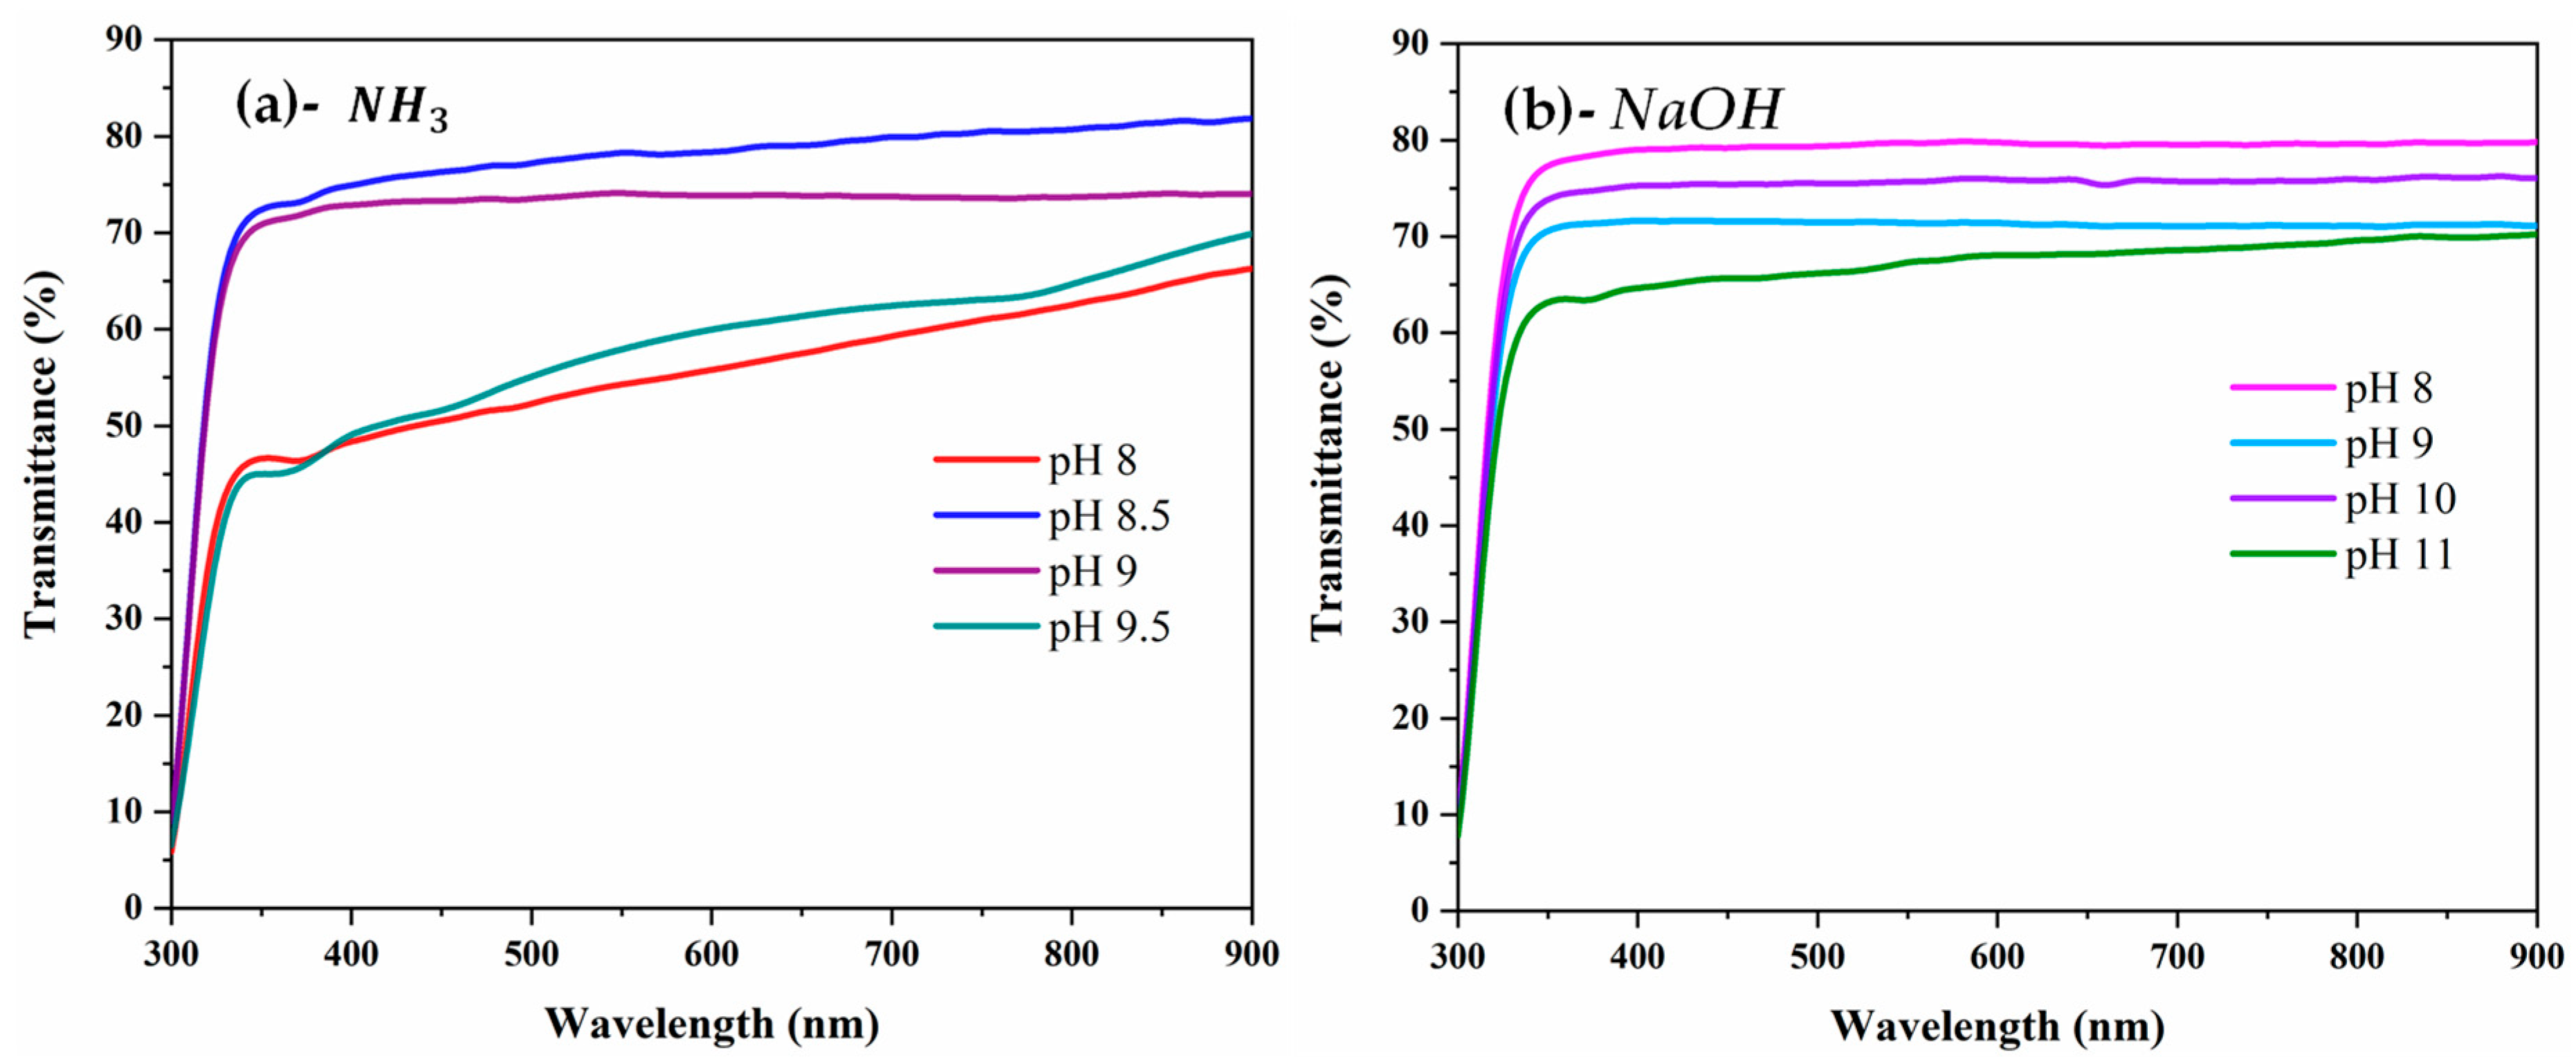
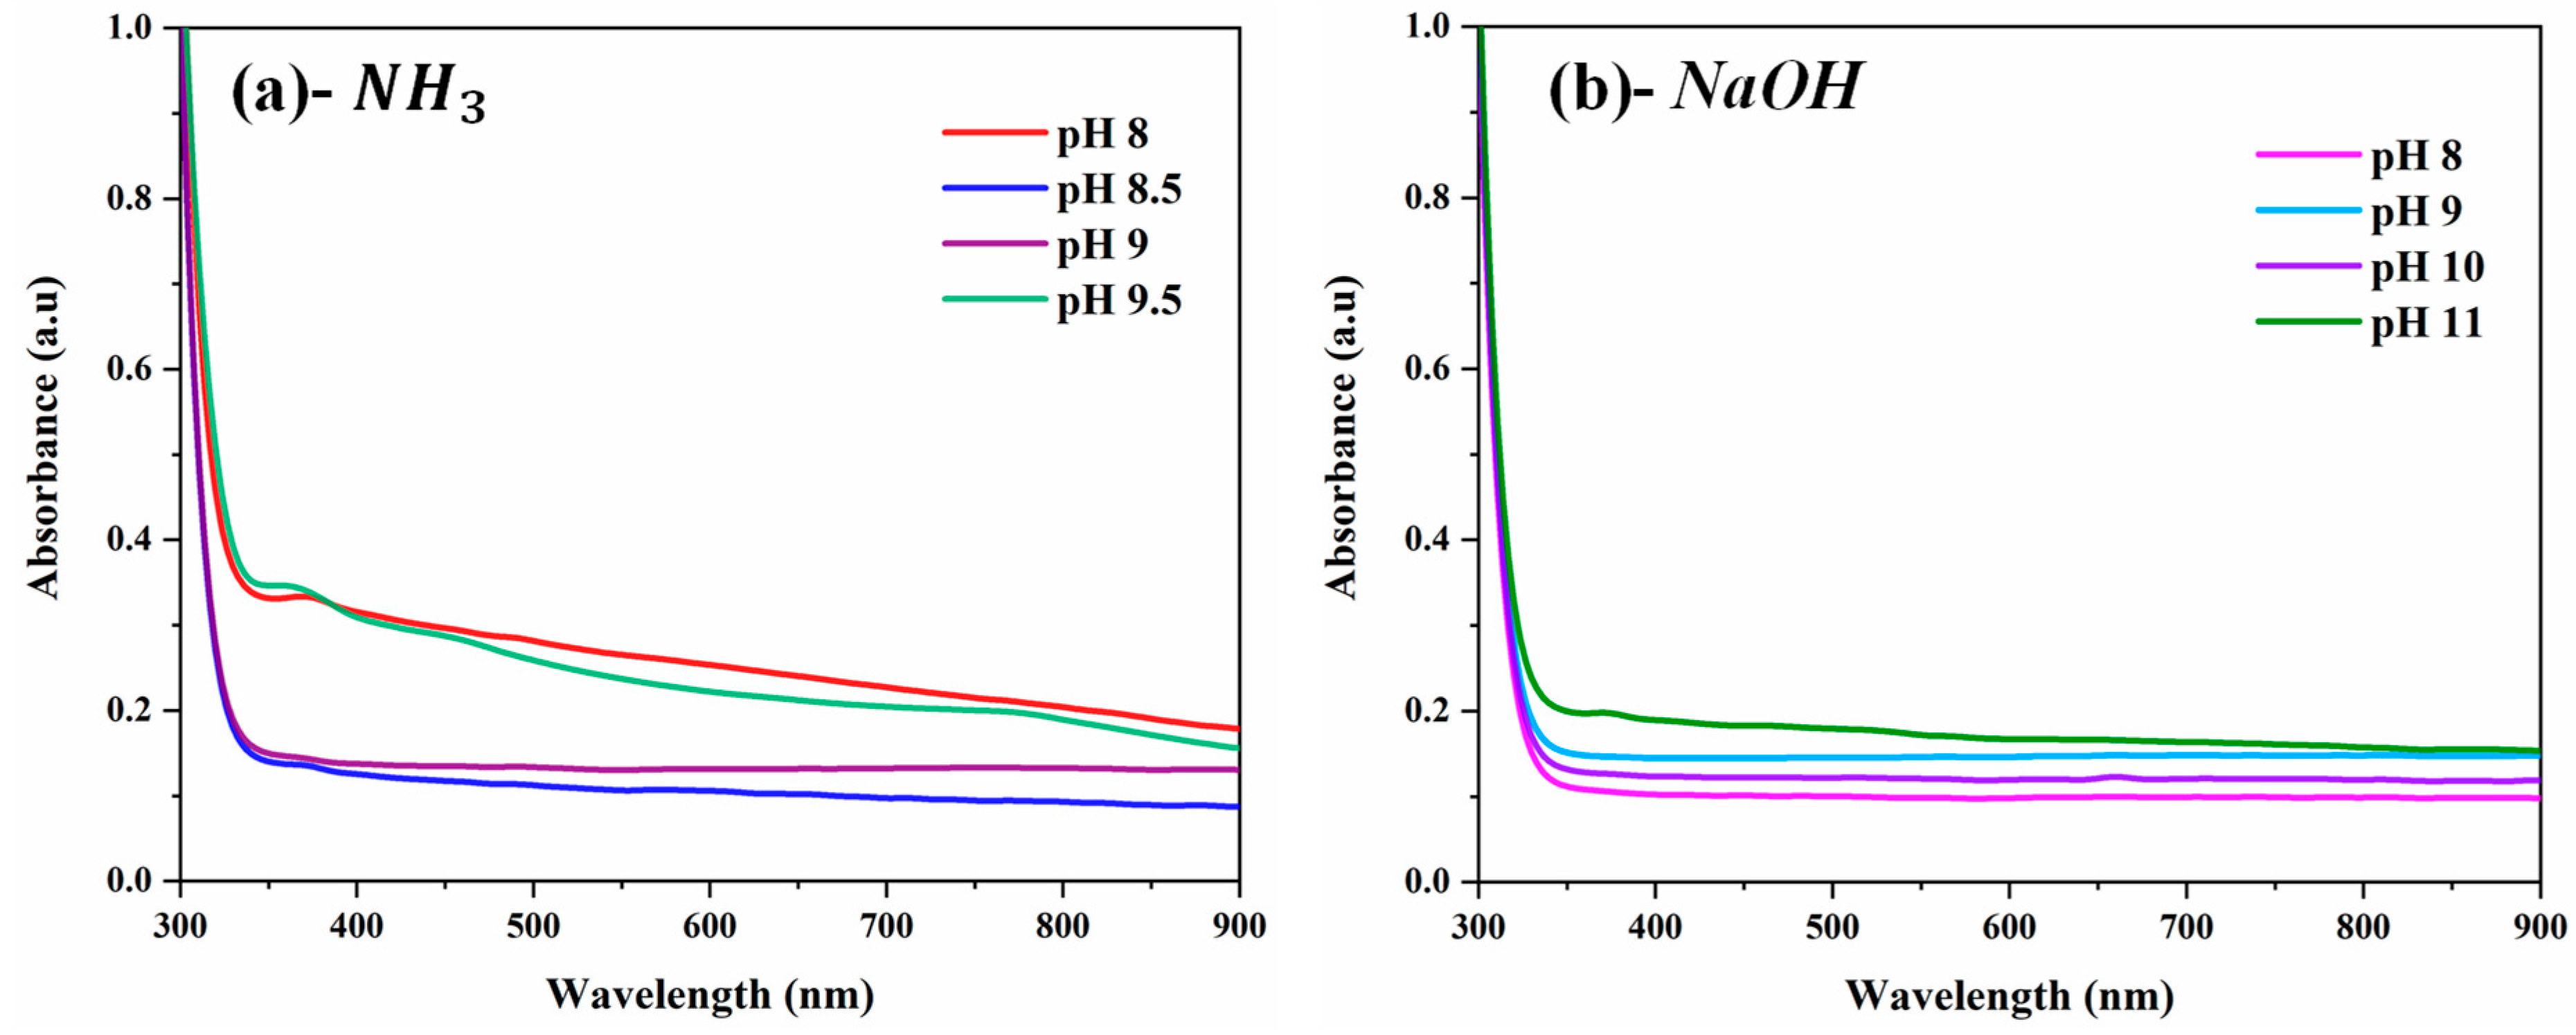
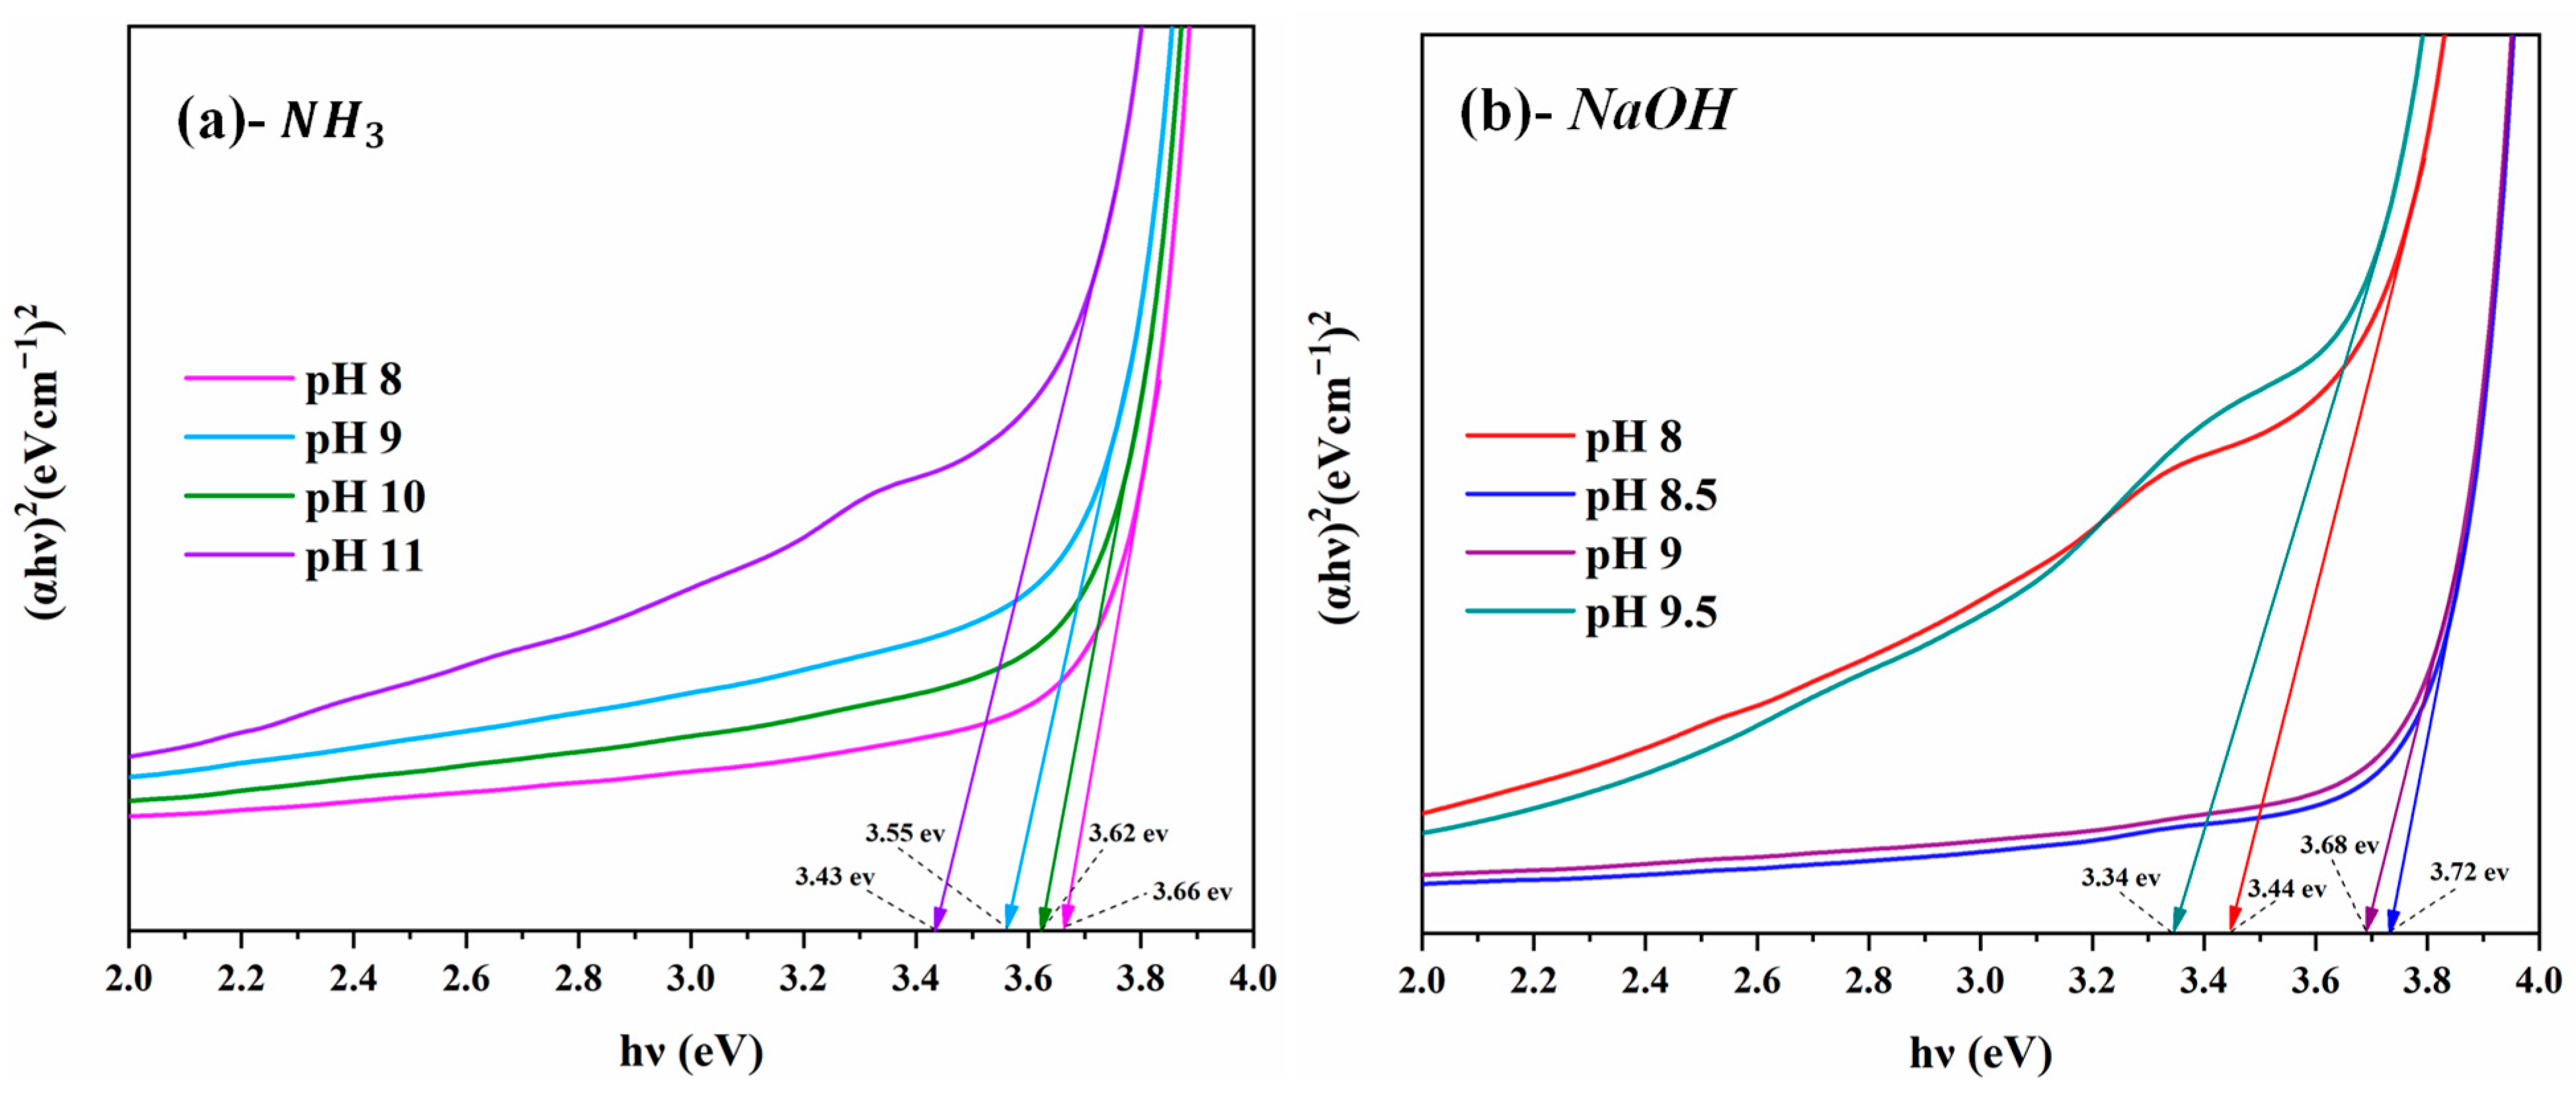
3.5. Optical Properties

Figure 6 depicts the transmittance spectra of ZnO thin films synthesized at different pH values. The results clearly show that ZnO thin films obtained using NaOH (Figure 6b) are more transparent compared to those obtained using NH 3 (Figure 6a). Changing the pH and the pH control agent has a significant impact on the optical properties of ZnO thin films, which is a key parameter for DSSC photoanodes.
For samples obtained using NH 3 , sample NH3_8.5, obtained at pH 8.5, exhibits the highest transmittance (80%) in the visible range. This high level of light transmission is good to be used as a photoanode in DSSCs because more light can be absorbed by the dye, improving the solar cell efficiency. It can be observed that the transmittance decreases with the pH increase. In contrast, sample NH3_8, obtained at pH 8, has the lowest light transmittance at only 53%. This drastic decrease in transmittance is related to the particle size and grain shape of the sample NH3_8. It is well known that small particles lead to light scattering, reducing transmittance [60]. Moreover, nanosheet-shaped compact materials also exhibit light-scattering behavior [61].
Figure 6b shows that ZnO thin films prepared using NaOH show better optical performance. The highest transmittance value of 81% is obtained for ZnO thin films elaborated at pH 8. The same trend is observed for NaOH samples. It is again observed that the transmittance decreases with an increase in pH value. As explained above, this can be due to the decrease in particle size as pH increases, but for samples synthesized from NaOH, it can also result from the formation of impurities, as shown in XRD results.
Figure 7 show the optical absorption spectra of ZnO thin films synthesized at different pH values over the wavelength range of 300–900 nm. In both cases, two regions can be seen in this graph for all samples: (i) a higher absorption in the UV region (below 350 nm), indicating the strong light-harvesting capability of ZnO, which is essential for efficient electron excitation; (ii) in contrast, the lower absorption in the visible and near-infrared regions (above 350 nm) suggests high transparency, which is beneficial for applications requiring minimal optical losses [62]. These results confirm the transmittance measurements, as transmittance is inversely proportional to absorbance [63].
The band-gap energy of the deposited ZnO films was determined (Figure 8) using Tauc’s relation (Equation (18)) [64]:
α h υ n = A h υ E g
where α , n, E g , and are the absorption coefficient, power factor of the transition mode, band-gap energy, and photon energy, respectively.
The band-gap energies of ZnO thin films obtained at pH 8, 8.8, 9, and 9.5 using NH3 are 3.44 eV, 3.72 eV, 3.68 eV, and 3.34 eV, respectively (Figure 8a). Similarly, the band-gap energies of ZnO thin films obtained at pH 8, 9, and 11 using NaOH are 3.66 eV, 3.62 eV, 3.55 eV, and 3.43 eV, respectively (Figure 8b). These results reveal a fluctuation in the band-gap energy with increasing pH, influenced by the growth conditions and the nature of the base used. This variation can be attributed to the changes in the grain size and the structural defects of the films [65], as confirmed by XRD and SEM analyses. When the crystallite size decreases, particularly in the NH3 group, quantum confinement effects may occur, leading to a widening of the band-gap [66]. Moreover, the disordered growth of the films may introduce lattice defects such as oxygen vacancies and zinc interstitials, which generate localized states in the band structure and affect the optical transition energy [67]. The possible presence of impurity phases from NaOH (NaOH.H2O) or residual chemical species from the NH3 (NH4+ complexes) may also alter the band structure and contribute to the observed variations in the band-gap energy. Additionally, internal stress and the optical confinement effect related to the nanostructured morphology of the films can further influence the band-gap [67,68].

4. Conclusions

This study highlights the significant effect of pH and pH control agent selection on the properties of mesoporous ZnO films synthesized by CBD. By varying the pH from 8 to 11 and using NH3 or NaOH, significant differences in the morphology, crystal structure, and optical properties of ZnO films were observed. XRD analysis confirmed that all ZnO films have the hexagonal wurtzite structure regardless of synthesis conditions. FTIR spectra revealed the presence of functional groups consistent with the synthesis of ZnO. SEM images indicated that both the nature of the base and the pH influence the surface morphology of the film. The films synthesized using NH3 exhibited a variety of surface morphologies, while those obtained from NaOH were homogeneous and compact regardless of the pH. Optically, the ZnO films synthesized using NH3 at pH 8.5 and NaOH at pH 8 exhibited the highest transmittances of 80% and 81% in the visible, respectively. The results obtained highlight the importance of careful control of synthesis conditions, especially pH and type of pH control agent, to tune the properties of ZnO films. Based on grain shape and transmittance, ZnO thin films obtained from NH3 at pH 8.5 are more suitable as photoanodes in DSSCs.

Author Contributions

Conceptualization, A.D.G. and M.B.; Methodology, A.D.G. and M.B.; Formal analysis, M.B., K.S.G.-T. and A.C.A.; Data curation, K.S.G.-T., A.C.A., M.S. and M.M.D.; Writing—original draft, A.D.G.; Writing—review and editing, A.C.A., K.N., B.G., K.B. and K.A.A.; Visualization, O.A., K.A.A. and M.M.D.; Supervision, M.B., M.H., M.S. and B.G. All authors have read and agreed to the published version of the manuscript.

Funding

This research work received financial support from Centre d’Excellence Régional pour la Maîtrise de l’Electricité (CERME) of University of Lomé (crédit IDA 6512-TG, Don IDA 536IDA).

Institutional Review Board Statement

Not applicable.

Informed Consent Statement

Not applicable.

Data Availability Statement

The original contributions presented in this study are included in the article. Further inquiries can be directed to the corresponding author.

Acknowledgments

The authors would like to thank the FICCI-DST (Government of India) and the Service de Coopération et d’Action Culturelle (SCAC) of the French Government for their support through the CV Raman International Fellowship Program for African Researchers and the French Government Fellowship Program, respectively.

Conflicts of Interest

The authors declare no conflicts of interest.

References

  1. Nazeeruddin, M.K.; Baranoff, E.; Grätzel, M. Dye-Sensitized Solar Cells: A Brief Overview. Sol. Energy 2011, 85, 1172–1178. [Google Scholar] [CrossRef]
  2. Sharma, K.; Sharma, V.; Sharma, S.S. Dye-Sensitized Solar Cells: Fundamentals and Current Status. Nanoscale Res. Lett. 2018, 13, 381. [Google Scholar] [CrossRef] [PubMed]
  3. Dhanasekaran, P.; Marimuthu, R. A Review on Dye-Sensitized Solar Cells (DSSCs), Materials and Applications. Iran. J. Mater. Sci. Eng. 2023, 20, 1–23. [Google Scholar] [CrossRef]
  4. Taleb, A.; Mesguich, F.; Hérissan, A.; Colbeau-Justin, C.; Yanpeng, X.; Dubot, P. Optimized TiO2 Nanoparticle Packing for DSSC Photovoltaic Applications. Sol. Energy Mater. Sol. Cells 2016, 148, 52–59. [Google Scholar] [CrossRef]
  5. Lai, M.H.; Lee, M.W.; Wang, G.-J.; Tai, M.F. Photovoltaic Performance of New-Structure ZnO-Nanorod Dye-Sensitized Solar Cells. Int. J. Electrochem. Sci. 2011, 6, 2122–2130. [Google Scholar] [CrossRef]
  6. Jiang, C.Y.; Sun, X.W.; Lo, G.Q.; Kwong, D.L.; Wang, J.X. Improved Dye-Sensitized Solar Cells with a ZnO-Nanoflower Photoanode. Appl. Phys. Lett. 2007, 90, 263501. [Google Scholar] [CrossRef]
  7. Messaoudi, C.; Abd-lefdil, S.; Sayah, D.; Cadene, M. ZnO Layers Prepared by Spray Pyrolysis. Eur. Phys. J. AP 1998, 1, 181–184. [Google Scholar] [CrossRef]
  8. Beula, R.J.; Suganthi, D.; Abiram, A. TiO2 Photo-Electrode with Gold Capping for Improved Observation in Dye-Sensitized Solar Cell. Appl. Phys. A 2020, 126, 223. [Google Scholar] [CrossRef]
  9. Archana, P.S.; Jose, R.; Vijila, C.; Ramakrishna, S. Improved Electron Diffusion Coefficient in Electrospun TiO2 Nanowires. J. Phys. Chem. C 2009, 113, 21538–21542. [Google Scholar] [CrossRef]
  10. Look, D.C.; Reynolds, D.C.; Sizelove, J.R.; Jones, R.L.; Litton, C.W.; Cantwell, G.; Harsch, W.C. Electrical Properties of Bulk ZnO. Solid State Commun. 1998, 105, 399–401. [Google Scholar] [CrossRef]
  11. Ravichandran, K.; Anbazhagan, A.; Baneto, M.; Dineshbabu, N.; Ravidhas, C.; Muruganandam, G. Enhancement of the Hackee’s Quality Factor of Sol–Gel Spin Coated ZnO Thin Films by MO Doping. Mater. Sci. Semicond. Process. 2016, 41, 150–154. [Google Scholar] [CrossRef]
  12. Hassan, N.K.; Hashim, M.R.; Al-Douri, Y. Morphology and Optical Investigations of ZnO Pyramids and Nanoflakes for Optoelectronic Applications. Optik 2014, 125, 2560–2564. [Google Scholar] [CrossRef]
  13. Kim, S.A.; Abbas, M.A.; Lee, L.; Kang, B.; Kim, H.; Bang, J.H. Control of Morphology and Defect Density in Zinc Oxide for Improved Dye-Sensitized Solar Cells. Phys. Chem. Chem. Phys. 2016, 18, 30475–30483. [Google Scholar] [CrossRef]
  14. Kuo, S.-Y.; Yang, J.-F.; Lai, F.-I. Improved Dye-Sensitized Solar Cell with a ZnO Nanotree Photoanode by Hydrothermal Method. Nanoscale Res. Lett. 2014, 9, 206. [Google Scholar] [CrossRef]
  15. Lai, F.-I.; Yang, J.-F.; Chen, W.-C.; Hsu, Y.-C.; Kuo, S.-Y. Enhancing Dye-Sensitized Solar Cell Performance with Different Sizes of ZnO Nanorods Grown Using Multi-Step Growth. Catalysts 2023, 13, 1254. [Google Scholar] [CrossRef]
  16. Park, H.; Kim, W.-R.; Jeong, H.-T.; Lee, J.-J.; Kim, H.-G.; Choi, W.-Y. Fabrication of Dye-Sensitized Solar Cells by Transplanting Highly Ordered TiO2 Nanotube Arrays. Sol. Energy Mater. Sol. Cells 2011, 95, 184–189. [Google Scholar] [CrossRef]
  17. Vittal, R.; Ho, K.-C. Zinc Oxide Based Dye-Sensitized Solar Cells: A Review. Renew. Sustain. Energy Rev. 2017, 70, 920–935. [Google Scholar] [CrossRef]
  18. George, A.; Kumari, P.; Soin, N.; Roy, S.S.; McLaughlin, J.A. Microstructure and Field Emission Characteristics of ZnO Nanoneedles Grown by Physical Vapor Deposition. Mater. Chem. Phys. 2010, 123, 634–638. [Google Scholar] [CrossRef]
  19. Lupan, O.; Guérin, V.M.; Ghimpu, L.; Tiginyanu, I.M.; Pauporté, T. Nanofibrous-like ZnO Layers Deposited by Magnetron Sputtering and Their Integration in Dye-Sensitized Solar Cells. Chem. Phys. Lett. 2012, 550, 125–129. [Google Scholar] [CrossRef]
  20. Schaper, N.; Alameri, D.; Kim, Y.; Thomas, B.; McCormack, K.; Chan, M.; Divan, R.; Gosztola, D.J.; Liu, Y.; Kuljanishvili, I. Controlled Fabrication of Quality ZnO NWs/CNTs and ZnO NWs/Gr Heterostructures via Direct Two-Step CVD Method. Nanomaterials 2021, 11, 1836. [Google Scholar] [CrossRef]
  21. Elen, K.; Van Den Rul, H.; Hardy, A.; Van Bael, M.K.; D’Haen, J.; Peeters, R.; Franco, D.; Mullens, J. Hydrothermal Synthesis of ZnO Nanorods: A Statistical Determination of the Significant Parameters in View of Reducing the Diameter. Nanotechnology 2009, 20, 055608. [Google Scholar] [CrossRef]
  22. Magiswaran, K.; Norizan, M.N.; Mahmed, N.; Mohamad, I.S.; Idris, S.N.; Sabri, M.F.M.; Amin, N.; Sandu, A.V.; Vizureanu, P.; Nabiałek, M.; et al. Controlling the Layer Thickness of Zinc Oxide Photoanode and the Dye-Soaking Time for an Optimal-Efficiency Dye-Sensitized Solar Cell. Coatings 2022, 13, 20. [Google Scholar] [CrossRef]
  23. Lou, X.B.; Shen, H.L.; Zhang, H.; Li, B.B. Optical Properties of Nanosized ZnO Films Prepared by Sol-Gel Process. Trans. Nonferrous Met. Soc. China 2007, 100, 200. [Google Scholar]
  24. Xu, S.; Fang, D.; Xiong, F.; Ren, Y.; Bai, C.; Mi, B.; Gao, Z. Electrophoretic Deposition of Double-Layer ZnO Porous Films for DSSC Photoanode. J. Solid State Electrochem. 2023, 28, 589–599. [Google Scholar] [CrossRef]
  25. Zak, A.K.; Majid, W.H.; Wang, H.Z.; Yousefi, R.; Moradi Golsheikh, A.; Ren, Z.F. Sonochemical Synthesis of Hierarchical ZnO Nanostructures. Ultrason. Sonochemistry 2013, 20, 395–400. [Google Scholar] [CrossRef]
  26. Rosli, A.B.B.; Hamid, N.H.B.; Bin Zulkefle, M.A.; Shariffudin, S.S.B.; Abdullah, W.F.H.B.; Herman, S.H. Post-Deposition Heat Treatment Effect on pH Sensing Behavior of Chemical Bath Deposited Nanostructured Zinc Oxide. Int. J. Hydrog. Energy 2023, 48, 1636–1648. [Google Scholar] [CrossRef]
  27. Rahman, R.A.; Zulkefle, M.A.; Herman, S.H.; Alip, R.I. Synthesis of Zinc Oxide Nanostructure by Chemical Bath Deposition (CBD) Method: Influence of Growth Time towards Nanostructure Characteristics. Int. J. Recent Technol. Eng. 2019, 8, 6891–6896. [Google Scholar] [CrossRef]
  28. Mane, R.S.; Lokhande, C.D. Chemical Deposition Method for Metal Chalcogenide Thin Films. Mater. Chem. Phys. 2000, 65, 1–31. [Google Scholar] [CrossRef]
  29. Murthy, M.N.; Sreelatha, C.J.; Ravinder, G.; Anusha, S. The Effect of Solution pH on the Structural, Surface Morphological, and Optical Characteristics of ZnO Thin Films Synthesized by the Chemical Bath Deposition Technique. Mater. Today Proc. 2022, 54, 602–607. [Google Scholar] [CrossRef]
  30. Ashraf, R.; Riaz, S.; Hussain, S.S.; Naseem, S. Effect of pH on Properties of ZnO Nanoparticles. Mater. Today Proc. 2015, 2, 5754–5759. [Google Scholar] [CrossRef]
  31. Vernardou, D.; Kenanakis, G.; Couris, S.; Koudoumas, E.; Kymakis, E.; Katsarakis, N. pH Effect on the Morphology of ZnO Nanostructures Grown with Aqueous Chemical Growth. Thin Solid Film. 2007, 515, 8764–8767. [Google Scholar] [CrossRef]
  32. Abdulrahman, A.F.; Ahmed, S.M.; Hamad, S.M.; Almessiere, M.A.; Ahmed, N.M.; Sajadi, S.M. Effect of Different pH Values on Growth Solutions for the ZnO Nanostructures. Chin. J. Phys. 2021, 71, 175–189. [Google Scholar] [CrossRef]
  33. Garcia-Barrientos, A.; Ambrosio-Lazaro, R.C.; Ramirez-Bone, R.; Garcia-Ramirez, M.A.; Perez-Cortes, O.; Tapia-Olvera, R.; Plaza-Castillo, J. pH-Effect in the Fabrication of ZnO Nanostructured Thin Films by Chemical Bath Deposition for Increasing the Efficiency of Solar Cells. Materials 2023, 16, 3275. [Google Scholar] [CrossRef] [PubMed]
  34. Chu, J.B.; Huang, S.M.; Zhang, D.W.; Bian, Z.Q.; Li, X.D.; Sun, Z.; Yin, X.J. Nanostructured ZnO Thin Films by Chemical Bath Deposition in Basic Aqueous Ammonia Solutions for Photovoltaic Applications. Appl. Phys. A 2009, 95, 849–855. [Google Scholar] [CrossRef]
  35. Rai, P.; Song, M.-K.; Kim, J.-H.; Kim, Y.-S.; Song, H.-M.; Yu, Y.-T. Effect of Ammonia Water on the Morphology of Monoethanolamine-Assisted Sonochemicaly Synthesized ZnO Nanostructures. J. Nanosci. Nanotechnol. 2012, 12, 1380–1385. [Google Scholar] [CrossRef] [PubMed]
  36. Rai, P.; Jo, J.-N.; Wu, X.-F.; Yoon, J.-M.; Yu, Y.-T. Synthesis of Well Dispersed, Regular Shape ZnO Nanorods: Effect of pH, Time and Temperature. J. Nanosci. Nanotechnol. 2011, 11, 647–651. [Google Scholar] [CrossRef]
  37. McMurdie, H.F.; Morris, M.C.; Evans, E.H.; Paretzkin, B.; Wong-Ng, W.; Ettlinger, L.; Hubbard, C.R. Standard X-Ray Diffraction Powder Patterns from the JCPDS Research Associateship. Powder Diffr. 1986, 1, 64–77. [Google Scholar] [CrossRef]
  38. Koliverdov, V.F. Relation between the Temperature Coefficient of Surface Tension and Phase Diagrams. Russ. J. Phys. Chem. 2010, 84, 1294–1300. [Google Scholar] [CrossRef]
  39. Wunderlich, J.A. Contribution à l’étude cristallochimique des hydrates de soude. I.—Méthodes expérimentales et les structures cristallines de NaOH.H2O et de 2 NaOH.7 H2O. Bull. Minéralogie 1958, 81, 287–314. [Google Scholar] [CrossRef]
  40. Hemily, P.W. Structures cristallines des hydrates de la soude. I. Structure cristalline de NaOH.4H2O. Acta Cryst. 1957, 10, 37–44. [Google Scholar] [CrossRef]
  41. Romero, R.; Leinen, D.; Dalchiele, E.A.; Ramos-Barrado, J.R.; Martín, F. The Effects of Zinc Acetate and Zinc Chloride Precursors on the Preferred Crystalline Orientation of ZnO and Al-Doped ZnO Thin Films Obtained by Spray Pyrolysis. Thin Solid Film. 2006, 515, 1942–1949. [Google Scholar] [CrossRef]
  42. Arellano-Cortaza, M.; Ramírez-Morales, E.; Pal, U.; Pérez-Hernández, G.; Rojas-Blanco, L. pH Dependent Morphology and Texture Evolution of ZnO Nanoparticles Fabricated by Microwave-Assisted Chemical Synthesis and Their Photocatalytic Dye Degradation Activities. Ceram. Int. 2021, 47, 27469–27478. [Google Scholar] [CrossRef]
  43. Ravichandran, K.; Shalini, R.; Ayyanar, M.; Kavitha, P.; Baneto, M.; Karunakaran, M.; Praseetha, P.K.; Pushpa, K.C.S.; Anuradha, N. Effect of pH of the Precursor Solution on the Photocatalytic and Biomedical Applications of Enzyme Coupled ZnO and SnO2 Nanomaterials: A Comparative Study. J. Water Process Eng. 2023, 53, 103817. [Google Scholar] [CrossRef]
  44. Mohan, V.K.; Srivastav, A.; Güell, F.; John, T.T. pH-Controlled Synthesis of ZnO Nanoflowers: A Correlation Study among the Optoelectronic Properties and Improved Photodegradation Efficiency. J. Alloys Compd. 2024, 976, 172993. [Google Scholar] [CrossRef]
  45. Drici, A.; Djeteli, G.; Tchangbedji, G.; Derouiche, H.; Jondo, K.; Napo, K.; Bernède, J.C.; Ouro-Djobo, S.; Gbagba, M. Structured ZnO Thin Films Grown by Chemical Bath Deposition for Photovoltaic Applications. Phys. Stat. Sol. 2004, 201, 1528–1536. [Google Scholar] [CrossRef]
  46. Kashif, M.; Hashim, U.; Ali, M.E.; Ali, S.M.U.; Rusop, M.; Ibupoto, Z.H.; Willander, M. Effect of Different Seed Solutions on the Morphology and Electrooptical Properties of ZnO Nanorods. J. Nanomater. 2012, 2012, 452407. [Google Scholar] [CrossRef]
  47. Abdulrahman, A.F.; Ahmed, S.M.; Ahmed, N.M.; Almessiere, M.A. Enhancement of ZnO Nanorods Properties Using Modified Chemical Bath Deposition Method: Effect of Precursor Concentration. Crystals 2020, 10, 386. [Google Scholar] [CrossRef]
  48. Rosli, N.; Halim, M.M.; Hashim, M.R. Effect of CBD Growth Times on the ZnO Microrods Prepared on Macroporous Silicon. Appl. Phys. A 2021, 127, 712. [Google Scholar] [CrossRef]
  49. Mustapha, S.; Ndamitso, M.M.; Abdulkareem, A.S.; Tijani, J.O.; Shuaib, D.T.; Mohammed, A.K.; Sumaila, A. Comparative Study of Crystallite Size Using Williamson-Hall and Debye-Scherrer Plots for ZnO Nanoparticles. Adv. Nat. Sci. Nanosci. Nanotechnol. 2019, 10, 045013. [Google Scholar] [CrossRef]
  50. Wang, Y.; Cui, X.; Zhang, Y.; Gao, X.; Sun, Y. Preparation of Cauliflower-like ZnO Films by Chemical Bath Deposition: Photovoltaic Performance and Equivalent Circuit of Dye-Sensitized Solar Cells. J. Mater. Sci. Technol. 2013, 29, 123–127. [Google Scholar] [CrossRef]
  51. Anand, A.; Mittal, S.; Leeladevi, V.; De, D. Nanoflower Shaped ZnO Photoanode and Natural Dye Sensitizer Based Solar Cell Fabrication. Mater. Today Proc. 2023, 72, 227–231. [Google Scholar] [CrossRef]
  52. Baneto, M.; Enesca, A.; Lare, Y.; Jondo, K.; Napo, K.; Duta, A. Effect of Precursor Concentration on Structural, Morphological and Opto-Electric Properties of ZnO Thin Films Prepared by Spray Pyrolysis. Ceram. Int. 2014, 40, 8397–8404. [Google Scholar] [CrossRef]
  53. Kanmani, S.S.; Ramachandran, K. Role of Aqueous Ammonia on the Growth of ZnO Nanostructures and Its Influence on Solid-State Dye Sensitized Solar Cells. J. Mater. Sci. 2013, 48, 2076–2091. [Google Scholar] [CrossRef]
  54. Lizama-Tzec, F.I.; García-Rodríguez, R.; Rodríguez-Gattorno, G.; Canto-Aguilar, E.J.; Vega-Poot, A.G.; Heredia-Cervera, B.E.; Villanueva-Cab, J.; Morales-Flores, N.; Pal, U.; Oskam, G. Influence of Morphology on the Performance of ZnO-Based Dye-Sensitized Solar Cells. RSC Adv. 2016, 6, 37424–37433. [Google Scholar] [CrossRef]
  55. Selvapriya, R.; Mayandi, J.; Ragavendran, V.; Sasirekha, V.; Vinodhini, J.; Pearce, J.M. Dual Morphology Titanium Dioxide for Dye Sensitized Solar Cells. Ceram. Int. 2019, 45, 7268–7277. [Google Scholar] [CrossRef]
  56. Jahan Tamanna, N.; Hossain, S.; Mohammed Bahadur, N.; Ahmed, S. Green Synthesis of Ag2O & Facile Synthesis of ZnO and Characterization Using FTIR, Bandgap Energy & XRD (Scherrer Equation, Williamson-Hall, Size-Train Plot, Monshi- Scherrer Model). Results Chem. 2024, 7, 101313. [Google Scholar] [CrossRef]
  57. Idiawati, R.; Mufti, N.; Taufiq, A.; Wisodo, H.; Laila, I.K.R.; Fuad, A. Sunaryono Effect of Growth Time on the Characteristics of ZnO Nanorods. IOP Conf. Ser. Mater. Sci. Eng. 2017, 202, 012050. [Google Scholar] [CrossRef]
  58. Hannachi, E.; Slimani, Y.; Nawaz, M.; Trabelsi, Z.; Yasin, G.; Bilal, M.; Almessiere, M.A.; Baykal, A.; Thakur, A.; Thakur, P. Synthesis, Characterization, and Evaluation of the Photocatalytic Properties of Zinc Oxide Co-Doped with Lanthanides Elements. J. Phys. Chem. Solids 2022, 170, 110910. [Google Scholar] [CrossRef]
  59. Muthukumaran, S.; Gopalakrishnan, R. Structural, FTIR and Photoluminescence Studies of Cu Doped ZnO Nanopowders by Co-Precipitation Method. Opt. Mater. 2012, 34, 1946–1953. [Google Scholar] [CrossRef]
  60. Hulst, H.C.; van de Hendrik, C. Light Scattering by Small Particles; Dover Publications: New York, NY, USA, 1981; ISBN 978-0-486-64228-4. [Google Scholar]
  61. Xu, F.; Dai, M.; Lu, Y.; Sun, L. Hierarchical ZnO Nanowire−Nanosheet Architectures for High Power Conversion Efficiency in Dye-Sensitized Solar Cells. J. Phys. Chem. C 2010, 114, 2776–2782. [Google Scholar] [CrossRef]
  62. Qasem, A.; Mostafa, M.S.; Yakout, H.A.; Mahmoud, M.; Shaaban, E.R. Determination of Optical Bandgap Energy and Optical Characteristics of Cd30Se50S20 Thin Film at Various Thicknesses. Opt. Laser Technol. 2022, 148, 107770. [Google Scholar] [CrossRef]
  63. Menzel, J.P.; Noble, B.B.; Blinco, J.P.; Barner-Kowollik, C. Predicting Wavelength-Dependent Photochemical Reactivity and Selectivity. Nat. Commun. 2021, 12, 1691. [Google Scholar] [CrossRef]
  64. Tauc, J.; Menth, A. States in the Gap. J. Non-Cryst. Solids 1972, 8–10, 569–585. [Google Scholar] [CrossRef]
  65. Wong, E.M.; Searson, P.C. ZnO Quantum Particle Thin Films Fabricated by Electrophoretic Deposition. Appl. Phys. Lett. 1999, 74, 2939–2941. [Google Scholar] [CrossRef]
  66. Anyaegbunam, F.N.C.; Augustine, C. A Study of Optical Band Gap and Associated Urbach Energy Tail of Chemically Deposited Metal Oxides Binary Thin Films. Dig. J. Nanomater. Biostructures 2018, 13, 847–856. [Google Scholar]
  67. Marotti, R. Bandgap Energy Tuning of Electrochemically Grown ZnO Thin Films by Thickness and Electrodeposition Potential. Sol. Energy Mater. Sol. Cells 2004, 82, 85–103. [Google Scholar] [CrossRef]
  68. Foo, K.L.; Hashim, U.; Muhammad, K.; Voon, C.H. Sol–Gel Synthesized Zinc Oxide Nanorods and Their Structural and Optical Investigation for Optoelectronic Application. Nanoscale Res. Lett. 2014, 9, 429. [Google Scholar] [CrossRef]
Figure 1. Flowchart of the synthesis process of ZnO thin films.
Surfaces 08 00046 g001
Figure 2. Effect of ammonia on the ZnO solution at (a) pH = 8, (b) pH = 9.5, and (c) pH > 9.5.
Surfaces 08 00046 g002
Figure 3. XRD patterns of ZnO thin films for different pH values, using (a) NH 3 and (b) NaOH as pH-controlling agents.
Surfaces 08 00046 g003
Figure 4. SEM images of ZnO mesoporous thin films synthesized at different pH values using NH 3 and NaOH as pH-controlling agents.
Surfaces 08 00046 g004
Figure 5. FTIR spectra of ZnO thin films for different pH values, using (a) NH 3 and (b) NaOH as pH-controlling agents.
Surfaces 08 00046 g005
Figure 6. Optical transmittance spectra of ZnO thin films for different pH values, using (a) NH 3 and (b) NaOH as pH-controlling agents.
Surfaces 08 00046 g006
Figure 7. UV–Visible absorption spectra of ZnO thin films for different pH values, using (a) NH3 and (b) NaOH as pH-controlling agents.
Surfaces 08 00046 g007
Figure 8. Tauc’s plot of ZnO thin films for different pH values, using (a) NH3 and (b) NaOH as pH-controlling agents.
Surfaces 08 00046 g008
Table 1. Texture coefficient of ZnO thin films along the dominant peaks (100), (002), and (101) for different pH values using (a) NH 3 and (b) NaOH as pH-controlling agents.
(a)  NH 3 (b) NaOH
pH T C h k l pH T C h k l
(100)(002)(101)(100)(002)(101)
81.30.71.081.50.60.9
8.51.20.81.091.11.10.8
91.01.01.0101.01.20.9
9.51.10.81.0118.01.40.7
Table 2. Lattice parameters and structural characteristics of ZnO thin films alongside (101) peak diffraction for different pH values using NH 3 as pH-controlling agents.
pH2θ (°)FWHM (°)D (nm) δ
( × 1015 Lines/m2)
Lattice Parameters (Å) c a RatioThe Internal Strains Along a and c Axesd (Å)V (Å3)L (Å)
ac ε a
(%)
ε c
(%)
836.2820.77310.8158.5503.2495.2051.602−0.009−0.0242.47447.5721.977
8.536.2610.76410.9428.3533.2515.2071.6020.0490.0182.47547.6471.978
936.2530.71511.6917.3163.2515.2091.6020.0580.0492.47647.6711.978
9.536.2540.79610.5019.0683.2515.2101.6020.0770.0692.47647.6981.979
JCPDS card 36-145136.253---3.2505.2071.602--2.47647.622-
Table 3. Lattice parameters and structural characteristics of ZnO thin films alongside (101) peak diffraction for different pH values using NaOH as pH-controlling agents.
pH2θ (°)FWHM (°)D (nm) δ
( × 1015 Lines/m2)
Lattice Parameters (Å) c a RatioThe Internal Strains Along a and c Axesd (Å)V (Å3)L (Å)
ac ε a
(%)
ε c
(%)
836.1790.31026.9591.3763.2585.2191.6020.2770.2522.48147.9771.983
936.1980.30127.7671.2973.2565.2151.6020.2150.1762.48047.8811.981
1036.1930.35423.6091.7943.2565.2101.6000.2060.0692.48047.8211.981
1136.2180.40220.7922.3133.2545.1861.5940.147−0.3812.47847.5511.977
JCPDS card 36-145136.253---3.2505.2071.602--2.47647.622-
Disclaimer/Publisher’s Note: The statements, opinions and data contained in all publications are solely those of the individual author(s) and contributor(s) and not of MDPI and/or the editor(s). MDPI and/or the editor(s) disclaim responsibility for any injury to people or property resulting from any ideas, methods, instructions or products referred to in the content.

