Article

Re-Viewing the Spatial Distribution of Prehistoric Sites in the Kegalle District of Sri Lanka: A GIS Approach


by
Dhanushka Jayarathne
1,* and
Takehiro Morimoto
2
1
Graduate School of Science and Technology, University of Tsukuba, Tsukuba 305-8577, Japan
2
Institute of Life and Environmental Sciences, University of Tsukuba, Tsukuba 305-8577, Japan
*
Author to whom correspondence should be addressed.
Heritage 2026, 9(7), 257; https://doi.org/10.3390/heritage9070257
Submission received: 15 April 2026 / Revised: 26 June 2026 / Accepted: 30 June 2026 / Published: 1 July 2026

Abstract

Geographic Information Systems (GIS)-based spatial analyses have become an important tool for prehistoric research globally. Sri Lanka holds a distinctive prehistoric record in South Asia, supported by extensive investigations. In contrast, the systematic applications of GIS analyses for prehistoric studies on the island are comparatively limited. This study examines the spatial distribution of prehistoric sites in the Kegalle district, where recent documentation suggests it differs from previous estimates. The study identified 16 new prehistoric sites, bringing the total to 22, including six already documented, representing the first GIS-based systematic expansion of the prehistoric site inventory in this district in six decades. Three analyses, Kernel Density Estimation (KDE), Least-Cost Path (LCP), supported by 3D terrain modelling and corridor analysis, were applied to examine site distribution and modelled movement potential. KDE results provided a preliminary spatial visualization showing higher site density around the Ma Oya basin and the Seethawaka Ganga, a tributary of the Kelani River basin; given the small sample size (n = 22), these patterns should be treated as survey coverage indications rather than confirmed settlement distributions. LCP indicated valley-oriented modelled movement potential, intermediate elevation site distribution and key topographic convergence points across the landscape. Corridor analysis identified low-gradient valley routes as probable topographic movement zones along the modeled least-cost paths. The integrated results suggest a preliminary pattern of valley-oriented site distribution and topographically favorable movement terrain concentrated around the Ma Oya and Kelani River basins, treated as exploratory spatial indications pending validation through future systematic survey and radiocarbon dating. This study presents one of the first systematic applications of an integrated GIS-based analytical framework for prehistoric spatial analysis in Sri Lanka, suggesting how such approaches can generate testable hypotheses and provide actionable guidance for future archaeological fieldwork in regions where comprehensive chronological data remain limited.

1. Introduction

Since the 1980s, Geographic Information Systems (GIS) have transformed from a simple mapping tool to advanced analytical capabilities for examining ancient human behavior [1,2,3]. Globally, prehistoric research has increasingly utilized GIS-based approaches for various analytical purposes. The widely adopted application areas are the analysis of prehistoric settlement patterns, landscape use, and predictive modelling [4,5,6,7,8,9,10,11,12]. In addition, methodological approaches such as prehistoric movement routes, dispersal patterns and network analysis have become prominent [2,13,14,15,16]. Furthermore, the integration of GIS-based analytical skills has enhanced the interpretive capabilities of human–environment interactions in prehistoric studies [17,18,19]. In summary, GIS-based analytical methodologies have contributed to improving the analytical and interpretive potential of archaeological evidence worldwide [20,21]. These analytical capabilities allow researchers to analyze prehistoric human behavior, including settlement and mobility patterns, as well as examine prehistoric human responses to challenging environmental conditions.
That said, GIS-based analytical methodologies show geographic differences on a macro scale. In the South Asian context, the use of GIS-based applications for prehistoric studies has received comparatively less attention than global developments. Nevertheless, recent Indian prehistoric studies suggest a growing adoption of GIS-based analyses [22,23,24,25,26]. Compared to the recent GIS-based analytical developments in Indian prehistory, Sri Lankan prehistoric studies are heavily dependent on typological and, recently, multiproxy geoarchaeological methodologies [27,28,29,30,31,32,33,34,35,36,37,38,39]. Recent studies in Sri Lanka adopted GIS as a map-making tool in most studies rather than as an analytical platform. Therefore, the current GIS adoption in prehistoric studies in Sri Lanka suggests a need for an analytical framework to address spatial context within a broader interpretive framework.
The history of prehistoric research in Sri Lanka dates back to the British colonial period [40,41,42,43,44,45,46]. Among the 150 years of prehistoric documentation, Deraniyagala’s work represents an important attempt in spatial mapping [27]. This fundamental spatial study did not evolve into a GIS-based analytical methodology. His ecological approach provided a significant foundation for analyzing the spatial distribution of prehistoric sites on the island. Subsequent studies focused on geoarchaeological case studies rather than on spatial analysis. Notably, one recent study examined the utility of Kernel Density Estimation (KDE) to analyze the vertical densities of prehistoric evidence in soil stratigraphy [47]. In the Kegalle District specifically, documentation remained limited to six cave sites over six decades without sufficient systematic spatial analysis. The present study addresses this gap directly by expanding the site inventory and applying an integrated GIS-based analytical framework for the first time.
Recent discoveries suggest that the actual distribution of prehistoric evidence on the island is more extensive than previously documented [48,49]. Particularly in the Kegalle District, previous documentation was limited to six prehistoric sites over a six-decade period. Despite this, recent fieldwork suggests that the actual density is higher than the previously estimated [50,51]. These new findings reveal the necessity of a GIS-based analytical framework to systematically update the traditional manual map of the country. Collectively, in response to these gaps, the present study, conducted by the authors between 2018 and 2024, applies an integrated GIS-based analytical framework to an expanded prehistoric site inventory in the Kegalle District, functioning as a methodological exploratory study that generates testable hypotheses and provides guidance for future systematic archaeological fieldwork. To achieve this, three GIS-based spatial analyses, namely, KDE, LCP supported by a 3D terrain model, and corridor analysis, were applied. This research presents one of the first systematic GIS-based analytical frameworks for prehistoric studies in Sri Lanka, which contributes to addressing the methodological gaps between local and regional scales of prehistoric studies. Against this background, the present research addresses the following research questions.
  • What spatial patterns emerge from the integrated GIS-based analysis of newly documented and previously recorded prehistoric sites in the Kegalle District, and what do these patterns suggest about priority areas for future systematic survey?
  • What modelled movement potential and probable corridor zones do the least-cost path and corridor modelling reveal in relation to the spatial distribution of prehistoric sites in the Kegalle District?
  • How can an integrated GIS-based analytical framework be applied to an expanded prehistoric site inventory to generate testable hypotheses and guide future archaeological fieldwork in a region lacking prior systematic GIS-based spatial analysis?
To address these research questions, the present study applied three GIS-based spatial analyses. Kernel Density Estimation (KDE) for analyzing the site density and survey coverage, Least-Cost Path (LCP) analysis to model the modelled movement potential and corridor analysis to identify probable movement zones. Collectively, these methods provide a replicable GIS-based framework to analyze the landscape dimensions of prehistoric evidence in Sri Lanka.

2. The Study Area

The Kegalle district is located in the Sabaragamuwa province in Sri Lanka, situated between the western foothills of the central highlands and the southwestern lowlands of the island. (Figure 1) The total extent of the district is approximately 1693 km2 [52]. Geographically, the topography ranges from low-lying valleys to highland terrain. The study area shows diverse topography. After excluding anomalous No Data pixels, the 12.5 m resolution ASF ALOS PALSAR DEM analysis ranges from 50–1840 m. The mean elevation is 175 m, and the median elevation is 107 m. The low elevation zone (below 200 m) dominates the study area. The foothill zone is defined by moderate elevations (200–500 m), and the highland margins are at higher elevations (500–1840 m). The drainage pattern of the Kegalle district is defined by three main river basins, Kelani, Ma Oya and Attanagalu Oya basins [52]. Three river basins and their interconnected tributary network create an interconnected valley corridor and natural pathways through the landscape. Most of the prehistoric sites are located in proximity to the Ma Oya and Kelani River basins. Therefore, the drainage pattern forms a critical spatial reference for the GIS analysis that follows. The study area belongs to the wet zone, with an average annual rainfall of 2500 mm. The natural vegetation is defined as tropical lowland rainforest in the valley areas and montane forest at higher elevations. The highland–lowland transitional character of the study area provides diverse ecological conditions and access to a wide range of natural resources. The existing prehistoric literature of the Kegalle district is based on six cave sites. Over six decades of research in the study area have established carbon dating sequences for three cave sites: Kitulgala Beli Lena (45,000 cal. BP), which belongs to the Kelani River basin; Attanagoda Alu Lena (10,350 cal. BP), which connects with the Ma Oya basin; and Dorawaka Lena (6310 cal. BP), located near the tributary of the Attanagalu Oya [27,28,30,38]. Yet, the systematic survey coverage has remained limited due to the geographic extent of the study area. The findings of the present research extend the prehistoric context of the study area with a GIS-based spatial analytical framework.
A clarification is needed regarding the use of the term “Mesolithic” in this paper, specifically its chronological scope. Typically, globally, the Mesolithic is regarded as a Holocene period beginning around 11,700 cal. BP, after the Pleistocene. However, in Sri Lanka, the term applies to both epochs. It describes a geometric microlithic stone tool tradition first found in the Late Pleistocene, with early evidence dating to about 48,000 cal. B.P. at Fa-Hien Lena [37], and around 45,000 cal. BP at Kitulgala Beli Lena [38]. This tradition persisted through the Holocene until roughly 3000 cal. BP [32,36]. In Sri Lankan archaeology, this usage reflects a focus on lithic technology rather than climatic boundaries, which define the Mesolithic elsewhere [27,30,34]. Table 1 compares this Sri Lankan sequence with the global geological framework to clarify the regional terminology for readers unfamiliar with it.

3. Materials and Methods

The archaeological data for the present study were generated through the combination of literature review, archival data and pedestrian surveys. The handheld GPS device (Garmin eTrex 30×, Garmin International, Inc., Olathe, KS, USA) was used to collect GPS points during the surveys, with an accuracy of ±3 m–±5 m. The coordinate system for point recordings was WGS1984 (EPSG:4326), and the data were later projected to UTM44N (EPSG:32644) for spatial analysis. Additionally, methods such as scale photography, stone-tool sampling, visual observation, and field notes were used to document the details of each newly discovered site. Previously documented site locations were re-surveyed to ensure the accuracy of the dataset. Ground truthing of all newly documented sites was conducted through three complementary verification processes. First, the prehistoric authenticity of each site was confirmed through on-site identification of lithic assemblages, particularly geometric microliths consistent with the Mesolithic cultural period as documented in the existing research history in Sri Lanka. Second, the accuracy of GPS point recordings was verified against observable landscape features during the field survey. This helped to ensure that modelled GIS outputs correspond to real topographic conditions in the study area. Third, documented prehistoric attributions and site locations were cross-referenced with unpublished reports to verify the accuracy. Collectively, these procedures confirm the reliability of the site inventory used as the basis for the present spatial analysis. The new evidence presented here is based on extensive fieldwork conducted by the authors between 2018 and 2024. Most of these recently discovered prehistoric sites were found during both systematic and random field explorations conducted by the regional archaeology office (Kegalle) of the Department of Archaeology, Sri Lanka [50,51].
The projected 22 GPS locations were selected for raster analysis in ArcMap 10.8 (Esri, Redlands, CA, USA). A digital elevation model (DEM) of the study area, with a 12.5 m resolution (ALOS PALSAR L-band), downloaded from the Alaska Satellite Facility (ASF, University of Alaska Fairbanks, Fairbanks, AK, USA), was utilized. KDE was applied using the Kernel Density tool in ArcMap with the following parameters. The search radius for the present analysis was set to 8366.83 m, computed automatically based on Silverman’s rule of thumb [53,54,55,56]. This automatic bandwidth selection is suitable for small archaeological datasets to minimize the mean integrated squared error and avoid subjective bandwidth selection. Automated bandwidth selection is preferred for the size (n = 22) of the present data set over manual selection. Nevertheless, it is acknowledged that bandwidth selection influences the shape and extent of density clusters. Manually selected bandwidths may produce different visual outputs of clusters. Therefore, the automatic bandwidth selection is used to present small size dataset. The present KDE result, generated using the automatic bandwidth, is considered a representation of spatial density rather than a definitive surface. The output cell size was set to 12.5 m, which matches the DEM resolution of the present analysis. The kernel function was the default quartic kernel, and area units were calculated in square kilometers.
LCP analysis was performed to model the generalized topographic movement potential between 22 GPS points. LCP routes were calculated using the nearest neighboring sites to produce a generalized model of topographic movement potential across the landscape rather than a site-to-site temporal reconstruction. A slope raster was derived from the Slope tool in ArcMap. Then, slope values were converted to degrees, ranging from 1–82.59°. This slope raster was directly used as the cost surface to calculate least-cost routes between 22 GPS points using the Cost Distance and Cost Path tools in the Spatial Analyst toolbox in ArcMap. The slope was considered the sole cost variable for some reasons. First, 12.5 m resolution ALOS PALSAR provides reliable slope data across the study area. There is no data source to extract the same resolution data for prehistoric vegetation, hydrology and resource distribution for the Kegalle District. Second, slope-based cost surfaces are well established in the existing literature for prehistoric LCP studies [57,58,59]. Third, slope-only models provide a solid foundation and transparency, which can be refined with additional environmental datasets that have become available. The LCP analysis was supported by a 3D terrain model.
Corridor analysis was applied to define the probable broader topographic movement zones along the modelled least-cost paths. Buffers of 500 m and 1000 m were generated using the Buffer tool in ArcMap. Two different buffer widths, 500 m and 1000 m, were selected to model the range of probable topographic movement corridors along the least-cost path routes. Ethnographic and experimental studies of hunter-gatherer movements suggest a 500 m buffer zone as a baseline for modelling probable prehistoric movement corridors [60,61,62,63]. The 1000 m corridor represents a broader topographic zone accommodating possible route variation or seasonal shifts in movement. Both buffer widths provide a bracketed range of corridor interpretation rather than a single corridor model.
The dataset in this study has limitations impacting spatial analysis. Absolute radiocarbon dates are only available for three sites: Kitulgala Beli Lena (45,000 cal. BP), Attanagoda Alu Lena (10,350 cal. BP), and Dorawaka Lena (6310 cal. BP). The other 19 sites lack absolute dates and are relatively attributed to the Mesolithic cultural period based on their lithic assemblages, consistent with the Mesolithic period as documented in the existing prehistoric literature in Sri Lanka. The 22 sites fall into four quality tiers with varying archaeological reliability: already documented caves with carbon dates; intact, stratified caves; undated, disturbed caves; open-air sites; and mixed, disturbed sites with low weight. This integrity classification is distinct from the chronological classification presented later in the manuscript. These limitations affect spatial analyses, including KDE interpretation, LCP contemporaneity, and corridor analysis, which are discussed in the Section 4 and Section 5.

4. Results

4.1. Recent Discoveries

Fieldwork identified 16 new prehistoric sites within the boundaries of the modern Kegalle district. Among them, 10 were cave sites, and six were open-air sites (Figure 1). Table 2 provides details of the newly discovered cave sites, while Table 3 presents the open-air sites. All sites in both tables are organized based on the authenticity of the prehistoric context.
Table 2. A summary of newly documented cave sites during the field survey. The table lists the site name, geographic coordinates, elevation of each location relative to mean sea level, and details of the prehistoric contexts of each site. Source: field survey, 2018–2024.
Site NameGPS CoordinatesElevation
(m MSL)
Remarks
BelingalaN 6.917360
E 80.309614
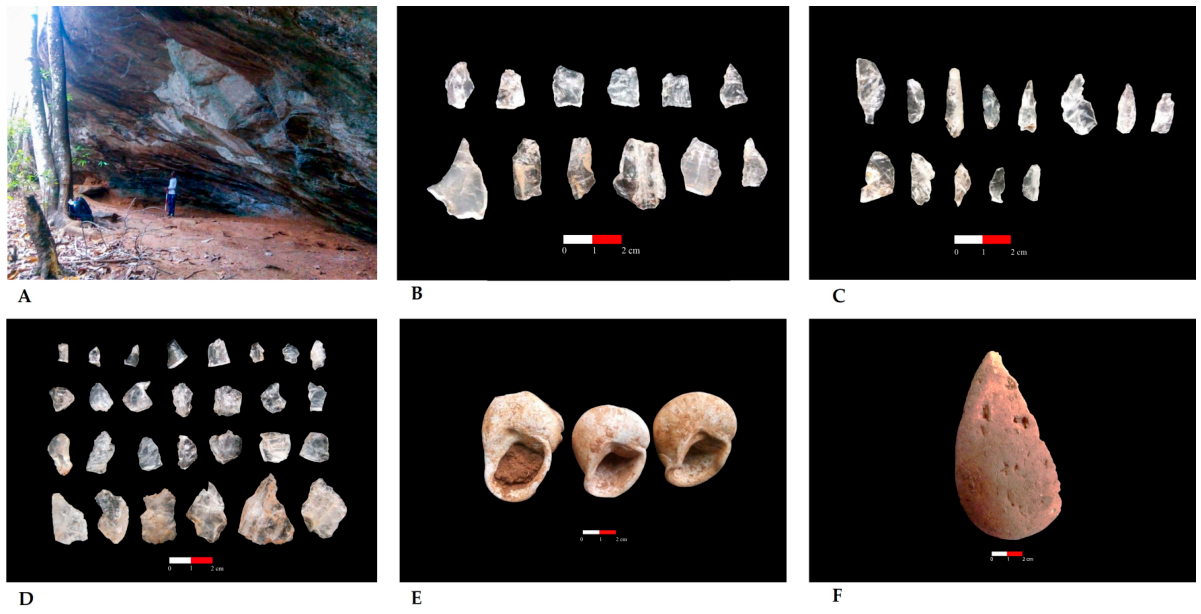
205 mRelatively a large cave site, the floor area is approximately 12 m × 5 m in size. Remaining the original cave deposit with quartz stone tools, flakes, chips and debitage. Pebbles, mollusks and chopping tools on the surface, which belonged to a prehistoric habitation. (Figure 2)
BambaragalaN 6.9922789
E 80.286179
202 mRock shelter with an undisturbed floor, approximately 6 m × 2 m in size. A habituation place with quartz tools and flakes was observed. The original courtyard of this place was affected by a previous landslide, resulting in a steep slope.
MampitaN 7.240680
E 80.270036
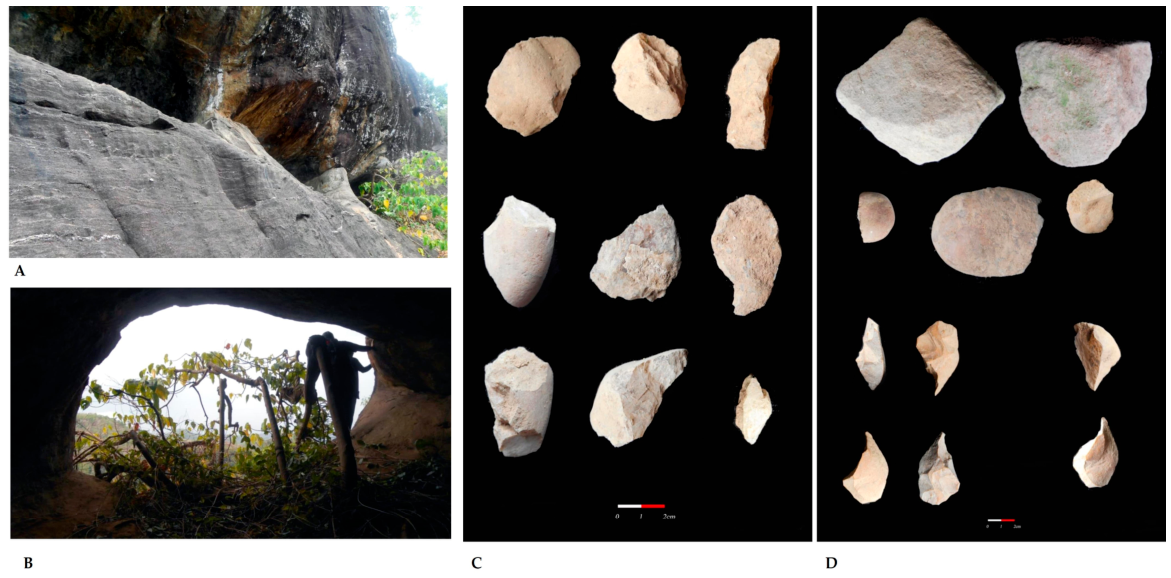
187 mA small cave is located on the edge of the rock boulder. A primary cave deposit with stone tools was observed. The floor area is approximately 1.5 m × 3 m in size. A prehistoric habitation with natural protection. (Figure 3)
Budugal LenaN 7.294416
E 80.429716
238 mPartially distributed cave floor approximately 8 m × 3 m in size. with pebbles and quartz flakes. Habitation site.
Amba LenaN 7.218260
E 80.283700
195 mRock shelter with prehistoric tools, flakes, cores and mollusk evidence. Historical and recent disturbances occurred. The prehistoric occupation site and the cave floor are approximately 15 m × 3 m in size.
PadavigampolaN 7.342517
E 80.365047
213 mHistorical period disturbances occurred. Disturbed the original cave deposit. A habitation site. The cave floor is approximately 5 m × 3 m in size.
EluwanaN 7.017510
E 80.255182
52 mA small-sized cave, and the floor is approximately 4 m × 3 m in size. Historical period disturbances occurred. Quartz flakes and chips can be observed in the vicinity of the cave and possibly a prehistoric habitation site.
SiyambalapitiyaN 7.266726
E 80.333014
232 mDisturbed original deposit. Quartz chips and flakes were observed in the vicinity. Historical period disturbances occurred. possibly a prehistoric habitation site.
PokunugalaN 7.247821
E 80.398277
277 mDisturbed original deposit. Quartz chips and flakes were observed in the vicinity. Relatively small cave, the floor is approximately 3 m × 2 m in size. Possibly a temporary dwelling place.
NilwakkaN 7.275416
E 80.361966
321 mDisturbed original deposit. Quartz chips and flakes can be seen. Recent disturbances have occurred. Relatively small cave with a cave floor approximately 3 m × 2 m in size.
Table 3. A summary of newly documented open-air sites during the field survey. The table lists the site name, geographic coordinates, elevation of each location relative to mean sea level, and details of the prehistoric contexts of each site. Source: field survey, 2018–2024.
Site NameGPS CoordinatesElevation
(m MSL)
Remarks
IllukgodaN 7.278569
E 80.420371
147 mQuartz flakes, chips and cores are visible on the rock plateau. Possibly a temporary campsite.
GanetennaN 7.256231
E 80.468862
385 mThe land belongs to a stone quarry site. Quartz flakes, chips and debitage were observed on the surface of the elevated flat land of the site. Possibly a temporary campsite and a viewpoint.
AmbuwakkaN 7.125401
E 80.311455
324 mQuartz flakes, chips and cores were observed near the rock plateau. Possibly a temporary campsite.
WahawaN 7.324881
E 80.377938
88 mPartially disturbed open-air site. Limited functional interpretation possible due to ongoing quarry activity
KalugalaN 7.287396
E 80.280926
241 mFully disturbed prehistoric context due to the proposed quarry site. Chert and quartz flakes, chips and cores were observed. This place may be a temporary campsite.
PanawalaN 6.875464
E 80.280311
96 mFragmented chopping and chert, quartz flakes were observed on the surface of the ruined mound of the Dutch fort. This is sloped land, possibly a temporary campsite.

4.2. Kernel Density Estimation (KDE)

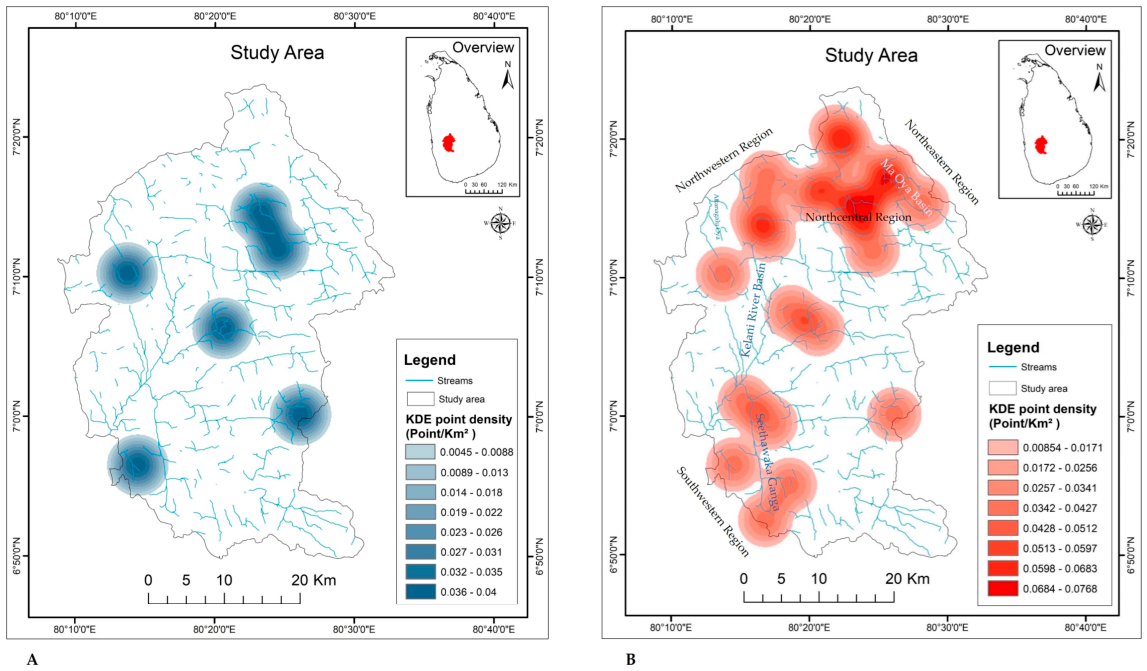
Figure 4 represents the KDE visualization for the two site layers. It is essential to acknowledge that at the outset, with n = 22, the KDE surface is primarily controlled by the automatically selected bandwidth (8366.83 m) rather than genuine spatial structure in the data; the output should therefore be read as a preliminary visualization of relative site concentration rather than a statistically robust density surface. This caveat cautiously suggests that maps indicate that the Ma Oya and Kelani River basins and their tributaries show higher site concentration. Unlike LCP and corridor analysis, KDE used dual-stage visualization to show the density variations separately for existing and combined site layers to indicate the influence of the new sites on the spatial density of prehistoric sites in the study area. In the pattern comparison, the A and B maps in Figure 4 indicate that the north-central cluster has the highest site density. This core area is part of the Ma Oya basin and its tributaries. Compared to map A in Figure 4, map B indicates a higher density in this region. In the northwestern section, map A shows a very low density of prehistoric sites; despite this, map B indicates a higher density owing to recent discoveries. Map B shows a new site concentration in the northwestern section, absent from Map A. In map A, the southern and southwestern regions exhibit a very low density of prehistoric sites. Nonetheless, map B shows a significant increase in density, with a new site density along the Seethawaka Ganga, a tributary of the Kelani River basin. In summary, the combined layer (Map B of Figure 4) shows higher site density and new clusters in the north-central, northwestern, north-eastern, and southwestern regions of the study area than the existing layer (Map A of Figure 4). Nevertheless, the site density of the upper catchment area of the Attanagalu Oya remains unchanged in both maps. (Maps A and B of Figure 4).

4.3. Least-Cost Path Analysis

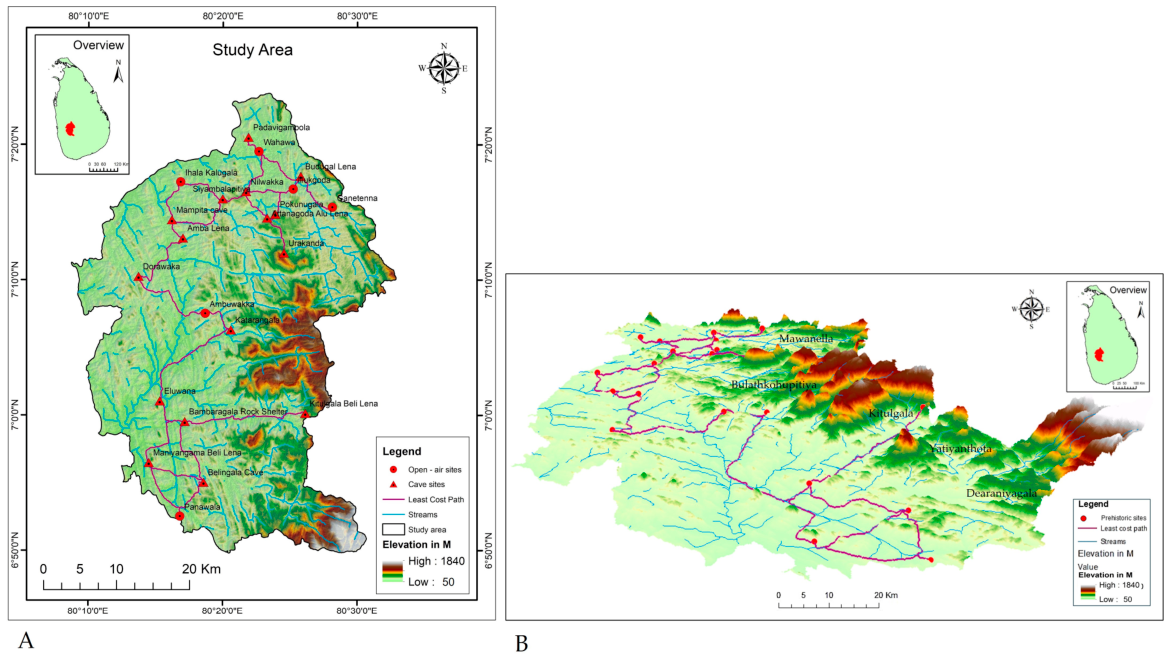
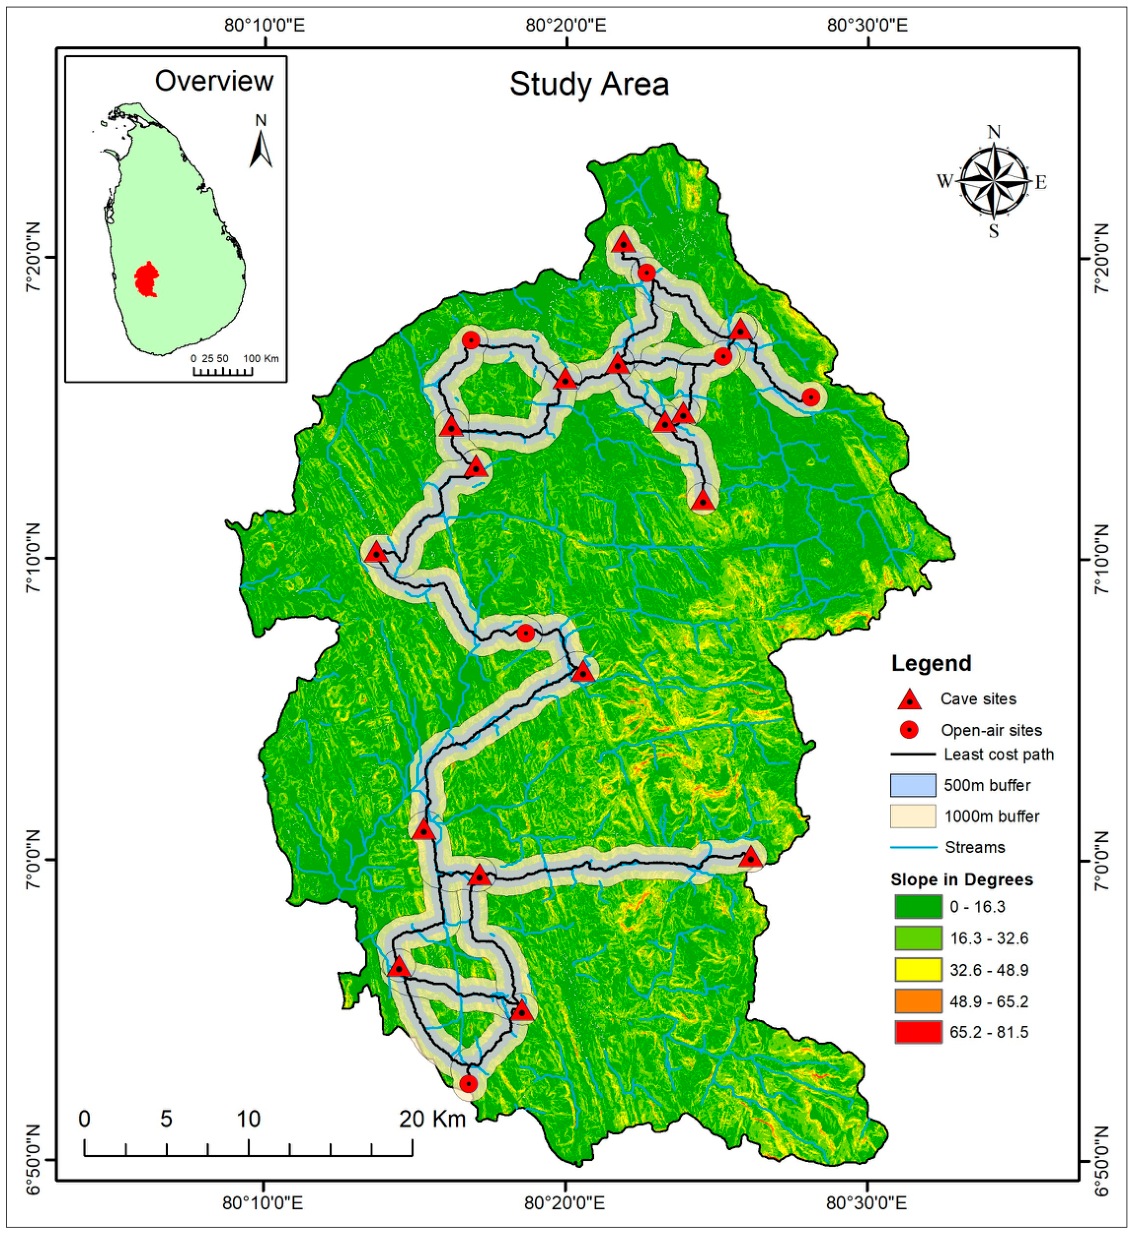
The present LCP analysis indicates several key modelled movement potential patterns. The first is the valley-oriented movement pattern. According to the results, most modelled LCP routes follow natural valley systems and low-elevation corridors. The second aspect is elevation-based site distribution. The elevations of both the cave and the open-air sites in the study area fall within the intermediate zone (200–500 m), typically between high-elevation areas (500–1840 m) and the lowest valley areas (below 200 m). The third is natural bottlenecks and convergence points. Several locations show convergence of multiple LCP routes. On the other hand, topographic bottlenecks are evident in the elevated terrain.
The spatial distribution of sites along the modelled LCP routes shows a mixed pattern. Some sites occur in areas where multiple low-cost routes converge, while others are situated in more topographically isolated positions. Kitulgala Beli Lena, for example, lies at the base of a high mountainous region on the eastern side of the study area, where terrain cost is highest. Several sites in the northern and southern sectors, including Mampita, Nilwakka, Alu Lena, Siyambalapitiya, Budugal Lena, Maniyangama, Bambaragala, and Belingala, occur near topographic convergence points where multiple low-cost terrain routes meet. Two sites, Katarangala and Ambuwakka, are situated in the central part of the study area near terrain that offers low-cost passage between the northern and southern clusters. These topographic positions are described here as landscape features only and lack absolute dates for new sites except for three previously documented sites; no inference of contemporaneous connectivity or network function is made (Figure 5).

4.4. Corridor Analysis

This analysis suggests that a 500 m buffer corridor has a lower average slope than a 1000 m buffer corridor, which is predominantly moderate terrain (62%). The 500 m corridor provides possible routes between prehistoric sites. In contrast, a 1000 m buffer corridor displays a mixed terrain, with more easy movement zones (36%) and more difficult areas (24%) than the 500 m buffer. Overall, a 500 m buffer corridor covers 87% of easy and moderate movement zones for human travel, while a 1000 m buffer corridor covers 76% of these zones (Table 4) (Figure 6). Based on these terrain characteristics, the 500 m buffer corridor represents a more topographically parsimonious movement zone and is retained as the baseline model for further discussion.

5. Discussion

5.1. Methodological Contribution

The present paper represents one of the first systematic GIS-based analytical works for prehistoric spatial analysis in Sri Lanka. Previous studies were mainly focused on typological and geoarchaeological applications, and GIS was used as a map-making tool rather than an analytical tool. By integrating KDE, LCP and corridor modelling into a single analytical approach, this approach provides richer analytical and interpretive capabilities for prehistoric data than traditional site-by-site individual descriptions. This integrated framework advances Sri Lankan prehistoric research from individual site descriptions to regional-scale spatial patterning. This approach provides a transparent, replicable analytical model for future prehistoric spatial studies in comparable landscapes. The methodological frame adopted here builds on widely adopted global GIS-based spatial studies; KDE, LCP and corridor analyses were widely applied for regional-scale case studies [66,67,68,69,70,71]. Such studies are extremely rare in Sri Lankan prehistory. In contrast, one recent prehistoric study applied KDE to analyze artefact densities across different soil layers in the stratigraphy of an excavation [47]. The results of the present paper suggest that the GIS-based approach is productive in prehistoric spatial analysis. This provides a replicable framework for future spatial studies in prehistoric archaeology in Sri Lanka. Beyond the methodological replication, the integrated framework indicated here generates three categories of testable hypotheses for future archaeological fieldwork. First, priority excavation targets are intact cave sites with undisturbed primary deposits. Second, priority survey zones include areas of low site density, which may reflect survey gaps rather than the genuine absence of prehistoric sites. Third, systematic survey targets along the modelled valley corridor zones where modelled movement potential is highest.

5.2. Site Density and the Significance of Discoveries

The work identified 16 new prehistoric caves and open-air sites and integrated them with the six previously documented sites, which increased the site inventory of the study area to 22. The most important finding is not only the increased site count, but also the visualization of spatial patterning and clustering of prehistoric sites. These findings improve the regional prehistory from individual site-by-site recording to a regional spatial pattern. It should be acknowledged that the 16 newly documented sites significantly contributed to increasing the site inventory, but the sample size is relatively small to draw firm conclusions about regional site distribution patterns. The spatial clusters identified by the KDE should be interpreted cautiously for two compounding reasons: first, the bandwidth-controlled surface at n = 22 cannot reliably distinguish real clustering from mathematical smoothing; second, site distribution may partly reflect survey coverage rather than genuine prehistoric density. A systematic survey has not been conducted uniformly across the study area. Therefore, the areas of low site density, especially in the eastern and southern margins, may reflect survey gaps rather than the genuine absence of prehistoric sites. Based on these facts, the present study should be understood as an exploratory framework that suggests preliminary spatial patterns, which will be clarified through future comprehensive investigations. Furthermore, the comparison between existing and combined site layers reveals differences in survey coverage across the study area. Site concentrations identified in the northwestern and southwestern regions are treated as preliminary spatial observations that may partly reflect survey coverage patterns rather than confirmed prehistoric site density.
It is recognized that the 22 sites used in the spatial analysis have varying levels of archaeological significance. Four tiers are categorized based on the reliability of their archaeological contexts. (Table 5) Tier 1 includes three well-documented cave sites, Kitulgala Beli Lena, Attanagoda Alu Lena, and Dorawaka Lena, that contain stratified deposits and have absolute radiocarbon dates, representing the highest evidential value. Tier 2 consists of three newly documented cave sites, Belingala, Bambaragala, and Mampita, that possess intact primary deposits with in-situ lithic assemblages. Although they lack absolute dates, these sites are considered archaeologically reliable due to their undisturbed deposits. Tier 3 includes the remaining disturbed cave and open-air sites, where deposits have been partially or fully altered by later human activity or natural processes. These contribute to the spatial distribution analysis but have moderate to low evidential weight owing to compromised stratigraphy. Tier 4 encompasses two sites, Urakanda and Panawala, with the lowest evidential weight. Urakanda has a low density of diagnostic tools, with prehistoric attribution based on similarities in engravings. Panawala presents a mixed, disturbed context linked to a Dutch fort mound, making cultural dating uncertain. Ideally, each tier should be analyzed separately because of its differing archaeological reliability. However, due to the small size of each tier, separate spatial analyses are unfeasible for now. As a result, treating all 22 sites as a single analytical layer is a limitation, which may introduce spatial bias, particularly affecting the KDE surface and LCP route pattern. Future research with larger, chronologically controlled site inventories should analyze these tiers separately, and the number of sites in each tier may change with future discoveries and excavations.
Apart from the first three sites in Table 2, all other cave and open-air sites were disturbed due to later human activities and some natural reasons, such as floods and landslides. These cultural and natural site formations were subjected to erosion, burial, or dislocated surface prehistoric evidence over time. All sites in Table 3 show evidence of recent modifications to their original deposits. The functional appearances of these sites were given according to the surface assemblages and observations. Due to the absence of absolute dating for new sites, they are relatively attributed to the Mesolithic period based on their lithic assemblages. The surface assemblages observed across these sites consist predominantly of geometric microliths, a diagnostic lithic technology directly consistent with the Mesolithic cultural period as documented in the existing Sri Lankan prehistoric literature, particularly the excavated assemblages from Kitulgala Beli Lena, Attanagoda Alu Lena and Dorawaka Lena [27,28,30,38]. This lithic basis provides the primary evidence for the prehistoric attribution of the newly documented sites.

5.3. Modelled Movement Potential and Landscape Structure

The present LCP analysis identifies possible low-elevation, valley-oriented routes corresponding to major river basins. This pattern of valley-oriented modelled movement potential is consistent with topography and surface water availability as landscape structuring factors, representing a preliminary spatial observation that requires verification through future explorations and absolute dating. This pattern is consistent with previous studies, which suggested the influence of topography and proximity to surface water sources [71,72,73,74,75]. The LCP results show that some sites are located near topographic convergence points where multiple low-cost routes meet, while others occupy intermediate terrain positions between the northern and southern site clusters. These are considered topographic descriptions of landscape position, not inferences about site function or contemporaneous interaction. The distribution of cave and open-air sites within the intermediate elevation zone (200–500 m) represents a preliminary landscape pattern observable from the GIS analysis. This intermediate positioning between high-elevation terrain and low-lying valley areas is noted here as a descriptive landscape characteristic of the dataset. Whether this distribution reflects deliberate site selection strategies related to resource access cannot be determined from surface survey and topographic modeling alone and requires future excavations and paleoenvironmental data for weighted interpretations. It should be acknowledged that LCP analysis is inherently limited by its algorithmic assumptions. The model identifies topographically ideal routes based merely on slope. Therefore, it represents one possible interpretation of prehistoric movement rather than a complete reconstruction. Actual prehistoric movement may have been influenced by various additional factors beyond topography. Some of them may be social networks, resource distribution, territorial boundaries, or seasonal factors, which are not captured by terrain cost alone [72,76,77]. Therefore, the results presented here are interpreted as an exploratory generalized topographic model, rather than confirmed prehistoric pathways. Another critical limitation of the LCP routes is the absence of absolute dates for the 16 new sites. Therefore, this LCP is considered a generalized model to visualize the modelled movement potential across the study area, rather than a contemporaneous model.
A key methodological limitation of the current LCP analysis is its inability to incorporate the temporal dimension of documented sites. For more reliable results, future research should employ a stronger method: calculating least-cost routes between randomly placed points across the landscape and analyzing whether documented sites tend to cluster along these natural corridors [57,59]. This distinction matters because site-to-site LCP estimates travel costs between known locations, while random-point LCP reveals the landscape’s inherent movement pathways, independent of site locations. This allows researchers to test if sites align with expected movement patterns based on landscape features alone. Due to a small and mostly undated site inventory, this approach was not feasible for the present study, limiting the statistical power of clustering tests against a random baseline. Future studies with detailed, chronologically controlled data should adopt the random-point LCP method to carefully determine whether the distribution of sites in Kegalle District aligns with natural movement corridors or if other factors, such as survey bias or preservation issues, influence the pattern.
Valley-oriented site distribution and modelled movement potential observed in the present study are broadly consistent with prehistoric site settings documented in the wider tropical South Asian context. As mentioned in the introduction, direct GIS-based prehistoric spatial analysis remains limited in Sri Lanka. In contrast, previous studies indicate similarities with prehistoric cave and open-air site settings as well as relationships with their contemporary landscape features, especially riverine lifeways and proximity to the water. Stratified excavations revealed various forms of evidence to prove prehistoric human–environment interactions. Some prehistoric cave sites recovered marine resources, which provide evidence of long-distance prehistoric movement documented in the existing literature [27,30,32,33,35,37,38]. Six previously documented prehistoric cave sites in the study area, especially Kitulgala Beli Lena (45,000 cal. BP), Attanagoda Alu Lena (10,350 cal. BP), and Dorawaka Lena (6310 cal. BP), relied on archaeological excavation, stratigraphy, and chronometric evidence rather than spatial GIS-based modelling. The environmental contexts identified in those studies are broadly comparable with the patterns observed in the present research. Findings of the present study can be integrated with the existing prehistoric body of the study area to analyze the prehistoric landscape features.

5.4. Movement Corridor Characteristics

In comparison of the 500 m and 1000 m corridor widths, the 500 m corridor exhibits more favorable terrain parameters (mean slope 13.67° vs. 14.41°; 87% favorable terrain vs. 76%). Technically, this result suggests that a 500 m corridor represents a more topographically favorable movement zone. It should be acknowledged that this difference occurred due to the use of the same underlying LCP route for the slope analysis. The purpose of comparing two corridor widths is not to identify the prehistorically correct movement zone, which terrain data alone cannot establish, but to provide a methodological baseline for prehistoric mobility modelling. More transparency and validation data, including ethnographic observations on hunter-gatherer movements, are needed. Existing literature suggests that natural barriers such as water bodies, steep slopes and mountain ranges may have influenced the prehistoric population to use multiple routes or wider pathways while travelling between two destinations [78,79]. In future studies, the present statistical data should be incorporated with additional environmental and ethnographical data, which would provide a more transparent basis to model prehistoric corridor widths.
The integration of three spatial analyses strengthens the interpretative capabilities of individual results. The KDE identified the Ma Oya basin and the Seethawaka Ganga tributary as areas of high-density site scattering. The topographic convergence points identified through LCP analysis in the northern and southern regions of the study area are consistent with KDE results. This correspondence suggests that areas of higher site density align with topographically favorable movement terrain, a pattern consistent with landscape-structured site location, though not interpretable as evidence of deliberate site placement given the chronological uncertainties. Furthermore, corridor analysis indicates that the LCP routes connecting these density clusters are along low-gradient valley terrain. Collectively, the integration of the three analytical results suggests a consistent preliminary picture of valley-oriented landscape use, with the Ma Oya and Kelani River basins representing the principal areas of site concentration and topographically favorable movement terrain in the study area. This picture is treated as an exploratory framework pending validation through radiocarbon dating, systematic survey, and expanded site inventories. Specifically, the integrated results generate the following testable hypotheses for future archaeological investigations. First, three cave sites with intact cave deposits, Belingala, Bambaragala, and Mampita, provide priority targets for future excavations and enable stratified carbon dating. Second, the eastern and southern margins mentioned low survey coverage, as indicated by KDE, making them a suitable case for future surface explorations as priority zones. Third, the results generated through LCP and corridor analyses can be used to test whether additional prehistoric site clusters are along topographically possible movement terrain in the study area.

5.5. Limitations and Future Research

Overall, these integrated methods provide a preliminary spatial analytical framework for examining prehistoric site distribution and modelled movement potential in the study area, establishing a foundation for future systematic investigations. Despite this, the present study has limitations, including a limited time period survey, a limited number of sites, and a lack of paleoenvironmental data for slope analysis. In addition, the absence of radiocarbon dating and formal typological order for the newly documented sites is another limitation of the present study. The disturbed conditions of many caves and open-air sites significantly limit comparison based on surface assemblages with standard tool typologies. This study observed only surface tool scattering, and it is difficult to assign it to specific cultural periods without stratigraphic contexts. Nevertheless, three cave sites, Belingala, Bambaragala and Mampita, retain their original cave deposits and offer high potential for future radiocarbon dating and tool typology analysis. The areas such as Deraniyagala, Yatiyanthota, Bulathkohupitiya, and the mountain ranges around Mawanella and the upper catchment areas of the Attanagalu Oya will provide high potential for future prehistoric studies in the study area. Such future works will allow researchers to place the spatial patterns of the present study in the absolute chronological frame of reference.

6. Conclusions

The present study addresses three research questions concerning the spatial distribution of prehistoric sites, modelled movement potential and probable corridor zones, and the application of an integrated GIS-based analytical framework to generate testable hypotheses for future archaeological fieldwork in the Kegalle district of Sri Lanka. This study presents two primary contributions to prehistoric studies in Sri Lanka. Empirically, new findings expand the prehistoric site inventory of the study area from six to 22. In addition to that, previous documentation was conducted without a GIS-based analytical framework, and spatial relationships between sites were not examined at a regional scale. The present study establishes this foundation for the first time. This contribution identifies areas of higher site density in the north, northwestern, northeastern and southwestern regions of the study area, expanding beyond the previously documented individual sites. Methodologically, this paper indicates one of the first systematic applications of an integrated GIS-based analytical framework for prehistoric spatial analysis in Sri Lanka. A combination of KDE, LCP and corridor modelling provides a productive spatial analytical output to interpret prehistoric site scattering and modelling of low-cost topographic routes across the challenging topography of the study area. The key findings of the present study are threefold. First, the KDE visualization shows that site density in the study area is higher than previously documented, with broader spatial distribution across the Ma Oya and Kelani basins. Given the small sample size (n = 22) and the bandwidth-controlled nature of the KDE surface, these patterns are treated strictly as preliminary spatial indications that identify priority areas for future systematic survey, not as evidence of confirmed prehistoric site clusters. Second, the LCP analysis identifies valley-oriented topographic corridors and low-cost movement terrain consistent with riverine landscape use. Given that the sites span a potential chronological range of approximately 40,000 years and most lack absolute dates, the analysis describes landscape movement potential rather than a contemporaneous prehistoric movement network. Third, corridor analysis indicates that the 500 m width model captured more topographically probable movement routes than the 1000 m corridor. This provides a methodological foundation for future prehistoric movement modelling in comparable landscapes.
This study acknowledges some limitations, such as limited field surveys, the absence of absolute dating for new sites and a lack of paleoenvironmental data. There are some high-potential regions in the study area yet to be explored. Future surveys need to explore those areas, and this will extend the results of the present study. Finally, the methodological framework developed through the present paper is a combination of random and systematic field surveys with integrated GIS-based analytical techniques, which provides a transparent and replicable model for future prehistoric studies in similar landscapes of Sri Lanka. This study shows that GIS-based spatial analysis, when applied before extensive fieldwork, can be an effective tool for generating hypotheses in prehistoric archaeology. By pinpointing survey priority zones in regions with low site density and modeling valley corridor areas as systematic survey targets, the proposed framework offers clear and practical guidance for future archaeological fieldwork in the Kegalle District. Additionally, it provides a replicable model for comparable prehistoric landscapes throughout Sri Lanka.

Author Contributions

Conceptualization, D.J.; Methodology, D.J.; Visualization, D.J.; Investigation, D.J.; Formal Analysis, D.J.; Writing Original Draft Preparation, D.J.; Writing Review and Editing, T.M.; Supervision, T.M.; Funding Acquisition, T.M.; Data Curation, D.J. All authors have read and agreed to the published version of the manuscript.

Funding

This research received no external funding. The Article Processing Charge (APC) was funded by the Japan Science and Technology Agency (JST) SPRING, Grant Number JPMJSP2124.

Data Availability Statement

All data supporting the findings of this study are openly available. Site coordinates, GIS processing parameters, and analytical workflow documentation are deposited at Zenodo: DOI 10.5281/zenodo.20174383. The DEM data used in this study are openly available from the Alaska Satellite Facility (ASF) Earth Data at https://search.asf.alaska.edu (accessed on 29 June 2026).

Acknowledgments

The authors acknowledge Saman Eregama, Rananjaya Premawardhane, and Darshana Senanayake for their contributions to fieldwork. The authors also acknowledge the Regional Archaeology Office (Kegalle), Department of Archaeology, Sri Lanka, for institutional support and access to unpublished field reports. The Article Processing Charge (APC) for this work was supported by JST SPRING.

Conflicts of Interest

The authors declare no conflicts of interest.

Abbreviations

The following abbreviations are used in this manuscript:
GISGeographic Information Systems
GPSGlobal Positioning System
KDEKernel Density Estimation
LCP Least-Cost Path
DEM Digital Elevation Model
ASFAlaska Satellite Facility
ALOSAdvanced Land Observing Satellite
MSLMean Sea Level
BPYears Before Present
Cal. BPCalibrated Years Before Present
TLThermoluminescence

References

  1. Conolly, J.; Lake, M. Geographical Information Systems in Archaeology. In Cambridge Manuals in Archaeology; Cambridge University Press: Cambridge, UK, 2006. [Google Scholar]
  2. McCoy, M.D.; Ladefoged, T.N. New Developments in the Use of Spatial Technology in Archaeology. J. Archaeol. Res. 2009, 17, 263–295. [Google Scholar] [CrossRef]
  3. Menéndez-Marsh, F.; Al-Rawi, M.; Fonte, J.; Dias, R.; Gonçalves, L.J.; Seco, L.G.; Hipólito, J.; Machado, J.P.; Medina, J.; Moreira, J. Geographic Information Systems in Archaeology: A Systematic Review. J. Comput. Appl. Archaeol. 2023, 6, 104. [Google Scholar] [CrossRef]
  4. Spikins, P. GIS Models of Past Vegetation: An Example from Northern England, 10,000–5000 BP. J. Archaeol. Sci. 2000, 27, 219–234. [Google Scholar] [CrossRef]
  5. Spikins, P.; Conneller, C.; Ayestaran, H.; Scaife, B. GIS Based Interpolation Applied to Distinguishing Occupation Phases of Early Prehistoric Sites. J. Archaeol. Sci. 2002, 29, 1235–1245. [Google Scholar] [CrossRef]
  6. Caracausi, S.; Berruti, G.L.F.; Daffara, S.; Bertè, D.; Borel, F.R. Use of a GIS Predictive Model for the Identification of High Altitude Prehistoric Human Frequentations. Results of the Sessera Valley Project (Piedmont, Italy). Quat. Int. 2018, 490, 10–20. [Google Scholar] [CrossRef]
  7. Alexakis, D.; Sarris, A.; Astaras, T.; Albanakis, K. Remote Sensing and Geomorphologic Approaches for the Reconstruction of the Landscape Habitation of Thessaly during the Neolithic Period. J. Archaeol. Sci. 2011, 38, 89–100. [Google Scholar] [CrossRef]
  8. Garcia, A. GIS-Based Methodology for Palaeolithic Site Location Preferences Analysis. A Case Study from Late Palaeolithic Cantabria (Northern Iberian Peninsula). J. Archaeol. Sci. 2013, 40, 217–226. [Google Scholar] [CrossRef]
  9. Li, G.; Dong, J.; Che, M.; Wang, X.; Fan, J.; Dong, G. GIS and Machine Learning Models Target Dynamic Settlement Patterns and Their Driving Mechanisms from the Neolithic to Bronze Age in the Northeastern Tibetan Plateau. Remote Sens. 2024, 16, 1454. [Google Scholar] [CrossRef]
  10. Yang, G.; Yao, C. GIS-Based Analysis of Distribution Patterns and Underlying Motivations of Prehistoric Settlements in the Middle and Lower Yuanjiang River Basin, Central China. Appl. Sci. 2025, 15, 2064. [Google Scholar] [CrossRef]
  11. Miera, J.J.; Schmidt, K.; von Suchodoletz, H.; Ulrich, M.; Werther, L.; Zielhofer, C.; Ettel, P.; Veit, U. Large-Scale Investigations of Neolithic Settlement Dynamics in Central Germany Based on Machine Learning Analysis: A Case Study from the Weiße Elster River Catchment. PLoS ONE 2022, 17, 0265835. [Google Scholar] [CrossRef] [PubMed]
  12. Leloch, M.; Kot, M.; Pavlenok, G.; Szymczak, K.; Khudjanazarov, M.; Pavlenok, K. Tracing the Palaeolithic Settlement Patterns in the Western Tian Shan Piedmont: An Example of Predictive GIS Modelling Use. J. Quat. Sci. 2022, 37, 527–542. [Google Scholar] [CrossRef]
  13. White, D.A.; Barber, S.B. Geospatial Modeling of Pedestrian Transportation Networks: A Case Study from Precolumbian Oaxaca, Mexico. J. Archaeol. Sci. 2012, 39, 2684–2696. [Google Scholar] [CrossRef]
  14. Seifried, R.M.; Gardner, C.A.M. Reconstructing Historical Journeys with Least-Cost Analysis: Colonel William Leake in the Mani Peninsula, Greece. J. Archaeol. Sci. Rep. 2019, 24, 391–411. [Google Scholar] [CrossRef]
  15. Beyin, A.; Hall, J.; Day, C.A. A Least Cost Path Model for Hominin Dispersal Routes out of the East African Rift Region (Ethiopia) into the Levant. J. Archaeol. Sci. Rep. 2019, 23, 763–772. [Google Scholar] [CrossRef]
  16. Nuttall, C. A GIS Analysis of Coastal Proximity with a Prehistoric Greek Case Study. J. Comput. Appl. Archaeol. 2024, 7, 170–184. [Google Scholar] [CrossRef]
  17. Bonnier, A.; Finné, M.; Weiberg, E. Examining Land-Use through GIS-Based Kernel Density Estimation: A Re-Evaluation of Legacy Data from the Berbati-Limnes Survey. J. Field Archaeol. 2019, 44, 70–83. [Google Scholar] [CrossRef]
  18. Chen, N.; Ming, B.; Chen, Y.; Wang, H.; Zhao, Y.; Jie, D.; Gao, G.; Niu, H. Spatial-Temporal Variations of Paleolithic Human Activities in Northeast China. Quat. Int. 2024, 691, 18–30. [Google Scholar] [CrossRef]
  19. Yang, L.; Zhao, Y.; Yuan, W.; Jai, X. GIS-Based Analysis of the Regional Typology of Neolithic Archaeological Cultures in the Taihu Lake Region of China. Land 2024, 13, 244. [Google Scholar] [CrossRef]
  20. Wheatley, D.; Gillings, M. Spatial Technology and Archaeology: The Archaeological Applications of GIS; CRC Press: Boca Raton, FL, USA, 2013. [Google Scholar]
  21. Verhagen, P. Spatial Analysis in Archaeology: Moving into New Territories. In Digital Geoarchaeology: New Techniques for Interdisciplinary Human-Environmental Research; Siart, C., Forbriger, M., Bubenzer, O., Eds.; Springer International Publishing: Cham, Switzerland, 2018. [Google Scholar]
  22. Nandi, D. Study of Palaeolithic Archaeology Using GIS: A Case Study from Kuliana Block of Mayurbhanj District in Odisha. Int. J. Inf. Res. Rev. 2014, 1, 195–205. [Google Scholar]
  23. Banerjee, R.; Srivastava, P.K.; Pike, A.W.G.; Petropoulos, G.P. Identification of Painted Rock-Shelter Sites Using GIS Integrated with a Decision Support System and Fuzzy Logic. ISPRS Int. J. Geo-Inf. 2018, 7, 326. [Google Scholar] [CrossRef]
  24. Pappu, S.; Akhilesh, K.; Ravindranath, S.; Raj, U. Applications of Satellite Remote Sensing for Research and Heritage Management in Indian Prehistory. J. Archaeol. Sci. 2010, 37, 2316–2331. [Google Scholar] [CrossRef]
  25. Vidyarthi, V.; Chauhan, P. Mapping the Indian Palaeolithic. J. Comput. Appl. Archaeol. 2025, 8, 78–93. [Google Scholar] [CrossRef]
  26. Begade, S. A Predictive Model for the Identification of Open-Air Palaeolithic Sites in Nagpur and Chandrapur Districts, Maharashtra. India J. Archaeol. Sci. Rep. 2026, 69, 105541. [Google Scholar] [CrossRef]
  27. Deraniyagala, S.U. The Prehistory of Sri Lanka: An Ecological Perspective; Department of Archaeological Survey: Colombo, Sri Lanka, 1992. [Google Scholar]
  28. Wijeyapala, W.H. New Light on the Prehistory of Sri Lanka in the Context of Recent Investigations at Cave Sites. Unpublished Ph.D. Thesis, University of Peradeniya, Peradeniya, Sri Lanka, 1997. [Google Scholar]
  29. Premathilake, R.; Risberg, J. Late Quaternary Climate History of the Horton Plains, Central Sri Lanka. Quat. Sci. Rev. 2003, 22, 1525–1541. [Google Scholar] [CrossRef]
  30. Perera, H.N. Prehistoric Sri Lanka: Late Pleistocene Rock Shelters and Open-Air Sites; Archaeopress: Oxford, UK, 2010. [Google Scholar]
  31. Premathilake, R. Relationship of Environmental Changes in Central Sri Lanka to Possible Prehistoric Land-Use and Climate Changes. Palaeogeogr. Palaeoclim. Palaeoecol. 2006, 240, 468–496. [Google Scholar] [CrossRef]
  32. Perera, N.; Kourampas, N.; Simpson, I.A.; Deraniyagala, S.U.; Bulbeck, D.; Kamminga, J. People of the Ancient Rainforest: Late Pleistocene Foragers at the Batadomba-lena Rockshelter, Sri Lanka. J. Hum. Evol. 2011, 61, 254–269. [Google Scholar] [CrossRef] [PubMed]
  33. Kourampas, N.; Simpson, I.A.; Perera, H.N.; Deraniyagala, S.U. Late Pleistocene Hunter-Gatherers in the South Asian Rainforest: Geoarchaeology of Inhabited Rockshelters in South-Western Sri Lanka. Antiquity 2008, 82, 1–4. [Google Scholar] [CrossRef]
  34. Premathilake, R. Human Used Upper Montane Ecosystem in the Horton Plains, Central Sri Lanka—A Link to Lateglacial and Early Holocene Climate and Environmental Changes. Quat. Sci. Rev. 2012, 50, 23–42. [Google Scholar]
  35. Roberts, P.; Perera, N.; Wedage, O.; Deraniyagala, S.; Perera, J.; Eregama, S. Direct Evidence for Human Reliance on Rainforest Resources in Late Pleistocene Sri Lanka. Science 2015, 347, 1246–1249. [Google Scholar] [CrossRef] [PubMed]
  36. Roberts, P.; Wedage, O.; Deraniyagala, S.; Perera, J.; Perera, N.; Eregama, S. Fruits of the Forest: Carbon and Nitrogen Stable Isotope Analysis of Rainforest Foraging in Late Pleistocene and Holocene Sri Lanka. J. Quat. Sci. 2017, 32, 752–763. [Google Scholar]
  37. Wedage, O.; Picin, A.; Blinkhorn, J.; Douka, K.; Deraniyagala, S.; Kourampas, N. Microliths in the South Asian Rainforest 45–4 Ka: New Insights from Fa-Hien Lena Cave, Sri Lanka. PLoS ONE 2019, 14, e0222606. [Google Scholar] [CrossRef] [PubMed]
  38. Wedage, O.; Roberts, P.; Faulkner, P.; Crowther, A.; Douka, K.; Picin, A.; Blinkhorn, J.; Deraniyagala, S.; Boivin, N.; Petraglia, M. Late Pleistocene to Early-Holocene Rainforest Foraging in Sri Lanka: Multidisciplinary Analysis at Kitulgala Beli-Lena. Quat. Sci. Rev. 2020, 231, 106200. [Google Scholar] [CrossRef]
  39. Siriwardana, T.M.; Manusinghe, P.P. Archaeology and Ecology of Acavus Snails in Sri Lanka’s Semi-Arid to Intermediate Zones: Uncovering Holocene Microclimatic Changes. Asian Archaeol. 2024, 8, 97–112. [Google Scholar] [CrossRef]
  40. Sarasin, P.; Sarasin, F. Stone Implements in Veddha Caves. Spolia Zeylan. 1907, 4, 188–190. [Google Scholar]
  41. Parsons, J. The Modes of Occurrence of Quartz in Ceylon. Spolia Zeylan. 1908, 5, 171–177. [Google Scholar]
  42. Parker, H. Ancient Ceylon; Luzac & Co.: London, UK, 1909. [Google Scholar]
  43. Lewis, F. Flints and Etc. from a Cave at Urumutta. Spolia Zeylan. 1912, 8, 119–165. [Google Scholar]
  44. Hartley, C. The Stone Implements of Ceylon. Spolia Zeylan. 1913, 9, 117–123. [Google Scholar]
  45. Wayland, E.J. Outlines of the Stone Age of Ceylon. Spolia Zeylan. 1919, 11, 85–125. [Google Scholar]
  46. Noone, N.A.; Noone, H.V.V. The Stone Implements of Bandarawela (Ceylon). Ceylon J. Sci. 1940, 3, 1–24. [Google Scholar]
  47. Amano, N. Early Sri Lankan Coastal Site Tracks Technological Change and Estuarine Resource Exploitation over the Last ca. 25,000 Years. Sci. Rep. 2024, 14, 26693. [Google Scholar] [CrossRef] [PubMed]
  48. Somadeva, R. The Archaeology of Mountains: Holocene Adaptations of Prehistoric Hunter-Gatherers; Postgraduate Institute of Archaeology, University of Kelaniya: Colombo, Sri Lanka, 2014. [Google Scholar]
  49. Krishnarajah, S. A Preliminary Investigation for the Study of Stone Age Culture Based on Archaeological Evidences. Nāgānanda Int. J. Humanit. Soc. Sci. 2021, 2, 1–16. [Google Scholar]
  50. Archaeological Impact Assessment in Galigamuwa, Palapoluwa, Bata-Pothella in Kegalle District; Regional Archaeology Office, Kegalle, Department of Archaeology: Colombo, Sri Lanka, 2019.
  51. Archaeological Impact Assessment for the Proposed Hydro Power Plant Project at Seethawaka River in Kegalle District; Regional Archaeology Office, Kegalle, Department of Archaeology: Colombo, Sri Lanka, 2019.
  52. Ranasinghe, P.C.H. District Environmental Profile: Kegalle; Central Environmental Authority: Colombo, Sri Lanka, 1991. [Google Scholar]
  53. Baxter, M.J.; Beardah, C.C.; Wright, R.V.S. Some Archaeological Applications of Kernel Density Estimates. J. Archaeol. Sci. 1997, 24, 347–354. [Google Scholar] [CrossRef]
  54. McMahon, T.C. Discerning Prehistoric Landscapes in Colorado and the Mesa Verde Region Using a Kernel Density Estimate (KDE) Method. In Digital Discovery: Exploring New Frontiers in Human Heritage, CAA 2006; Clark, J.T., Hagemeister, E.M., Eds.; Archaeolingua: Budapest, Hungary, 2007; pp. 151–166. [Google Scholar]
  55. Ducke, B. Spatial Cluster Detection in Archaeology: Current Theory and Practice. In Mathematics and Archaeology; CRC Press: Boca Raton, FL, USA, 2015. [Google Scholar]
  56. Pollard, A.M.; Ma, Q.; Bidegaray, A.-I.; Liu, R. The Use of Kernel Density Estimates on Chemical and Isotopic Data in Archaeology. In Handbook of Archaeological Sciences; John Wiley & Sons: Hoboken, NJ, USA, 2023; pp. 1227–1240. [Google Scholar]
  57. White, D.A.; Surface-Evans, S.L. Least Cost Analysis of Social Landscapes: Archaeological Case Studies; University of Utah Press: Salt Lake City, UT, USA, 2012. [Google Scholar]
  58. Taliaferro, M.S.; Schriever, B.A.; Shackley, M.S. Obsidian Procurement, Least Cost Path Analysis, and Social Interaction in the Mimbres Area of Southwestern New Mexico. J. Archaeol. Sci. 2010, 37, 536–548. [Google Scholar] [CrossRef]
  59. Herzog, I. The Potential and Limits of Optimal Path Analysis. In Computational Approaches to Archaeological Spaces; Routledge: London, UK, 2013. [Google Scholar]
  60. Whitley, T.G.; Hicks, L.M. A Geographic Information Systems Approach to Understanding Potential Prehistoric and Historic Travel Corridors. Southeast. Archaeol. 2003, 22, 77–91. [Google Scholar]
  61. Hazell, L.C.; Brodie, G. Applying GIS Tools to Define Prehistoric Megalith Transport Route Corridors: Olmec Megalith Transport Routes: A Case Study. J. Archaeol. Sci. 2012, 39, 3475–3479. [Google Scholar] [CrossRef]
  62. Bilotti, G.; Kempf, M.; Morillo Leon, J.M. Modelling Land and Water Based Movement Corridors in the Western Mediterranean: A Least Cost Path Analysis from Chalcolithic and Early Bronze Age Ivory Records. Archaeol. Anthr. Sci. 2024, 16, 122. [Google Scholar] [CrossRef]
  63. Moreno-Meynard, P.; Méndez, C.; Irarrázaval, I.; Nuevo-Delaunay, A. Past Human Mobility Corridors and Least-Cost Path Models South of General Carrera Lake, Central West Patagonia (46° S, South America). Land 2022, 11, 1351. [Google Scholar] [CrossRef]
  64. Tobler, W. Three Presentations on Geographical Analysis and Modeling; National Center for Geographic Information and Analysis: Santa Barbara, CA, USA, 1993. [Google Scholar]
  65. White, D.A. The Basics of Least Cost Analysis for Archaeological Applications. Adv. Archaeol. Pract. 2015, 3, 407–414. [Google Scholar] [CrossRef]
  66. Rogers, S.R.; Collet, C.; Lugon, R. Least Cost Path Analysis for Predicting Glacial Archaeological Site Potential in Central Europe. In Across Space and Time; Routledge: London, UK, 2015. [Google Scholar]
  67. Cross, K. Least Resistance? Cost-Path Analysis and Hunter-Gatherer Mobility in the Virginia Blue Ridge. J. Middle Atl. Archaeol. 2012, 28, 1–10. [Google Scholar]
  68. Gravel-Miguel, C.; Wren, C.D. Agent-Based Least-Cost Path Analysis and the Diffusion of Cantabrian Lower Magdalenian Engraved Scapulae. J. Archaeol. Sci. 2018, 99, 1–9. [Google Scholar] [CrossRef]
  69. Grove, M. A Spatio-Temporal Kernel Method for Mapping Changes in Prehistoric Land-Use Patterns. Archaeometry 2011, 53, 1012–1030. [Google Scholar] [CrossRef]
  70. Mendez-Quiros, P.; Barceló, J.A.; Santana-Sagredo, F.; Uribe, M. Modeling Long-Term Human Population Dynamics Using Kernel Density Analysis of 14C Data in the Atacama Desert (18°–21° S). Radiocarbon 2023, 65, 665–679. [Google Scholar] [CrossRef]
  71. Hennius, A. Towards a Refined Chronology of Prehistoric Pitfall Hunting in Sweden. Eur. J. Archaeol. 2020, 23, 530–546. [Google Scholar] [CrossRef]
  72. Grøn, O.; Loze, I.; Watson, J. The Movement of Groups versus Territoriality in the Research into Prehistoric Hunter-Gatherers—An Overview. In Mesolithic on the Move; Oxbow Books: Oxford, UK, 2005. [Google Scholar]
  73. Lock, G.R. Beyond the Map: Archaeology and Spatial Technologies; IOS Press: Amsterdam, The Netherlands, 2000. [Google Scholar]
  74. Andresen, J.B.R. Topographic Wetness Index and Prehistoric Land Use. In Layers of Perception: Proceedings of the 35th International Conference on Computer Applications and Quantitative Methods in Archaeology (CAA), Berlin, Germany, 2–6 April 2007; Posluschny, A., Lambers, K., Herzog, I., Eds.; Dr. Rudolf Habelt GmbH: Bonn, Germany, 2008; pp. 405–410. ISBN 978-3-7749-3556-3. [Google Scholar]
  75. Murrieta-Flores, P.A. Traveling in a Prehistoric Landscape: Exploring the Influences That Shaped Human Movement. In Proceedings of the Making History Interactive: Computer Applications and Quantitative Methods in Archaeology, Proceedings of the 37th International Conference (CAA 2010); Frischer, B., Webb Crawford, J., Koller, D., Eds.; Archaeopress: Oxford, UK, 2010; pp. 249–267. [Google Scholar]
  76. Binford, L.R. Constructing Frames of Reference: An Analytical Method for Archaeological Theory Building Using Ethnographic and Environmental Data Sets; University of California Press: Berkeley, CA, USA, 2001. [Google Scholar]
  77. Donnellan, L. Archaeological Networks and Social Interaction; Routledge: London, UK, 2021. [Google Scholar]
  78. Howey, M.C.L. Multiple Pathways across Past Landscapes: Circuit Theory as a Complementary Geospatial Method to Least Cost Path for Modeling Past Movement. J. Archaeol. Sci. 2011, 38, 2523–2535. [Google Scholar] [CrossRef]
  79. Verhagen, P.; Nuninger, L.; Groenhuijzen, M.R. Modelling of Pathways and Movement Networks in Archaeology: An Overview of Current Approaches. In Finding the Limits of the Limes: Modelling Demography, Economy and Transport on the Edge of the Roman Empire; Verhagen, P., Joyce, J., Groenhuijzen, M.R., Eds.; Springer International Publishing: Cham, Switzerland, 2019; pp. 217–249. [Google Scholar]
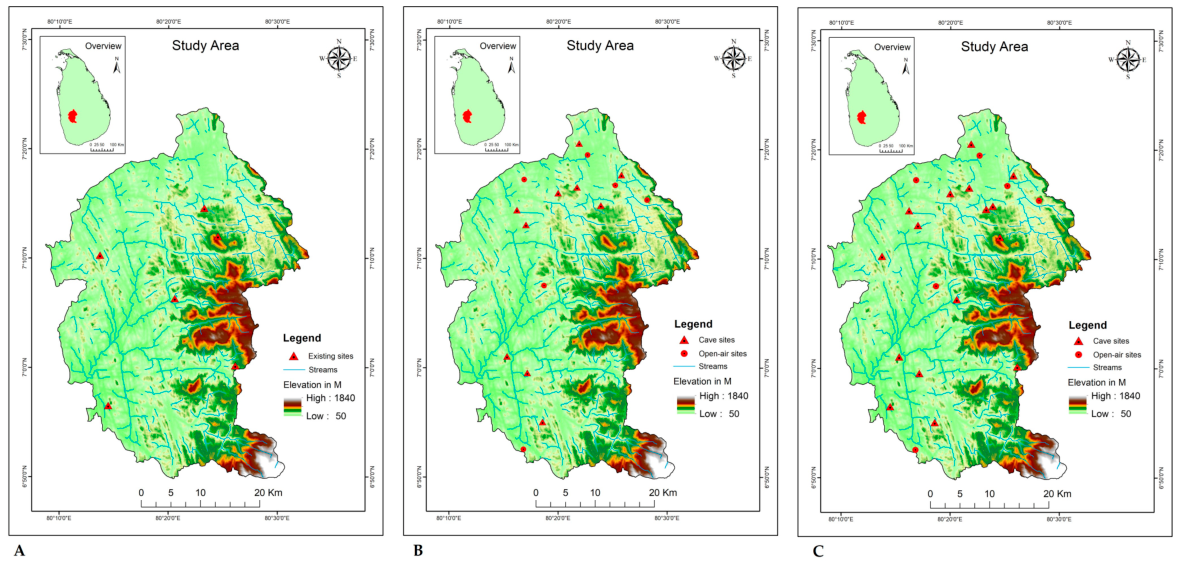
Figure 1. Spatial distribution of prehistoric sites in relation to the topography and hydrology of the study area. (A) Previously documented sites overlaid on the DEM of the study area; (B) Spatial distribution of recently identified prehistoric cave sites and open-air sites; (C) Integrated dataset of all identified sites, which were subjected to the present spatial analysis: Source: ASF Earth Data and field survey, 2018–2024.
Heritage 09 00257 g001
Figure 2. Prehistoric context and lithic assemblage of the Belingala rock shelter. (A) General view of the Belingala rock shelter; (BD), Assemblage of broken tools and quartz flakes indicating on-site tool production and retouch; (E) Mollusk evidence found inside the cave; (F) A broken pebble used as a raw material for lithic production. Source: field survey, 2018–2024.
Heritage 09 00257 g002
Figure 3. Archaeological context and lithic assemblage of the Mampita cave. (A) Exterior view of the cave on the boulder near the steep slope; (B) Interior view of the Mampita cave with inner space and entrance orientation; (C,D) Assemblage of lithic artefacts including flakes, broken pebbles, and possibly chopping tools with use marks. Source: field survey, 2018–2024.
Heritage 09 00257 g003
Figure 4. Kernel Density Estimation (KDE) maps showing the comparison of the density of prehistoric sites. (A) KDE surface of the previously documented prehistoric sites; (B) KDE surface of the integrated (existing and new data) layer. Density values represent the Point/km2. Results show areas of higher site density in the north-central and south-western regions; these patterns reflect the bandwidth-controlled KDE surface and should be interpreted as preliminary spatial indications rather than evidence of non-random site distribution. Source: ASF Earth Data and field survey, 2018–2024.
Heritage 09 00257 g004
Figure 5. The least-cost path of the study area. (A) A modelled least-cost path (LCP) for the prehistoric site locations in the study area; (B) A 3D terrain model showing the topographic variation of the study area in relation to the LCP route. Source: ASF Earth Data and field survey, 2018–2024.
Heritage 09 00257 g005
Figure 6. Modelled least-cost path corridors (500 m and 1000 m buffers). Source: ASF Earth Data and field survey, 2018–2024.
Heritage 09 00257 g006
Table 1. Geological epochs and corresponding Sri Lankan prehistoric cultural phases, illustrating the chronological scope of the Mesolithic in the Sri Lankan context relative to the standard global framework. Source: existing literature [27,28,30,32,34,36,37,38].
Geological Epoch (Global)Approx. Date Range
(Sri Lanka)
Sri Lankan Cultural PeriodDefining Evidence
Middle to Late Pleistocenec. 70,000–74,000 BP (TL); stratigraphically correlated to c. 125,000 BPMiddle PaleolithicBasal gravels of the Iranamadu Formation, Bundala/Patirajawela; non-microlithic flake/core industry [27,30]
Late Pleistocenec. 48,000–11,700 cal. BPMesolithic (microlithic tradition begins)Earliest geometric microliths at Fa-Hien Lena (c. 48,000–45,000 cal. BP); Kitulgala Beli Lena from c. 45,000 cal. BP. [27,30,37,38]
Pleistocene–Holocene transitionc. 11,700 cal. BP(no cultural break)Continuity of the same microlithic toolkit across this boundary [32,34,36]
Holocenec. 11,700–3000 cal. BPMesolithic (continued)Attanagoda Alu Lena (10,350 cal. BP), Dorawaka Lena (6310 cal. BP) [28]
Table 4. Slope classification of the 500 m and 1000 m movement corridors along the least-cost path routes, indicating the percentage and pixel count of terrain categorized as easy (0–10°), moderate (10–20°), and difficult (>20°), and mean slope values for each corridor width. Thresholds are informed by slope-dependent human mobility models [1,59,64,65].
Corridor WidthEasy 0–10°Moderate 10–20°Difficult > 20°Mean Slope
500 m25% (460,831)62% (1,153,994)13% (248,111)13.67°
1000 m36% (787,377)40% (866,646)24% (522,717)14.41°
Table 5. Chronological classification of all 22 prehistoric sites included in the spatial analysis, categorized into four tiers based on the nature and reliability of chronological and contextual evidence. Source: existing literature and field survey, 2018–2024.
Tier 1: Previously Documented Cave Sites with Absolute Radiocarbon Dates (3 sites)
Site NameSite TypeDocumentation StatusChronological EvidenceCultural Attribution
Kitulgala Beli LenaCavePreviously documentedAbsolute radiocarbon date: 45,000 cal. BP [38]Late Pleistocene Mesolithic
Attanagoda Alu LenaCavePreviously documentedAbsolute radiocarbon date: 10,350 cal. BP [28]Holocene Mesolithic
Dorawaka LenaCavePreviously documentedAbsolute radiocarbon date: 6310 cal. BP [28]Holocene Mesolithic
Tier 2: Newly Documented Cave Sites with Intact Primary Deposits (3 sites)
Site NameSite TypeDocumentation StatusChronological EvidenceCultural Attribution
BelingalaCaveNewly discoveredUndisturbed primary deposit—geometric microlith assemblageMesolithic (relative)
BambaragalaCaveNewly discoveredUndisturbed primary deposit—geometric microlith assemblageMesolithic (relative)
MampitaCaveNewly discoveredPrimary deposit observed—geometric microlith assemblageMesolithic (relative)
Tier 3: Disturbed Cave Sites and Open-Air Sites (14 sites)
Site NameSite TypeDocumentation StatusChronological EvidenceCultural Attribution
Beli Lena AthulaCavePreviously documentedRadiocarbon date unreliable due to sample contamination, geometric microlith assemblage present [27]Mesolithic (relative—based on lithic evidence)
KatarangalaCavePreviously documentedQuartz flakes and chips consistent with Mesolithic lithic technology—disturbed contextMesolithic (relative)
Budugal LenaCaveNewly discoveredQuartz flakes and chips consistent with Mesolithic lithic technology—disturbed contextMesolithic (relative)
Amba LenaCaveNewly discoveredQuartz flakes and chips consistent with Mesolithic lithic technology—disturbed contextMesolithic (relative)
PadavigampolaCaveNewly discoveredQuartz flakes and chips consistent with Mesolithic lithic technology—disturbed contextMesolithic (relative)
EluwanaCaveNewly discoveredQuartz flakes and chips consistent with Mesolithic lithic technology—disturbed contextMesolithic (relative)
SiyambalapitiyaCaveNewly discoveredQuartz chips and flakes consistent with Mesolithic lithic technology—disturbed contextMesolithic (relative)
PokunugalaCaveNewly discoveredQuartz chips and flakes consistent with Mesolithic lithic technology—disturbed contextMesolithic (relative)
NilwakkaCaveNewly discoveredQuartz chips and flakes consistent with Mesolithic lithic technology—disturbed contextMesolithic (relative)
IllukgodaOpen-airNewly discoveredQuartz flakes, chips and cores consistent with Mesolithic lithic technology—surface scatterMesolithic (relative)
GanetennaOpen-airNewly discoveredQuartz flakes, chips and debitage consistent with Mesolithic lithic technology—surface scatterMesolithic (relative)
AmbuwakkaOpen-airNewly discoveredQuartz flakes, chips and cores consistent with Mesolithic lithic technology—surface scatterMesolithic (relative)
WahawaOpen-airNewly discoveredChert and quartz flakes, chips and cores consistent with Mesolithic lithic technology—partially disturbed contextMesolithic (relative)
KalugalaOpen-airNewly discoveredChert and quartz flakes, chips and cores consistent with Mesolithic lithic technology—disturbed contextMesolithic (relative)
Tier 4: Sites with Mixed Disturbed Contexts and Lowest Evidential Weight (2 sites)
Site NameSite TypeDocumentation StatusChronological EvidenceCultural Attribution
UrakandaCavePreviously documentedQuartz debris and rock engravings comparable to documented prehistoric sites Dorawaka Lena, and Hakbelkanda—no diagnostic lithic tools identifiedPrehistoric—Mesolithic attribution tentative
PanawalaOpen-airNewly discoveredQuartz and chert flakes and chopping tools on the surface of a disturbed context near the Dutch fort mound—proximity to the documented prehistoric site Beli Lena AthulaPrehistoric—cultural period uncertain
Disclaimer/Publisher’s Note: The statements, opinions and data contained in all publications are solely those of the individual author(s) and contributor(s) and not of MDPI and/or the editor(s). MDPI and/or the editor(s) disclaim responsibility for any injury to people or property resulting from any ideas, methods, instructions or products referred to in the content.