Article

Quantification of Moisture in Masonry via AI-Evaluated Broadband Radar Reflectometry

1
Faculty of Design, Coburg University of Applied Sciences and Arts, Am Hofbräuhaus 1b, 96450 Coburg, Germany
2
Institute of Sensor and Actuator Technology, Coburg University of Applied Sciences and Arts, Am Hofbräuhaus 1b, 96450 Coburg, Germany
3
Institut für Diagnostik und Konservierung an Denkmalen in Sachsen und Sachsen-Anhalt e. V., Schloßplatz 1, 01067 Dresden, Germany
*
Author to whom correspondence should be addressed.
Heritage 2023, 6(7), 5030-5050; https://doi.org/10.3390/heritage6070266
Submission received: 9 May 2023 / Revised: 15 June 2023 / Accepted: 19 June 2023 / Published: 26 June 2023
(This article belongs to the Special Issue Decay and Conservation Studies of Building Mortars and Stones)

Abstract

:
Humidity, salt content, and migration in building materials lead to weathering and are a common challenge. To understand damage phenomena and select the right conservation treatments, knowledge on both the amount and distribution of moisture and salt load in the masonry is crucial. It was shown that commercial portable devices addressing moisture are often limited by the mutual interference of these values. This can be improved by exploiting broadband radar reflectometry for the quantification of humidity in historic masonry. Due to the above-mentioned limitations, today’s gold standard for evaluating the moisture content in historic buildings is still conducted by taking drilling samples with a subsequent evaluation in a specially designed laboratory, the so-called Darr method. In this paper, a new broadband frequency approach in the range between 0.4 and 6 GHz with improved artificial-intelligence data analysis makes sure to optimize the reflected signal, simplify the evaluation of the generated data, and minimise the effects of variables such as salt contamination that influence the permittivity. In this way, the amount of water could be determined independently from the salt content in the material and an estimate of the salt load. With new machine learning algorithms, the analysis of the permittivity is improved and can be made accessible for everyday use on building sites with minimal intervention by the user. These algorithms were trained with generated data from different drying studies on single building bricks from the masonries. The findings from the laboratory studies were then validated and evaluated on real historic buildings at real construction sites. Thus, the paper shows a spatially resolved and salt-independent measurement system for determining building moisture.

1. Introduction

Humidity and water are environmentally abundant, and ingress into and migration within the building material leading to weathering is a common challenge [1,2,3,4,5]. In order to prevent permanent damage to the building shell due to weathering, it is necessary to determine the exact moisture and salt content of the building and its masonry [6]. Wetting–drying cycles, acidic rain, and the effect of salt crystallization can weaken the internal structure of mineral building materials and change important material properties such as compressive strength [7,8,9]. Rising humidity and moisture within the walls (investigated in this study) can seriously reduce the compressive strength of sandstone and other building materials [10]. Based on the actual damage of the building, different measures must be taken to eliminate the causes [11]. According to the current state-of-the-art methods acknowledged by independent institutions, only invasive methods work reliably [12,13], such as the Darr method (gravimetric moisture measuring method). Despite the fact that it is a minor destructive method, samples have to be taken, which is associated with a small loss of substance; however, a big advantage is the possibility to extract more than one sample from one hole at different depths to see how the moisture changes from the surface to the inside of the wall. This makes it possible to find the origin of the water, the location, as well as the presence of salts in the sampled material. In order to completely understand the cause of damage, it is necessary to know how moisture and salt are distributed in masonry and how they change over time (winter/summer or on a day-to-day basis). The interplay of the crystallization and dissolution of salts leads to immense damage and is often the cause of structural weaknesses in building materials [14,15]. Such monitoring with invasive methods over longer time periods and on larger areas is not possible in the historical stock, or only possible with a considerable loss of substance. The demand for non-destructive methods and instant results which can measure large areas fast and easy to determine the moisture and salt content in building structures is therefore immense.
Several handheld devices have been developed in the past few decades. They operate with different physical methods such as capacitive methods (Gann-Hydromette [16]), electric methods (by measuring the resistance), or with microwave radiation, which is very well-suited to carry out moisture measurements [17,18]. The problem with these devices is their lack of reliability, and there is hardly any systematic correlation between measurements with different devices [19]. They also cannot provide an absolute water content. Instead, they generate a moisture index that can be used to calculate a moisture value via preset parameters. This generated value is often highly affected by the salt content in the masonry. Another weakness is the very limited measuring depth, as they only measure the first few centimeters below the surface.

2. Measurements with Electromagnetic Radiation

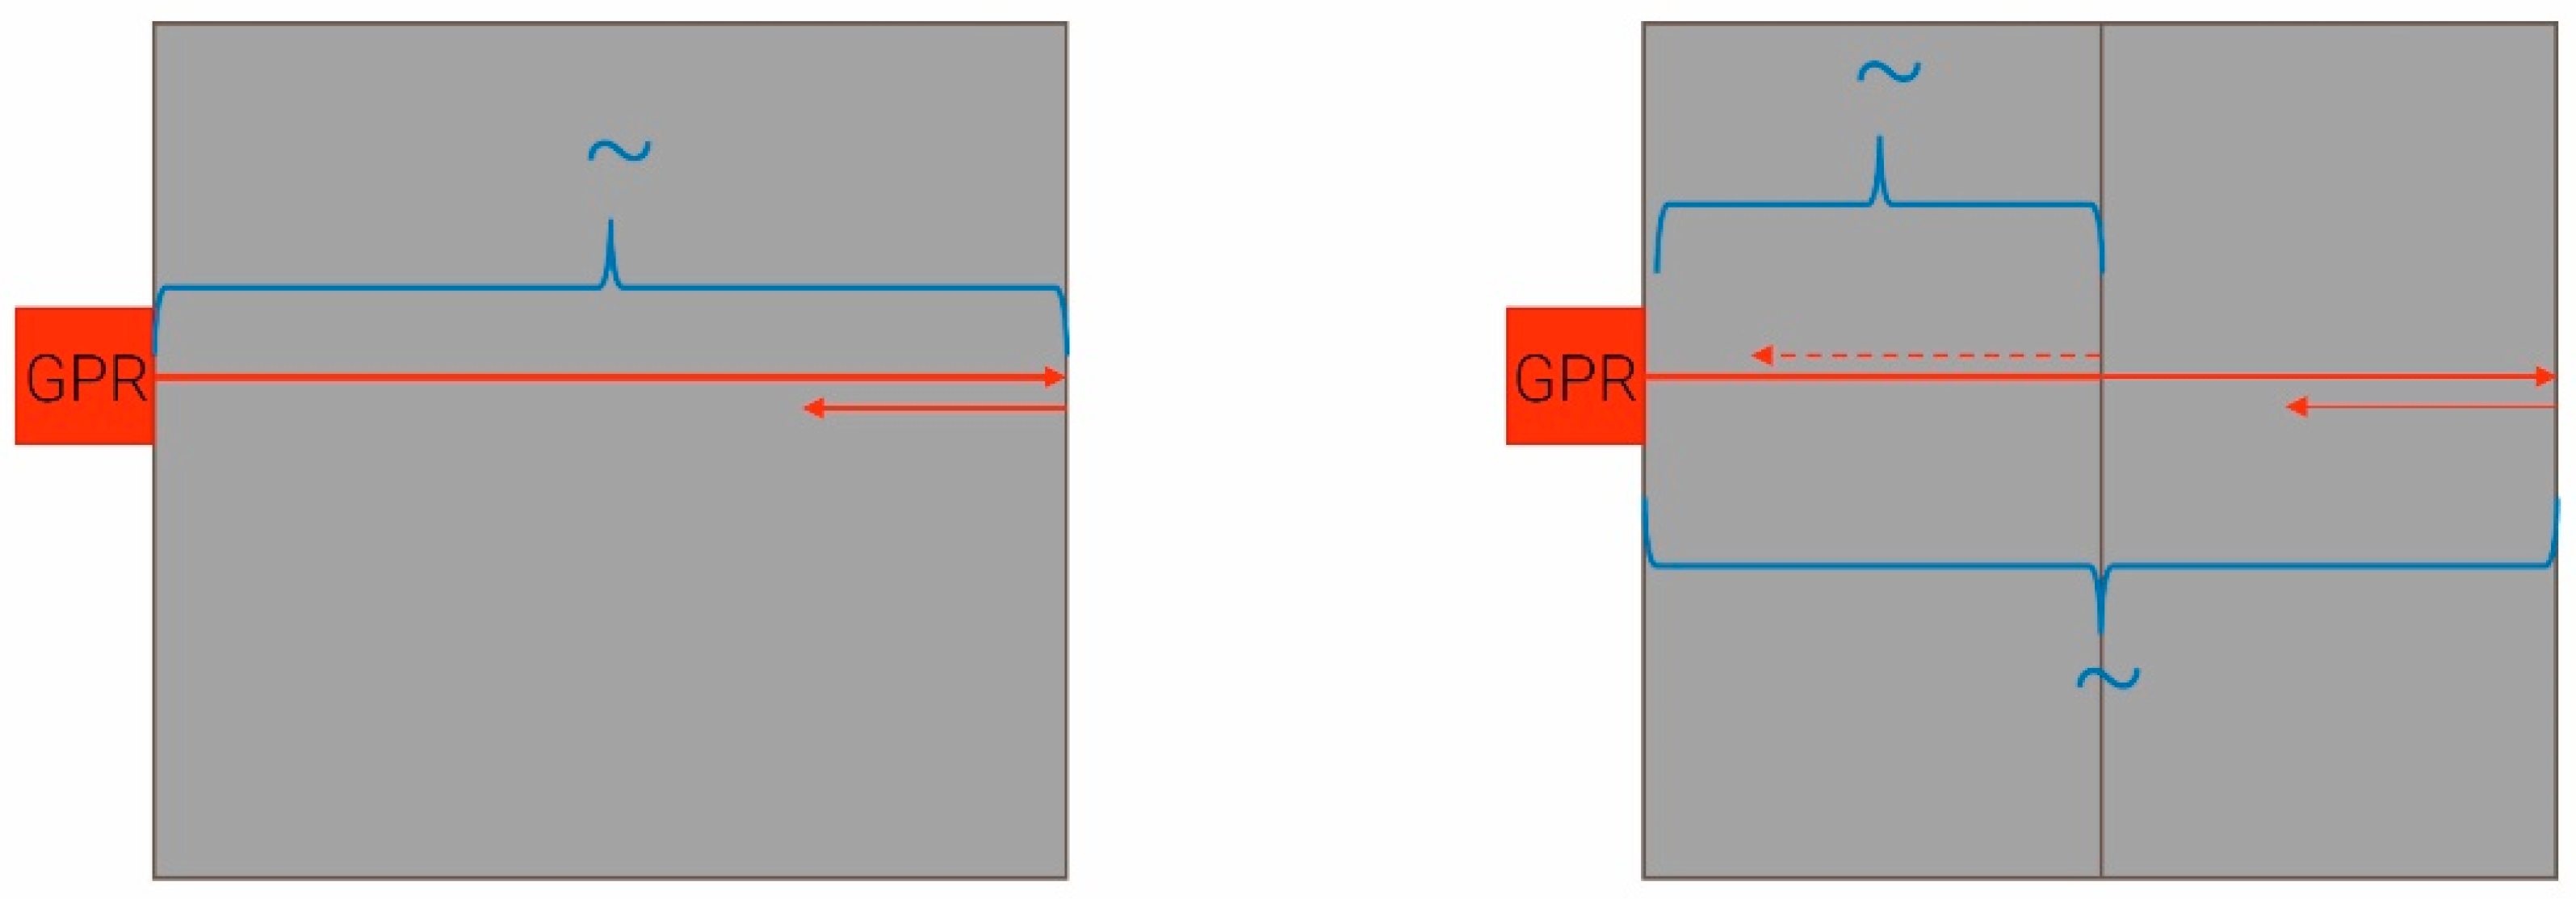
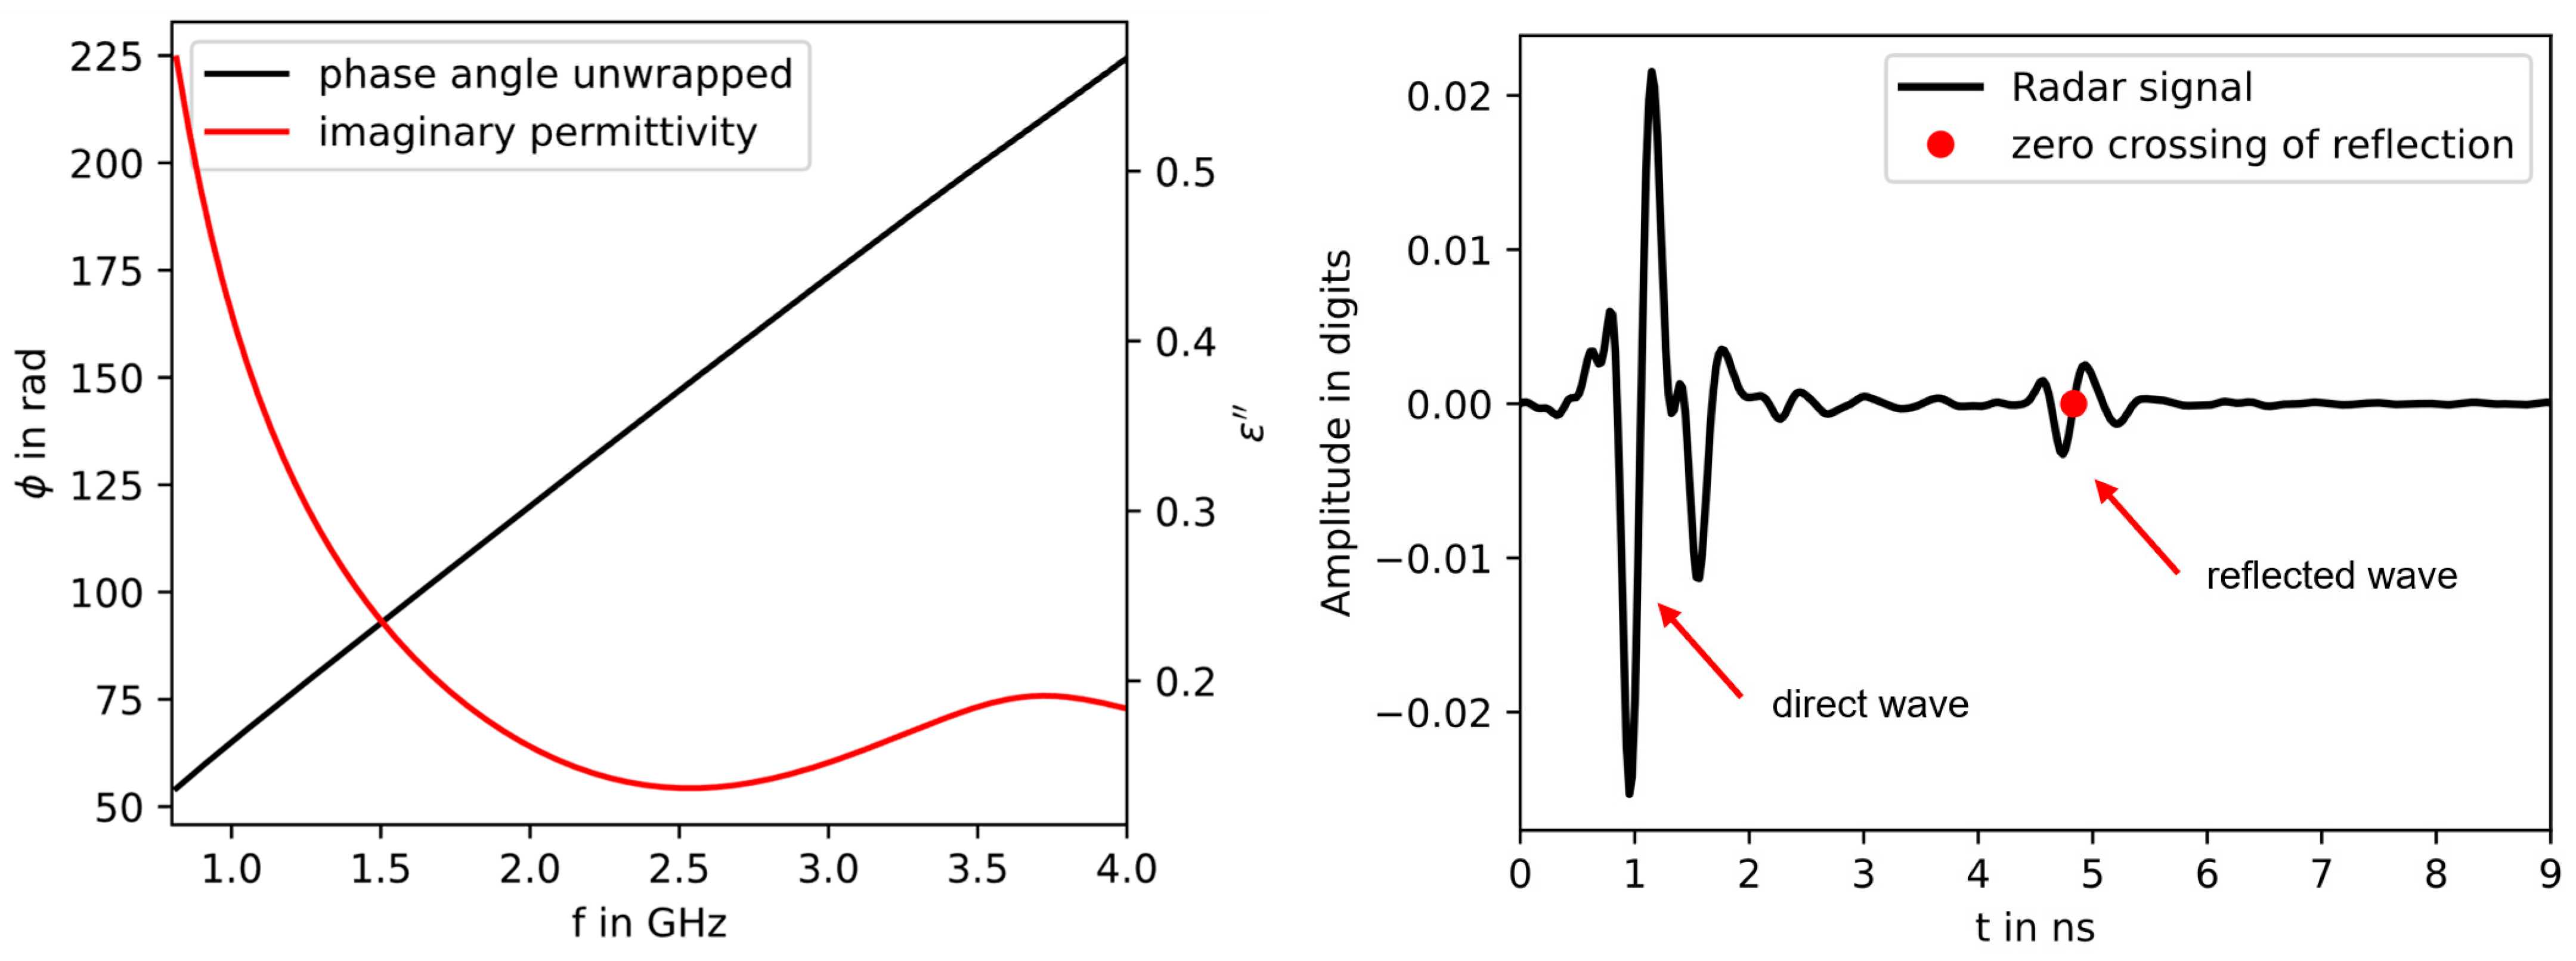
2.1. Basic Principle

A promising method is the coupling of radar waves into a masonry wall and detecting the reflected signal with a subsequent analysis of the complex permittivity. This method utilizes the strong differences in the complex-valued dielectric constant (permittivity) between the water and building materials.
The following formula displays the complex permittivity:
ε = ε i ε
The real part ε describes the classic dielectric constant, while the imaginary part ε describes the dielectric losses.
The characterisation of materials using the permittivity was already shown by Hasted and Shah in 1964 [20] and Pisa et al. in 2017 [21].
Leschnik [22] stated that up to a frequency of 100 MHz, the influence of salt and moisture on both the real and imaginary parts is so similar that it cannot be separated. Only above 100 MHz, the effect of the salts dissolved in the moist masonry becomes visible in the imaginary part. This gives the first idea of what frequencies are needed for a reliable radar measurement.
Maierhofer and Wöstmann [23] found that at 7 GHz, different masonries behave differently with varying moisture contents in terms of the real part. The imaginary part, in contrast, stays similar. They also found that the materials all lie in a similar dielectric range. Despite the fact that they only used one frequency, it is one of the few studies which considers more than one building material. Further investigations from Maierhofer et al. [24] showed that radar radiation can be used to determine the moisture in buildings but that the analysis of the generated data is very elaborate and complex. It was also stated that the quality of the evaluation has a great influence on the results obtained.
Different studies with ground-penetrating radar (GPR), which is already established in construction practices, show that measurements with different frequencies are very promising [25,26]. Other studies [27,28,29,30,31] also demonstrate the suitability of GPR modules for determining the water content. The measurements in these studies, however, were only performed on concrete. Other studies [32,33,34,35,36] stated that radar measurements are also possible on wet brick walls with varying materials.

2.2. Approach

Despite the above-mentioned studies, there is still a strong need for research. The reason for this is the large number of parameters that can influence the measurement data obtained. Besides humidity and salt, the influencing factors also include the composition of the (historical) masonry or the construction.
In addition, none of the available scientific studies have yet examined how different types of salt influence the imaginary part of the permittivity due to their differences in ion size and whether a metrological differentiation of the types of salt is possible.
The approach pursued is the insertion and detection of a broadband radar wave into masonries and materials that requires a large number of measurements in the frequency range. The wave propagated through the material and reflected at the material boundaries is always measured in the process (Figure 1).
In this study, various masonry test specimens were built and placed under different moisture and salt loads. These were then measured by radar at different times, and the complex-valued permittivity of the generated data was analyzed using trained neural networks. Measurements were carried out on individual building blocks as a database for the machine learning algorithms of the neural network. The predictions of the AI-based data evaluation were then compared with the current standard procedure, the Darr method. Finally, the measurement system was tested under real-life conditions at construction sites on historical buildings.

3. Materials and Methods
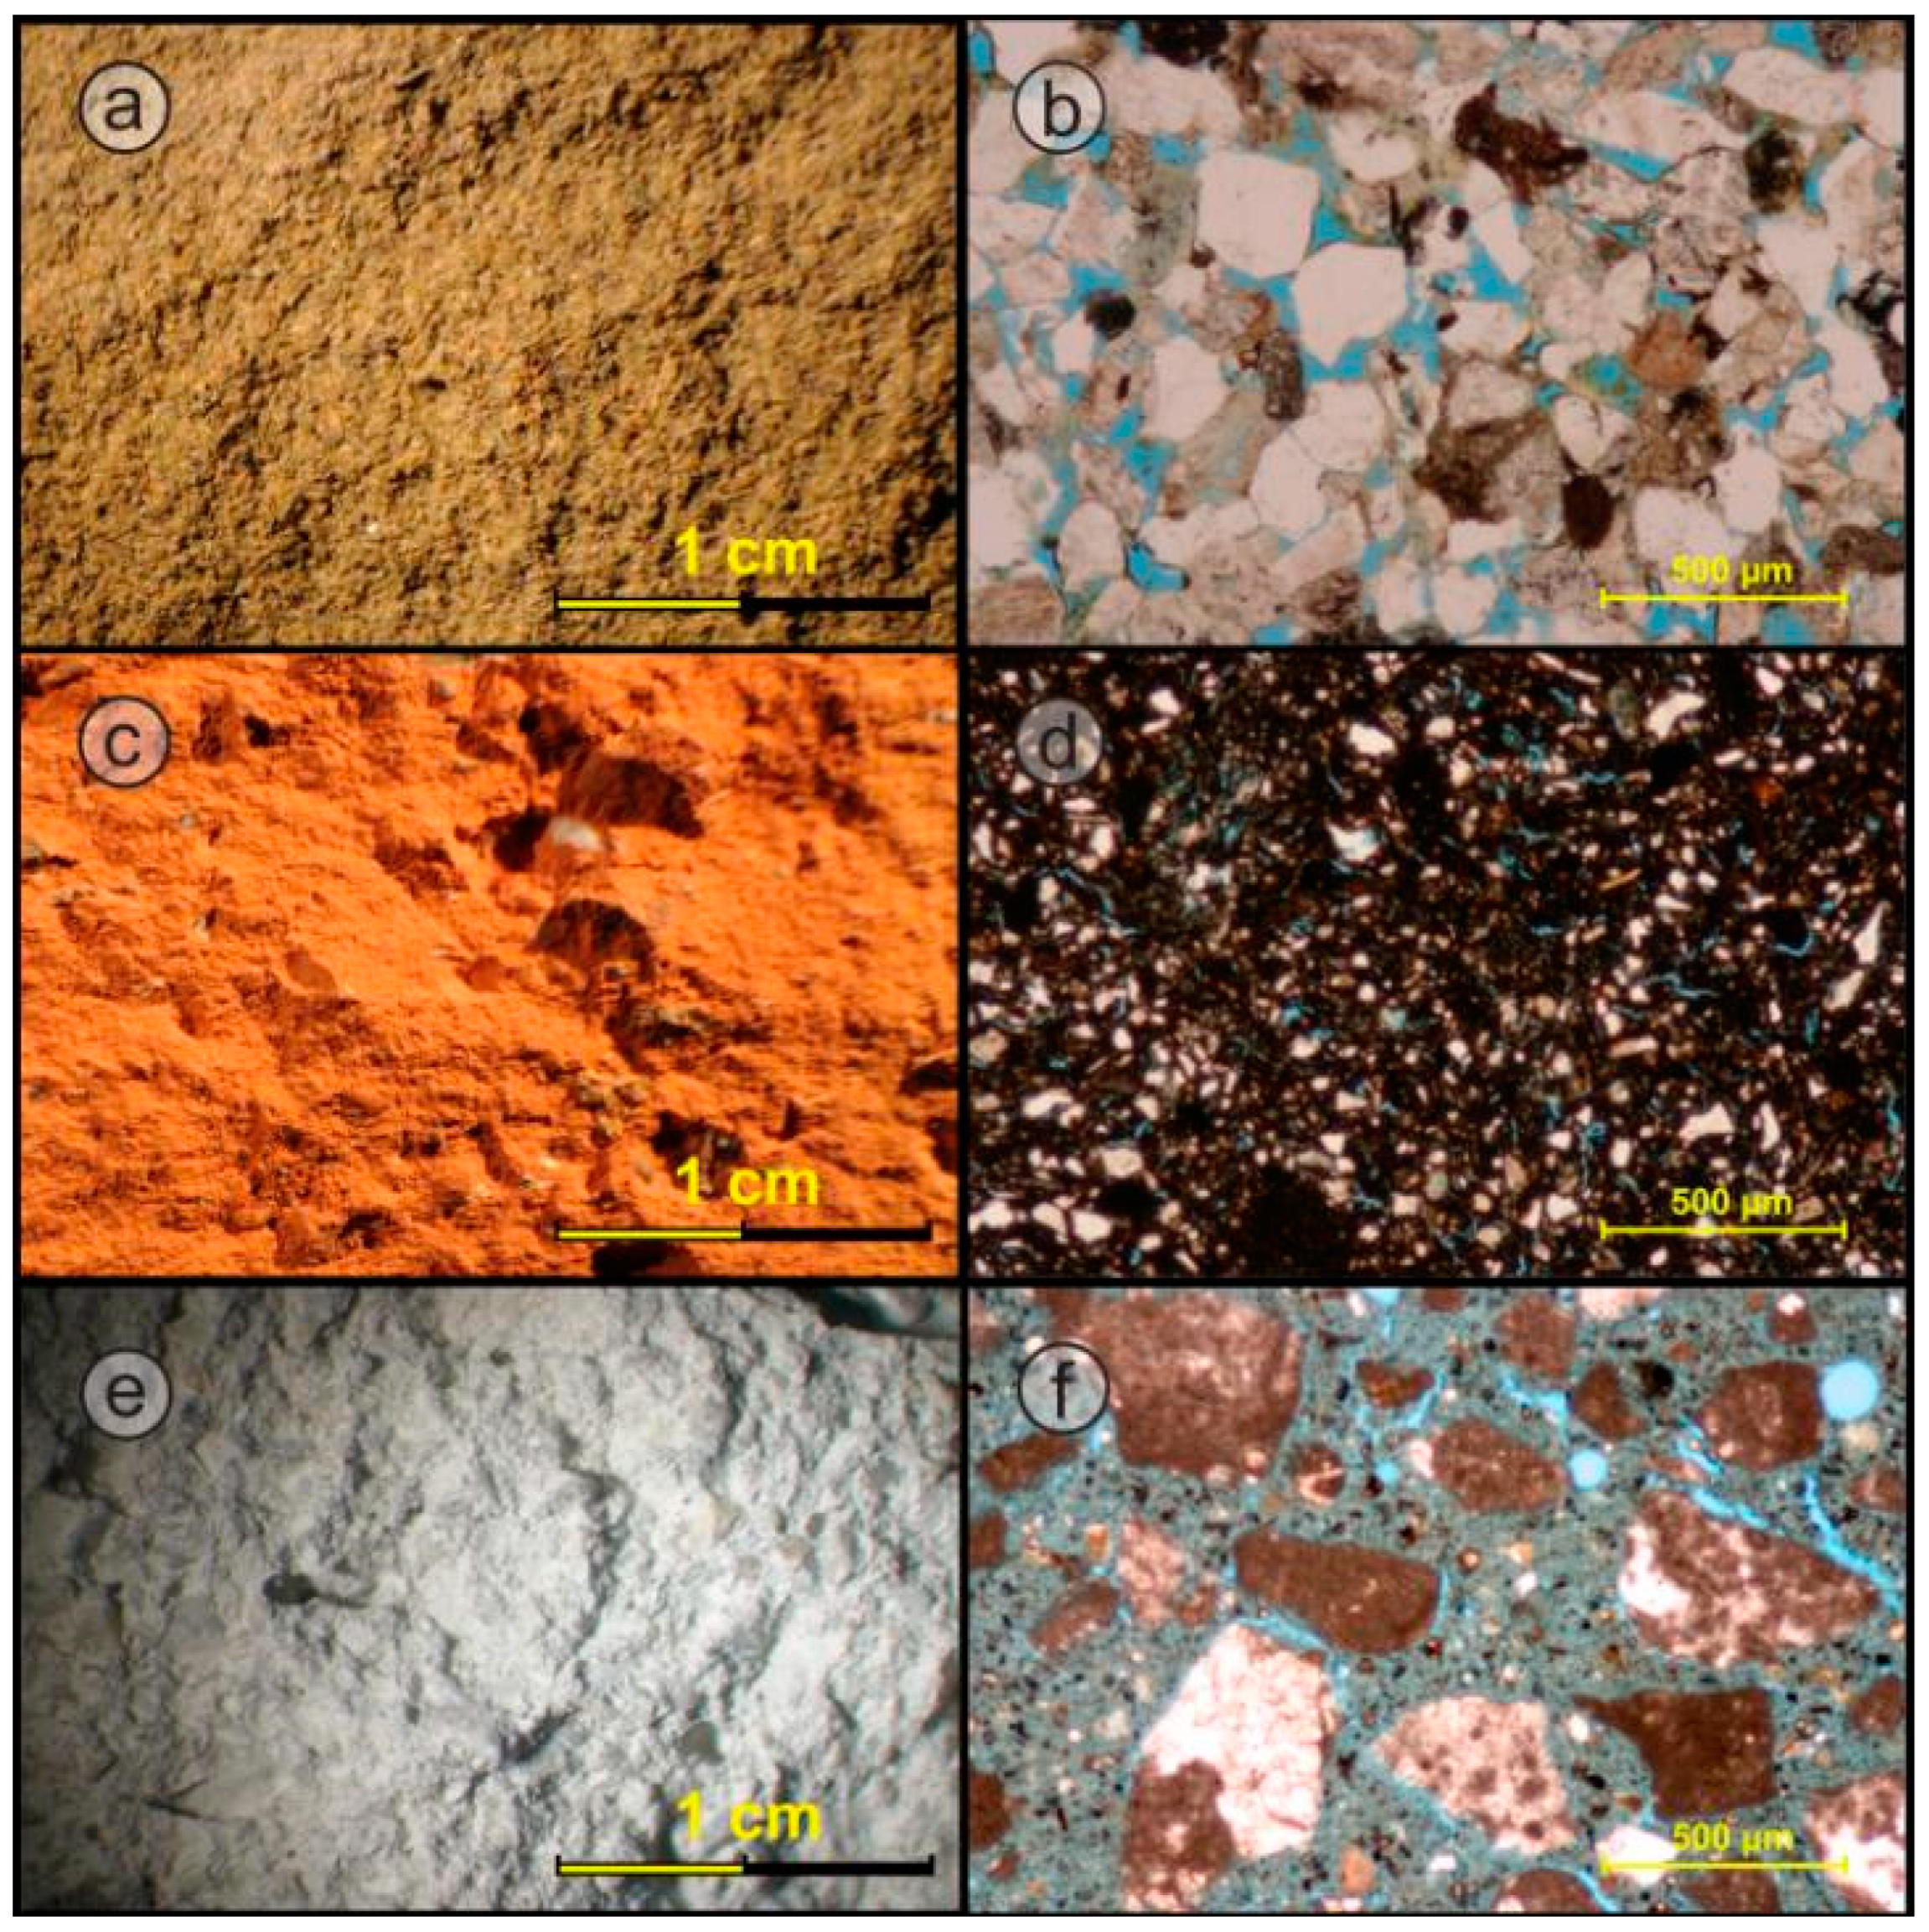
3.1. Materials

The extensive laboratory test measurements were performed on masonry models typical for historic buildings in Upper Franconia. The masonry test specimens created complied with historic specifications with regard to the building materials used and offered sufficient size for all kinds of measurements in their dimensions. For the eight laboratory masonry models, in total, three different materials with historic relevance came into use to construct the masonry models.
  • Sander sandstone (SST), a regionally occurring building stone, which has already been quarried for a thousand years;
  • Solid brick material (SBM) of company Wienerberger, corresponding in its material properties widely to a historic brick;
  • Trass-lime mortar (TLM) Mur956 of company Maxit, a cement-free mortar that is also well-suited for masonry with natural stone.
The properties of all the materials (Figure 2) were determined with special respect to the moisture-related properties (Table 1). The microscopic pictures give insight of the very different pore systems of the material. The Sander Sandstone SST has an interconnected pore system of relatively large pores. The Brick SBM has more pore space in a finely dispersed pore system all over the material. Both masonry materials have in the masonry joints the mortar (TLM) with even larger pore space (check Table 1), consisting of (i) finely distributed, (ii) elongated-tube, and (iii) gel pores in the material. This leads to some different A-coefficients (Table 1) within the corresponding materials in the masonry.

3.2. Single Stones and Masonry Specimens

The dimensions of the single stones were 240 × 71 × 115 mm3 (SBM) and 300 × 250 × 150 mm3 (SST), respectively. The following dimensions were used as guidelines for the masonry specimens: length, 0.9 m; width, 0.25 m; height, 0.6 m. The test specimens should still be transportable and at the same time offer sufficient space for measurements. Two masonry units (one of each kind) were placed in steel profile troughs. They were stored in a basement at relatively constant climate conditions (~18 °C, 55–65% rH) (Figure 3).

3.3. Methods

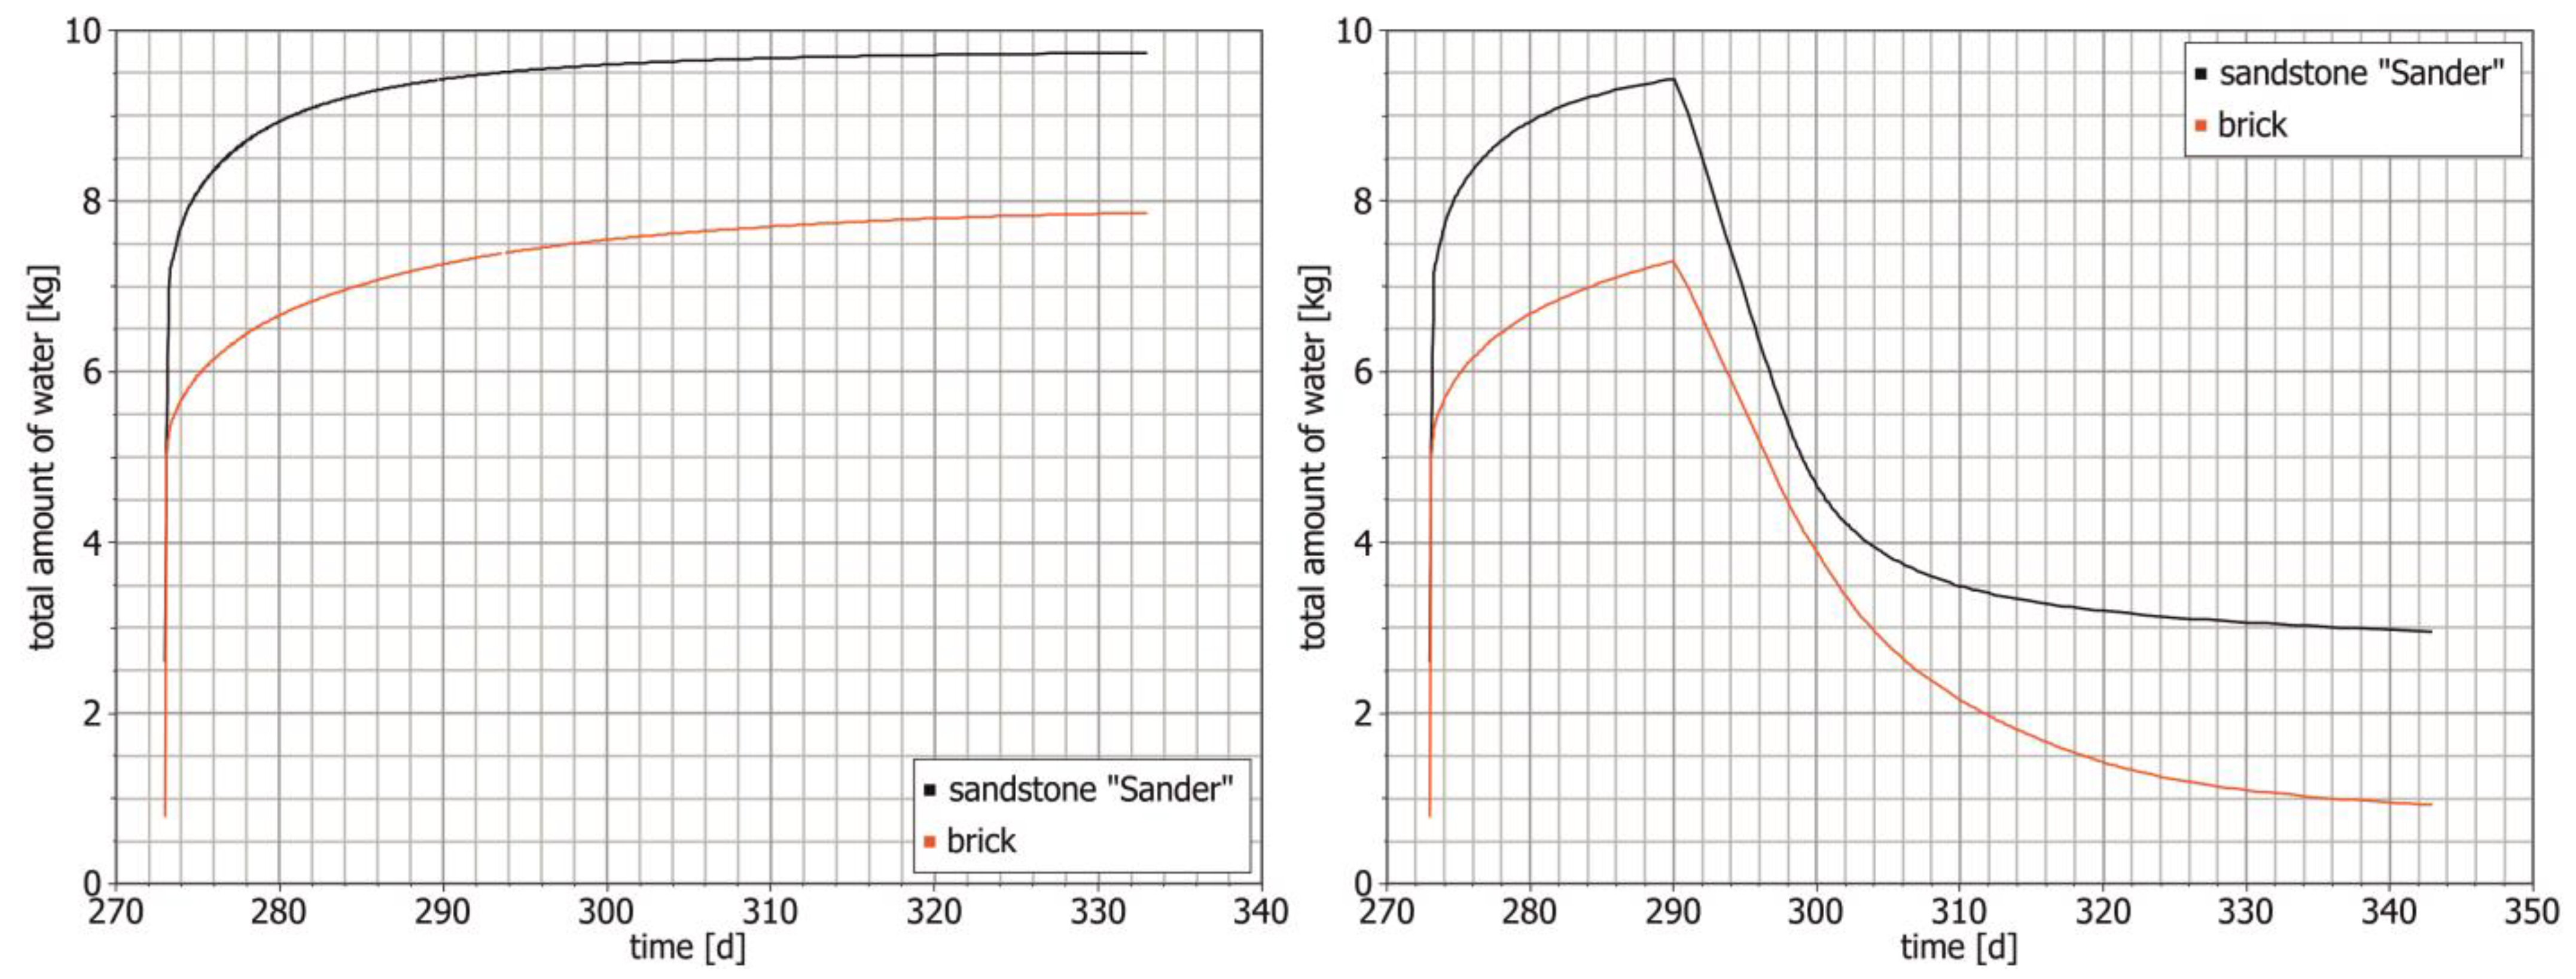
3.3.1. Hygrothermal Simulations

In the run-up of the project, hygrothermal simulations were carried out with the software “Delphin” [37], which allows the simulation of exact 3D models of the test specimen and a wide range of boundary conditions to be defined. The simulations should be as realistic as possible to determine how long the masonry specimen should stay in the water and how the moisture within is distributed over time. For this purpose, the corresponding material values already contained in the “Delphin” database were replaced with the values measured in the laboratory (see Table 1). For the prevailing boundary conditions, the results of the climate measurement were used (18 °C, ~60% rH).
In Figure 4, the uptake of the total water calculated by the program is presented for two scenarios. For the first simulation in Figure 4 on the left, the simulation time was 60 days. During this time, calculated by the simulation, the sandstone wall absorbs about 9.75 kg of water. The brick wall takes up about 8 kg of water. After that time, the water uptake is very slow and reaches a saturation point. It should be noted that after only 17 days, both the sandstone wall and the brick wall have already absorbed about 85% of the total amount of water. It was thus clear that a watering period of more than 17 days had only a minor effect on the absolute moisture distribution and water uptake in the built-up masonry test specimens.
In a subsequent simulation (Figure 4 right), an exemplary watering cycle was calculated. This time, the simulation time was set to 70 days. After 17 days, the water was “removed”, so the process of drying is also shown.
The simulation results show well that the drying phases extend over a longer period and therefore represent a generally “slower” system. Thus, it was decided that not only the radar measurements, but also the collection of drill dust samples would mainly be carried out during the drying phases to observe multiple conditions of humidity.

3.3.2. Single Stones

Single-brick materials and sandstones were used to collect further data for the AI-based evaluation of the radar measurements. Different studies with deionised water and salt solutions were carried out to test different salt concentrations and how the variation of salts affects the radar signal. The test stones derived from the same batch as the building materials for the masonry specimen.
Because the single stones represent a much faster system (in terms of watering and drying) regarding the big masonry specimen, they are ideal for testing moisture contents and salt concentrations before applying them to the masonry specimen.
The individual bricks were placed in small tubs and immersed either in deionised water or in a NaCl solution, respectively, MgSO4 and KNO3, until completely saturated. The drying process was accompanied by measurement of the reflected radar signal at the back of the stone (Figure 5). In addition, the mass of the stones was determined to calculate the amount of water remaining in the stones in mass percent (m%) (see Equation (2)).
The following formula is used to calculate the moisture content left in the material:
w = m m e a s m d r y m d r y 100 %
For the initial study, the concentration of the NaCl solution was adjusted so that the concentration of introduced anions into the material was 0.1 m% in relation to the oven-dried materials. This concentration corresponds to a medium salt load according to table values for the repair of historic buildings [38]. For this purpose, the saturation moistures were used for the SBMs and the sandstones.
Later on, other stones were contaminated with MgSO4 and with KNO3 to achieve an anion concentration of 0.2 m% (for MgSO4) or 0.1 m% (for KNO3), respectively, in the material. This again corresponds to medium salt loads in relation to the oven-dried materials. The concentrations are adjusted here in order to not only study the influences introduced by the salts via radar measurement, but also generate evaluable results when contaminating the masonry specimen.
To determine the influence of the different salt ions, solutions with a constant molality were produced to have the same number of anions present. For this second study, all three salts available (NaCl, MgSO4, and KNO3) were used. This time, sandstones were divided into two groups and were contaminated with salt solutions with different molalities of 0.012 mol/kg and 0.02 mol/kg. The drying process was again observed as previously explained.

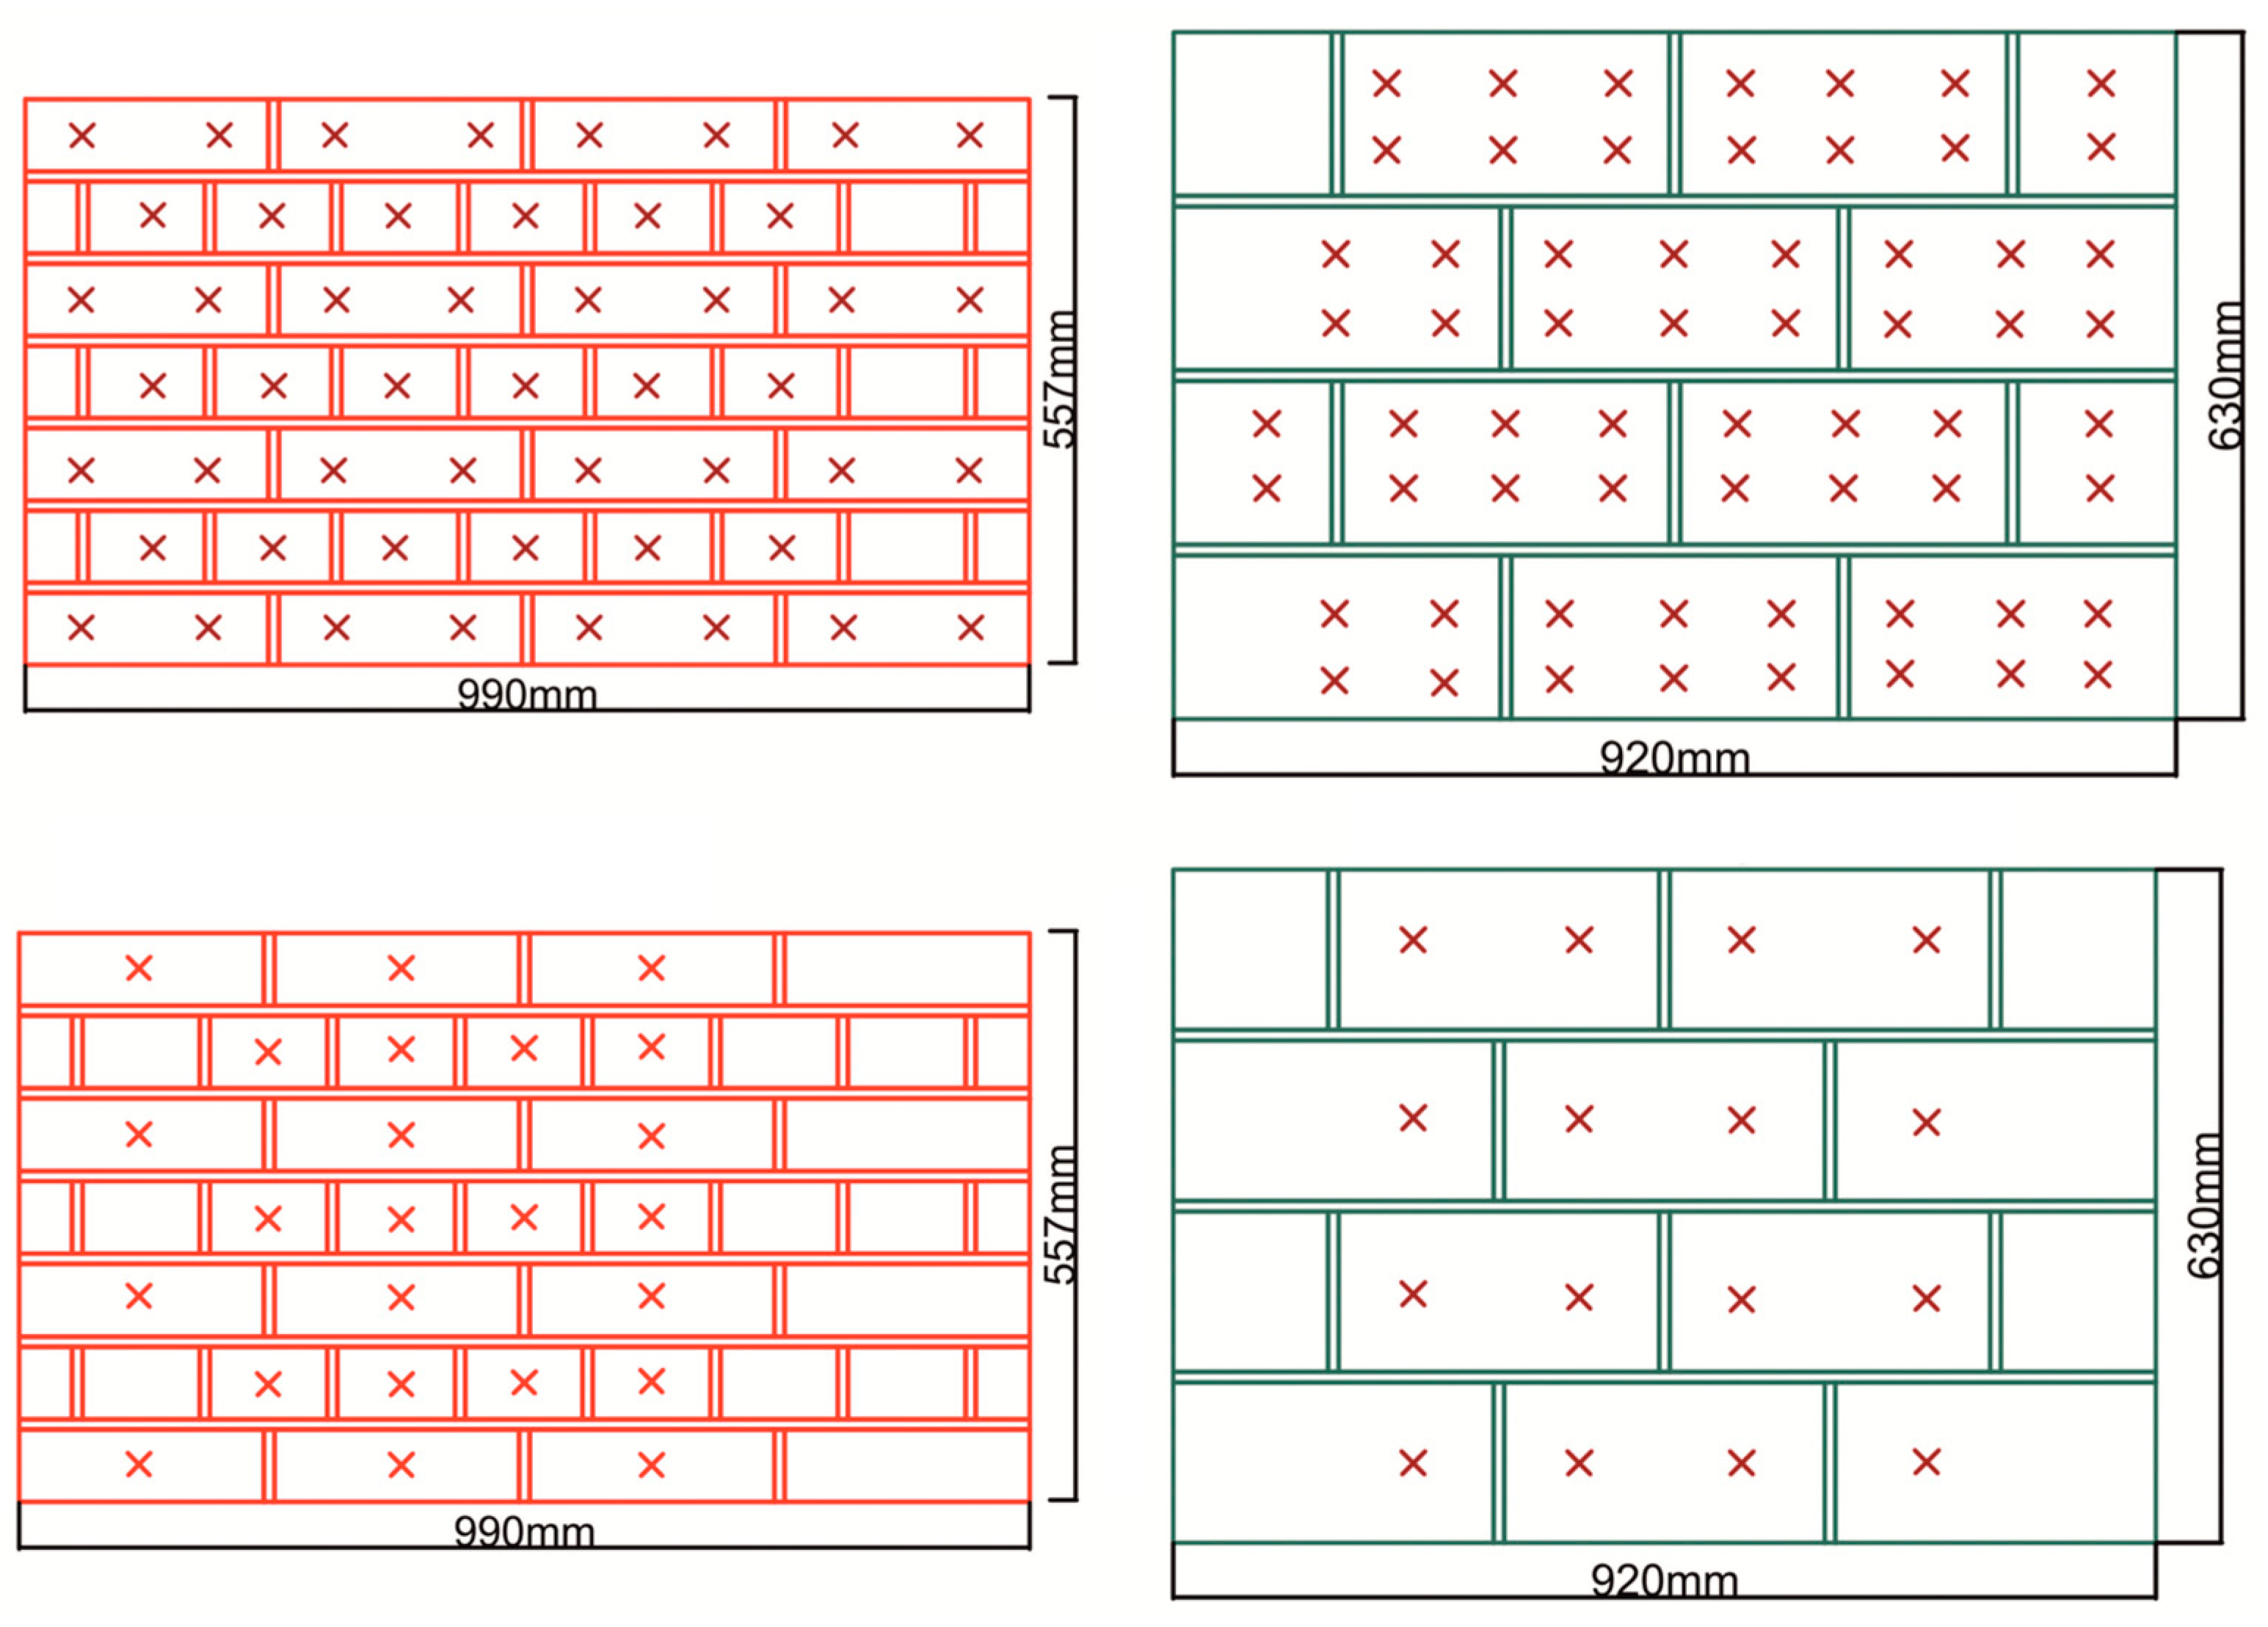
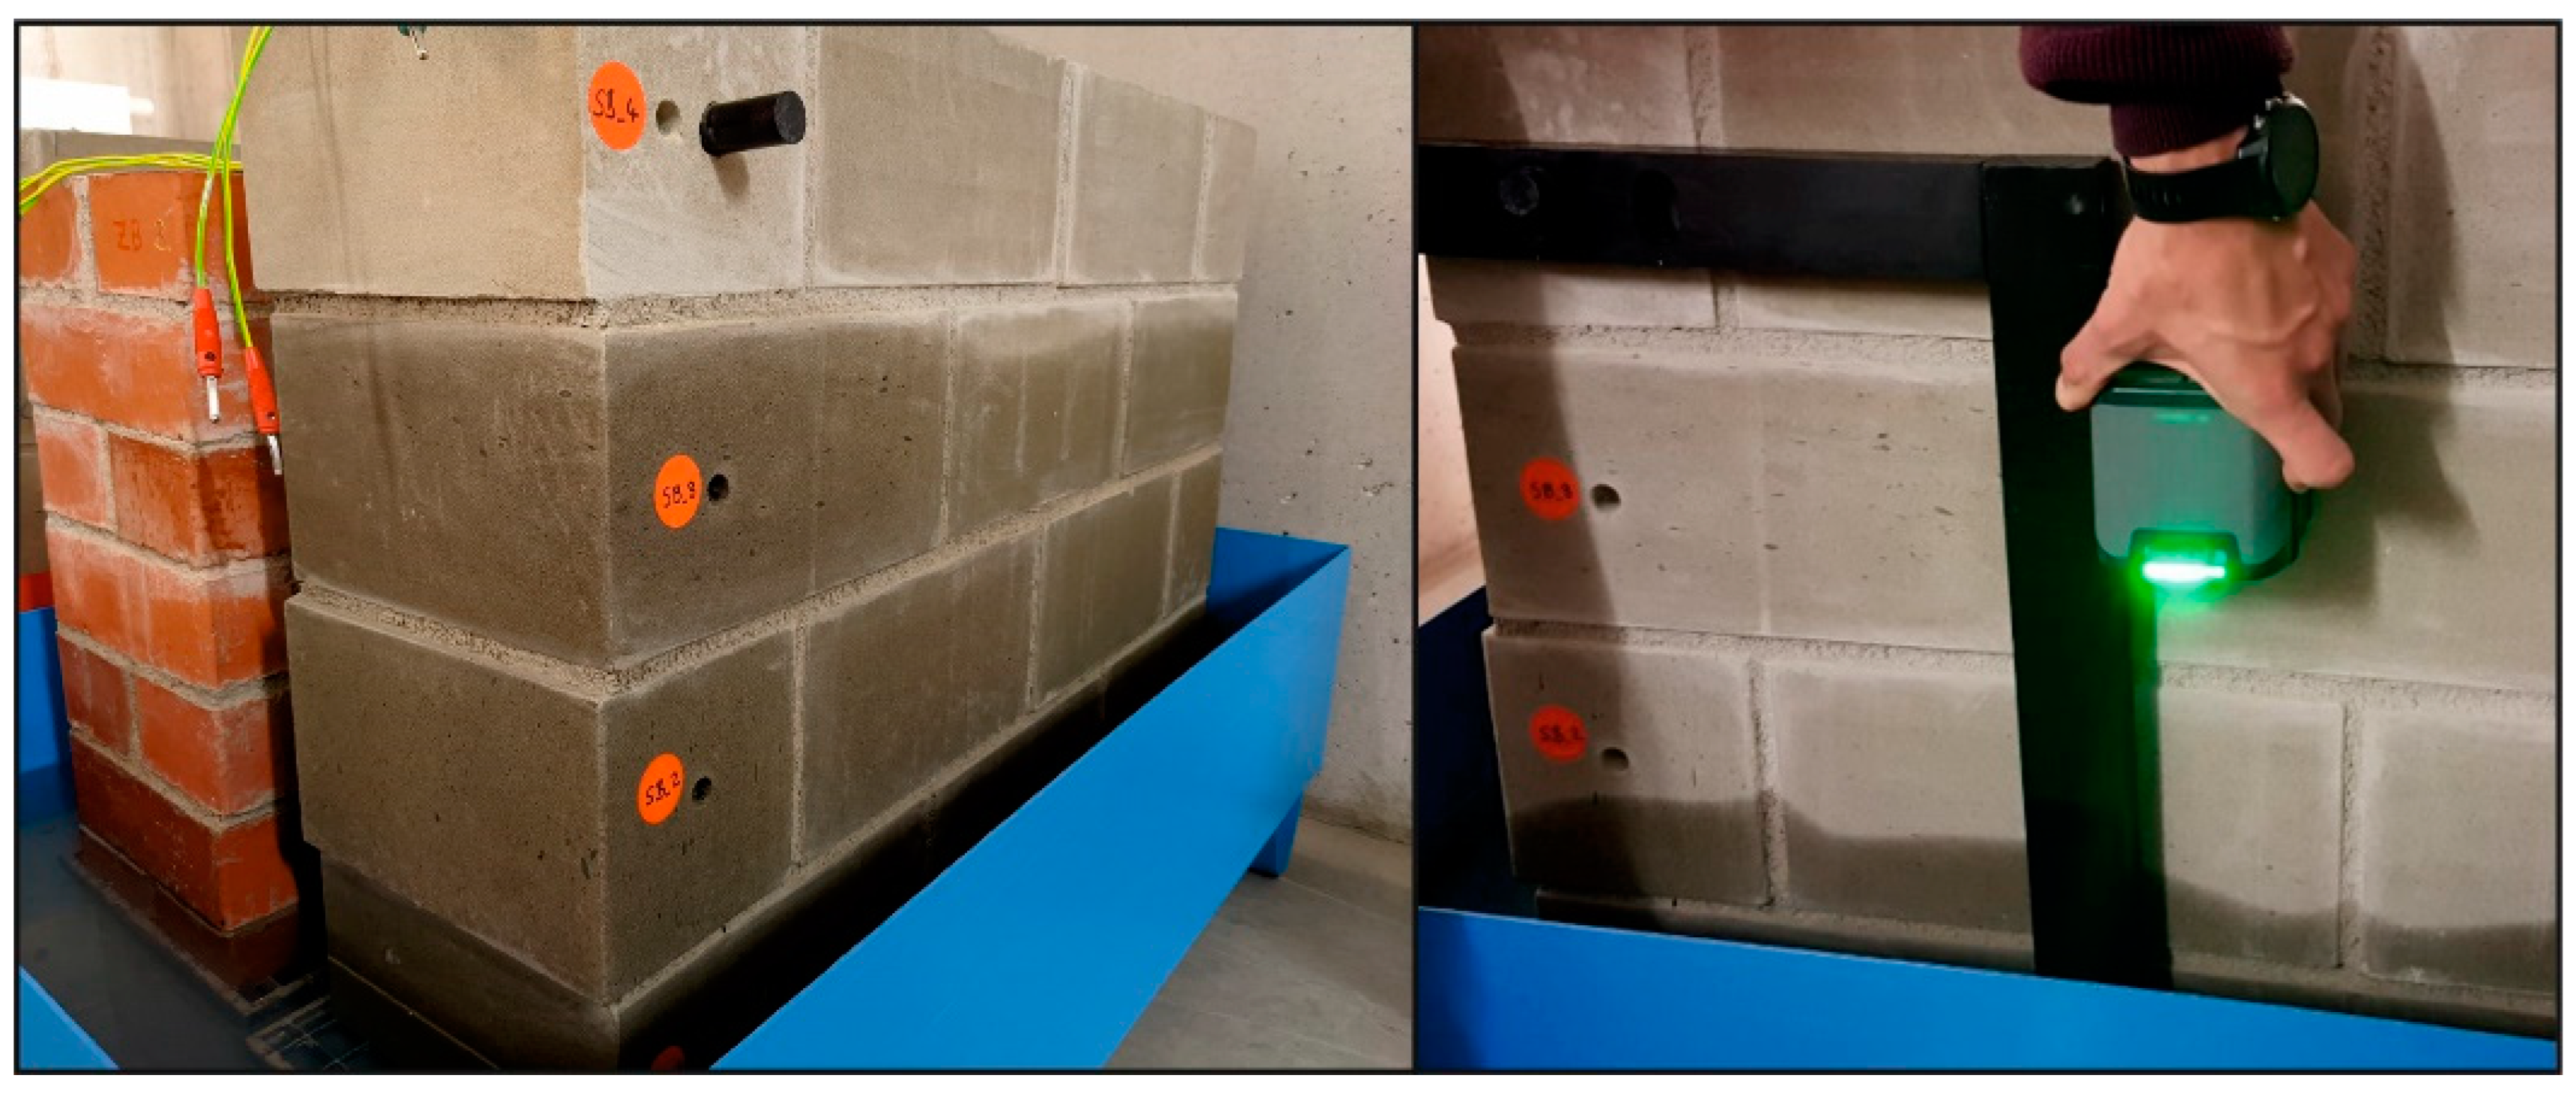
3.3.3. Masonry Specimen

The procedure for watering the masonries was to fill the profile tubs with water until the first layer of the brick wall was completely covered. First, deionised water was used in order to not bring any more contamination into the test specimens. Subsequently, the salt solutions with NaCl and MgSO4 were taken. The concentrations used were determined in the single-brick studies.
After a specific period of time (usually between 17 and 36 days, defined by the simulations), the water was removed and the masonries were left to dry.
To obtain the absolute moisture content in (m%) and to validate the radar measurements, drill dust samples were collected at favorable metrological points in time. The total drill depth was 12 cm, which corresponds to about half of the wall’s thickness. The collected samples were immediately packed airtight, taken to the laboratory, weighed there, dried until mass constancy, and weighed again.

3.3.4. Area Scans

In total, two major concerted drilling operations were carried out. In Figure 6, schematic drawings of the sample positions for the two operations are displayed. For each drilling sample, a radar measurement was previously carried out at the same position.
The first set of masonry specimens were placed in a salt solution with NaCl (0.1 m% compared to the oven-dried brick as previously specified) and left there for about 19 days. After this time, the water was drained, and the measurements were carried out the same day.
In a second set of masonry specimens, the walls were additionally watered from above, this time only with deionised water because the masonry specimens used here were previously already contaminated with MgSO4. Due to time constraints, the measuring field as well as the sampling and measuring points were reduced (Figure 6, bottom two pictures).

3.3.5. Historic Buildings

To test the method under real conditions at construction sites, further measurements were performed on real historic objects. These measurements should also validate the generated data in the laboratory and identify the strengths and weaknesses of the device. In total, three regional buildings where examined:
  • Nuremberg state archive constructed in 1880;
  • Nuremberg primary school St. Johannis constructed in 1882;
  • Historical house in Hohenpoelz (Franconian Switzerland) constructed sometime between 1880–1890.
The focus in the selection of the projects was on the investigation of the masonry structure (type of materials, joint network, and thickness) as well as the priority determination of the moisture content via the Darr method. This would enable a comparison with the values obtained via radar measurements. Primarily, projects were of interest in which the above-mentioned questions were clarified by taking drill cores using the dry drilling method. This ensures that the maximum amount of information can be obtained from the samples taken.

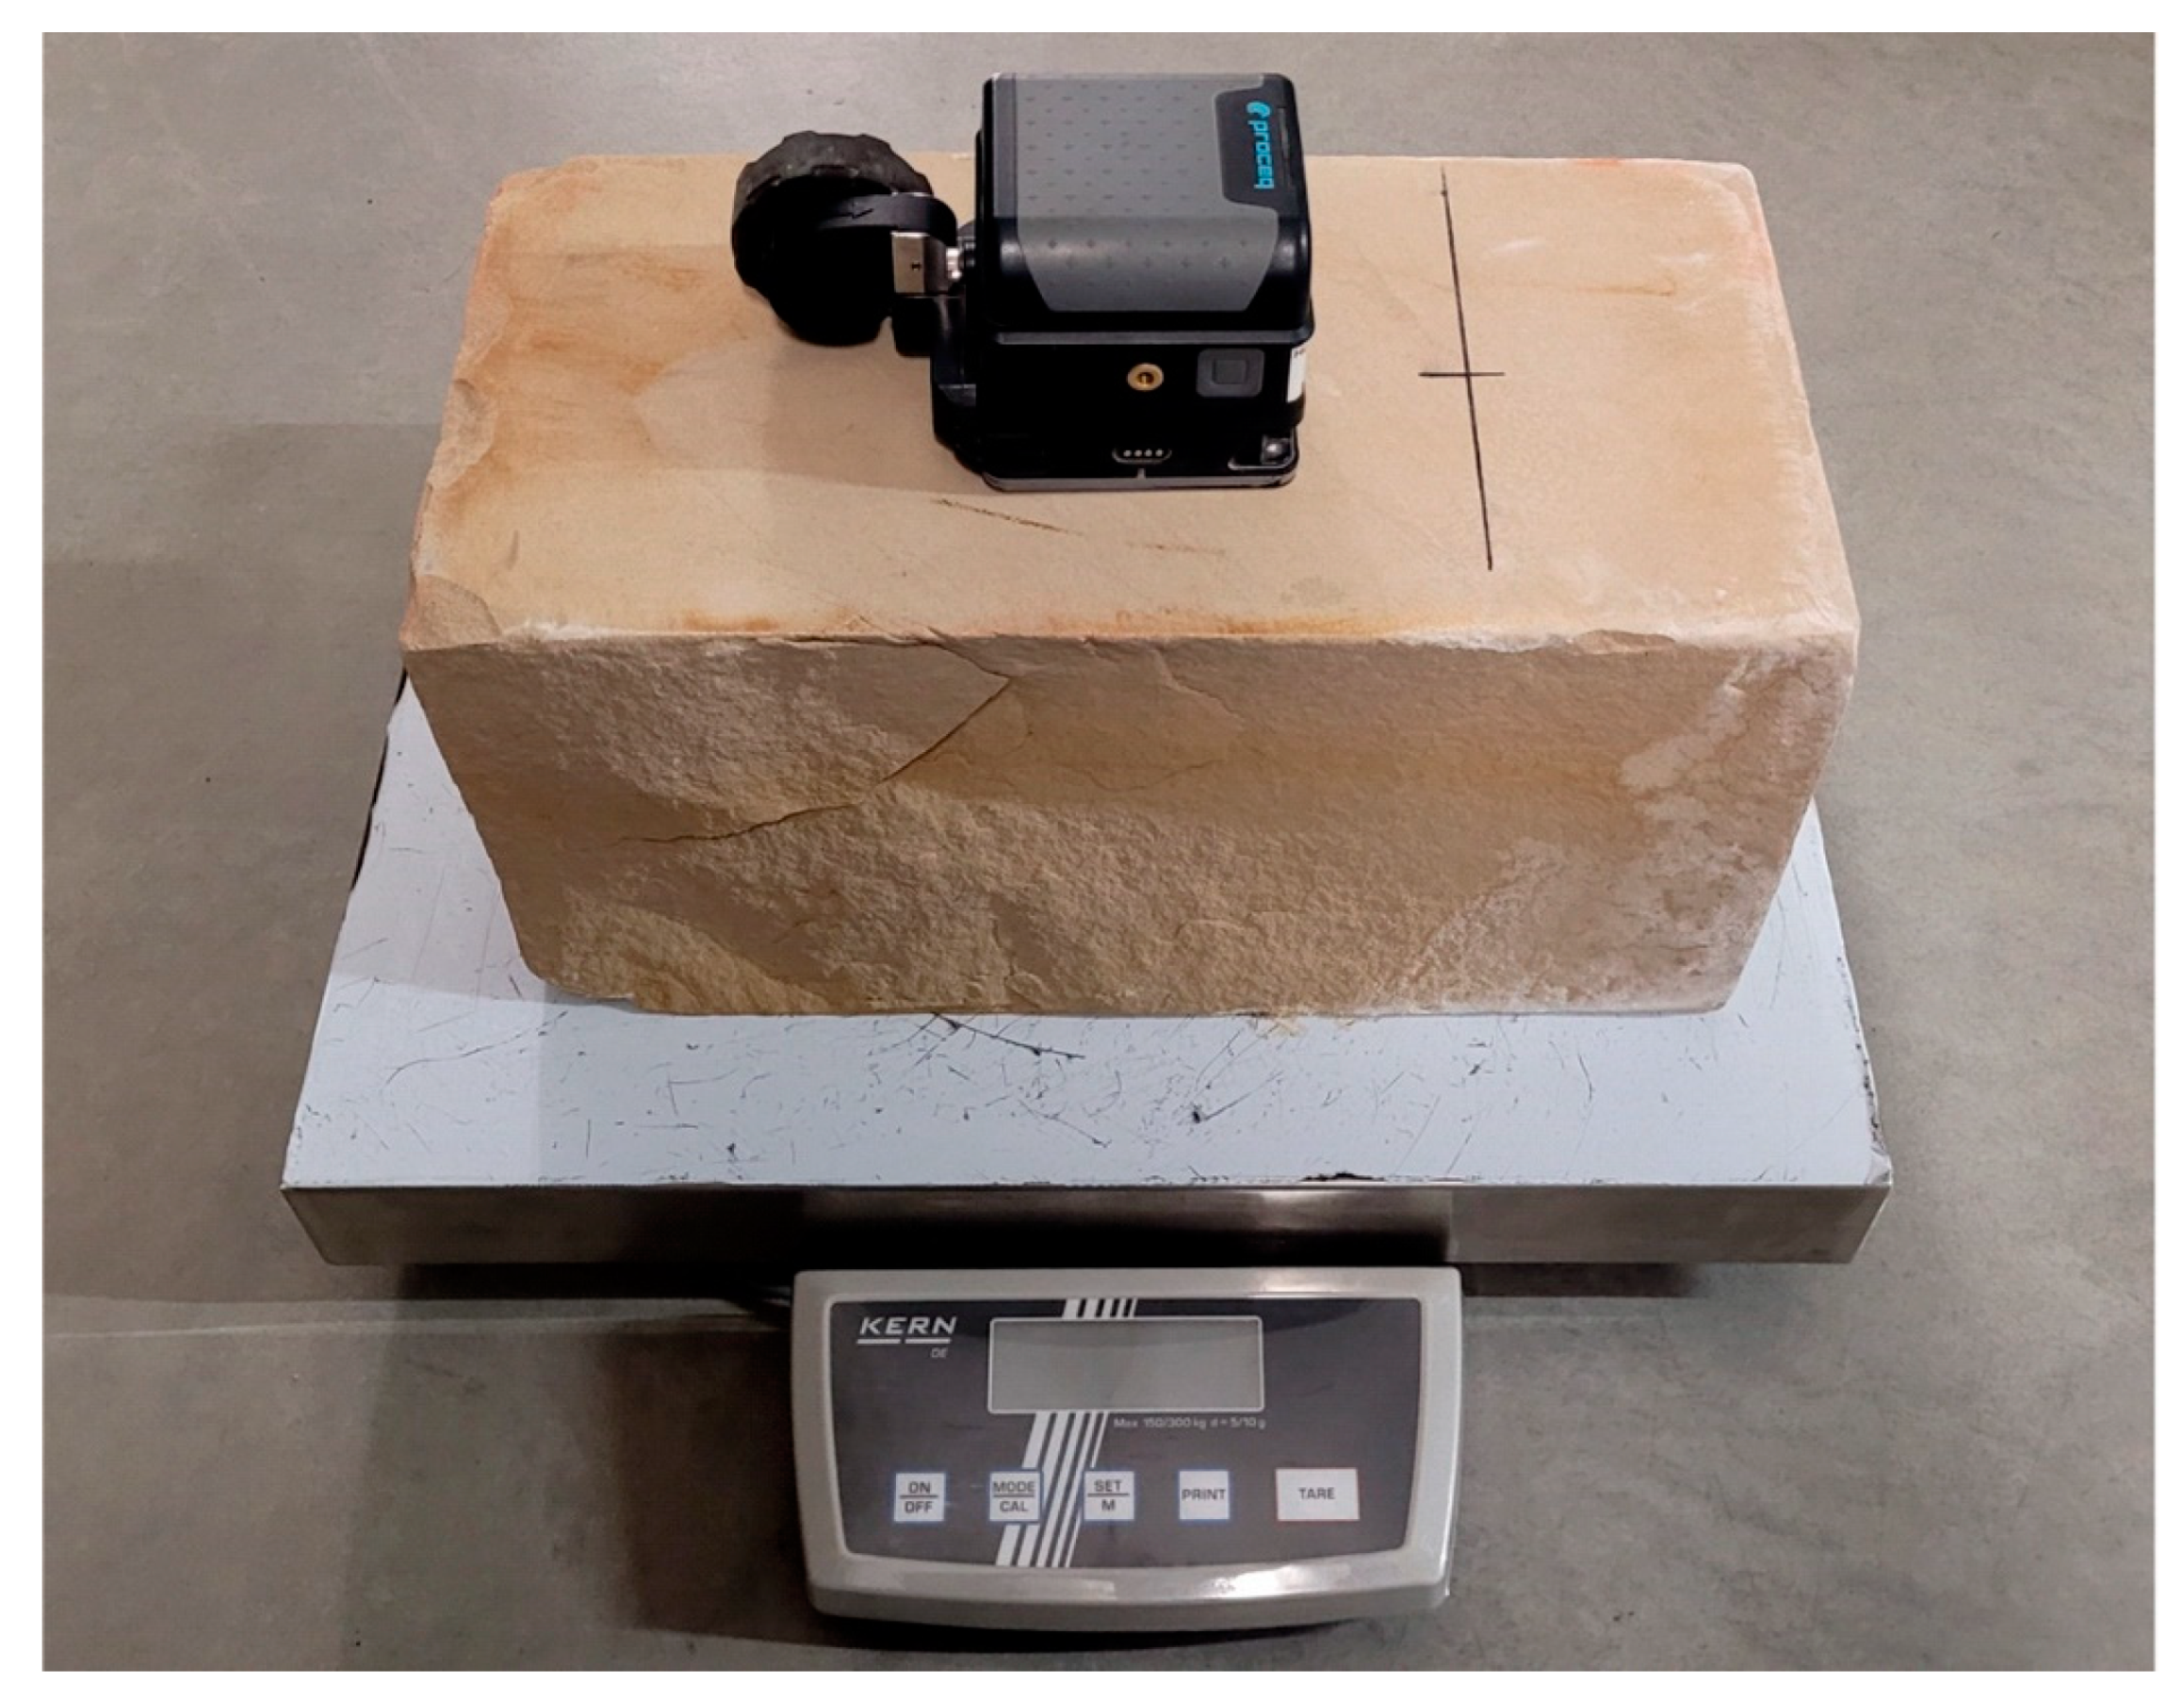
3.4. Radar Measurements

3.4.1. Processing of Radar Data

For the radar measurements, the commercial radar system GP 8800 from screening eagle was used. It is a stepped-frequency continuous wave ground penetrating radar with a frequency between 400 and 6000 MHz [39]. Either measurements on the masonries were point measurements or taken with the help of a frame made of plastic parts, which allowed repeating measurements on the same positions (Figure 7).
For a frequency-resolved determination of the (complex) permittivity, an evaluation in the frequency domain is necessary. In this study, we used the phase spectrum analysis (see e.g., [40,41]). The analysis uses the calculation of the cross power spectral density to retrieve the information about the phase and attenuation of the reflected signal in the frequency domain. While the first one can be transformed into a phase velocity and thus into the real part of frequency dependent, complex permittivity, the latter one was used to calculate an extinction coefficient which was necessary for calculating the imaginary part of the complex permittivity. This approach is described in detail in another study [42].
In this previous study we also proved, that with radar signals within a frequency range between 1 and 3 GHz, the influence of the ions of dissolved salts in the moist building material vanishes for the real part of complex permittivity while the attenuating effect is still present in the imaginary part. Thus, a salt-independent measurement of the humidity at the same time as salt detection can be realized.

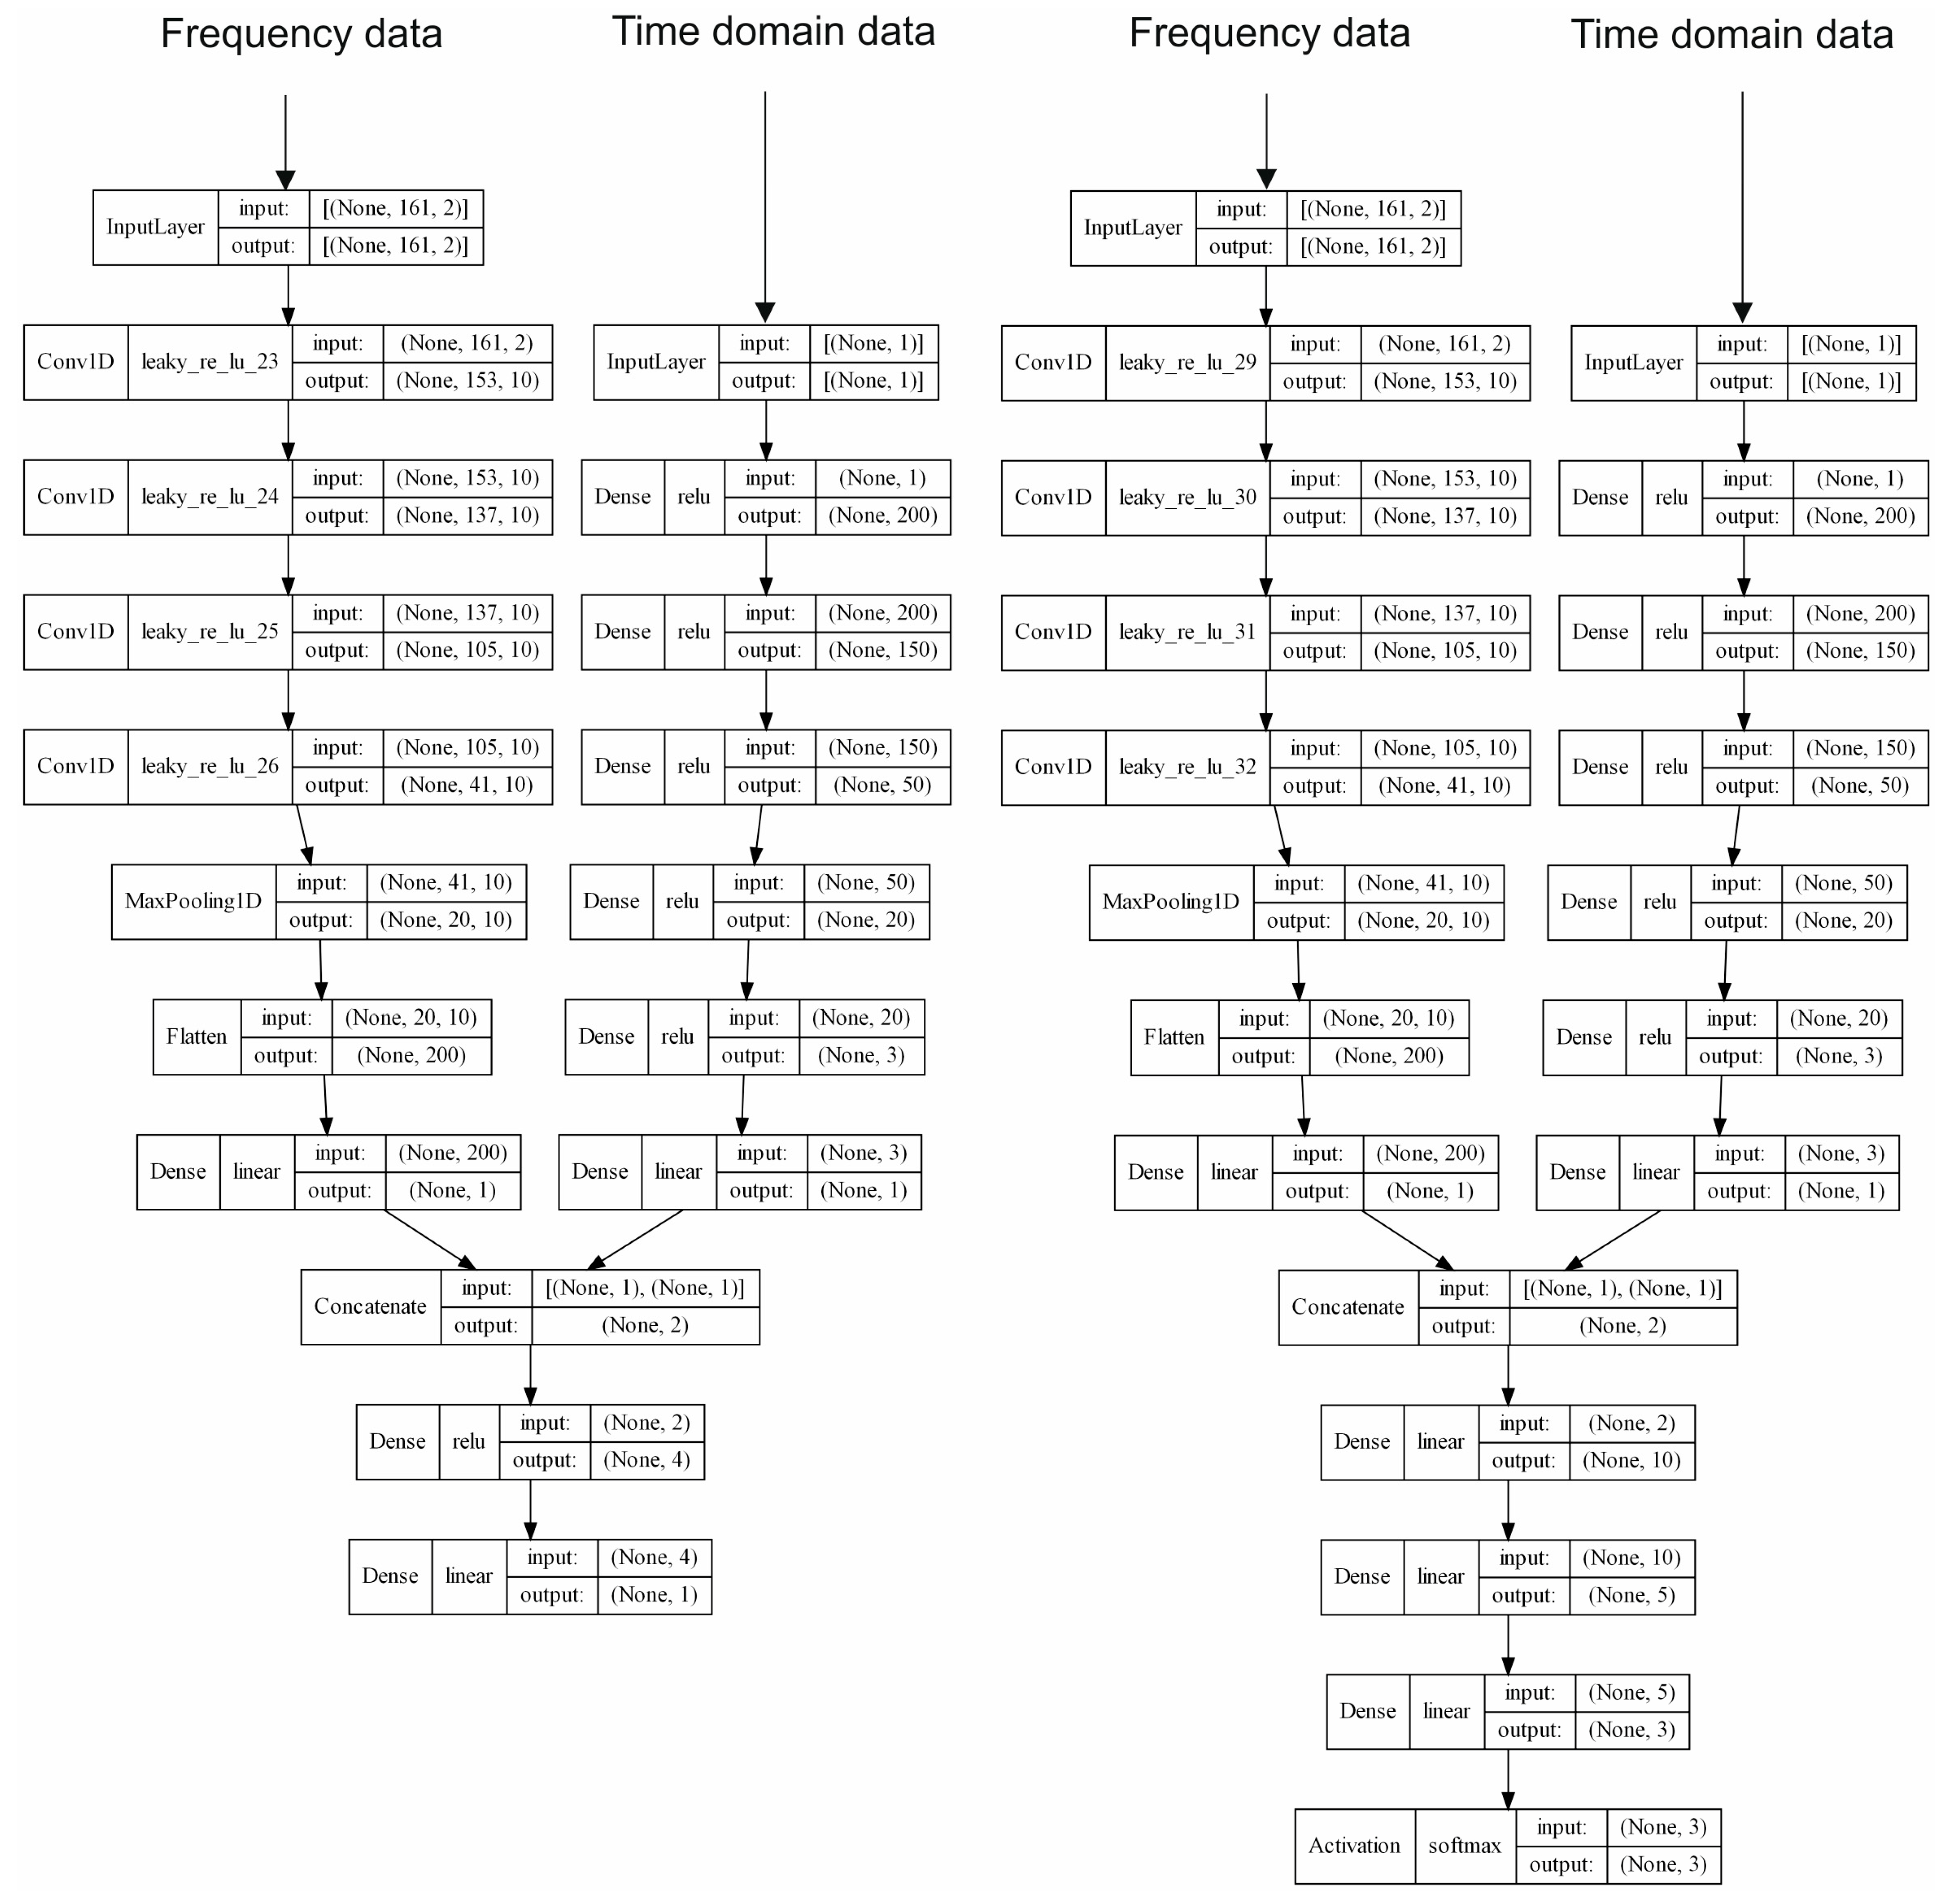
3.4.2. Machine Learning Model (Neural Network)

A further step in optimization is the usage of machine learning algorithms. We used our existing knowledge to determine what input data contains the necessary information about the humidity and salt effects. In the final model, we used the frequency curves of imaginary permittivity and the unwrapped phase angle in the frequency range of 0.8–4 GHz as well as the zero crossing in the center of the reflected wave in the time domain. In model testing we found that the frequency resolved phase information led to more robust predictions as the real part of complex permittivity in fact the difference is just a scaling. The input variables are shown schematically for a measurement in Figure 8.
Since the vectorial data from the frequency domain contains many features, neural networks were used to retain the information out of the complex data structures.
With an algorithm that searches the raw data for the relevant reflection signals and automatically applies a window function, the user interaction is reduced to the input of the wall thickness and the selection of the appropriate material model.
Figure 9 shows the structure of the constructed neural networks. For the frequency data, which is available as a matrix, convolutional layers have proven to be advantageous. The zero-crossing data from the time domain, on the other hand, is processed with fully connected layers (“dense layers”). It should be noted that for both the moisture and the salt model, frequency and time domain data are processed in parallel and merged at the end. For the qualitative salt load prediction model (Figure 9, right), more fully connected layers in the end region proved to be beneficial. Although both networks are similar in structure, the model for moisture prediction is a regressor, which gives a definitive value as output. In this specific case, the moisture in the masonry in mass percent. The model for salt prediction, on the other hand, is a classifier, which gives a probability of how far a measurement result fits into the previously trained categories. In this case, the different salt load levels:
  • No/low salt load
  • Medium salt load
  • High salt load
Usually, data sets that are processed by machine learning algorithms have to be preprocessed. Accordingly, the frequency data were transformed with a “standard scaler” which enforces a normal distribution of the data and the zero-crossing data with a “MinMax scaler” which transforms the maximum value range. The information in the data sets with known salinity was classified with a label- and OneHot-encoder into the prior defined salt categories.

4. Results

4.1. Single Stone Studies

The evaluation of the single-stone studies was carried out as described in Section 3.4.1. By comparing the model parameters of the wet bricks with the moisture data obtained by weighing, a link can be established between the measured curves and the moisture, as can be seen in Figure 10. For the single-stone studies, see also our previous work [42].
The model parameters of the real part for the single-brick materials contaminated with NaCl in Figure 10 show that the humidity can be determined independently of the salt content. On the other hand, the imaginary part shows a high sensitivity to the salt load.
It should be noted that the data points of the salt-loaded bricks are only plotted up to a moisture content of approximately 75%. For higher saturation values, the attenuating properties of the water in combination with the dissolved ions of the salt were too high to generate any evaluable signals for the examined brick length of 240 mm. However, since the bricks without salt loads in this range showed usable results, the information of not receiving a signal already suggests the presence of an increased amount of salt.
For the sandstone samples, it was observed that again, there was no impact of the salts on the real-part permittivity (Figure 11 left) for the salt-contaminated specimens. However, in the imaginary part, different measurement effects of the salts for medium salt loads can be seen. Figure 11 on the right shows that sodium chloride has the strongest dielectric loss on the reflected radar wave, which can be observed in the high imaginary permittivity parameter. The samples with potassium nitrate and magnesium sulphite showed a medium loss. All parameter values of the three salts for the imaginary part lie clearly above the reference values of the samples with deionised water (black dots). This effect decreases with the increasing dryness of the samples as the measurements with saline specimens merge into the measurements with deionised water as the moisture level tends to be zero. Crystallized salts can therefore not be detected because they are electrically neutral.
For the studies with the constant molalities of the salt solutions, the sandstones (same type as in the walls) were divided into two groups. By choosing two molalities of 0.02 mol/kg or 0.012 mol/kg, a solution for each of the three types of salt was prepared accordingly. Monovalent anions such as chloride and nitrate showed similar values in the imaginary-part parameter (attenuation of the signal), whereas values of solutions with bivalent anions, such as the MgSO4 solution, had a lower attenuation of the signal. This can be seen for both groups in Figure 12.
This study shows that the differences between the various salts (especially for the ones with monovalent ions) are low to not present at all. Thus, according to the current status, the qualitative differentiation of salts is not possible. On a real building with an unknown quantity and types of salts contained, it is not possible to distinguish between the different types of salt, especially when there is a mixture of salts with different valences. Furthermore, only a classification into high, medium, and low/no salt load seems feasible, as described in Section 3.4.2.
With the values shown from the single-stone studies, the first version of the neural network for moisture determination at different salt levels was trained. Even so, the measurement can be performed independently from the salt; bricks and sandstones show different measurement effects and therefore need different AI models.

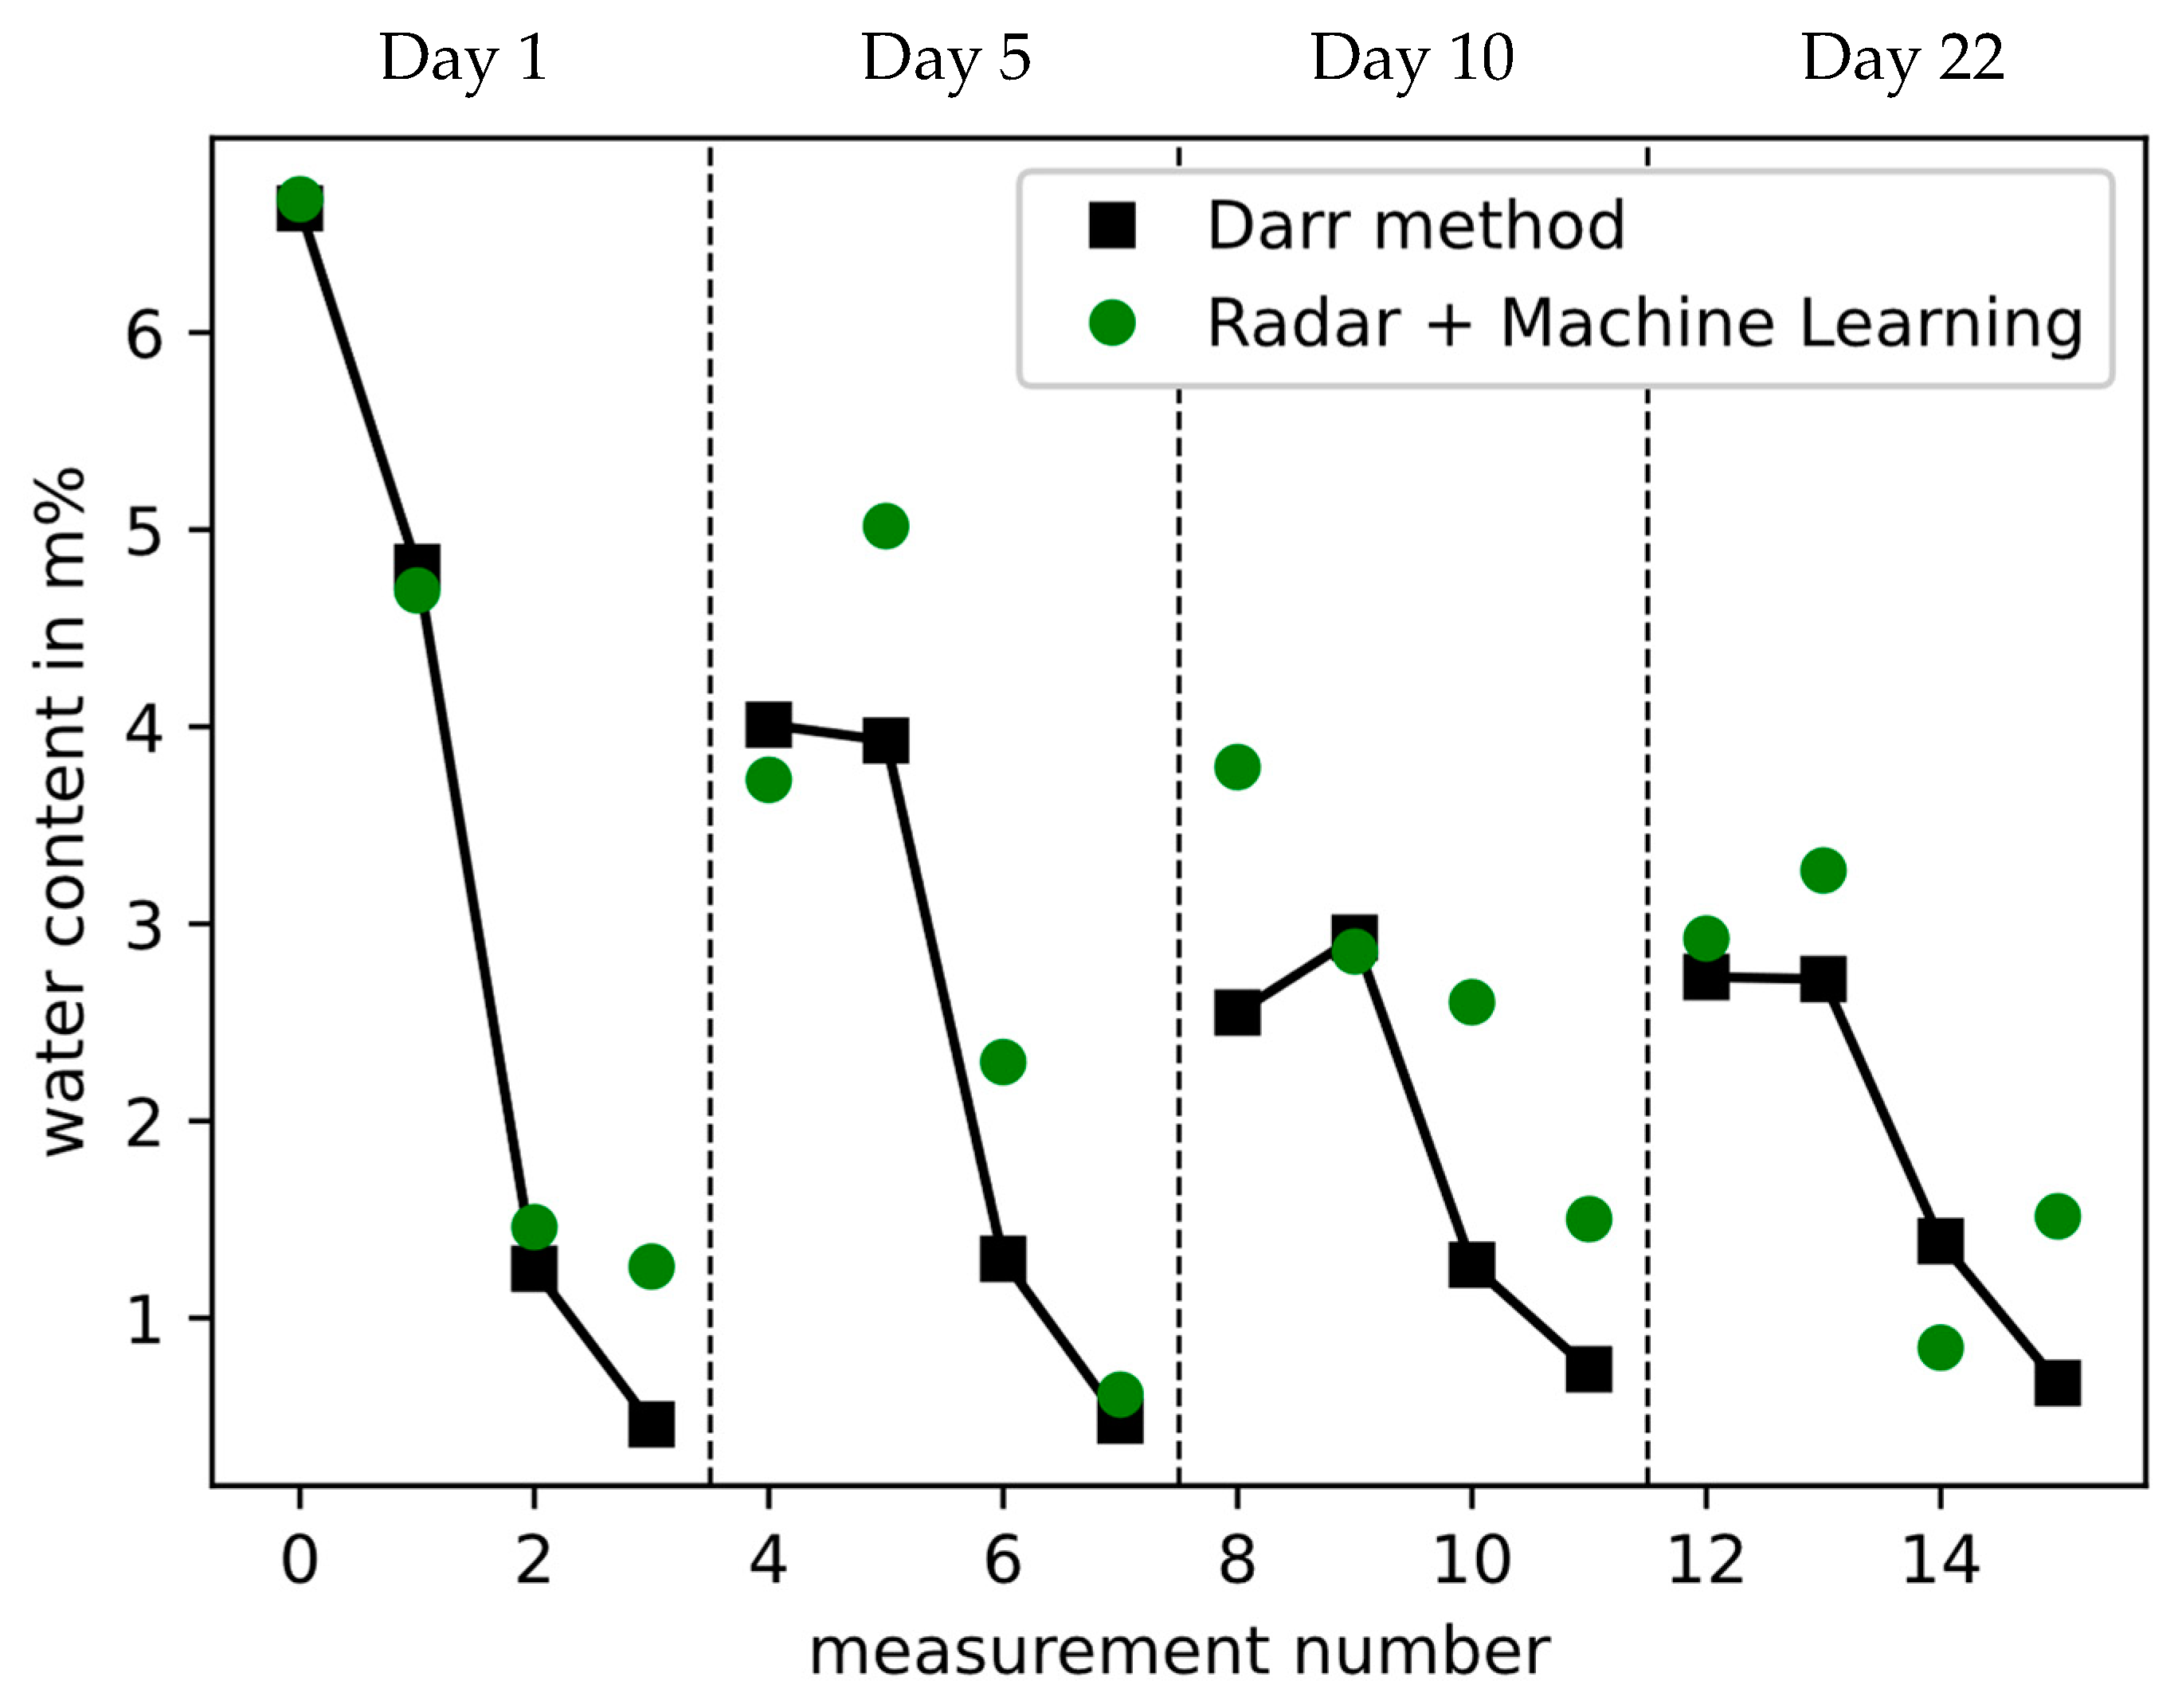
4.2. Measurements Combined with Darr Method on Masonries

In the next steps, the neural network trained with the data from the previous section was applied to the radar measurements of the masonry, which were accompanied by measurements using the Darr method.
To obtain different moisture levels, a sandstone masonry was placed in water. After 19 days, the water was removed, and the sandstone wall was sampled a total of four times over a period of three weeks to show the drying process. The sampling took place at 1, 5, 10, and 22 days after drainage.
For each sampling campaign, point measurements were carried out with the radar device at four heights, followed directly by the extraction of drill dust at the corresponding points (Figure 13).
Figure 14 shows the results for both measurement methods. It can be clearly seen that in the first two measurement days, the moisture prediction of the radar device corresponded well with the gravimetric results. The radar measurements in the last two measurement campaigns, on the other hand, tended to be significantly higher moisture values (see, e.g., measurements 8 and 10, respectively).
The results shown above and additional combined radar and Darr measurements were used to further optimize the neural network. This increased the robustness of the model, resulting in the final version of the used neural network.

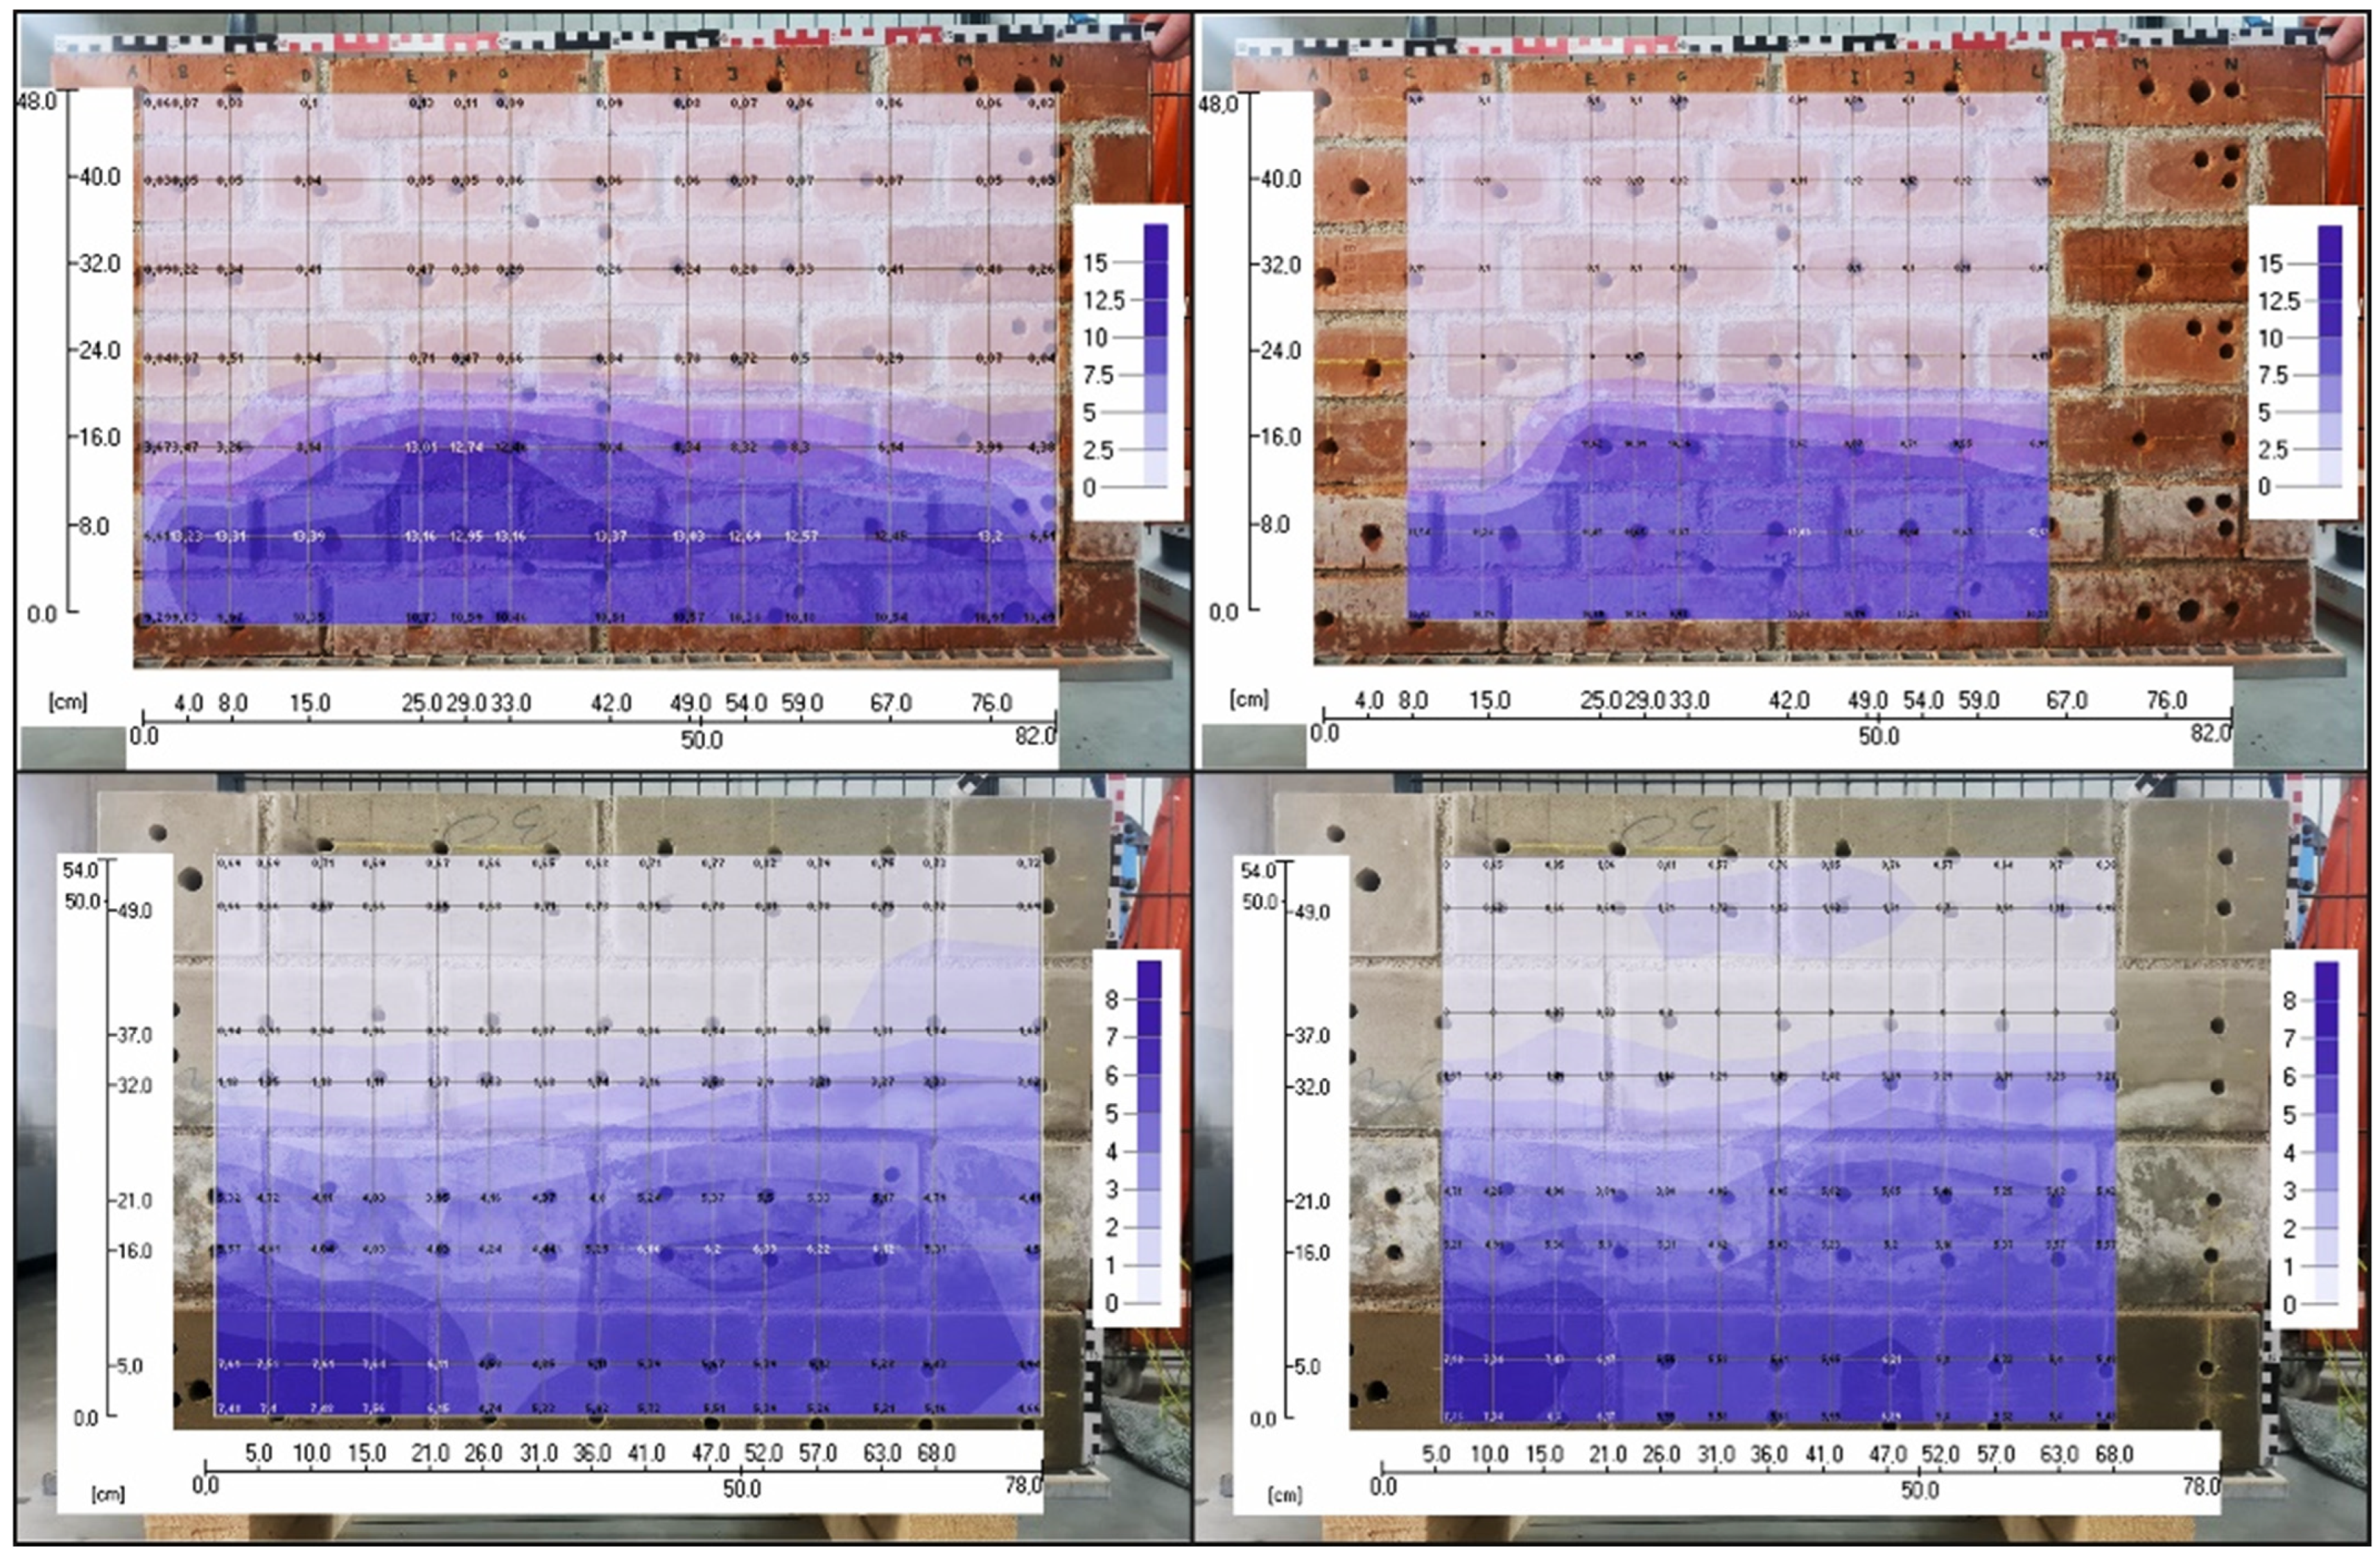
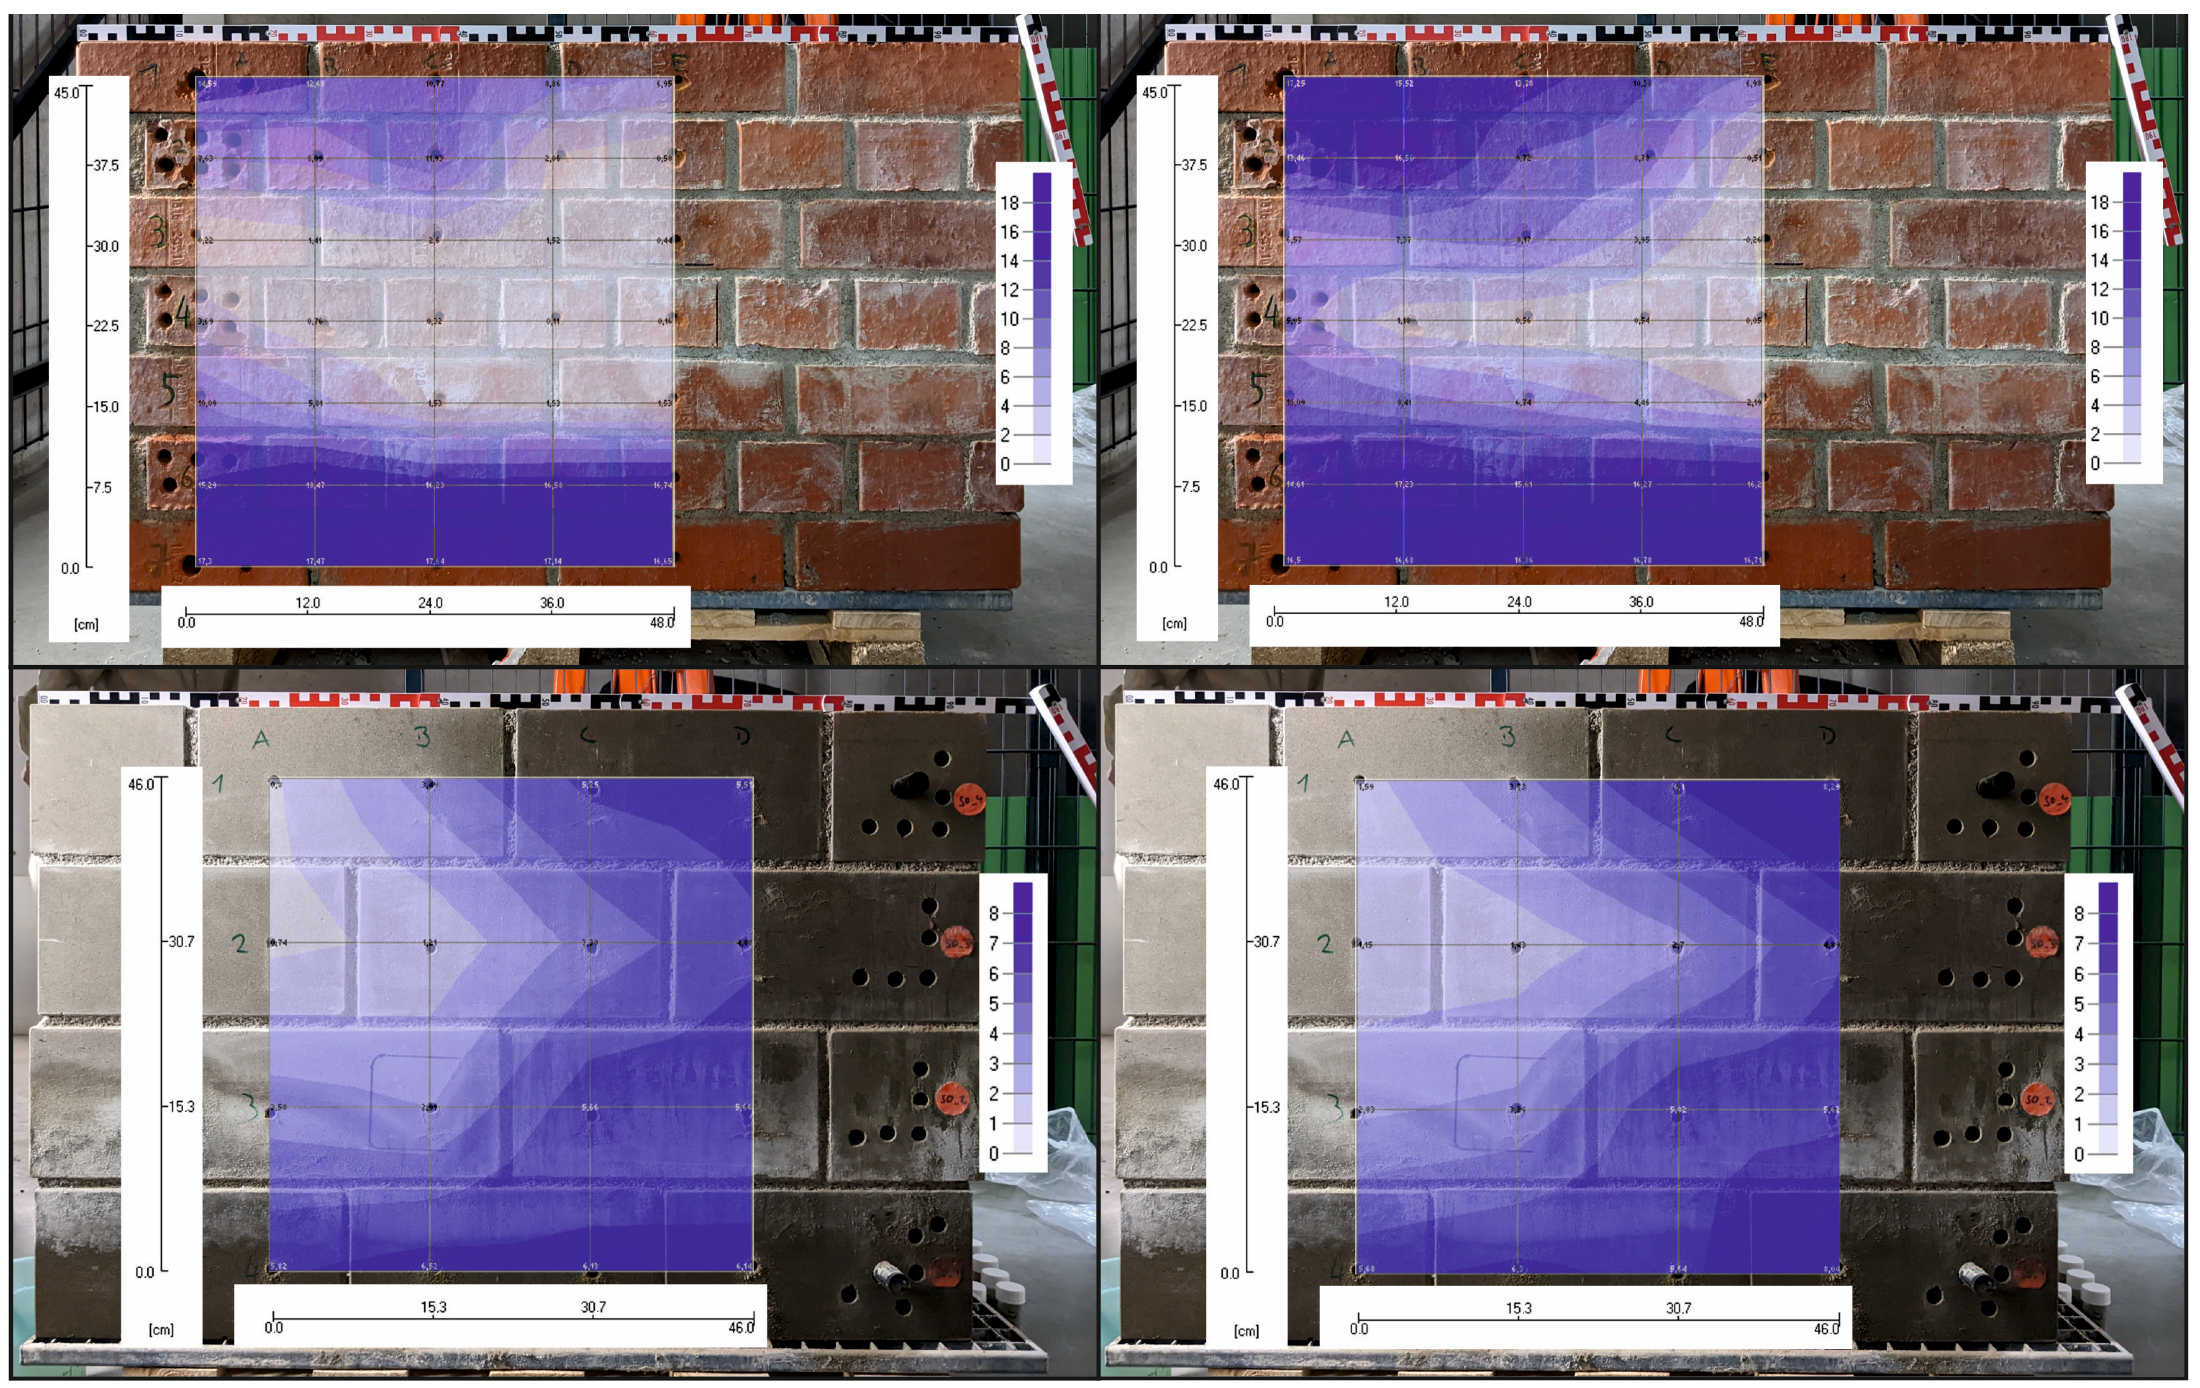
4.3. Area Scans of Masonries

Area measurements were carried out on two sets of masonry specimens (sandstone and brick) with different watering conditions.
The following Figure 15 summarizes the results of the gravimetric evaluation of the first concerted drilling operation in comparison to the radar measurement evaluated with the help of the AI model trained in Section 4.2.
The color bars in all figures are scaled identically in (m%) and so are all the masonry types. Moreover, the diagrams and test block photos were fitted to avoid graphical distortion [43]. It is easy to see that the suction height of the water was very well-represented in the radar measurements. The moisture values can also be compared well with each other, whereby the radar measurements on the brick walls give slightly drier values. In contrast, the measured moisture values of the sandstone walls are very similar compared to the results of the Darr method, which can also be seen well in the very wet stone in the lower left corner. This is also shown in the same way in the radar measurement. It should be noted that the final regression model was not used here, and the data used to train the model were taken from the materials measured here.
For the values of the brick wall, a mean error of 0.55 m% with a standard deviation of ±0.84 m% was determined between the gravimetric and radar measurements. The comparison of the measurements on the sandstone walls resulted in a mean error of 0.41 m% with a standard deviation of ± 0.4 m%.
Figure 16 shows the results of the radar measurements on the left and the values determined by the radar measurements on the right. Since the bricks were able to absorb more water due to their properties, the scale for the brick walls was increased to 18 m%. Otherwise, the scales are the same as in the previous evaluation and identical in each case for the corresponding masonry types. Again, the two results present a very similar picture and reflect the distribution of the wetness very well. This time, the AI predictions are sometimes higher than the values from the Darr method, especially on the brick walls.
In this drilling operation, the mean error between the gravimetrically determined extraction moisture and that determined by the radar measurements is higher than in the first one, at 1.97 m%. The standard deviation here is also high at ±2.49 m%. In contrast, the error at the sandstone wall is significantly better at 0.65 m% with a standard deviation of ±0.72 m%.
While taking the drill dust samples with subsequent weighing and evaluation took about three days, the measurements with the radar probe on both masonries were completed in a few hours. The subsequent evaluation took about another few hours because the workflow had not yet been optimized. With an automated evaluation with little user interaction, this time would be significantly reduced.

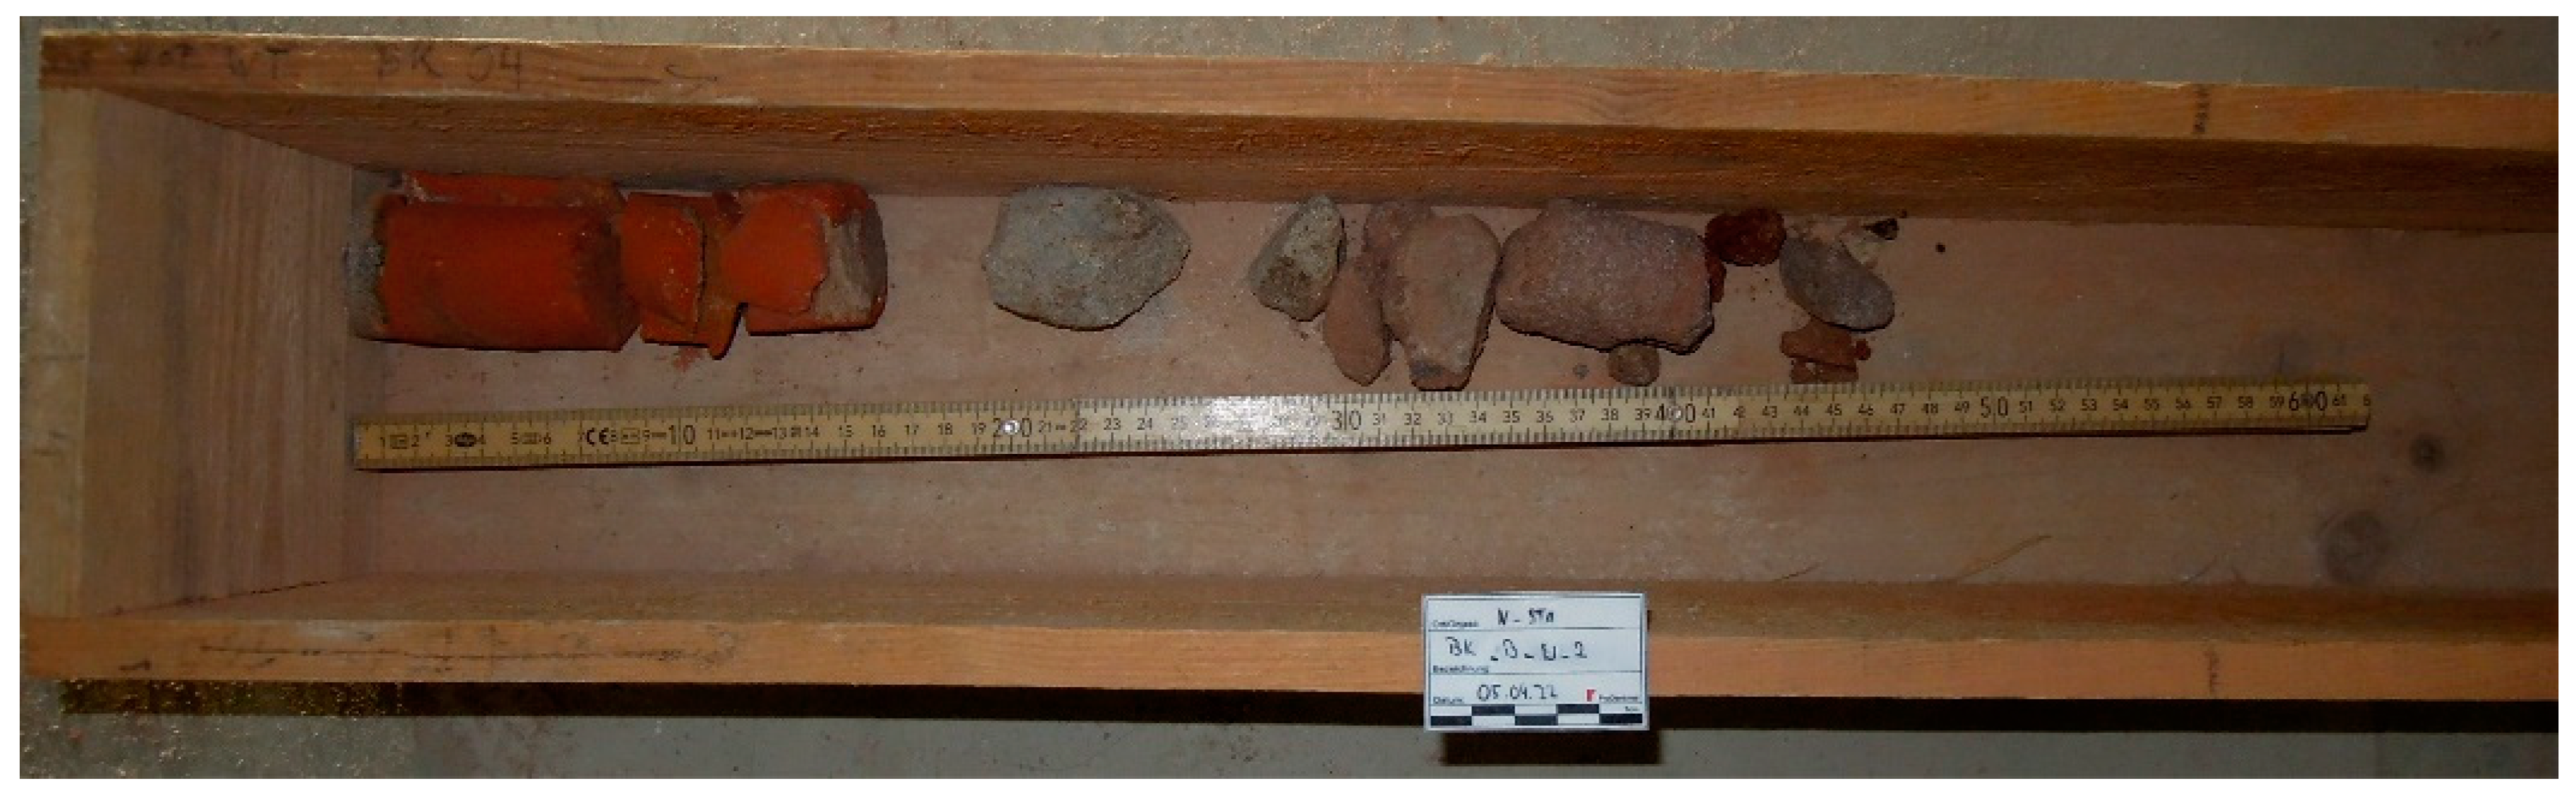
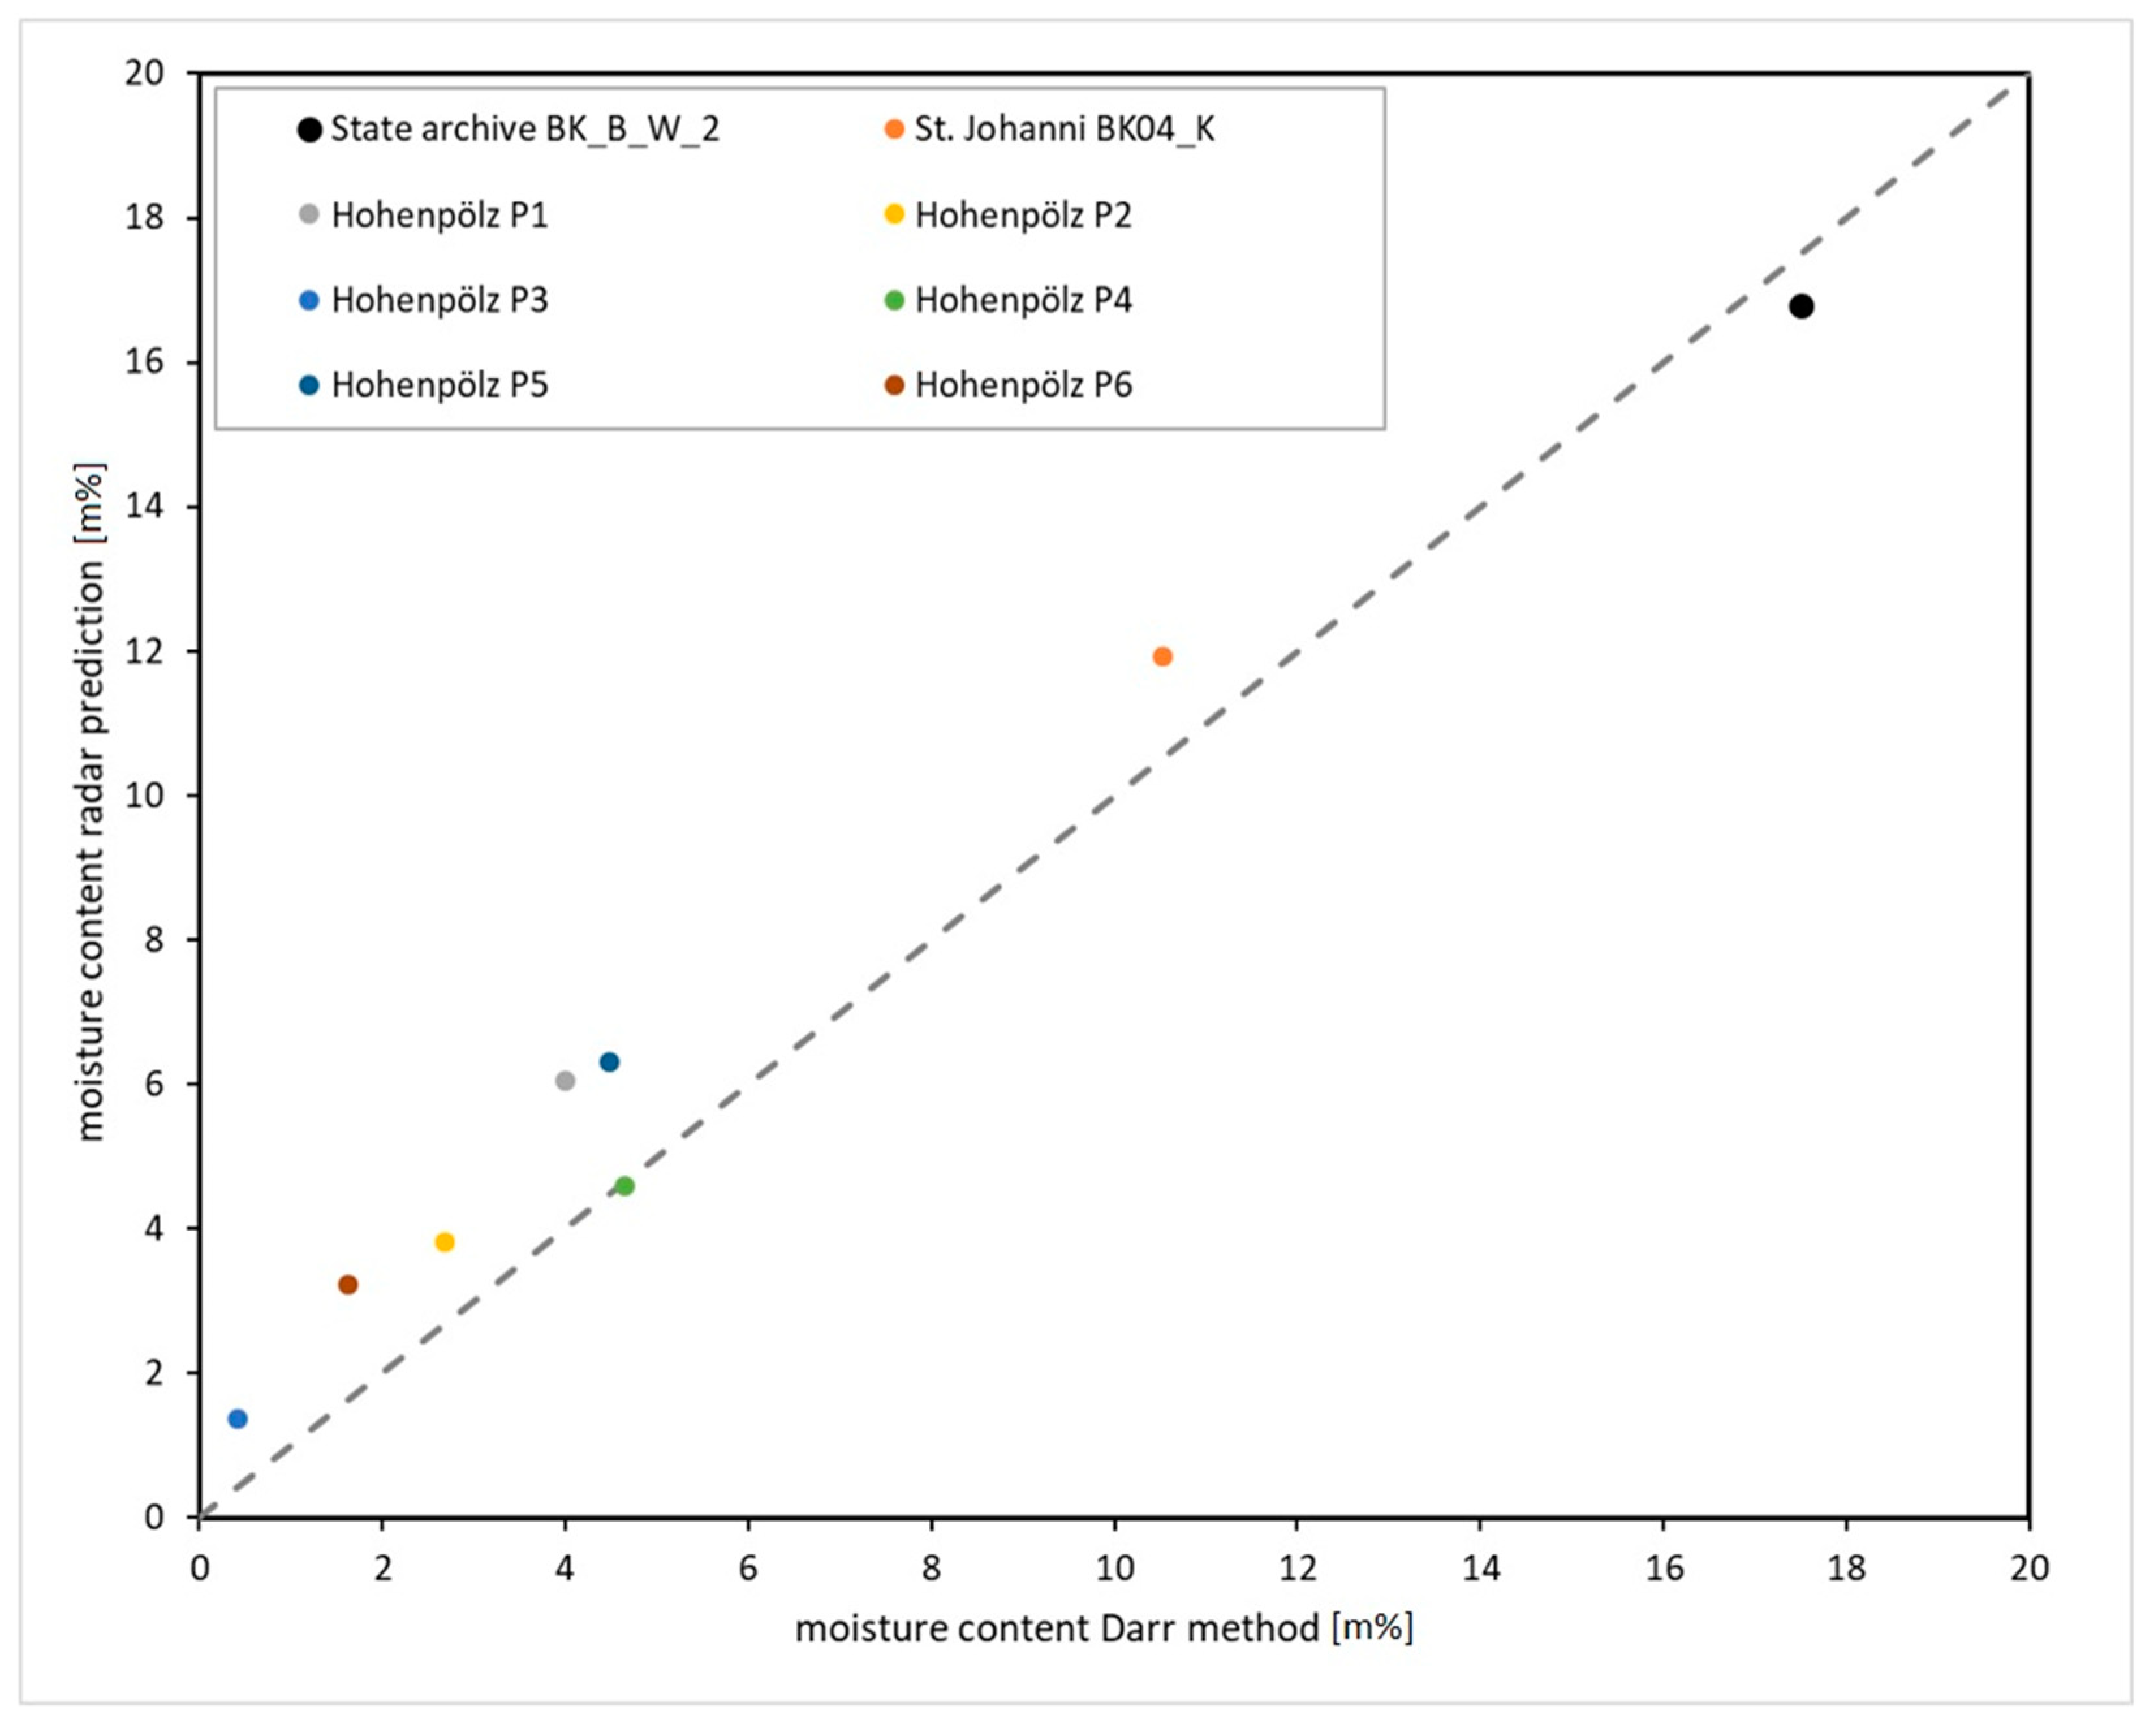
4.4. On-Site Measurements of Historic Buildings

For most of the walls (especially at the two buildings in Nuremberg), the GPR used here was too weak to penetrate the whole thickness of the masonries with about 0.8–0.9 m. Therefore, the following approach was used to preselect the radar measurements to be recorded on thick walls.
The aim was to find a good and clear reflected signal from the material boundaries inside the masonry. Via the drill core samples (example seen in Figure 17), the construction of the wall can be determined, and possible material boundaries such as between brick stone and mortar can be seen.
In total, about eight good measurements could be obtained from the three buildings (Table 2). For the evaluation of the collected data, the analysis of the cross-power density spectrum (CPDS) was used just like described above for the masonry specimens and the single-brick studies.
The evaluation of the data was done with the help of the final trained neural network, whereby only the thickness of the wall, respectively, the distance covered to the reflection plane, and which material was involved (brick or sandstone) had to be entered.
Figure 18 summarizes the results of both measurement methods in a diagram. The predictions of the radar measurements are predominantly higher than the absolute moisture content. The mean error is 1.22 m% with a standard deviation of ±0.61 m%.
The measured values also show a great variety between dry materials (mostly samples from Hohenpoelz) and moist or even wet materials (state archive Nuremberg).

5. Discussion and Conclusions

The measuring system described here can detect moisture independently of the salt content in masonries. Therefore, an evaluation of the complex permittivity over a wide frequency range was conducted. To determine the moisture, model parameters related to the real part are used, as these values show no impact on salt-contaminated specimens. The imaginary part, on the other hand, is highly influenced by the salt content and is therefore suited for a possible salt detection.
Two limits of the procedure must be accepted: Crystallized salts cannot be detected; It is not possible to determine the type of the dissolved salts. Due to the dielectric losses caused by the dissolved salts, a division into low, medium, high salt loads seems possible but should be further investigated.
With machine learning algorithms, the analysis of the complex permittivity becomes more accessible, and only a few user interactions are necessary. The neuronal networks can process multiple sets of data (regressor model for moisture prediction and classifier model for the salt prediction) simultaneously and can sort out insufficient signals automatically. It should be noted that the required data are generated in a single radar measurement.
The concerted drill operations show that the device presented here can measure a large area in a short amount of time in comparison to the Darr method. While the collection of drill dust samples with subsequent analysis in the laboratory took about three days, the radar measurements and the evaluation of the generated data were completed in a few hours. Another big advantage is the non-invasive nature of this method where the device only needs good contact with the surface.
The device has proven to be very practicable under real conditions at construction sites and historic buildings. Like in the concerted drill operations, measurements on large areas can be performed easily and fast. Nevertheless, the best results can be obtained on relatively smooth surfaces and on thin masonries.
The mortar joints on the masonry specimen were so thin (~1 cm) compared to the stones that they had no influence on the measurements because the distance between the antennas of the GPR was bigger than thickness of the mortar joints. In this sense, the stone was always measured as well. Measurements near the joints behave similar to areas without mortar nearby.
Many of these limitations are hardware-related, as the available radar equipment is not designed for such measurements. For further studies, a more focused radiation characteristic of the transmitter should be chosen. This would allow for a higher measuring depth with the same power and therefore a significantly improved quality of the back-reflected signal. This would also minimize possible scattering effects that could superimpose the signal. Furthermore, the transmitter should have a higher power to be able to measure a sufficiently good signal even at higher salt loads with corresponding dielectric losses.
The method developed in this project opens up new possibilities for moisture determination in monument conservation. It is possible to carry out large-scale, temporally repeatable monitoring with the same physical unit as the current destructive standard method. For an exact determination of the composition and quantity of salts in the masonry, the radar method can be used to identify the relevant locations for meaningful drilling samples in advance and thus reduce the frequency of destructive intervention in the building fabric.

Author Contributions

K.S.D., A.T. and C.F. conceptualized the research and led the research team; K.S.D. and C.F. set the methodology; F.H., D.F. and F.B. were in charge of arranging the work; F.H., D.F., O.B., F.B. and C.F. participated in the collection of data in the lab; D.F., O.B. and F.B. took data from the field; O.B. and F.B. carried out radar data evaluation. All authors participated in paper writing. All authors have read and agreed to the published version of the manuscript.

Funding

This research was funded by “Zukunft Bau” innovation program of the German Federal Institute for Research on Building, Urban Affairs and Spatial Development (BBSR) grant number SWD-10.08.18.7-20.49.

Data Availability Statement

The data presented in this study are available on request from the corresponding author.

Acknowledgments

The authors would like to thank Matthias Werner and Katrin Schwuchow for support in project application.

Conflicts of Interest

The authors declare no conflict of interest.

References

  1. Franzen, C.; Mirwald, P.W. Moisture content of natural stone: Static and dynamic equilibrium with atmospheric humidity. Environ. Geol. 2004, 46, 391–401. [Google Scholar] [CrossRef]
  2. Hall, C.; Hoff, W.D. Water Transport in Brick, Stone and Concrete; CRC Press: Boka Raton, FL, USA, 2021. [Google Scholar]
  3. Steiger, M.; Charola, A.E.; Sterflinger, K. Weathering and deterioration. In Stone in Architecture: Properties, Durability; The Metropolitan Museum of Art: New York, NY, USA, 2011; pp. 227–316. [Google Scholar]
  4. Franzen, C.; Zötzl, M.; Trommler, U.; Hoyer, C.; Holzer, F.; Höhlig, B.; Roland, U. Microwave and radio wave supported drying as new options in flood mitigation of imbued decorated historic masonry. J. Cult. Herit. 2016, 21, 751–758. [Google Scholar] [CrossRef]
  5. Adamowski, J.; Hoła, J.; Matkowski, Z. Probleme und Lösungen beim Feuchtigkeitsschutz des Mauerwerks von Baudenkmälern am Beispiel zweier großer Barockbauten in Wrocław. Bautechnik 2005, 82, 426–433. [Google Scholar] [CrossRef]
  6. Zhou, X.; Derome, D.; Carmeliet, J. Analysis of moisture risk in internally insulated masonry walls. Build. Environ. 2022, 212, 108734. [Google Scholar] [CrossRef]
  7. Noor-E-Khuda, S.; Albermani, F. Flexural strength of weathered granites under wetting-drying cycles: Implications to steel structures. Adv. Steel Constr. 2019, 15, 225–231. [Google Scholar]
  8. Franzoni, E.; Sassoni, E. Correlation between microstructural characteristics and weight loss of natural stones exposed to simulated acid rain. Sci. Total Environ. 2011, 412–413, 278–285. [Google Scholar] [CrossRef]
  9. Gentilini, C.; Franzoni, E.; Bandini, S.; Nobile, L. Effect of salt crystallisation on the shear behaviour of masonry walls: An experimental study. Constr. Build. Mater. 2012, 37, 181–189. [Google Scholar] [CrossRef]
  10. Tomor, A.K.; Nichols, J.M.; Orbán, Z. Evaluation of the Loss of Uniaxial Compressive Strength of Sandstones Due to Moisture. Int. J. Arch. Herit. 2023. [Google Scholar] [CrossRef]
  11. Delgado, J.M.P.Q.; Guimarães, A.S.; de Freitas, V.P.; Antepara, I.; Kočí, V.; Černý, R. Salt Damage and Rising Damp Treatment in Building Structures. Adv. Mater. Sci. Eng. 2016, 2016, 1280894. [Google Scholar] [CrossRef] [Green Version]
  12. DIN EN 16682:2017-05; Conservation of Cultural Heritage—Methods of Measurement of Moisture Content, or Water Content, in Materials Constituting Immovable Cultural Heritage. Deutsches Institut für Normung: Berlin, Germany, 2017.
  13. WTA (2002): Messung der Feuchte von Mineralischen Baustoffen. WTA Merkblatt 4-11. Referat 4 Bauwerksabdichtung. Unter Mitarbeit von Uwe Schürger und Heinrich Wigger; Ausgabe: 12.2002/D, Endgültige Fassung: Oktober 2003. Fraunhofer IRB-Verlag; WTA Publications (WTA-Merkblatt, 4–11): Stuttgart, Pfaffenhofen.
  14. Flatt, R.J.; Caruso, F.; Sanchez, A.M.A.; Scherer, G.W. Chemo-mechanics of salt damage in stone. Nat. Commun. 2014, 5, 4823. [Google Scholar] [CrossRef] [Green Version]
  15. Scherer, G.W. Crystallization in pores. Cem. Concr. Res. 1999, 29, 1347–1358. [Google Scholar] [CrossRef]
  16. GANN. “Gann Hydromette Uni 1 + Uni 2”. 2001. Available online: https://www.gann.de/_Resources/Persistent/f108529c9e130dc739403b303170bb20b7d54d88/UNI1_UNI2_EN.pdf (accessed on 4 May 2023).
  17. Hoła, A. Measuring of the moisture content in brick walls of historical buildings—The overview of methods. IOP Conf. Ser. Mater. Sci. Eng. 2017, 251, 012067. [Google Scholar] [CrossRef]
  18. Gärnter, G.; Plagge, R.; Sonntag, H. Determination of moisture content of the outer wall using hf-sensor technology. In Proceedings of the 1st European Conference on Moisture Measurement, Weimar, Germany, 5–7 October 2010. [Google Scholar]
  19. Bayer, K.; Köhler, W.; Schuh, H.; Wendler, E. Vergleichsuntersuchungen mit unterschiedlichen zerstörungsfreien und zerstörungsarmen Feuchte- und Salzmessmethoden. In Konservierungswissenschaftliches Kolloquium in Berlin und Brandenburg; Hsg, S., Ed.; Lukas Verlag: Berlin, Germany, 2010; pp. 69–74. [Google Scholar]
  20. Hasted, J.B.; Shah, M.A. Microwave absorption by water in building materials. Br. J. Appl. Phys. 1964, 15, 825–836. [Google Scholar] [CrossRef]
  21. Pisa, S.; Pittella, E.; Piuzzi, E.D.; Atanasio, P.; Zambotti, A. Permittivity measurement on construction materials through free space method. In Proceedings of the I²MTC 2017 IEEE International Instrumentation and Measurement Technology Conference, Torino, Italy, 22–25 May 2017; IEEE: Piscataway, NJ, USA, 2017; pp. 1–4. [Google Scholar]
  22. Leschnik, W. Feuchtemessung an Baustoffen–Zwischen Klassik und Moderne. DGZfP-Berichtsband BB 69-CD. Ph.D. Thesis, Technische Universität Hamburg, Hamburg, Germany, 1999. [Google Scholar]
  23. Maierhofer, C.; Wöstmann, J. Investigation of dielectric properties of brick materials as a function of moisture and salt content using a microwave impulse technique at very high frequencies. NDT E Int. 1998, 31, 259–263. [Google Scholar] [CrossRef]
  24. Maierhofer, C.; Wöstmann, J.; Trela, C.; Röllig, M. Investigation of moisture content and distribution with radar and active thermography. In Proceedings of the RILEM Symposium on On Site Assessment of Concrete, Masonry and Timber Structures-SACoMaTiS 2008, Varenna, Italy, 1–2 September 2008; RILEM Pub: Bagneux, France, 2008; pp. 411–420. [Google Scholar]
  25. Dérobert, X.; Villain, G. Effect of water and chloride contents and carbonation on the electromagnetic characterization of concretes on the GPR frequency band through designs of experiment. NDT E Int. 2017, 92, 187–198. [Google Scholar] [CrossRef]
  26. Du Plooy, R.L.; Villain, G.; Lopes, S.P.; Ihamouten, A.; Dérobert, X.; Thauvin, B. Electromagnetic non-destructive evaluation techniques for the monitoring of water and chloride ingress into concrete: A comparative study. Mater. Struct. 2015, 48, 369–386. [Google Scholar] [CrossRef]
  27. Hugenschmidt, J.; Loser, R. Detection of chlorides and moisture in concrete structures with ground penetrating radar. Mater. Struct. 2008, 41, 785–792. [Google Scholar] [CrossRef] [Green Version]
  28. Kalogeropoulos, A.; Van Der Kruk, J.; Hugenschmidt, J.; Busch, S.; Merz, K. Chlorides and moisture assessment in concrete by GPR full waveform inversion. Near Surf. Geophys. 2011, 9, 277–286. [Google Scholar] [CrossRef]
  29. Ihamouten, A.; Villain, G.; Dérobert, X. Complex Permittivity Frequency Variations From Multioffset GPR Data: Hydraulic Concrete Characterization. IEEE Trans. Instrum. Meas. 2012, 61, 1636–1648. [Google Scholar] [CrossRef]
  30. Senin, S.; Hamid, R. Ground penetrating radar wave attenuation models for estimation of moisture and chloride content in concrete slab. Constr. Build. Mater. 2016, 106, 659–669. [Google Scholar] [CrossRef]
  31. Wutke, M.K. Use of Ground Penetrating Radar measurement combined to resistivity measurement for characterization of the concrete moisture. In Proceedings of the 17th International Conference on Ground Penetrating Radar (GPR). 2018 17th International Conference on Ground Penetrating Radar (GPR), Rapperswil, Switzerland, 18–21 June 2018; IEEE: Piscataway, NJ, USA, 2018; pp. 1–7. [Google Scholar]
  32. Lai, W.W.-L.; Kind, T.; Kruschwitz, S.; Wöstmann, J.; Wiggenhauser, H. Spectral absorption of spatial and temporal ground penetrating radar signals by water in construction materials. NDT E Int. 2014, 67, 55–63. [Google Scholar] [CrossRef]
  33. Binda, L.; Colla, C.; Forde, M. Identification of moisture capillarity in masonry using digital impulse radar. Constr. Build. Mater. 1994, 8, 101–107. [Google Scholar] [CrossRef]
  34. Binda, L.; Cardani, G.; Zanzi, L. Nondestructive Testing Evaluation of Drying Process in Flooded Full-Scale Masonry Walls. J. Perform. Constr. Facil. 2010, 24, 473–483. [Google Scholar] [CrossRef]
  35. Agliata, R.; Bogaard, T.A.; Greco, R.; Mollo, L.; Slob, E.C.; Steele-Dunne, S.C. Non-invasive estimation of moisture content in tuff bricks by GPR. Constr. Build. Mater. 2018, 160, 698–706. [Google Scholar] [CrossRef] [Green Version]
  36. Orr, S.A.; Fusade, L.; Young, M.; Stelfox, D.; Leslie, A.; Curran, J.; Viles, H. Moisture monitoring of stone masonry: A comparison of microwave and radar on a granite wall and a sandstone tower. J. Cult. Herit. 2020, 41, 61–73. [Google Scholar] [CrossRef]
  37. Delphin (6.1.5) [Software]. 2023 Bauklimatik Dresden. Available online: https://www.bauklimatik-dresden.de/delphin/index.php (accessed on 5 April 2023).
  38. Wissenschaftlich-Technische Arbeitsgemeinschaft für Bauwerkserhaltung und Denkmalpflege (2019): Salzreduzierung an Porösen Mineralischen Baustoffen Mittels Kompressen; Deutsche Fassung vom Dezember 2019, Ausgabe 12/2019/D; Fraunhofer IRB-Verlag, (WTA-Merkblatt, 3-13): Stuttgart, Germany, 2019.
  39. Proceq GP8800|Ground Penetrating Radar. 2023. Available online: https://www.screeningeagle.com/en/products/proceq-gp8800-ultraportable-concrete-gpr-radar (accessed on 2 March 2023).
  40. Sachse, W.; Pao, Y.-H. On the determination of phase and group velocities of dispersive waves in solids. J. Appl. Phys. 1978, 49, 4320–4327. [Google Scholar] [CrossRef]
  41. Singer, F. Mess- und Analysemethoden in der Laserakustik bei breitbandiger Laseranregung. Tech. Mess. 2015, 82, 45–51. [Google Scholar] [CrossRef]
  42. Blaschke, O.; Brand, F.; Drese, K.S. Quantification of Humidity and Salt Detection in Historical Building Materials via Broadband Radar Measurement. Sensors 2023, 23, 4616. [Google Scholar] [CrossRef]
  43. Franzen, C.; Siedler, G.; Franzen, C.; Vetter, S. Orthogonal IRT imaging. In Proceedings of the 2013 Digital Heritage International Congress (DigitalHeritage), Marseille, France, 8 October–1 November 2013; pp. 633–636. [Google Scholar] [CrossRef]
Figure 1. Basic principle of measurement: Continuous masonry unit on the left with one possible reflection at the back. Layered bricks with mortar joint in between on the right, here with two possible reflections: the first on the mortar joint and the second on the back.
Heritage 06 00266 g001
Figure 2. Historic building materials used and investigated in the study: (a) SST macroscopic picture; (b) SST under the microscope, pores are marked by blue resin; (c) SBM; (d) SBM under the microscope; (e) TLM in jointing mortar; (f) TLM microscopic view.
Heritage 06 00266 g002
Figure 3. Stored test specimens in steel profile troughs.
Heritage 06 00266 g003
Figure 4. (Left) Results of the 3D simulation with the measured material properties of the building materials and the generally prevailing boundary conditions (measured climate conditions 18 °C and 60% rH). (Right) Result of a simulated watering process on true scale constructed 3D models of both types of masonry specimens over 70 days. After 17 days, the water was removed, and the drying process starts. While there is a lot of water intake in the first few days, the drying process is much slower and therefore more suitable for measurements with the radar device.
Heritage 06 00266 g004
Figure 5. Measurement of the drying process of individual bricks along an axis with the radar device. Continuous weight measurement allows conclusions to be drawn about the water content in the sample.
Heritage 06 00266 g005
Figure 6. Schematic drawings of the two drilling operations with corresponding drill points for brick masonry (left) and sandstone masonry (right). The top two pictures each show the first drilling action, and the bottom two show the second with fewer sample points. Each red cross represents an extraction or, respectively, a radar measure point.
Heritage 06 00266 g006
Figure 7. (Left) Masonry shortly before the water was drained. The suction horizon on the sandstone masonry can be seen very clearly. (Right) Radar measurement along the positioning frame.
Heritage 06 00266 g007
Figure 8. Input variables for the neural networks. (Left) Frequency-domain data. Additional features (deviation from the linear curve) of the phase angle are not visible due to scaling. (Right) Time domain data with zero crossing.
Heritage 06 00266 g008
Figure 9. (Left) Structure of the neural network for moisture prediction. (Right) Neural network for salt prediction.
Heritage 06 00266 g009
Figure 10. Studies on SBM for different moisture contents. One group was exposed to a salt solution with NaCl (blue squares), while the other group was only exposed to deionised water (black dots). The displayed real part (left side) was not affected by the contained salt. The imaginary part, on the other hand, was affected, and the offset increased with increasing moisture content. That is due to the higher number of dissolved salt ions, which results in a higher damping of the reflected signal. It is possible to measure the moisture content independently from the salt content.
Heritage 06 00266 g010
Figure 11. (Left) Model values of the real-part permittivity for sandstone specimens with different salt solutions and deionised water against the water content. No offset between the salt solutions and the deionised water is seen here. (Right) Model values of the imaginary-part permittivity for sandstone specimens, again with different salt solutions and deionised water against water content. Here, a clear offset can be seen between the salt-contaminated samples and the specimens with deionised water.
Heritage 06 00266 g011
Figure 12. Influence of different types of salt on radar measurement at two constant molalities (left side 0.012 mol/kg, right side 0.02 mol/kg). Displayed here are the model parameters of the imaginary part. Monovalent ions such as chloride and nitrate show similar results for the imaginary part. Negative values are possible if the measured wave has a higher amplitude compared to the measured reference signal.
Heritage 06 00266 g012
Figure 13. Equidistant extraction points of the four measurement days resulting in a total of 16 individual positions.
Heritage 06 00266 g013
Figure 14. Comparison of the gravimetric extraction moisture (black line) with the results of the radar measurements (green dots). The positions of the measurement numbers are displayed in Figure 13. Darr method and radar measurements agree well in the first two sampling campaigns. In the subsequent measurements, the radar measurements tend to show higher moisture contents.
Heritage 06 00266 g014
Figure 15. Results of the gravimetrically determined moisture content on the left and the predictions of the radar measurements on the right. Top picture brick wall, bottom picture sandstone wall. The graphical representation shows the moisture distribution across the whole surface. The scale on the right shows the moistures in (m%). The bricks have a higher porosity than the sandstone, but the pore size distribution of the sandstone allows a higher maximum of capillary rise.
Heritage 06 00266 g015
Figure 16. Evaluation of the water content for both specimen types of the smaller, concerted drilling action. On the left are the results of the Darr method; on the right are the predictions of the radar measurements.
Heritage 06 00266 g016
Figure 17. Drill core taken from a single-shell vault masonry of the state archive in Nuremberg. The sample number here is BK_B_W_2.
Heritage 06 00266 g017
Figure 18. Graphical representation between the gravimetrically determined moisture data and the predictions from the radar measurements, according to the values from Table 2.
Heritage 06 00266 g018
Table 1. Lab-determined relevant physical and moisture characteristics of the building material.
SampleProperties of the Material
Waa
(Atmospheric)
Wav
(Vacuum)
WAvol.Poros.Saturation
Coefficient
pure-D.raw-D.A-Coefficient
[m%][m%][Vol.%][Vol.%] [g/cm³][g/cm³][kg/m2 × h0.5]
SST8.0411.8316.1623.780.682.642.018.46
SBM13.9315.3225.6028.160.912.561.8413.6
TLM17.4220.6029.7335.160.852.631.7115.34
WAa, water absorption under atmospheric pressure; WAv, water absorption under vacuum; WAvol., volumetric water absorption; poros., porosity; pure-D., pure density; raw-D., raw density; A-coefficient, capillary water absorption.
Table 2. Compilation of the results of the selected measuring points. Marked in light blue are the values of the moisture content determined via Darr method and the predictions via radar.
SampleLengthMaterialMoisture Content
Darr Method
WAaDegree of
Moisture
Penetration
Moisture Content
Radar Prediction
From (cm)To (cm) (m%)(m%)(%)(m%)
State archive, Nuremberg
BK_B_W_2/1117brick17.5016.8210016.8
Primary school St. Johannis, Nuremberg
BK04_K210brick10.5315.1369.611.93
Historical house, Hohenpoelz
P10 13brick3.9917.5622.76.04
P20 13brick2.6817.5615.23.82
P30-13brick0.4117.562.31.37
P40 15brick plastered4.6417.5626.44.6
P50 15brick plastered4.4817.5625.56.32
P60 15brick plastered1.6217.569.23.22
Disclaimer/Publisher’s Note: The statements, opinions and data contained in all publications are solely those of the individual author(s) and contributor(s) and not of MDPI and/or the editor(s). MDPI and/or the editor(s) disclaim responsibility for any injury to people or property resulting from any ideas, methods, instructions or products referred to in the content.

