Article

Modeling Salt Behavior with ECOS/RUNSALT: Terminology, Methodology, Limitations, and Solutions

1
Monuments Lab, Royal Institute for Cultural Heritage (KIK-IRPA), 1000 Brussels, Belgium
2
Faculty of Design Sciences, Antwerp Cultural Heritage Sciences (ARCHES), University of Antwerp, 2000 Antwerpen, Belgium
3
Department of Geology, PProGRess, Ghent University, 9000 Ghent, Belgium
4
Department of Chemistry, University of Hamburg, 20146 Hamburg, Germany
5
Institute for Sustainable Heritage, University College London (UCL), London WC1E 6BT, UK
6
Renovation & Heritage Lab, Belgium Building Research Institute (BBRI), 1060 Saint-Gilles, Belgium
7
Department of Earth Sciences, Utrecht University, 3584 Utrecht, The Netherlands
*
Author to whom correspondence should be addressed.
Heritage 2022, 5(4), 3648-3663; https://doi.org/10.3390/heritage5040190
Submission received: 25 October 2022 / Revised: 18 November 2022 / Accepted: 21 November 2022 / Published: 23 November 2022
(This article belongs to the Special Issue Effective Models in Heritage Science)

Abstract

:
Damage to porous materials in heritage buildings caused by salt mixture crystallization is driven by the surrounding environmental conditions. To understand the crystallization behavior of a mixed salt solution as a function of changing climatic conditions (i.e., relative humidity and temperature), excluding factors such as the internal pore structure, the thermodynamic model ECOS/RUNSALT is the only freeware available that requires simple input and includes the most relevant ions for heritage buildings and solids. We suggest the use of specific terminology and describe how to use the model and how to interpret the output, with emphasis on key limitations for which solutions are provided. When used correctly, the model output can be trusted, specifically when it is used to inform preventive conservation (e.g., environmental conditions in which salt crystallization cycles should not occur). However, salt mixture kinetics and the internal pore structure remain crucial parameters that are not considered in the model. These aspects need further attention to develop a better understanding and correctly model salt damage in relation to climatic changes.

1. Introduction

Salt deterioration is a common issue when dealing with the conservation of porous materials in built heritage [1,2,3,4,5,6]. However, understanding salt behavior is a complex subject due to the presence of a wide variety of ions [7], which are often the result of groundwater infiltration by capillary rising damp, rainwater infiltration, and atmospheric, biological, or internal material contamination. Over time, these result in an accumulation of salts in the first few millimeters or centimeters of a material’s drying front. Damage to the material occurs when salts fill a porous material and crystallization cycles are provoked by changing environmental conditions. The individual mixture composition found in the material determines the crystallization behavior of each possible solid that can occur, as described by Price and Brimblecombe [8] in the context of porous materials. This behavior is further influenced by a wide range of internal and external factors of the salt-bearing porous material and salt solution properties, such as supersaturation, viscosity, pore characteristics, inner pore processes [9,10,11,12,13,14,15], and ambient environment. The sheer scope of all the parameters involved limits our current understanding of the real-world processes that underpin the damage potential of salts over time. However, the outcomes of specific scientific projects contribute to the understanding of complex salt behavior, as described in Price (Ed.) [16]. This has resulted in a thermodynamic model, Environmental Control of Salts (ECOS), used to determine the environmental conditions needed to reduce salt damage in porous materials. Based on the ECOS model, Bionda [17] developed RUNSALT, which is a graphical user interface (GUI) that takes care of the data pre-/postprocessing and the visualization of outputs. The freeware and published work [18,19,20,21,22,23,24,25,26,27,28,29,30,31] of the first use cases can be found on the RUNSALT website [32].
Since its development, the model has been used extensively to aid management decisions for the preservation of built heritage worldwide. Although a limited amount of literature is available [33,34,35,36,37,38,39,40,41,42,43,44,45,46,47,48,49,50], it is important to note that its use is mostly undocumented in peer-reviewed literature; for example, in Belgium the software has been used for over 300 heritage sites [51]. Like any model, ECOS and RUNSALT have limitations and pitfalls, with ineffective or non-existent transfer from research to practice, a challenge faced more widely in heritage science, as recently explored by Richards and Brimblecombe [52]. Some of these limitations are linked to data processing and issues with the input parameters and outputs. Several of the limitations are reported on and addressed in this paper with the aim to advance the conservation field when considered or adjusted in future versions of the software. Additionally, when dealing with salt crystallization, an ambiguous use of terminology and discrepancies can be found in the literature; thus, specific terminology and abbreviations are suggested for salt mixtures.

2. Models and Theory

When dealing with salt mixtures, there are several models available that output, amongst others, specific saturation, crystallization, dissolution, and transition relative humidity points, that allow a deeper understanding of the mixture behavior under changing climatic conditions. However, most programs or models are designed for specific purposes, such as atmospheric, industrial (brines) or (sea) water chemistry, e.g., FREEZCHEM [53], E-AIM [54,55], and [56,57,58,59,60,61]. Since these programs and models have been developed primarily to address specific applications, they exclude relevant ions and data for salts typically found in building materials [7]. The computer program PHREEQC [62] and the ECOS/RUNSALT model [16,17] are the most cited in literature for this purpose. PHREEQC includes a variety of options and incorporations of ions, such as those described by, e.g., Benavente et al. [63] and Pérez-Diez et al. [64]. However, an important limitation in the aqueous model is the lack of internal consistency in the databases [62]. PHREEQC has a limited pre-installed dataset of solids and non-validated parameters, which the user needs to update. Moreover, experimental data are often lacking or contain inconsistencies in the literature [65]; it is thus a complicated and tedious task to complete the datasets and derive reliable results, particularly for systems containing nitrate. However, the program has potential in stone conservation, as it permits the implementation of, e.g., kinetics and in-pore situations.
ECOS/RUNSALT is currently the only model with simple inputs that include the most relevant salt phases found in the built environment, and can handle more complex systems when compared to PHREEQC. ECOS (Environmental Control of Salts) is a chemical equilibrium model initially developed on the molality-based thermodynamic approach of the ion interaction model of Pitzer [66]. There, the solubilities of the included mineral phases, as well as the water vapor–salt solution equilibrium, are considered. It is based on a molality-dependent expression for excess Gibbs energy which includes empirically determined interaction parameters and, by its minimization, allows the iterative determination of the activity and osmotic coefficient. While the latter coefficient is related to the water activity of the electrolyte solution, the activity coefficient corrects for the non-ideal behavior of ions in the solution. During the development of ECOS, it turned out that the parameterization of the model was well suited for the calculation of solubilities in mixed electrolyte solutions in the desired range, but in combination with the algorithm used for the calculation of the amounts of crystallized salts and solution, partly incorrect results were obtained. Especially in cases of high concentrations, the algorithm based on the original Pitzer molality-based model passed unrealistic conditions in ranges where the model was already invalid. It was possible to overcome this hurdle by using equations in terms of mole fractions [55,67,68,69], which was implemented in Fortran [70]. Having equivalent principles to the molality-based model, the mole fraction one, generally known as the Pitzer–Simonson–Clegg model, includes ion concentrations expressed as mole fractions [71]. Nevertheless, the original molality-based approach was later improved, as described by Steiger et al. [72], and should be considered as a valid alternative. In either case, it must be noted that ECOS always considers equilibrium conditions, neglecting kinetic aspects. Thus, certain metastable pathways are possible, and salt damage is linked to the kinetically driven supersaturation of the salt solution.
To further understand the ECOS calculations, we refer to the literature, e.g., [16,73,74,75,76,77,78], including data related to activity coefficients and (solubility) phase diagrams (solution concentration as molality (number of moles of dissolved salt per kilogram water) (m(salt)/mol·kg−1), volume (V), relative humidity (RH), or water activity (aw) over temperature (T)). Phase diagrams are best suited for binary or ternary systems to illustrate the crystallization pathways at given concentrations. However, the graphical representation of quaternary or higher systems becomes more complicated. If all data from such phase diagrams should be derived, x-y-z plots are required with, for example, x as RH, y as the number of moles of crystalline salt (n) or volume (V), and z as temperature (T). Such a plot is, in principle, the same as a combination of RUNSALT plots derived from calculations at different T or RH and presented with three axes, as shown by Menéndez [33].
Equilibrium conditions also mean that at each RH, ECOS considers an equilibration with the surroundings. In reality, RH changes are generally faster where non-equilibrium dynamic RH changes occur, so there are larger gradients between the vapor pressure of the solution and the surrounding air influencing evaporation.
When looking at phase diagrams in the context of ions found in building materials, at least senary or septenary systems should be considered that include the most important ions (CO32−, Cl, NO3, SO42−, Na+, K+, Mg2+, and Ca2+) while excluding less common ions such as fluoride, phosphate, oxalate, ammonium, acetate, or formate, as previously described [79,80]. Since the least soluble salts will rapidly crystallize from a mixed salt system, carbonates and gypsum can be excluded in most cases. Thus, a senary system of more soluble salts will remain, including Cl, NO3, Na+, K+, and Mg2+ with either SO42− or Ca2+, as further described in [7], which is implemented in ECOS.

3. Terminology for Mixed Salt Systems and Methodology for Using RUNSALT

Understanding salt mixture behavior in porous media under changing climatic conditions is not a straightforward task and requires in-depth knowledge of the mixture composition and material characteristics, as well as internal and external factors. A first step, however, is knowing the correct salt mixture present, which requires data input preparation for the model, as described further in Steiger and Heritage [79] and recently verified by applying the method to a large dataset including several additional steps in Godts et al. [7].
Before moving forward with the methodology for using RUNSALT, Table 1 is given to overcome the ambiguous use of terminology found in the literature and to clarify the crystallization pathways of mixed salt systems shown in RUNSALT plots (see example Figure 1). Specific RH points of interest are linked to the suggested symbols presented in the table, and the letters A to F are further detailed in the legend of Figure 1. Note how RH points of interest overlap depending on how a plot is read from a humid to a dry environment or vice versa. The term mutual (m) is chosen as the behavior of each solid is influenced by the mixture composition, and m is removed when dealing with single salts. The symbols are recommended for future use to make scientific information comparable.
The reactions presented in the RUNSALT plot shown in Figure 1 are further detailed in Table 2.
Legend by Figure 1, with the letters A to F indicating specific RH points of interest:
A.
The first mutual crystallization relative humidity of the mixture ( R H cry 1 m ) represents the RH at which crystallization initiates for the first solid that appears under drying conditions (aphthitalite here, and thus R H cry aph m ). The solution is saturated with respect to aphthitalite, and above this RH all solids are dissolved.
B.
The mutual crystallization relative humidity of all the following solids that crystallize from the solution in the mixture, and thus is the RH at which crystallization first begins for R H cry hal m ,   R H cry nit m   and   R H cry dar m .
C.
The mutual dissolution relative humidity of all solids in the mixture when solution becomes available is equal to the RH points when a crystal starts to dissolve for R H dis aph m ,   R H dis hal m ,   R H dis nit m   and   R H dis dar m . B and C are often at the same RH; here, the resolution of the plot distorts the position for halite and niter, a phenomenon explained further on.
D.
The mutual deliquescence relative humidity of the mixture is the RH determined by the solids in the mixture at which the first dissolution starts to occur and solution becomes available; here, R H del dar m also equals the dissolution relative humidity of R H dis aph m ,   R H dis hal m   and   R H dis nit m .
E.
The mutual transition relative humidity R H tra [ dar / aph ] - [ nit / the ] m . Here, under drying conditions, thenardite is formed and the amount of niter increases from the decomposition of darapskite and aphthitalite in a solid-state reaction.
F.
Plot stacking artifact caused by transition reactions, herein identified by chloride that is not available in other solids.
As described in the previous section, the ions used for the model input are Cl, NO3, Na+, K+, and Mg2+, with either SO42− or Ca2+. This excludes, amongst others, carbonates and the equimolar contents of calcium and sulfate, with the latter considered as the gypsum content. Hence, the model primarily calculates a maximum of six ions. The system composition is entered into the RUNSALT interface as mol or weight, with the selection of either a RH range between 15% and 98%, or a T range between −30 and +50 °C, after which either the T or RH value is fixed. The RUNSALT interface generates a temporary .DAT file that includes the inputs required by the model. These inputs are read in by the batch executable .EXE file which then initiates the model. In another temporary file, ECOS outputs the equilibrium composition at 50 equally spaced intervals for either the specific temperature or humidity range, and is then read by RUNSALT to produce a graphical representation of the crystallization behavior. The output can be exported in graphical and textual (.CSV) formats for further analysis through RUNSALT.
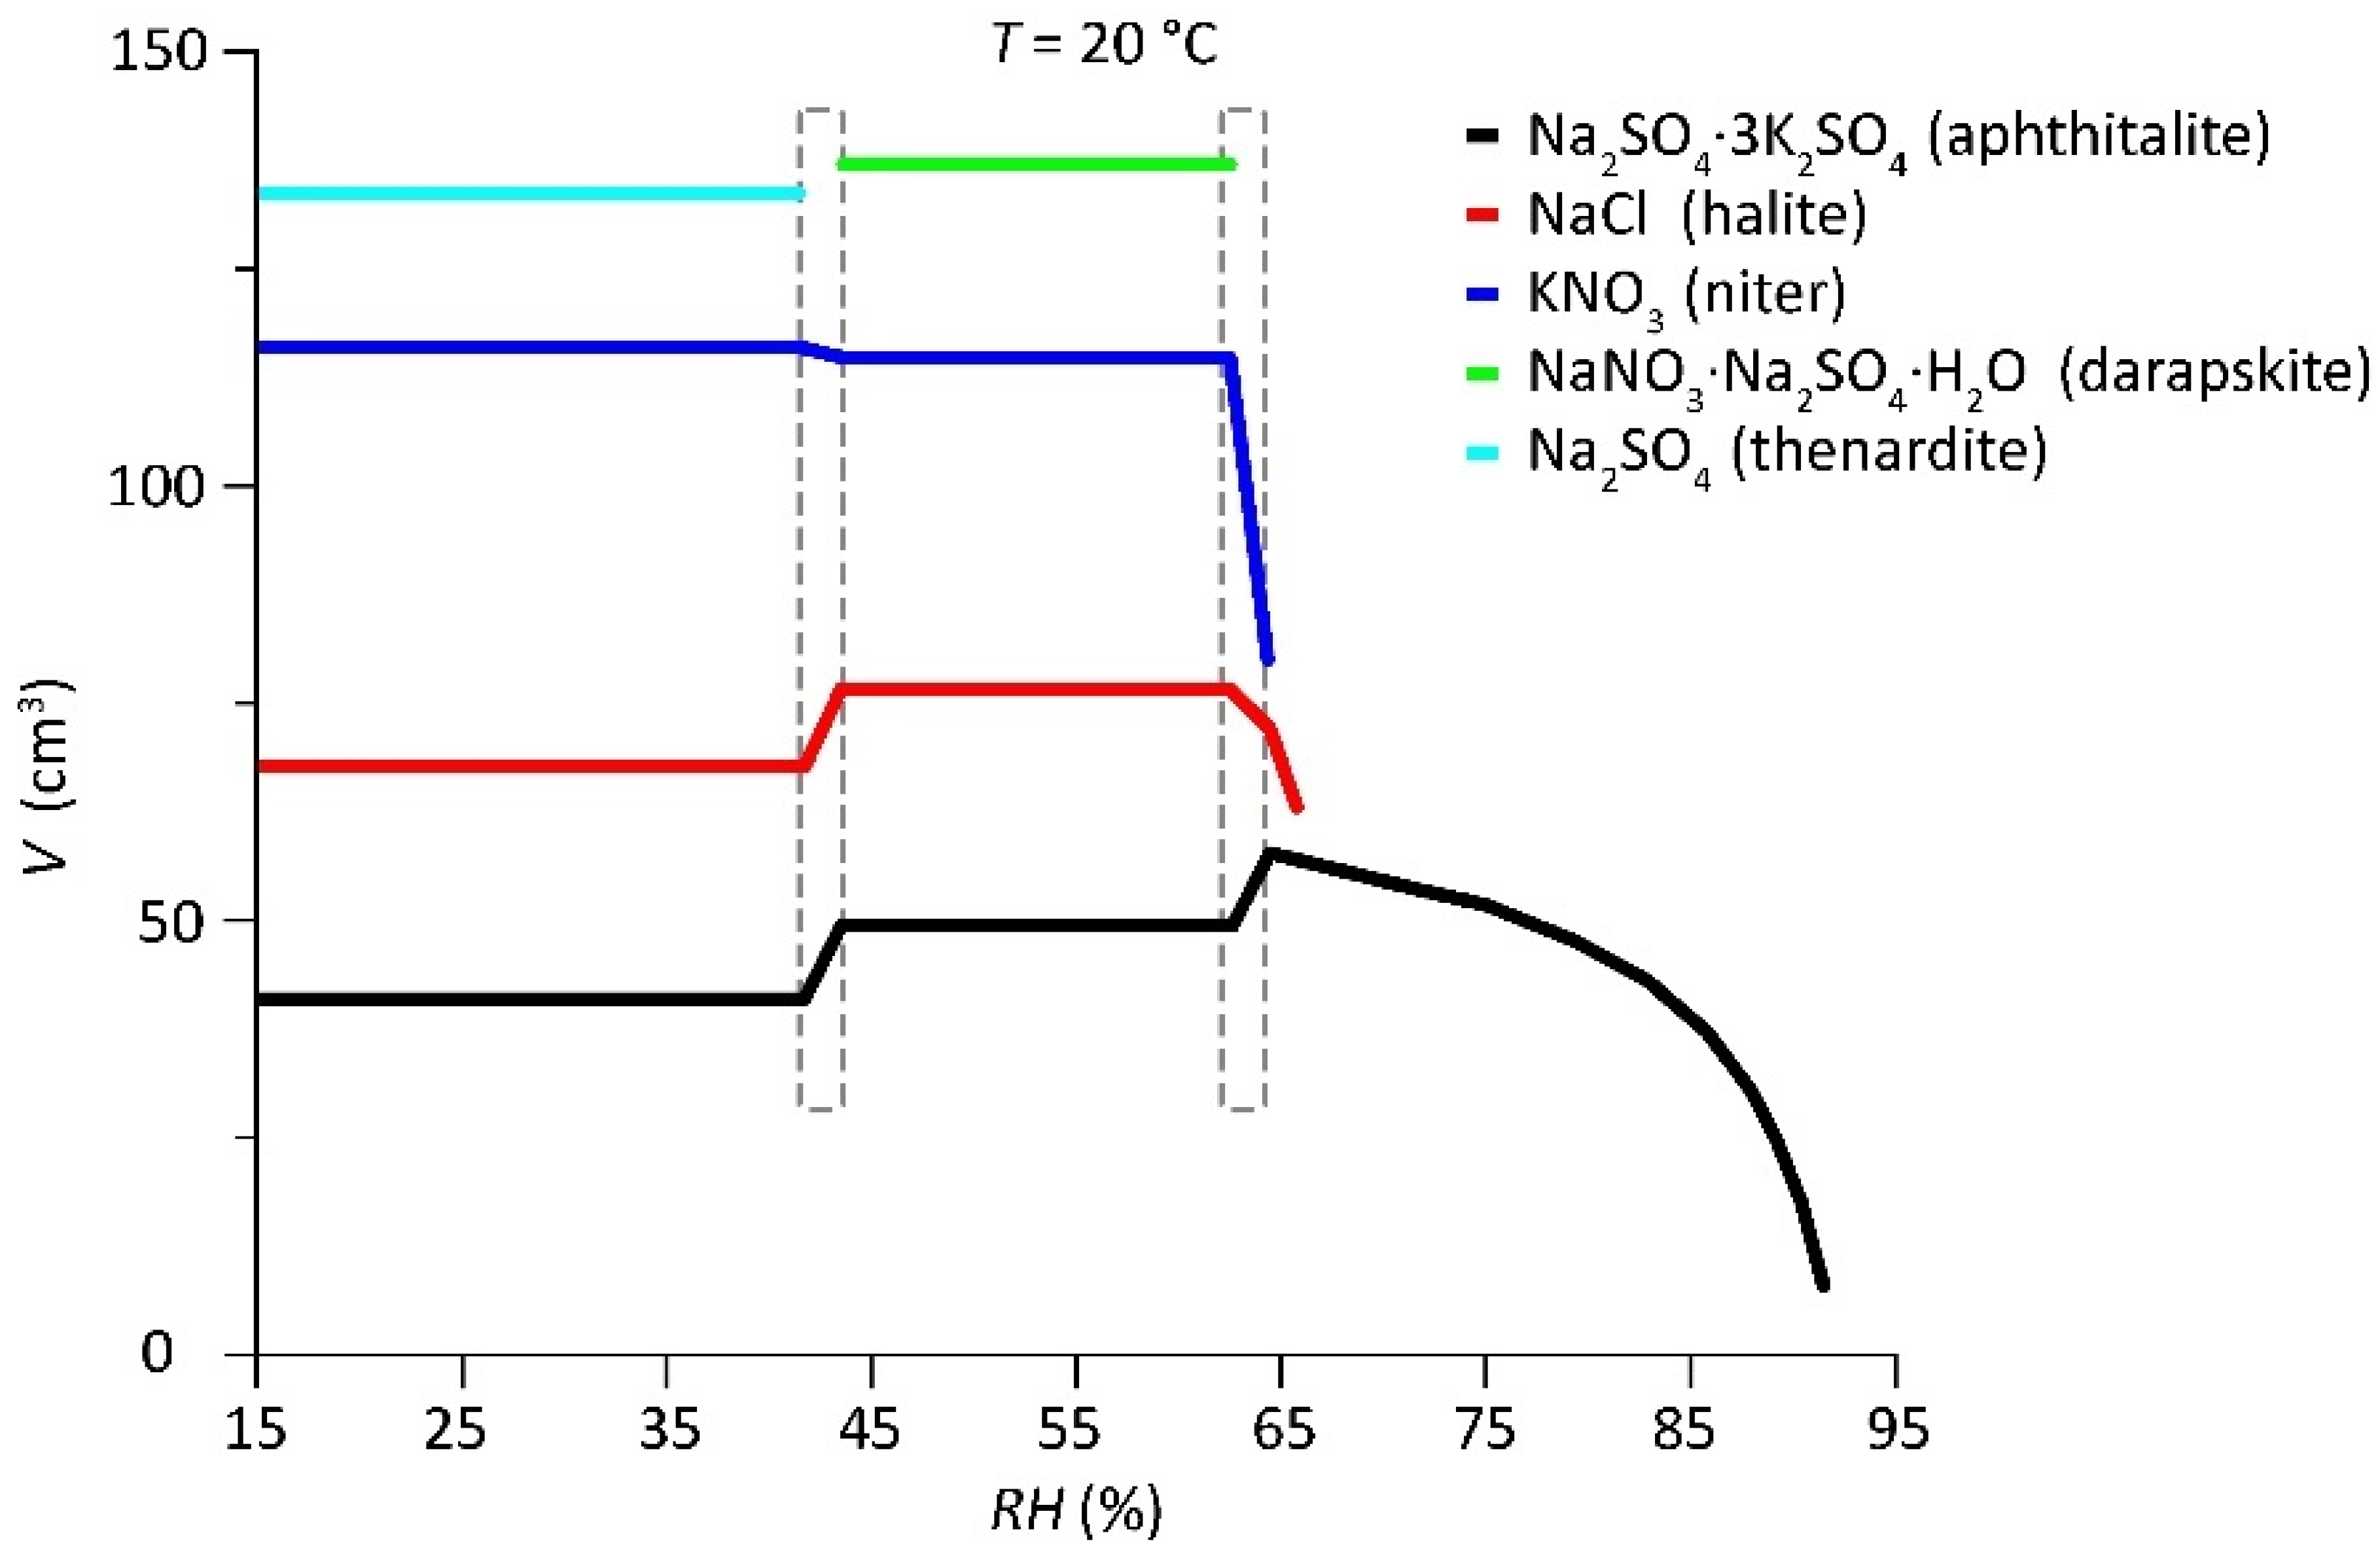
The crystallization behavior of the mixture is graphically represented by RUNSALT with the specified relative humidity (RH) or temperature (T) range on the x-axis, while the y-axis returns the amount of substance (mol) (Figure 1). After the plot is generated, one can choose to show the y-axis as volume (V) in cm3 (molar volume of salt, that is, equilibrium crystal volume) (Figure 2), which gives a more realistic visualization of the salt content in the pores. For example, aphthitalite is present in approximately one tenth of the total mol content (Figure 1), and at least a third of the total solid volume (Figure 2). The latter is thus more indicative of risk in the pore structure and will determine the overall interpretation and conservation advice. The use of volume in the outputs was recently illustrated in relation to climatic conditions by Costa et al. [81]. Expressing the results as volume is additionally useful to estimate pore filling, as the molar volume (Vm) can be used as an input value in the calculation, as described in Gulotta et al. [82]. All values on the y-axis are cumulative (stacked), meaning that the amount of the first solid should be deducted from the second to know the absolute value of each individual solid. The individual amount of salt is illustrated for halite (NaCl) at the given RH with the arrow in Figure 1.
As the data points are systematically calculated for 50 points within the chosen range of environmental parameters (RH or T), the smaller the range the higher the resolution. Hence, data related to smaller successive intervals can be stitched together to obtain a more detailed output. However, changes in stacking order in the detailed plots can occur at higher resolution. This process can be an important step to correct certain artifacts caused by the resolution of the chosen environmental parameters. For example, in Figure 3, if the RH range between 60 and 70% is entered into RUNSALT, the resolution of the plot increases to 0.2% RH, as opposed to 1.6% RH when generating a plot from 15 to 95% RH (Figure 1). Thus, the thermodynamically calculated mutual relative humidity points of interest, for example, R H cry nit m and R H cry hal m , are more accurate. The plot also shows that R H cry dar m or R H del dar m is equal to R H dis nit m , R H dis hal m , and R H tra [ aph ] - [ hal / nit / dar ] m . The resolution makes little to no difference to the final conservation advice given to the field in terms of the risk assessment of RH ranges of crystallization/dissolution. However, selecting a narrower range in the environmental parameters can clarify certain artifacts and uncertainties in the plot. In particular, the slightly non-vertical lines of aphthitalite, halite, and niter are caused by the resolution 0.2% RH, and these lines are in fact to be read as vertical (location shown by the dashed rectangles in Figure 2 and Figure 3). The same is true for the gap (transition R H tra   [ dar / aph ] - [ nit / the ] m ) and all non-vertical lines at lower RH at approximately 43% (shown in Figure 2).
When reading the complete RUNSALT plot, we can start looking at the x-axis from a more humid environment on the far right (95% RH) to a dry environment on the far left (15% RH). Under more humid conditions, and before the first line appears, all salts are in solution. The solution has a certain concentration corresponding to the given RH; the further away from the first solid, the more the solution is diluted, which is theoretically infinite until pure water is reached at 100% RH. Just before the RH at which the first solid crystallizes (for example, in Figure 1, aphthitalite (Na2SO4∙3K2SO4)), the solution is at its highest degree of saturation. The solution is saturated and in equilibrium with the environment, and is referred to as mutual saturation relative humidity ( R H sat m ). In a mixture, this can be defined at any RH point where curved lines are visible in the RUNSALT outputs. The lines indicate the crystallization of a solid. Looking further at Figure 1, aphthitalite starts to crystallize at approximately 92% (20 °C); this point is the mutual crystallization relative humidity of the solution ( R H cry m ). Following the crystallization of aphthitalite to dryer conditions, the remaining ions are still in solution and become more concentrated until halite starts to crystallize, followed by niter and darapskite. Each solid has a crystallization relative humidity ( R H cry m ) of 67, 66, and 64% (±0.1), respectively. Similar to aphthitalite, for both halite and niter, the solid amount increases over a RH range, while all darapskite crystallizes at a specific RH point, as shown in Figure 3. This RH of 64% is also the point at which no more solution is available. This is the mutual deliquescence relative humidity ( R H del m ) of the mixture.
Looking further down the remaining crystallization pathway at dryer conditions below R H cry dar m (= R H del m of the mixture), while keeping in mind that no solution is available, the following solid-state reactions can be observed. First, a small amount of aphthitalite decomposes at the same RH as R H cry dar m , and from 64% to 43% RH all solids remain crystallized. For this mixture, the RH of 64% is the most important to avoid crystallization cycles and damage to porous materials. In practice, it would be common to advise a stable RH between 50% and 60% RH at 20 °C; that is, if all water sources are eliminated, other artifacts in the area remain well preserved under these conditions, the mixture compositions are representative for the entire salt risk assessment, and the location allows such a narrow range of RH to be maintained. However, some flexibility should be considered, specifically toward the lower RH range as the solid-state reactions might have limited effect on the substrates. Additionally, an RH increase over a limited time should be acceptable due to the kinetics considering dissolution/crystallization rates [43]. However, more research is needed to further understand these processes.
As shown in Table 2, the formation of thenardite is the result of the decomposition of aphthitalite and darapskite, which also explains the increase in niter at the same RH of approximately 43%. The decrease in halite at the same RH is an artifact of plot stacking (amount of substance or volume) on the y-axis. This can be derived from the fact that no other salt is formed with Cl. In drier conditions (below 43%), all salts remain crystallized.
Looking back at higher RH in the figures, it is important to understand that, for example, aphthitalite in the system will only start to dissolve if all other salts have gone into solution and the solution has reached the specific dilution above 64% RH. Specifically, the dissolution of aphthitalite is dependent on the concentration of the surrounding solution. The solution will accumulate moisture, which can cause discoloration, moisture stains, the peeling of paint layers, and attract biological growth. At R H cry aph m of 92%, the solution is saturated with respect to aphthitalite. Above this RH point, the solution becomes further diluted (until infinity at 100%). The amount of water vapor absorbed by the solution at a given RH can be calculated with ECOS; however, the data are currently not given in RUNSALT. Details on the backend calculations of the model are extensively described in Price et al. [16].
The above example shows the value of the model to derive specific advice for environmental salt risk assessment. The model has proven extremely valuable for the field and certain aspects have been verified with four ion mixtures by Rörig-Dalgaard [83]; however, several limitations and issues should be taken into consideration before application. In the following, the most common limitations and solutions are provided, while we abstain from considering deviations in the crystallization pathways if a solid becomes isolated from the remaining solution.

4. ECOS/RUNSALT Limitations and Solutions

Comparable to any model, ECOS/RUNSALT has limitations and pitfalls. An important obstacle in the calculations is caused when there are extremely high concentrations or supersaturation in hygroscopic mixtures, including calcium nitrate and calcium chloride, resulting in water activities higher than expected from thermodynamics. This obstacle was overcome by the incorporation of certain assumptions and non-verified solids, such as MgCa(NO3)4∙10H2O, which rarely appears in the outputs. However, it is as yet unclear whether extreme hygroscopic solids crystallize in these conditions.
Concerning the input data, an issue occurs with the autobalance option in RUNSALT. When using theoretical charge input data with integer numbers (e.g., 1Cl and 1Na+), the autobalance works correctly. However, with experimental output of ion analyses, values with several decimal places are common and the autobalance only corrects the chloride content, rendering the output incorrect. It is thus recommended to abstain from using the ‘autobalance’ feature and consider the use of charge balance calculations as described in [7], including the downloadable calculation sheet and R script (.R and .xlsx) at [51]. Furthermore, an error message can occur due to rounding issues produced by the thermodynamic calculations, which is caused by the number of decimals of each ion value entered. This can be resolved by changing the place values of all ions equally to ones, tens, hundreds, or thousands, depending on the initial concentration; although the total amount on the y-axis (mol or volume) varies, the output remains identical.
In certain cases, an error message appears when either entering the full RH range from 15 to 98% as input in the environmental parameters, or under certain temperatures, depending on the mixture composition. Both errors are easily overcome by limiting the RH to 95% or increasing or decreasing the temperature by one to five degrees. In either case, the results obtained from the model for the limitations of output values are considered more than sufficient. Another issue in the environmental parameters is the possibility to use values below 0 °C, although the formation of ice is not incorporated in the outputs. It is thus advised not to use a temperature input values below 0 °C in RUNSALT.
Moving forward to complications specifically related to single salts in the ECOS calculations and RUNSALT outputs, inconsistencies are seen with more recent studies related to Ca(NO3)2, K2SO4, and MgSO4 hydrates [84]. The critical RH values calculated by the ECOS of Ca(NO3)2, K2SO4, and MgSO4 are presented in the RUNSALT output in Figure 4 and Figure 5, respectively. The crystallization behaviors of Ca2+ and NO3 show two critical RH values (Figure 4, left), the first at 51.82% for tetrahydrate (nitrocalcite) and the second at 37.98% for anhydrous calcium nitrate (at 20 °C RH resolution = 0.02%; resolution not represented in the figure). However, it is known that dehydration of the tetrahydrate only occurs over extended periods of time and at extreme low RH with transition values between the anhydrous di-, tri-, and tetrahydrate at 8.3%, 12.4%, and 20.5%, respectively [75]. Thus, considering that the dehydration of nitrocalcite is kinetically hindered, one can expect that the crystallization RH of the tetrahydrate is the only one to be considered, keeping in mind that more research is needed to understand the in-pore effects under realistic climatic conditions.
The RUNSALT outputs of K+ and SO42− (calculated at 20 °C) show two critical RH values (Figure 4, right) with a relative humidity crystallization of potassium sulfate monohydrate starting at 97.7%, followed by dehydration to form arcanite at 89.7%. However, as detailed further by Archer and Kirklin [85], it has been found in several studies that the monohydrate phase does not occur below 9 °C, and if stable at all this is less probable at higher temperatures. Furthermore, the RHcry should decrease with decreasing temperature; currently, the outputs show the opposite at lower temperatures, with a decreasing amount of the monohydrate (not illustrated). Thus, caution should be taken when looking at the critical RH values of potassium sulfate. Here, at 20 °C, K2SO4 is likely to start at 97.7% and the monohydrate can be ignored.
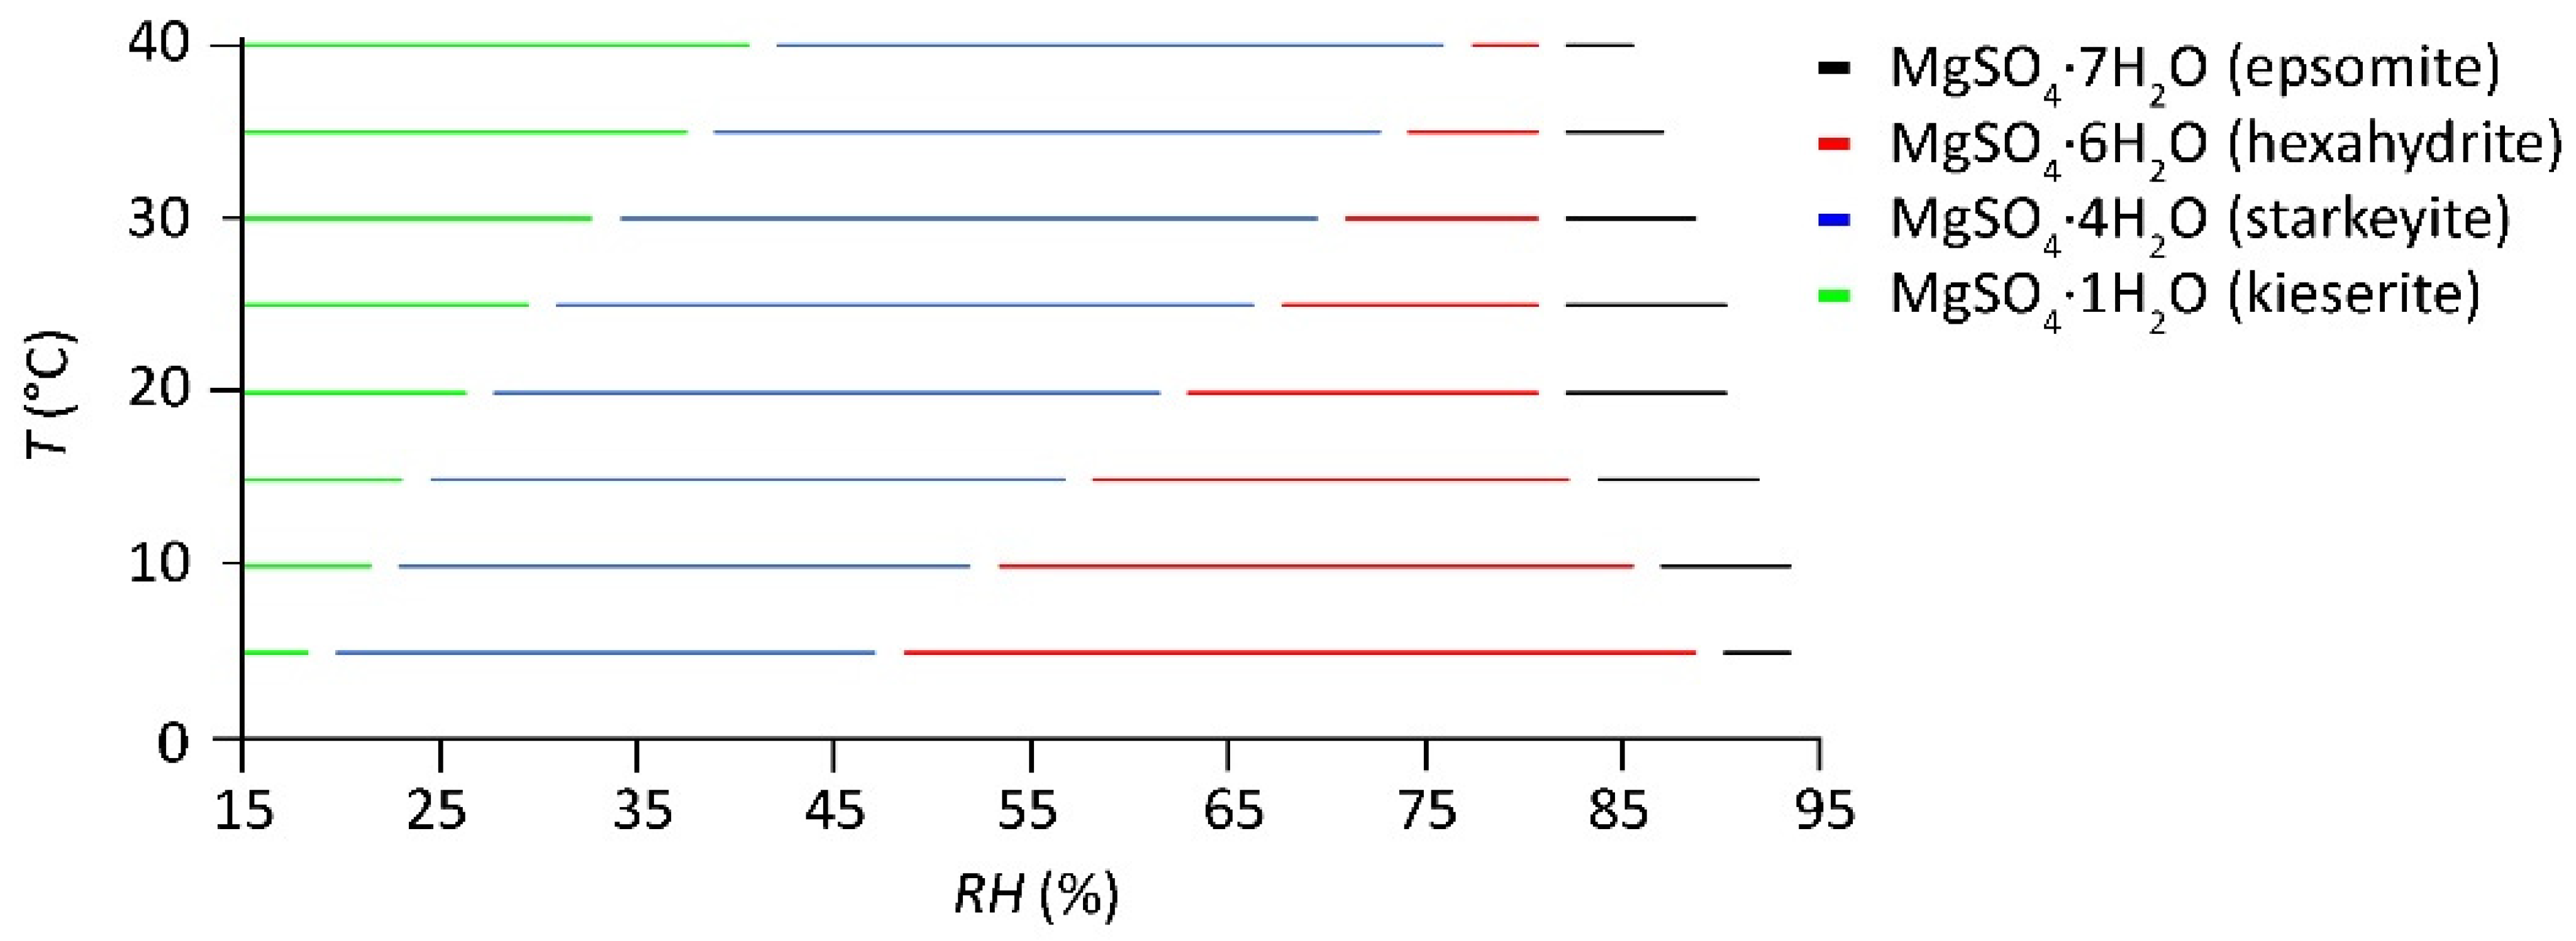
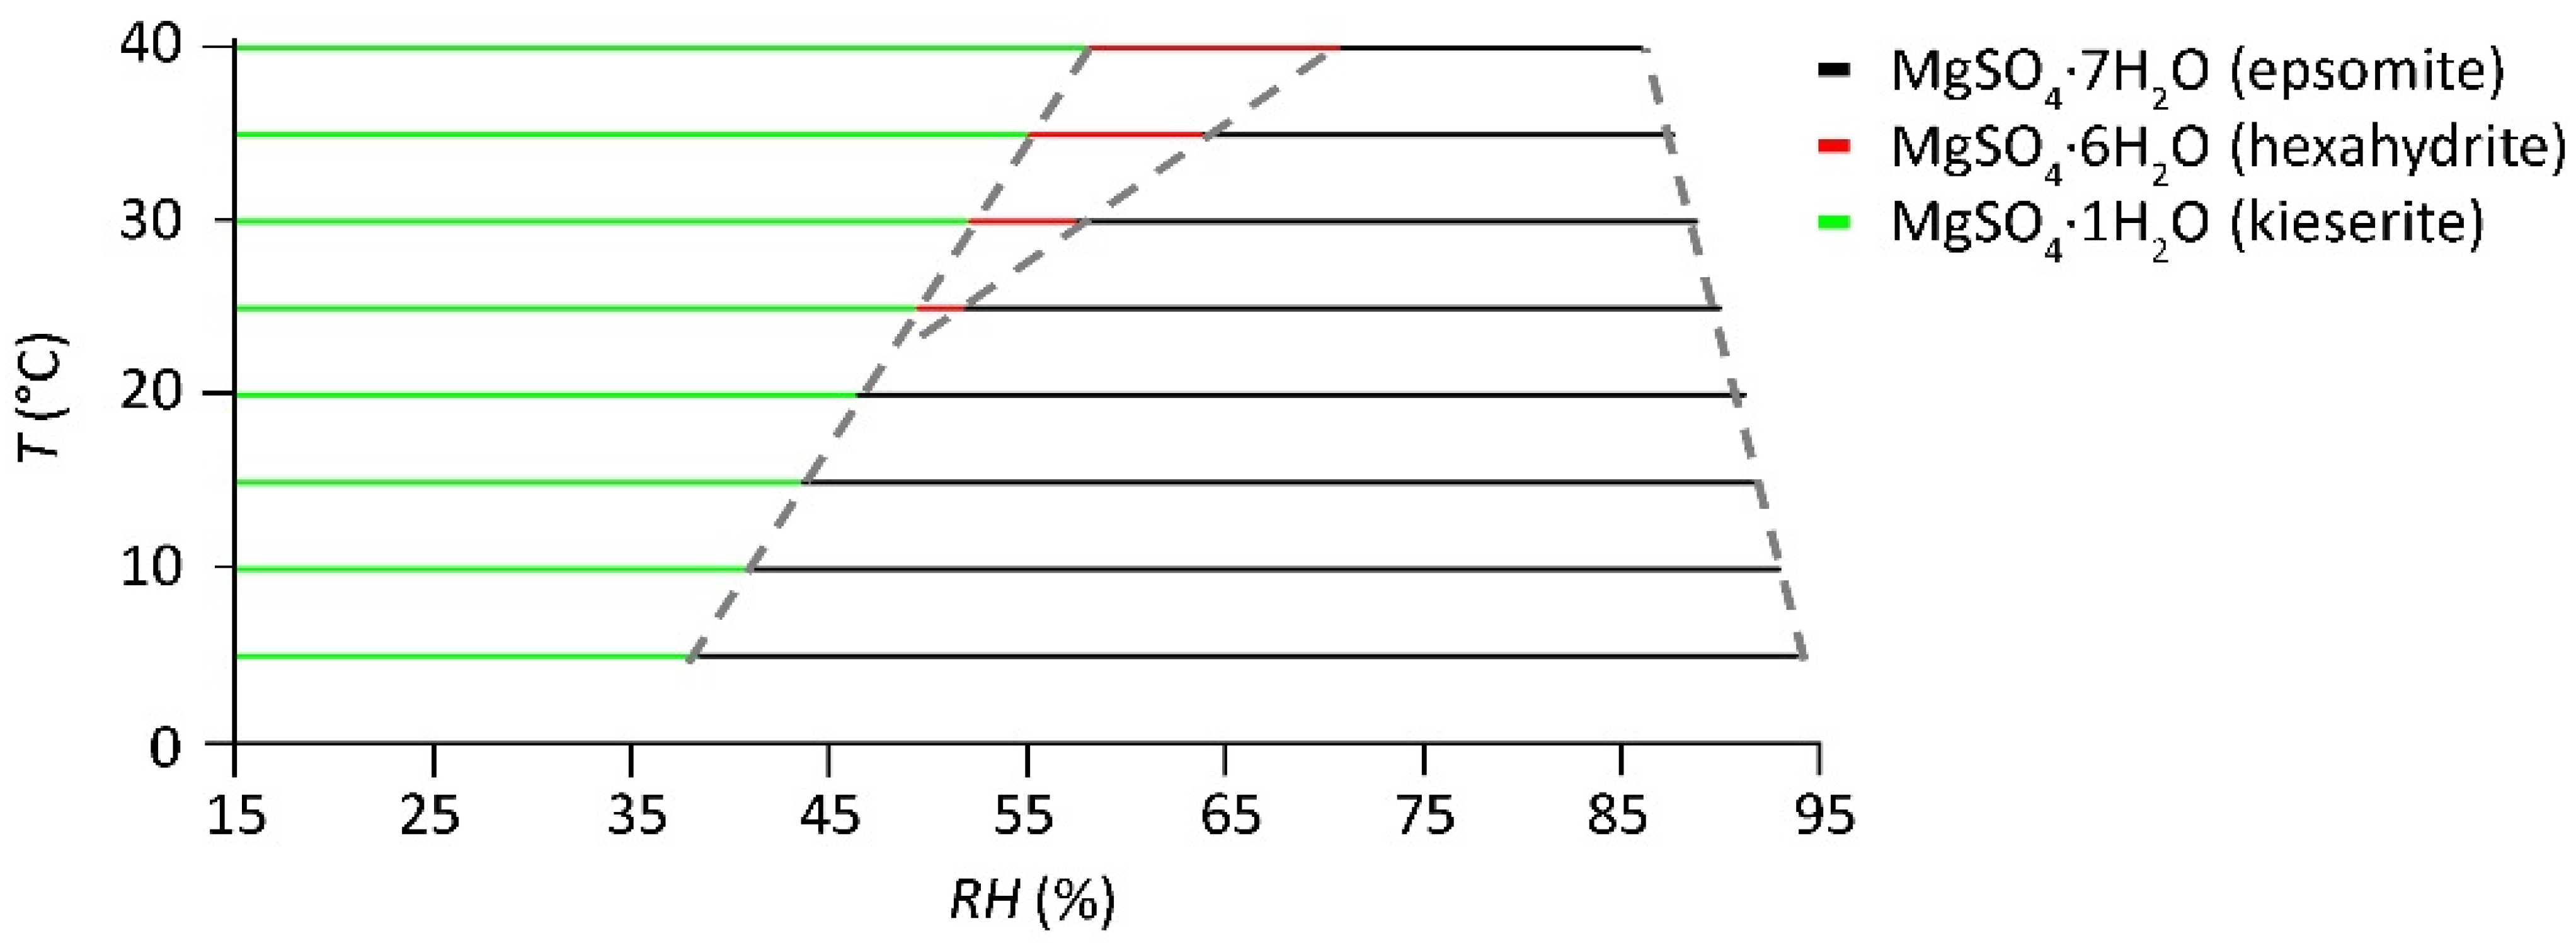
For magnesium sulfate (Figure 5), four critical RH values are shown at 20 °C, starting with the crystallization relative humidity, R H cry eps at 91.54% for MgSO4∙7H2O (epsomite), followed by the transition to MgSO4∙6H2O (hexahydrite), R H tra [ eps - hex ] at 81.94%, and to MgSO4∙4H2O (starkeyite) and MgSO4∙1H2O (kieserite), with R H tra [ hex - sta ] and R H tra [ sta - kie ] at 62.3% and 27.16%, respectively. However, from experimental results and improved thermodynamic calculations (see [72,84]), important deviations specifically concerning starkeyite are derived. The data show that the values used in ECOS for this phase are inaccurate and no change in the mixtures from one to the other hydrate should be taken into consideration within the range of 5–40 °C. The original data from the ECOS/RUNSALT outputs are shown in Figure 5, while the corrected data are given in Figure 6. Here, at 20 °C, the RHdel of MgSO4∙7H2O (epsomite) is 91.2% RH with a transition to MgSO4∙1H2O (kieserite) at 46.6% RH; the hexahydrate only occurs at higher temperatures. The latter figure illustrates how ECOS/RUNSALT outputs with a wide RH range calculated in a variety of temperatures will correspond to the phase diagram, following the transition between kieserite, hexahydrite, and epsomite, and the RHdel at different temperatures. In addition to the described issues that should be considered in the model outputs, it remains important to understand that certain phases can be metastable and kinetically hindered, as further described for magnesium sulfates in Steiger et al. [84].
Several solids are missing in ECOS/RUNSALT, although they can play a role in the crystallization pathways and deterioration processes, such as Ca-K-NO3 double salts [86]. The efflorescence found on monuments [80,87,88,89,90,91,92,93] reveals salts that are currently not available or not consistently incorporated in the model outputs, for example, humberstonite (Na7K3Mg2(SO4)6(NO3)2∙6H2O). Moreover, the removal of equimolar contents of calcium and sulfate (gypsum) can alter the RUNSALT outputs, including double salts such as glauberite (Na2Ca(SO4)2), gorgeyite (K2Ca5(SO4)6∙H2O), and syngenite (K2Ca(SO4)2∙H2O). However, the formation of the latter three might be kinetically hindered or occur as solid-state reactions over longer periods of time.
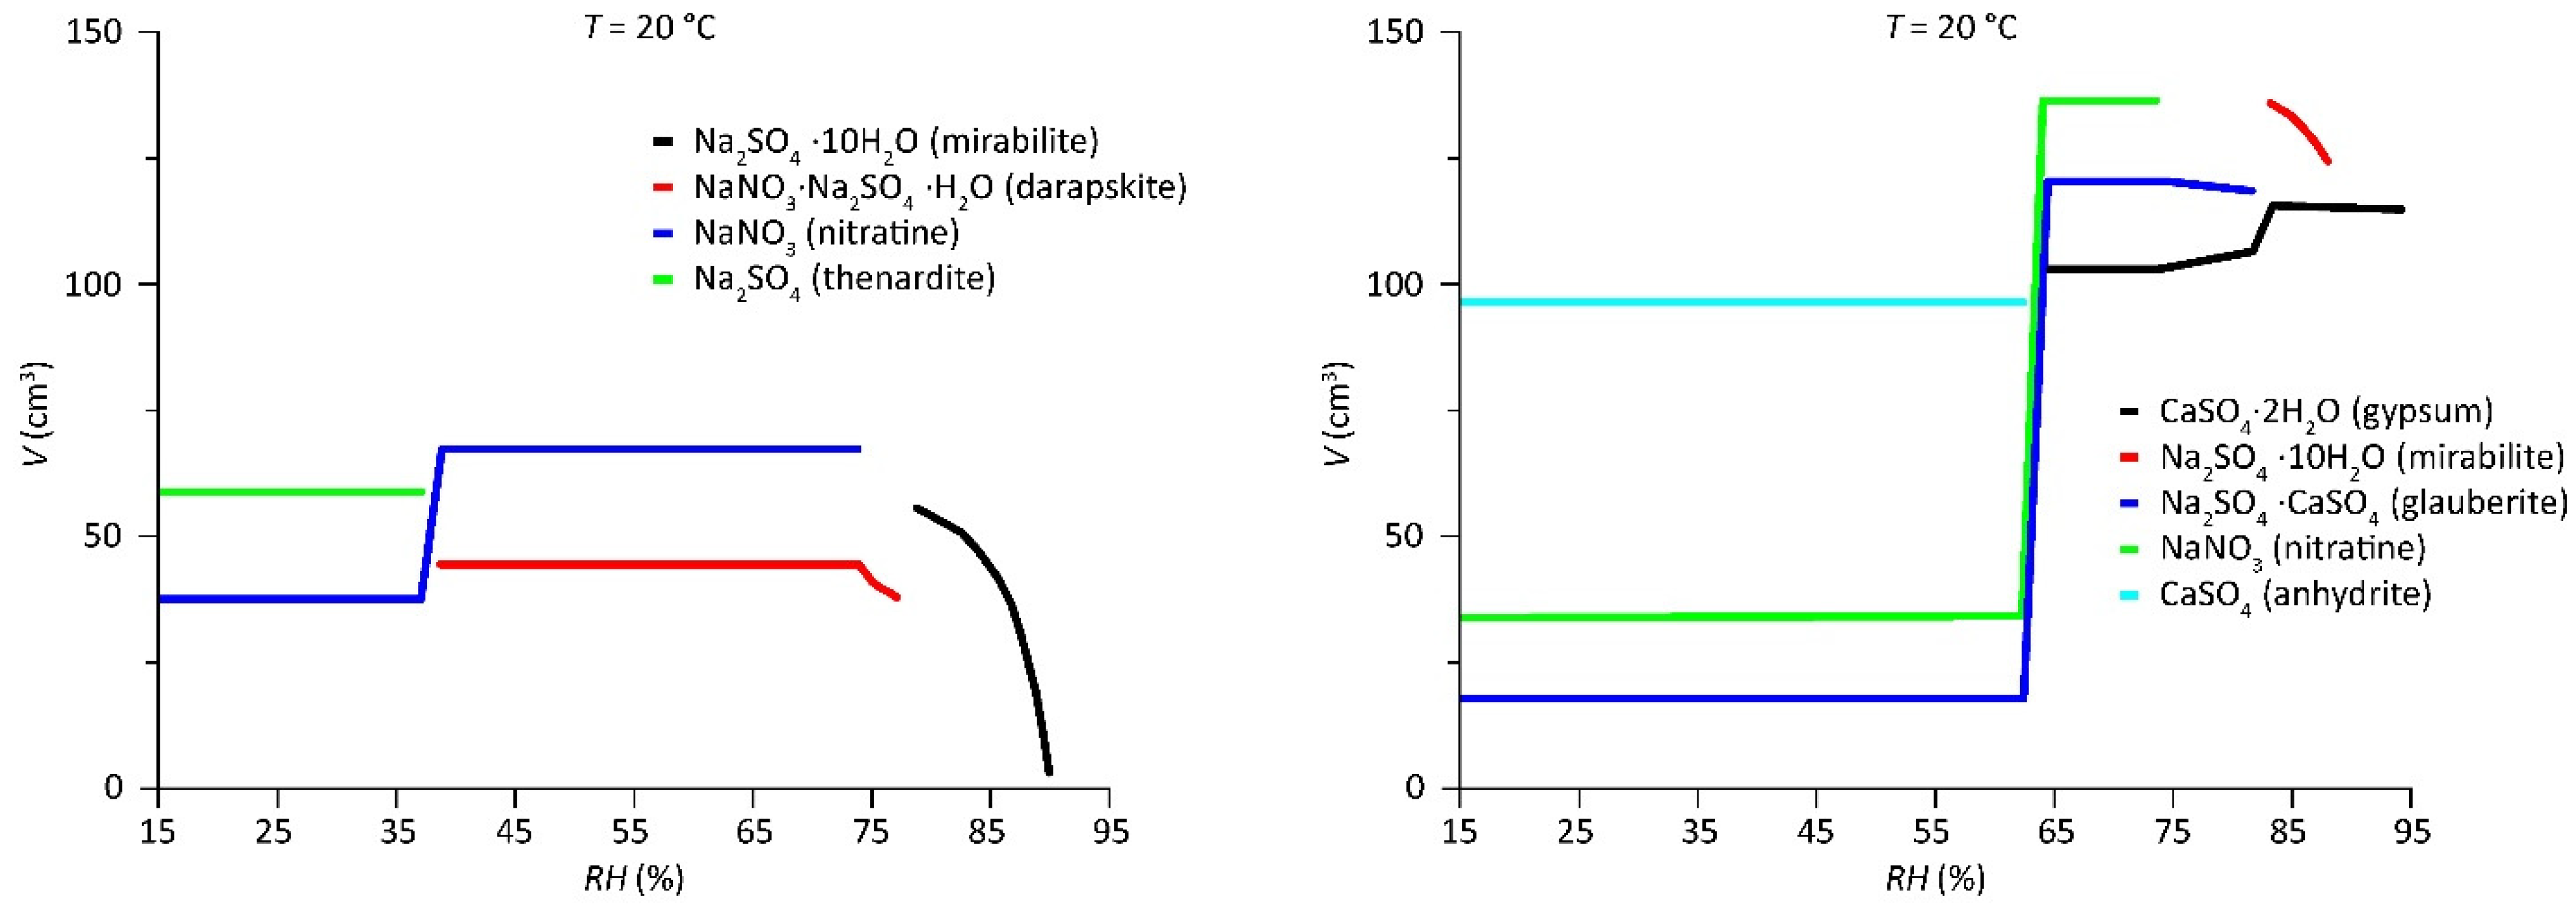
As detailed in [35], the model is not capable of systematically integrating the presence of an equimolar amount of calcium and sulfate ions. In rare cases, when the model allows calculations with calcium and sulfate, the crystallization pathway can change. In these cases, it is often observed that the common salt darapskite (NaNO3∙Na2SO4∙H2O) is replaced by glauberite (Na2SO4∙CaSO4), as illustrated in Figure 7. As mentioned earlier, several issues are visible in the plot on the right, such as the kinetically hindered solid-state phase change between gypsum and anhydrite. Additionally, due to the stacking of the solids and the RH resolution, the vertical lines for glauberite and nitratine should remain horizontal; thus, the latter is simply an artifact of the gap between the transition R H tra [ gyp - anh ] m . Further research is needed to understand the formation of double salts containing calcium and sulfate.
Furthermore, relevant carbonate salts such as thermonatrite (Na2CO3∙H2O), natron (Na2CO3∙10H2O), trona (Na3CO3HCO3∙2H2O), and kalicinite (KHCO3) are absent from the model outputs. However, these soluble carbonates are rare and only seen in approximately 2% of samples taken in Belgium heritage [7]. Other rare anions not included but contributing to the total charge balance and crystallization pathway are fluoride, phosphate, oxalate, acetate, ammonium, and formate [79].

5. Discussion and Conclusions

ECOS/RUNSALT is currently the only model that includes the most relevant salt phases found in built heritage. We provide an overview to further the understanding of its use and suggest specific terminology for salt mixture behavior to simplify and clarify the model, and make scientific information comparable. Furthermore, as several limitations and pitfalls exist when using the model, possible incorrect interpretations of the derived outputs can occur. However, when the presented issues and solutions are taken into consideration, the RUNSALT outputs can be considered highly accurate. The most important issues described concern calcium nitrate, potassium sulfate, and magnesium sulfate phases (hydrates), and the possible influence of calcium sulfate on the formation of different solids under specific conditions.
It also remains important to examine the variety of factors that can cause deviations from the modeled crystallization behavior. Some of these factors include the in-pore situation, the material characteristics, impurities in the system, and salt kinetics. The latter is specifically relevant to environmental conditions, the separation of solids from the solution, gradients in solution concentrations, kinetically hindered salt crystallization, and rates of crystallization/dissolution, including long-term solid-state reactions. In any case, if a specific range of RH is considered safe when interpreting RUNSALT outputs, meaning salt crystallization/transition cycles are less likely to occur in the specific environment, the model outputs can be trusted, keeping in mind that different crystallization pathways are possible when certain salts are separated from the solution. Overall, more research is needed considering salt mixture kinetics in the pore system. An important aspect to focus on is the rate at which phase transitions occur, as this can guide conservation scientists towards a better prediction of salt damage in relation to climatic changes over time. Thereby, updates of the current model and wider accessibility of the source codes are important for the future.

Author Contributions

S.G., M.S., S.A.O. and A.S.: Conceptualization, Methodology, Validation, Investigation; S.G.: Data curation, Writing—original draft, Visualization, Funding acquisition; M.S., S.A.O., A.S., J.D., H.D.C., V.C. and T.D.K.: Writing—review and editing. All authors have read and agreed to the published version of the manuscript.

Funding

This research is funded by the Belgium Science Policy (Belspo) within the framework of BRAIN-be 2.0, Belgian Research Action through Interdisciplinary Networks: project B2/191/P1/PREDICT (Research action B2); joint PhD project PREDICT, Phase Transitions of Salts under Changing Climatic Conditions.

Conflicts of Interest

The authors declare no conflict of interest.

References

  1. Evans, I.S. Salt Crystallization and Rock Weathering: A Review. Rev. Geomorphol. Dyn. 1970, 19, 153–177. [Google Scholar]
  2. Goudie, A.; Viles, H. Salt Weathering Hazards; John Wiley & Sons: Chichester, UK, 1997; ISBN 0-471-95842-5. [Google Scholar]
  3. Doehne, E. Salt Weathering: A Selective Review. Geol. Soc. Spec. Publ. 2002, 205, 51–64. [Google Scholar] [CrossRef]
  4. Doehne, E.; Price, C.A. Stone Conservation: An Overview of Current Research, 2nd ed.; Research in Conservation; Getty Conservation Institute: Los Angeles, CA, USA, 2010; ISBN 978-1-60606-046-9. [Google Scholar]
  5. Snethlage, R.; Sterflinger, K. Stone Conservation. In Stone in Architecture; Siegesmund, S., Snethlage, R., Eds.; Springer Berlin Heidelberg: Berlin/Heidelberg, Germany, 2011; pp. 411–544. ISBN 978-3-642-14474-5. [Google Scholar]
  6. Oguchi, C.T.; Yu, S. A Review of Theoretical Salt Weathering Studies for Stone Heritage. Prog. Earth Planet. Sci. 2021, 8, 1–23. [Google Scholar] [CrossRef]
  7. Godts, S.; Steiger, M.; Orr, S.A.; De Kock, T.; Desarnaud, J.; De Clercq, H.; Cnudde, V. Charge Balance Calculations for Mixed Salt Systems Applied to a Large Dataset from the Built Environment. Sci. Data 2022, 9, 324. [Google Scholar] [CrossRef]
  8. Price, C.; Brimblecombe, P. Preventing Salt Damage in Porous Materials. Stud. Conserv. 1994, 39, 90–93. [Google Scholar] [CrossRef]
  9. Espinosa, R.M.; Franke, L.; Deckelmann, G. Model for the Mechanical Stress Due to the Salt Crystallization in Porous Materials. Constr. Build. Mater. 2008, 22, 1350–1367. [Google Scholar] [CrossRef]
  10. Espinosa, R.M.; Franke, L.; Deckelmann, G. Phase Changes of Salts in Porous Materials: Crystallization, Hydration and Deliquescence. Constr. Build. Mater. 2008, 22, 1758–1773. [Google Scholar] [CrossRef]
  11. Naillon, A.; Joseph, P.; Prat, M. Ion Transport and Precipitation Kinetics as Key Aspects of Stress Generation on Pore Walls Induced by Salt Crystallization. Phys. Rev. Lett. 2018, 120, 034502. [Google Scholar] [CrossRef] [Green Version]
  12. Li, L.; Kohler, F.; Dziadkowiec, J.; Røyne, A.; Espinosa Marzal, R.M.; Bresme, F.; Jettestuen, E.; Dysthe, D.K. Limits to Crystallization Pressure. Langmuir 2022, 38, 11265–11273. [Google Scholar] [CrossRef]
  13. Espinosa-Marzal, R.M.; Scherer, G.W. Advances in Understanding Damage by Salt Crystallization. Acc. Chem. Res. 2010, 43, 897–905. [Google Scholar] [CrossRef]
  14. Flatt, R.; Aly Mohamed, N.; Caruso, F.; Derluyn, H.; Desarnaud, J.; Lubelli, B.; Espinosa Marzal, R.M.; Pel, L.; Rodriguez-Navarro, C.; Scherer, G.W.; et al. Predicting Salt Damage in Practice: A Theoretical Insight into Laboratory Tests. RILEM Tech. Lett. 2017, 2, 108–118. [Google Scholar] [CrossRef]
  15. Espinosa-Marzal, R.M.; Scherer, G.W. Impact of In-Pore Salt Crystallization on Transport Properties. Environ. Earth Sci. 2013, 69, 2657–2669. [Google Scholar] [CrossRef] [Green Version]
  16. Price, C. An Expert Chemical Model for Determining the Environmental Conditions Needed to Prevent Salt Damage in Porous Materials: Protection and Conservation of the European Cultural Heritage; Project ENV4-CT95-0135 (1996–2000) Final Report; Protection and conservation of the European Cultural Heritage; Archetype: London, UK, 2000; ISBN 978-1-873132-52-4. [Google Scholar]
  17. Bionda, D. RUNSALT—A Graphical User Interface to the ECOS Thermodynamic Model for the Prediction of the Behaviour of Salt Mixtures under Changing Climate Conditions (2005). Available online: Http://Science.Sdf-Eu.Org/Runsalt/ (accessed on 9 October 2022).
  18. Bionda, D.; Storemyr, P. Modelling the Behaviour of Salts Mixtures in Walls: A Case Study from Tenaille von Fersen Building, Suomenlinna, Finland. In Proceedings of the Study of Salt Deterioration Mechanisms. Decay of Brick Walls Influenced by Interior Climate Changes; von Konow, T., Ed.; Suomenlinnan Hoitokunta: Suomenlinna, Finland, 2002; pp. 95–101. [Google Scholar]
  19. Bionda, D. Methodology for the Preventive Conservation of Sensitive Monuments: Microclimate and Salt Activity in a Church. In Proceedings of the 10th International Congress on Deterioration and Conservation of Stone, Stockholm, Sweden, 27 June–2 July 2004; Kwiatkowski, D., Löfvendahl, R., Eds.; ICOMOS Sweden: Stockholm, Sweden, 2004; pp. 627–634. [Google Scholar]
  20. Klenz Larsen, P. The Salt Decay of Medieval Bricks at a Vault in Brarup Church, Denmark. Environ. Geol. 2007, 52, 375–383. [Google Scholar] [CrossRef]
  21. Prokos, P. Equilibrium Conditions of Marine Originated Salt Mixtures: An ECOS Application at the Archaeological Site of Delos, Greece. In Proceedings of the SWBSS, Salt Weathering of Buildings and Stone Sculptures, Copenhagen, Denmark, 22–24 October 2008; Ottosen, L.M., Ed.; Technical University of Denmark: Lyngby, Denmark, 2008. [Google Scholar]
  22. Eklund, S. Stone Weathering in the Monastic Building Complex on Mountain of St Aaron in Petra, Jordan; University of Helsinki: Helsinki, Jordan, 2008. [Google Scholar]
  23. Franzen, C.; Mirwald, P.W. Moisture Sorption Behaviour of Salt Mixtures in Porous Stone. Geochemistry 2009, 69, 91–98. [Google Scholar] [CrossRef]
  24. Maguregui, M.; Sarmiento, A.; Martínez-Arkarazo, I.; Angulo, M.; Castro, K.; Arana, G.; Etxebarria, N.; Madariaga, J.M. Analytical Diagnosis Methodology to Evaluate Nitrate Impact on Historical Building Materials. Anal. Bioanal. Chem. 2008, 391, 1361–1370. [Google Scholar] [CrossRef] [PubMed]
  25. Maguregui, M.; Knuutinen, U.; Castro, K.; Madariaga, J.M. Raman Spectroscopy as a Tool to Diagnose the Impact and Conservation State of Pompeian Second and Fourth Style Wall Paintings Exposed to Diverse Environments (House of Marcus Lucretius). J. Raman Spectrosc. 2010, 41, 1400–1409. [Google Scholar] [CrossRef]
  26. Price, C.A. Predicting Environmental Conditions to Minimise Salt Damage at the Tower of London: A Comparison of Two Approaches. Environ. Geol. 2007, 52, 369–374. [Google Scholar] [CrossRef]
  27. Sawdy, A.; Heritage, A. Evaluating the Influence of Mixture Composition on the Kinetics of Salt Damage in Wall Paintings Using Time Lapse Video Imaging with Direct Data Annotation. Environ. Geol. 2007, 52, 303–315. [Google Scholar] [CrossRef]
  28. Sawdy, A.; Price, C. Salt Damage at Cleeve Abbey, England. J. Cult. Herit. 2005, 6, 125–135. [Google Scholar] [CrossRef]
  29. Steiger, M. Modellierung von Phasengleichgewichten. In Proceedings of the DBU Workshops im Februar 2008 in Osnabrück, Salzschäden an Kulturgütern Stand des Wissens und Forschungsdefizite; Schwarz, H.-J., Steiger, M., Eds.; Deutsche Bundesstiftung Umwelt: Hannover, Germany, 2009; pp. 80–99. [Google Scholar]
  30. Zehnder, K.; Schoch, O. Efflorescence of Mirabilite, Epsomite and Gypsum Traced by Automated Monitoring on-Site. J. Cult. Herit. 2009, 10, 319–330. [Google Scholar] [CrossRef]
  31. Sawdy, A. The Kinetics of Salt Weathering of Porous Materials; Institute of Archaeology University College London: London, UK, 2001. [Google Scholar]
  32. Bionda, D. RUNSALT. Available online: http://science.sdf-eu.org/runsalt/ (accessed on 6 January 2022).
  33. Menéndez, B. Estimation of Salt Mixture Damage on Built Cultural Heritage from Environmental Conditions Using ECOS-RUNSALT Model. J. Cult. Herit. 2017, 24, 22–30. [Google Scholar] [CrossRef]
  34. Scatigno, C.; Prieto-Taboada, N.; Festa, G.; Madariaga, J.M. Soluble Salts Quantitative Characterization and Thermodynamic Modeling on Roman Bricks to Assess the Origin of Their Formation. Molecules 2021, 26, 2866. [Google Scholar] [CrossRef] [PubMed]
  35. Godts, S.; Hayen, R.; De Clercq, H. Investigating Salt Decay of Stone Materials Related to the Environment, a Case Study in the St. James Church in Liège, Belgium. Stud. Conserv. 2017, 62, 329–342. [Google Scholar] [CrossRef]
  36. Gómez-Laserna, O.; Cardiano, P.; Diez-Garcia, M.; Prieto-Taboada, N.; Kortazar, L.; Olazabal, M.Á.; Madariaga, J.M. Multi-Analytical Methodology to Diagnose the Environmental Impact Suffered by Building Materials in Coastal Areas. Environ. Sci. Pollut. Res. 2018, 25, 4371–4386. [Google Scholar] [CrossRef]
  37. Gibeaux, S.; Thomachot-Schneider, C.; Eyssautier-Chuine, S.; Marin, B.; Vazquez, P. Simulation of Acid Weathering on Natural and Artificial Building Stones According to the Current Atmospheric SO2/NOx Rate. Environ. Earth Sci. 2018, 77, 327. [Google Scholar] [CrossRef]
  38. Heinrichs, K.; Azzam, R. Quantitative Analysis of Salt Crystallization–Dissolution Processes on Rock-Cut Monuments in Petra/Jordan. In Engineering Geology for Society and Territory—Volume 8; Lollino, G., Giordan, D., Marunteanu, C., Christaras, B., Yoshinori, I., Margottini, C., Eds.; Springer International Publishing: Cham, Sweden, 2015; pp. 507–510. ISBN 978-3-319-09407-6. [Google Scholar]
  39. Crevals, V.; Godts, S.; Desarnaud, J. Salt Problems and Climate Control in the Case of the Church of Sint Aldegondis in Mespelare, Belgium, an ECOS/Runsalt Approach. In Proceedings of the Fifth International Conference on Salt Weathering of Buildings and Stone Sculptures, Delft, The Netherlands, 22–24 September 2021; Lubelli, B., Kamat, A.A., Quist, W.J., Eds.; TU Delft Open: Delft, The Netherlands, 2021; pp. 13–20. [Google Scholar]
  40. Godts, S.; Hayen, R.; Clercq, H.D. Common Salt Mixtures Database: A Tool to Identify Research Needs. In Proceedings of the 3rd International Conference on Salt Weathering of Buildings and Stone Sculptures, Brussels, Belgium, 14–16 October 2014; KIK-IRPA: Brussels, Belgium, 2014; p. 14. [Google Scholar]
  41. Godts, S.; Hayen, R. Onderzoek en preventie van vocht- en zoutschade gerelateerd aan het klimaat in de crypte van de Sint-Baafskathedraal te Gent. In Proceedings of the WTA-PRECOM3OS Studiedag: Preventieve Conservatie: Van klimaat- en schademonitoring naar een geïntegreerde benadering, Leuven, Belgium, 5 April 2019; Verstynge, E., van Bommel, B., Vernimme, N., van Hees, R., Eds.; TUDelft—KULeuven: Leuven, Belgium, 2019. [Google Scholar]
  42. Godts, S.; Clercq, C.D. Analysis of the Salt Content during Water Bath Desalination of a Polychrome Limestone Relief. In Proceedings of the 14th International Congress on the Deterioration and Conservation of Stone, Monument Future: Decay and Conservation of Stone, Göttingen, Germany, 7–12 September 2020; Siegesmund, S., Middendorf, B., Eds.; Mitteldeutscher Verlag: Göttingen, Germany, 2020; pp. 853–858. [Google Scholar]
  43. Godts, S.; Orr, S.A.; Desarnaud, J.; Steiger, M.; Wilhelm, K.; De Clercq, H.; Cnudde, V.; De Kock, T. NaCl-Related Weathering of Stone: The Importance of Kinetics and Salt Mixtures in Environmental Risk Assessment. Herit. Sci. 2021, 9, 1–13. [Google Scholar] [CrossRef]
  44. Godts, S.; Clercq, H.D.; Hayen, R.; Roy, J.D. Risk Assessment and Conservation Strategy of a Salt Laden Limestone Mausoleum and the Surrounding Funeral Chapel in Boussu, Belgium. In Proceedings of the 12th International Congress on the Deterioration and Conservation of Stone, New York, NY, USA, 22–26 October 2012; Columbia University: New York, NY, USA, 2012. [Google Scholar]
  45. De Clercq, H.; Godts, S. Rehabilitation of Farmhouses and Barns: Limits of Salt Content. Appl. Phys. A 2016, 122, 831. [Google Scholar] [CrossRef]
  46. De Clercq, H.; Godts, S.; Hayen, R. Impact of the Indoor Climate on the Performance of Building Materials Contaminated with Salt Mixtures. Conserv. Manag. Archaeol. Sites 2014, 16, 39–55. [Google Scholar] [CrossRef]
  47. Menéndez, B. Estimators of the Impact of Climate Change in Salt Weathering of Cultural Heritage. Geosciences 2018, 8, 401. [Google Scholar] [CrossRef] [Green Version]
  48. Laue, S.; Poerschke, D.; Hübner, B. Investigation and Conservation of Salt Damaged Epitaphs in the Church of Werben (Saxony-Anhalt, Germany). SWBSS 2017 Fourth Int Conf Salt Weather Build Stone Sculpt. In Proceedings of the Fourth Int Conf salt Weather Build Stone Sculpt, Potsdam, Germany, 20–22 September 2017; Laue, S., Ed.; Verlag der Fachhochschule: Potsdam, Germany, 2017. [Google Scholar]
  49. Chabas, A.; Kloppmann, W.; Sizun, J.-P.; Wille, G.; Coman, A.; Petitmangin, A.; Nowak, S.; Martin, E.; Jurgens, M.-A. Sources and Chronology of Soluble Salt Formation in a Medieval Dovecote Caught up in Urbanization: A Resilience Story? Environ. Sci. Pollut. Res. 2022. preprint. [Google Scholar] [CrossRef]
  50. Pintér, F. The Combined Use of Ion Chromatography and Scanning Electron Microscopy to Assess Salt-Affected Mineral Materials in Cultural Heritage. J. Am. Inst. Conserv. 2022, 61, 85–99. [Google Scholar] [CrossRef]
  51. Godts, S.; Orr, S.A.; Steiger, M.; De Kock, T. Mixed Salt Systems in the Built Environment—Charge Balance Calculations [Data Set]. Available online: https://zenodo.org/record/6280617#.Y32dBX1BxPY (accessed on 22 September 2022).
  52. Richards, J.; Brimblecombe, P. The Transfer of Heritage Modelling from Research to Practice. Herit. Sci. 2022, 10. [Google Scholar] [CrossRef]
  53. Marion, G.M.; Mironenko, M.V.; Roberts, M.W. FREZCHEM: A Geochemical Model for Cold Aqueous Solutions. Comput. Geosci. 2010, 36, 10–15. [Google Scholar] [CrossRef]
  54. Wexler, A.S. Atmospheric Aerosol Models for Systems Including the Ions H+, NH4+, Na+, SO42−, NO3, Cl, Br, and H2O. J. Geophys. Res. 2002, 107, 4207. [Google Scholar] [CrossRef]
  55. Clegg, S.L.; Pitzer, K.S.; Brimbiecombet, P. Thermodynamics of Multicomponent, Miscible, Ionic Solutions. 2. Mixtures Includlng Unsymmetrical Electrolytes. J Phys Chem 1992, 96, 9470–9479. [Google Scholar] [CrossRef]
  56. Gruszkiewicz, M.S.; Palmer, D.A.; Springer, R.D.; Wang, P.; Anderko, A. Phase Behavior of Aqueous Na–K–Mg–Ca–Cl–NO3 Mixtures: Isopiestic Measurements and Thermodynamic Modeling. J. Solut. Chem. 2007, 36, 723–765. [Google Scholar] [CrossRef]
  57. Thomsen, K.; Rasmussen, P.; Gani, R. Correlation and Prediction of Thermal Properties and Phase Behaviour for a Class of Aqueous Electrolyte Systems. Chem. Eng. Sci. 1996, 51, 3675–3683. [Google Scholar] [CrossRef]
  58. Wang, P.; Anderko, A.; Young, R.D. A Speciation-Based Model for Mixed-Solvent Electrolyte Systems. Fluid Phase Equilibria 2002, 203, 141–176. [Google Scholar] [CrossRef]
  59. Wang, P.; Springer, R.D.; Anderko, A.; Young, R.D. Modeling Phase Equilibria and Speciation in Mixed-Solvent Electrolyte Systems. Fluid Phase Equilibria 2004, 222, 11–17. [Google Scholar] [CrossRef]
  60. Wang, P.; Anderko, A.; Springer, R.D.; Young, R.D. Modeling Phase Equilibria and Speciation in Mixed-Solvent Electrolyte Systems: II. Liquid–Liquid Equilibria and Properties of Associating Electrolyte Solutions. J. Mol. Liq. 2006, 125, 37–44. [Google Scholar] [CrossRef]
  61. Hingerl, F.F.; Wagner, T.; Kulik, D.A.; Kosakowski, G.; Driesner, T.; Institut, P.S.; Hingerl, F. Development of a New Activity Model for Complex Mixed-Salt Solutions from Ambient to Geothermal Conditions. In Proceedings of the Geophysical Research Abstracts, Vienna, Austria, 22–27 April 2012; Volume 14, p. 5332. [Google Scholar]
  62. Parkhurst, D.L.; Appelo, C.A.J. Description of Input and Examples for PHREEQC Version 3: A Computer Program for Speciation, Batch-Reaction, One-Dimensional Transport, and Inverse Geochemical Calculations; Techniques and Methods; U.S. Geological Survey: Reston, VA, USA, 2013; Volume 6-A43, p. 519. [Google Scholar]
  63. Benavente, D.; Brimblecombe, P.; Grossi, C.M. Thermodynamic Calculations for the Salt Crystallisation Damage in Porous Built Heritage Using PHREEQC. Environ. Earth Sci. 2015, 74, 2297–2313. [Google Scholar] [CrossRef]
  64. Pérez-Diez, S.; Fernández-Menéndez, L.J.; Morillas, H.; Martellone, A.; De Nigris, B.; Osanna, M.; Bordel, N.; Caruso, F.; Madariaga, J.M.; Maguregui, M. Elucidation of the Chemical Role of the Pyroclastic Materials on the State of Conservation of Mural Paintings from Pompeii. Angew. Chem. Int. Ed. 2021, 60, 3028–3036. [Google Scholar] [CrossRef] [PubMed]
  65. Marcilla, A.; Reyes-Labarta, J.A.; Olaya, M.M. Should We Trust All the Published LLE Correlation Parameters in Phase Equilibria? Necessity of Their Assessment Prior to Publication. Fluid Phase Equilibria 2017, 433, 243–252. [Google Scholar] [CrossRef] [Green Version]
  66. Pitzer, K.S. Ion Interaction Approach: Theory and Data Correlation. In Activity coefficients in electrolyte solutions; CRC Press: Boca Raton, FL, USA, 1991; pp. 75–153. [Google Scholar]
  67. Clegg, S.L.; Pitzer, K.S. Thermodynamics of Multicomponent, Miscible, Ionic Solutions: Generalized Equations for Symmetrical Electrolytes. J. Phys. Chem. 1992, 96, 3513–3520. [Google Scholar] [CrossRef]
  68. Pitzer, K.S.; Simonson, J.M. Thermodynamics of Multicomponent, Miscible, Ionic Systems: Theory and Equations. J. Phys. Chem. 1986, 90, 3005–3009. [Google Scholar] [CrossRef]
  69. Pitzer, K.S. The Treatment of Ionic Solutions over the Entire Miscibility Range. Berichte Bunsenges. Für Phys. Chem. 1981, 85, 952–959. [Google Scholar] [CrossRef] [Green Version]
  70. Clegg, S.L. Personal Communication about the ECOS/Runsalt Model and Backend Calculations; University of East Anglia: Norwich, UK, 2021. [Google Scholar]
  71. Clegg, S.L.; Brimblecombe, P. Pitzer Model of Electrolyte Solutions. In An Expert Chemical Model for Determining the Environmental Conditions Needed to Prevent Salt Damage in Porous Materials: Project ENV4-CT95-0135 (1996-2000) Final Report; Protection and conservation of the European Cultural Heritage; Price, C.A., Ed.; Archetype: London, UK, 2000; pp. 13–18. ISBN 978-1-873132-52-4. [Google Scholar]
  72. Steiger, M.; Kiekbusch, J.; Nicolai, A. An Improved Model Incorporating Pitzer’s Equations for Calculation of Thermodynamic Properties of Pore Solutions Implemented into an Efficient Program Code. Constr. Build. Mater. 2008, 22, 1841–1850. [Google Scholar] [CrossRef]
  73. Pitzer, K.S.; Mayorga, G. Thermodynamics of Electrolytes. III. Activity and Osmotic Coefficients for 2–2 Electrolytes. J. Solut. Chem. 1974, 3, 539–546. [Google Scholar] [CrossRef] [Green Version]
  74. Steiger, M.; Asmussen, S. Crystallization of Sodium Sulfate Phases in Porous Materials: The Phase Diagram Na2SO4–H2O and the Generation of Stress. Geochim. Cosmochim. Acta 2008, 72, 4291–4306. [Google Scholar] [CrossRef]
  75. Steiger, M. Salts in Porous Materials: Thermodynamics of Phase Transitions, Modeling and Preventive Conservation. Restor. Build. Monum. 2005, 11, 419–432. [Google Scholar] [CrossRef]
  76. Lindström, N.; Talreja, T.; Linnow, K.; Stahlbuhk, A.; Steiger, M. Crystallization Behavior of Na2SO4–MgSO4 Salt Mixtures in Sandstone and Comparison to Single Salt Behavior. Appl. Geochem. 2016, 69, 50–70. [Google Scholar] [CrossRef]
  77. Shen, Y.; Linnow, K.; Steiger, M. Crystallization Behavior and Damage Potential of Na2SO4–NaCl Mixtures in Porous Building Materials. Cryst. Growth Des. 2020, 20, 5974–5985. [Google Scholar] [CrossRef]
  78. Steiger, M.; Charola, A.E.; Sterflinger, K. Weathering and Deterioration. In Stone in Architecture; Siegesmund, S., Snethlage, R., Eds.; Springer Berlin Heidelberg: Berlin/Heidelberg, Germany, 2014; pp. 225–316. ISBN 978-3-642-45154-6. [Google Scholar]
  79. Steiger, M.; Heritage, A. Modelling the Crystallization Behaviour of Mixed Salt Systems: Input Data Requirements. In Proceedings of the 12th International Congress on the Deterioration and Conservation of Stone, New York, NY, USA, 22–26 October 2012. [Google Scholar]
  80. Arnold, A.; Zehnder, K. Monitoring Wall Paintings Affected by Soluble Salts; Cather, S., Ed.; The Courtauld Institute of Fine Art and The Getty Conservation Institute: London, UK, 1987; pp. 103–135. [Google Scholar]
  81. Costa, F.M.d.C.; Henriques Rosa, M.A.N.; Canetto, M.; Sobral da Fonseca, M.J. The Degradation of the “Study Room” (Convent of Christ, Tomar, Portugal), from a Preliminary Analysis towards a Sustainable Maintenance. Ge-conservacion 2022, 21, 95–107. [Google Scholar] [CrossRef]
  82. Gulotta, D.; Godts, S.; De Kock, T.; Steiger, M. Comparative Estimation of the Pore Filling of Single Salts in Natural Stone. In Proceedings of the Fifth International Conference on Salt Weathering of Buildings and Stone Sculptures, Delft, The Netherlands, 22–24 September 2021; Lubelli, B., Kamat, A.A., Quist, W.J., Eds.; TU Delft Open: Delft, The Netherlands, 2021. [Google Scholar]
  83. Rörig-Dalgaard, I. Direct Measurements of the Deliquescence Relative Humidity in Salt Mixtures Including the Contribution from Metastable Phases. ACS Omega 2021, 6, 16297–16306. [Google Scholar] [CrossRef] [PubMed]
  84. Steiger, M.; Linnow, K.; Ehrhardt, D.; Rohde, M. Decomposition Reactions of Magnesium Sulfate Hydrates and Phase Equilibria in the MgSO4–H2O and Na+–Mg2+–Cl–SO42−–H2O Systems with Implications for Mars. Geochim. Cosmochim. Acta 2011, 75, 3600–3626. [Google Scholar] [CrossRef]
  85. Archer, D.G.; Kirklin, D.R. Enthalpies of Solution of Sodium Chloride and Potassium Sulfate in Water. Thermodynamic Properties of the Potassium Sulfate + Water System. J. Chem. Eng. Data 2002, 47, 33–46. [Google Scholar] [CrossRef]
  86. Flatt, R.; Bocherens, P. Sur Le Système Ternaire Ca++_K+_NO3-_H2O. Helv Chim Acta 1962, 45, 187–195. [Google Scholar] [CrossRef]
  87. Siedel, H. Salt Efflorescence as Indicator for Sources of Damaging Salts on Historic Buildings and Monuments: A Statistical Approach. Environ. Earth Sci. 2018, 77, 572. [Google Scholar] [CrossRef]
  88. Morillas, H.; Maguregui, M.; Paris, C.; Bellot-Gurlet, L.; Colomban, P.; Madariaga, J.M. The Role of Marine Aerosol in the Formation of (Double) Sulfate/Nitrate Salts in Plasters. Microchem. J. 2015, 123, 148–157. [Google Scholar] [CrossRef] [Green Version]
  89. Benavente, D.; de Jongh, M.; Cañaveras, J.C. Weathering Processes and Mechanisms Caused by Capillary Waters and Pigeon Droppings on Porous Limestones. Minerals 2020, 11, 18. [Google Scholar] [CrossRef]
  90. Von Konow, T. Test Results. The Study of Salt Deterioration Mechanisms. Decay of Brick Walls Influenced by Interior Climate Changes; von Konow, T., Ed.; Suomenlinnan Hoitokunta: Helsinki, Finland, 2002. [Google Scholar]
  91. Charola, A.; Lewin, S. Efflorescence on Building Stones—SEM in the Characterization and Elucidation of the Mechanism of Formation. Scan Electron Microsc 1979, 79, 379–387. [Google Scholar]
  92. Arnold, A.; Küng, A. Crystallization and Habit of Salt Efflorescences on Walls I. In Proceedings of the 5th International Congress on Deterioration and Conservation of Stone, Lausanne, Switzerland, 25–27 September 1985; Félix, G., Ed.; Presses Romandes: Lausanne, Switzerland, 1985; pp. 255–267. [Google Scholar]
  93. Bionda, D. Modelling Indoor Climate and Salt Behaviour in Historical Buildings; Swiss Federal Institute of Technology: Zurich, Switzerland, 2006. [Google Scholar]
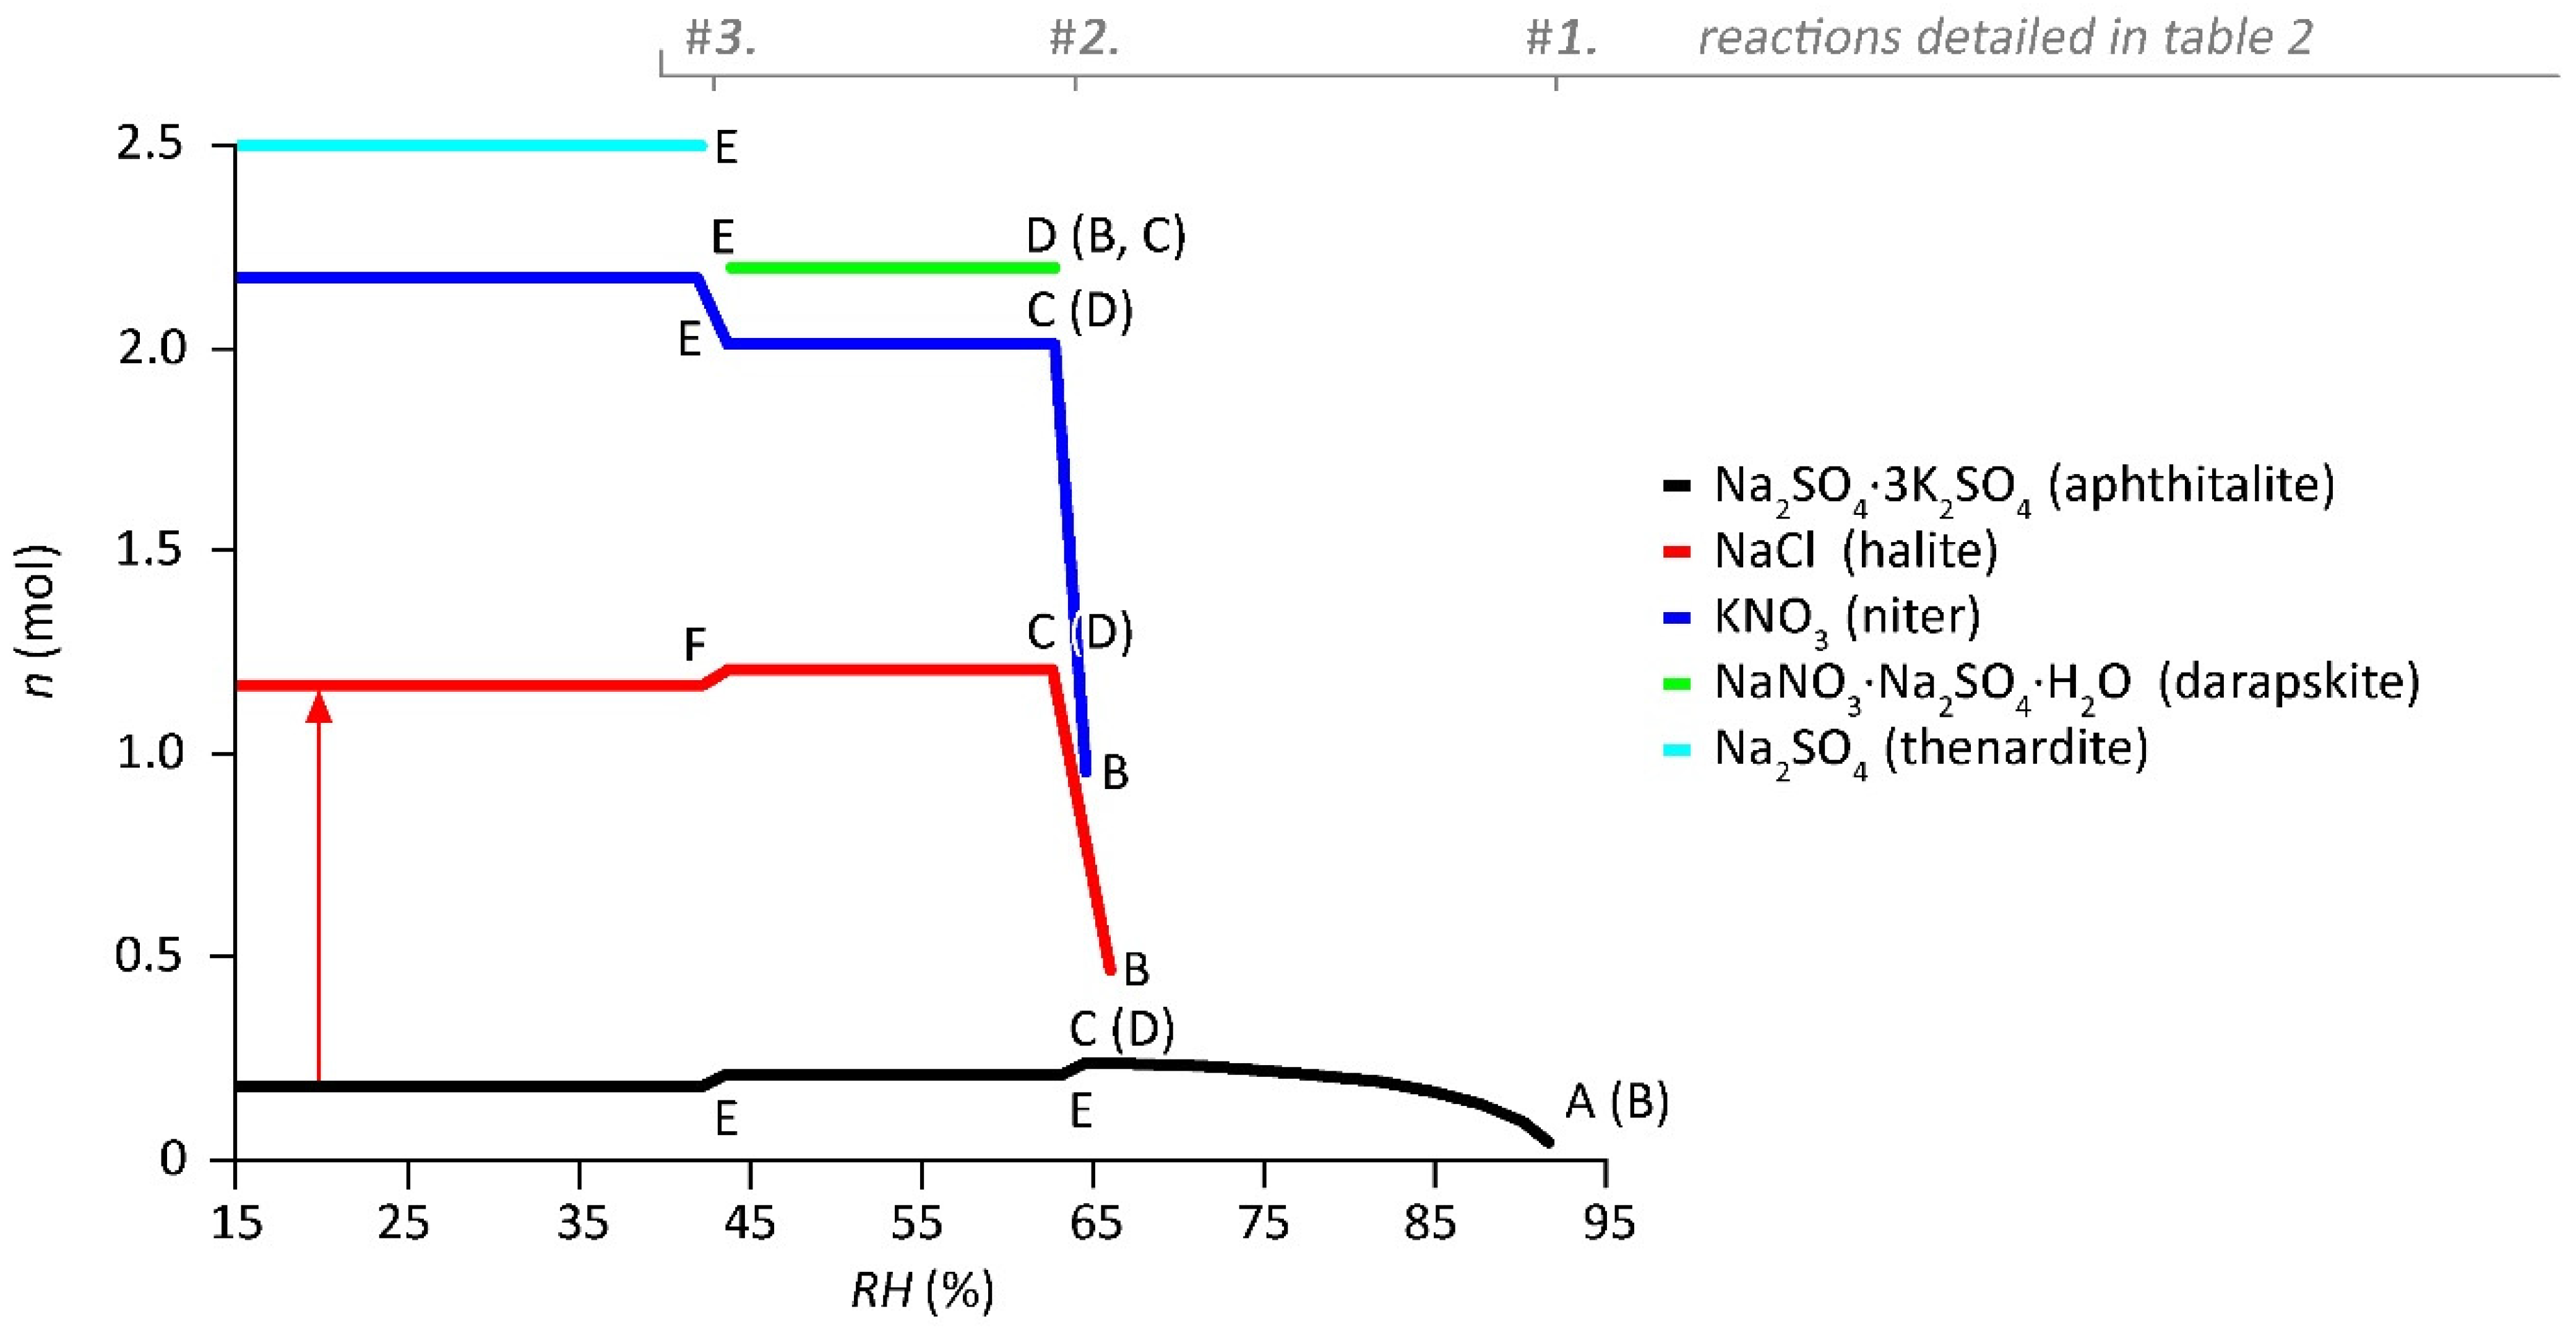
Figure 1. Example of an ECOS/RUNSALT output with 2 mol Na+ and K+, and 1 mol Cl, NO3, and SO42−, calculated at 20 °C with RH (%) from 15% to 95% (resolution 1.6% RH points), with the latter on the x-axis and the amount of crystalline salt, n (mol), stacked on the y-axis. The red arrow illustrates the absolute amount of the solid NaCl (halite) at the specific RH, here from 0.16 to 1.16 mol, thus with an absolute amount of 1 mol. The letters A to F indicate specific RH points of interest and are explained in the legend below. The numbers 1 to 3 indicate the RH points at which reactions take place when looking from a humid to a dry environment, as further detailed in Table 2.
Heritage 05 00190 g001
Figure 2. Example of an ECOS/RUNSALT output of 2 mol Na+ and K+, and 1 mol Cl, NO3 and SO42−, calculated at 20 °C with RH (%) from 15% to 95% (resolution 1.6% RH), with the latter on the x-axis and the amount of crystalline salt in volume, V (cm3), stacked on the y-axis. The dashed rectangles illustrate plot artifacts caused by the RH resolution; the non-vertical lines are to be read as vertical ones and the gap between darapskite and thenardite is closed.
Heritage 05 00190 g002
Figure 3. Detail of the ECOS/RUNSALT output shown in Figure 1, calculated at 20 °C with RH (%) from 60% to 70% (resolution 0.2% RH points), with the latter on the x-axis and the amount moles of crystalline salt, n (mol), stacked on the y-axis. The dashed rectangle illustrates plot artifacts caused by the RH resolution; the non-vertical lines are to be read as vertical.
Heritage 05 00190 g003
Figure 4. ECOS/RUNSALT outputs, 1 mol Ca2+ and 2 mol NO3 (left), and 2 mol K+ and 1 mol SO42− (right). Calculated at 20 °C for RH ranging from 15% to 95% or to 98% (right) (resolution 1.6% RH), with the latter on the x-axis and the amount of crystalline salt, n (mol), on the y-axis.
Heritage 05 00190 g004
Figure 5. Calculated MgSO4 phases at different temperatures derived from ECOS/RUNSALT plots (with equimolar contents of Mg2+ and SO42−); relative humidity from 15 to 95% on the x-axis (resolution 1.6% RH) and temperature, T (°C), on the y-axis.
Heritage 05 00190 g005
Figure 6. Calculated and experimental MgSO4 phases at different temperatures derived from Steiger et al. [84] (the dashed lines correspond to data of the phase diagram); the relative humidity from 15 to 95% (resolution 1.6% RH) is on the x-axis, and temperature, T (°C), is on the y-axis.
Heritage 05 00190 g006
Figure 7. ECOS/RUNSALT outputs to illustrate the influence of Ca2+ and SO42− (considered as the gypsum content) on the crystallization behavior of a salt mixture. Left: excluding equimolar contents of Ca2+ and SO42−, input parameters in mol are Na+: 1.8, Ca2+: 0, NO3: 1, and SO42−: 0.4. Right: including equimolar contents of Ca2+ and SO42−, thus Na+: 1.8, Ca2+: 3.6, NO3: 1, and SO42−: 4. Both outputs show the RH (%) on the x-axis and the amount of crystalline salt in volume, V (cm3), on the y-axis.
Heritage 05 00190 g007
Table 1. Overview of terminology and suggested symbols to describe RUNSALT plots showing the crystallization pathway of mixed salt systems under changing RH. Refer also to Figure 1, the legend of Figure 1, and Table 2.
MeaningBase SymbolSpecies-Specific Symbol 1
Explanation following RUNSALT plots (example Figure 1)
1.Mutual crystallization relative humidity R H cry m R H cry 1 m
RH point at the onset of any line shown in a plot corresponding to the start of crystallization; the number shown in the specific symbol refers to the species/solid in order of appearance from a humid to a dry environment. The use of the number (e.g., 1) in relation to the solids can be useful to understand the sequence of crystallization. The solution at this point is saturated with respect to a specific solid. When available, the first letters of the mineral name or chemical formula can used to replace the number, e.g., R H cry 1 m is aphthitalite = aph and thus R H cry aph m (letter A in Figure 1). Aphthitalite is the first that crystallizes in the mixture and the same base symbol is used for the mutual crystallization relative humidity of all solids that crystallize (indicated with the letter B in Figure 1). This is only relevant when solution is still available before crystallization takes place (reactions in solution in Table 2).
2.Mutual dissolution relative humidity R H dis m R H dis 1 m
RH point at the end of a horizontal line in a plot, looking from a dry to a humid environment, equals the start of dissolution; e.g., in Figure 1 this is illustrated by the RH points indicated with the letter C, and thus when solution becomes available.
3.Mutual deliquescence relative humidity R H del m R H del 1 m
RH point at the end of a horizontal line in a plot when no more solution is available, looking from a dry to a humid environment, e.g., indicated as letter D in Figure 1. Here, the last solid that crystallizes is darapskite, and afterwards no more solution is available. Thus, R H del   dar m , as further illustrated by reaction number 2 shown in Table 2.
4.Mutual transition relative humidity R H tra m R H tra [ 3 - 5 ] m
RH point at which salt transitions occur. The numbers refer to the solids involved in the transition, starting with solids before the dash (e.g., 3 in [3–5]) at more humid conditions transitioning to solids after the dash (e.g., 5 in [3–5]) at dryer conditions. Either a phase change (hydration, dehydration), decomposition, or the formation (addition) of solids occur under both wetting and drying conditions. For example, the transition of mirabilite to thenardite is R H tra [ mir - the ] m , or is more complicated, as shown by reaction 3 in Table 2 (letter E in Figure 1).
Additional terms that are useful when calculating water activities or concentrations.
Values that are not included in the RUNSALT output data yet could be derived from the ECOS calculations.
5.Mutual equilibrium relative humidity R H eq m
Any RH point at which a solution is in equilibrium with its environment = water activity at any concentration if solution is available, e.g., in Figure 1 any RH point above D, and thus R H del dar m .
6.Mutual saturation relative humidity R H sat m
Any RH point at which a solution is saturated (points on the curves, e.g., in Figure 1, all RH points between A and C on the curve of aphthitalite crystallization), equal to the R H eq m points during crystallization (when solid and solution are available).
1 For practical considerations, double subscripts can be replaced by a comma between subscripts, e.g., RHmcry,aph.
Table 2. Summary of the reactions under drying conditions shown in the RUNSALT plot (Figure 1, noted as # 1, 2 and 3 above the figure).
Start Composition of the Solution (mol): 2Na+ + 2K+ + 1Cl + 1NO3 + 1SO42−
#Reactions in solution
1. 2Na+ + 6K+ + 4SO42− → Na2SO4∙3K2SO4 (cr)
2. Na2SO4∙3K2SO4 (cr) + 11Na+ + Cl + 10NO3 + 4H2O → NaCl (cr) + 6KNO3 (cr) + 4NaNO3∙Na2SO4∙H2O (cr)
Solid-state reactions
3. 6NaNO3∙Na2SO4∙H2O (cr) + Na2K SO4)4 (cr) → 6KNO3 (cr) + 10Na2SO4 (cr)
Publisher’s Note: MDPI stays neutral with regard to jurisdictional claims in published maps and institutional affiliations.