Article

Performance of Ventilation, Filtration, and Upper-Room UVGI in Mitigating PM2.5 and SARS-CoV-2 Levels

by
Atefeh Abbaspour
1,*,
Hamidreza Seraj
1,
Ali Bahadori-Jahromi
1,* and
Alan Janbey
2
1
Department of Civil and Environmental Engineering, School of Computing and Engineering, University of West London, London W5 5RF, UK
2
Research Department, London College, London TW5 9QX, UK
*
Authors to whom correspondence should be addressed.
Clean Technol. 2025, 7(3), 53; https://doi.org/10.3390/cleantechnol7030053
Submission received: 7 May 2025 / Revised: 14 June 2025 / Accepted: 19 June 2025 / Published: 23 June 2025

Abstract

This study aimed to improve indoor air quality (IAQ) in an existing college building in London by addressing two key pollutants: PM2.5 particles (from indoor and outdoor sources) and SARS-CoV-2 as a biological contaminant. Various mitigation strategies were assessed, including hybrid ventilation that combined CIBSE-recommended rates with partial window and door opening. The effectiveness of HEPA-based air purifiers (APs) and upper-room ultraviolet germicidal irradiation (UVGI) systems with different intensities was also evaluated for reducing viral transmission and the basic reproduction number (R0). To manage PM2.5 in the kitchen, HEPA and in-duct MERV13 filters were integrated into the ventilation system. Results showed that hybrid ventilation outperformed mechanical systems by achieving greater reductions in infection probability (PI) and maintained higher performance as the number of infectors increased, showing only a 2.5–16% drop, compared to 35% with mechanical ventilation. An R0 analysis indicated that UVGI is more suitable in high-risk settings, while APs combined with hybrid ventilation are effective in lower-risk scenarios. The findings also emphasize that combining Supply–Exhaust ventilation with APs or MERV13 filters is crucial for maintaining safe IAQ in kitchens, aligning with the WHO’s short- and long-term exposure limits.

1. Introduction

The COVID-19 pandemic has brought significant attention to airborne transmission as a major route of infection for SARS-CoV-2, a highly infectious virus, particularly in indoor environments. Several studies have applied quantitative models to estimate the risk of infection in these settings. Furthermore, PM2.5 is widely recognized as one of the most common indoor air pollutants, and its presence has been extensively examined in numerous studies due to its significant influence on the IAQ. PM2.5 consists of microscopic particles with diameters of 2.5 μm or less, which are small enough to penetrate deep into the respiratory tract and contribute to a range of adverse health outcomes [1]. Accurate tracking and analysis of PM2.5 concentrations are essential for understanding and mitigating exposure risks related to indoor air pollution.
IAQ is often evaluated using carbon dioxide (CO2) levels, which serve as a reliable indicator of ventilation effectiveness. Elevated CO2 concentrations typically point to poor ventilation and have been associated with various health concerns and reduced cognitive performance, highlighting the importance of maintaining adequate air exchange rates in occupied spaces [2]. The Wells–Riley model [3], originally developed to predict the risk of airborne infections in enclosed spaces, has been adapted and utilized in various research efforts, particularly in IAQ studies to assess the effectiveness of ventilation and other mitigation strategies like ultraviolet germicidal irradiation (UVGI).
Dai and Zhao [4] utilized the Wells–Riley model to assess COVID-19 infection risks in confined spaces, examining the effect of ventilation rates on transmission probabilities. They simulated varying air changes per hour (ACH) to model different ventilation scenarios and included viral emission rates from infected individuals engaged in activities like talking and breathing. They finally concluded that maintaining ventilation rates that lead to R0 values below 1 or calibrating factors like occupancy and room dimensions was found to substantially reduce infection probability.
Iwamura and Tsutsumi [5] developed a modified version of the Wells–Riley model to estimate the probability of airborne transmission of SARS-CoV-2, specifically focusing on the Omicron strain. By utilizing indoor CO2 concentrations as a proxy for ventilation effectiveness, the model helps assess the risk of airborne transmission in real-world settings. The study’s findings highlighted essential CO2 thresholds for different settings to prevent airborne SARS-CoV-2 transmission.
Ultraviolet-C (UV-C) radiation, operating in the 200–280 nanometer wavelength range, has long been recognized for its germicidal properties. A key application of UV-C light is UVGI, which is widely used to inactivate airborne and surface-bound pathogens, including viruses, bacteria, and fungi. UVGI works by disrupting the DNA and RNA of microorganisms, preventing them from replicating and rendering them non-infectious [6,7,8]. During the COVID-19 pandemic, UVGI gained particular attention for its efficacy against SARS-CoV-2 virus.
Several studies demonstrated that UVGI effectively reduces viral loads of SARS-CoV-2 in the air and on surfaces under controlled conditions [9,10,11,12,13]. Factors such as exposure time, UV-C intensity, and environmental conditions are critical to its effectiveness. One of the most effective implementations of UVGI is the upper-room UVGI system, which targets airborne pathogens in the upper portion of a room [10]. In this method, UV-C lamps are installed near the ceiling, creating a zone of UV-C radiation that disinfects air as it circulates through the space.
Ensuring air mixes adequately between the occupant level and the UVGI zone enhances the disinfection effect [14]. This continuous process makes upper-room UVGI highly effective in densely populated spaces or those with limited ventilation, like hospitals, schools, and public transportation hubs, where the risk of airborne transmission is typically higher. Cui [9] utilized a Quantitative Microbial Risk Assessment (QMRA) model to evaluate the risk of SARS-CoV-2 transmission in a 500 m3 indoor space. The study concluded that UVGI is a highly effective supplementary measure to ventilation, particularly in enclosed spaces with limited air exchange.
In another study, Park et al. [10] investigated the effectiveness of upper-room UVGI systems in a school classroom setting, which is particularly susceptible to airborne disease due to high occupancy and prolonged use. The findings revealed that increasing ventilation rates from 1.1 to 5 ACH achieved approximately 85% airborne disinfection, while doubling the UV-radiating volume contributed to 60% disinfection. A moderate increase in the UV fluence rate yielded an additional 18% disinfection.
Lau et al. [15] explored how ambient conditions such as air velocity and temperature affect UVGI lamp output. These factors influence the cold spot temperature on UV lamps, which in turn impacts their germicidal efficiency. Through modeling and experiments with various lamp types, the study found that UVGI lamp output can fluctuate by as much as 68% depending on conditions. The calibrated model showed that ignoring these ambient factors could lead to an underestimation of the disinfection performance by around 20%.
To address the concerns raised in past years regarding the safety and health implications of IAQ in educational buildings, many studies have focused on investigations and intervention strategies in real-world educational environments. In this context, Abhijith et al. [16] conducted detailed air quality monitoring at three primary schools in London and showed the significant impact of traffic-related pollution on both outdoor and indoor environments. Their study demonstrated that green screens placed at school boundaries could reduce particulate matter (PM) concentrations by up to 44% in playground areas and effectively acted as passive pollution barriers. In the indoor environment, the installation of air purifiers achieved reductions in PM concentrations by around 57% and highlighted the effectiveness of active filtration devices in classrooms.
Extending the scope beyond single interventions, Rawat and Kumar [17] provided a comprehensive synthesis of various strategies aimed at improving both indoor and outdoor air quality around schools. Their review categorized interventions into technological (e.g., air purifiers, HVAC filters), behavioral, structural, and policy measures and highlighted that a combination of these approaches is necessary to achieve meaningful pollution reductions.
Considering that in educational buildings, particularly higher educational (HE) institutions, commercial kitchens associated with campus cafés and restaurants are significant sources of indoor PM2.5 emissions, these spaces should be given focused attention in IAQ assessments. When HE buildings are selected as case studies, it is essential to account for the contribution of kitchen activities to overall particulate matter levels, as they may substantially influence exposure conditions in adjacent areas, such as dining halls, lounges, and even nearby classrooms or corridors.
In this regard, Lyu et al. [18] investigated PM2.5 emissions in six types of commercial kitchens across Chinese cities, including traditional Chinese, Western, teppanyaki, fried chicken, barbecue, and hotpot cooking areas. This study measured PM2.5 concentrations and emission rates, focusing on the exposure risks to chefs. They found that at the start of stir frying and the middle to end of pan frying, the highest PM2.5 is released. The research also assessed the deposition rates of PM2.5 in different regions of the respiratory system and found the highest deposition in the upper airways for chefs in teppanyaki and Chinese kitchens.
Further research regarding the PM2.5 generated by kitchen activities was conducted by Kang et al. [19]. In this study, they analyzed the impact of cooking activities on IAQ in residential buildings. The methodology included both field measurements of particles, including PM2.5 and PM2.5, and controlled experiments in 30 residential buildings, which allowed for a comprehensive evaluation of different cooking scenarios. Their findings revealed that the simultaneous use of natural ventilation and range hood systems significantly reduced particle concentrations, with decay rate constants reaching approximately 9 h−1. Moreover, this research highlighted the limitations of range hood systems when used alone and highlighted the effectiveness of combining natural ventilation with mechanical systems to mitigate indoor air pollution from cooking activities.
The present study focuses on a comprehensive multizone assessment of IAQ within a university building in London, UK. It considers both internal and external sources of pollutants, with particular attention to PM2.5 and SARS-CoV-2. Various combinations of strategies in different conditions are studied for mitigating the pollution and enhancing the IAQ.
This study expands on existing research by addressing airborne contaminant risks in a more comprehensive manner. Unlike studies on SARS-CoV-2 transmission that typically consider only a single infector, this work examines scenarios involving multiple contaminant sources, providing solutions for both single- and multiple-source cases to better understand and reduce airborne transmission in indoor environments. Additionally, while many studies on PM2.5 reduction focus only on indoor sources, this study evaluates PM2.5 levels in the kitchen by considering contributions from both indoor and outdoor sources, analyzing both annual averages and worst-case 24 h levels to meet the air quality guidelines (AQGs) set by the World Health Organization (WHO).

2. Methodology

In this study, a higher education building in the UK was selected to evaluate its IAQ. A detailed multi-zonal IAQ and ventilation system analysis was performed using a CONTAM simulation tool. CONTAM 3.4.0.4 was selected for this study due to its capability to model airflow and pollutant dispersion in multizone buildings over long periods with low computational demand. Although it assumes well-mixed conditions within each zone and does not include thermal or energy calculations, it allows for detailed assessment of ventilation strategies and IAQ and has the capability of defining an unlimited number of pollutants. The software includes a CFD0 option for single-zone detailed airflow modeling; however, this feature is limited to one zone at a time and does not support whole building simulations.
On the other hand, other tools such as EnergyPlus and TRNSYS are more focused on energy performance and thermal comfort and offer only basic contaminant tracking. DesignBuilder, which uses EnergyPlus as its engine, also lacks advanced multizone pollutant transport features. Computational fluid dynamics (CFD) tools like OpenFOAM provide high-resolution airflow analysis but are limited to small spaces and require a high computational power, which makes them not suitable for long-term, whole-building simulations. Therefore, CONTAM provides the most practical balance between simulation speed, scale, and accuracy for evaluating IAQ in the case-study building.
The case-study building, a three-story structure modeled in CONTAM (as shown in Figure 1), incorporates a multizone ventilation model to simulate natural infiltration, exfiltration, and airflow between zones. Wall and floor leakages were defined to account for air movement, with wall leakages specified at three elevations to capture the stack effect and airflow interactions between the outdoor environment and different building zones [20].
According to observations in the building and interviews with the site engineer, the central ventilation system is old and has limited capacity, and increasing the airflow rate causes noise issues, especially in the second-floor rooms. Considering that based on actual measurements, the current ventilation rate in the building is below standard, the possibility of having hybrid ventilation by increasing the ventilation rate to the CIBSE-recommended level along with opening of the window/door is evaluated for its impact on the selected contaminants.

2.1. Defining Contaminants for Parametric Simulation

The concept of quanta, introduced by Wells in 1955 [3], is a theoretical unit representing the infectious dose required to cause infection through airborne transmission. A “quantum” is defined as the amount of infectious material that, when inhaled, results in an infection. The relationship between the number of quanta inhaled and the likelihood of infection follows a Poisson distribution, which forms the basis of the Wells–Riley equation, widely used to model airborne transmission risks [21]. To estimate the risk of airborne disease transmission, the study applies Equation (1), which has been frequently employed in prior research for quantifying the risk of infection based on factors such as ventilation, exposure duration, and source strength [22,23]:
P I = N C N S = 1 exp Iqpt Q = 1 exp ( n q )
n q = p ( 1 M inh   ×   F m ) t 1 t 2 C t dt
where P I denotes the infection risk, N C the number of infected individuals, and N S is the susceptible population. I is the number of infectors, p represents the pulmonary ventilation rate (inhalation rate), q is the quanta generation rate, t refers to exposure time, and Q is the room’s ventilation rate. The term n q captures the cumulative quanta inhaled over the exposure period. In Equation (2), M i n h is the inhalation efficiency, F m denotes the mask usage rate, and C t indicates the time-varying quanta concentration (quanta/m3).
In addition to the probability of infection, basic reproduction number (R0) is also calculated for further investigation. The R0 is the average number of secondary infections produced by one infectious individual in a fully susceptible population. These terms have been previously [22,24,25] utilized for the same purpose. R0 is defined as hereunder:
R 0 = N C I
when R0 is less than one, the infectious agent is unlikely to spread within the population, suggesting that the infection will gradually subside. Thus, reducing R0 is a key objective in controlling outbreaks within indoor environments. Figure 2 shows the virus dispersion mitigation methods analyzed in the classroom environment.
In addition to the virus, PM2.5 was selected for analysis among the particulate matter pollutants because, due to its smaller size compared to PM10, it can penetrate deeper into the lungs and, therefore, is more strongly associated with serious respiratory and cardiovascular health effects [26]. However, the methods used for PM2.5 reduction in this study and similar WHO AQG targets and interim values, are also applicable to PM10. Furthermore, it should be noted that as there is currently a lack of well-established long-term data, standards, or thresholds from trusted sources, such as the WHO, PM1 was not considered in the analysis, but still, similar reduction methods are applicable to it as well.
Kitchens are recognized as a key source of PM2.5 indoors, particularly during cooking. The café, where food is prepared in the adjoining kitchen, operates between 9:00 AM and 5:00 PM from Monday to Saturday. Food preparation takes place in the kitchen connected to the café, where cooking is scheduled twice daily. Each session lasts for 30 min. A door connecting the kitchen to the café remains open continuously, while an extraction hood operates during cooking to manage pollutant levels. Figure 3 illustrates the kitchen with the studied PM2.5 mitigation methods.
The capture efficiency of a hood measures how well they extract pollutants before dispersing into the surrounding indoor environment [27,28,29]. For this study, the hood was modeled in CONTAM with an assumed efficiency of 80%, consistent with experimental findings for activities such as pan-frying hamburgers over medium heat [29]. This efficiency aligns with airflow rates of 51–138 L/s and particle sizes ranging between 0.3 and 5.0 µm. Furthermore, according to CIBSE Guide A [30] and Building Regulations Part F1 [31], the minimum recommended extraction rates are 30 L/s for hoods placed near the hob or 60 L/s when located elsewhere in kitchens.
In this study, the kitchen hood was configured with an extraction rate of 100 L/s, while the air supply rate was set to 90% of this value. This arrangement creates negative pressure in the kitchen, which prevents pollutants from escaping into the café through the open door and ensures that cleaner air from the café flows into the kitchen. Furthermore, to reflect the impact of the hood on PM2.5 emissions, the emission rate was adjusted using a method described by Underhill et al. [32].
The study also accounted for outdoor PM2.5 contributions from nearby roads and other external sources. Data on outdoor pollutant concentrations were sourced from the Air Quality in England (AQE) database, which compiles measurements from monitoring stations in London and other areas (see Figure 4). Outdoor pollutants were integrated into CONTAM using a .CTM file, with a penetration factor through the building’s walls assumed to be 1.0 [33].
The World Health Organization (WHO) has established air quality guidelines (AQGs) to minimize health risks, setting interim targets for short-term (24 h) and long-term (annual) PM2.5 exposure, along with an ultimate AQG goal, as presented in Table 1. These interim targets represent incremental steps towards improving air quality.
This study has focused on working toward compliance with or surpassing WHO’s recommended interim targets by analyzing various methods of reducing PM2.5 levels in the kitchen. Table 2 summarizes the input parameters used in the simulation.

2.2. Numerical Analysis of Viral Concentration

In addition to the internal source of virus (infector), the virus can also enter the room through outdoor air (OA), recirculating air, or infiltration. In order to evaluate the effectiveness of various interventions, such as ventilation, filtration, and UVGI, in reducing the concentration of infectious airborne quanta in a room, a basic form of the first-order differential mass conservation equation (Equation (4)) can be utilized [11].
d C t d t = q V + α i n . C i n t α t o t . C t
In Equation (4), C t is the virus concentration (quanta/m3) at time t, q is the quanta generation rate from an infector, V is the room volume (m3), C i n t is the concentration of virus in incoming air (e.g., from outdoor or return ducts), and α i n is the rate at which this external air enters the room. The total removal rate, α t o t , is the combined effect of all removal and disinfection mechanisms.
To expand this model and include detailed flows and removal mechanisms, Equation (4) can be written in terms of airflows (m3/h) and concentrations, as shown in Equation (5). It should be noted that this equation includes general terms for various interventions, such as filtering the recirculated air even if it is not applicable in the current case with 100% OA.
V d C t d t = q + 1 μ M E R V . Q r e c . C r e c t + Q O A . C O A t + Q i n f i l . C i n f i l t Q r . C r t + Q e x f i l . C e x f i l t + Q d e p . C d e p t + Q d e a c . C d e a c t + Q H E P A . C H E P A t + Q B V . C B V t + V . f . k . E . C U V G I t .
On the right-hand side of Equation (5), various virus concentration mitigation strategies are defined. In this equation, Q r e c , Q O A , and Q i n f i l (m3/h) represent the OA supply, recirculated air, and infiltration (uncontrolled entry of outdoor air), respectively. Furthermore, C r e c ( t ) is the virus concentration entering the room through recirculating air. C O A ( t ) and C i n f i l ( t ) are the concentration of virus in the OA and infiltration air (which are assumed to be zero). Moreover, μ M E R V is the efficiency of the MERV filter, applied to Q r e c .
Also, Q r and Q e x f i l represent return and exfiltration flows (controlled and uncontrolled exhaust). Q d e p , Q d e a c , Q H E P A , and Q B V are equivalent removal rates, corresponding to deposition, natural deactivation, HEPA filtration, and background ventilation. V . f . k . E . represents virus removal by the upper-room UVGI system, modeled as a first-order decay rate. Additionally, C r t and C e x f i l t represent the concentration of virus in the return air and air leaving the space, respectively. C d e p t ,   C d e a c t , C H E P A t , C B V t , and C U V G I t are equivalent virus removed by deposition, deactivation, HEPA filtration, background ventilation, and UVGI system, respectively.
It should be noted that the Q values for filters and natural decay and virus deposition are expressed as equivalent flow rates not actual airflows. It is important to clarify that infiltration and exfiltration are not intentional airflows but are calculated by the CONTAM simulation based on indoor and outdoor pressure differences and envelope leakage characteristics. Infiltration refers to the uncontrolled entry of outdoor air into the room which occurs when the indoor pressure is lower than the outdoor pressure, and exfiltration occurs when the indoor pressure is higher and indoor air is pushed out. These processes happen continuously and dynamically depending on building layout, window positions, wind direction, and HVAC operation.
The total removal rate, which combines all these control methods, is denoted as α t o t , as shown in Equation (6):
α t o t = Q r + Q M E R V + Q e x f i l + Q d e p + Q d e a c + Q H E P A + Q B V + V . f . k . E V
where Q M E R V is the equivalent flow associated with MERV filtration. All terms are in m3/h unless otherwise noted.
To solve for the quanta concentration over time ( C t ), the differential equation is addressed assuming a steady-state source of infection. Furthermore, initial concentration of the virus is assumed zero ( C 0 = 0 ). The general solution to the first-order differential equation is as follows:
C t = q + V . α i n . C i n V . α t o t 1 e α t o t . t
This equation describes the evolution of quanta concentration over time, ultimately leading to a steady-state value. The steady-state concentration, C S S , is the long-term quanta concentration that the room will reach if the infection source continues to emit quanta at a constant rate and the air exchange and removal mechanisms remain constant. Therefore, steady-state conditions and an initial concentration of C 0 = 0 are assumed in calculations.
C S S = q + V . α i n . C i n V . α t o t
If the only source of increased virus concentration is the generation by the infector and assuming that the OA is virus-free, the steady-state concentration of the virus can be defined by Equation (9):
C S S = q Q r + Q M E R V + Q e x f i l + Q d e p + Q d e a c + Q H E P A + Q B V + V . f . k . E
This equation clearly demonstrates the impact of all mitigation strategies on the virus concentration inside the room.
In practice, the concentration of virus particles in recirculated air ( C r e c ) is often lower than in the source zone. This happens because, as air moves through ductwork and different areas of a building, it becomes mixed and diluted. As a result, the effectiveness of in-duct cleaning methods, like MERV filters or in-duct UV systems, can decrease, especially in larger mechanical systems where the air has more time to dilute. Therefore, localized air cleaning strategies within individual rooms are generally more effective, particularly in buildings with extensive ventilation systems [22].

2.3. Air Purifier with HEPA Filter

Air purifiers with HEPA filters are designed to capture 99.97% of particles that are 0.3 microns in size, but they also efficiently trap both larger and smaller particles due to various filtration mechanisms. While viruses like SARS-CoV-2 are smaller than 0.3 microns, they often attach to larger respiratory droplets, making HEPA filters capable of capturing them effectively. However, HEPA filters trap viruses rather than kill them, so the trapped viruses remain in the filter until it is replaced.
The Clean Air Delivery Rate (CADR) is a key metric used to measure the effectiveness of APs, indicating how quickly an air cleaner can reduce the concentration of particles in the air. A higher CADR means the purifier can clean more air in less time, which is especially important in larger rooms. The overall efficiency of an air cleaner depends on the quality of the HEPA filter, proper airflow relative to room size, and regular maintenance.
Four APs from different manufacturers, suitable for large rooms and offering high performance with a CADR of at least 390 m3/h and 99.9% efficiency in contaminant removal, were selected to install in the classrooms and kitchen (see Table 3).
To simulate the APs, an air-handling system with 100% recirculated air was modeled, representing the operation of an AP with a HEPA filter integrated into the recirculation process.

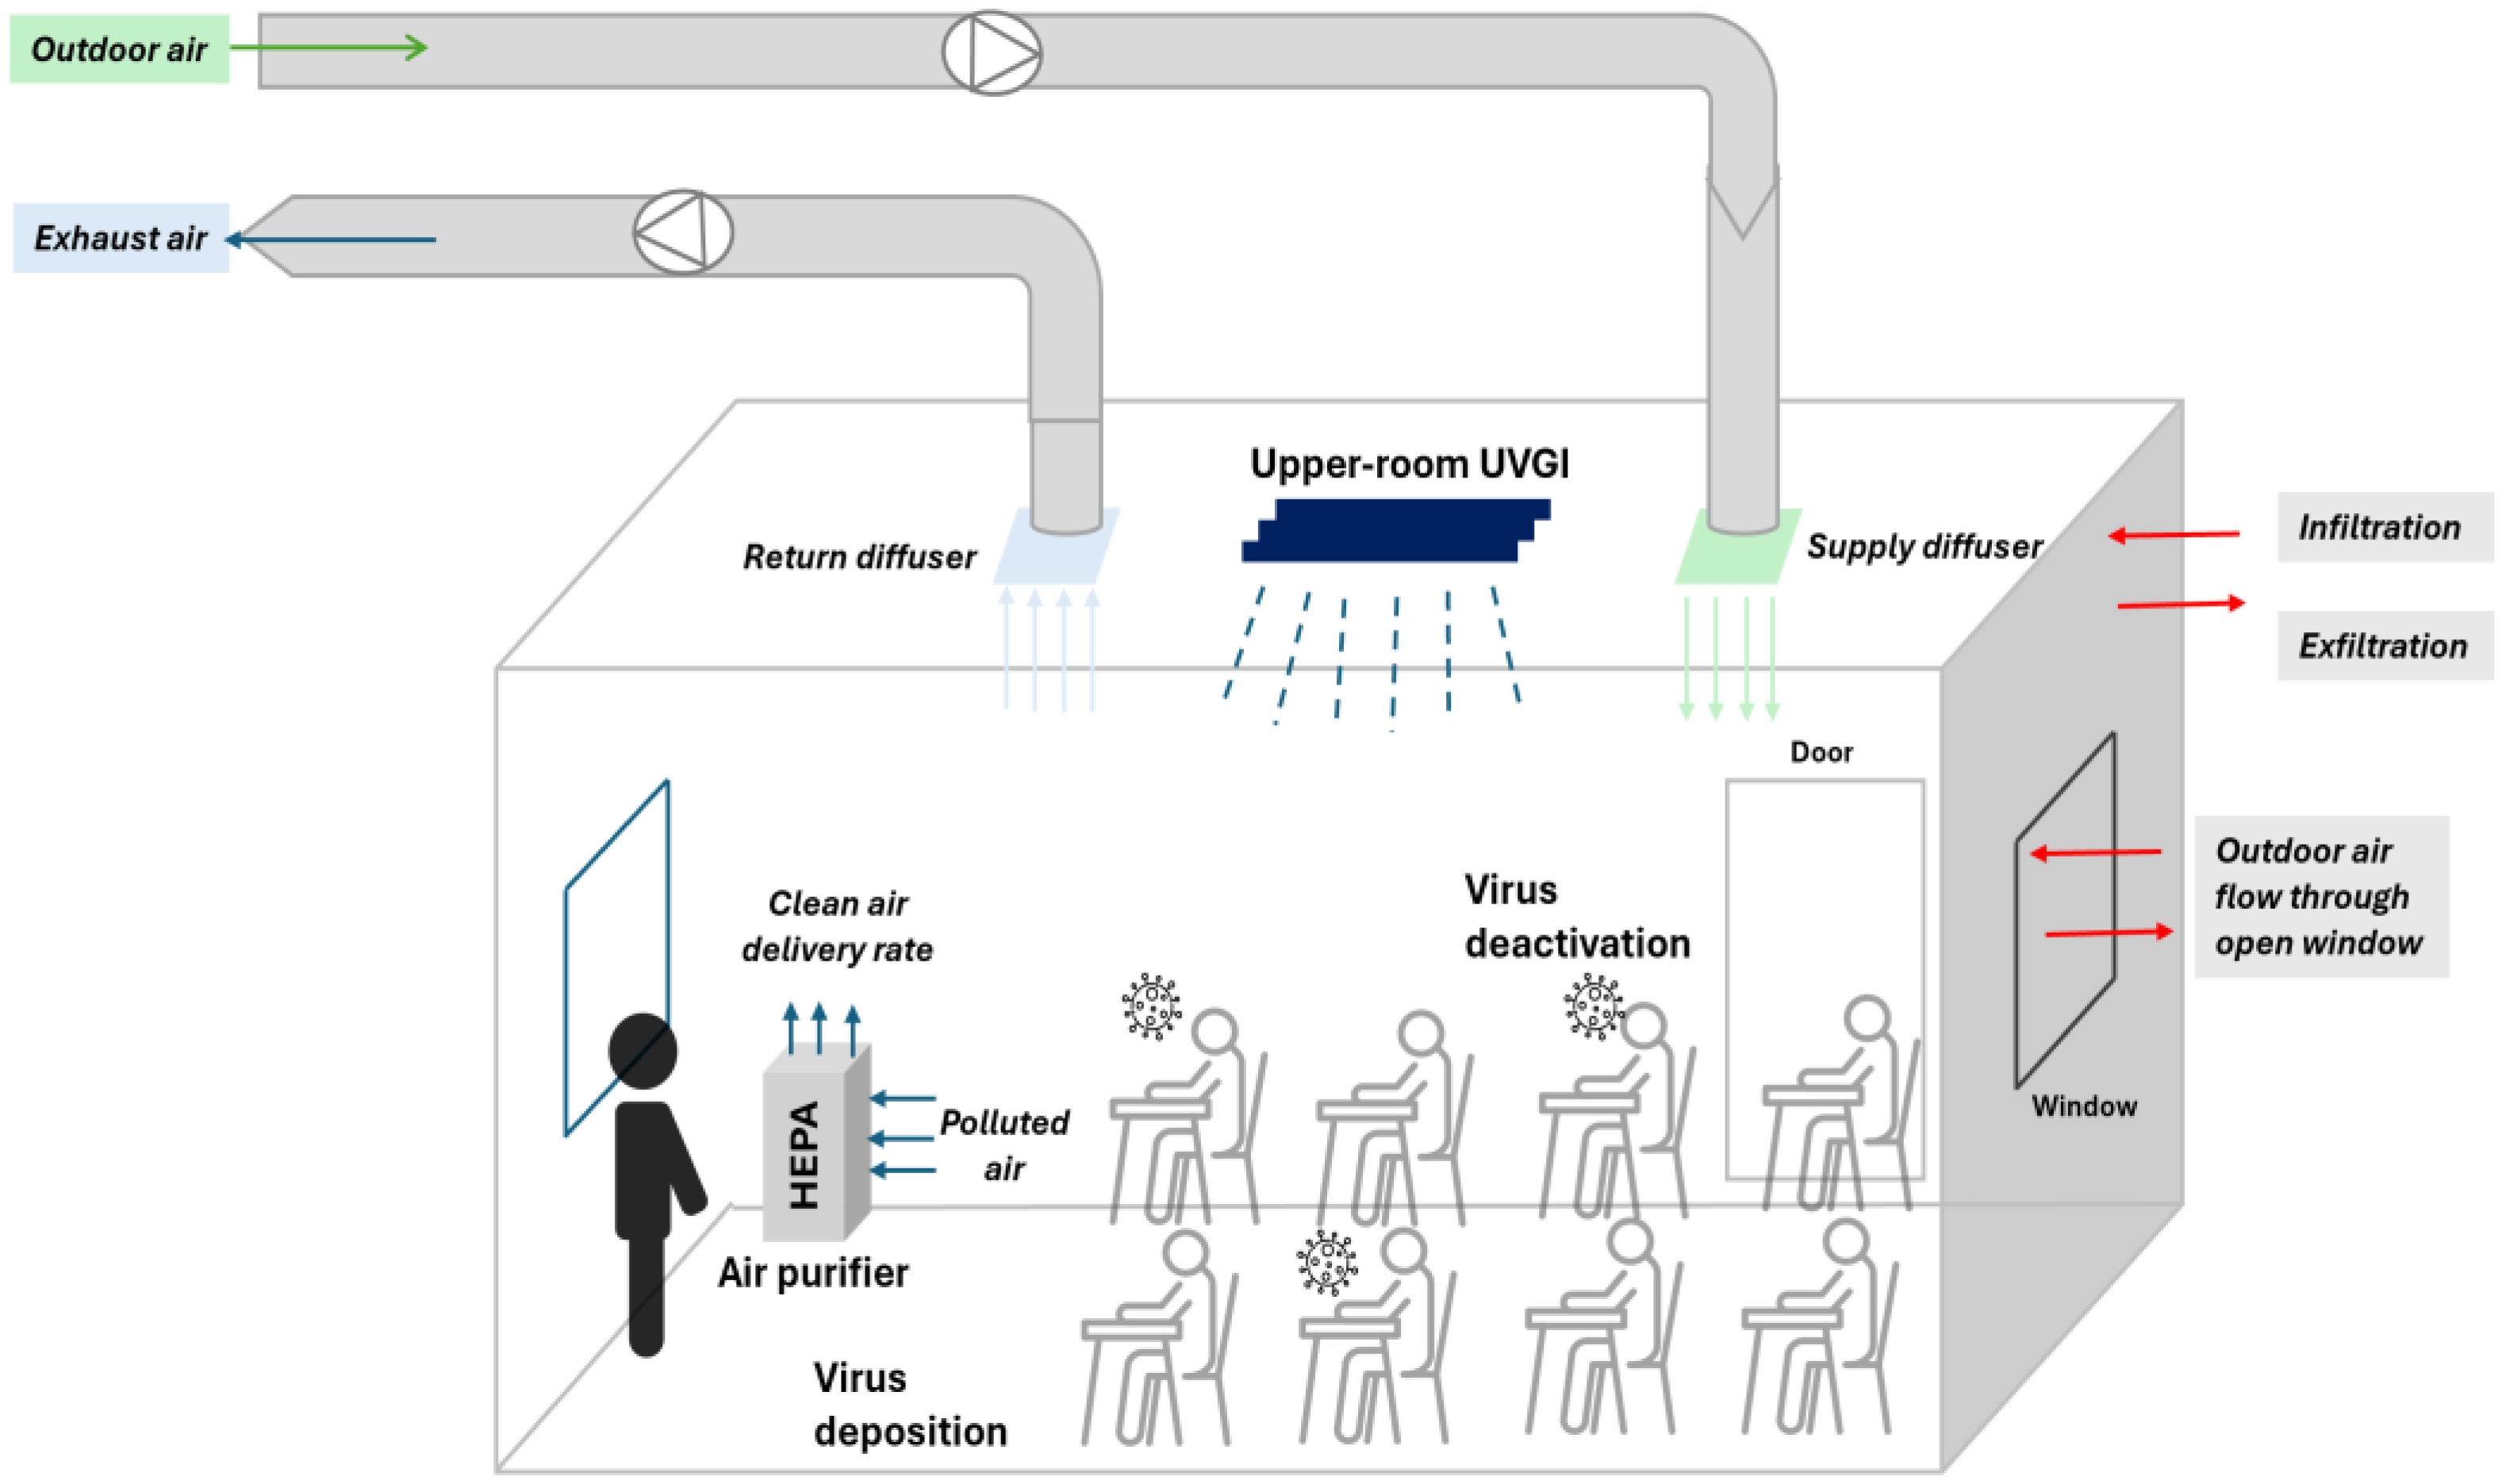
2.4. Upper-Room UVGI

Ultraviolet-C (UV-C) radiation, operating in the 200–280 nanometer wavelength range, has long been recognized for its germicidal properties. UVGI systems are widely recognized for their ability to inactivate airborne microorganisms, such as viruses using UV-C light. It is also important to acknowledge that UVGI while effective against airborne microorganisms, has no inactivating effect on particulate pollutants such as PM2.5. Therefore, PM reduction strategies must rely on filtration and ventilation rather than UV-based technologies.
The pathogen inactivation by UVGI (or expressed as “equivalent air change rate”) can be calculated using Equation (10):
Q U V G I = f . k . E . ( 3.6 )
where k is inactivation constant or susceptibility constant (cm2/mJ), E is fluence rate (µW/cm2), and f is UVGI radiation volume fraction (the fraction (%) of the total air volume in the room that passes through the irradiated zone). In this equation, 3.6 multiplier is used to convert the result’s unit to ACH or 1/h. To compare these parameters’ effectiveness, three types of UVGI systems were selected, as outlined in Table 4.
In a recent study, Schuit et al. [40] reported inactivation constants for SARS-CoV-2 of 2.93 cm2/mJ at 254 nm and 4.22 cm2/mJ at 222 nm, which was also used in [9]. Additionally, other experimental studies [41,42] suggested 3.77 cm2/mJ for k at 254 nm.
According to Threshold Limit Values (TLVs), the recommended average fluence rate for 222 nm UV-C light, suitable for whole-room applications, ranges from 1 to 3 µW/cm2 [9]. For conventional UVGI systems using 254 nm UV-C, which have been used to control tuberculosis, fluence rates typically range from 30 to 50 µW/cm2 [43].
Given that 254 nm UV-C light can cause damage to human skin and eyes, its radiation volume is usually limited to the upper room. Therefore, in the current study, only 30% of the room volume is considered to be exposed to the UV to avoid harm to occupants. In contrast, 222 nm UV-C light, as demonstrated by [44], has very shallow penetration into human tissues and does not penetrate through eye cells [45], and therefore, it is safe to be used in the whole room (100% radiation volume) [46].

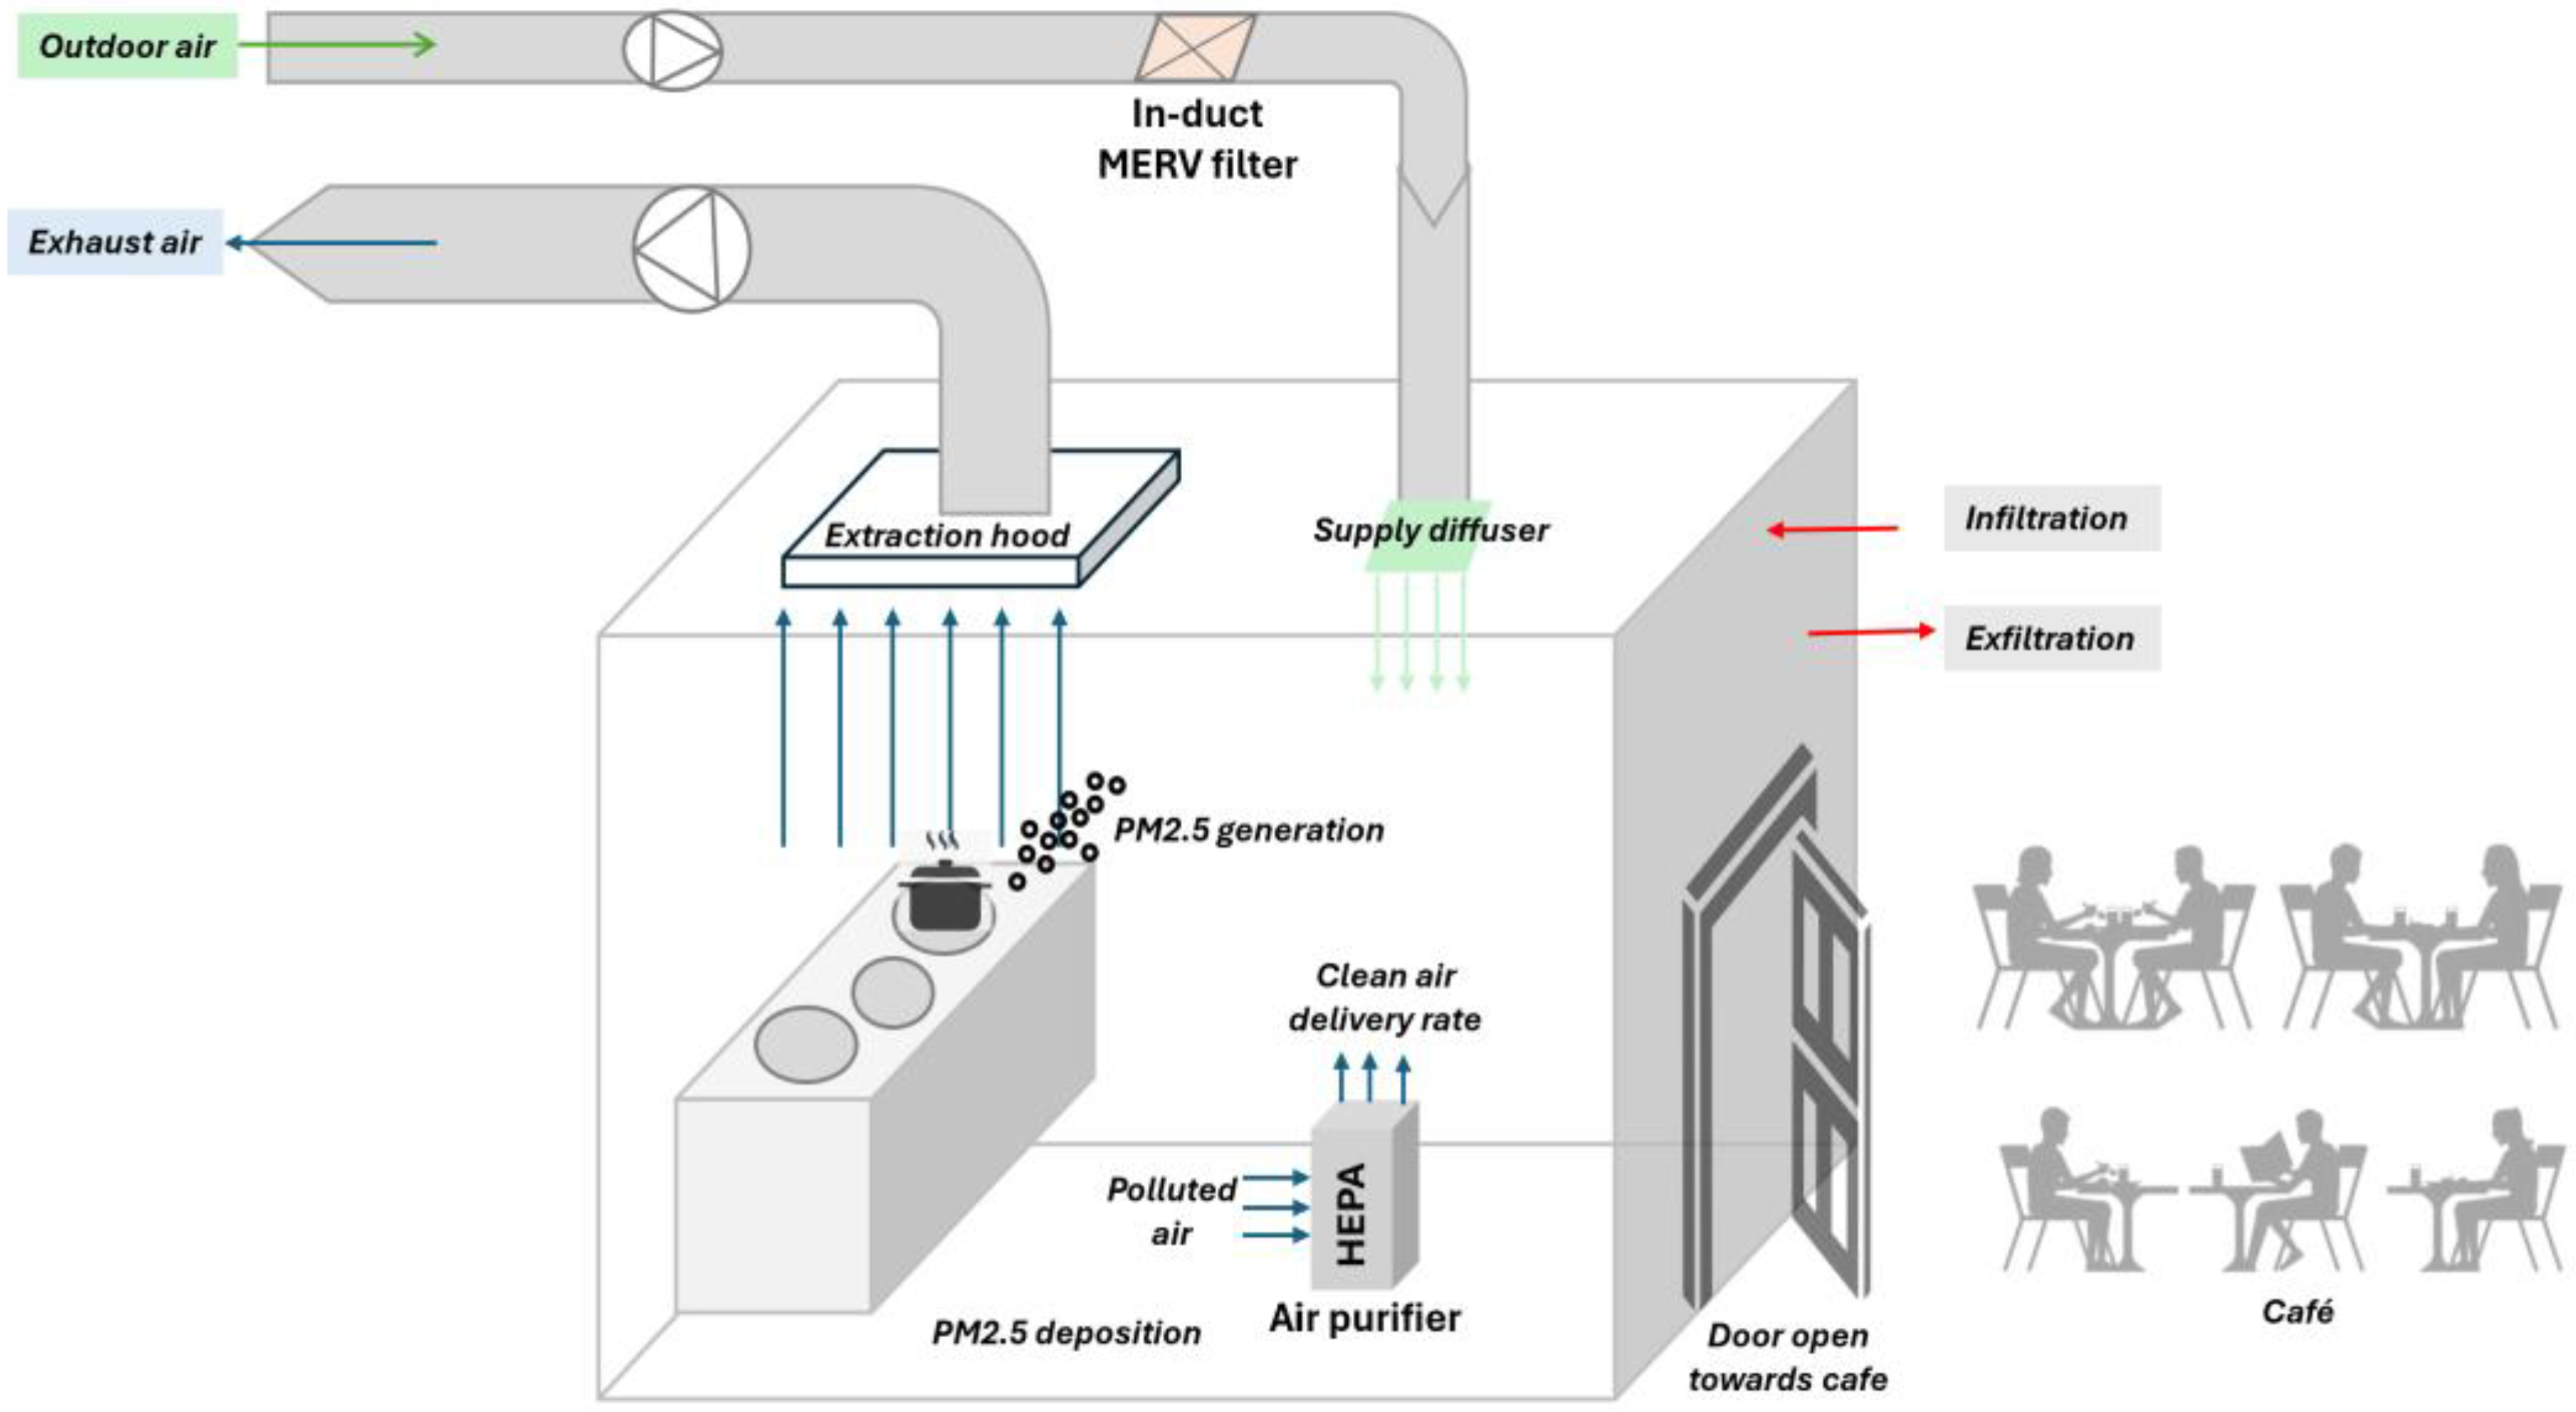
2.5. Installing In-Duct MERV Filter

The last control method is using Minimum Efficiency Reporting Value (MERV) filters in the OA ducts. In recirculating air systems, where 100% of the OA is not used, adding MERV filters is a practical method to enhance the air quality by mitigating contaminants. MERV filters capture airborne particles like PM2.5 and droplets that may carry viruses and bacteria. The MERV filter efficiency varies based on pollution’s dimension. ANSI/ASHRAE [47] presents the efficiency of all MERV filters from MERV1 to MERV16 based on the particle sizes. Airborne transmission of SARS-CoV-2 primarily occurs through virus-laden aerosols. Previous studies indicate that the size of these particles ranges from 0.25 µm to 5 µm [48,49,50,51,52].
It should be noted that the installation of in-duct filtration systems increases airflow resistance and pressure drop which leads to higher fan electricity consumption [53]. For example, a study by [54] reported that this could result in a 49% increase in electricity usage and a 1.17% rise in total building energy consumption. These impacts often necessitate system upgrades or modifications to accommodate the additional energy demand and maintain overall system performance.
In this study, the building’s current ventilation system operates with 100% of the OA, which means no air is recirculating. Even if recirculation were present, the OA is assumed to be free of viral contaminants which make in-duct filters ineffective for virus removal in this context. However, since the outdoor PM2.5 concentration is included in the calculations, the impact of a MERV13 filter is still examined. This study focuses on particle size range 2 (1.0 µm to 3.0 µm), as defined in the ANSI/ASHRAE standard [47], to model the PM2.5. A MERV13 filter, with a minimum efficiency of 85%, has been selected for this purpose.

2.6. Proposed Scenarios for Air Quality Improvement

In this study, the possibility of SARS-CoV-2 infection with various numbers of infectors is investigated to examine the controlling strategies’ performance under extreme conditions of presenting two and five infectors in each room, while in many studies that have studied the SARS-CoV-2 virus’s transmission in closed environments, only one infector is considered. The number of infectors is increased to two and five in the CONTAM model using the ‘multiplier’ option.
As mentioned earlier, the proposed scenarios for virus control include the use of mechanical and hybrid ventilation, either alone or in combination with four models of APs with varying strengths and performance levels (as was presented in Table 3), and three models of upper-room UVGI systems, as was shown in Table 4.
In this study, hybrid ventilation refers to a concurrent strategy, where both natural and mechanical ventilation operate at the same time in the same zone during occupied hours [55,56,57]. Specifically, it involves 70% window and door openings in classrooms, combined with a mechanical ventilation rate of 10 L/s per person, supplying outdoor air in accordance with CIBSE Guide A recommendations [30]. This setup is considered the high-performance hybrid ventilation case, as identified in a previous study, assuming the absence of contaminant sources within the rooms [34]. This concurrent operation reflects common practice in many UK schools, where windows are opened for comfort or air freshness even when central systems are running.
In terms of PM2.5 pollution, the objective is to assess a set of integrated strategies aimed at effectively reducing particulate matter concentrations in the kitchen area. These strategies combine different ventilation approaches with the use of APs and MERV13 filtration systems, as outlined in Table 5.
The first scenario represents the worst-case condition with no ventilation, serving as a reference point. Scenario number 2 includes only a kitchen exhaust hood, reflecting a basic setup. Scenario number 3 adds outdoor fresh air supply to the basic setup to form a so-called “Supply-Exhaust ventilation” system. Scenario number 4 builds on a previous scenario by introducing APs of four different performance levels. Finally, the last scenario investigates the use of MERV13 filtration on the OA supply duct, alongside Supply–Exhaust ventilation, to examine its ability to reduce PM2.5 levels to meet the WHO recommendations.

3. Results

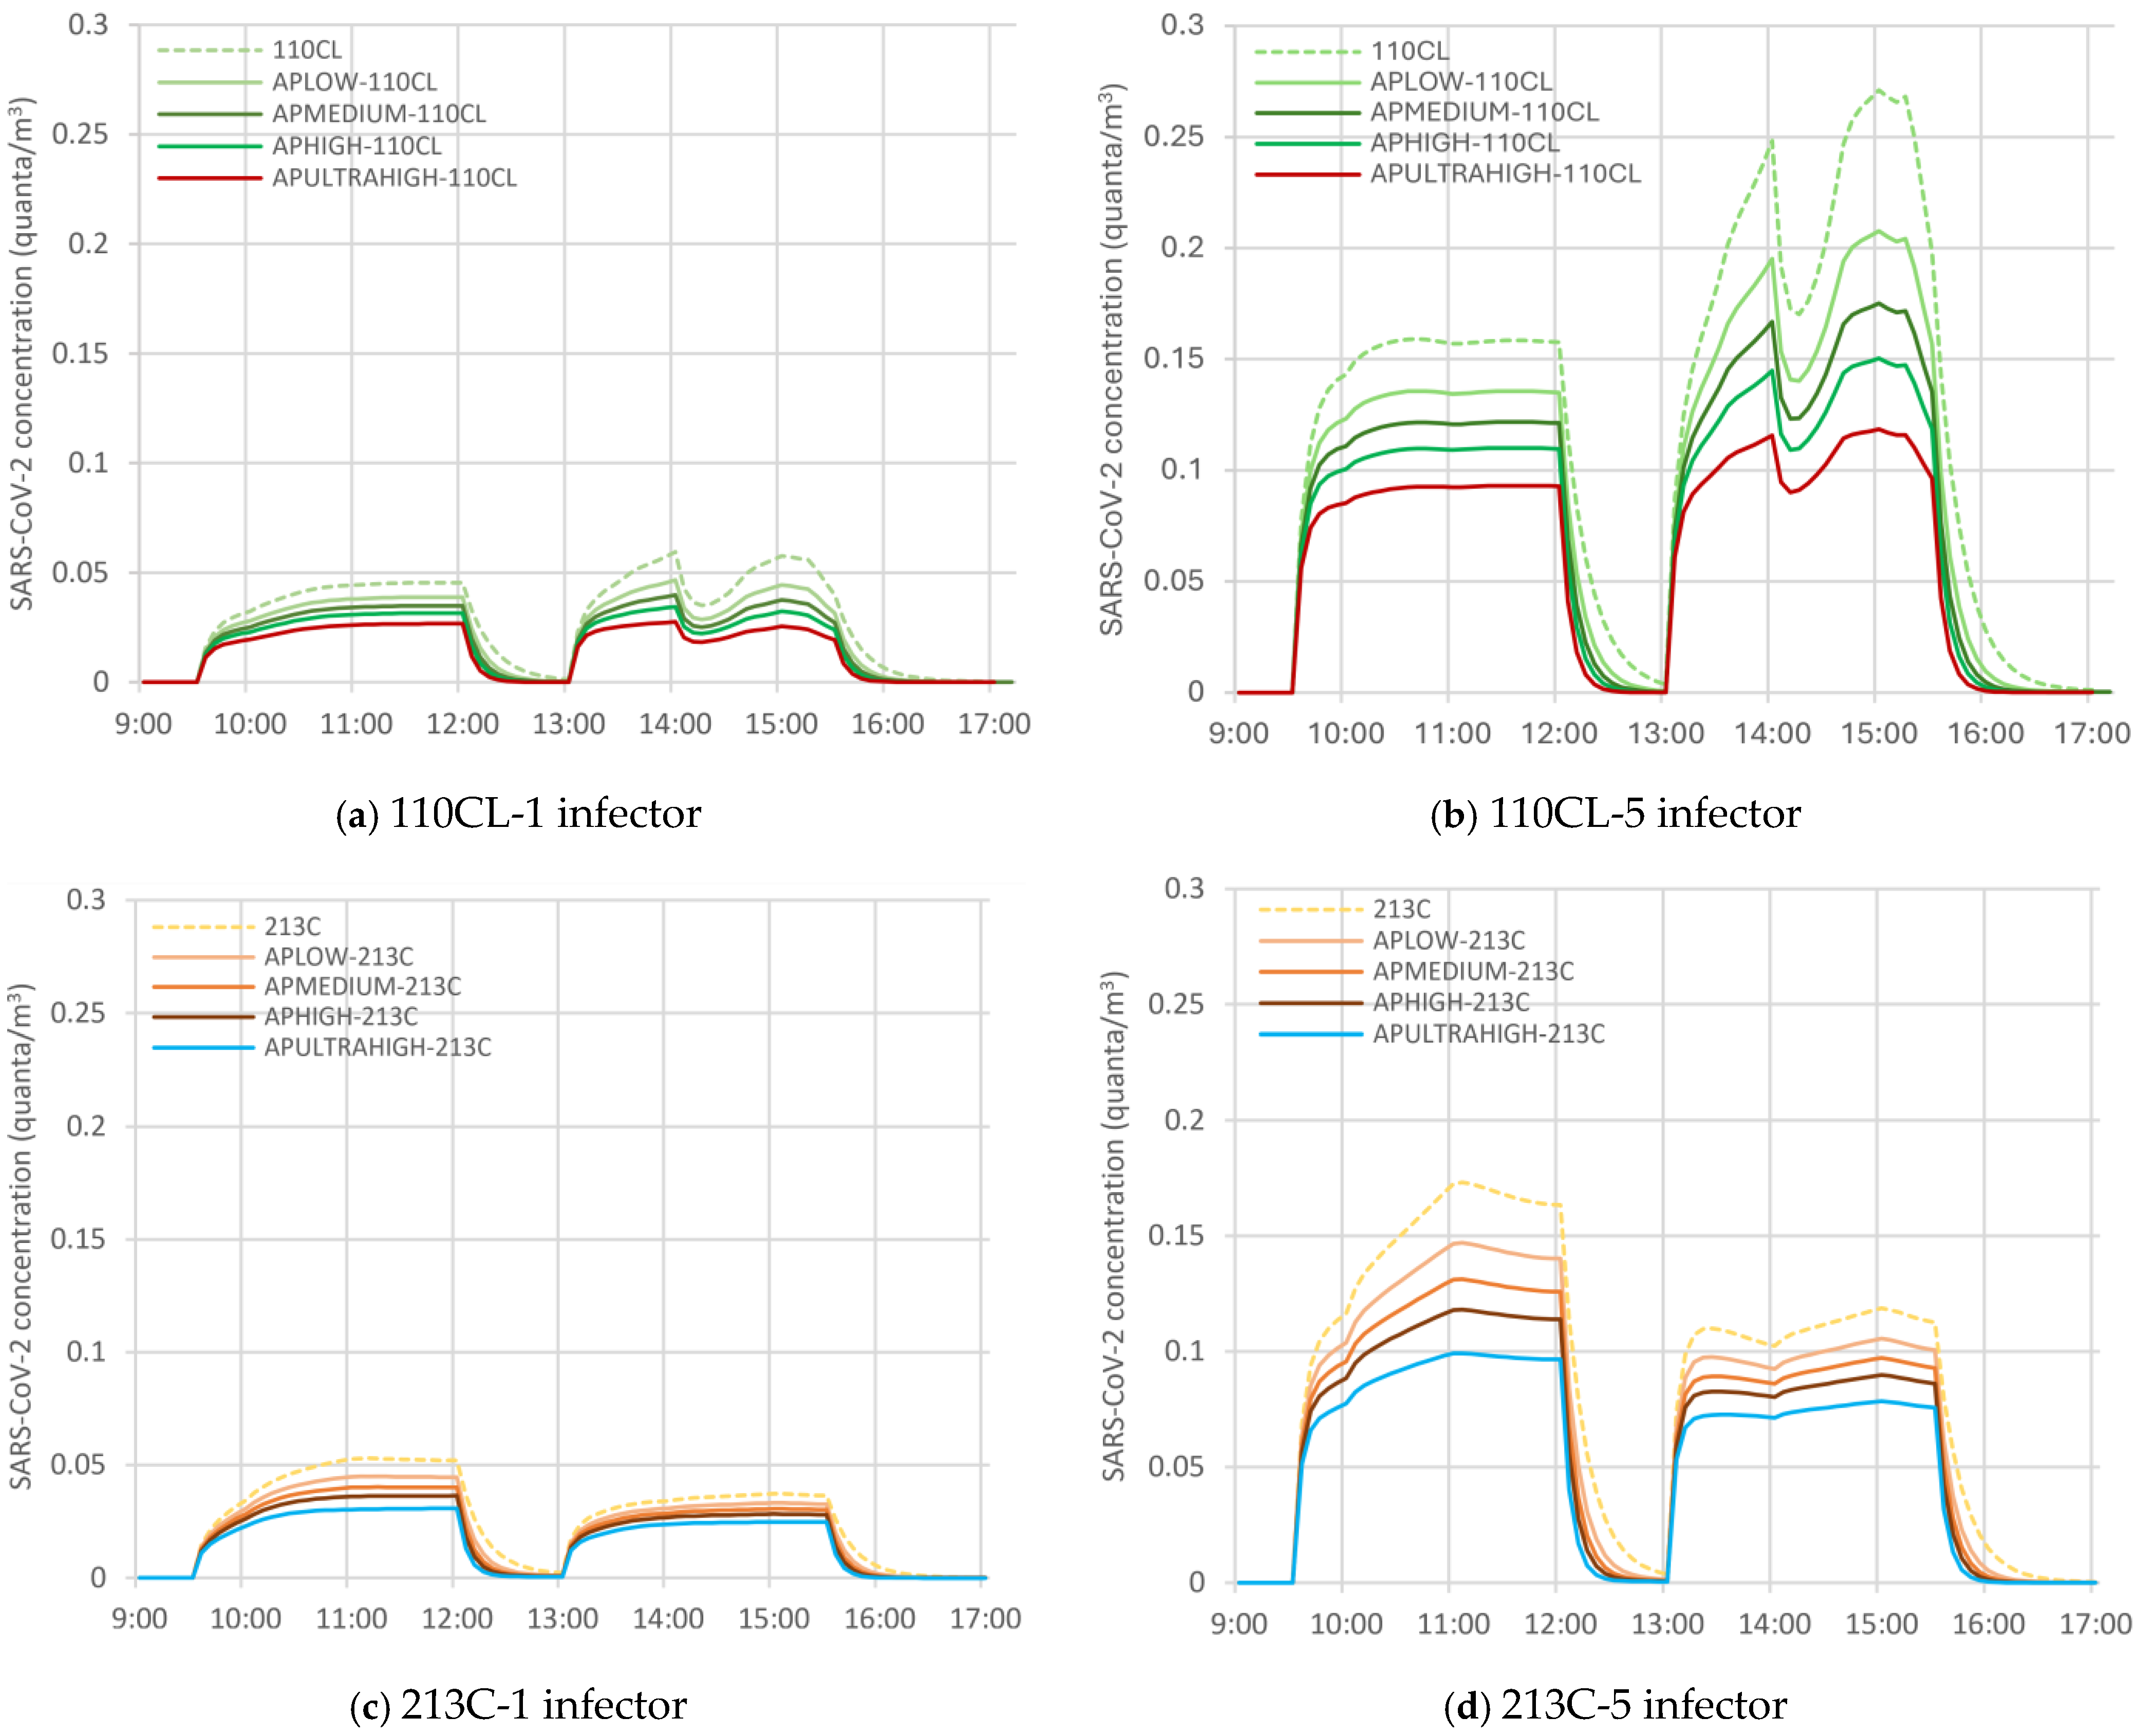
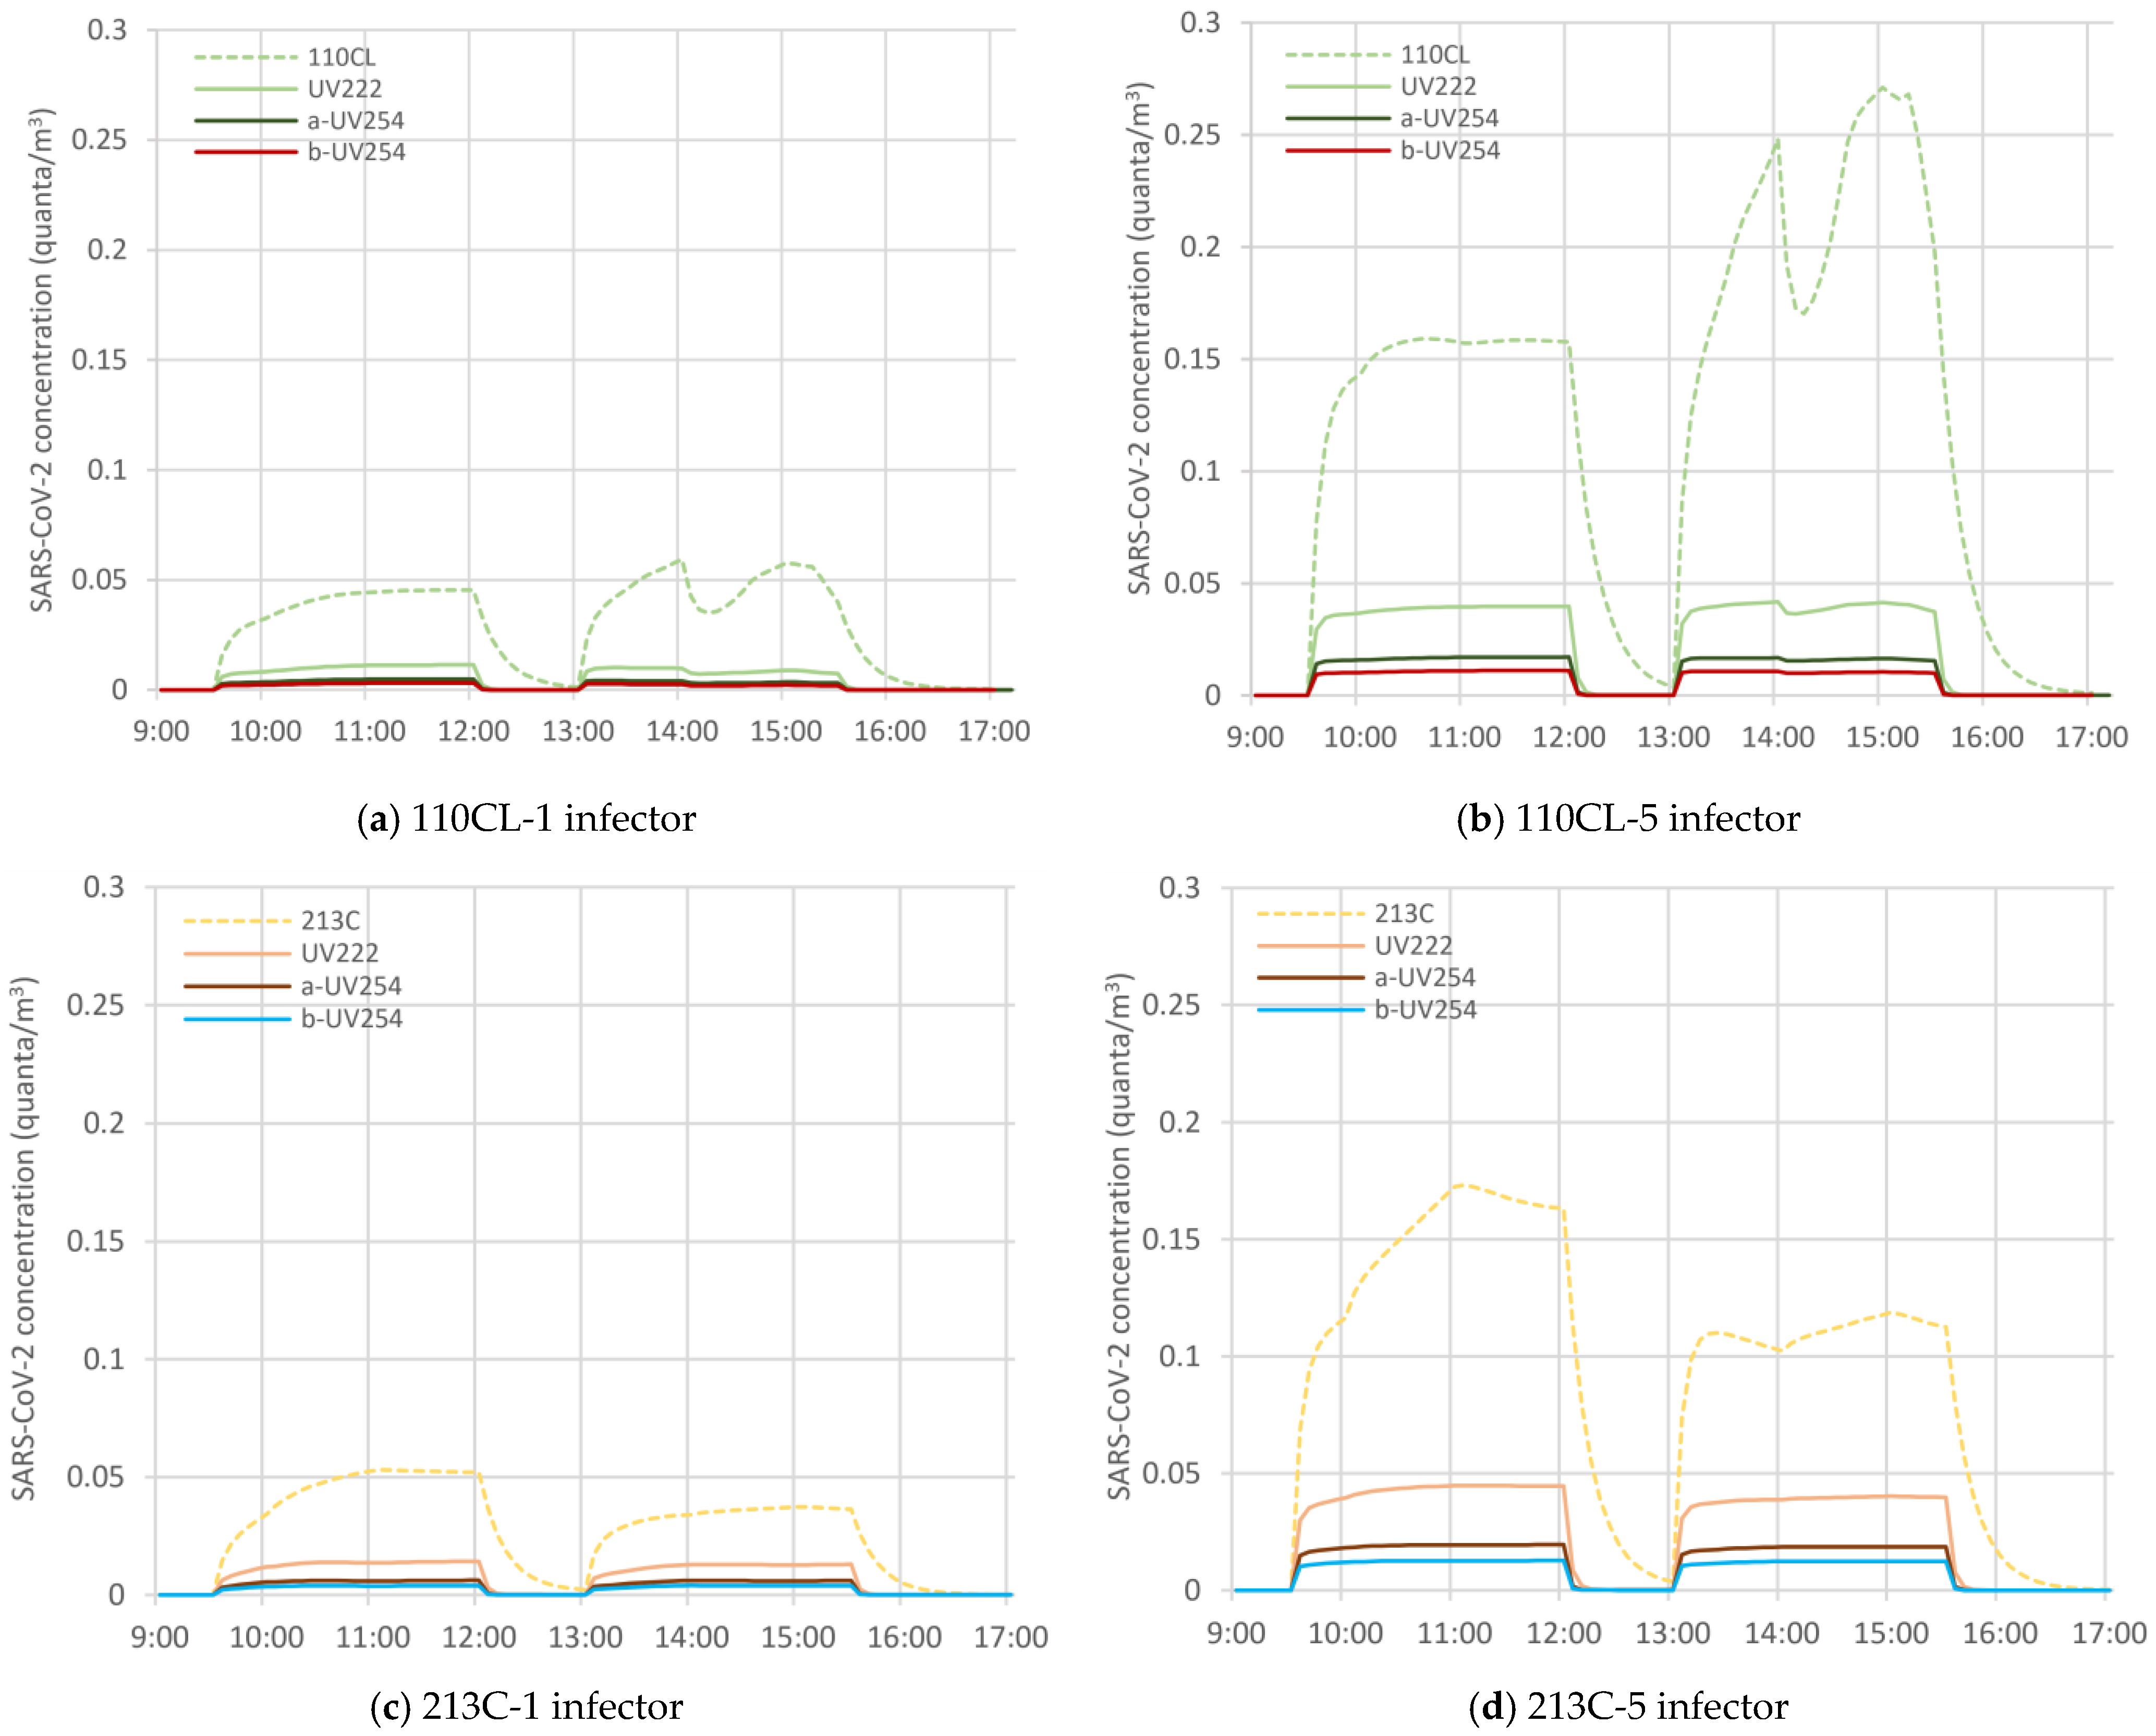
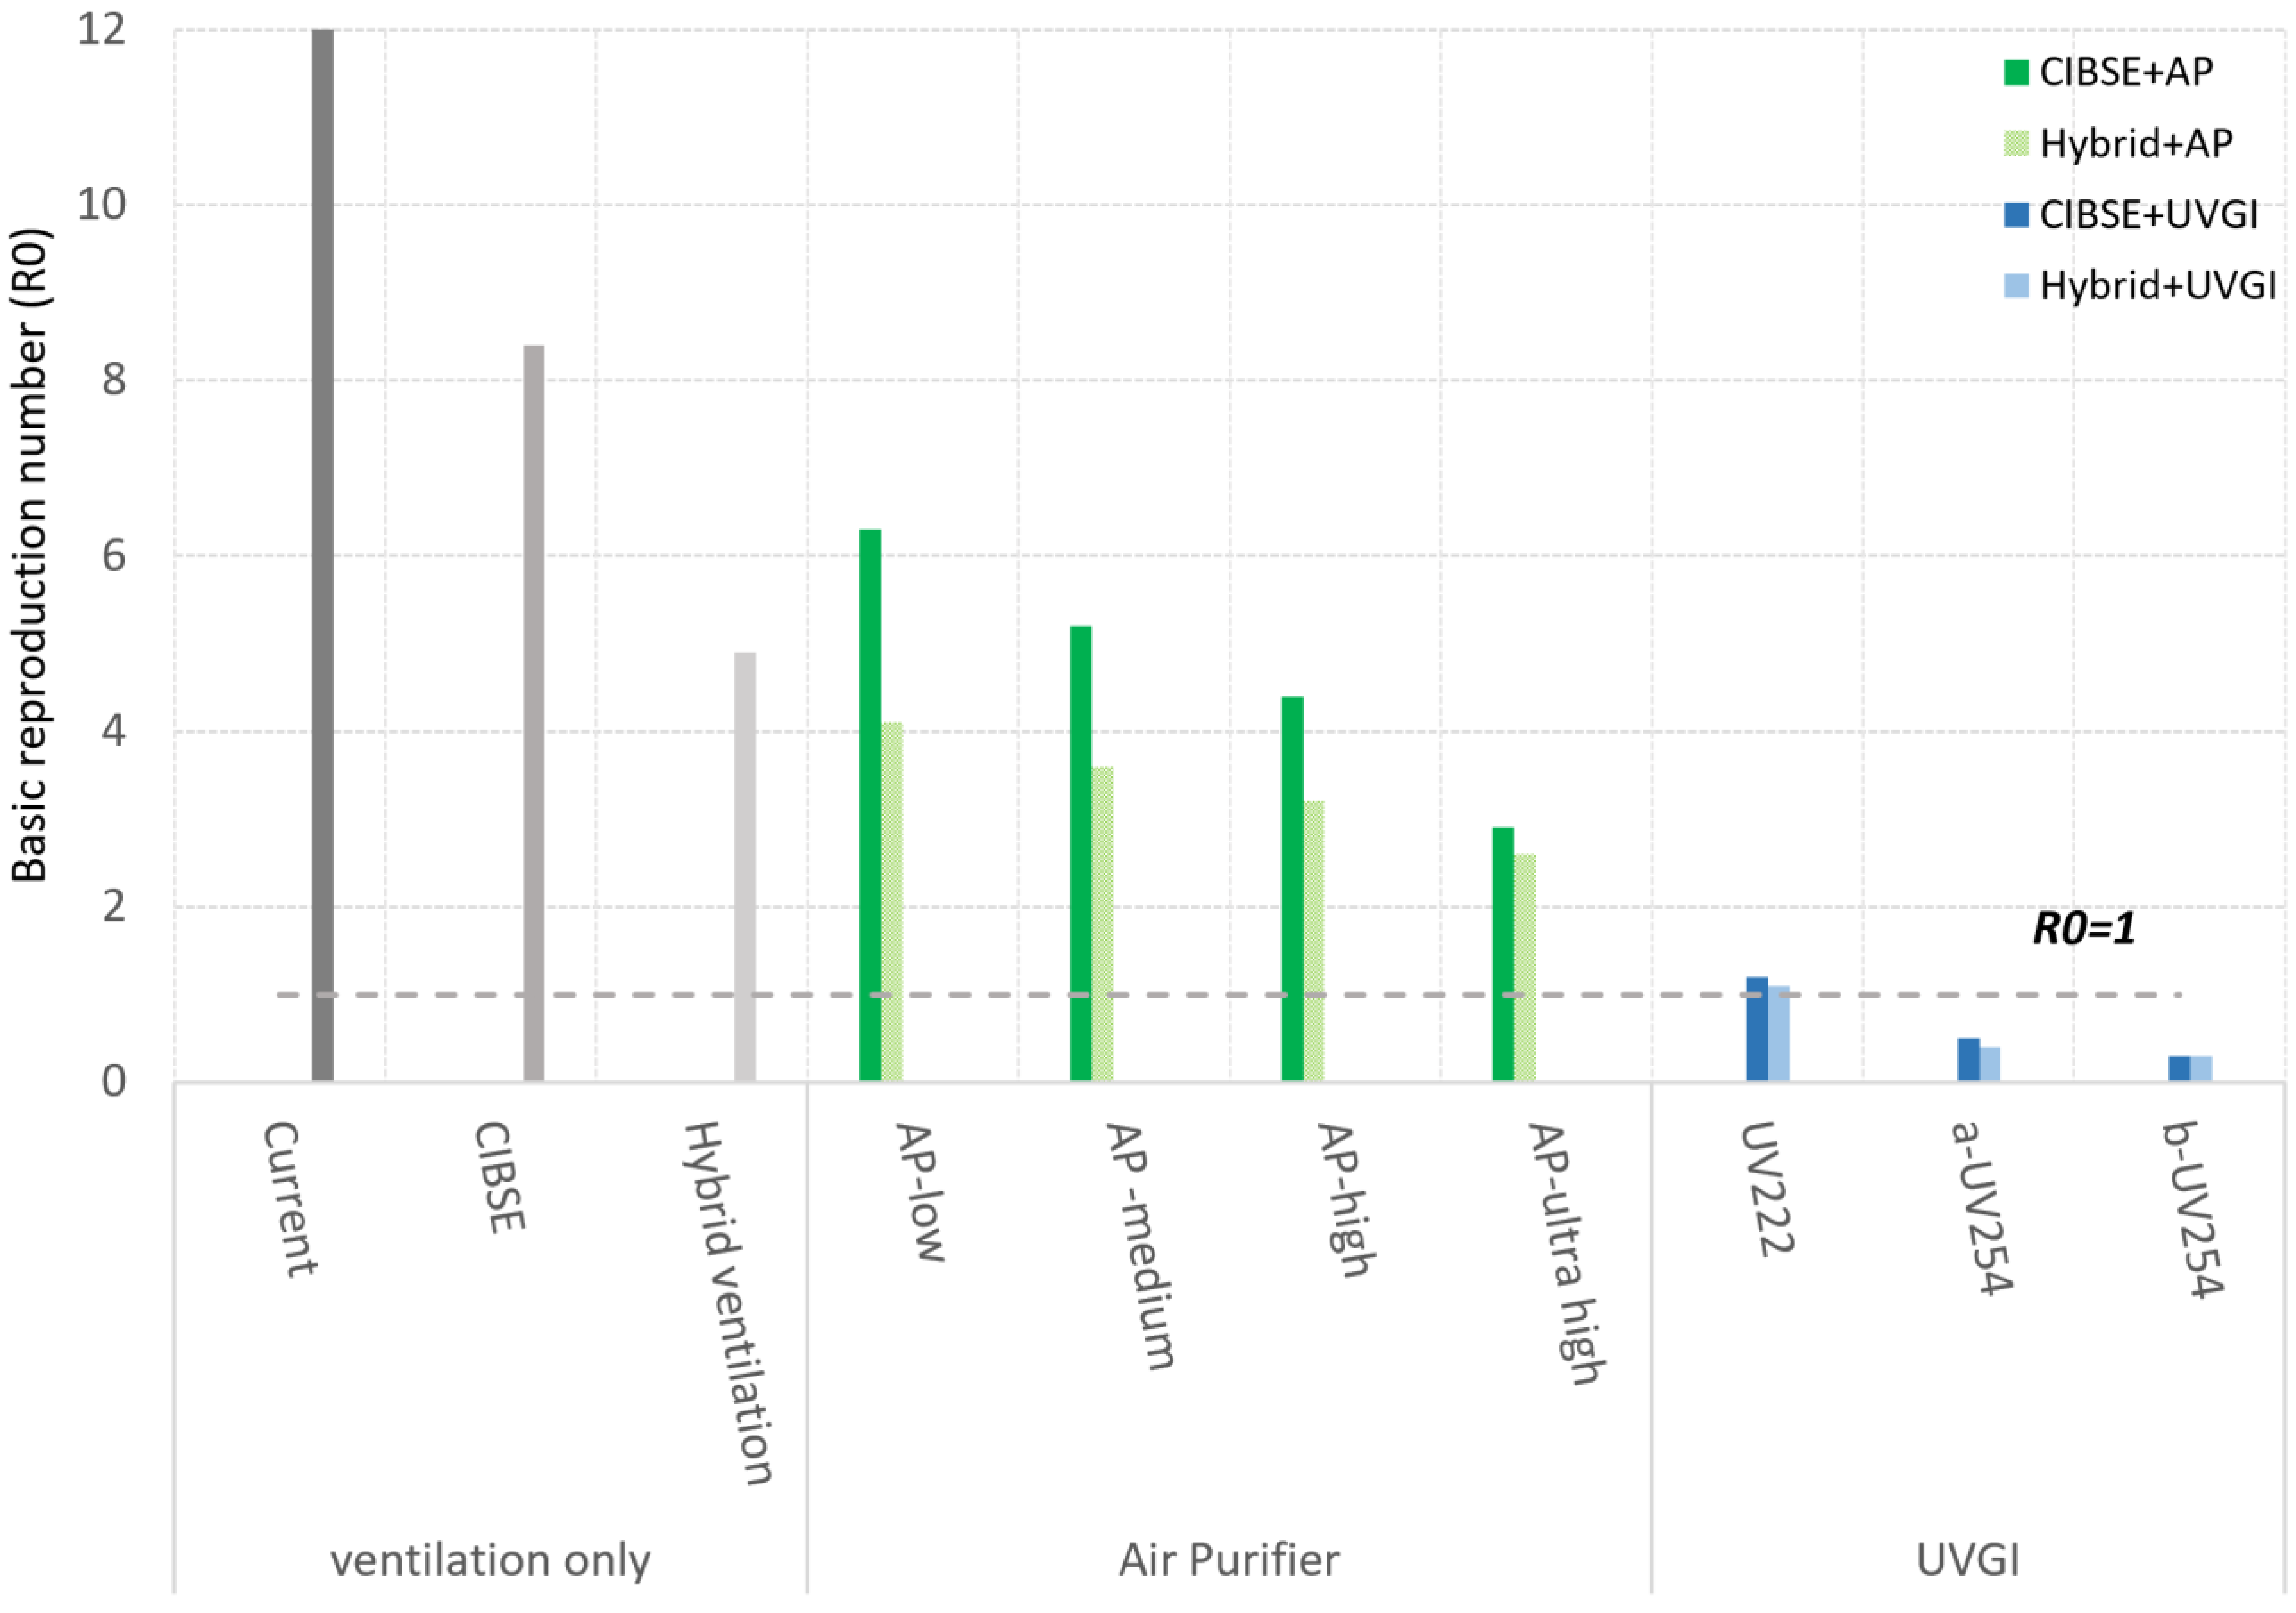
3.1. SARS-CoV-2 Controlling Strategies

A summary of maximum infection probabilities (PI) under various ventilation scenarios is provided in Table 6, focusing on rooms where virus concentration peaks. Since infection risk increases with prolonged exposure, the values presented assume the infector remains in the space for the entire class duration, thereby representing the worst-case exposure scenario.
In the next phase, hybrid ventilation and the mechanical ventilation scenario with CIBSE-recommended rates, were each separately combined with an AP and upper-room UVGI. Figure 5 illustrates the SARS-CoV-2 concentration over 8 h occupied period in two rooms (110CL and 213C) with one and five infectors, after adding four types of APs to the hybrid scenario.
As seen in Figure 5a, in 110CL with one infector, adding APs further reduces the virus concentration compared to the baseline case (hybrid scenario). It can be observed that in the case of one infector, the difference in the reduction in the virus level is relatively close together with different types of APs. When five infectors are present, Figure 5b shows significantly higher viral concentrations without purification, peaking around 0.25 quanta/m3. The spikes in viral concentration are much higher with low-performance purifiers (AP-Low and AP-Medium), especially during high-occupancy periods. The ultra-high purifier almost completely mitigates the spikes, maintaining a consistently low concentration level around 0.1 quanta/m3 in both sessions.
Moreover, Figure 6 shows the effect of adding UVGI lights to hybrid ventilation scenario in rooms 110CL and 213C.
To provide a more comprehensive insight into the performance of various methods, the basic reproduction numbers (R0) values are compared in Figure 7. The goal is to analyze how each intervention impacts the virus’s ability to spread, where an R0 of less than 1 indicates that transmission is under control, while an R0 greater than 1 suggests continued viral spread.
According to Figure 7, the combination of the CIBSE recommendation for mechanical ventilation with air cleaning reduces the R0 to approximately 3 to 6 but is still insufficient to bring the virus spread under control. Hybrid ventilation alone is also not enough to stop the spread of the virus but provides a basis for further improvement when combined with additional interventions like APs or UVGI lights. Both UV254 types nearly eliminate the transmission risk by reducing R0 well below 1, making them the most effective strategy for mitigating viral spread in this scenario.

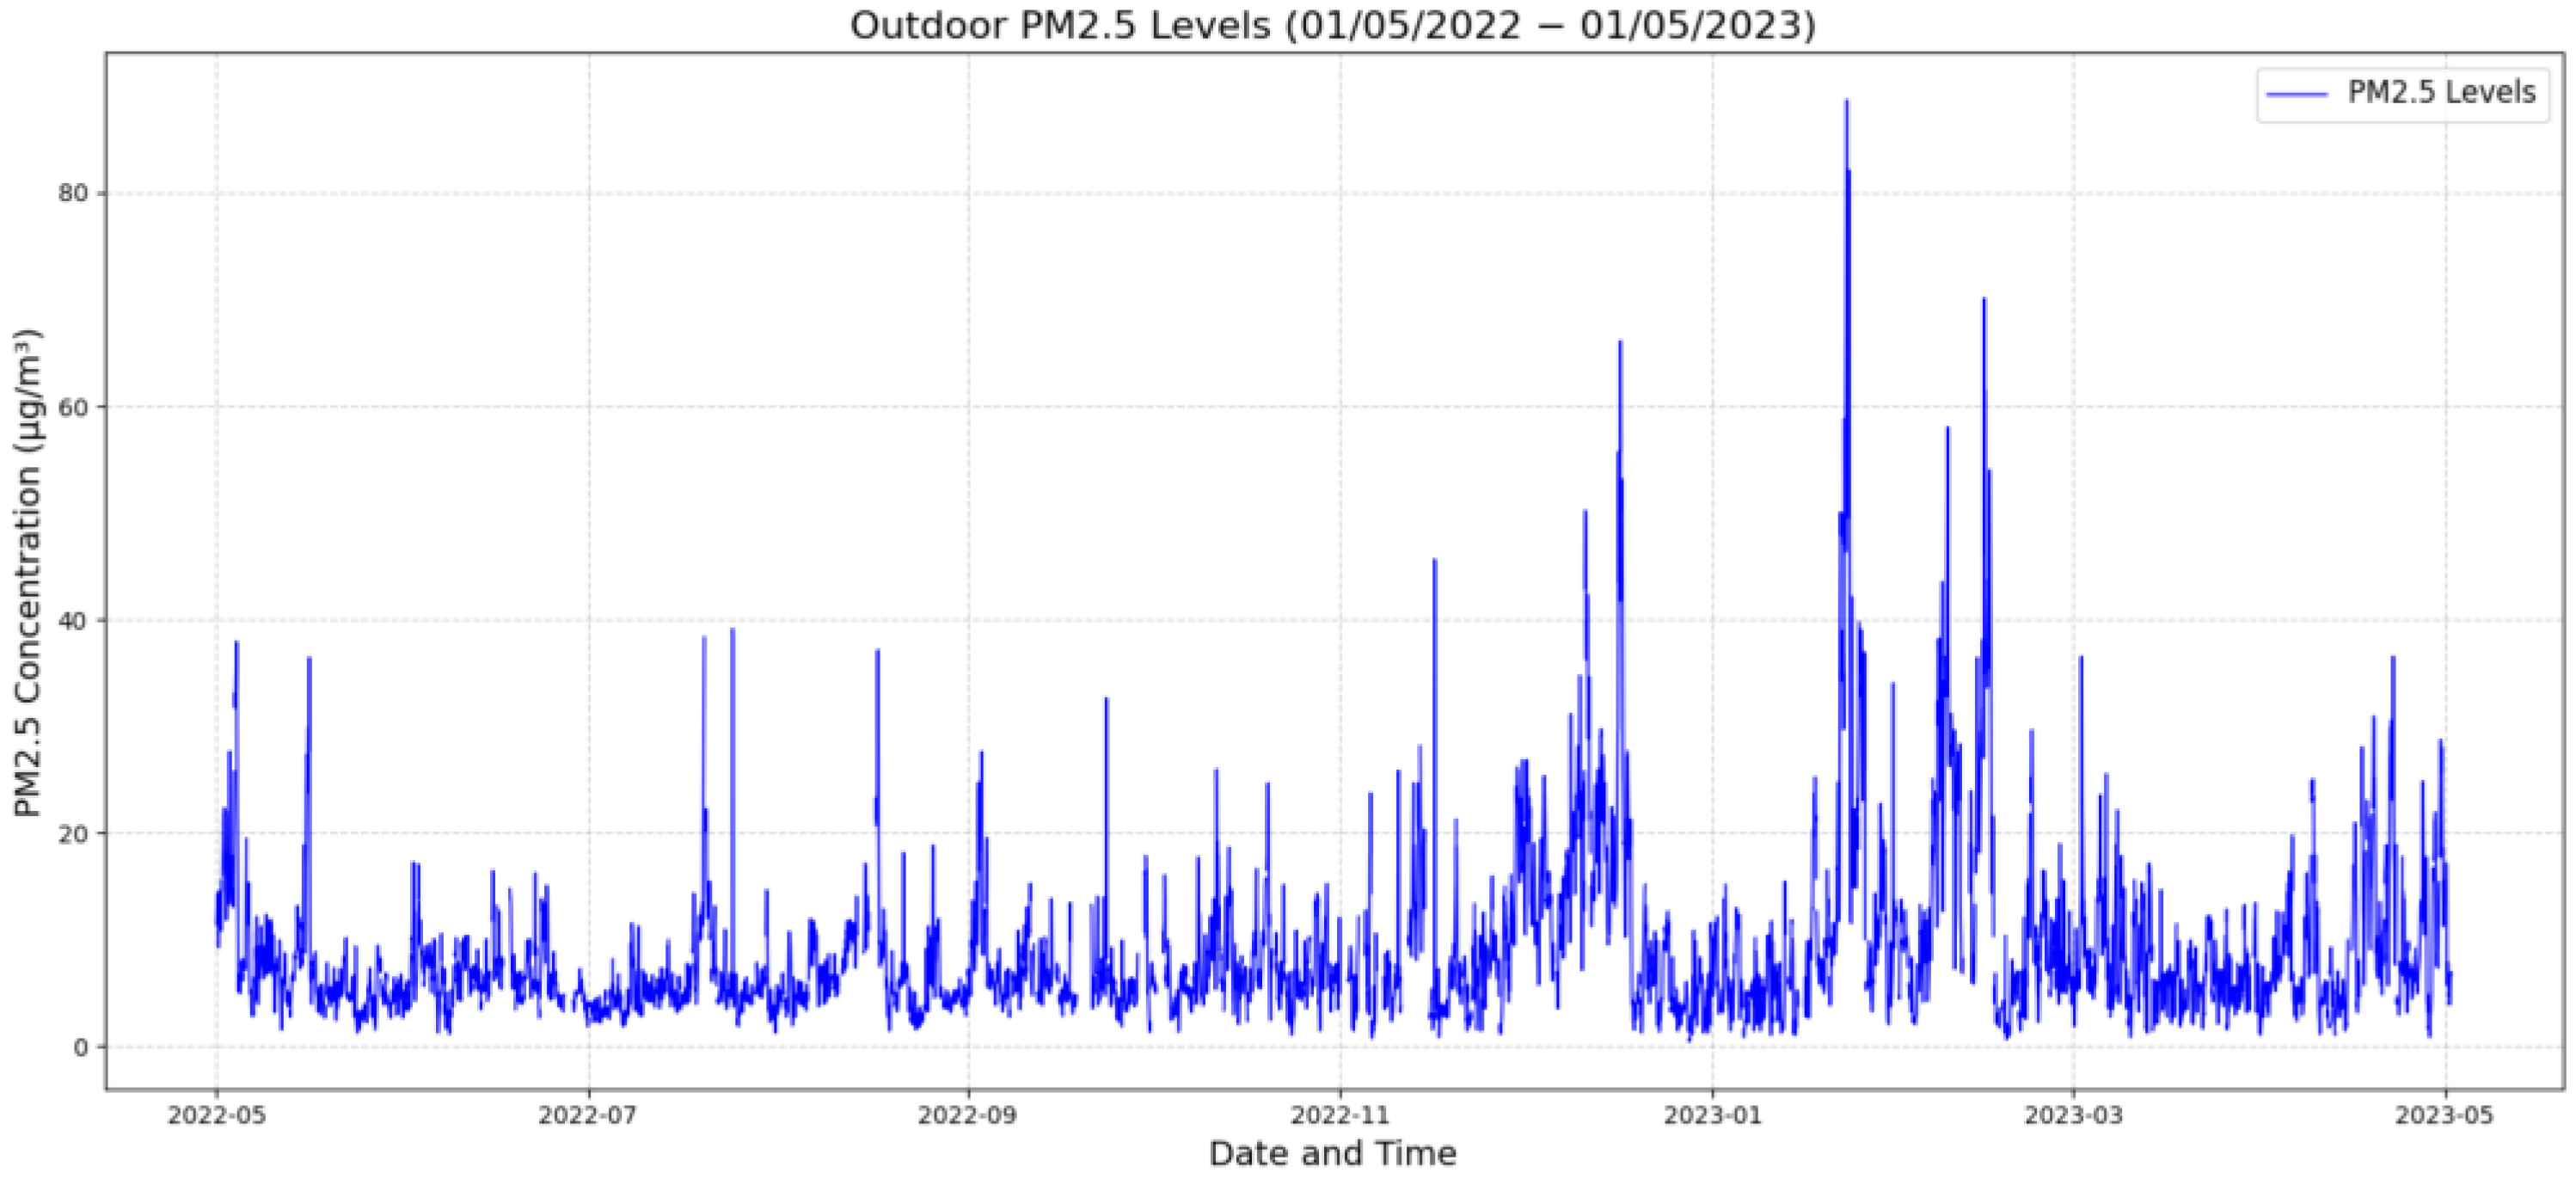
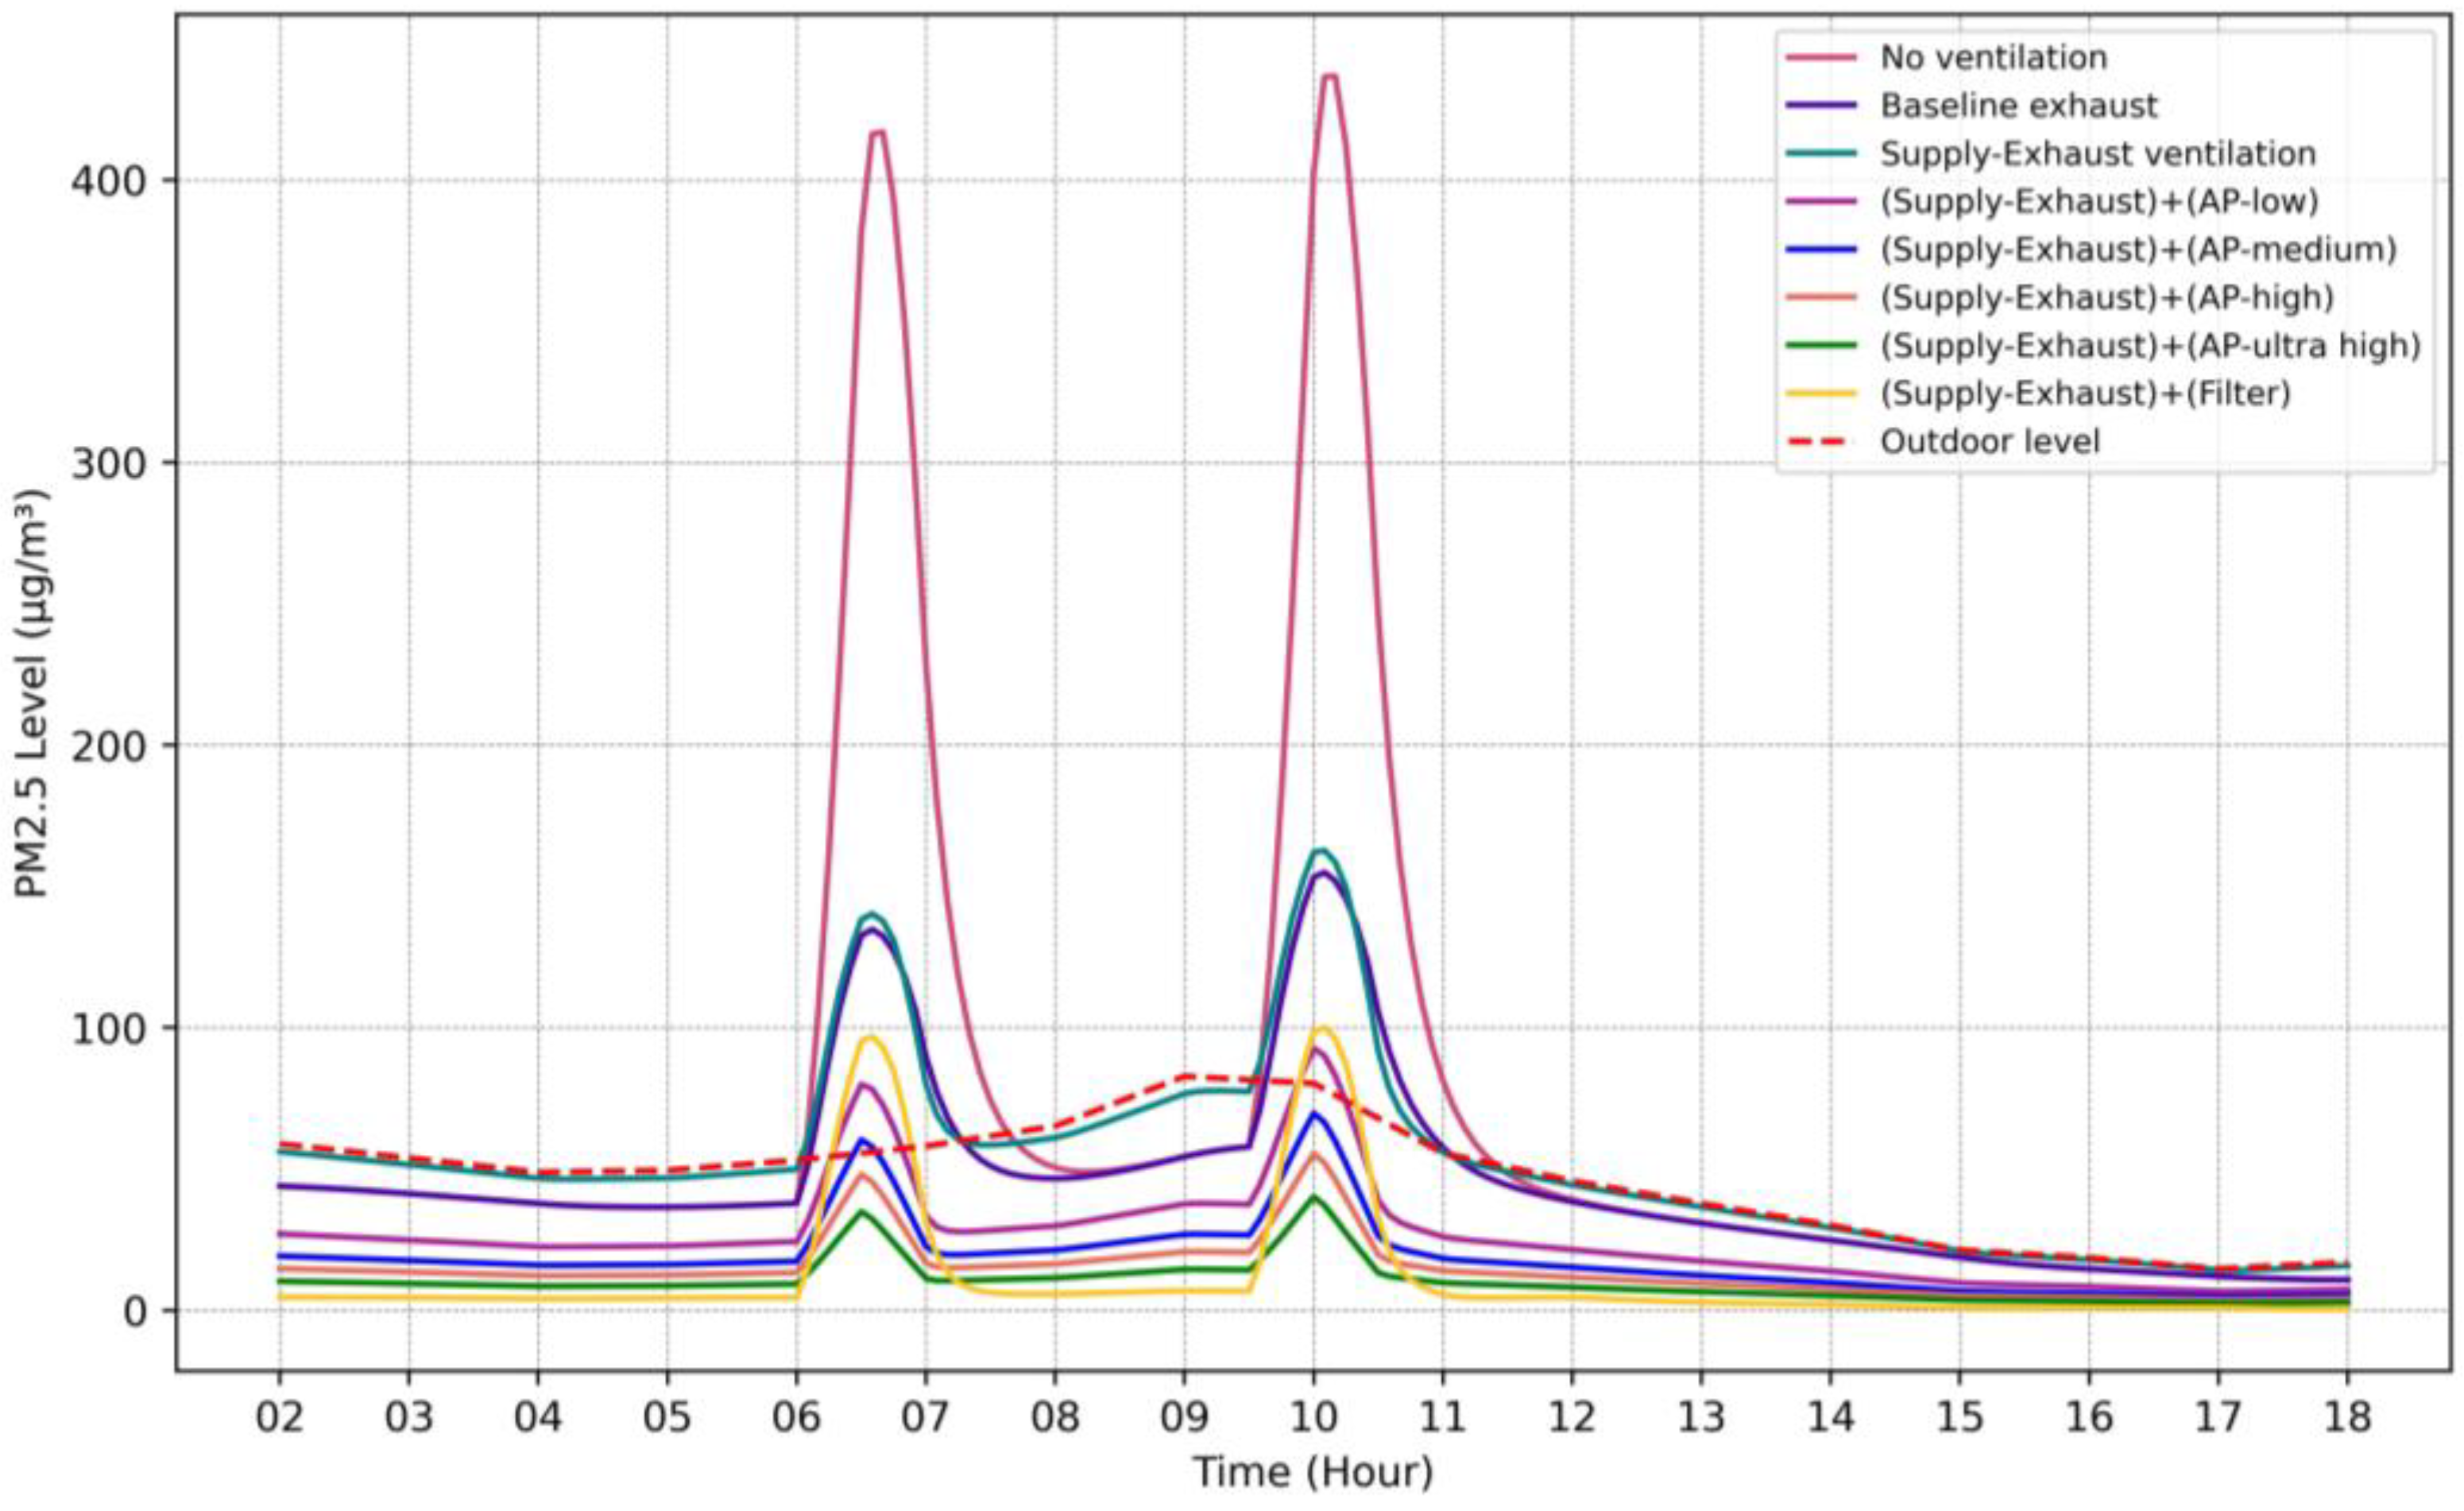
3.2. PM2.5 Controlling Strategies in the Kitchen

While many studies on PM2.5 reduction in indoor environments focus only on indoor sources, this study takes a more comprehensive approach by evaluating PM2.5 levels in the kitchen, considering both indoor and outdoor contributions. Furthermore, the annual and worst-case 24 h levels are both considered.
Table 7 provides a detailed analysis of PM2.5 levels in a year in the kitchen under various ventilation and filtration scenarios. In the worst-case scenario of no ventilation, the mean PM2.5 concentration is 21.98 µg/m3, far exceeding the AQG level of 5 µg/m3. This scenario also has 16.47% of PM2.5 concentrations exceeding 15 µg/m3, highlighting the poor air quality when no ventilation is present. The wide fluctuation in this case (SD = 63.04) is due to cooking activities that generate PM2.5 without any ventilation to remove it.
The day with the highest concentration over the course of a year has been selected to calculate its average PM2.5 level, as shown in Table 8. Additionally, the PM2.5 level under various scenarios on this day is illustrated in Figure 8.

4. Discussion

The paper calculated the transmission risk and basic reproduction number of the SARS-CoV-2 virus under different ventilation cases. Table 9 presents the reduction in the efficacy of mechanical and hybrid ventilation systems in lowering infection probability (PI) as the number of infectors increases from one to five.
The findings demonstrate a 35% reduction in the efficacy of mechanical ventilation when the number of infectors increases to 5, highlighting the need for further actions in extreme conditions. On the other hand, extra window/door openings in the hybrid scenario achieve greater reductions in PI compared to the mechanical ventilation. Moreover, the hybrid system exhibits a smaller decline in performance as the number of infectors increases, with efficacy reductions ranging from 2.5% to 16%.
Furthermore, Table 9 shows that mechanical ventilation delivers consistent performance across different zones, while hybrid ventilation’s performance varies significantly between the two zones. This variability can be attributed to the influence of the window location and orientation, as outdoor airflow through windows is affected by wind direction, which can alter the airflow and, consequently, the effectiveness of hybrid systems.
Based on the results in Figure 5 and Figure 6, UVGI lights generally perform better than APs in maintaining consistently low viral concentrations, especially when multiple infectors are present, which aligns with the results from Li et al. [58]. In these cases, the viral concentration with UVGI lights is kept below 0.05 quanta/m3, or even close to zero during occupied hours, whereas with APs, even the ultra-high model results in concentrations around 0.1 quanta/m3.
The R0 analysis reveals that while both APs and UVGI systems significantly improve the IAQ compared to hybrid and CIBSE-rate cases, UVGI systems are more effective in reducing viral transmission, particularly in extreme conditions with five infectors. UVGI systems consistently bring the R0 below the critical threshold of 1, indicating controlled viral spread even under high-risk scenarios.
However, for scenarios with just one infector, the analysis shows that even the combination of AP-low with hybrid ventilation is sufficient to reduce R0 below 1 across all rooms. This highlights that while UVGI is ideal for high-risk conditions, APs can also be a viable option for lower-risk environments when integrated with hybrid ventilation method. Additionally, in the case of one infector, when APs are used in conjunction with the CIBSE ventilation scenario, where windows and doors remain closed, at least AP-high or AP-ultra high purifiers should be used to keep the R0 below 1 to ensure controlled transmission in these less ventilated environments is achieved.
In the analysis, both annual PM2.5 averages and worst-case 24 h scenarios were considered, and the goal was to align the results with the WHO’s air quality guidelines. The findings revealed that the baseline exhaust scenario reduces PM2.5 levels significantly compared to no ventilation, with a mean of 10.51 µg/m3. While it slightly exceeds interim target 4, which suggests moderate air quality improvements, it still does not meet the AQG target of 5 µg/m3.
Supply–Exhaust ventilation, which combines exhaust with a fresh air supply (OA), results in higher PM2.5 concentrations compared to the exhaust-only scenario because the OA, when unfiltered, introduces additional particulate matter into the indoor environment. This increase in outdoor PM2.5 can worsen the IAQ by adding to the existing indoor pollutant load, especially in areas with high outdoor pollution levels. In other words, while Supply–Exhaust ventilation helps distribute air more evenly throughout the space, the lack of filtration for the incoming fresh air undermines its ability to reduce overall PM2.5 concentrations effectively.
On the other hand, relying only on baseline exhaust is also not an optimal solution. While it may lower indoor PM2.5 levels by removing polluted air, this approach can create very negative pressure in the room. Excessive negative pressure reduces the effectiveness of the exhaust hood by making it difficult for the system to capture pollutants efficiently, as it may pull unfiltered air from surrounding spaces or outdoors.
This study highlighted that combining Supply–Exhaust ventilation with air purification or MERV13 filters is essential for achieving safe IAQ in kitchen environments, ensuring compliance with the WHO standards for both short-term and long-term exposure.
The HEPA air purification scenarios provide varying levels of improvement. As purifier strength increases from low to ultra-high, PM2.5 levels steadily decrease, with mean concentrations ranging from 5.71 µg/m3 (AP-low) to 2.21 µg/m3 (AP-ultra high). This demonstrates the effectiveness of increasing air purification in reducing indoor PM2.5 levels. Additionally, the in-duct MERV13 filtration scenario shows a mean concentration of 4.00 µg/m3, which is slightly higher than AP-ultra high but still lower than AP-low and AP-medium.
Moreover, all of these scenarios meet the AQG level of 5 µg/m3, except for AP-low, which exceeds the AQG slightly but still achieves Interim Target 4 (10 µg/m3). The AP-ultra high and MERV13 scenarios provide the best outcomes, achieving PM2.5 concentrations well below the AQG. AP-medium and AP-high also comfortably meet the AQG level, making them viable solutions.
Furthermore, AP-low has an SD of 8.83 µg/m3, while AP-ultra high has a much lower SD of 3.60 µg/m3. This trend shows that stronger purification not only reduces the mean concentration but also stabilizes air quality, which is critical for maintaining a healthier indoor environment. MERV13 filtration, despite having a mean concentration close to AP-ultra high, has a slightly higher SD of 14.73 µg/m3, suggesting more fluctuations in PM2.5 levels throughout the year.
The most effective solutions identified in this study were the high-strength air purifiers (AP-ultra high) and MERV13 filtration, which brought PM2.5 levels well below WHO guidelines. In these scenarios, the annual average PM2.5 levels fall below 5 µg/m3, with 24 h peaks remaining within safe limits, even during cooking. The AP-ultra high and MERV13 scenarios achieve a 24 h mean of 8.5 µg/m3, demonstrating their ability to control PM2.5 levels effectively throughout the day.

5. Conclusions

The present study aimed to analyze the current (baseline) condition of an educational building in the UK in terms of IAQ and propose strategies to enhance the situation for the health and well-being of occupants by considering SARS-CoV-2 and PM2.5 as the indoor contaminants. The study’s key findings are summarized below:
  • Hybrid ventilation achieves greater PI reductions and maintains better performance as infectors increase compared to mechanical ventilation with only a 2.5–16% drop in efficacy, compared to a 35% drop under mechanical ventilation. This results demonstrates the resilience of hybrid systems in high-risk scenarios and supports their use in buildings where controlling the virus spread under varying conditions is a priority.
  • Upper-room UVGI systems outperformed all other options in high-risk viral scenarios (five infectors) by maintaining R0 consistently below 1. However, in low-risk scenarios (one infector), APs combined with hybrid ventilation were sufficient to reduce the R0 below 1 in all rooms. This shows that while UVGI offers the highest level of control, Aps, especially medium- to high-capacity models, can provide adequate protection in less critical conditions.
  • Mechanical ventilation alone (CIBSE rates) is not sufficient under multiple-infector cases unless combined with high-performance APs or UVGI. This highlights the importance of enhancing ventilation with additional control layers, especially when windows cannot be opened.
  • Supply–Exhaust ventilation introduces unfiltered outdoor air and increases indoor PM2.5 levels especially in polluted areas.
  • Combining Supply–Exhaust ventilation with APs or MERV13 filters is essential for achieving safe PM2.5 levels (<5 µg/m3) and maintaining stable IAQ, even during cooking. These approaches not only met the WHO targets but also reduced daily fluctuations and improved overall air quality consistency. Moreover, AP-medium and AP-high models also achieved acceptable PM2.5 levels and offered a cost-effective alternatives in less polluted conditions.
The current study provided a detailed comparison of multizone IAQ strategies using CONTAM and offered insights into the effectiveness of various interventions in controlling both viral and particle-based indoor pollutants under realistic building operating conditions. However, one of the important identified gaps to guide future research is that the environmental and life cycle cost analysis of upper-room UVGI systems and APs has been rarely studied, despite their importance as key factors in real-world decision-making. While Lee and Bahnfleth [59] investigated the life cycle cost of in-duct UVGI systems over a 15-year economic lifespan, further research is needed to evaluate the life cycle costs of upper-room UVGI systems to provide a comprehensive basis for their selection and implementation. Moreover, the Wells–Riley model is a simplification of real-world airborne transmission. It does not incorporate several dynamic variables, such as variability in individuals’ breathing rates, spatial interactions between occupants, interpersonal distances, or the heterogeneous mixing behavior of infectious aerosols in indoor air.

Author Contributions

A.A., A.B.-J., H.S. and A.J. designed the project; A.A. and H.S. performed the experiments and analyzed the data; A.A. and H.S. wrote and edited the paper; A.B.-J. and A.J. reviewed the paper; A.J. provided building data. All authors have read and agreed to the published version of the manuscript.

Funding

This research received no external funding.

Institutional Review Board Statement

Not applicable.

Informed Consent Statement

Not applicable.

Data Availability Statement

All data generated from this study are available within the text of this manuscript.

Conflicts of Interest

The authors declare no conflicts of interest.

References

  1. WHO. WHO Global Air Quality Guidelines: Particulate Matter (PM2.5 and PM10), Ozone, Nitrogen Dioxide, Sulfur Dioxide and Carbon Monoxide, print version; World Health Organization: Geneva, Switzerland, 2021; pp. 1–273. ISBN 978-92-4-003421-1. [Google Scholar]
  2. Aguilar, A.J.; de la Hoz-Torres, M.L.; Costa, N.; Arezes, P.; Martínez-Aires, M.D.; Ruiz, D.P. Assessment of ventilation rates inside educational buildings in Southwestern Europe: Analysis of implemented strategic measures. J. Build. Eng. 2022, 51, 104204. [Google Scholar] [CrossRef] [PubMed]
  3. Wells, W.F. Airborne Contagion and Air Hygiene: An Ecological Study of Droplet Infections; Commonwealth Fund: Cambridge, MA, USA; Harvard University Press: Cambridge, MA, USA, 1955; 423p. [Google Scholar]
  4. Dai, H.; Zhao, B. Association of the infection probability of COVID-19 with ventilation rates in confined spaces. Build. Simul. 2020, 13, 1321–1327. [Google Scholar] [CrossRef] [PubMed]
  5. Iwamura, N.; Tsutsumi, K. SARS-CoV-2 airborne infection probability estimated by using indoor carbon dioxide. Environ. Sci. Pollut. Res. 2023, 30, 79227–79240. [Google Scholar] [CrossRef]
  6. Biasin, M.; Bianco, A.; Pareschi, G.; Cavalleri, A.; Cavatorta, C.; Fenizia, C.; Galli, P.; Lessio, L.; Lualdi, M.; Tombetti, E.; et al. UV-C irradiation is highly effective in inactivating SARS-CoV-2 replication. Sci. Rep. 2021, 11, 6260. [Google Scholar] [CrossRef]
  7. Kowalski, W.J. Ultraviolet Germicidal Irradiation Handbook: UVGI for Air and Surface Disinfection; Springer: New York, NY, USA, 2009. [Google Scholar]
  8. Riley, R.L.; Nardell, E.A. Clearing the air: The theory and application of ultraviolet air disinfection. Am. Rev. Respir. Dis. 1990, 142, 1233–1234. [Google Scholar] [CrossRef]
  9. Cui, H. Quantitative Microbial risk Assessment for Airborne transmission of SARS-CoV-2 And the efficacy of Ultraviolet Germicidal Irradiation (UVGI) Systems. Master’s Thesis, Purdue University, West Lafayette, IN, USA, 2022. [Google Scholar]
  10. Park, S.; Mistrick, R.; Rim, D. Performance of upper-room ultraviolet germicidal irradiation (UVGI) system in learning environments: Effects of ventilation rate, UV fluence rate, and UV radiating volume. Sustain. Cities Soc. 2022, 85, 104048. [Google Scholar] [CrossRef]
  11. Yan, S.; Wang, L.; Birnkrant, M.J.; Zhai, Z.; Miller, S.L. Multizone Modeling of Airborne SARS-CoV-2 Quanta Transmission and infection Mitigation Strategies in Office, Hotel, Retail, and School Buildings. Buildings 2023, 13, 102. [Google Scholar] [CrossRef]
  12. Emmerich, S.J.; Hirnikel, D. Validation of multizone IAQ modeling of residential-scale buildings: A review. Ashrae Trans. 2001, 107, 619–628. [Google Scholar]
  13. Shrestha, P.; DeGraw, J.W.; Zhang, M.; Liu, X. Multizonal modeling of SARS-CoV-2 aerosol dispersion in a virtual office building. Build Environ. 2021, 206, 108347. [Google Scholar] [CrossRef]
  14. Noakes, C.J.; Beggs, C.B.; Sleigh, P.A. Effect of room mixing and ventilation strategy on the performance of upper room ultraviolet germicidal irradiation systems. Proc. Ashrae Iaq. 2004, 1–13. [Google Scholar]
  15. Lau, J.; Bahnfleth, W.; Freihaut, J. Estimating the effects of ambient conditions on the performance of UVGI air cleaners. Build Environ. 2009, 44, 1362–1370. [Google Scholar] [CrossRef]
  16. Abhijith, K.V.; Kukadia, V.; Kumar, P. Investigation of air pollution mitigation measures, ventilation, and indoor air quality at three schools in London. Atmos. Environ. 2022, 289, 119303. [Google Scholar] [CrossRef]
  17. Rawat, N.; Kumar, P. Interventions for improving indoor and outdoor air quality in and around schools. Sci. Total Environ. 2023, 858, 159813. [Google Scholar] [CrossRef] [PubMed]
  18. Lyu, J.; Shi, Y.; Chen, C.; Zhang, X.; Chu, W.; Lian, Z. Characteristics of PM2.5 emissions from six types of commercial cooking in Chinese cities and their health effects. Environ. Pollut. 2022, 313, 120180. [Google Scholar] [CrossRef] [PubMed]
  19. Kang, K.; Kim, H.; Kim, D.D.; Lee, Y.G.; Kim, T. Characteristics of cooking-generated PM 10 and PM 2.5 in residential buildings with different cooking and ventilation types. Sci. Total Environ. 2019, 668, 56–66. [Google Scholar] [CrossRef]
  20. Ng, L.C.; Musser, A.; Persily, A.K.; Emmerich, S.J. Airflow and Indoor Air Quality Models of DOE Reference Commercial Buildings; NIST Technical Note 2072; National Institute of Standards and Technology: Gaithersburg, MD, USA, 2019; 135p. [Google Scholar] [CrossRef]
  21. Riley, E.C.; Murphy, G.; Riley, R.L. Airborne spread of measles in a suburban elementary school. Am. J. Epidemiol. 1978, 107, 421–432. [Google Scholar] [CrossRef]
  22. Yan, S.; Wang, L.; Birnkrant, M.J.; Zhai, J.; Miller, S.L. Evaluating SARS-CoV-2 airborne quanta transmission and exposure risk in a mechanically ventilated multizone office building. Build. Environ. 2022, 219, 109184. [Google Scholar] [CrossRef]
  23. Dols, W.S.; Polidoro, B.J.; Poppendieck, D.; Emmerich, S.J. A Tool to Model the Fate and Transport of indoor Microbiological Aerosols (FaTIMA); NIST Technical Note 2095; National Institute of Standards and Technology: Gaithersburg, MD, USA, 2020; 32p. [Google Scholar] [CrossRef]
  24. Moreno, T.; Pintó, R.M.; Bosch, A.; Moreno, N.; Alastuey, A.; Minguillón, M.C.; Anfruns-Estrada, E.; Guix, S.; Fuentes, C.; Buonanno, G.; et al. Tracing surface and airborne SARS-CoV-2 RNA inside public buses and subway trains. Environ. Int. 2021, 147, 106326. [Google Scholar] [CrossRef]
  25. Rudnick, S.N.; Milton, D.K. Risk of indoor airborne infection transmission estimated from carbon dioxide concentration. Indoor Air 2003, 13, 237–245. [Google Scholar] [CrossRef]
  26. Polichetti, G.; Cocco, S.; Spinali, A.; Trimarco, V.; Nunziata, A. Effects of particulate matter (PM10, PM2.5 and PM1) on the cardiovascular system. Toxicology 2009, 261, 1–8. Available online: https://www.sciencedirect.com/science/article/abs/pii/S0300483X09002121 (accessed on 25 May 2025). [CrossRef]
  27. Singer, B.C.; Delp, W.W.; Price, P.N.; Apte, M.G. Performance of installed cooking exhaust devices. Indoor Air 2012, 22, 222–234. [Google Scholar] [CrossRef] [PubMed]
  28. Li, Y.; Delsante, A.; Symons, J. Derivation of capture efficiency of kitchen range hoods in a confined space. Build. Environ. 1996, 31, 461–468. [Google Scholar] [CrossRef]
  29. Lunden, M.M.; Delp, W.W.; Singer, B.C. Capture efficiency of cooking—Related fine and ultrafine particles by residential exhaust. Indoor Air. 2015, 25, 45–58. [Google Scholar] [CrossRef] [PubMed]
  30. CIBSE. Environmental Design, CIBSE Guide A; CIBSE: London, UK, 2021; ISBN 978-1-906846-55-8. [Google Scholar]
  31. HM Government. The Building Regulations 2010. The Building Regulations 2010 For England and Wales, Part F; HM Government: London, UK, 2013.
  32. Underhill, L.J.; Milando, C.W.; Levy, J.I.; Dols, W.S.; Lee, S.K.; Fabian, M.P. Simulation of indoor and outdoor air quality and health impacts following installation of energy-efficient retrofits in a multifamily housing unit. Build. Environ. 2020, 170, 106507. [Google Scholar] [CrossRef]
  33. Shrubsole, C.; Ridley Biddulph, P.; Milner, J.; Vardoulakis, S.; Ucci, M.; Wilkinson, P.; Chalabi, Z.; Davies, M. Indoor PM 2.5 exposure in London’s domestic stock: Modelling current and future exposures following energy efficient refurbishment. Atmos. Environ. 2012, 62, 336–343. [Google Scholar] [CrossRef]
  34. Abbaspour, A.; Bahadori-jahromi, A.; Janbey, A.; Godfrey, P.B.; Amirkhani, S. Enhancing indoor Air Quality and Regulatory Compliance: Ann-Depth Comparative Study on Ventilation Strategies and Their impact on SARS-CoV-2 Transmission Risk. Sustainability 2023, 16, 271. [Google Scholar] [CrossRef]
  35. Buonanno, G.; Stabile, L.; Morawska, L. Estimation of airborne viral emission: Quanta emission rate of SARS-CoV-2 for infection risk assessment. Environ. Int. 2020, 141, 105794. [Google Scholar] [CrossRef]
  36. Bazant, M.Z.; Bush, J.W.M. A guideline to limit indoor airborne transmission of COVID-19. Proc. Natl. Acad. Sci. USA 2021, 118, e2018995118. [Google Scholar] [CrossRef]
  37. Doremalen Nvan Bushmaker, T.; Morris, D.H.; Holbrook, M.G.; Gamble, A.; Williamson, B.N.; Tamin, A.; Harcourt, J.L.; Thornburg, N.J.; Gerber, S.I.; LloydSmith, J.O.; et al. Aerosol and surface stability of SARS-CoV-2 as compared with SARS-CoV-1. N. Engl. J. Med. 2020, 382, 1564–1567. [Google Scholar] [CrossRef]
  38. Fabian, P.; Adamkiewicz, G.; Levy, J.I. Simulating indoor concentrations of NO2 and PM2.5 in multifamily housing for use in health—Based intervention modeling. Indoor Air. 2012, 22, 12–23. [Google Scholar]
  39. Tran, D.T.; Alleman, L.Y.; Coddeville, P.; Galloo, J.C. Indoor and Built Indoor particle dynamics in schools: Determination of air exchange rate, size-resolved particle deposit rate and penetration factor in real-life conditions. Indoor Built Environ. 2017, 26, 1335–1350. [Google Scholar] [CrossRef]
  40. Schuit, M.A.; Larason, T.C.; Krause, M.L.; Green, B.M.; Holland, B.P.; Wood, S.P.; Grantham, S.; Zong, Y.; Zarobila, C.J.; Freeburger, D.L.; et al. SARS-CoV-2 inactivation by ultraviolet radiation and visible light is dependent on wavelength and sample matrix. J. Photochem. Photobiol. B Biol. 2022, 233, 112503. [Google Scholar] [CrossRef] [PubMed]
  41. Walker, C.M.; Ko, G. Effect of ultraviolet germicidal irradiation on viral aerosols. Environ. Sci. Technol. 2007, 41, 5460–5465. [Google Scholar] [CrossRef]
  42. Beggs, C.B.; Avital, E.J. Upper-room ultraviolet air disinfection might help to reduce COVID-19 transmission in buildings: A feasibility study. Peer J. 2020, 8, e10196. [Google Scholar] [CrossRef]
  43. Centers for Disease Control and Prevention. Environmental Control for Tuberculosis: Basic Upper-Room Ultraviolet Germicidal Irradiation Guidelines for Healthcare Settings; Centers for Disease Control and Prevention: Cincinnati, OH, USA, 2009; p. 87. Available online: http://www.cdc.gov/niosh/docs/2009-105/ (accessed on 20 December 2024).
  44. Buonanno, M.; Randers-Pehrson, G.; Bigelow, A.W.; Trivedi, S.; Lowy, F.D.; Spotnitz, H.M.; Hammer, S.M.; Brenner, D.J. 207-nm UV Light—A Promising Tool for Safe Low-Cost Reduction of Surgical Site Infections. I: In Vitro Studies. PLoS ONE 2013, 8, e76968. [Google Scholar] [CrossRef]
  45. Blatchley, E.R.; Brenner, D.J.; Claus, H.; Cowan, T.E.; Linden, K.G.; Liu, Y.; Mao, T.; Park, S.J.; Piper, P.J.; Simons, R.M.; et al. Far UV-C radiation: An emerging tool for pandemic control. Crit. Rev. Environ. Sci. Technol. 2023, 53, 733–753. [Google Scholar] [CrossRef]
  46. ACGIH. 2021 TLVs and BEIs: Based on the Documentation of the Threshold Limit Values for Chemical and Physical Agents & Biological Exposure Indices; Ansi/Ashrae: Atlanta, GA, USA, 2019. [Google Scholar]
  47. ANSI/ASHRAE Standard 55; Thermal Environmental Conditions for Human Occupancy. ANSI/ASHRAE: Atlanta, GA, USA, 2017; Volume 7. p. 60.
  48. Santarpia, J.L.; Herrera, V.L.; Rivera, D.N.; Ratnesar-Shumate, S.; Reid, S.P.; Ackerman, D.N.; Denton, P.W.; Martens, J.W.S.; Fang, Y.; Conoan, N.; et al. The size and culture ability of patient generated SARS-CoV2 aerosol. J. Expo. Sci. Environ. Epidemiol. 2021, 32, 706–711. [Google Scholar] [CrossRef]
  49. Lee, B.U. Minimum sizes of respiratory particles carrying SARS-CoV-2 and the possibility of aerosol generation. Int. J. Environ. Res. Publ. Health 2020, 17, 6960. [Google Scholar] [CrossRef]
  50. Santarpia, J.L.; Rivera, D.N.; Herrera, V.L.; Morwitzer, M.J.; Creager, H.M.; Santarpia, G.W.; Crown, K.K.; Brett-Major, D.M.; Schnaubelt, E.R.; Broadhurst, M.J.; et al. Aerosol and surface contamination of SARS-CoV-2 observed in quarantine and isolation care. Sci. Rep. 2020, 10, 12732. [Google Scholar] [CrossRef]
  51. Lednicky, J.A.; Lauzardo, M.; Alam, M.M.; Elbadry, M.A.; Stephenson, C.J.; Gibson, J.C.; Morris, J.G. Isolation of SARS-CoV-2 from the air in a car driven by a COVID patient with mild illness. Int. J. Infect. Dis. 2021, 108, 212–216. [Google Scholar] [CrossRef]
  52. Mallach, G.; Kasloff, S.B.; Kovesi, T.; Kumar, A.; Kulka, R.; Krishnan, J.; Robert, B.; McGuinty, M.; Otter-Moore Sden Yazji, B.; Cutts, T. Aerosol SARS-CoV-2 in hospitals and long-term care homes during the COVID-19 pandemic. PLoS ONE 2021, 16, e0258151. [Google Scholar] [CrossRef] [PubMed]
  53. Justo Alonso, M.; Dols, W.S.; Mathisen, H.M. Using Co-simulation between Energy Plus and CONTAM to evaluate recirculation-based, demand-controlled ventilation strategies in an office building. Build. Environ. 2022, 211, 108737. [Google Scholar] [CrossRef]
  54. Abbaspour, A.; Bahadori-jahromi, A.; Mylona, A.; Janbey, A.; Godfrey, P.B. Mitigation of airborne contaminants dispersion in and educational building and investigate its impacts on indoor air quality and energy performance. Eng. Futur. Sustain. 2023, 1. [Google Scholar] [CrossRef]
  55. Brager, G.; Borgeson, S.; Lee, Y. Summary Report: Control Strategies for Mixed-Mode Buildings. 207AD. Available online: https://escholarship.org/uc/item/8kp8352h (accessed on 10 January 2025).
  56. Brager, G. Mixed-Mode Cooling; Oxford University Press: Oxford, UK, 2006; p. 8. [Google Scholar]
  57. Peng, Y.; Lei, Y.; Tekler, Z.D.; Antanuri, N.; Lau, S.K.; Chong, A. Hybrid system controls of natural ventilation and HVAC in mixed-mode buildings: A comprehensive review. Energy Build. 2022, 276, 112509. Available online: https://www.sciencedirect.com/science/article/abs/pii/S0378778822006806 (accessed on 18 October 2023). [CrossRef]
  58. Li, Z.; Ma, X.; Liao, Y. Combined performance of upper-room UVGI and ceiling-mounted air cleaners Foremoving active bioaerosol. Build. Environ. 2025, 267, 112230. [Google Scholar] [CrossRef]
  59. Lee, B.; Bahneth, W.P. Effects of installation location on performance and economics of in-duct ultraviolet germicidal irradiation systems for air disinfection. Build. Environ. 2013, 67, 193–201. [Google Scholar] [CrossRef]
Figure 1. Building model and location of studied zones in building’s plan. Different colored dots in the model represent various airflow elements (windows, doors, etc), AHU diffusers, leakage paths, pollutant sources, and depositions.
Cleantechnol 07 00053 g001
Figure 2. Schematic of the viral spread mitigation methods in the classroom.
Cleantechnol 07 00053 g002
Figure 3. Schematic of the PM2.5 mitigation methods in the kitchen.
Cleantechnol 07 00053 g003
Figure 4. PM2.5 concentration in building’s outdoor area over a year.
Cleantechnol 07 00053 g004
Figure 5. Performance of various APs in decreasing SARS-CoV-2 levels in 110CL and 213C rooms with one and five infectors.
Cleantechnol 07 00053 g005
Figure 6. Performance of UVGI-lights in decreasing SARS-CoV-2 levels in 110CL and 213C rooms with one and five infectors.
Cleantechnol 07 00053 g006
Figure 7. Basic reproduction number’s comparison under various combination of scenarios with five infectors.
Cleantechnol 07 00053 g007
Figure 8. Fluctuations of PM2.5 level on the day with max. concentration under different scenarios.
Cleantechnol 07 00053 g008
Table 1. WHO-recommended 24 h and annual AQG level and interim targets for PM2.5 [1].
RecommendationPM2.5 (µg/m3)
24 hAnnual
Interim target 17535
Interim target 25025
Interim target 337.515
Interim target 42510
AQG level155
Table 2. Input parameters’ values utilized in modeling.
Input ParameterValue
Building model
TypeCollege building
Types of most occupied roomsClassroom–Laboratory–Café
Occupancy schedulesProvided based on college’s annual time table for 2023
Number of occupants in studied zones110CL15
213C15
Kitchen1
Floor area of studied zones110CL54 m2
213C49 m2
Kitchen14 m2
Number of Occupied Days per Week110CL4 days
213C3 days
Kitchen6 days
Number of floors3
Total floor area2500 m2
Floor height2.8 m
Location and weather fileLondon-TRY weather file from CIBSE
Ventilation systemAir handling unit
Total ventilation rate5289 m3/h-calculated and validated in previous study [34]
ACH0.8–1.0 h−1 [34]
External wall/floor leakage area2.2 cm2/m2 (@4 Pa)
Outdoor air100%
Recirculating air0%
SARS-CoV-2 model
SourceInfected person
Generation rate65 quanta/h [22,35]
Breathing rate0.75 m3/h- light activity (whispering and speaking) [36]
Deposition rate0.24 h−1 [24]
Deactivation rate0.63 h−1 [37]
Initial concentration0 quanta
PM2.5 model
SourceCooking activity (gas-burner)
Generation rate1.56 mg/min [38]
Deposition rate0.5 h−1 [39]
Initial concentrationSame as outdoor level
Outdoor PM2.5 penetration factor1.0 [33]
Table 3. Specifications of APs used in the building model.
CADR, m3/hMax. Room Area, m2Efficiency, %ManufacturerModelPower Consumption, W
AP-low3909999.99Winix-
South Korea
530050
AP-medium69727499.98Levoit-ChinaCore-600s49
AP-high101634299.9Medify-USAMA-112120
AP-ultra high161411099.97Blueair-
Sweden
Pro XL256
Table 4. Specifications of UVGI lights used in the building model.
Wavelength (nm)Average Fluence Rate (µW/cm2)Susceptibility Constant (cm2/mJ)Radiation Volume (Fraction of Room Volume %)
UV22222234.221
a-UV254254402.930.3
b-UV254254503.770.3
Table 5. Strategies to decrease PM2.5 level in the kitchen to achieve WHO recommendations.
ScenariosApplied Strategies
1No ventilation (worst case)Without any ventilation
2Baseline ExhaustOnly exhaust hood
3Supply–Exhaust VentilationHood + supply fresh air (OA)
4HEPA PurificationSupply–Exhaust ventilation + AP (4 types from Table 3)
5MERV13 FiltrationSupply–Exhaust ventilation + filtering supply OA
Table 6. Impact of increasing the number of infectors with various ventilation cases on PI and R0.
Zones213C110CL
Exposure time (h)2.52.5
ScenariosNumber of infectorsPI (%)R0PI (%)R0
Baseline ventilation129.44.428.04.2
250.27.548.17.2
582.512.480.112.1
CIBSE ventilation (only mechanical)115.32.315.22.3
228.34.228.14.2
556.48.556.18.4
Hybrid ventilation16.10.98.41.3
29.41.415.22.3
518.62.832.74.9
Table 7. PM2.5 level under different scenarios in a one year period.
ScenariosMean (µg/m3)Min (µg/m3)Max (µg/m3)SD75th
Percentile
Percentage of PM2.5 Levels Greater than 15 µg/m3 (%)
No ventilation (worst case)21.980.32436.7163.049.5716.47
Baseline Exhaust10.510.32154.9717.579.0214.48
Supply–Exhaust Ventilation17.580.39162.7016.5711.1717.58
HEPA
Purification
AP-low5.710.1892.78.835.296.52
AP-medium4.080.1369.736.483.744.60
AP-high3.150.1055.525.072.873.74
AP-ultra high2.210.0740.223.602.002.57
MERV13 Filtration4.000.02100.1614.730.975.31
Table 8. Average PM2.5 level over a 24 h period on the highest PM2.5 day of the year.
ScenariosNo Ventilation (Worst Case)Baseline ExhaustSupply-
Exhaust Ventilation
HEPA PurificationMERV13 Filtration
AP-LowAP-
Medium
AP-HighAP-
Ultra high
Mean (µg/m3)54.837.745.022.015.712.18.58.5
Table 9. Reduction in the efficacy of mechanical (CIBSE rates) and hybrid ventilation systems in reducing PI with an increase in infectors (1 to 5).
Baseline to HybridBaseline to CIBSE
Zones213C110CL213C110CL
% reduction in PI179%70%48%46%
577%59%31%30%
Reduction in system efficacy2.5%16%35%35%
Disclaimer/Publisher’s Note: The statements, opinions and data contained in all publications are solely those of the individual author(s) and contributor(s) and not of MDPI and/or the editor(s). MDPI and/or the editor(s) disclaim responsibility for any injury to people or property resulting from any ideas, methods, instructions or products referred to in the content.

