Article

Isotope Detection in Microwave-Assisted Laser-Induced Plasma

1
School of Chemical Engineering, University of Adelaide, Adelaide, SA 5005, Australia
2
Photonics Laboratory, Physics Unit, Tampere University, FI-33720 Tampere, Finland
*
Author to whom correspondence should be addressed.
These authors contributed equally to this work.
Plasma 2023, 6(3), 466-477; https://doi.org/10.3390/plasma6030032
Submission received: 19 May 2023 / Revised: 20 July 2023 / Accepted: 26 July 2023 / Published: 1 August 2023
(This article belongs to the Special Issue Advances in Laser Plasma Spectroscopy Applications)

Abstract

:
Isotope detection and identification is paramount in many fields of science and industry, such as in the fusion and fission energy sector, in medicine and material science, and in archeology. Isotopic information provides fundamental insight into the research questions related to these fields, as well as insight into product quality and operational safety. However, isotope identification with established mass-spectrometric methods is laborious and requires laboratory conditions. In this work, microwave-assisted laser-induced breakdown spectroscopy (MW-LIBS) is introduced for isotope detection and identification utilizing radical and molecular emission. The approach is demonstrated with stable B and Cl isotopes in solids and H isotopes in liquid using emissions from BO and BO2, CaCl, and OH molecules, respectively. MW-LIBS utilizes the extended emissive plasma lifetime and molecular-emission signal-integration times up to 900 μs to enable the use of low (~4 mJ) ablation energy without compromising signal intensity and, consequently, sensitivity. On the other hand, long plasma lifetime gives time for molecular formation. Increase in signal intensity towards the late microwave-assisted plasma was prominent in BO2 and OH emission intensities. As MW-LIBS is online-capable and requires minimal sample preparation, it is an interesting option for isotope detection in various applications.

1. Introduction

Isotopes are widely used in many industries, including electronics and semiconductors and medical and forensics science. Isotopic analysis is a challenging task due to the similarities of the analyte. For this reason, analysis of isotopes is usually preformed in a laboratory environment. Isotopes are usually detected based on the mass difference. However, detection of isotopes in plasma provides several advantages due to the presence of atoms and molecules in excited forms when the changes in emission behavior, i.e., the shift of the spontaneous emission either form atoms or radical or closed-shell molecules, can be utilized.
Laser-induced breakdown spectroscopy (LIBS) is a rising plasma emission-based analytical method that is widely utilized for elemental detection in science and industry [1]. LIBS is a robust, information-rich, and online-capable method that requires no or minimal sample preparation. The method generally utilizes the atomic emissions produced in a laser-induced plasma plume and its emitted radiation for elemental identification and quantification. Laser-induced plasma is generated by irradiating a sample material, gas, solid, or liquid, with a high-energy laser pulse. The focalized laser pulse absorbing to the sample create a localized area of high temperature, vaporizing and ionizing the material and leading to the ignition of the plasma plume [2]. The recombining electrons and atoms in the plasma emit radiation on the elemental characteristic wavelengths that are utilized in elemental identification. In addition, the intensity of the radiation on the respective wavelengths can be further used in the quantification of the elemental composition in the sample material [3]. One obvious advantage of LIBS is the possibility of in situ detection under ambient pressure and temperature conditions. However, the high electron density presents a challenge as they tend to broaden the emission lines due to stark broadening [2]. To overcome the atomic-line-broadening issue, isotopic detection based on vibronic transitions in radical shave been used [4]. However, due to the short plasma lifetime in LIBS, the formation of these radicals is usually confined. In addition to the ionic and atomic emission from the plasma, utilization of radical and molecular emissions from the cooling plasma plume has become more popular approach [5,6,7]. This approach has been shown to be a fruitful tool for isotopic detection [1,2].
The initial laser-induced plasma plume has relatively a high temperature and electron density, typically up to 20,000 K (in the range 1–2 eV) and 1019 cm−3, respectively [8]. Therefore, the elemental lines are broadened and the small isotopic shifts in the electronic transitions cannot be resolved in ambient conditions. However, the isotopic shift in the vibronic molecular-emission bands tend to be larger than in the purely electronic transitions in atomic species due to the vibrational and rotational contribution. For example, the isotopic shift between 11B and 10B in the 2s2p2 2D transition at 208.89 nm is 0.002 nm, whereas the 11BO and 10BO B2Σ+ − X2Σ+ system’s (0–2) band heads at 255.2 nm and at 255.9 nm, respectively, are separated by 0.73 nm [7]. The laser ablation and subsequent plasma formation that takes benefit from the molecular-emission behavior has been conceptualized into an isotope-detection method called laser ablation and molecular isotopic spectrometry (LAMIS) [7,9]. The LAMIS approach has been demonstrated for various elements, such as B [7], C [4,10], H/D [4,11], N, O, and Cl [4]. It is also utilized in combination with the isotopic shifts in atomic transitions for the detection of U isotopes [12]. Isotope detection and identification are paramount in many fields of science and industry, such as in the fusion and fission energy sector, in medicine and material science, and in archeology. Isotopic information provides fundamental insight into the research questions related to these fields, as well as insight into product quality and operational safety. LAMIS is challenging the methods based on mass spectrometry, e.g., IRMS [13], TIMS [14], SIMS [15], and ICP-MS [16], that are well known for their high resolving power and sensitivity, with reduced need of labor-intensive sample preparation and online isotope-detection capability.
LAMIS detects the molecule emission from a cooling plasma using a long gate delay of ~10 μs instead of the typical delay of ~1 μs used for atomic emission. To obtain sufficient populations of the excited molecules at the late time of plasma plume, LAMIS applications have used laser powers in the range of 50 mJ to 150 mJ [4,9]. The sensitivity has been improved with a spark discharge (SD) [17] or double pulse (DP) [18,19] that act as an external energy source to the plasma, causing reheating and, consequently, re-excitation of the species in the cooling plasma plume. The detection window for LAMIS and SD/DP-enhanced molecular emission is still limited, being in the range of a few tens of microseconds.
Microwave-assisted laser-induced breakdown spectroscopy (MW-LIBS) is one of the recent rising techniques to improve the LIBS method’s analytical performance. It utilizes microwave radiation as an external energy source to maintain the laser-induced plasma electron temperature and density and thus extend the emissive lifetime of the plasma plume up to a millisecond range [20]. MW-LIBS can be applied to solid [21,22,23], liquid [24], and gaseous [25] samples. Up to 100-fold improvements in sensitivity [26] and over 1000-fold improvements in the characteristic elemental plasma emission intensity [27] have been reported with the MW-LIBS approach when compared to a conventional LIBS arrangement. When microwave radiation interacts with the laser-induced plasma plume, the plasma front moves rapidly toward the plasma source and the plasma volume increases substantially compared to the initial laser-induced plasma plume. Ikeda et al. identified three distinct phases in the spatial plasma plume behavior in MW-LIBS: (i) laser ablation and initial plasma formation; (ii) plasma expansion and microwave-sustained breakdown; and (iii) sustained nonthermal plasma and plasma dissipation [28]. After the first two dynamic phases, the microwave-maintained plasma temperature stabilizes to about 6000 K (0.5 eV) and the electron density to order of 1 × 1016 cm−3, which sustains the microwave absorption into the plasma plume. The long relatively cool microwave-maintained plasma period provides an environment for molecule formation and, furthermore, enables extended temporal observation window for molecular species [29,30].
This work presents the application of MW-LIBS for isotopic detection and analysis. MW-LIBS can benefit isotopic analysis in two ways. First, MW-LIBS extends the laser-induced plasma lifetime, providing an extended temporal window for chemical kinetics to form radicals and molecules. The use of microwave injection substantially prolongs the plasma lifetime as the electrons gain kinetic energy by absorbing microwave radiation in the inverse bremsstrahlung process (IB). After this, the electrons excite other species (ions, neutral atoms, and molecules) through collision. Later, the excited species return to the ground state, emitting light that carries qualitative and quantitative information about the species. This process is cycled until the input microwave radiation decays [31]. Second, the electron density in MW-LIBS is an order of magnitude lower than in LIBS when measured on a solid sample at a 100 ns gate delay and with a 800 µs gate width after ablation at 4 mJ of laser energy under ambient conditions [32], which prevent line broadening producing well-resolved spectra. Thus, the molecular emission emitted from the microwave-maintained plasma plume of the MW-LIBS arrangement is used to detect and identify isotopes. The approach is demonstrated with the detection of 11B and 10B isotopes by emissions from BO and BO2 molecules, 35Cl and 37Cl isotopes by emissions from the CaCl molecule, and H and D isotopes by emissions from OH and OD molecules. To the best of the authors’ knowledge, this is the first report on the detection and identification of isotopes in MW-LIBS plasma.

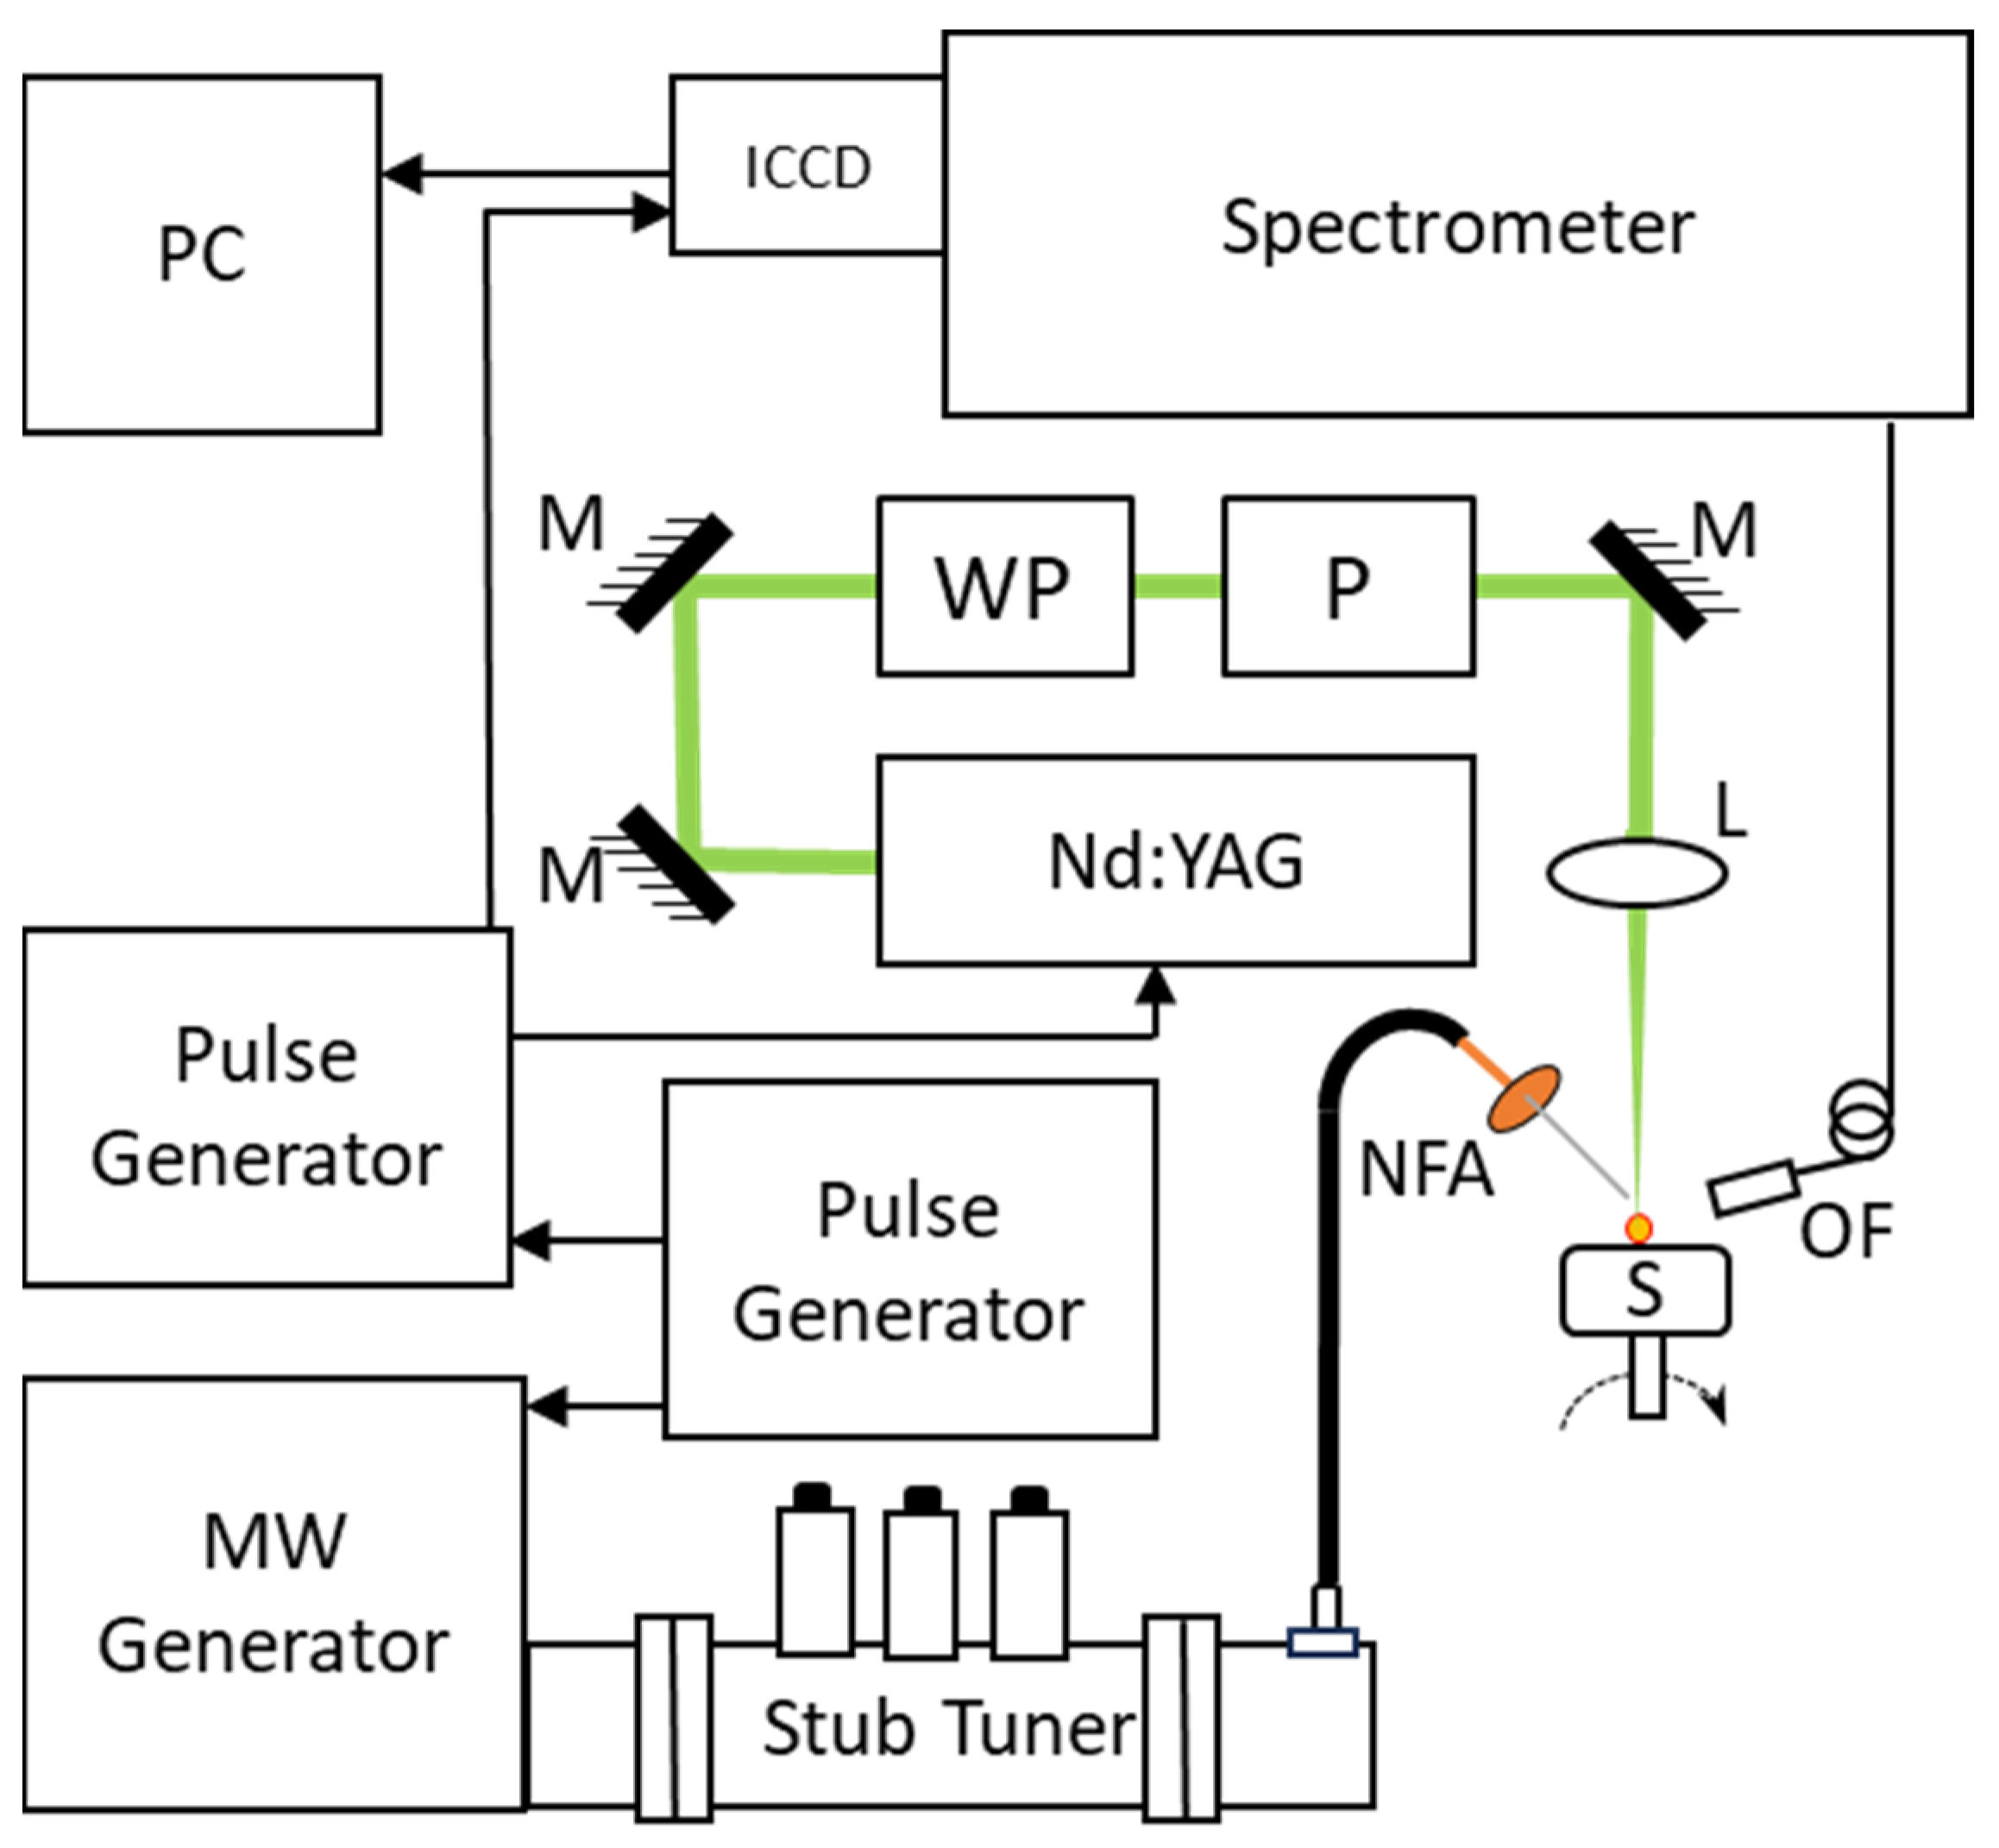
2. Experimental Arrangement

A schematic the experimental MW-LIBS arrangement is shown in Figure 1. A pulsed laser Quantel (Brilliant B), emitting at 532 nm with a pulse length of 6 ns and a repetition rate of 10 Hz, was used to ablate the sample and ignite the plasma plume. The pulse energy was controlled by a half-wave plate (HWP) and a Glan–laser polarizer (P). The laser pulses were focused on the sample surface using a lens with 100 mm focal length. The microwave pulses were formed with a microwave source (Sairem) and were delivered to the NFA using a coaxial cable (50 U NN cable) with 0.14 dB @ 2.45 GHz. The NFA was manufactured from a semi-rigid silver-plated copper coaxial cable (RG402/U) [33]. The NFA was attached to a precision stage that allowed positioning of the NFA tip 0.5 mm away from the laser propagation path and approximately 1 mm above the sample surface. The plasma emission was collected into a fiber bundle Thorlabs (BFY400HS02) that was connected into a spectrometer (Andor Shamrock500i) equipped with an ICCD camera (Andor, iStar). The resolving power of the spectrometer at 332 nm is 10,000 and 16,000 for 2400 and 3600 grooves per mm gratings, respectively. The fiber tip was mounted close to the plasma plume, enabling direct light collection into the fiber.
Boron isotope analysis was performed on isotope-enriched boric acid samples H310BO3 (10B 95 at. %) and H311BO3 (11B 99 at. %) (Sigma-Aldrich Co., Ltd., Castle Hill, NSW, Australia). For chlorine isotope analysis, the sample was a powder of CaCl2 (Sigma-Aldrich Co., Ltd.). Each sample powder was mixed with an organic binder and pressed into a pellet. The pellets were placed on a hot surface, at T below ~350 K, to form a smooth solid surface. The diameter and the thickness of the pellets were 21 mm and 3 mm, respectively. Hydrogen isotope analysis was performed on liquid samples. The samples were distilled water (H2O) and heavy water (D2O) (D 99.9 atom %) (Sigma-Aldrich Co., Ltd.). The water was circulated using a peristaltic pump (Ismatec, MWMSC1) which provided 0.26 mL/min [24].

3. Results

3.1. 11B and 10B Isotope Detection

Boron is an important element in the nuclear industry due to its high neutron-absorbing efficiency. Therefore, the stable isotopes of boron 11B and 10B are among the most frequently measured isotopes with LAMIS [9]. The BO emission systems B2Σ+ − X2Σ+ and A2ΠI − X2Σ+ are well visible in the spectrum from a laser-induced plasma in ambient conditions increasing the interest towards this molecule [7]. To demonstrate the isotope-separation abilities of the MW-LIBS approach and to enable comparison with previously reported results, the technique is applied for boron isotope analysis. Example spectra of 11BO and 10BO B2Σ+ − X2Σ+ (0–2) emission bands are shown in Figure 2. The spectra were collected with 12 mJ of laser-pulse energy and 540 W of microwave power in ambient air. The locations and band shapes were identified using isotope-enriched boric acid samples. The observed band head separation of 0.73 nm is similar to the previously reported separation in LAMIS experiments. The separation of the different isotope band heads is not as clear as in previous LAMIS experiments [7,9,18] due to the partial overlap of NO A2Σ+ − X2Π (0–3) and BO B2Σ+ − X2Σ+ (1–3) emission bands [34] that are also maintained in the microwave-assisted plasma plume. The spectral structures from 256.3 nm upwards originate from the NO A2Σ+ − X2Π (0–3) emission band having the band origin at 259.1 nm. The proximity of the NO band and the overlapping 11BO and 10BO bands limit the quantification of the 10B/11B fraction to the natural fraction. However, the applications of detection of the boron isotope fraction, especially in nuclear power applications, concentrate on materials with a higher 10B/11B fraction than a natural fraction.
The signal-to-noise ratio (SNR) of the BO emission line as a function of the laser-pulse energy and the microwave power was studied. The dependencies are shown in Figure 3. It was found that the SNR improved in a stepwise manner when the ablation energy was increased to above 10 mJ. However, increasing the laser-pulse energy further did not increase the SNR. The increase in microwave power improved microwave–plasma coupling and a slight improvement in SNR was observed when the microwave power was increased from 450 W to 600 W.
The BO2 molecule has also been utilized for the detection of boron isotopes [35]. The isotopic shift in BO2 A2Πu − X2Πg transition’s (200-000) band at 493.1 nm has been observed to be 1.93 nm [35], thus enabling isotope detection. The spectra obtained in the emission band from isotope-enriched boric acid samples are shown in Figure 4. The separation observed in this work between the 11BO2 and 10BO2 spectra at the A2Πu − X2Πg transition’s (200-000) band is only 1.05 nm. The BO2 spectrum was present at laser energies down to 3 mJ, which was the consistent microwave coupling threshold in the current arrangement with 600 W of microwave power. However, the intensity approximately doubled as the ablating laser-pulse energy increased to 12 mJ, similar to the SNR increase in BO emission. The BO2 spectrum in Figure 4 was obtained with 4 mJ of laser-pulse energy to reduce the wearing of the sample and to demonstrate the possibility of utilizing low ablation laser energies in MW-LIBS isotope detection. The narrow spectral feature showing near 499 nm in Figure 4 has not been identified. It is assumed to be caused from contamination originating from the sample pelletization process, and the signal is enhanced in the microwave-sustained plasma. The BO2 emission spectrum was not observed without microwave assistance with low ablation energy. The atomic boron seems to react efficiently in the microwave-assisted plasma plume, with the oxygen molecules originating from air to form BO2 that is visible in the spectrum with substantially lower laser energies than the emission lines from BO providing substantially higher SNR. Thus, the BO2 signal was not as sensitive to the small variations in ablation and microwave–plasma coupling as the BO signal.
BO2 is a polyatomic molecule; hence, its rovibronic transition spectra are more complex than that of, for example, BO leading to the requirement of high resolution to separate the individual spectral features. For example, the separation between (1–0) and the nearest vibrational band head, (3–1), of the BO B − X system is 3 nm, while the separation between (200-000) and (040-000) of the BO2 A − X system is only 0.3 nm [36,37]. As the rotational branches of the BO2 bands are heavily overlapped, they are unresolvable by our spectral system. Therefore, BO2 appears as a broad spectral feature, as shown in Figure 4. However, as shown in Figure 4, the broad spectral features are shifted due to the isotope mass effect and can be utilized for isotope identification.
The time-resolved formation of BO2 was chosen as an example to illustrate the benefit of using microwave to extend the plasma lifetime. This was achieved by using a microwave pulse of 600 W in power and 1.6 ms in temporal width and by detecting BO2 emission using a variable gate delay at a fixed gate width of 10 μs. As shown in Figure 5, the BO2 emission intensity increases in time up until 200 μs of the microwave-assisted plasma evolution. Thus, the BO2 concentration in the plasma finds equilibrium only after 200 μs of the plasma lifetime. Table 1 contains examples of the reaction paths that lead to BO2 formation in the plasma plume. The overall equilibrium of the BO2 concentration is the result of reactions (1)–(11). Despite the low ablation energy, integration over 900 μs of the emissive MW-LIBS plasma lifetime produced an improved SNR for the BO2 emission band compared to previously reported signals obtained with conventional LAMIS [35]. Thus, the use of microwave assistance in the laser-induced plasma, and consequentially the extended plasma lifetime, brings substantial benefit in comparison to the conventional LIBS arrangement. On the other hand, extended plasma lifetime can influence the chemical equilibrium for molecules and radicals that have not been studied previously in LIBS-based plasma emission applications. This opens a new line of research for further work.

3.2. 35Cl and 37Cl Isotope Detection

Chlorine has two stable isotopes, 35Cl and 37Cl, with natural fractions of 75.76% and 24.24%, respectively [39]. Stable chlorine isotopic variations are observed and utilized as a geological tracing tool for the origin and fate of fluids and rock from the Earth’s interior parts. Analysis of chlorine stable isotopes has also been suggested to be used in tracing sources, transportation, and the transformation of a number of natural and anthropogenic organic compounds [40]. Chlorine is a challenging element for conventional LIBS analysis that utilizes the atomic emission. The ground-state transitions of atomic chlorine are in the deep UV region and thus the excitation of transitions between upper levels, which could be detected using VIS-NIR spectrometer, require high excitation energy. Therefore, utilization of molecular emission is an attractive option for chlorine detection when using an LIBS-based approach [5].
Chlorine is often detected using emission from a CaCl molecule. The MW-LIBS spectrum of the CaCl system B2Σ+ − X2Σ+ (Δν = −1) from a CaCl2 pellet with a natural isotopic fraction is shown in Figure 6. The spectrum is obtained by accumulating 100 shots using 4 mJ of laser-pulse energy and 900 W of microwave power. The signal-acquisition parameters were 1.2 μs of gate delay and 500 μs of gate width. As can be seen, the peaks in the CaCl emission system experience a shift that enables the identification and quantification of the 35Cl/37Cl fraction. The spectra obtained with low ablation energy has very a similar quality to that reported in previous studies [4]. Thus, the microwave-assisted approach enables chlorine isotope identification and quantification in solid samples using low laser-pulse energy, which enable the construction of more compact and cost-efficient chlorine isotope detection.

3.3. 1H and 2H Isotope Detection

Hydrogen has two stable isotopes, 1H and 2H, of which the latter is known as deuterium (D). The natural abundance of deuterium is very small. However, deuterium is used in multiple applications in science and industry. Deuterium is preferable in medical applications due to its non-radioactivity, where it is used as a tracer for pharmaceutical and medical diagnostic applications [41,42,43,44]. In addition, deuterium is employed in nuclear plants as a moderator for nuclear reactors due to the heavy nucleus of deuterium [45].
In this work, the hydrogen isotopes are identified using A2Σ+ − X2Π (0, 0) rotational bands R11 and R22 [46] as this region is free from interference from other molecular emission lines. Figure 7 shows example MW-LIBS spectra obtained from H2O and D2O streams. The spectra are accumulated over 100 shots using 10 mJ laser-pulse energy and 900 W of microwave power. The OH radical A2Σ+ − X2Π system’s emission intensity was found to increase with time, similarly to the BO2 emission in Section 3.1. Hence, a long gate delay for a signal acquisition of 200 µs was used with a 600 µs gate width. As the measurement was performed in ambient air, the spectra obtained from the D2O sample had traces of a OH signal due to the moisture in air. However, this does not impact isotope identification. The separation between the R11 and R22 branches’ band heads are 0.12 nm and 0.24 nm, respectively. The isotopic shift is in agreement with previous studies, and the signal intensity and SNR are of a similar magnitude to those presented in liquid and solid samples with LAMIS [11,47].

4. Conclusions

MW-LIBS is demonstrated for stable isotope detection of B, Cl, and H using molecular emissions from the microwave-assisted plasma plume. The B isotopes in solid samples were detected and identified in the plasma using emission from BO and BO2 molecules. However, boron isotope detection in an ambient atmosphere is limited to samples with high boron content due to spectral interference with NO and other BO emission bands. On the other hand, BO2 emission intensity was found to increase substantially towards the end of the microwave-assisted plasma lifetime and has the potential to provide sensitive boron detection. The OH/OD emission signal that was utilized for H/D isotope detection in liquid samples was found to increase towards the end of the plasma lifetime with a similar trend in BO2 emission. Hence, it was demonstrated that the use of MW-LIBS gives time for molecular formation in the plasma plume providing an increased emission intensity and SNR for various molecular species. The work also offers the possibility of a new research direction for molecular species that are found in the microwave-assisted plasma plume. In addition, the extended lifetime emission and the consequentially extended signal-integration time enable the use of low ablation energies for all samples without compromising the signal intensity or SNR. The low ablation energy is highly beneficial when avoiding sample damage. On the other hand, the requirement for low ablation energy can substantially reduce the cost of the experimental arrangement and sample damage. As demonstrated in this work, MW-LIBS is a promising approach for isotope detection in various applications looking for an online-capable method with the benefit of low sample damage.

Author Contributions

Conceptualization, J.V. and Z.T.A.; methodology, A.M.A., J.V. and Z.T.A.; validation, J.V. and Z.T.A.; formal analysis, A.M.A. and J.V.; investigation, A.M.A. and J.V.; resources, P.K.; writing—original draft preparation, J.V.; writing—review and editing, A.M.A., Z.T.A. and P.K.; visualization, J.V.; supervision, P.K. and Z.T.A.; project administration, Z.T.A.; funding acquisition, J.V. and Z.T.A. All authors have read and agreed to the published version of the manuscript.

Funding

J.V. acknowledges the funding from Academy of Finland (decision 338338).

Institutional Review Board Statement

Not applicable.

Informed Consent Statement

Not applicable.

Data Availability Statement

Data will be made available upon request.

Conflicts of Interest

The authors declare no conflict of interest.

References

  1. Hahn, D.W.; Omenetto, N. Laser-Induced Breakdown Spectroscopy (LIBS), Part II: Review of Instrumental and Methodological Approaches to Material Analysis and Applications to Different Fields. Appl. Spectrosc. 2012, 66, 347–419. [Google Scholar] [CrossRef] [PubMed]
  2. Hahn, D.W.; Omenetto, N. Laser-induced breakdown spectroscopy (LIBS), part I: Review of basic diagnostics and plasma–particle interactions: Still-challenging issues within the analytical plasma community. Appl. Spectrosc. 2010, 64, 335A–366A. [Google Scholar] [CrossRef] [PubMed] [Green Version]
  3. Guezenoc, J.; Gallet-Budynek, A.; Bousquet, B. Critical review and advices on spectral-based normalization methods for LIBS quantitative analysis. Spectrochim. Acta Part B At. Spectrosc. 2019, 160, 105688. [Google Scholar] [CrossRef]
  4. Bol’Shakov, A.A.; Mao, X.; Perry, D.L.; Russo, R.E. Laser Ablation Molecular Isotopic Spectrometry for rare isotopes of the light elements. Spectroscopy 2014, 29, 30–39. [Google Scholar]
  5. Fernández-Menéndez, L.J.; Méndez-López, C.; Abad, C.; Fandiño, J.; González-Gago, C.; Pisonero, J.; Bordel, N. A critical evaluation of the chlorine quantification method based on molecular emission detection in LIBS. Spectrochim. Acta Part B At. Spectrosc. 2022, 190, 106390. [Google Scholar] [CrossRef]
  6. Moros, J.; Laserna, J. Laser-Induced Breakdown Spectroscopy (LIBS) of Organic Compounds: A Review. Appl. Spectrosc. 2019, 73, 963–1011. [Google Scholar] [CrossRef]
  7. Russo, R.E.; Bol’shakov, A.A.; Mao, X.; McKay, C.P.; Perry, D.L.; Sorkhabi, O. Laser ablation molecular isotopic spectrometry. Spectrochim. Acta Part B At. Spectrosc. 2011, 66, 99–104. [Google Scholar] [CrossRef]
  8. Gaudiuso, R.; Dell’Aglio, M.; De Pascale, O.; Senesi, G.S.; De Giacomo, A. Laser induced breakdown spectroscopy for elemental analysis in environmental, cultural heritage and space applications: A review of methods and results. Sensors 2010, 10, 7434–7468. [Google Scholar] [CrossRef] [Green Version]
  9. Bol’Shakov, A.A.; Mao, X.; González, J.J.; Russo, R.E. Laser ablation molecular isotopic spectrometry (LAMIS): Current state of the art. J. Anal. At. Spectrom. 2015, 31, 119–134. [Google Scholar] [CrossRef]
  10. Dong, M.; Mao, X.; Gonzalez, J.J.; Lu, J.; Russo, R.E. Carbon Isotope Separation and Molecular Formation in Laser-Induced Plasmas by Laser Ablation Molecular Isotopic Spectrometry. Anal. Chem. 2013, 85, 2899–2906. [Google Scholar] [CrossRef]
  11. Sarkar, A.; Mao, X.; Chan, G.C.-Y.; Russo, R.E. Laser ablation molecular isotopic spectrometry of water for 1D2/1H1 ratio analysis. Spectrochim. Acta Part B At. Spectrosc. 2013, 88, 46–53. [Google Scholar] [CrossRef]
  12. Mao, X.; Chan, G.C.-Y.; Choi, I.; Zorba, V.; Russo, R.E. Combination of atomic lines and molecular bands for uranium optical isotopic analysis in laser induced plasma spectrometry. J. Radioanal. Nucl. Chem. 2017, 312, 121–131. [Google Scholar] [CrossRef] [Green Version]
  13. Silverman, S.N.; Phillips, A.A.; Weiss, G.M.; Wilkes, E.B.; Eiler, J.M.; Sessions, A.L. Practical considerations for amino acid isotope analysis. Org. Geochem. 2022, 164, 104345. [Google Scholar] [CrossRef]
  14. Di, Y.; Krestianinov, E.; Zink, S.; Amelin, Y. High-precision multidynamic Sr isotope analysis using thermal ionization mass spectrometer (TIMS) with correction of fractionation drift. Chem. Geol. 2021, 582, 120411. [Google Scholar] [CrossRef]
  15. Gillespie, J.; Nemchin, A.A.; Kinny, P.D.; Martin, L.; Aleshin, M.; Roberts, M.P.; Ireland, T.R.; Whitehouse, M.J.; Jeon, H.; Cavosie, A.J.; et al. Strontium isotope analysis of apatite via SIMS. Chem. Geol. 2020, 559, 119979. [Google Scholar] [CrossRef]
  16. Vanhaecke, F.; Degryse, P. Isotopic Analysis: Fundamentals and Applications Using ICP-MS; John Wiley & Sons: Hoboken, NJ, USA, 2012. [Google Scholar]
  17. Bol’Shakov, A.A.; Mao, X.; Russo, R.E. Spectral emission enhancement by an electric pulse for LIBS and LAMIS. J. Anal. At. Spectrom. 2017, 32, 657–670. [Google Scholar] [CrossRef]
  18. Mao, X.; Bol’Shakov, A.A.; Perry, D.L.; Sorkhabi, O.; Russo, R.E. Laser Ablation Molecular Isotopic Spectrometry: Parameter influence on boron isotope measurements. Spectrochim. Acta Part B At. Spectrosc. 2011, 66, 604–609. [Google Scholar] [CrossRef]
  19. Choi, S.-U.; Han, S.-C.; Lee, J.-Y.; Yun, J.-I. Isotope analysis of iron on structural materials of nuclear power plants using double-pulse laser ablation molecular isotopic spectrometry. J. Anal. At. Spectrom. 2021, 36, 1287–1296. [Google Scholar] [CrossRef]
  20. Wakil, M.A.; Alwahabi, Z.T. Gated and non-gated silver detection using microwave-assisted laser induced breakdown spectroscopy. J. Anal. At. Spectrom. 2021, 36, 185–193. [Google Scholar] [CrossRef]
  21. Liu, Y.; Baudelet, M.; Richardson, M. Elemental analysis by microwave-assisted laser-induced breakdown spectroscopy: Evaluation on ceramics. J. Anal. At. Spectrom. 2010, 25, 1316–1323. [Google Scholar] [CrossRef]
  22. Khumaeni, A.; Motonobu, T.; Katsuaki, A.; Masabumi, M.; Ikuo, W. Enhancement of LIBS emission using antenna-coupled microwave. Opt. Express 2013, 21, 29755–29768. [Google Scholar] [CrossRef] [PubMed]
  23. Oba, M.; Miyabe, M.; Akaoka, K.; Wakaida, I. Development of microwave-assisted, laser-induced breakdown spectroscopy without a microwave cavity or waveguide. Jpn. J. Appl. Phys. 2020, 59, 062001. [Google Scholar] [CrossRef]
  24. Wall, M.; Sun, Z.; Alwahabi, Z.T. Quantitative detection of metallic traces in water-based liquids by microwave-assisted laser-induced breakdown spectroscopy. Opt. Express 2016, 24, 1507–1517. [Google Scholar] [CrossRef] [PubMed] [Green Version]
  25. Viljanen, J.; Zhao, H.; Zhang, Z.; Toivonen, J.; Alwahabi, Z. Real-time release of Na, K and Ca during thermal conversion of biomass using quantitative microwave-assisted laser-induced breakdown spectroscopy. Spectrochim. Acta Part B At. Spectrosc. 2018, 149, 76–83. [Google Scholar] [CrossRef]
  26. Viljanen, J.; Sun, Z.; Alwahabi, Z.T. Microwave assisted laser-induced breakdown spectroscopy at ambient conditions. Spectrochim. Acta Part B At. Spectrosc. 2016, 118, 29–36. [Google Scholar] [CrossRef]
  27. Ikeda, Y.; Ofosu, J.A.; Wakaida, I. Development of microwave-enhanced fibre-coupled laser-induced breakdown spectroscopy for nuclear fuel debris screening at Fukushima. Spectrochim. Acta Part B At. Spectrosc. 2020, 171, 105933. [Google Scholar] [CrossRef]
  28. Ikeda, Y.; Soriano, J.K.; Kawahara, N.; Wakaida, I. Spatially and temporally resolved plasma formation on alumina target in microwave-enhanced laser-induced breakdown spectroscopy. Spectrochim. Acta Part B At. Spectrosc. 2022, 197, 106533. [Google Scholar] [CrossRef]
  29. Wakil, M.; Alwahabi, Z.T. Quantitative fluorine and bromine detection under ambient conditions via molecular emission. J. Anal. At. Spectrom. 2020, 35, 2620–2626. [Google Scholar] [CrossRef]
  30. Wakil, M.A.; Alwahabi, Z.T. Microwave-assisted laser induced breakdown molecular spectroscopy: Quantitative chlorine detection. J. Anal. At. Spectrom. 2019, 34, 1892–1899. [Google Scholar] [CrossRef]
  31. Ikeda, Y.; Soriano, J.K. Microwave-enhanced laser-induced air plasma at atmospheric pressure. Opt. Express 2022, 30, 33756. [Google Scholar] [CrossRef]
  32. Ali, M.; Alamri; Jan, V.; Zeyad, T.A. Properties of Microwave-Assisted Laser-Induced Breakdown Plasma. Spectrochim. Act. B, 2003; Submitted. [Google Scholar]
  33. Chen, S.J.; Iqbal, A.; Wall, M.; Fumeaux, C.; Alwahabi, Z.T. Design and application of near-field applicators for efficient microwave-assisted laser-induced breakdown spectroscopy. J. Anal. At. Spectrom. 2017, 32, 1508–1518. [Google Scholar] [CrossRef]
  34. Akpovo, C.A.; Helms, L.; Profeta, L.T.; Johnson, L. Multivariate determination of 10B isotopic ratio by laser-induced breakdown spectroscopy using multiple BO molecular emissions. Spectrochim. Acta Part B At. Spectrosc. 2019, 162, 105710. [Google Scholar] [CrossRef]
  35. Amiri, S.H.; Darbani, S.M.R.; Saghafifar, H. Detection of BO2 isotopes using laser-induced breakdown spectroscopy. Spectrochim. Acta Part B At. Spectrosc. 2018, 150, 86–91. [Google Scholar] [CrossRef]
  36. Mélen, F.; Dubois, I.; Bredohl, H. The AX and BX transitions of BO. J. Phys. B At. Mol. Phys. 1985, 18, 2423. [Google Scholar] [CrossRef]
  37. Johns, J. The absorption spectrum of BO2. Can. J. Phys. 1961, 39, 1738–1768. [Google Scholar] [CrossRef]
  38. Pasternack, L. Gas-phase modeling of homogeneous boron/oxygen/hydrogen/carbon combustion. Combust. Flame 1992, 90, 259–268. [Google Scholar] [CrossRef]
  39. Berglund, M.; Wieser, M.E. Isotopic compositions of the elements 2009 (IUPAC Technical Report). Pure Appl. Chem. 2011, 83, 397–410. [Google Scholar] [CrossRef] [Green Version]
  40. Stewart, M.A.; Spivack, A.J. The stable-chlorine isotope compositions of natural and anthropogenic materials. Rev. Mineral. Geochem. 2004, 55, 231–254. [Google Scholar] [CrossRef]
  41. Pirali, T.; Serafini, M.; Cargnin, S.; Genazzani, A.A. Applications of Deuterium in Medicinal Chemistry. J. Med. Chem. 2019, 62, 5276–5297. [Google Scholar] [CrossRef]
  42. Belete, T.M. Recent Updates on the Development of Deuterium-Containing Drugs for the Treatment of Cancer. Drug Des. Dev. Ther. 2022, 16, 3465–3472. [Google Scholar] [CrossRef] [PubMed]
  43. De Feyter, H.M.; Behar, K.L.; Corbin, Z.A.; Fulbright, R.K.; Brown, P.B.; McIntyre, S.; Nixon, T.W.; Rothman, D.L.; de Graaf, R.A. Deuterium metabolic imaging (DMI) for MRI-based 3D mapping of metabolism in vivo. Sci. Adv. 2018, 4, eaat7314. [Google Scholar] [CrossRef] [PubMed] [Green Version]
  44. Atzrodt, J.; Derdau, V.; Kerr, W.J.; Reid, M. Deuterium- and Tritium-Labelled Compounds: Applications in the Life Sciences. Angew. Chem. Int. Ed. 2018, 57, 1758–1784. [Google Scholar] [CrossRef] [PubMed] [Green Version]
  45. Spagnolo, D.A.; Miller, A.I. The CECE Alternative for Upgrading/Detritiation in Heavy Water Nuclear Reactors and for Tritium Recovery in Fusion Reactors. Fusion Technol. 1995, 28, 748–754. [Google Scholar] [CrossRef]
  46. Stark, G.; Brault, J.; Abrams, M. Fourier-transform spectra of the A 2 Σ+–X 2 Π Δv = 0 bands of OH and OD. JOSA B 1994, 11, 3–32. [Google Scholar] [CrossRef]
  47. Choi, S.-U.; Han, S.-C.; Yun, J.-I. Hydrogen isotopic analysis using molecular emission from laser-induced plasma on liquid and frozen water. Spectrochim. Acta Part B At. Spectrosc. 2019, 162, 105716. [Google Scholar] [CrossRef]
Figure 1. Schematic presentation of the measurement arrangement. NFA, near-field applicator; OF, optical fiber; L, lens (f = 100 mm); M, mirror; WP, half-wave plate; P, polarizer; C, coaxial cable.
Plasma 06 00032 g001
Figure 2. MW-LIBS spectra of BO obtained from (a) H311BO and (b) H311BO3 samples. The spectra obtained with 10 μs gate delay, 900 μs gate width, and averaged over 100 shots.
Plasma 06 00032 g002
Figure 3. The BO emission dependency on laser energy and microwave power measured with 10 μs gate delay, 900 μs gate width, and averaged over 100 shots. The error bars are the standard deviation obtained from five independent measurements carried out with the same measurement settings.
Plasma 06 00032 g003
Figure 4. MW-LIBS spectra of BO2 obtained from solid H310BO and H311BO samples. The spectra were obtained with 4 mJ of laser energy, 600 W microwave power, 10 μs gate delay, 900 μs gate width, and averaged over 100 shots.
Plasma 06 00032 g004
Figure 5. The temporal evolution of BO2 emission intensity obtained with 10 μs gate width and averaged over 100 shots using 4 mJ of ablation energy and 600 W of microwave power.
Plasma 06 00032 g005
Figure 6. MW-LIBS spectra of CaCl obtained from a solid CaCl2 sample. The lines associated with the Ca35Cl molecule are marked with black dashed arrows and the lines associated with Ca37Cl molecule are marked with red dashed arrows.
Plasma 06 00032 g006
Figure 7. MW-LIBS spectra of OH and OD obtained from liquid (a) H2O and (b) D2O samples.
Plasma 06 00032 g007
Table 1. Examples of possible reactions in a MW-LIBS plasma leading to BO2 formation [35,38]. The presence of a catalyst is denoted with “M”.
B + O2 ⇌ BO2(1)
BO + O + M⇌ BO2 + M(2)
BO + O2 ⇌ BO2 + O(3)
B2O3 + M ⇌ BO + BO2 + M (4)
B2O3 + O ⇌ 2BO2 (5)
2B2O3 + O2 ⇌ 4BO2 (6)
B2O3 + BO ⇌ B2O2 + BO2 (7)
B2O2 + O ⇌ BO + BO2 (8)
B2O2 + O2 ⇌ 2BO2 (9)
BO + OH ⇌ BO2 + H(10)
BO + CO2 ⇌ BO2 + CO(11)
Disclaimer/Publisher’s Note: The statements, opinions and data contained in all publications are solely those of the individual author(s) and contributor(s) and not of MDPI and/or the editor(s). MDPI and/or the editor(s) disclaim responsibility for any injury to people or property resulting from any ideas, methods, instructions or products referred to in the content.

