1. Introduction
Among the various additive manufacturing methods available, stereolithography stands out for its ability to produce dense ceramic parts with high dimensional precision, greater surface quality, and favorable mechanical characteristics, without the requirement of molds. Stereolithography operates by selectively polymerizing a reactive mixture composed of ceramic particles dispersed in a UV-curable resin, including monomers and/or oligomers along with a photo-initiator. The process entails building up a part layer by layer through exposure of the resin to a UV laser beam, which solidifies the resin according to the desired cross-sectional pattern for each layer [
1,
2,
3].
Upon exposure to UV light, the photo-initiator initiates the release of free radicals, triggering the polymerization of the organic intergranular phase [
4,
5,
6]. These radicals facilitate both the initiation and propagation stages, wherein polymer chains progressively grow by bonding monomers to radicals at the ends of polymer chains. Chain growth ceases when two radicals react, forming stable covalent bonds during termination [
7].
Ceramic particles, present in high concentrations within the suspension (50–65% vol), are trapped within the polymer matrix, imparting mechanical strength to the green part. Once the green part is built, it undergoes debinding and sintering processes to achieve the desired properties [
8]. Over the past decade, the demand for and applications of stereolithography have significantly expanded, with its utilization spanning various industries, including biomedical, luxury goods, electronics, and casting molds and cores for the aerospace industry [
9,
10].
Beyond the effect of laser diffusion in a ceramic slurry on the achieved polymerization dimensions [
9,
11], it is also important to consider the generation of stress during the printing process. Whether they stem from thermal contraction and expansion [
12] or chemical shrinkage due to polymerization [
13,
14,
15,
16,
17], these stresses resulting from the stereolithography printing process may have a significant impact on the mechanical properties of the densified parts and their dimensions. A printed part typically deforms and bends due to the accumulated stresses during the printing process. This phenomenon is commonly referred to as curling or warping, and it is accentuated by low adhesion with the printing surface [
13,
18,
19,
20].
In order to enhance predictions and potentially reduce the loss of dimensional accuracy and mechanical strength of both green and sintered parts, it is crucial to account for the presence of these residual stresses. A few studies have already explored stress generation influence on dimensions using numerical approaches, and all described the material behavior with pure elastic properties. Bugeda et al. [
21] and Huang et al. [
19] both developed a finite-element-method-based model to analyze the part distortion in stereolithography applied to fully organic systems. Wu [
22] proposed a model to predict the evolution of residual stresses and distortions and the appearance of cracks or delamination in ceramic green parts built with the Large Area Maskless Photopolymerization (LAMP) technique. More recently, Classens et al. [
23] established a 1D multiphysical model to control the curing process and material properties. Westbeek et al. [
24] used a homogenization approach to evaluate the influence of filler particles on optical, mechanical, and thermal characteristics of curing in order to use these properties in a process simulation framework.
Consequently, with the help of experimental characterizations, this work aims to develop a finite element method analysis to simulate the warping occurring on green parts and, ultimately, identify key factors for improving the dimensional accuracy of the stereolithography process. To achieve this, this work establishes a novel model to simulate the printing of macro-scale 3D green parts, with two key innovations: It incorporates non-reversible deformations through elastoplastic material behavior and accounts for part aging by considering the time-dependent evolution of the degree of conversion. The conversion of the suspension is associated with linear shrinkage in the three directions, and therefore, it allows the generation of stress depending on contact conditions. Adhesion between the part and the build platform is also integrated into the model using cohesive contact interactions. Experimental measurements are conducted to obtain information on the material properties, polymerization kinetics, and curling magnitude of the green parts and to evaluate the numerical results.
4. Development of the Model
4.1. Simulation Process
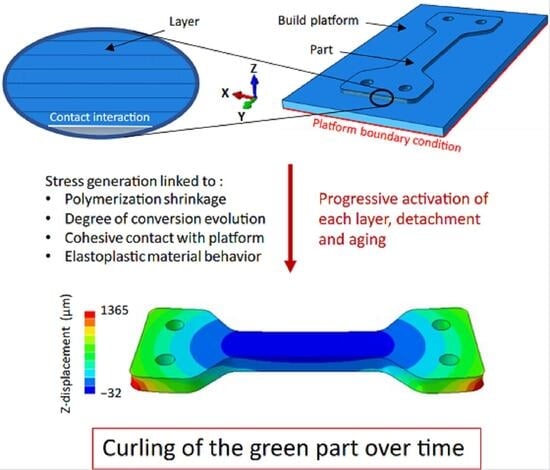
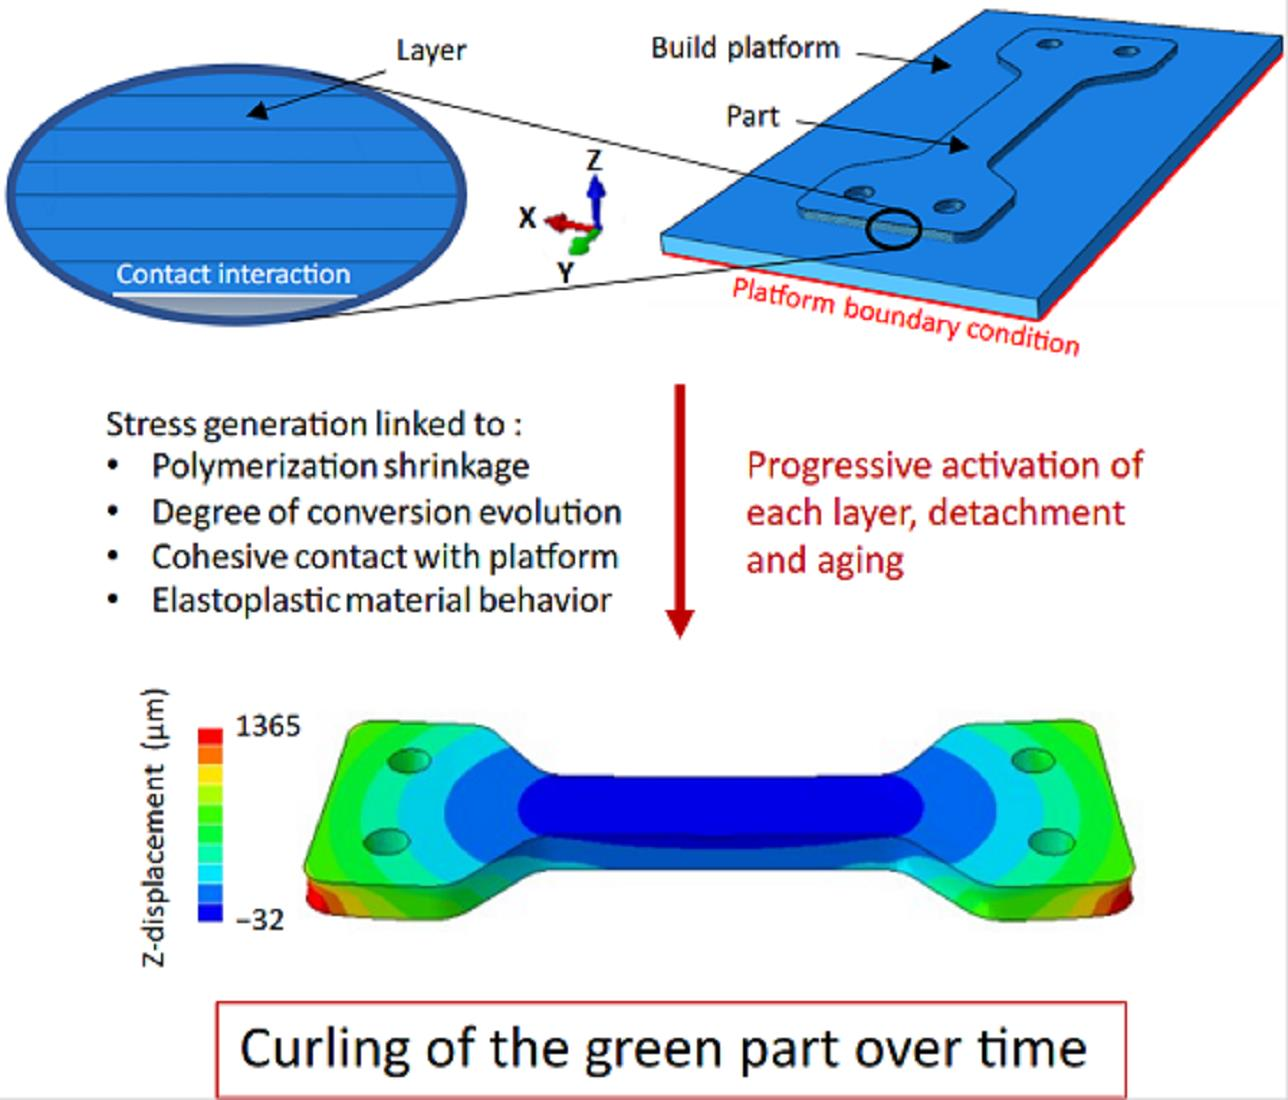
The model developed in this work aims to consider the chemical shrinkage of polymerization in order to analyze and predict the deformations and stresses of green parts resulting from stereolithography printing. This simulation process, using the finite element method in Abaqus 2024 software, relies on the successive activation of pre-meshed layers and on the progressive rise of the degree of conversion, allowing for a digital reproduction of the steps of suspension spreading, polymerization, and aging of the part. Each layer is activated 100 s after the polymerization of the preceding one, which roughly corresponds to the interval between the exposure of two consecutive layers.
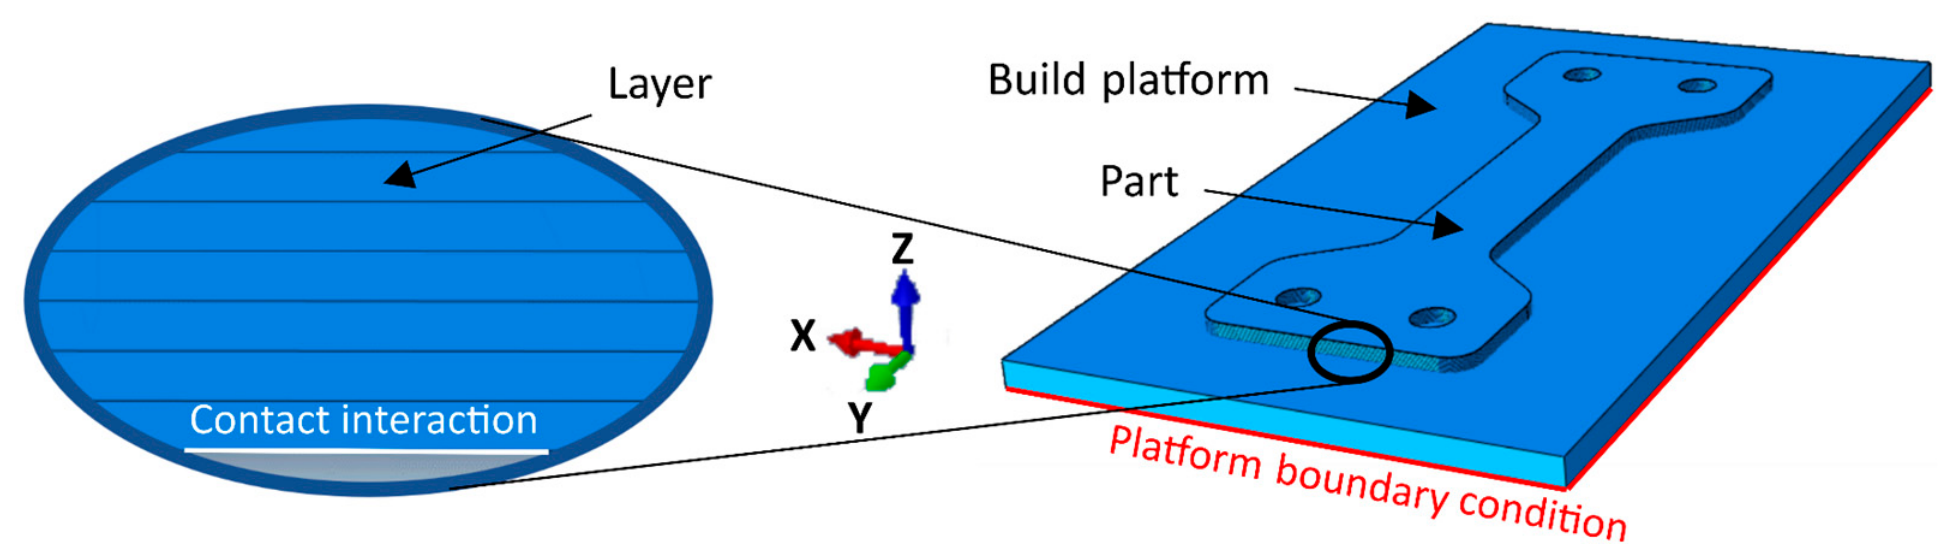
Like the printed samples, the simulated part is composed of 60 layers of 50 µm, resulting from the partition of the initial part. As depicted in
Figure 11, a stainless steel build platform also supports the part and consists of a rectangular parallelepiped, for which its bottom surface is fixed as a boundary condition. Both parts are deformable solid 3D parts. A cohesive contact interaction with a traction-separation behavior is also considered between the part and the build platform to account for bond degradation. At the last step of the simulation, this cohesive contact is deactivated to account for the detachment of the part and allows for the aging simulation. To prevent rigid body motion from occurring, the degrees of freedom of three nodes are constrained according to the 3-2-1 method [
32]. This technique does not induce any reaction force at the constrained nodes and thus has no impact on the final part shape.
To simulate polymerization shrinkage, this work relies on a functionality [
33] capable of modelling curing processes in polymer applications by applying shrinkage depending on the degree of conversion of the material. This functionality requires the use of specific analysis procedures during simulation steps. Therefore, a dynamic implicit analysis procedure [
34] is used in all simulation steps. This procedure allows the study of non-linear responses and large deformations and permits better contact management compared to a static procedure.
The mesh is composed of hexahedral linear element C3D8 and is coincident at the interface between layers. Insulation patterns only depend on the STL file provided; thus, elements are activated at a fixed position without considering the strain of previous layers. Therefore, during the activation step, the nodes on the bottom surface slightly move to ensure coincidence with those of the previous layer without inducing any stress. After a mesh size sensitivity analysis, the average element size is set to 400 µm, resulting in a total of about 360,000 elements in the part.
No thermal contraction/expansion is considered in this work. Indeed, our suspension showed a maximum heating of 10 °C during polymerization. This translates into a maximum linear expansion of about a 0.1%, considering the coefficients of thermal expansion of both alumina and polymer [
24], likely inducing less stress in the part than chemical shrinkage. However, taking into account volume variations would probably be necessary in the case of a highly exothermic reaction.
4.2. Monomer Conversion
Once a layer is activated, its conversion rate increases according to Kamal’s law, as described by the following equation [
35]:
,
,
,
,
, and
represent, respectively, the degree of conversion, the maximum degree of conversion, a rate constant, the universal gas constant, the activation energy, and absolute zero.
and
are reaction constants, and
is the initial degree of conversion. The model considers an initial degree of conversion of zero (
) and a maximum conversion rate
at 0% conversion (
). The effect of temperature and activation energy is also neglected. Therefore, the previous equation can be simplified to determine the evolution of the degree of conversion depending on the time increment
used for iteration:
Laser absorption and differences in exposure between layers may lead to gradients of conversion in each layer and between layers [
11,
23,
25]. Such differences, however, represent a challenge to consider. Therefore, this work makes the assumption that the degree of conversion of each layer is uniform and only depends on the time elapsed since polymerization. This first hypothesis is based on previous work depicting a difference of about 5% between the degree of conversion at the top and the bottom of a layer and good exposure homogeneity in the x and y directions for chosen printing parameters [
11].
The parameters
,
, and
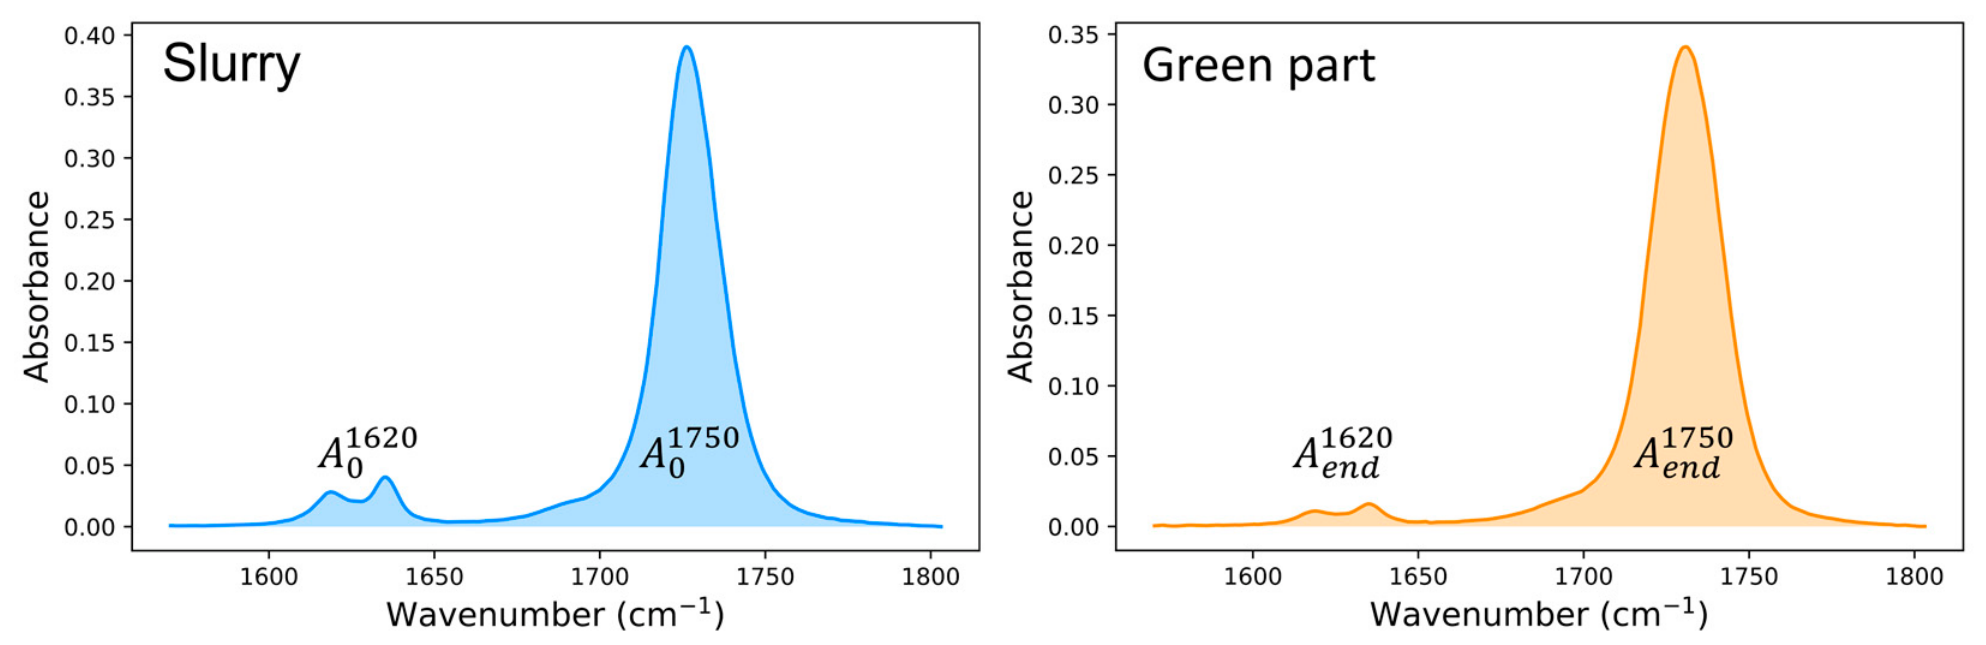
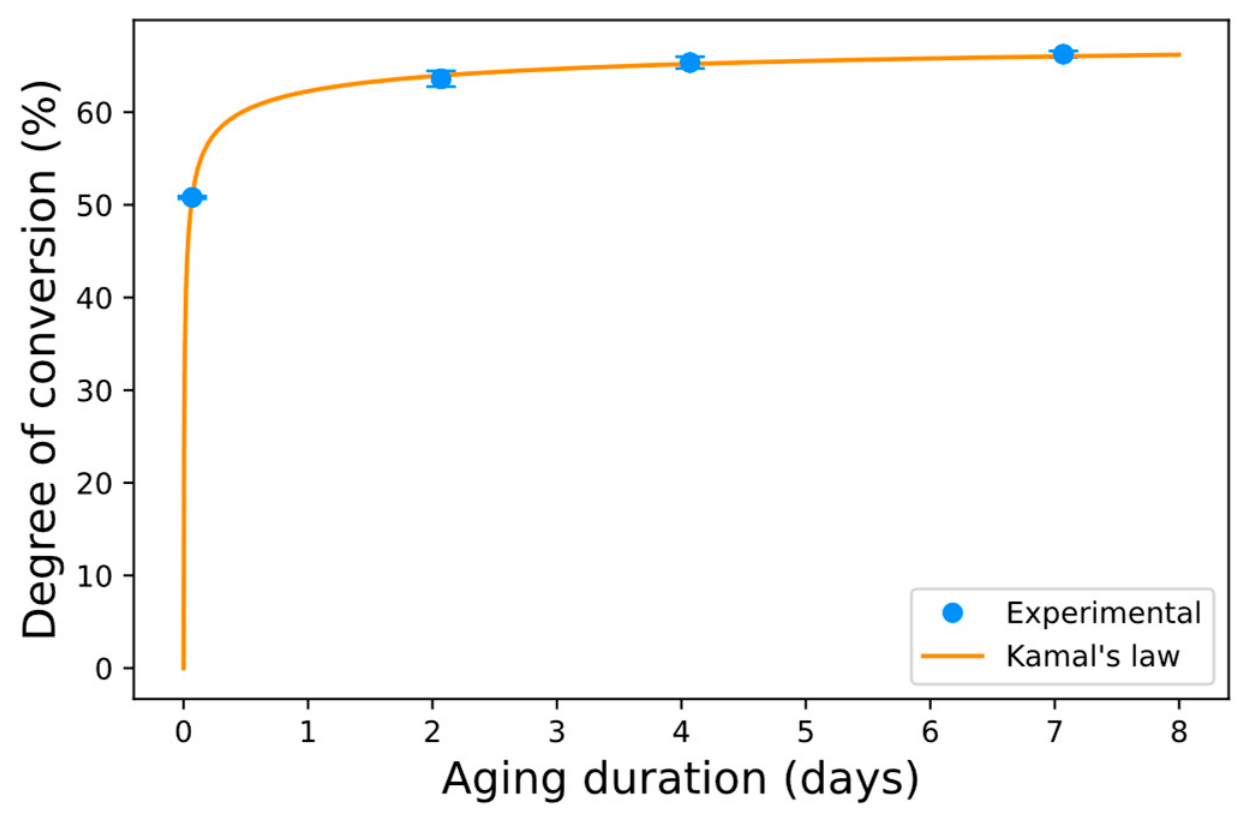
allow us to impose an evolution of the degree of conversion very similar to the experimental measurements.
Figure 12 shows the evolution of the degree of conversion in a layer after its activation at t = 0.
4.3. Polymerization Shrinkage
In the developed model, the deformation ε resulting from polymerization shrinkage directly depends on the degree of conversion
through the introduction of a shrinkage coefficient
, and it is considered isotropic [
33]:
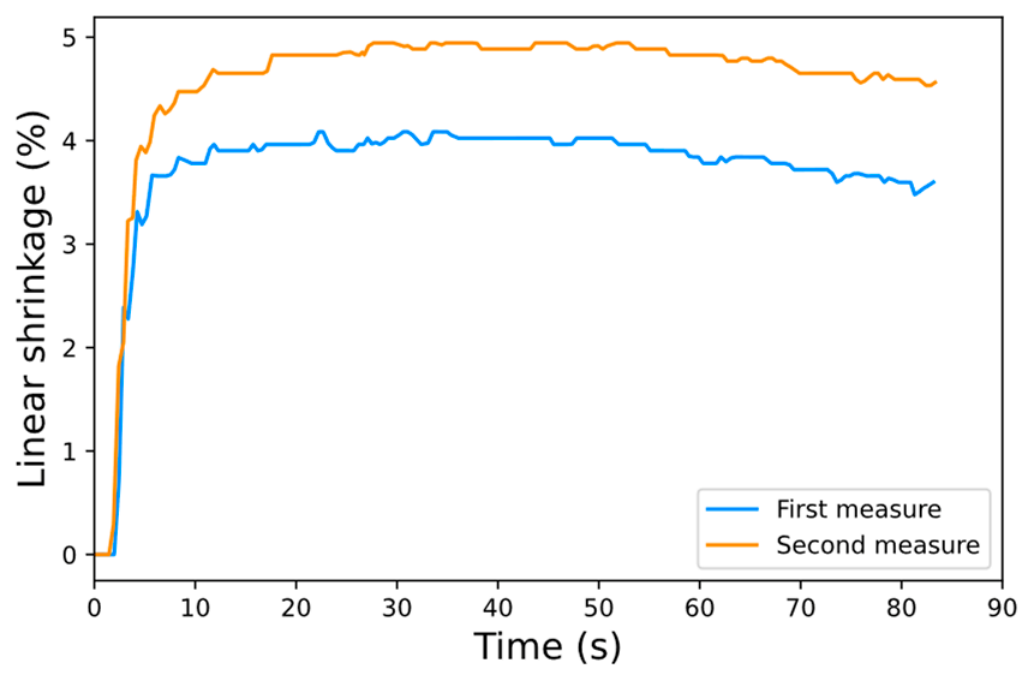
The maximum linear shrinkage was previously (2.2) estimated to 4.5%, and it is hypothesized that this value corresponds to the maximum degree of conversion of the material. Therefore, the model considers a shrinkage coefficient of 0.064, allowing for a linear shrinkage of 4.5% at the maximum conversion of 70%, as determined previously with .
4.4. Mechanical Behavior
The introduction of permanent deformations may be essential in the case of polymer parts, often showing high plastic deformations due to polymer chain stretching and alignment [
36]. Therefore, this work considers an elastoplastic material for the part and elastic stainless steel for the build platform.
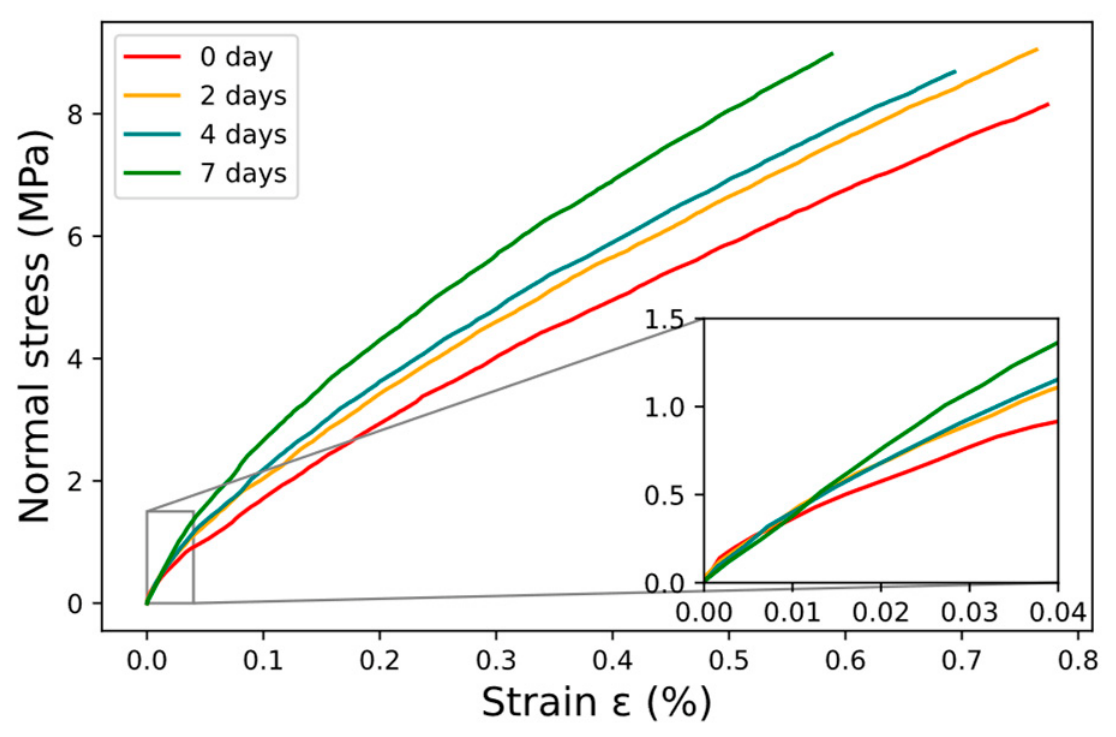
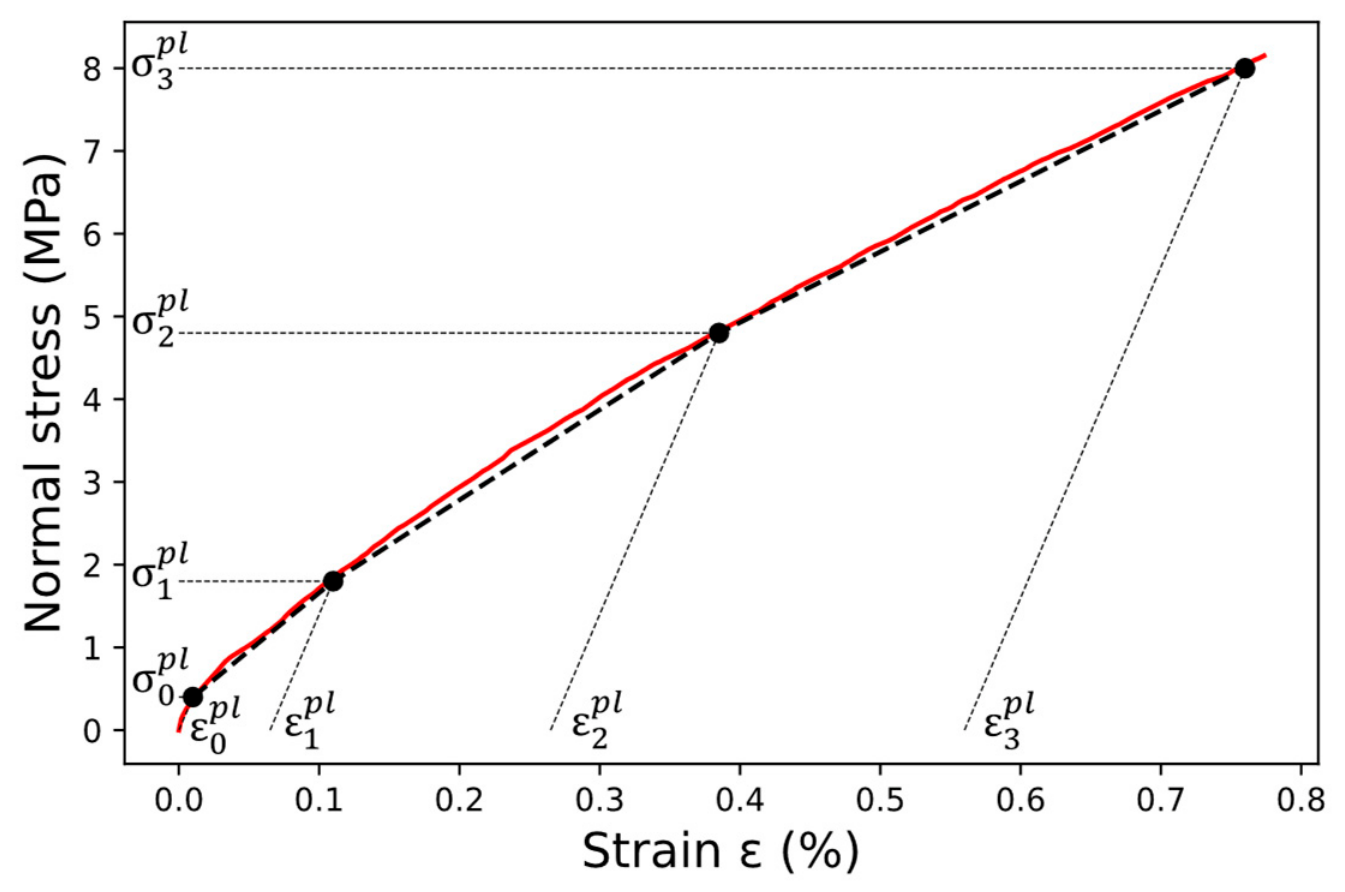
Based on the stress–strain curve of the green part at zero day of aging (
Figure 13), also represented in
Figure 8, Young’s modulus, yield points, hardening points, and the corresponding plastic strains are determined and given in
Table 2.
It is important to note that the model does not account for viscous relaxation over time and material property evolution during polymerization. It also relies on two important assumptions: (i) the hardening curve follows a constant extrapolation after the last hardening point, and the slope becomes zero if the maximum stress is reached, resulting in fully plastic deformation; (ii) once the part is completely detached from the platform, plastic strain remains constant, and any new strain caused by aging is fully elastic.
4.5. Cohesive Contact
To account for the adhesion between the build platform and the part, the model includes a cohesive contact interaction at the interface (
Figure 11). This cohesive contact interaction is created at the very beginning of the simulation and deactivated after the activation of all layers to simulate the detachment of the part from the platform. The part is then able to deform freely and relax some of the stresses accumulated during the process.
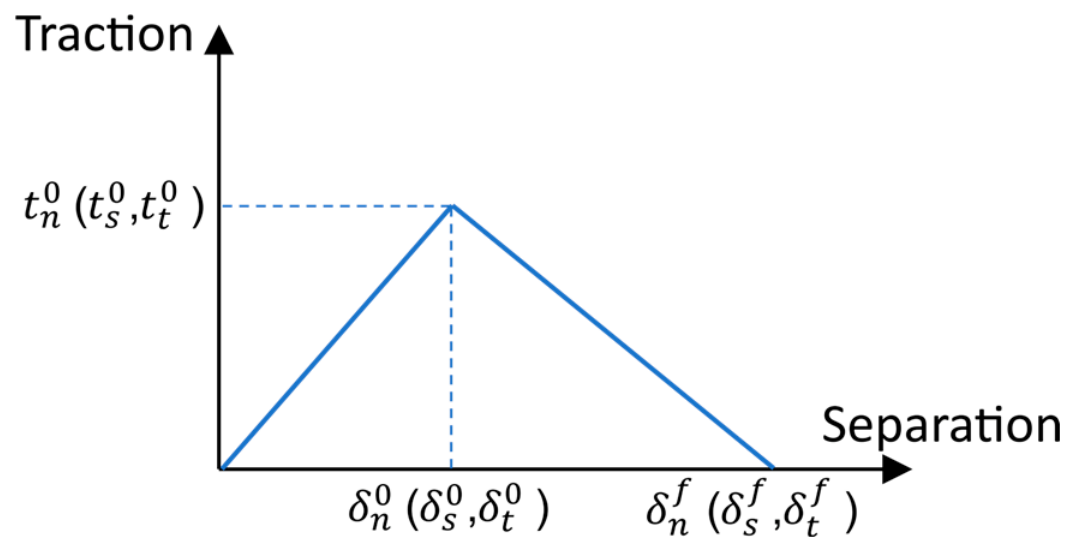
The cohesive contact interaction follows a traction–separation law, illustrated in
Figure 14. This interaction allows each node at the interface to be virtually linked to the platform with a spring of stiffness
, until reaching a maximum contact stress
at the initiation of separation
. Once this distance is reached, the spring’s stiffness gradually degrades until it reaches zero at the failure separation
.
The relationship between the tensile stress and the separation is defined by the following expression [
38,
39,
40]:
where
denotes the spring stiffness matrix, and
is the contact stress vector for which its three components
,
, and
(Pa) are oriented, respectively, along the
,
, and
axes. The corresponding separations along these three axes are denoted by
,
, and
(m). In order to simplify the model, two assumptions are made about the contact: (i) the coefficients are uncoupled,
, and (ii) the contact stiffness is isotropic,
.
The contact stress damage initiation criterion is evaluated using the contribution of each component. Degradation starts when this quadratic stress criterion, represented as follows, reaches a value of one:
Compressive normal contact stress does not lead to any contact degradation; thus, only traction normal contact stress is able to initiate damage in this direction. Once damage initiates, contact stress is reduced with the help of a damage variable D, increasing from 0 to 1 upon degradation:
where
,
, and
are the contact stress components predicted by the elastic traction-separation behavior for the current separations without damage. The damage variable
evolves with linear softening from the initiation of separation
to the given failure separation
.
4.6. Simulation Steps
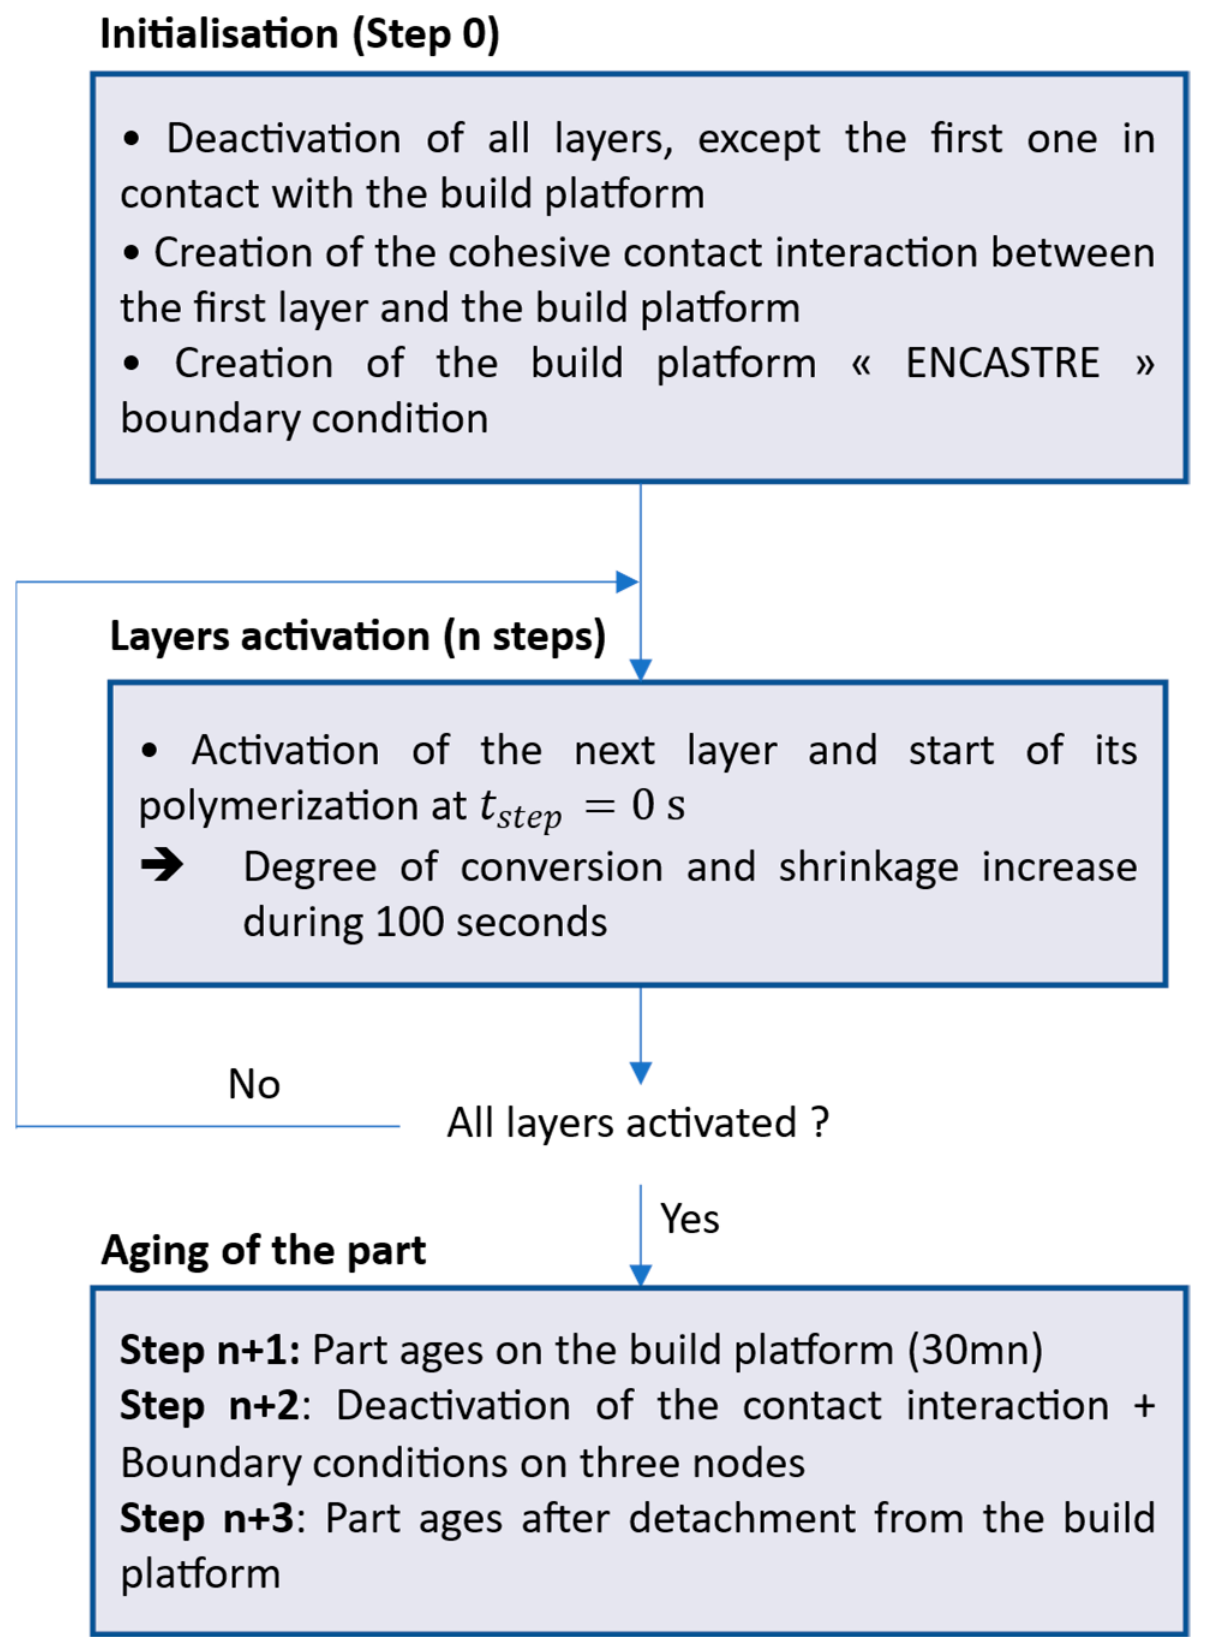
The different stages of the simulation are described in
Figure 15. After an initialization step, this model simulates additive manufacturing in stereolithography through the repetition of a loop. This loop consists of (i) the instantaneous activation of the printed top layer and (ii) a progressive increase in the degree of conversion and shrinkage of this layer and the previous ones over 100 s, based on kinetics provided by Kamal’s law. After the activation of all layers and an aging step of 30 min on the build platform, the deactivation of the cohesive interaction with the platform and the application of constraints on three nodes allow the part to deform freely without rigid body motion. The stresses generated during the printing process and aging then cause the part to warp over time. The time increment
is fixed at 10 s until part detachment (step n + 2), and it progressively increases upon the last step.
5. Results and Discussions
First, this work compares the case of a part completely tied to the build platform until contact deactivation (step n + 2) with the case of cohesive interactions. As a first approach to this phenomenon and in order to prove the impact of adhesion, this work considers only one contact stiffness of 5 and maximum contact stresses of 5 in each direction, corresponding to damage initiation at a separation of 1 µm and a complete failure of the contact at a distance of 5 µm. These low separation values express a nearly instantaneous break in the part–platform bond once the maximum contact stress is reached.
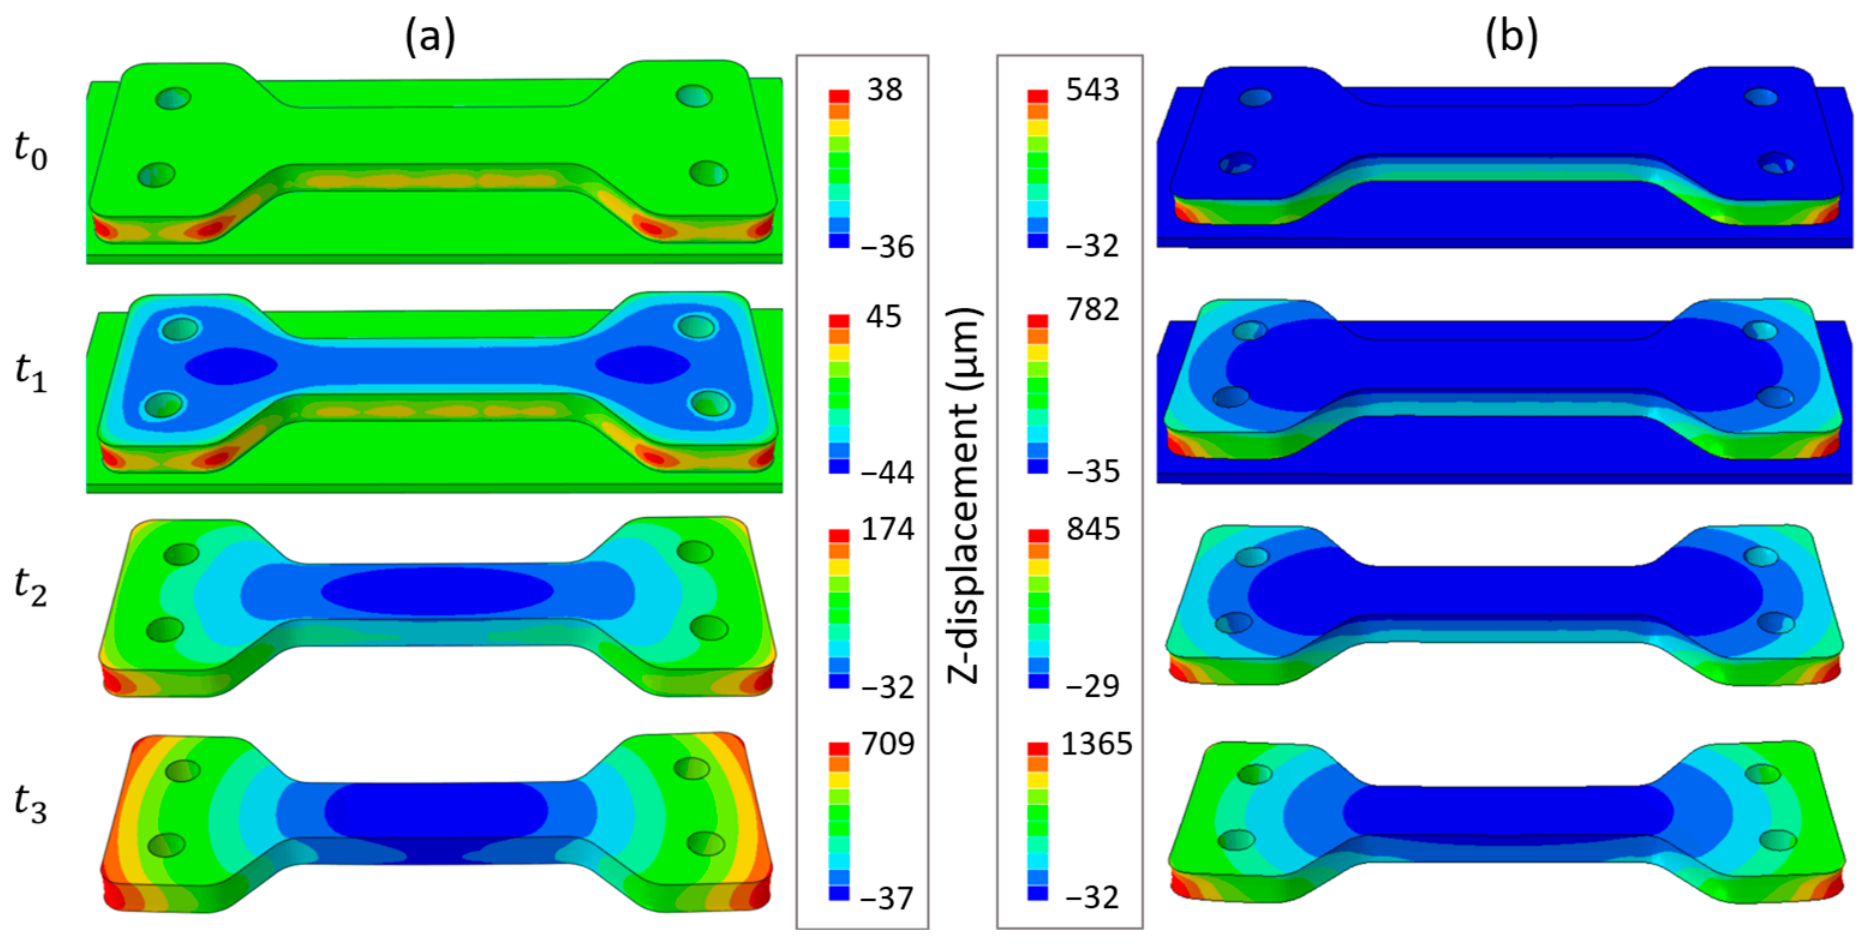
Figure 16 displays the
-displacement over time of the simulated parts, from the end of the printing process to 2 h of aging, for (a) a part tied to the platform and (b) a part with cohesive contact. During printing, any bottom surface tied or still in cohesive contact with the build platform cannot shrink in the
and
directions.
The upper layers that do not meet this boundary condition are able to slightly shrink, but the -displacement remains low and inferior to the layer thickness until activation of all layers. However, it is important to note that this displacement, mainly observed around the borders of the top surface, increases with vertical distance to the plate, eventually reaching a layer thickness for sufficiently high or unsupported parts and causing scraping issues. This model may then be helpful in determining suitable supports.
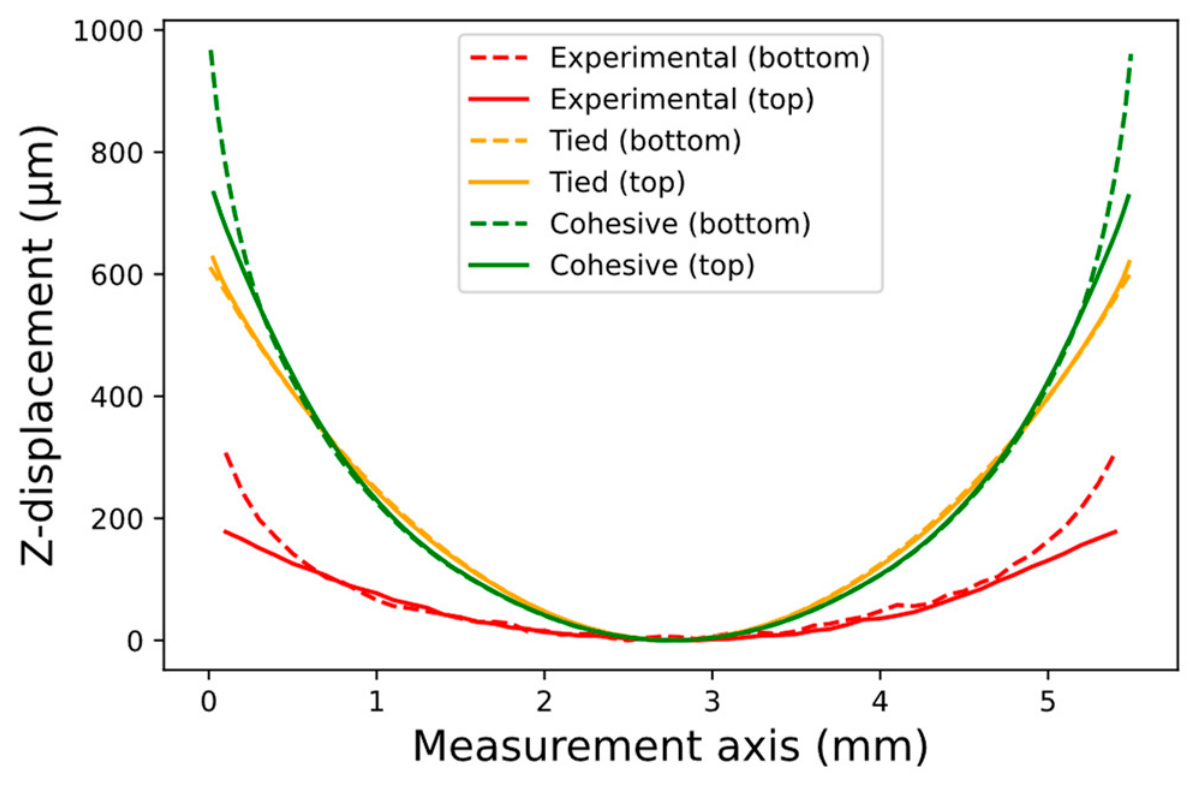
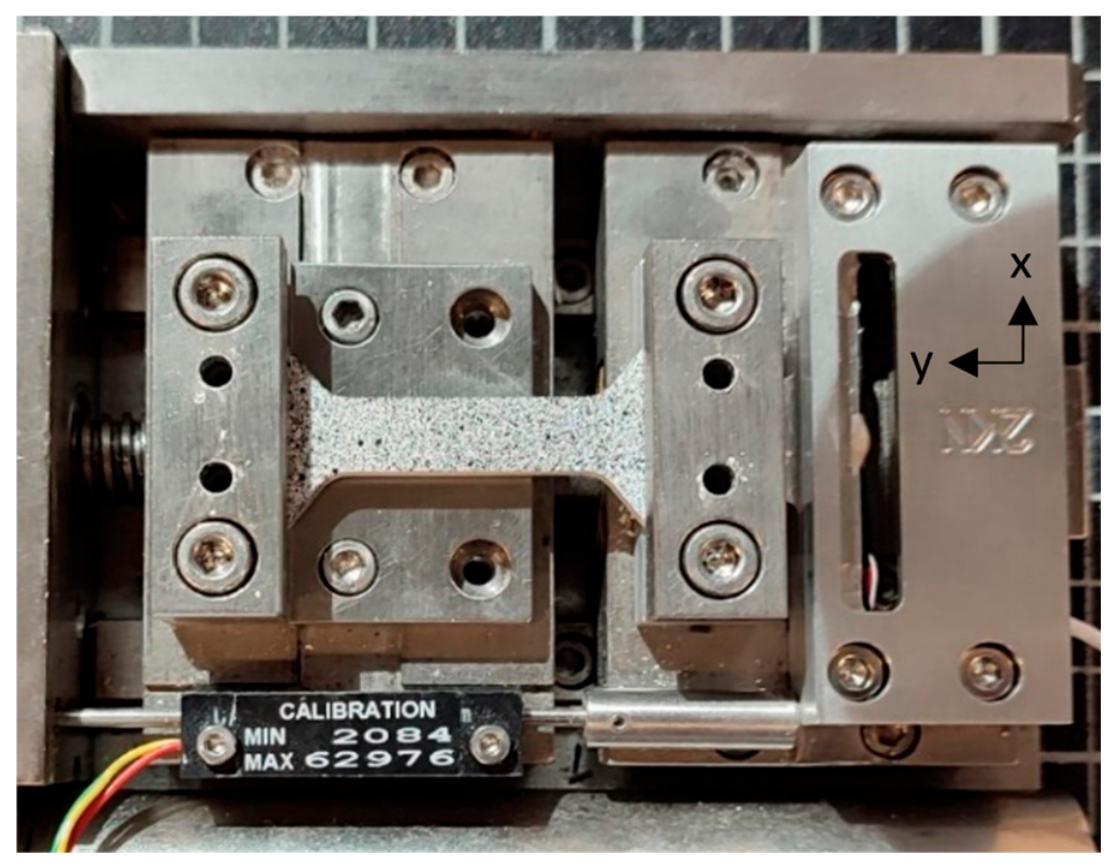
Curling of the part over time is monitored using the displacement over the
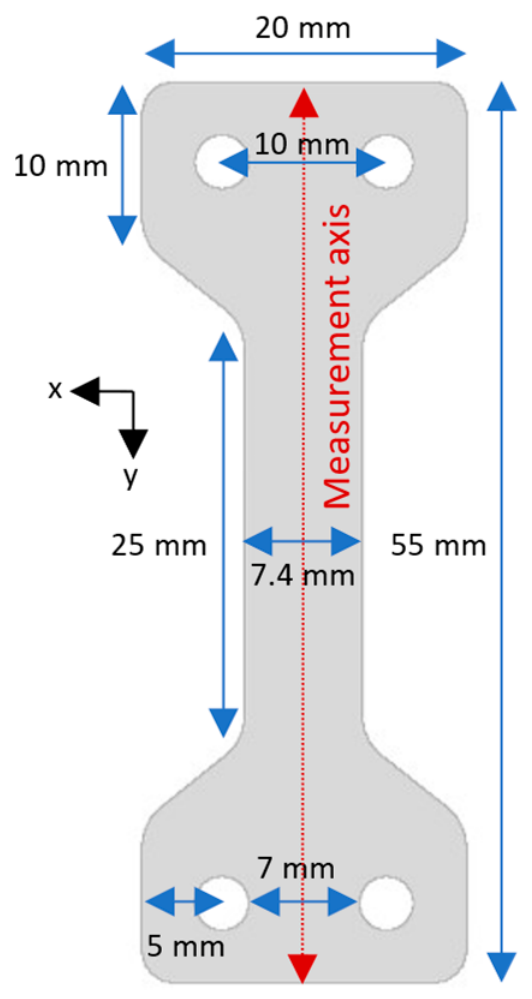
-direction along the measurement axis, as shown in
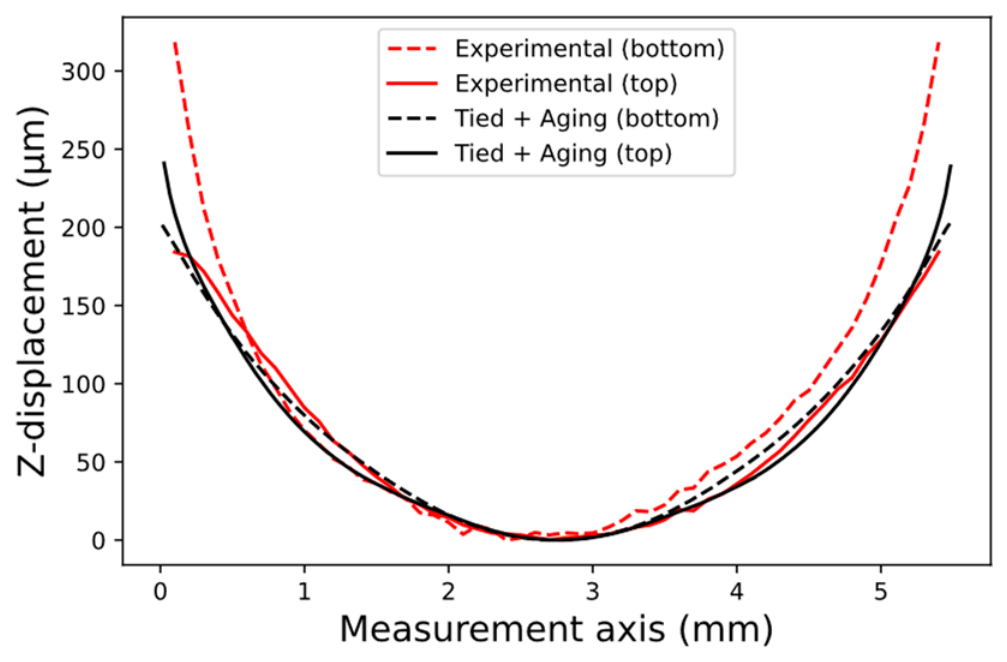
Figure 7. The simulated displacements for both contact conditions are then compared to the experimental measurements in
Figure 17. To facilitate observations, the displacement on the top surface is slightly shifted by 30–40 µm towards a positive
in order to set the minimum to zero.
Though the curve has the same shape, the simulated curling phenomenon appears to be much higher than the experimental one. These discrepancies can be attributed to several unmodeled physical factors. First, viscoelastic relaxation is not considered in the current model, whereas it could be responsible for a substantial reduction in long-term residual stresses and warping. Furthermore, localized material damage due to mechanical fatigue may develop during the printing process, which would contribute to relieving residual stresses and reducing the overall curling magnitude [
41]. Another significant simplification is the omission of light irradiation from the upper layers; this additional exposure strongly influences the conversion kinetics of the underlying material and the subsequently generated stresses. Finally, a more complex consideration of the continuous evolution of mechanical properties upon polymerization could also lead to lower final stresses in the printed part. It should be noted that it is highly challenging to estimate the contribution of each of these factors to the observed discrepancies between the experimental and numerical displacement values.
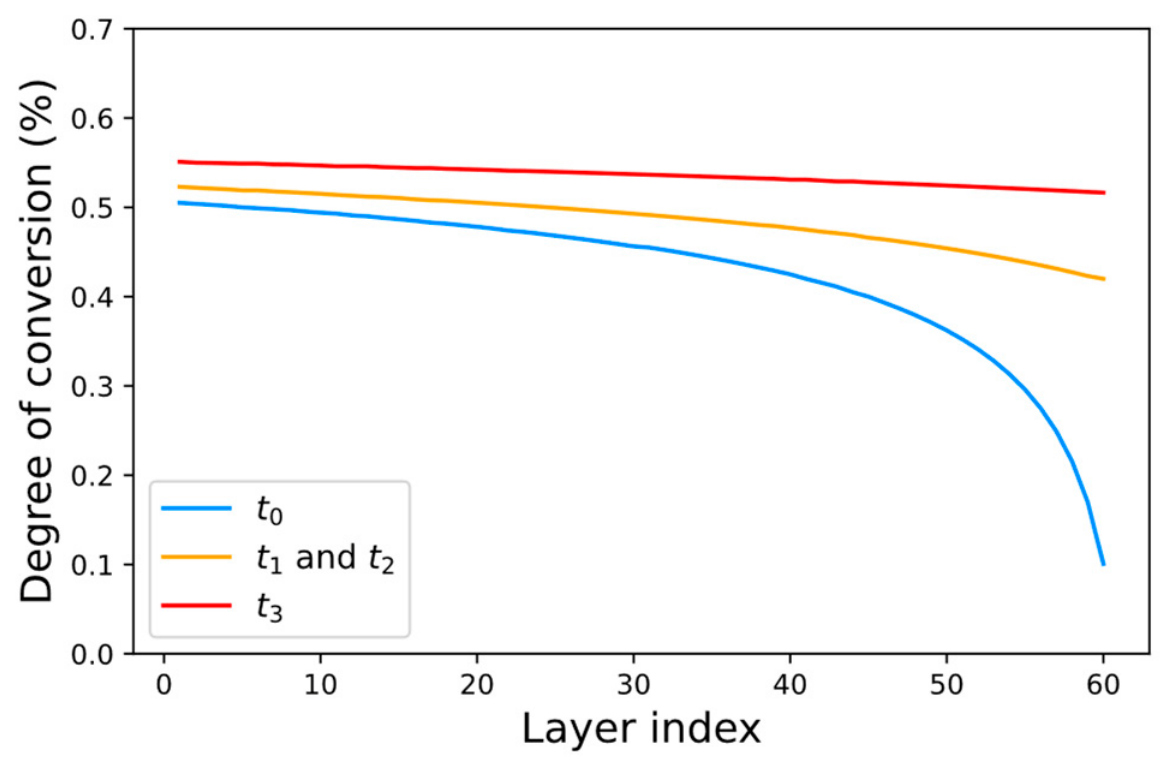
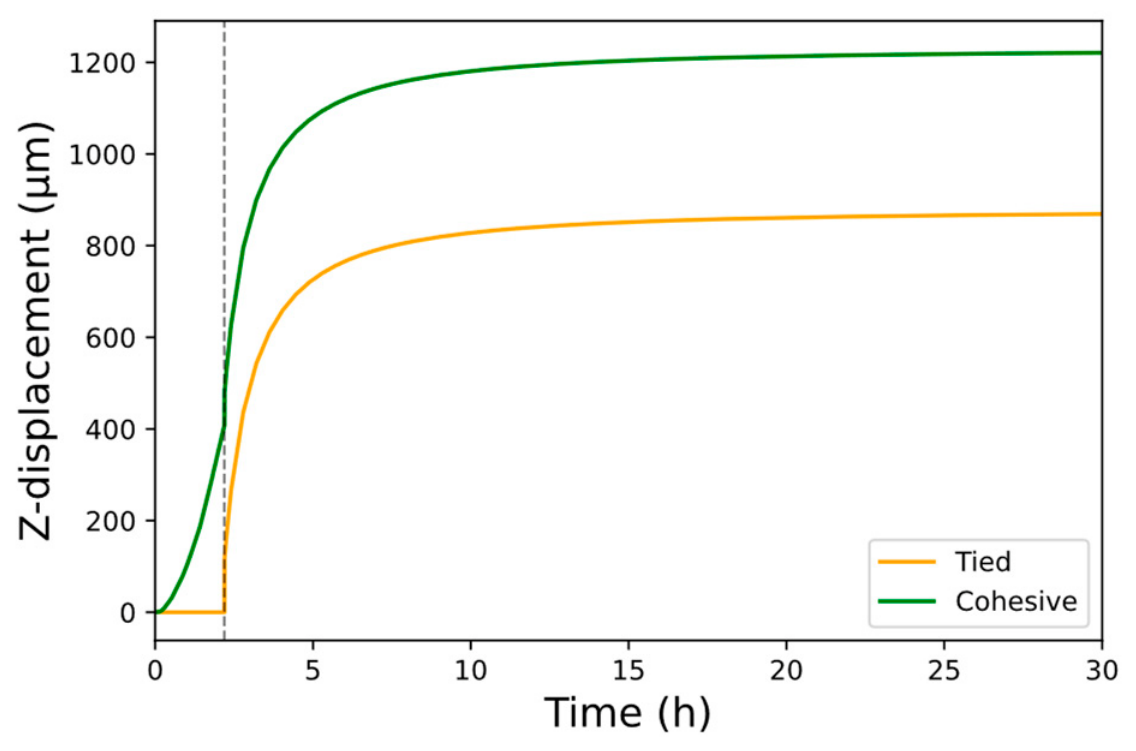
Just after detachment, the degree of conversion is lower in the last printed layers than in the first ones, but it keeps increasing and causing shrinkage all along the aging step, as illustrated in
Figure 18. With the rise being higher in the last layers, the associated shrinkage is also higher and is therefore responsible for the accentuation of the curling phenomenon over time.
The displacement quickly increases during the first hours of aging, until stabilizing when the degree of conversion differences in the part approaches zero. With shrinkage being the source of over-time deformations, aging highly depends on polymerization kinetics, and thus, it may induce substantial post-detachment warping with respect to slow kinetics or almost no effect with respect to already complete polymerization.
The appearance of curling can also be justified with normal stress in the
-direction.
Figure 19 shows the stress tensor component for both simulated parts before and after the detachment of the platform. A cross-section at
allows for internal observations. A positive value means that the material is under tension along this direction, while a negative value indicates a compressive state. Before detachment, both parts mainly exhibit tensile stress, with higher stress
around the top center of each part. This stress gradient in the
-direction leads to the curling of the part just after detachment, allowing for the balance of residual stress. By opening the part–platform interface during printing, the part printed with cohesive interactions is able to shrink with fewer constraints, and thus, it exhibits higher compressive stresses in these areas.
The progressive opening of the interface during printing and the curling evolution over time are illustrated in
Figure 20, showing the
-displacement of a node located at the very end of the measurement axis for both simulated parts. No opening of the interface occurs for the tied part. In comparison, cohesive contact allows the node to move up to 400 µm along the
-axis before deactivation of the contact. Contact condition deactivation leads to elastic springback of the part, leading to instantaneous warping upon detachment from the platform. This instant displacement is observed for both parts, but it is higher for the tied part since its interface stored more elastic energy during printing [
42]. This translates into higher tensile stresses before detachment (
Figure 19).
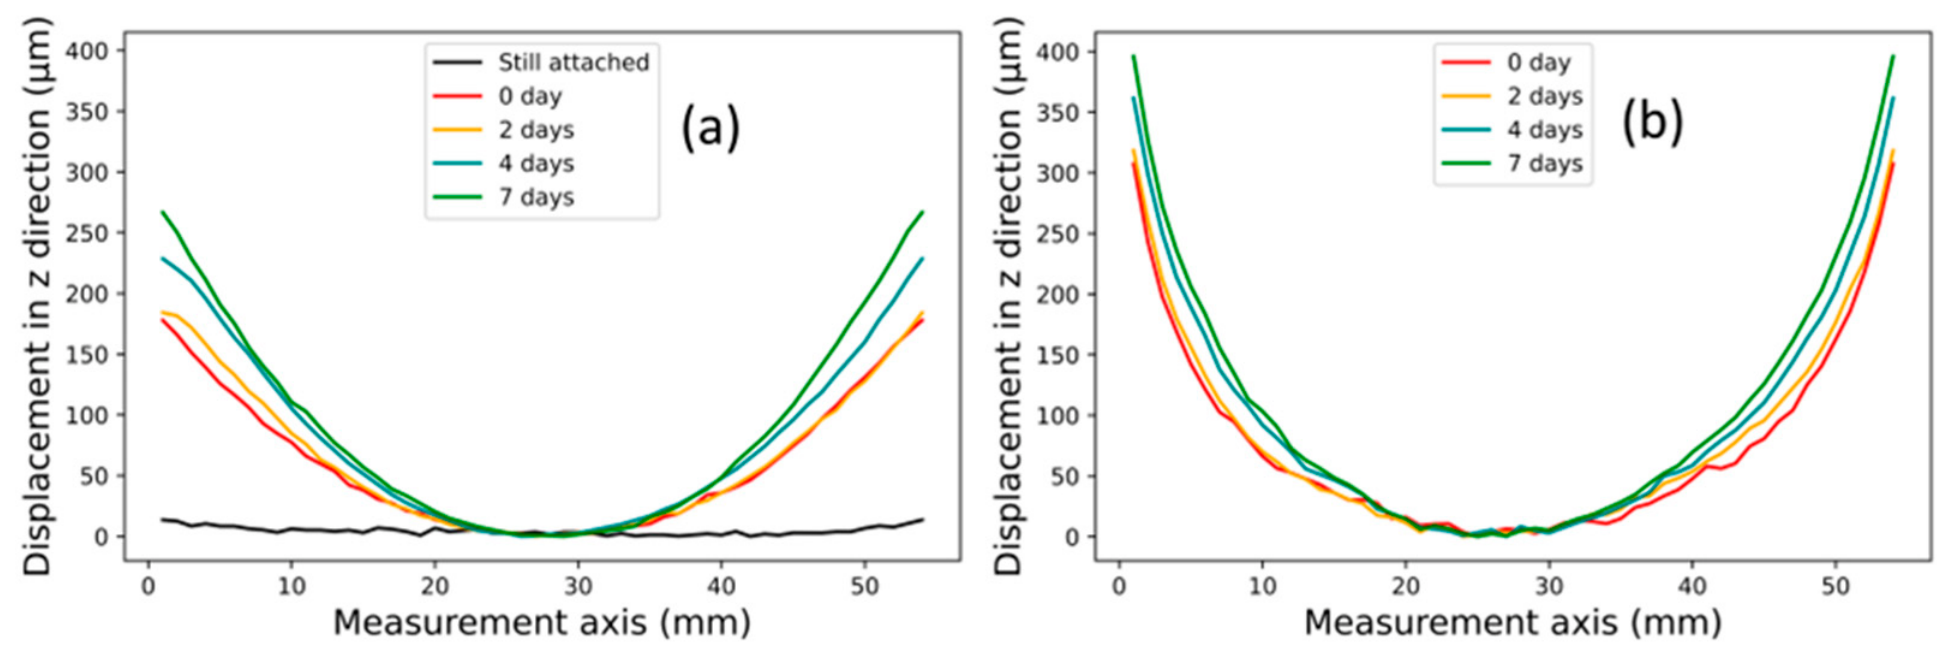
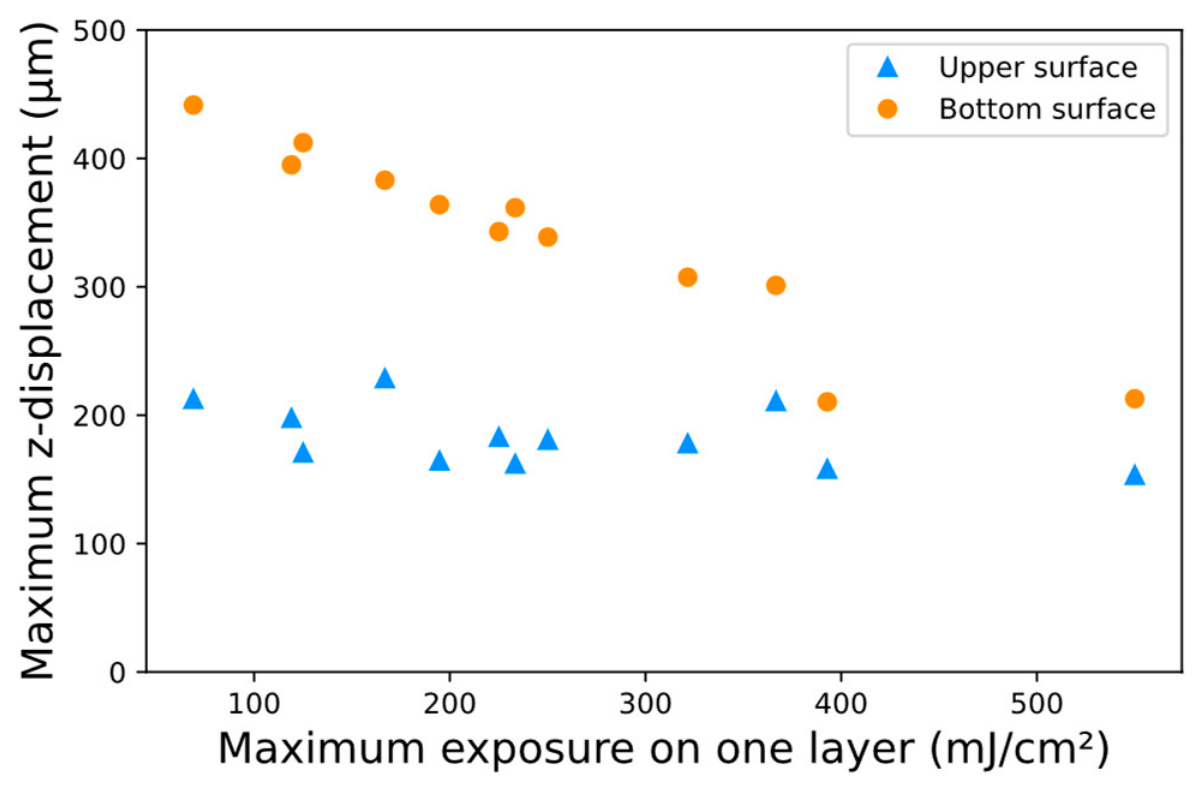
The introduction of the cohesive contact allowed the reproduction of the displacement difference between the bottom and top surfaces, as observed experimentally (
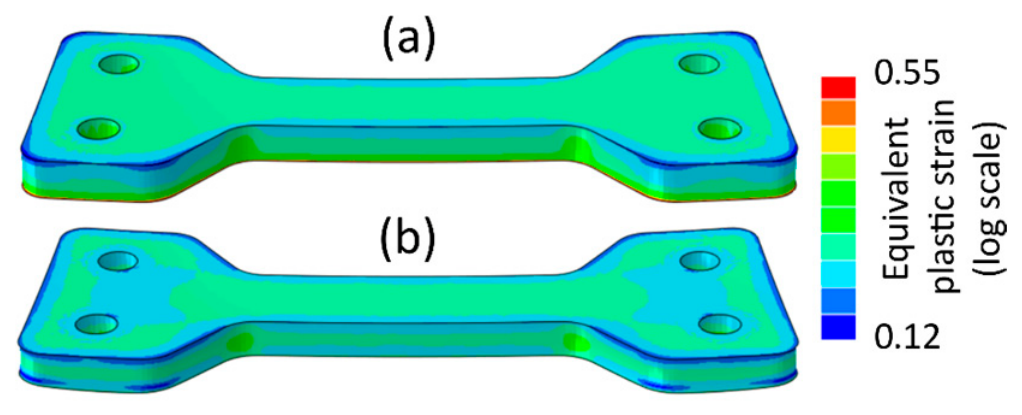
Figure 9). The cohesive contact also induces a larger curling phenomenon compared to the tied part. These differences between the two contact conditions are justified by the plastic strain field, especially around the borders of the part.
Figure 21 shows the equivalent plastic strain field (PEEQ) in the two parts just after detachment. Stress indeed accumulates faster in the tied part due to contact conditions, resulting in increased plastic hardening. Therefore, the tied part that accumulated more plastic strain before detachment undergoes less elastic strain, resulting in a slightly different curling profile.
The influence of subsequent insulations on the degree of conversion may result in both faster polymerization kinetics and a higher overall degree of conversion, as well as a larger gradient in the printing direction [
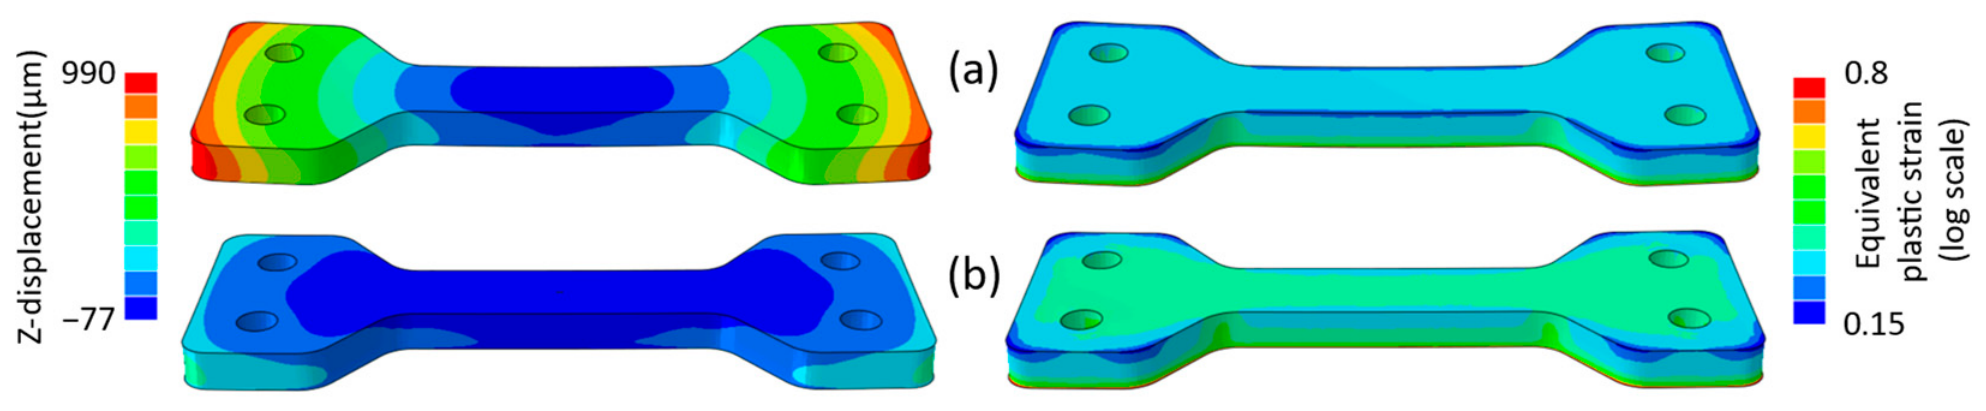
25]. Such a different field would cause more plastic strain before part detachment. Along with the neglect of mechanical property evolution and viscous relaxation, this may be another factor explaining the difference between the experimental and simulated dimensions. Since the aging duration on the build platform has an influence on the degree of conversion, it also impacts the proportion of plastic strain and thus the final part’s dimensions, as evidenced in
Figure 22, which shows the influence of aging duration on the build platform on both the post-stabilization dimensions and the equivalent plastic strain. Indeed, aging while the part remains tied to the build platform results in higher plastic strain. This induces a much smaller curling phenomenon, comparable to the experimental measurements (
Figure 23). This result highlights the critical role of the degree of conversion kinetics and plastic strain in understanding green part deformation and in improving the precision of the stereolithography process.
6. Conclusions and Perspectives
Predicting the deformation of a ceramic green part printed by stereolithography is one of the key points for optimizing the process. A finite element model was developed in this work to provide insights for improving the dimensional accuracy of parts produced by stereolithography.
Accounting for polymerization shrinkage, the time dependency of the degree of conversion to integrate the aging of green parts and the elastoplastic behavior of the material enabled the simulation of the curling phenomenon. The progressive increase in the degree of conversion and shrinkage led to an intensification of curling upon aging. Although showing differences in the simulated displacement magnitudes, this model provided a numerical validation for deformations often observed experimentally.
It was experimentally observed that the adhesion force between the part and the build platform has a direct impact on the shape and dimensions of the green part after printing. This adhesion force, depending on the exposure used during printing, degrades during the process due to shrinkage-induced stress. Low adhesion may cause printing issues and must therefore be avoided. The consideration of a rigid cohesive contact to model part–platform adhesion allowed for a better replication of the experimental observations. The model confirms that applying strong irradiation (overcuring) to the first layer helps reduce the final deformation of the printed part. This increased exposure ensures stronger adhesion to the build platform, which is mechanically represented in this study by the “tied” contact condition.
Improving platform adhesion, accelerating polymerization kinetics, or reducing the volumetric shrinkage of the photosensitive suspension could be viable solutions to help minimize dimensional issues of green parts in stereolithography. More significant plastic behavior could also help increase plastic strain during printing and thus limit the effective deformations primarily caused by the elastic component. In addition to these material-related approaches and for complex geometries, the strategic addition of support structures forces the part being printed to undergo higher plastic deformations during the printing process. Increased constraints lead to higher localized plastic strains, which effectively limit the residual elastic deformations responsible for springback and warping after printing.
Stereolithography involves numerous chemical, thermal, and mechanical phenomena that are challenging to fully capture. This work does not yet aim to precisely predict part dimensions but rather offers insights for better understanding the mechanical behavior during printing. Accounting for other factors, such as viscous relaxation, the effect of prior layer exposure, the heterogeneity of the degree of conversion within a layer, or even the anisotropy and evolution of mechanical properties upon polymerization and aging, could lead to more precise predictions of residual stresses and final dimensions in future versions of this model.