Article

Mapping the Mine: Combining Portable X-ray Fluorescence, Spectroradiometry, UAV, and Sentinel-2 Images to Identify Contaminated Soils—Application to the Mostardeira Mine (Portugal)

1
Department of Geosciences, University of Évora, 7000-671 Évora, Portugal
2
Institute of Earth Sciences, Évora Pole, 7000-671 Évora, Portugal
3
Institute for Advanced Studies and Research, 7000-671 Évora, Portugal
4
Earth Remote Sensing Laboratory—EaRSLab, 7000-671 Évora, Portugal
*
Author to whom correspondence should be addressed.
Remote Sens. 2023, 15(22), 5295; https://doi.org/10.3390/rs15225295
Submission received: 15 October 2023 / Revised: 6 November 2023 / Accepted: 7 November 2023 / Published: 9 November 2023
(This article belongs to the Section Remote Sensing in Geology, Geomorphology and Hydrology)

Abstract

:
Old and abandoned mines are testimonials of ancient industrial activities, and as such, they are able to convey environmental concerns. A multidisciplinary approach combining ground measurements—i.e., portable X-ray fluorescence and optical spectroradiometry—with airborne multispectral images—i.e., Sentinel-2 and unmanned aerial vehicles—was conducted to define a baseline for the characterization of areas that constitute environmental burdens. The Mostardeira mine, an old copper mine located in the Portuguese Ossa-Morena Zone, was selected as a case study. The results reveal that the soils have toxic metals—e.g., As (mean = 1239 ppm) and Cu (mean = 435 ppm)—above the defined health thresholds. The spectroradiometry provided insights into the soil characterization using data from the vis-NIR spectral region, allowing us to distinguish agricultural soil, mine waste, and bare soils. The spectra obtained are comparable with the USGS soil spectra standards, namely Clinozoisite Epidote HS299, Hematitic Alt. Tuff CU91-223, and Sand DWO-3-DEL2ar1 no oil. The airborne images considered through the lens of principal components analysis and supervised and unsupervised machine learning techniques (random forest and K-means) are found to be effective tools in creating cartographic representations of the contaminated soils. The collected data are used to construct a baseline for characterizing these environmentally challenging areas, whereas the methodological approach is revealed to be successful for tackling the posed environmental problems, allowing us to map the old mine environment passives.

1. Introduction

Abandoned mining areas are considered to be post-industrial landscapes [1] and correspond to a Janus-faced dilemma. On one hand, they pose a high health risk for humans and animals, contaminating plants, soils, surface water, ground waters, and even in some cases even the air; on the other hand, they constitute added value, as a possible source of raw materials in a circular economy paradigm. Moreover, these areas are often considered to be pieces of patrimonial, cultural, and social heritage by the population. This double-sided view is reflected in conclusions from recent works that studied the relationship between the populations from abandoned mine sites and the territory [1,2,3]. This vision is unmistakeably reflected in some of the remarks and conclusions of the authors. For example, [1] concludes that “one should wonder is whether erasing the traces of mining history also erases the emotional traces of the place’s inhabitants and workers”, emphasizing the connection between the population and the physical testimonies of their history. It is not uncommon that different authors suggest that “to achieve successful results in reclamation studies, multidisciplinary approach enriched with the latest technological means is highly required” [3].
However, many of the works related to contaminated soils from mining activities propose holistic approaches to address this problem; most of the existing literature tallies to a one-sided view that is commonly related to the subject area of the authors.
The geochemical studies enhance mostly the quantification and chemical behaviour of elements in specific environments, facing mobilisation conditions due to changes in pH, redox reactions, and mineral breakdown during mine drainage; e.g., [4,5,6]. The portable X-ray fluorescence equipment proved its usefulness for studying the metal contents of contaminated soils in numerous cases reported in the literature; e.g., [7,8,9,10,11].
Other studies relate chemical composition with the spectral response of materials commonly in the Visible-near-infra-red regions, e.g., [12,13], and identifying spectral signatures of materials with implications in the characterization of the soils and mine tailings. The use of soil spectroradiometry for identifying the characteristics of soils is widespread in the literature; e.g., [14,15,16].
There is also a plethora of studies on hydrothermal alterations, structural lineaments, acid mine drainage systems, and mineral exploration using satellite images—e.g., [17,18,19,20,21] —providing regional maps of prospective, present, and past mining explorations. However, the comprehensive consultation of these works reveals that most of them deal with a regional district and provincial scale (1:10,000 to 1:100,000), not providing high resolution maps (1:5000 to 1:1000) that are commonly and effectively used in the majority of mine scale studies.
The present-day literature contains few all-inclusive articles about multidisciplinary studies on the impact of old mine explorations in natural systems. In the Portuguese context, Quental et al. [21] provides a comprehensive study of the Iberian Pyrite Belt by mostly using multi and hyperspectral images. For the Mostardeira Mine and the Ossa Morena Zone old and abandoned mines, there exists an internal report from the Instituto Geológico e Mineiro [22] regarding a preliminary assessment of environmental problems from abandoned mines.
Converging diverse mappable criteria of both the geochemical dispersion through soils and other residues in mine sites to a unifying outcome offers a straightforward overview of mine drainage, and an easy-to-use method for environmental characterization and further assessment. Our work, combining ground level data with airborne and orbital data, is a novel approach that provides useful insights for the characterization and understanding of old mine sites and mining regions.

2. Geological and Mining Background

The southwest of Iberia is known worldwide for its multiple sources of copper in distinct geological contexts, defined by two main tectonostratigraphic zones (Figure 1): the Ossa-Morena Zone (OMZ) and the South Portuguese Zone (SPZ). The SPZ is home of the Iberian Pyrite Belt, which comprises world-class copper deposits consisting of massive masses of copper sulphides with its origins related to important Carboniferous volcanic activity [7,23,24]. Contrarily, the OMZ has numerous small, clustered copper deposits mainly composed of sulphides and carbonates associated with quartz veins and corresponding enrichment areas. This is due to hydrothermal fluid circulation in the Ordovician-to-Devonian strata that filled the late fault networks. Historically, most of these deposits were discovered and exploited in Roman times, and its exploitation assisted a boom during the Industrial Revolution in the 19th century [25] that faded from then until the present day.
These old exploitations, many of which were abandoned during the early 20th century, constitute an environmental liability burden that is a hazard to environmental and human health. It must be addressed by evaluating the risk associated with the possible contamination of soils and aquifers.
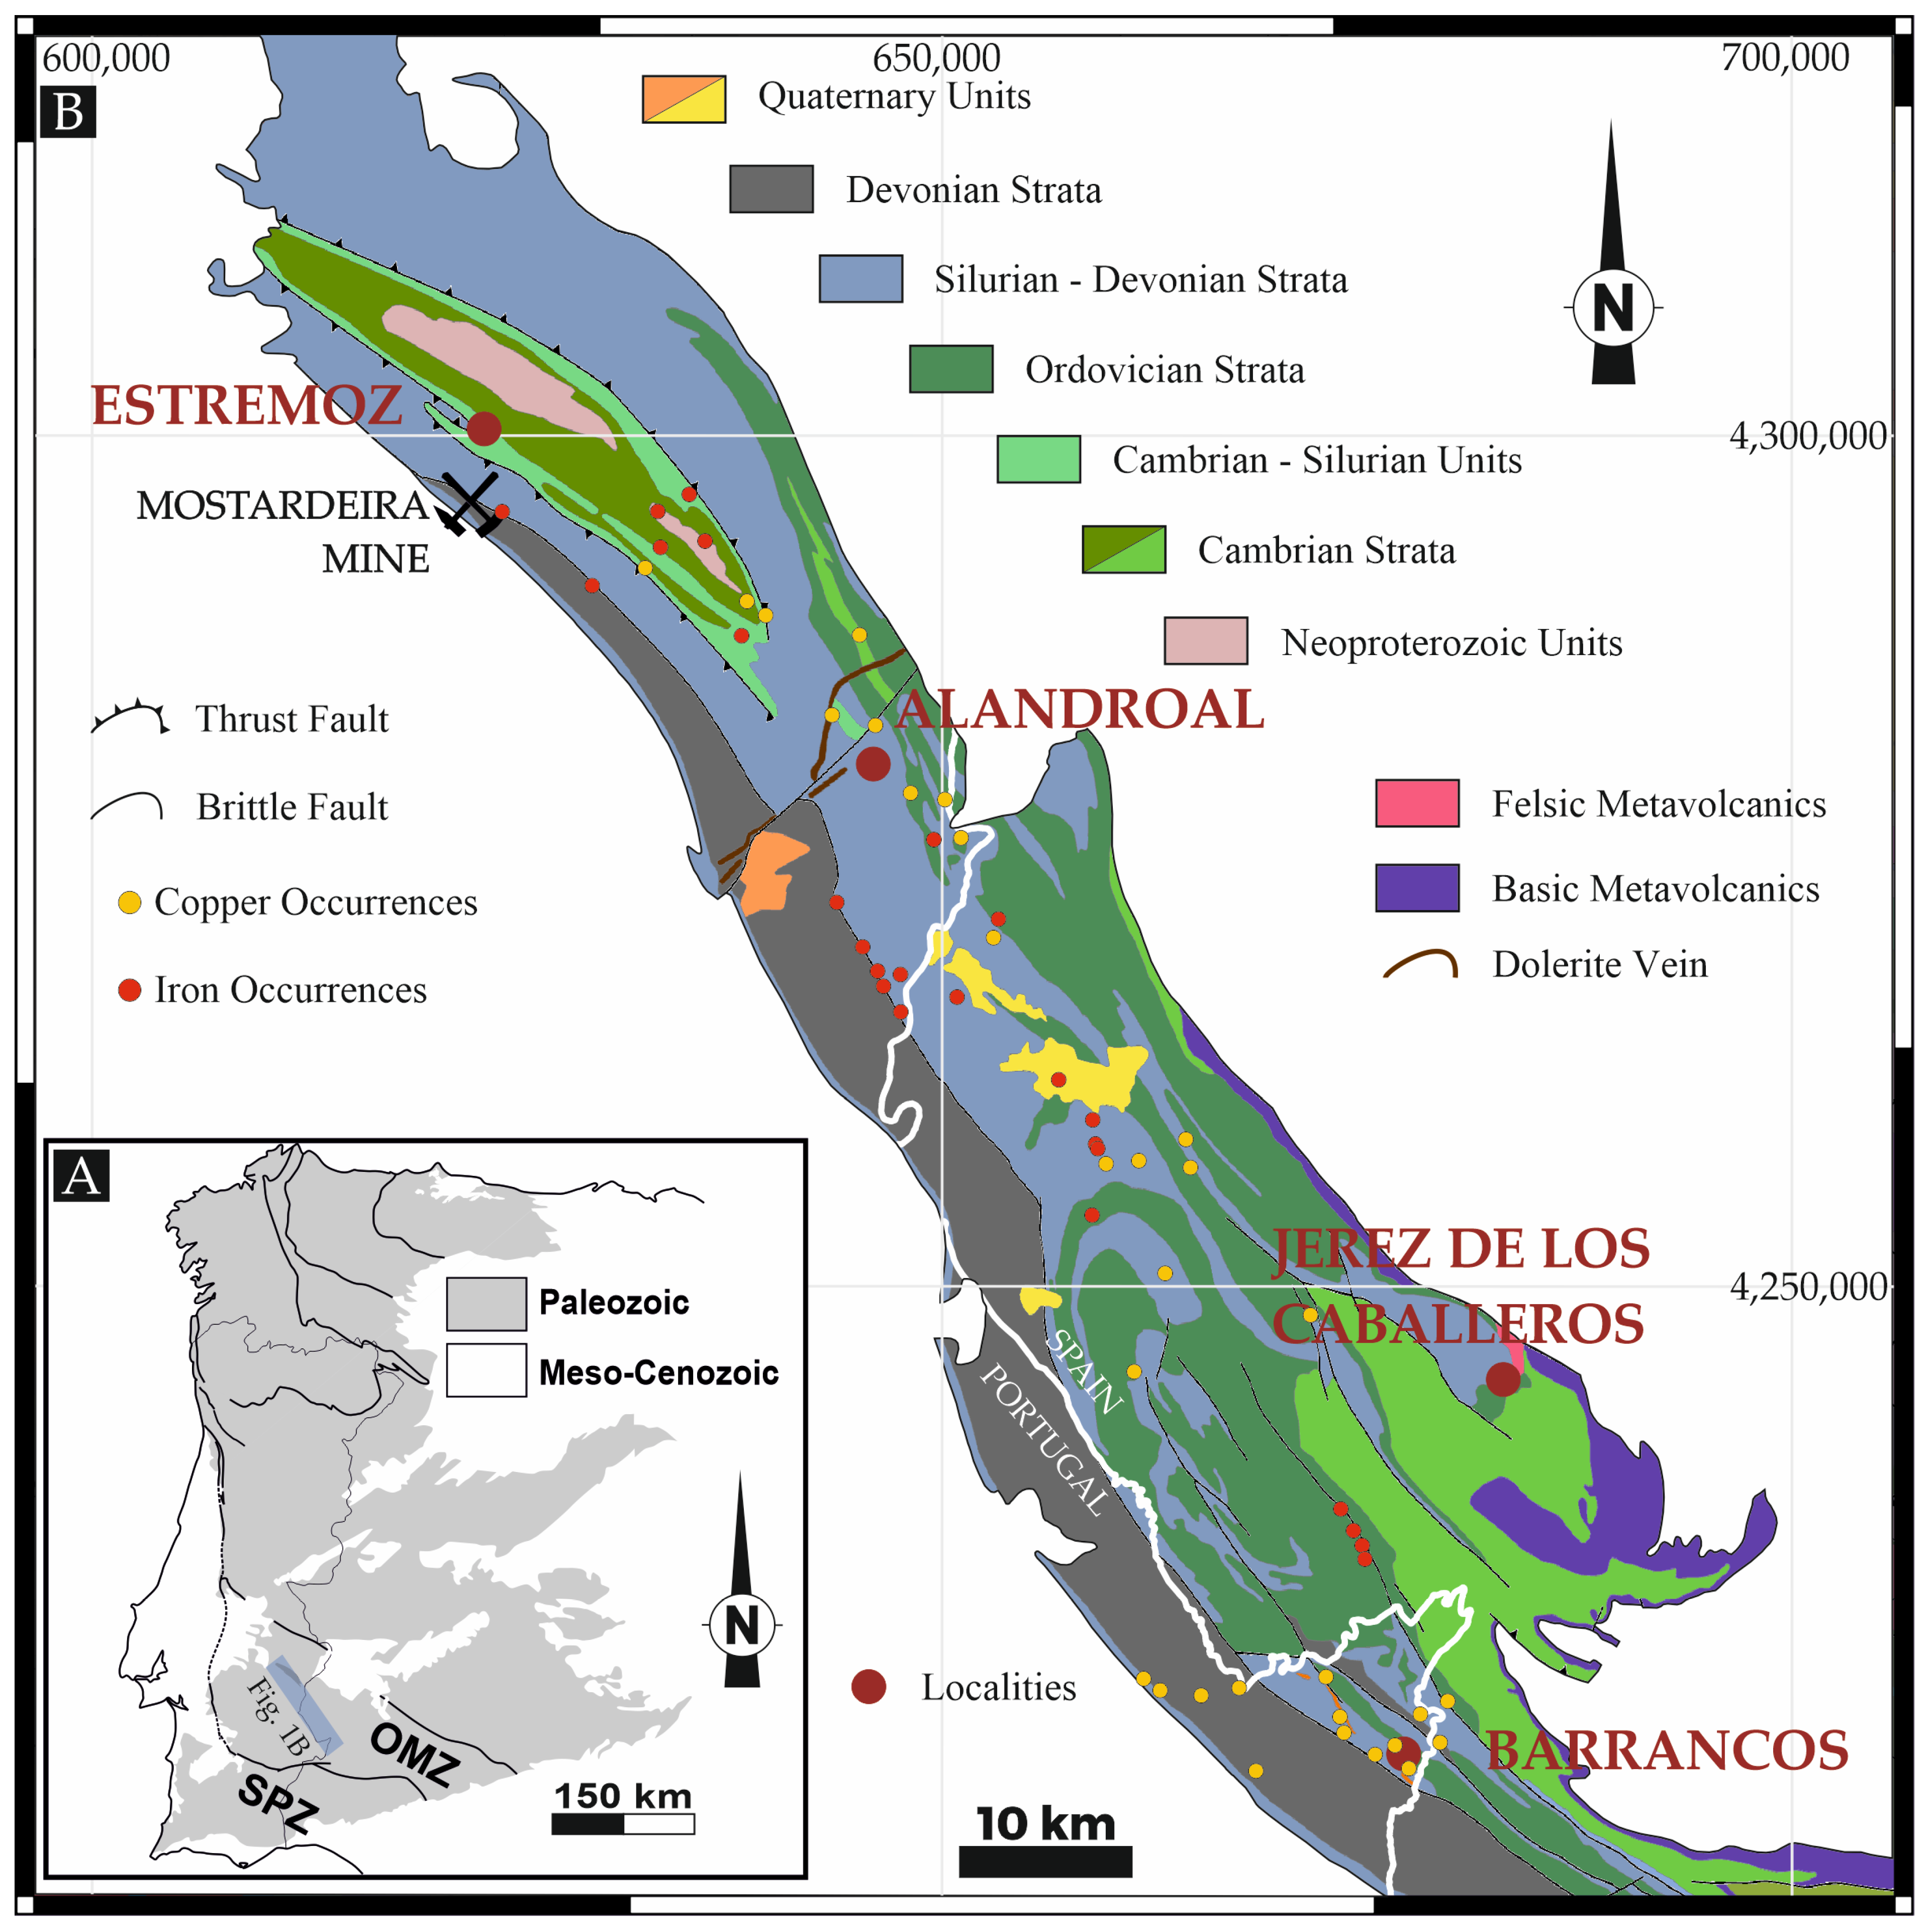
Currently, all the OMZ mines are abandoned, and it is urgent for us to collect insights, understand the extent of this risk, and propose actions for its remediation. Our work focused on the example of the Mostardeira mine, located in the Estremoz-Alandroal domain, in the Portuguese counterpart of OMZ (Figure 1). The deposit consists of a subvertical copper-rich quartz-carbonate lode, with a typical pattern of supergene enrichment [7,25,26].
Figure 1. (A) Tectonostratigraphic division of the Iberian Terrane (after [27]) regarding the OMZ and SPZ on the SW, with emphasis on the Estremoz-Barrancos Sector [28]. (B) Geological map of the Estremoz Barrancos Sector, with the location of the Mostardeira mine on the Estremoz-Alandroal Domain.
Remotesensing 15 05295 g001
The exploitation was conducted in underground galleries that run along the strike of the vein. The material exploited was extracted by a vertical chimney and stored in stockpiles in the nearby terrain (Figure 2A). At some point in time, an ustulation plant was erected (Figure 2B), but was then abandoned after few years without much success [25]. In the mine area, it is still possible to recognize some of the infrastructures, soil occupations, and land uses (Figure 2C,D). All these heavy industrial activities left a high toll of contaminated soils and degraded lands, and although some works of removal and reutilization of the in situ remaining mine wastes were carried out, the mine site still exhibits evidence of the degraded soils and corresponding activities (Figure 2).
This work intends to map the Mostardeira abandoned mine site concerning its geochemical footprint—i.e., the metallic elements present as contaminants in the soils—and connect these features with geophysical aspects—i.e., the soil optical properties. This ground-based characterization, when combined with the information provided by multispectral satellite and UAV unmanned aerial vehicle images (hereby designated by drone images), will be utilized to define a baseline of information that is a key element for characterizing existing abandoned mines and degraded land sites.
The work proposes that this baseline of information is used as a tool for—in the future—identifying other areas with a high potential risk of being contaminated or degraded.

3. Materials and Methods

The methodology used involved a combined approach of ground level techniques—namely a portable X-ray fluorescence (pXRF) and a portable optical spectroradiometer (pSpec) for collecting point information—and airborne images—namely drone and satellite multispectral images. The results obtained are interpreted using statistical exploratory data analysis complemented with machine learning methods as advanced tools for data analytics (Figure 3).
The ground data and the airborne data are treated using different data analysis techniques complemented by machine learning methods. The results from the ground data are used to identify toxic metal elements and other soil features that enable the creation of soil use maps. The airborne data results obtained with the analytical approach generate maps that are used to create land cover maps.
These combined map products constitute a baseline for the characterization of the mine sites, and allow us to “map the mine” and understand its features.
All the collected information was organized as a GIS project in QGIS [29], and the data were treated in R combined with RStudio software (Version “Mountain Hydrangea” Release de44a311, 2023-08-25 for windows) and available extension packages [30].

3.1. Field Data Collection

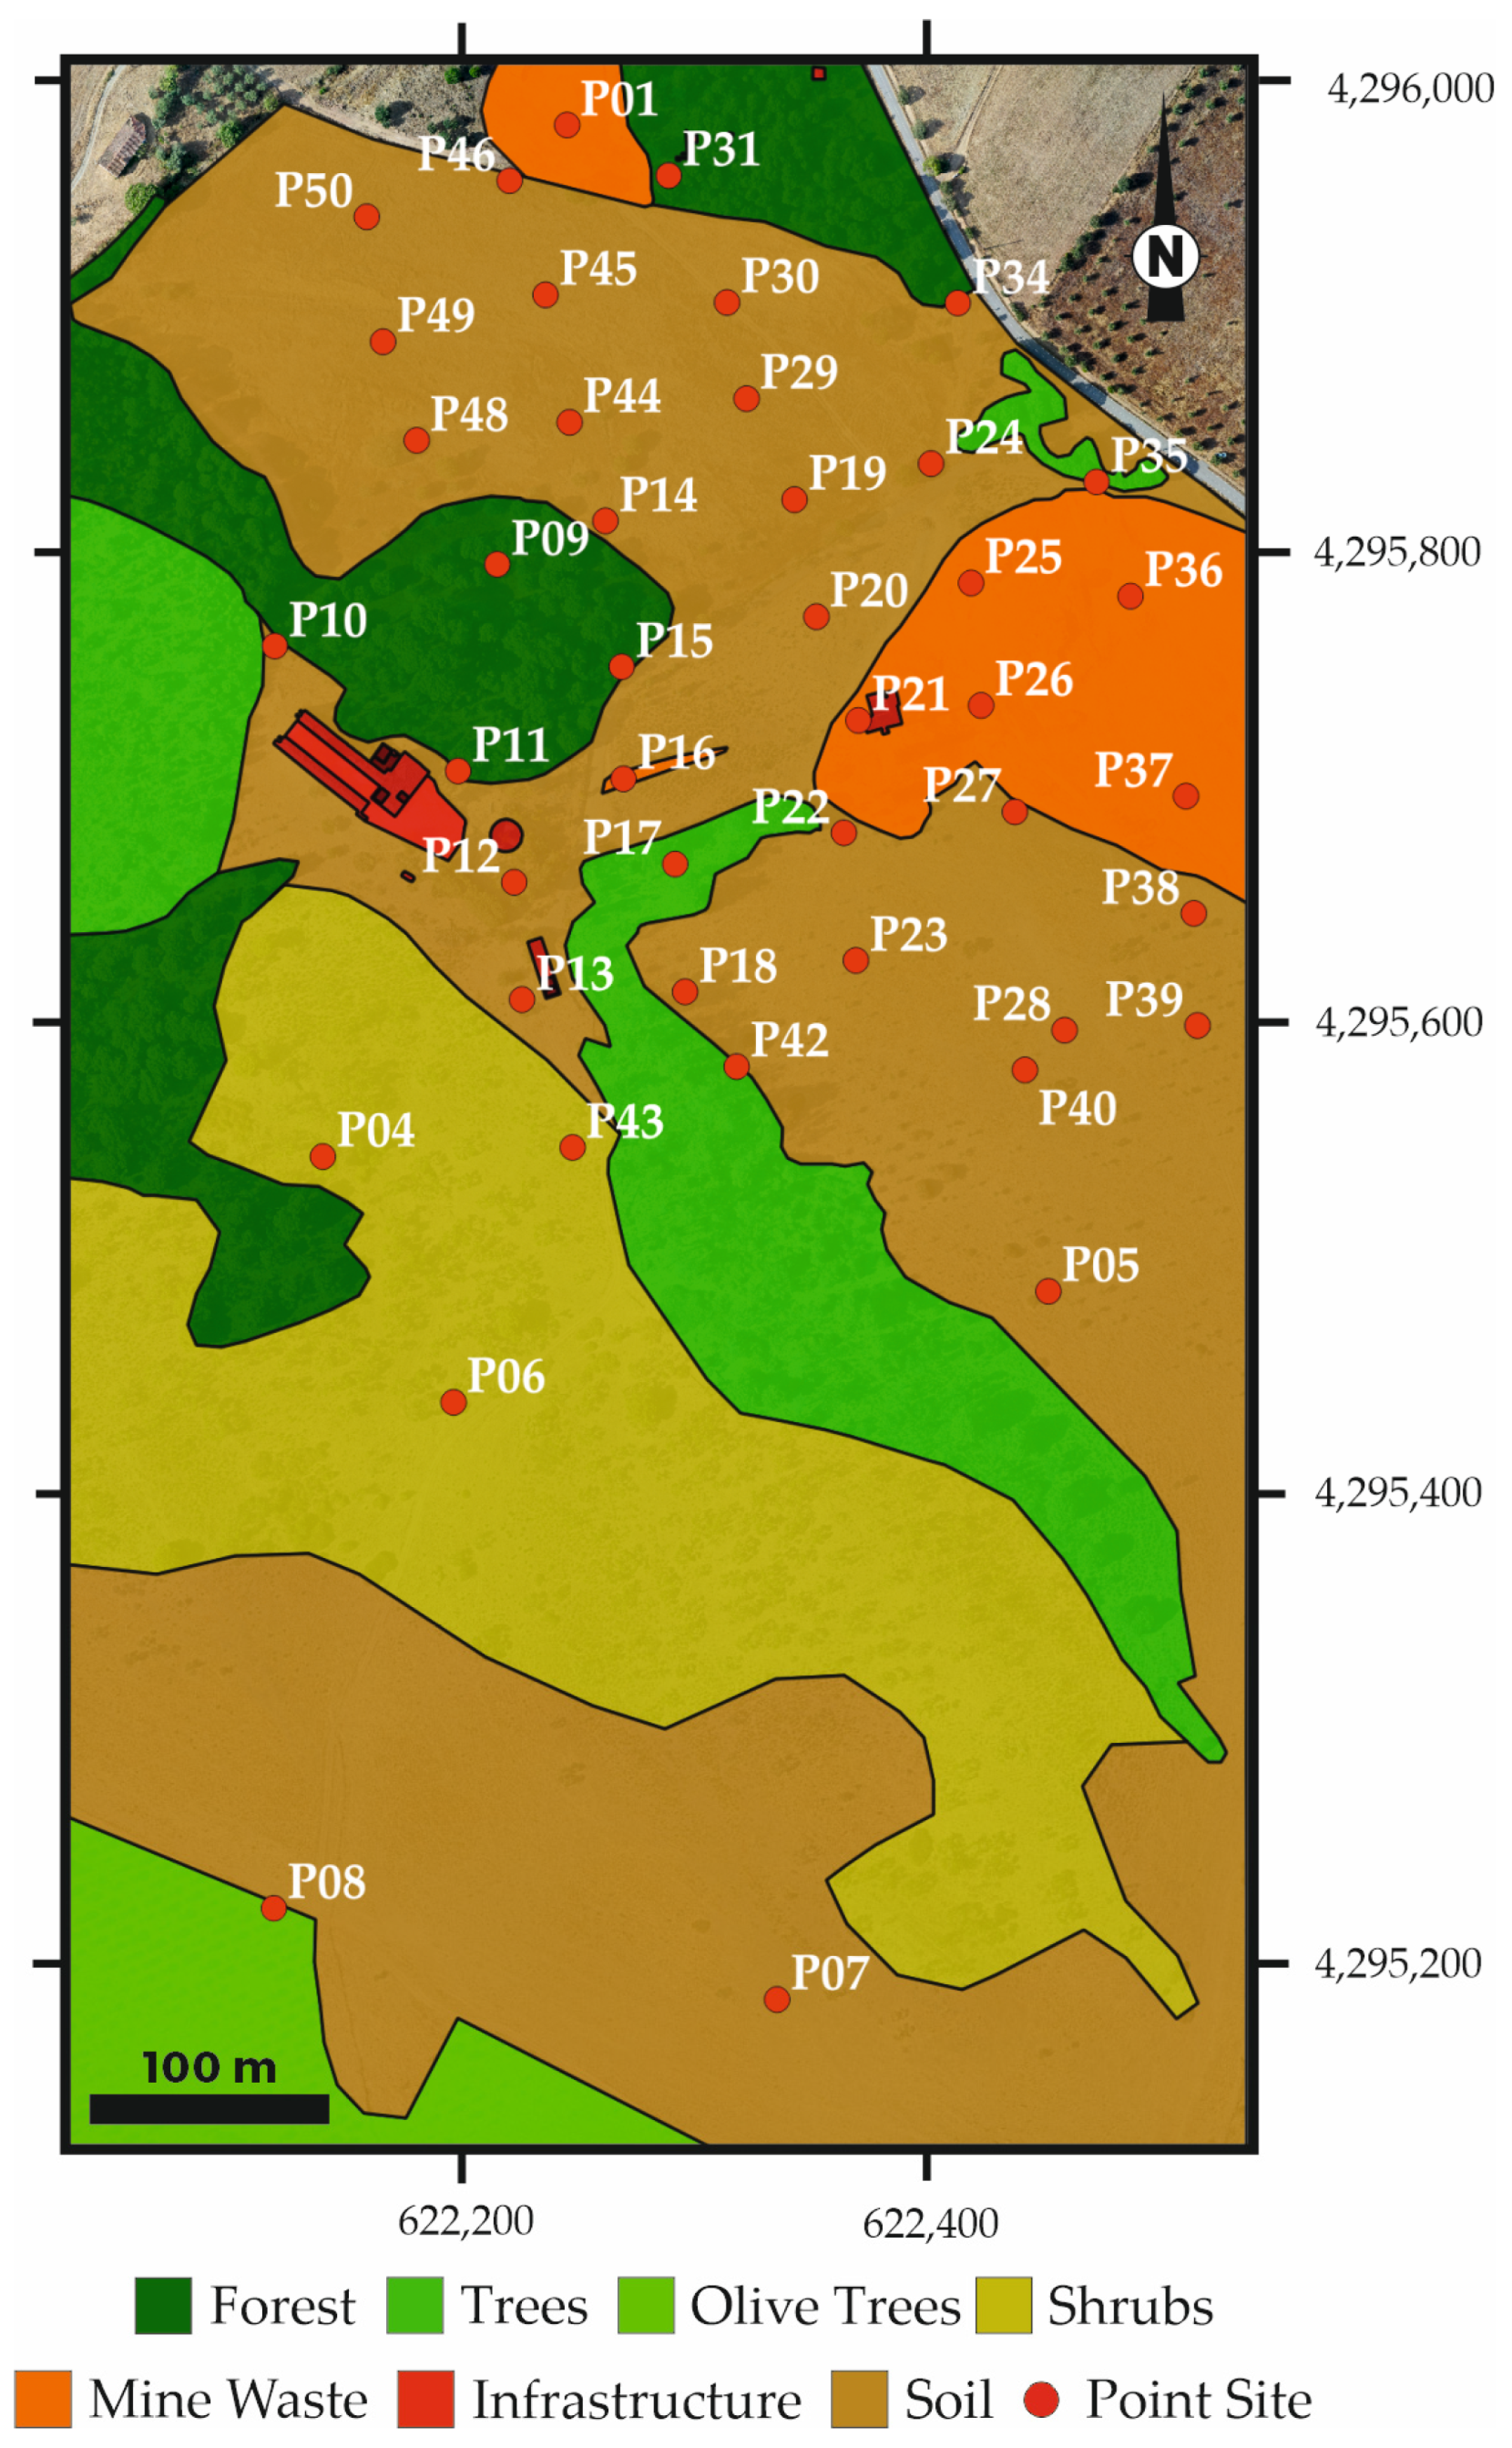
For field observations, a regularly spaced grid (Figure 4) covering the outcrop of the vein and surrounding areas was delineated to collect the point site information. This grid was complemented with 8 selected point locations to better represent the information from the various soil use (SU) types defined for the study area. For statistical robustness of the data collected, each analysis point site—i.e., X-ray fluorescence and spectroradiometry—is the average of 4 spot analyses in a 1 square meter area.
The spots were prepared following the methodology described by Lemière et al. [9], removing the superficial layer of soil and any visible vegetation, followed by light compaction to form a homogeneous flat surface. Additionally, the surrounding vegetation was flattened to avoid casting shadows during spectroradiometric analysis.

3.2. Portable X-ray Fluorescence (pXRF)

The portable X-ray fluorescence analysis was conducted in 5 campaigns, using a SkyRay Instruments Explorer-9000 spectrometer coupled with a GPS sensor. The equipment uses a miniature X-ray tube with an excitation source of 50 kV/200 µA, a fast SDD detector with 128 eV energy resolution, a digital signal processor, and a micro multi-channel analysis module. The spectrometer was configured to use the “environmental soil” internal package, running for 100 s at a 45 kV voltage and 80 µA current. In this configuration, the spot analysis has a 50 micra diameter. A total of 199 analyses were performed, consistently detecting 10 metallic elements: V, Cr, Mn, Fe, Co, Ni, Cu, Zn, As, and Pb.

3.3. Field Spectroradiometry

The spectroradiometric analysis campaign was conducted on three different days to guarantee the optimal weather conditions for data acquisition. The equipment used for data collection is a portable spectroradiometer, the HandHeld 2 FieldSpec VNIR (ASD, Inc., Boulder, CO, USA) [31] coupled to a tripod for stabilization. The data are in reflectance values (0–1) for wavelengths in the range of 325 to 1075 nm with a 1 nm step. A 10° foreoptic nozzle was attached to the spectrometer to have a narrower field of view. This configuration resulted in a spot size of around 20 cm. The equipment settings were defined to save 25 spectra with a 136 ms integration time. The baseline spectrum was obtained using a Spectralon white reference panel at each point site. A total of 4500 spectra were recorded across the 47 point sites.

3.4. Sentinel 2 Satellite Data

Satellite images are broadly used to identify and characterize mine sites, to identify potentially hazardous situations, or to incorporate the passive stock of abandoned materials into the circular economy; e.g., [32,33,34,35].
Data from the Sentinel-2 were collected from the image obtained on 3 July 2021 covering the T29SPD tile, and was then downloaded with the Level 2A correction—i.e., the orthoimage was atmospherically corrected. The image contains 12 bands, was cropped to the study area, and all the bands were resampled to a 10 m pixel size using a bilinear interpolation. The resulting image has 89 × 52 pixels, and all the data were transformed to the WGS 84/UTM zone 29N (EPSG:32629) coordinate system for spatial calculations.
The analysis of the Sentinel images was carried out by using image compositions and band ratios. A true colour composite uses the bands 4-3-2 of the band set, which corresponds to the red, green, and blue channels, respectively. A composite of false colour uses different bands to enable the visualization of wavelengths that are beyond the range of human vision, such as near-infrared. Several band compositions were tested based on literature reviews (for details see [36]), and we presented the compositions of bands 12-4-2, and 12-11-2, which are mostly used in geological studies.
Previous studies presented well-established algorithms to identify several minerals, mineral alterations and even rock types from remotely sensed images, such as: (a) Ferric oxides index: 11/8a [37]; (b) Ferric iron index: 3/4 [38]; (c) Gossan index: 11/4 [39].
These algorithms and many others can be consulted in [36], some of which were tested during this study, but are not presented for clarity reasons.

3.5. Multispectral Drone Data

A Mavic 2 PRO drone equipped with a RGB Hasselblad camera and a Sentera Multispectral NDVI camera was used to obtain the UAV images. The drone path was at a 100 m height with an 80% of overlap in the flight direction and a 70% lateral overlap. A total of 439 photos were collected and processed using Agisoft Metashape software (Version 1.6 build 9925). The products obtained include an orthophotography and a digital elevation model.
The images were resampled to a pixel size of 5 cm, and a stack of 5 bands was created with blue, green, and red images (bands B1, B2 and B3) from the Hasselblad camera; red and (NIR)—near infrared (bands B4 and B5) were obtained from the Sentera Multispectral camera.

3.6. Data Processing

The X-ray fluorescence data were averaged for each point site analysis, and outlier values were not considered. The obtained data were processed using exploratory data analysis, followed by the examination of the correlation matrices to consider the combined geochemical behaviour of the elements. As a data reduction and analysis method, the principal components analysis (PCA) was performed for all the data sets. Unsupervised classification of data using K-means [40] was tested with different numbers of clusters to evaluate the classification and agglomeration of the data.
The spectroradiometric field data were trimmed to the 350–1000 nm range to eliminate some noise in both inferior and superior limits, and to be comparable with existing databases. For each point site, the 100 spectra collected were averaged after removing the ones that were considered outliers—i.e., any spectrum in which the values were not consistent with the others from the same spot. The spectra were compared with the existing USGS spectral library version 7 database [41], namely the soils collection of data. This comparison serves as a guide for the type of soil or mineral present in each point site. The data from the wavelengths of blue = 490 nm, green = 560 nm, red = 665 nm, NIR (near infra-red) = 840, and two low ×1 = 400 nm and high ×2 = 800 nm wavelengths were also collected for analysis.
The 12-band stack of images from the Sentinel-2 satellite was used to test different band false colour compositions and band ratios. PCA was performed to understand the influence of the different bands in the identification of the various land covers mapped.
The drone images were cropped to the study area and resampled to a 5 cm pixel size for land cover (LC) mapping purposes. The same images were resampled for 1 m pixel size for data analysis purposes, in order to reduce image size in matrix calculations. The K-means unsupervised classification algorithm was tested to identify the different land cover areas. Complementarily, the random forest supervised classification algorithm was modelled with 10% training data and 90% test data. The authors tested several splits, starting with the mostly described 70% (training) 30% (test) split [42]. However, the gain in precision was marginal (less than 5%), and the time to process the dataset was exponentially higher. Moreover, concerns in overfitting the data were raised, with the final result reproducing the training dataset exactly due to the number of pixels involved. The 10% (training) 90% (test) split was used to better visualize the variability of the results that one might expect from a process of classification from natural features. The land cover polygons were used as the classification parameter. The confusion matrix was calculated to evaluate the model performance.

3.7. Soil Use (SU) Types and Land Cover (LC)

For the point site analysis—that is, the portable X-ray fluorescence and the portable spectroradiometer data—the classification of the sites was based on the identification of SU types, which are defined as: (a) Agricultural soil, usually ploughed, and used as basis for vineyards, olive trees, or planting grains and forage; (b) mine waste soil, which was dumped in the place due to the mining activities and could be stockpiles or ustulation plant wastes; or (c) bare soil, which is a mixed type that describes a generally poor skeletal soil that contains many rock fragments. The different SU types for each point site are described in Table 1 and presented in Figure 4. The P32, P33, and P47 are outside the margin of the study area and were not considered in cartographic representations.
From these points sites (n = 47), note that P2, P3, and P41 correspond to locations that were not analysed with any method due to its mixed nature (revolved soils). The spectroradiometry measures P31 and P32 were also not considered due to the canopy casting shade onto the ground.
For the satellite and drone images, the terrain was classified based on its land cover (LC) types. Supported by the field mapping combined with analysis of the satellite and drone images, the study area was mapped and divided into 7 categories, defined as: Infrastructures, mine waste, soil, forest, trees, olive trees, and shrubs. The map with these categories was drawn and is used throughout this work as a basis for data categorization and classification (Figure 4).

4. Results

The results in this section are presented in a per-technique description, with highlights on the main outcomes of each applied method combined with the necessary analysis of data.

4.1. Portable XRF

Profiting from its fast and reliable results, this technique was applied to characterize the metallic contents of the study area. These results, combined with an advanced statistical approach, are an important contribution to understanding the geochemistry of the soils in the study area.

4.1.1. Exploratory Data Analysis

The exploratory data analysis (EDA) includes the mean, standard deviation (sd), median, skewness, kurtosis, minimum, and maximum values for the analysed elements (Table 2). In this table, the Portuguese Environmental Agency (APA—Agência Portuguesa do Ambiente) maximum allowed values for agricultural soils (APA) was also included for reference. In the table, the mean and maximum values that are above the suggested environmental quality standards (EQS) values are highlighted for ease of interpretation.
The As, Cu, and Ni mean values are above the allowed values. Considering the maximum content in the analysis, all the detected elements, except Zn, are above the proposed limit. In the case of arsenic (As), even the lower determined value is above the limit of the EQS.
The median is generally lower than the mean, except for V, indicating a positive skew, and hence a positive asymmetry of the data distribution, revealing a probable two or more population distribution. The standard deviation is commonly high, indicating, as above, the possible presence of multiple populations of data. Kurtosis is also mostly high, indicating a leptokurtic distribution, except for As, Ni, V, and Zn, where a more normal or platykurtic distribution is present.
To understand the combined behaviour of the elements, the correlation matrix was calculated. The results are presented in (Supplementary Material Figure S1a,b), where the elements are organized according to its affinities in four groups. (Gx): G1—Pb, Mn, Cr, Fe(%), Co; G2—Cu, Ni, As, G3—Zn and G4-V.
The most striking aspect is that Zn (G3) correlates negatively with the rest of the elements, with the strongest negative correlation being with Cu (−0.66). V (G4) possesses mostly weak correlations (<0.5) with the rest of the elements, and constitutes a separate group. The G2 group corresponds to metals that were mostly exploited in the mine in the form of Cu-sulphides (chalcopyrite) and As-sulphides (arsenopyrite). The group with more elements is composed of metals hosted in the secondary mineral, and generally occur in the form of oxides and hydroxides, such as in the case of Fe (hematite) and Mn (pyrolusite).
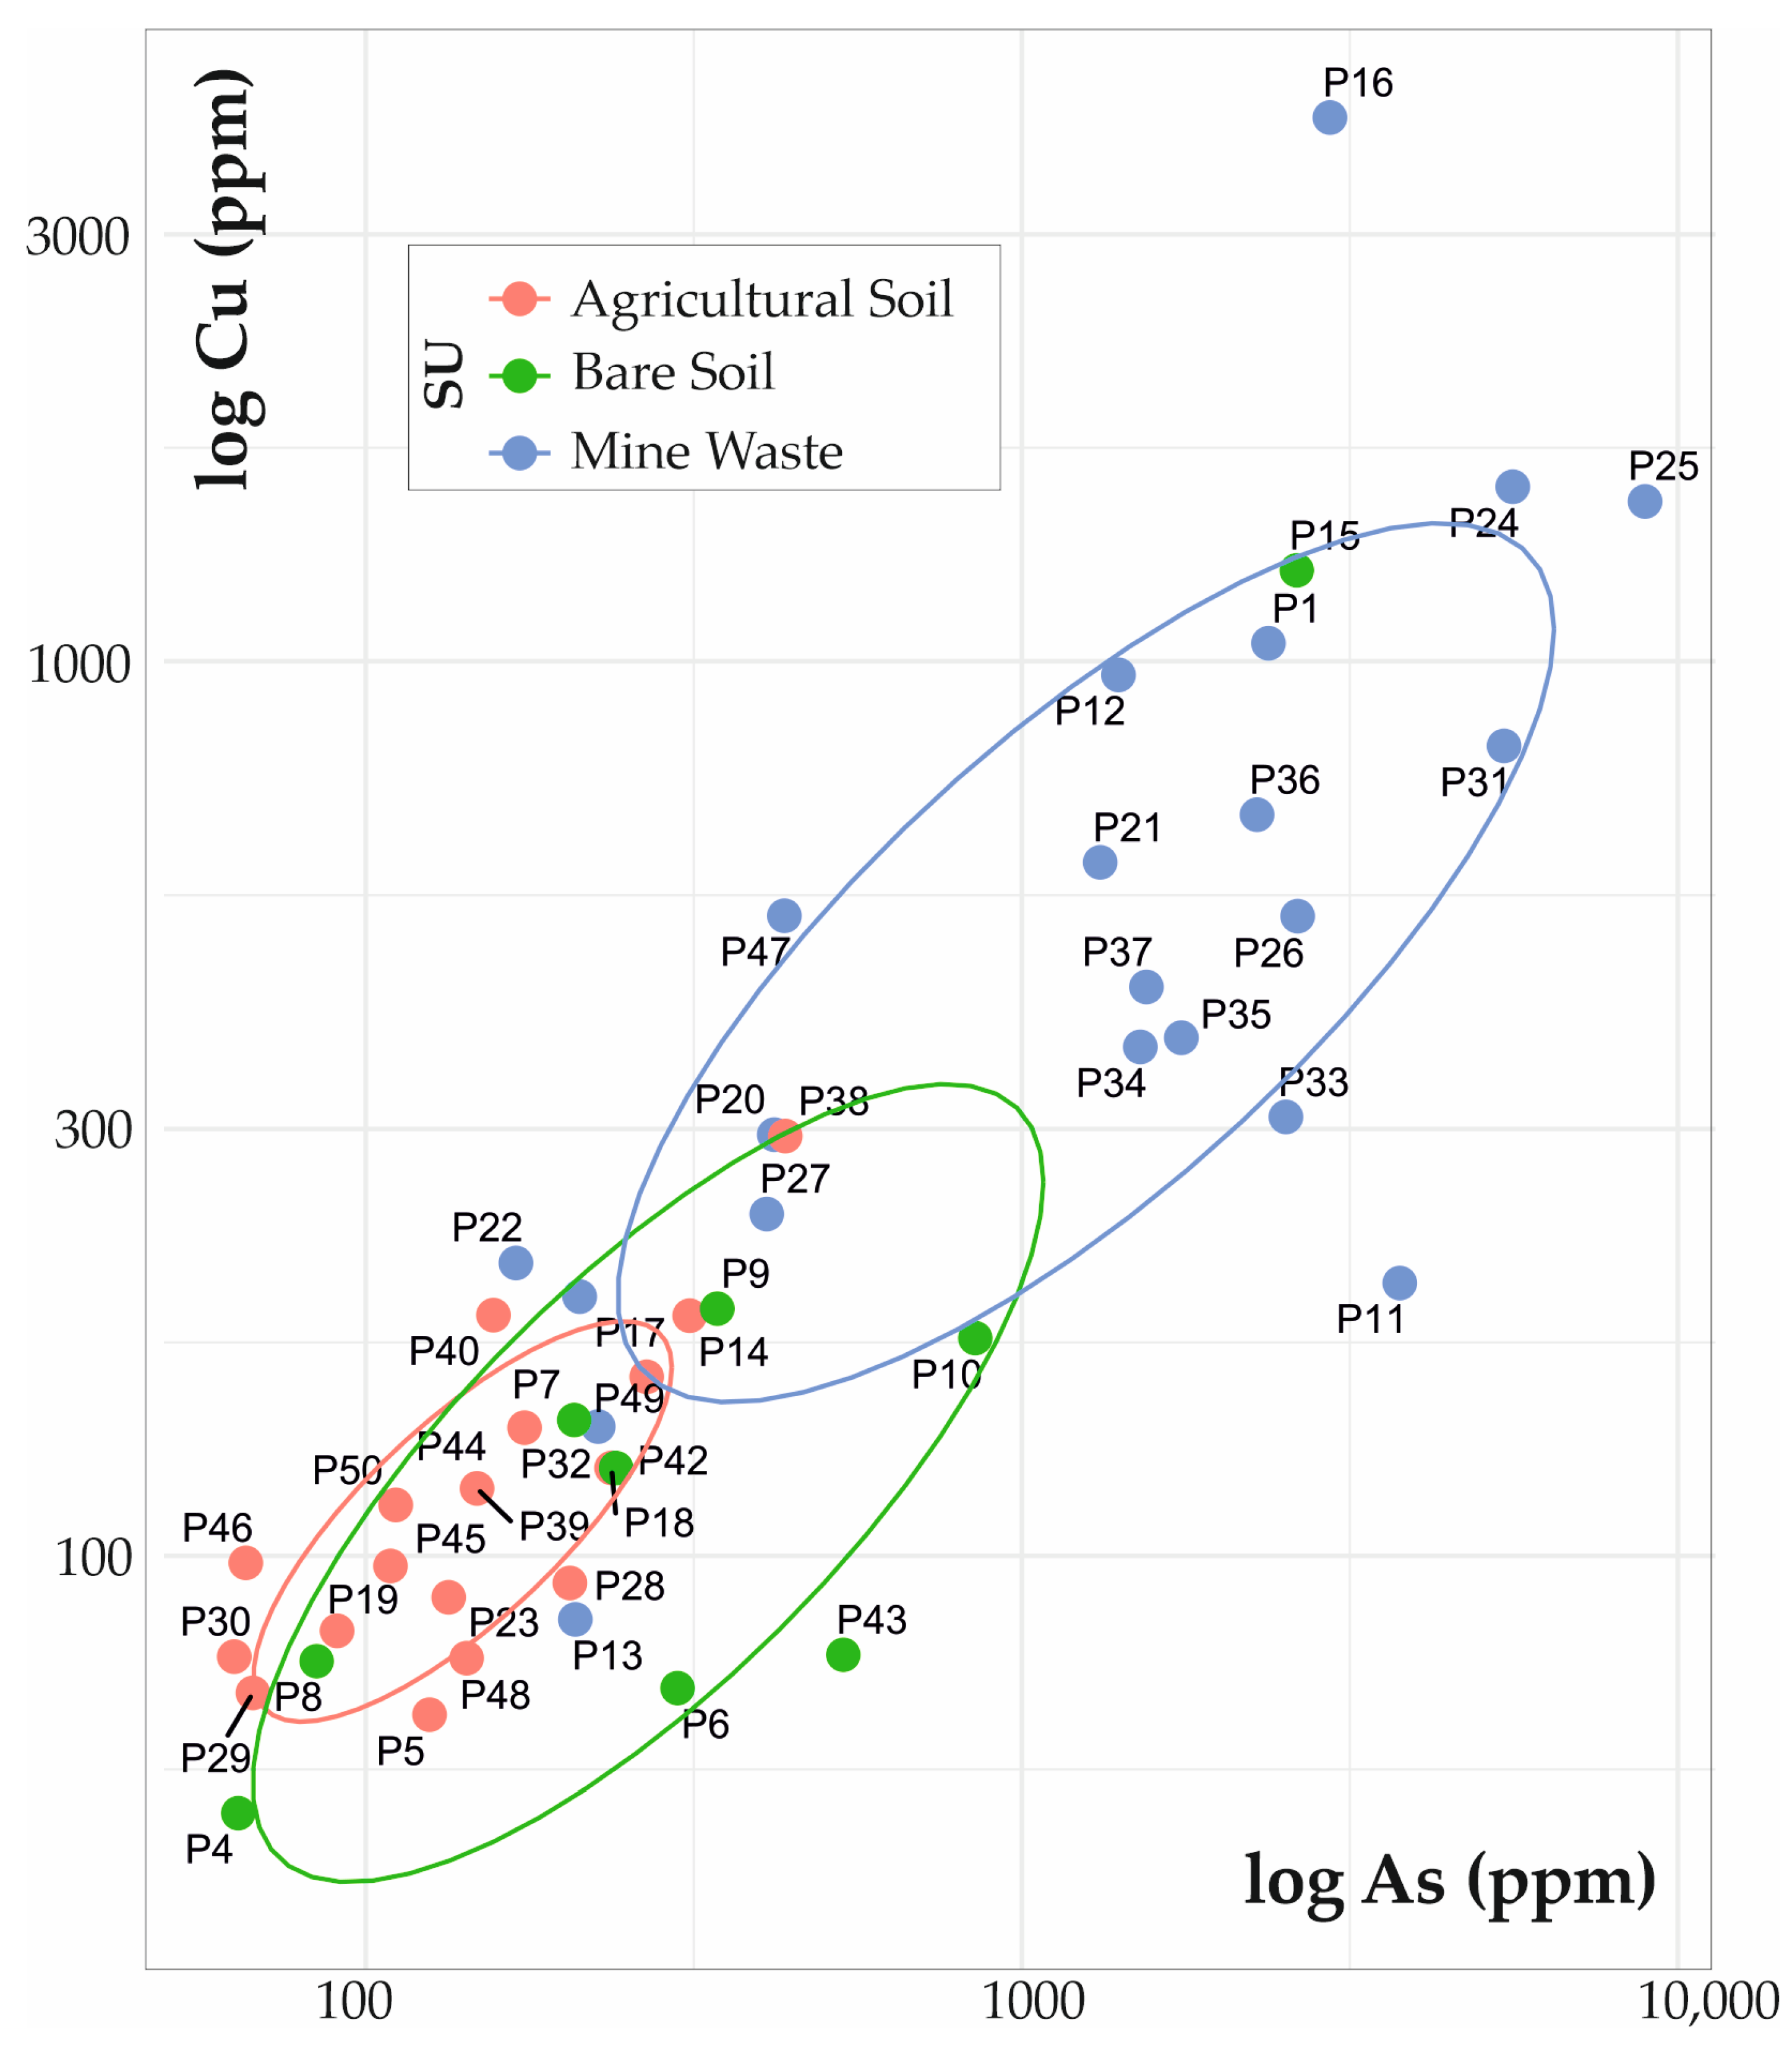
The discrimination of the elements’ distribution by SU type can be visualized in a scatter plot of As vs. Cu using a logarithmic scale (other important elemental binary plots are in Supplementary Material Figure S2a–e). The results demonstrate that mine waste soils constitute a separate group with a high content of metallic elements, whereas bare soil and agricultural soil, tend to plot together with bare soils that have a slightly lower content of Cu (Figure 5). Agricultural soil is the group with lower variability, with a low variance of the values.

4.1.2. Principal Components Analysis

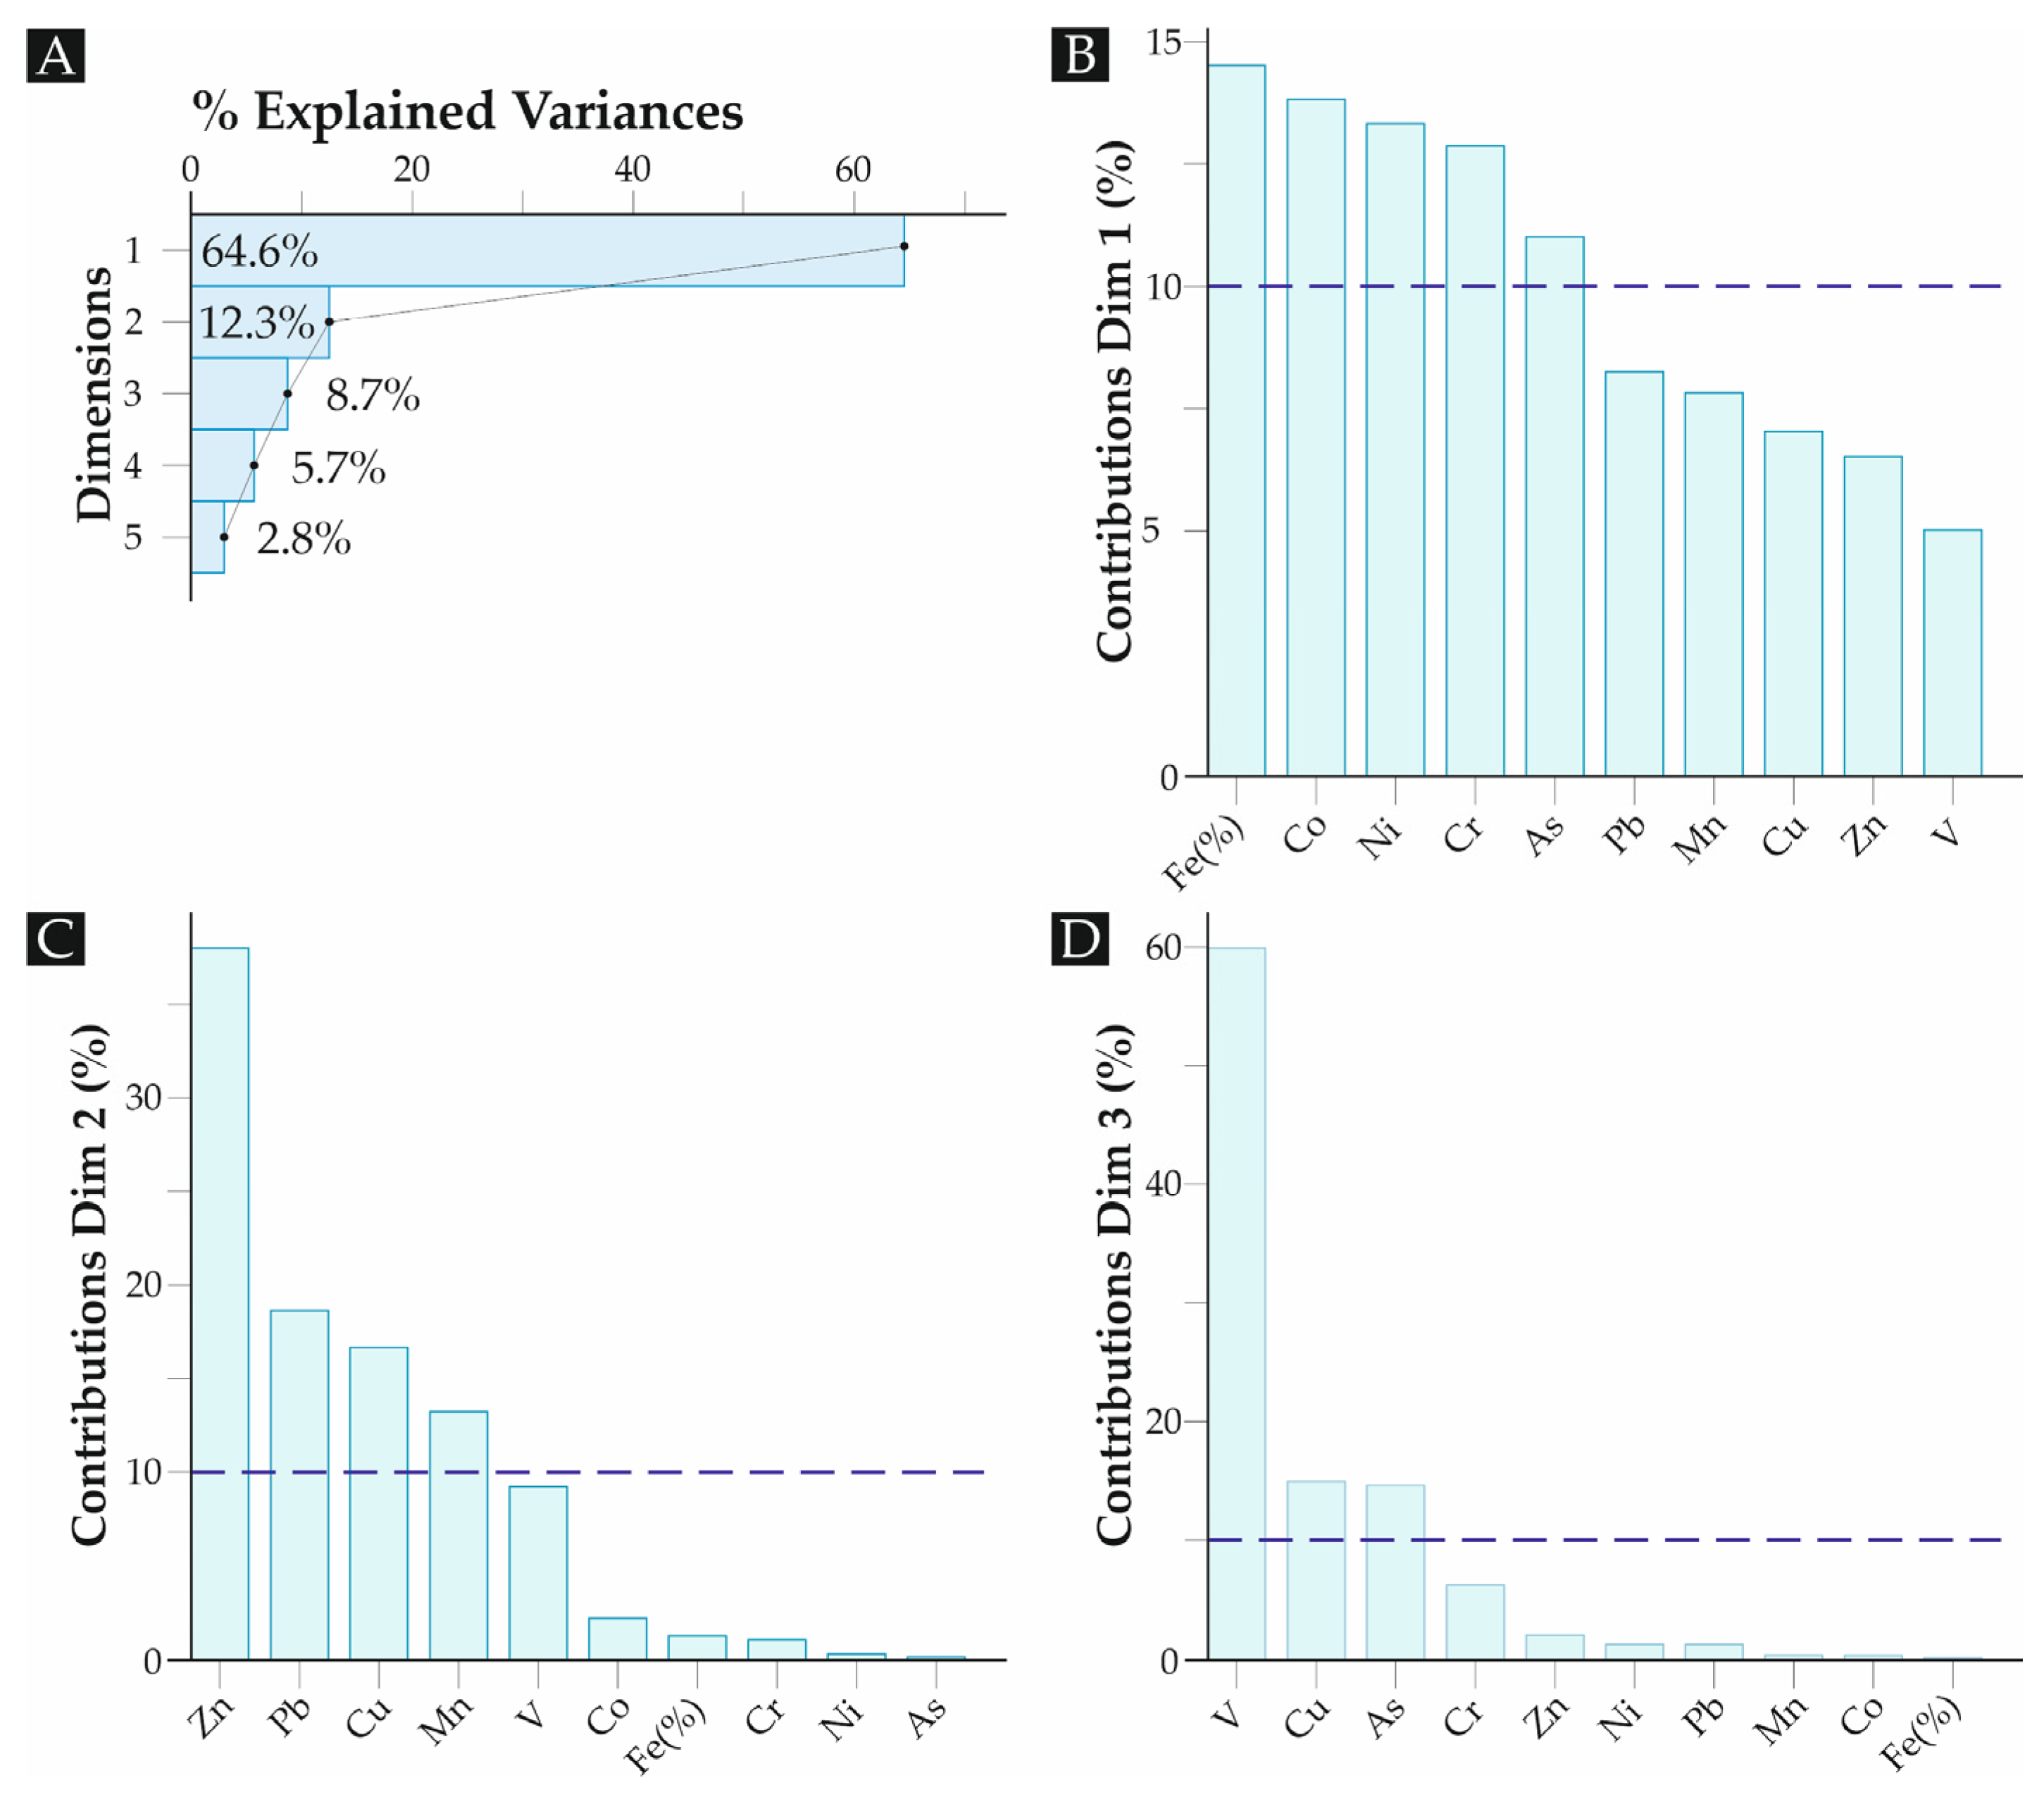
The PCA was performed centred to zero, and scaled to have unit variance before the analysis took place. The results indicate that PC1 explains 64.6% of the variance, whereas PC2 explains 12.3% and PC3 8.7% of the variance (Figure 6A). PC1 is dominated by Fe, Co, Ni, Cr, and As, whereas PC2 is dominated by Zn, Pb, Cu, and Mn (Figure 6B,C). PC3 is mostly dominated by V, with smaller contributions of Cu and As (Figure 6D).
The biplot for the principal components (Figure 7) reveals that the PC1 separates the mine waste points with negative PC1 values, and is dominated by Fe and Co, whilst the agricultural soil falls in the positive part of this axis.
The PC2 helps in discriminating the bare soil that falls in the second quadrant and is dominated by a negative contribution from the Cu.

4.1.3. K-Means Clustering

K-means clustering is an unsupervised machine learning technique that groups similar data points in clusters. It works by partitioning the data into a predetermined number of clusters, each defined by a centroid that represents the centre of the cluster. The algorithm iteratively assigns data points to the nearest centroid and then recalculates the centroids based on the new assignments. K-means aims to minimize the within-cluster variance, effectively organizing data points into compact groups.
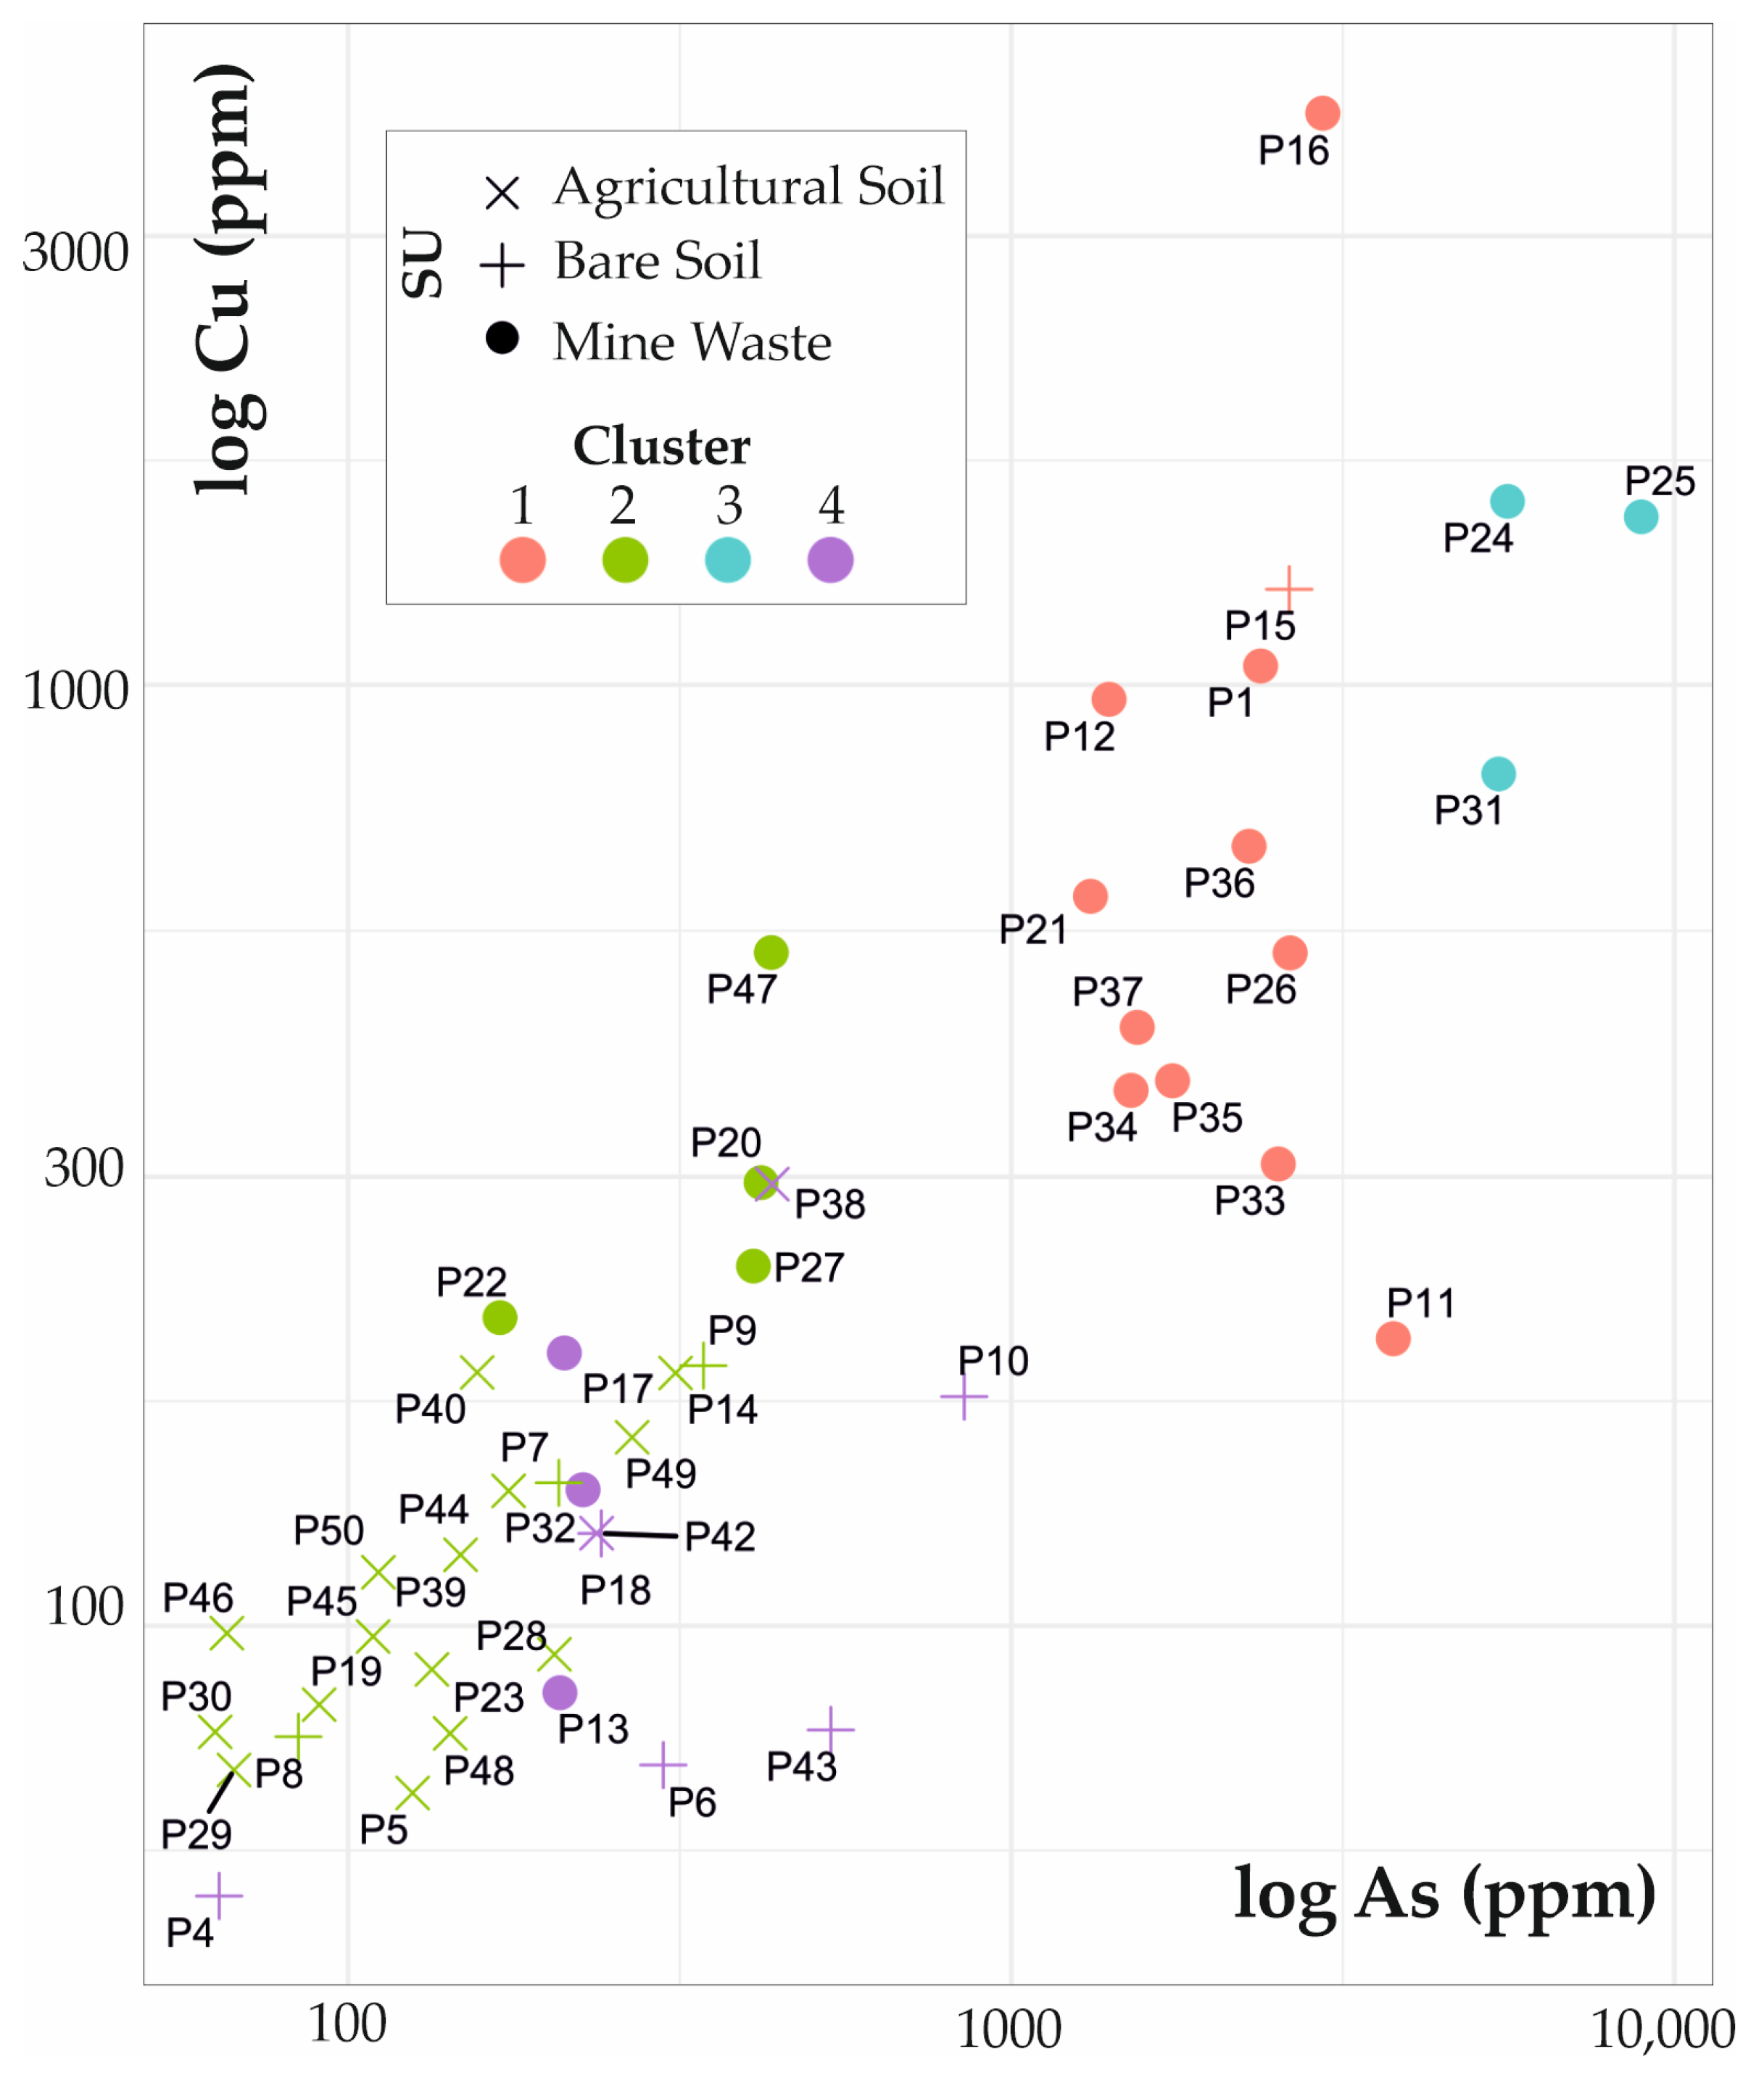
The results obtained (Figure 8; Supplementary Material Figure S3a–e) plotted in the As vs. Cu diagram show that clusters one, two, and three are mainly divisions inside the mine waste soils, where clusters one and two correspond to points with the highest values (P16, and P24, P25 and P31 respectively), and the third group corresponds to intermediate values of As and Cu. As is always higher than 1000 ppm, and Cu is always higher than 200 ppm. The point sites with simultaneously low As and Cu form the most numerous groups, and include mostly both bare soil and agricultural soil samples.
Noteworthy is that the P16 sample is the one in the immediate vicinity of the outcropping quartz vein, and P24 and P25 are in continuation of the strike of the vein.

4.2. Optical Spectroradiometry

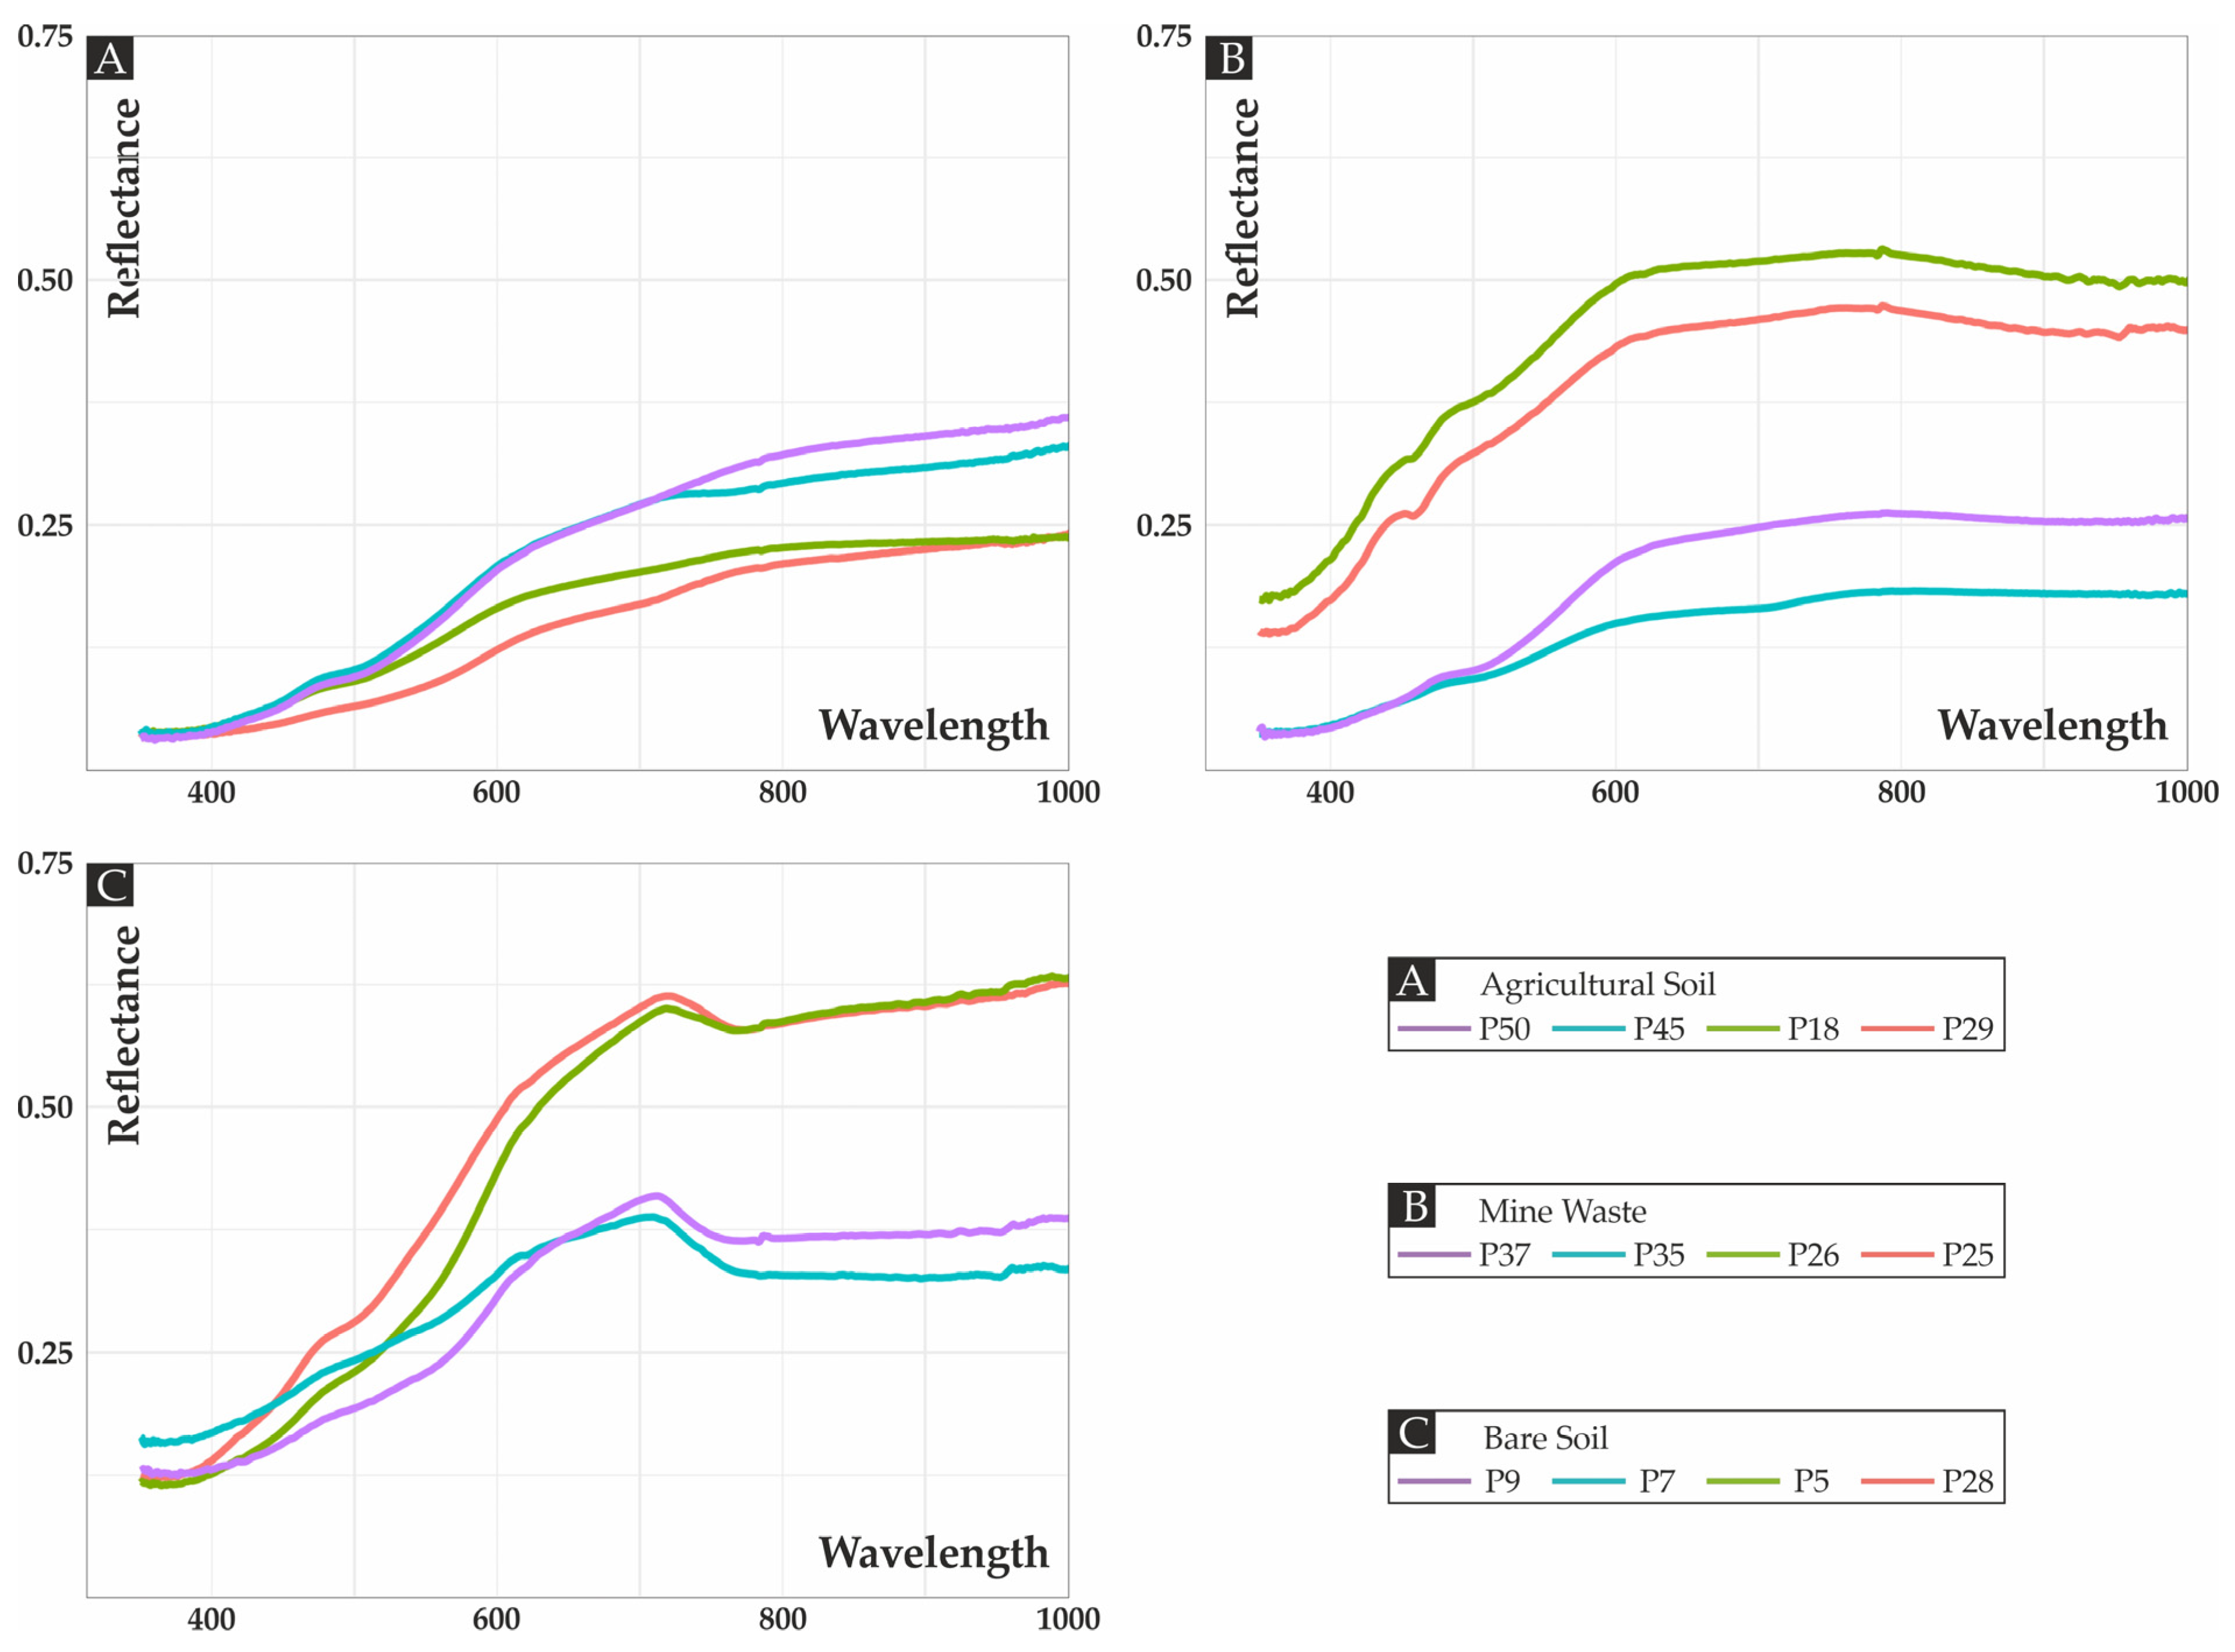
The spectroradiometric techniques have proven to be effective and reliable in not only identifying different types of soil, but also in identifying metal contaminated soils. Figure 9 displays selected examples of spectra obtained from the agricultural soils (Figure 9A), mine waste (Figure 9B) and bare soils (Figure 9C).

4.2.1. Exploratory Data Analysis

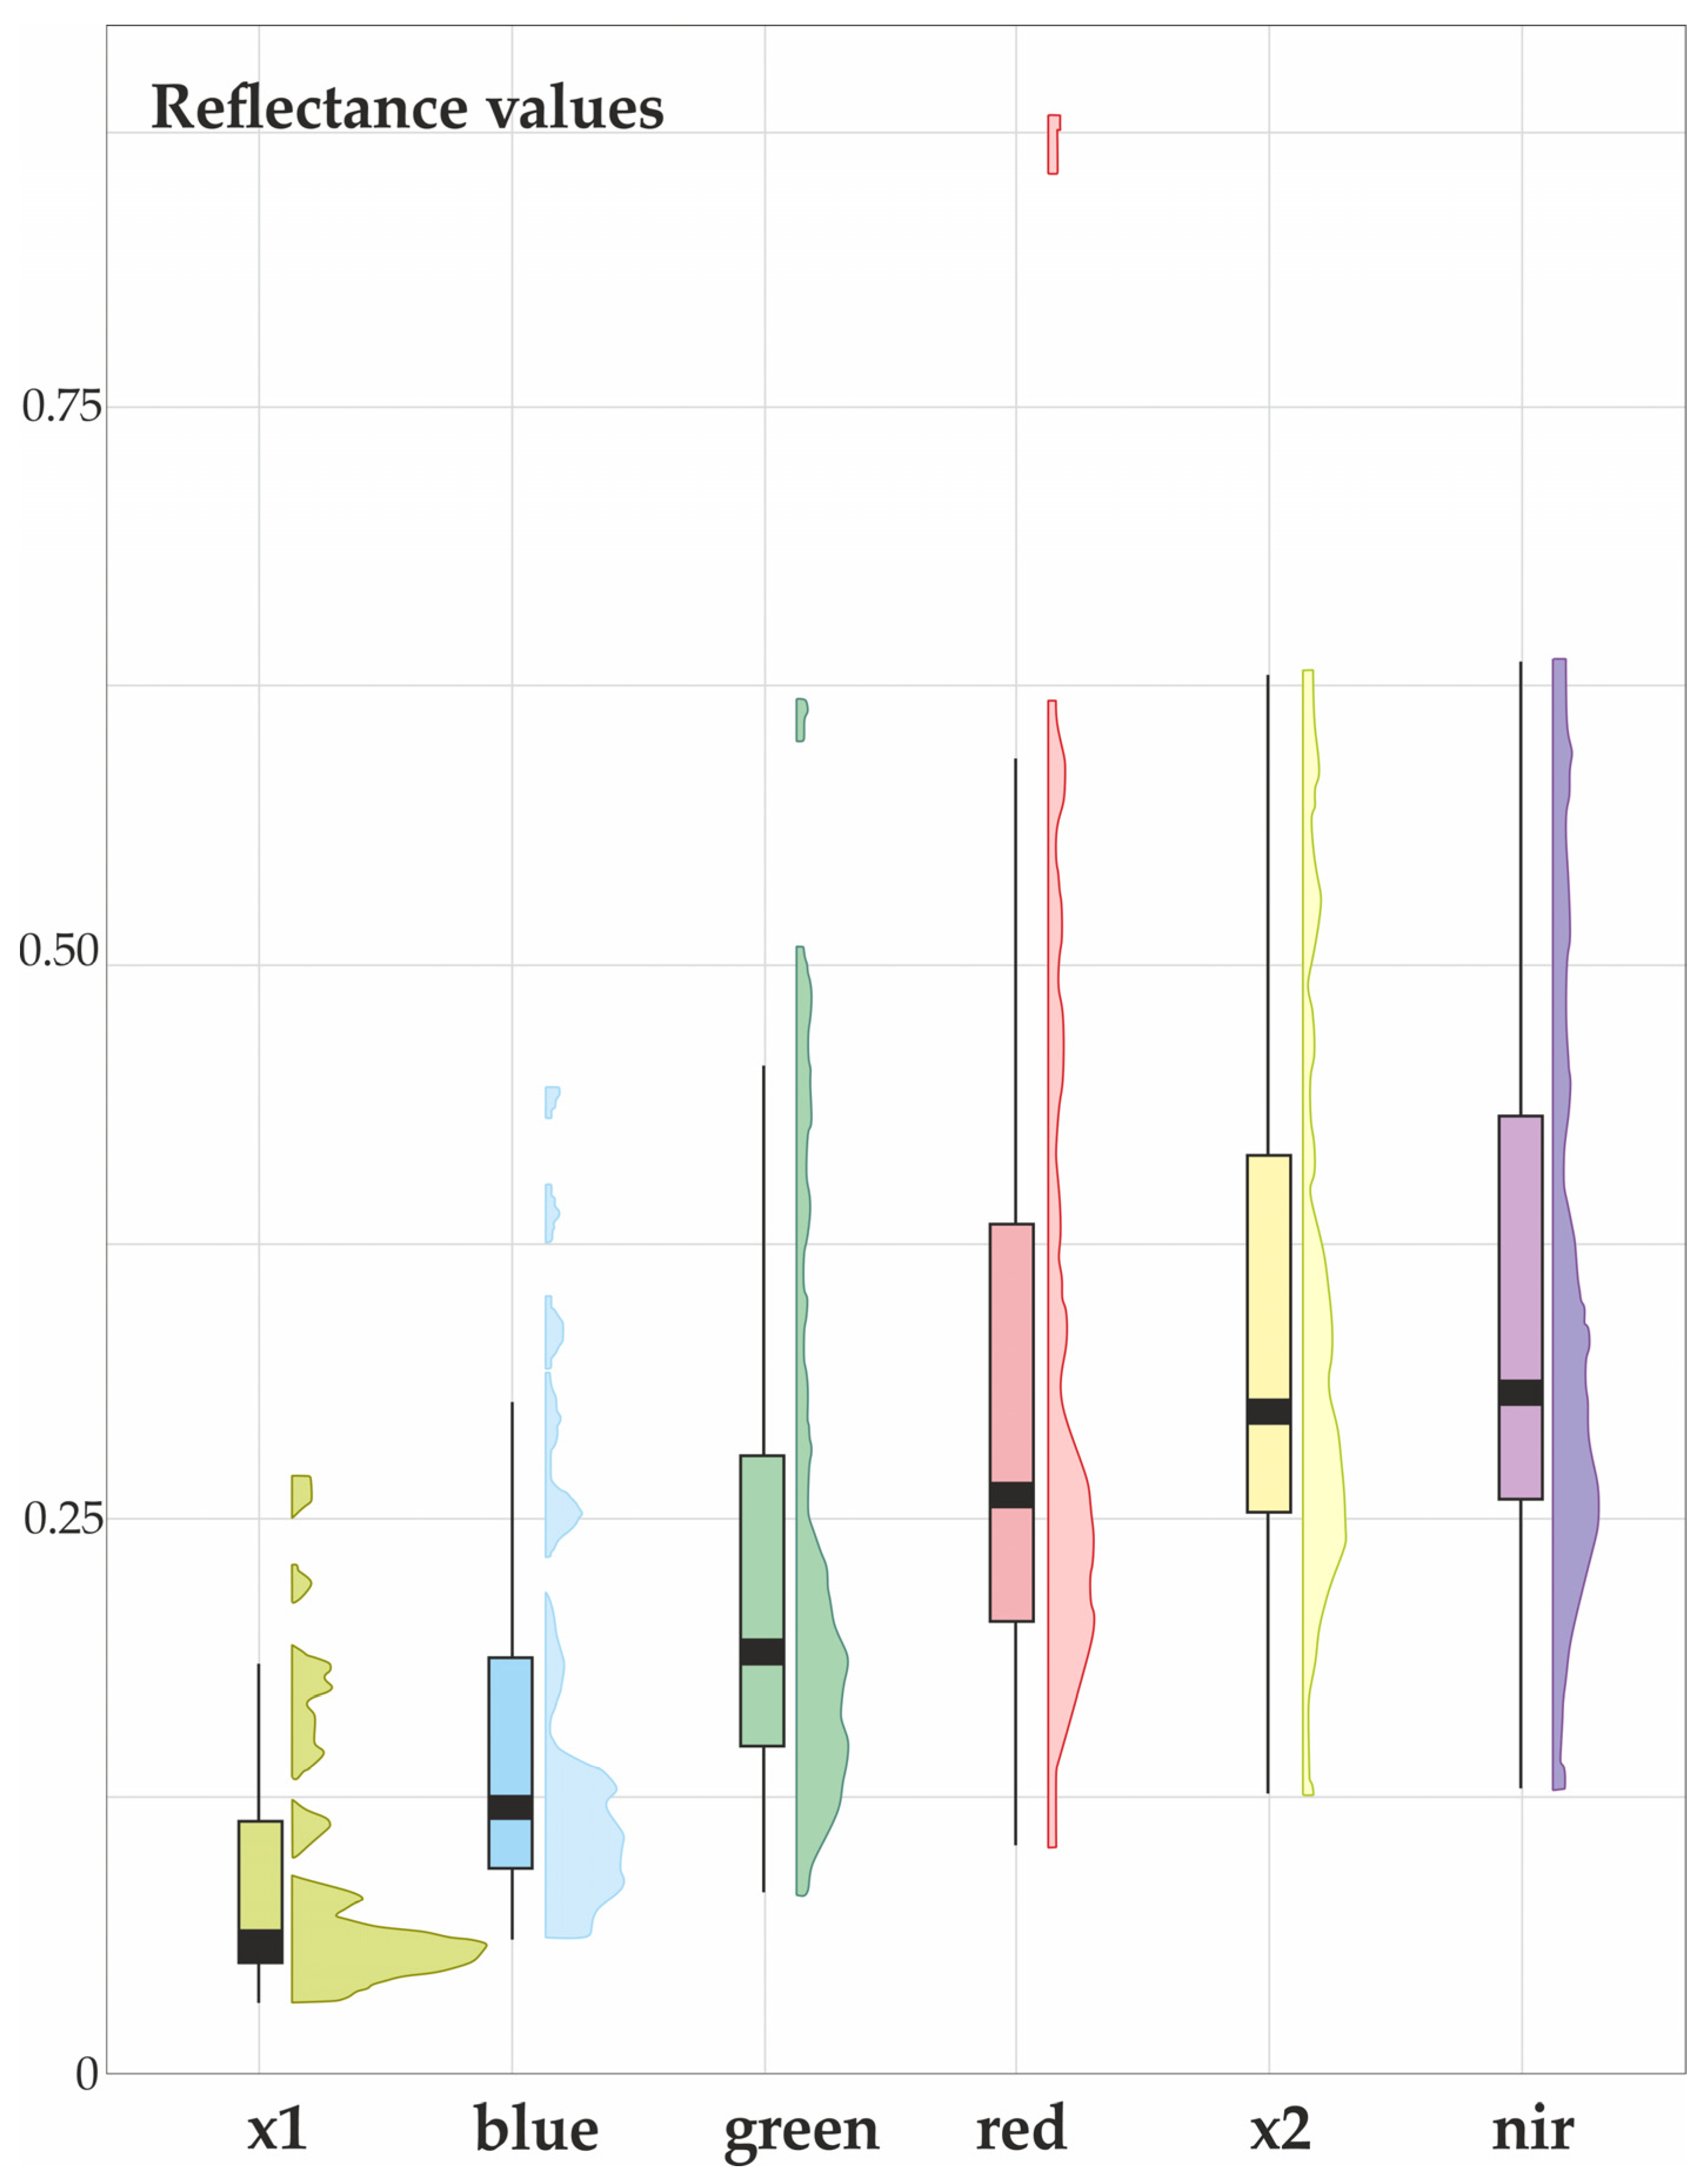
The analysis of the six selected bands (Table 3) reveals that the mean reflectance varies from lower in the X1 band (0.09) to higher (0.35) in the NIR band. The standard deviations follow the same pattern, increasing to higher wavelength values, with most of the spectra tending to stabilize in higher than 800 nm (X2) values. The median is lower than the mean for all the bands, corresponding to positive asymmetries. The kurtosis of the values is generally low, indicating a relative platykurtic distribution (Figure 10).
The negative values for the kurtosis in the X2 and NIR bands indicates a more spread-out distribution of data.
The density distribution of the green, red, X2, and NIR bands (Figure 10) presents a two peak distribution complemented with a variable number of positive outliers. This is indicative of at least two groups of spectra, as well as a third group corresponding to the outlier values.
The correlation diagram (Supplementary Material Figure S1a,b) shows that all the correlations of the different bands are strong (>75) and positive, and can be separated into three groups—namely, the X1, blue, and green bands; the NIR and X2 bands; and the separated red band.

4.2.2. Principal Components Analysis

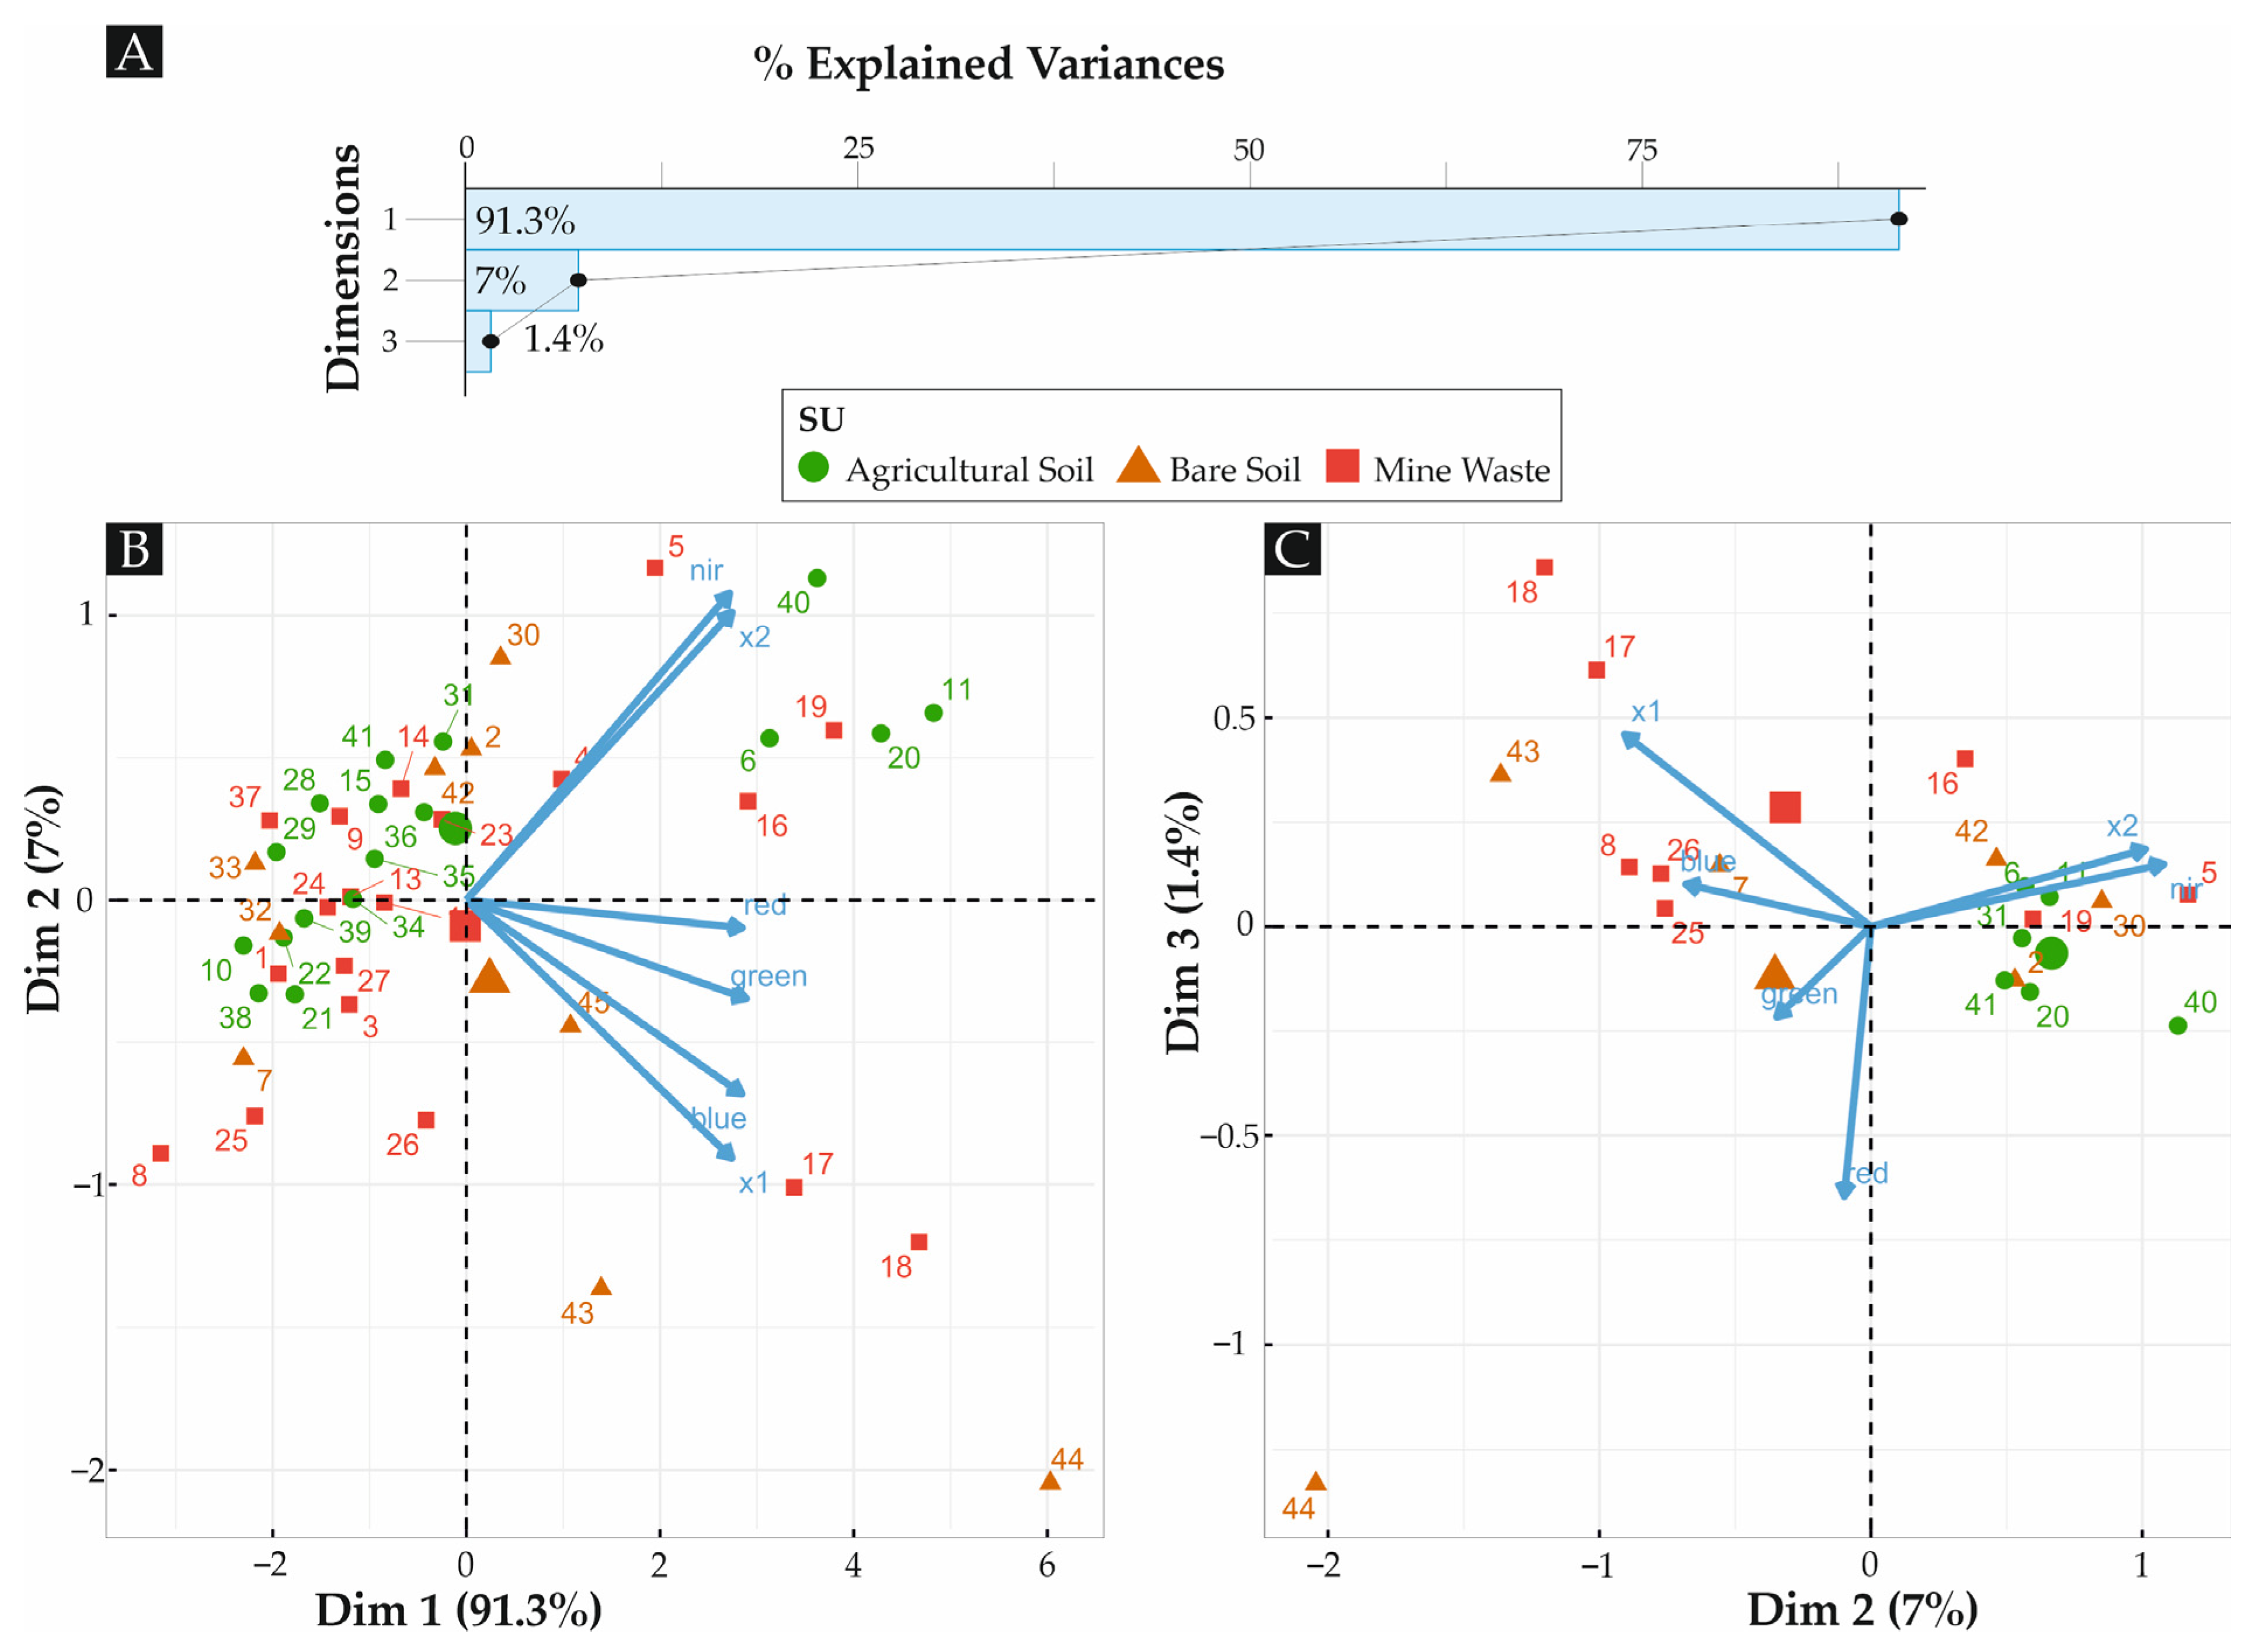
The principal components analysis for the defined bands revealed that PC1 explains 91.3% of the variability, PC2 explains 7% of the variability, and PC3 explains 1.4% (Figure 11A). For PC1, PC2, and PC3, the variables that contribute most are green, red, and blue; nir, X2, and X1; and red and X1, respectively.
The bigger brown triangle in Figure 11 represents the centroid of bare soil spectra, the bigger red square represents the centroid for the mine waste spectra, and the bigger green circle represents the centroid for the agricultural soil spectra. It is noteworthy that although most of the variability is explained by PC1, this variability does not correspond to a recognizable feature in the terrain. It is PC2 that separates bare soil dominated by blue and X1 bands and NIR, and X2 that reveals the agricultural soil types. The mine waste soil use types are between these two features.
The observation of the Figure 11C plot reveals that mine waste soils are mainly controlled by low wavelength bands (X1 and blue), and are in an opposite position relative to the red band.

4.3. Sentinel-2

4.3.1. Sentinel-2 Band Compositions

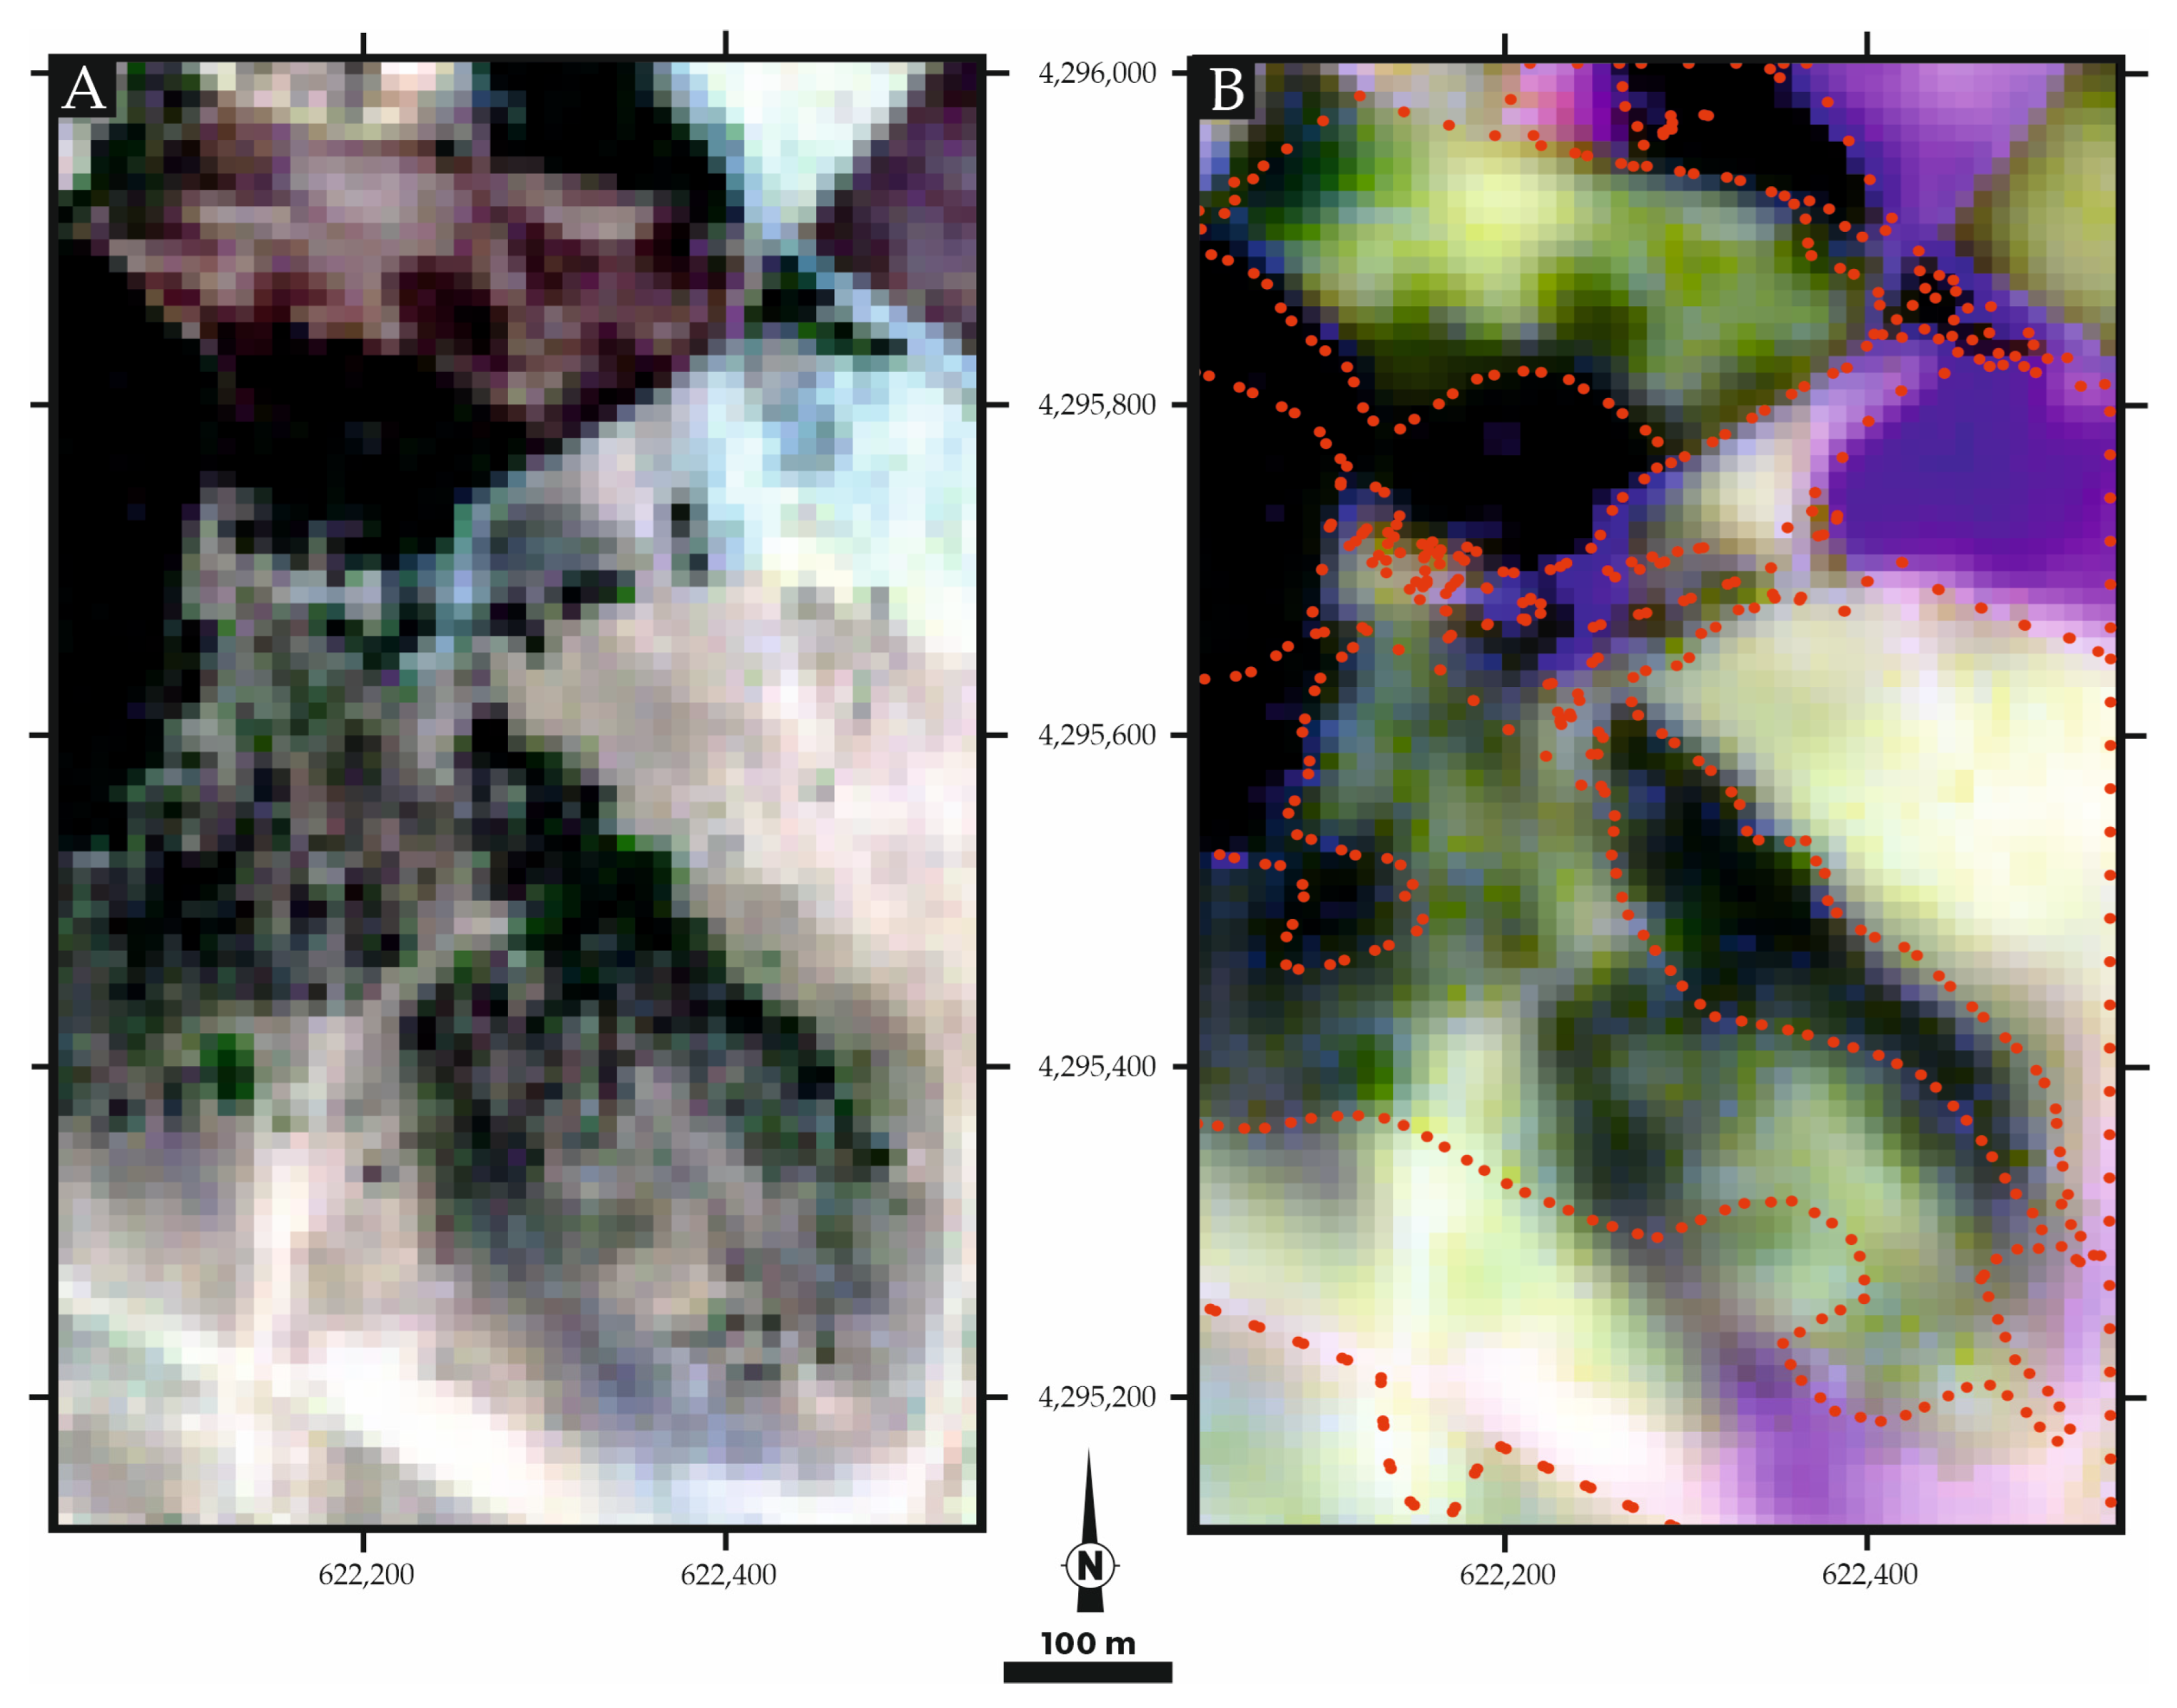
For the study area, the band composition of true colour (B4-B3-B2 bands) and geology (B12-B11-B2 bands) was analysed (Figure 12).
In the true colour image, the tree-covered-like areas (forest, trees, olive trees, and shrubs) are presented in green colours that range from very dark to faint green, as expected. The soil-like areas (soils, mine waste, and infrastructure) appear in a creamy red colour, but the mine waste and road areas present a more blueish colour (top right of the image).
The results obtained with the geology composite image highlight the mine waste area that becomes purple, and clearly separates the forest-like areas and the soil-covered areas in dark greenish colours and light cream colours, respectively (Figure 12). In the lower right part of the study area, there are some purplish areas that correspond to a lower elevation terrain.

4.3.2. Sentinel-2 Band Ratios

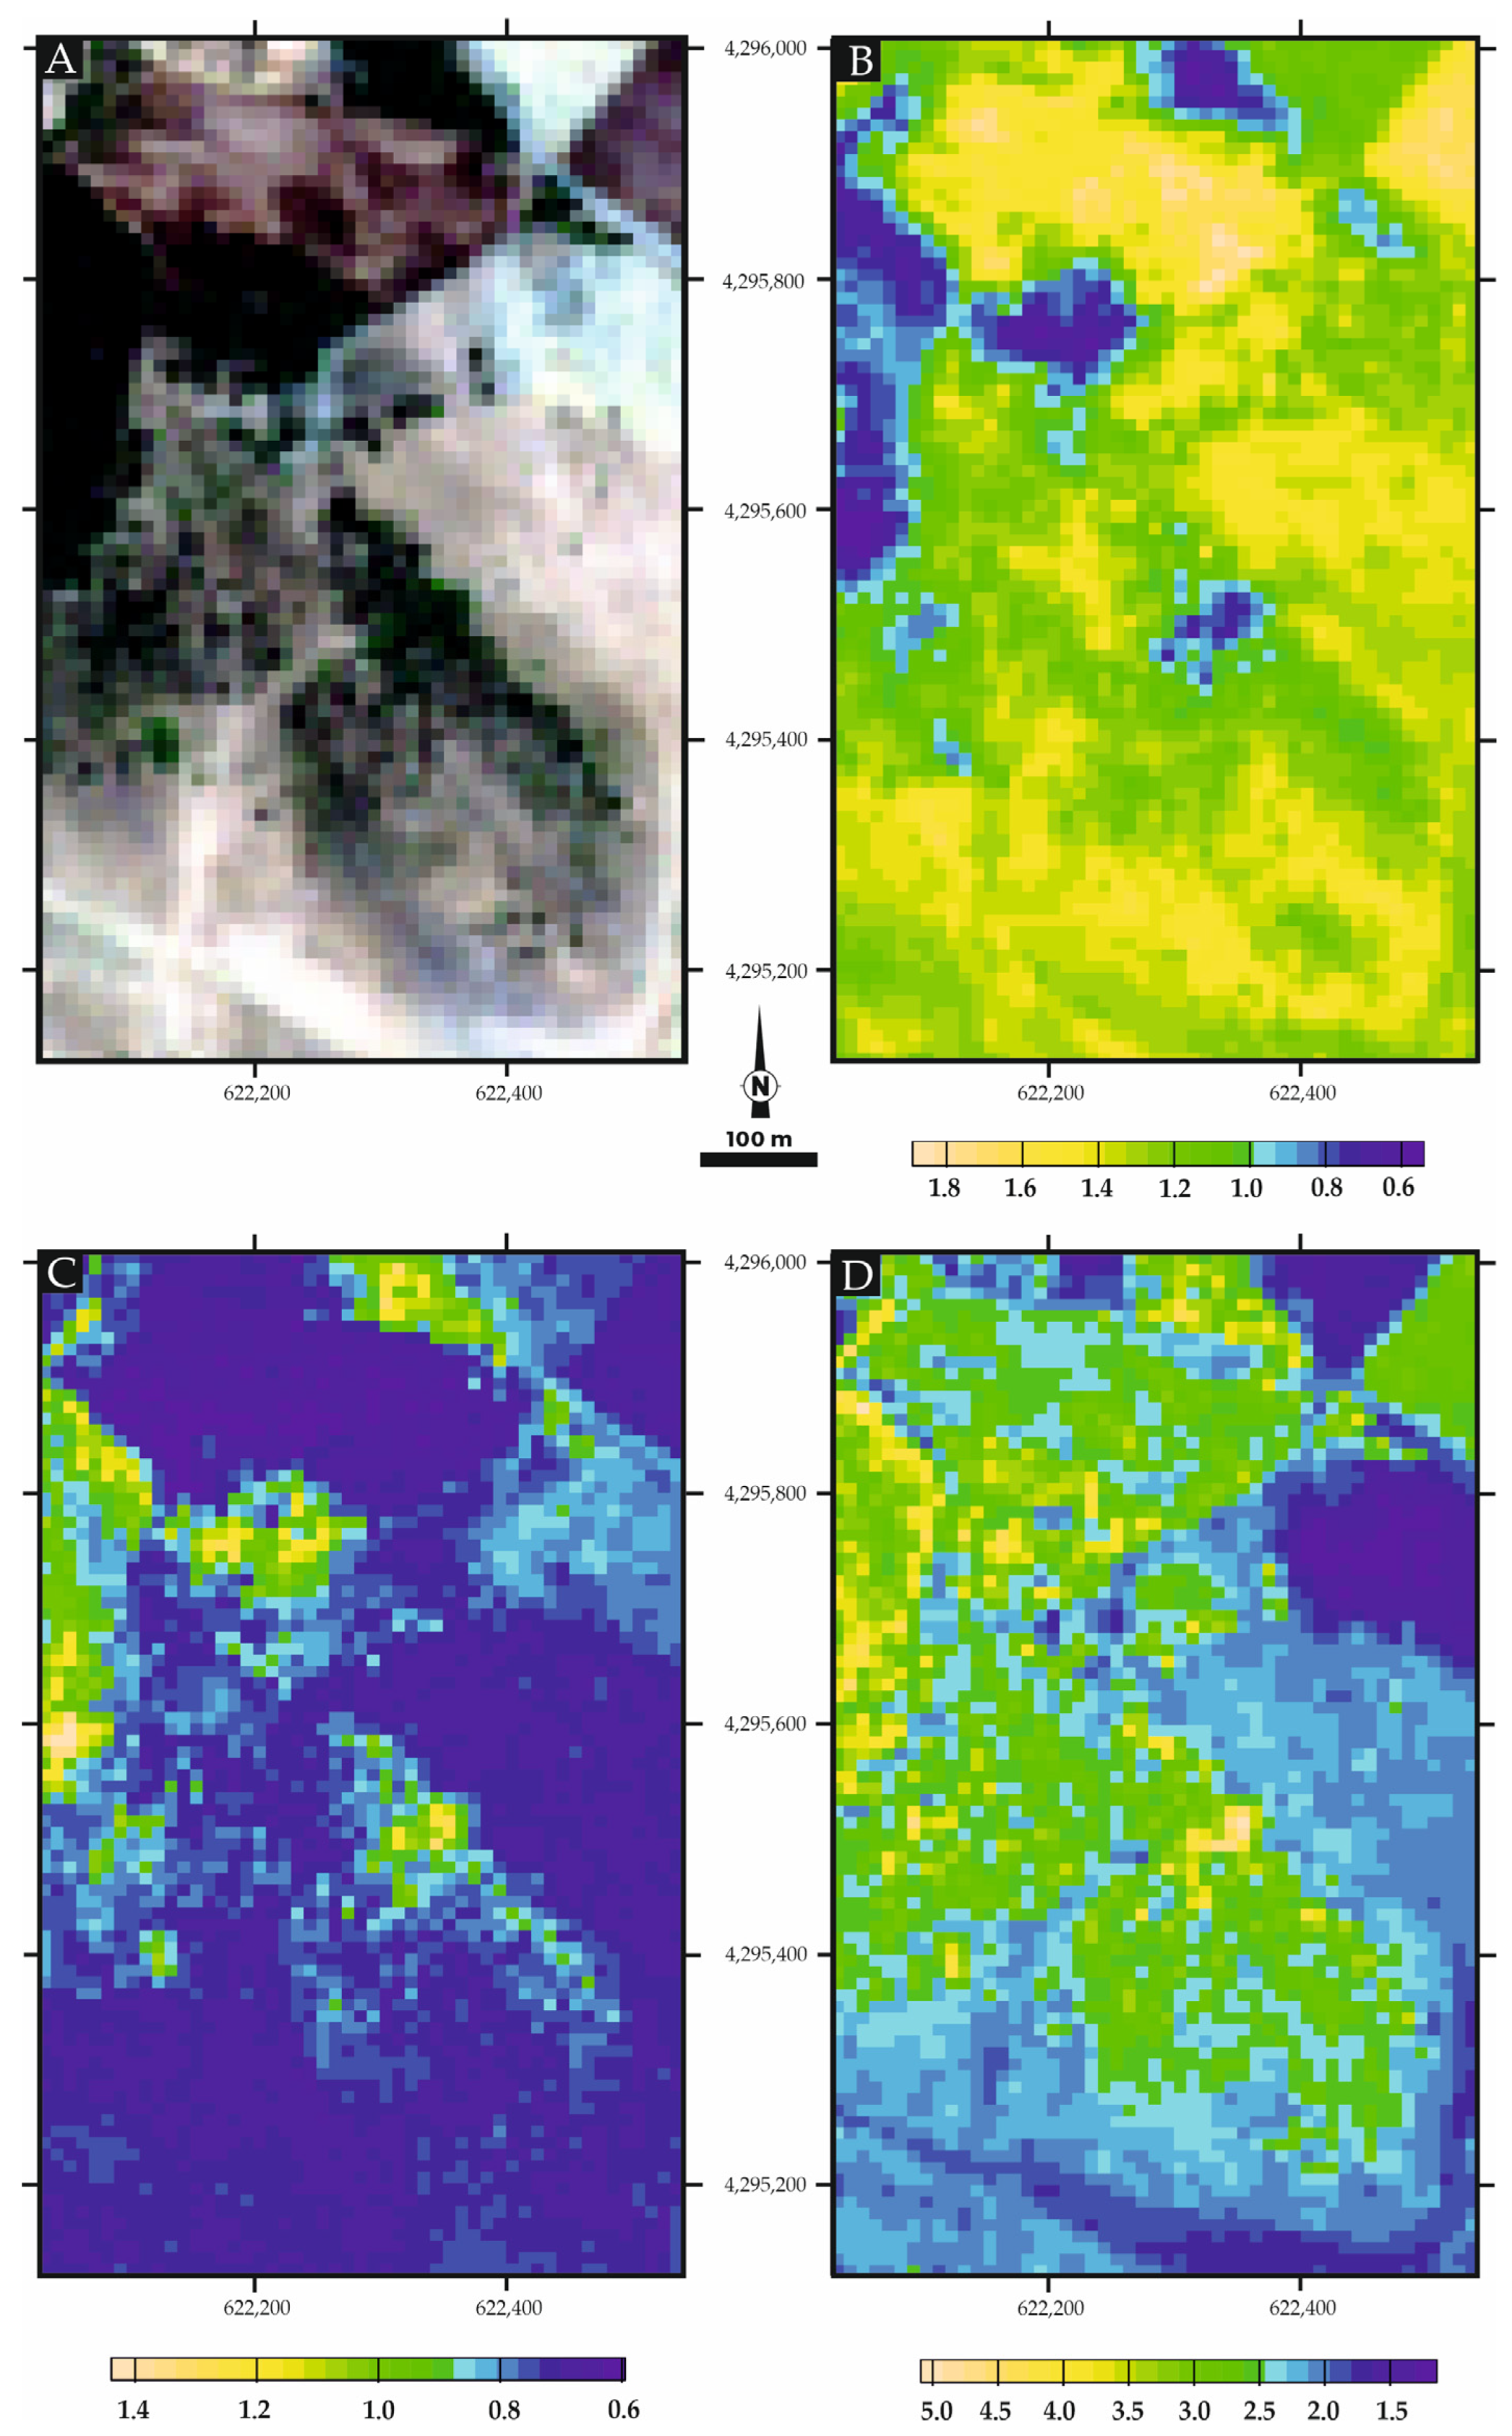
The band ratios essayed in the Sentinel-2 images—i.e., B11/B8, B3/B4 and B11/B4—evaluate the iron content and type response in the study area (Figure 13).
The iron oxides (B11/B8a) reveal the higher values respond in the soils area, and the lower values respond in the forest area. The ferric band ratio (B3/B4) displays high values in the forest areas and low values in all the remaining areas. The gossan index (B11/B4) reveals distinctive low values in the mine waste areas, intermediate values in the vegetation areas, and the high values mainly in forested areas.

4.3.3. Principal Components Analysis

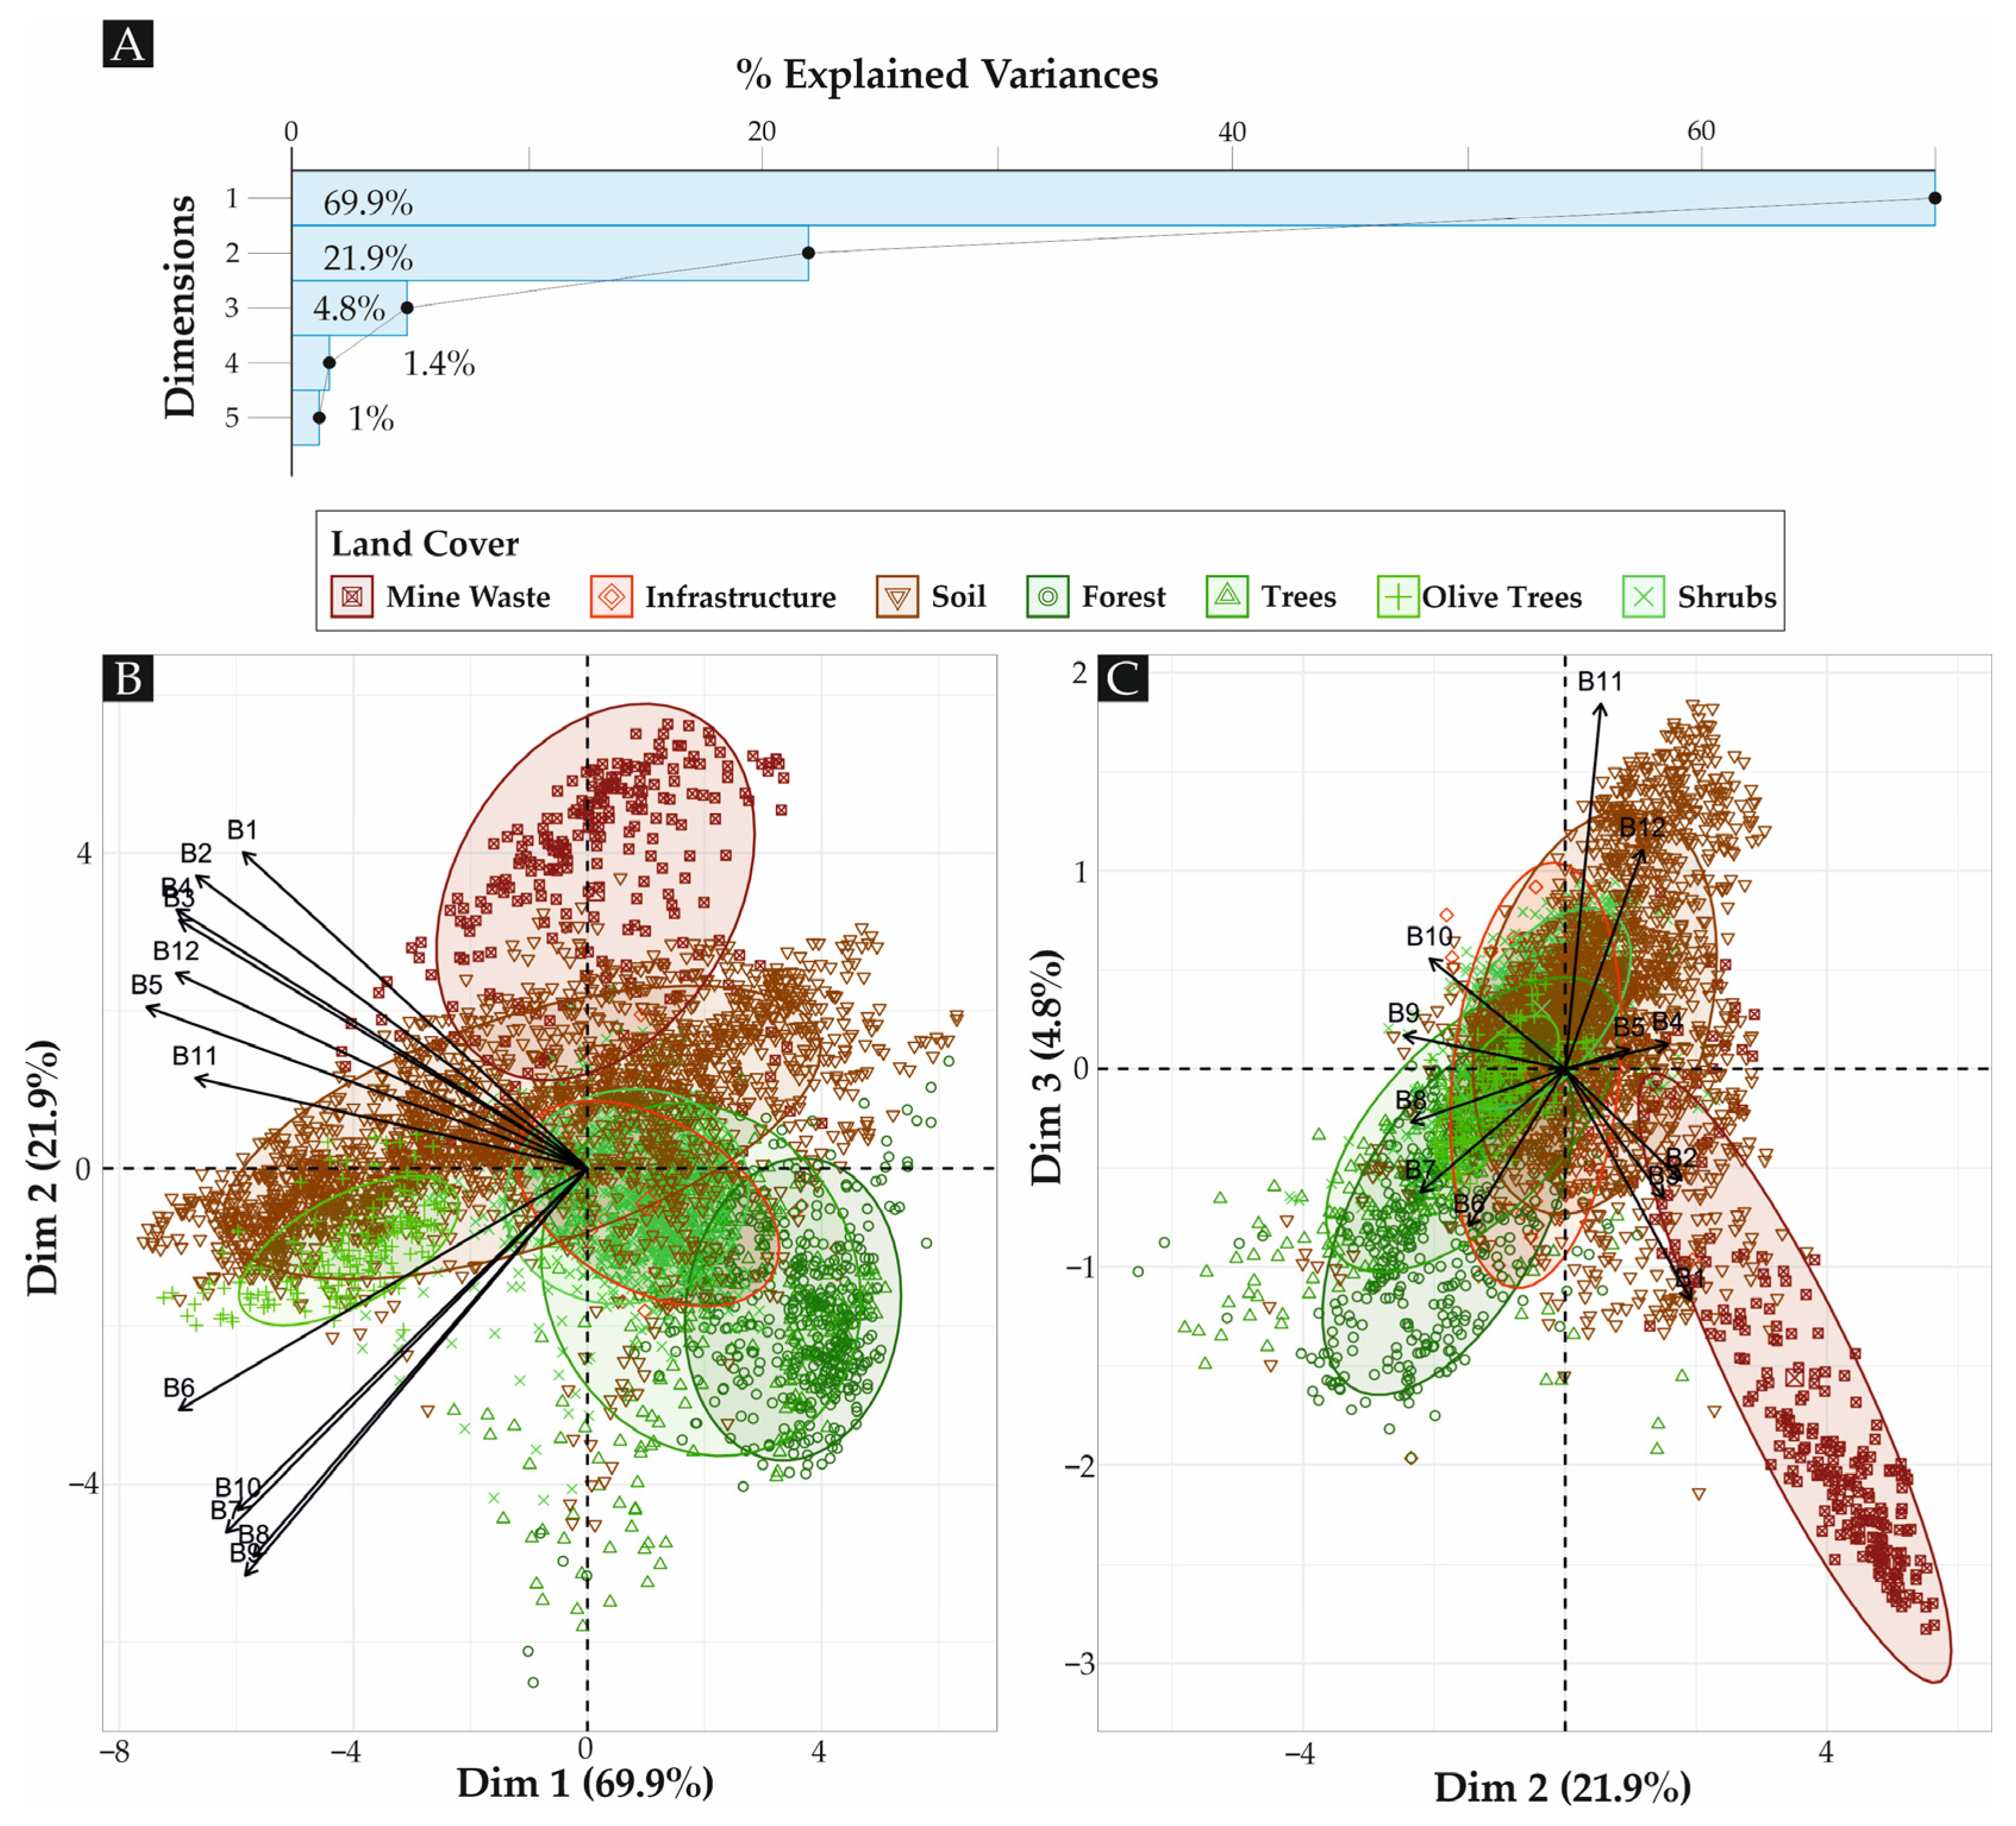
For the Mostardeira case study, 5 PCs were considered, but most of the variability is explained by the first three components (PC1, PC2, and PC3; see Figure 14).
The analysis of the biplots demonstrates that in the PC2 axis, it is possible to mostly differentiate the vegetated elements in the negative part of this axis, whereas most of the soil-like elements fall in the upper part of the PC2 axis (c.f. Figure 14B). Complementarily, the biplot of PC2 vs. PC3 (Figure 14C) allows the discrimination of mine-wastes-defining pixels in the negative part of PC3 axis, defined mostly by the B1, B2, and B3 bands, and soil in the positive part of this axis, dominated by the B11 and B12 bands. Although PC1 explains most of the variety of data, it is not clear from these plots what component it is mapping.
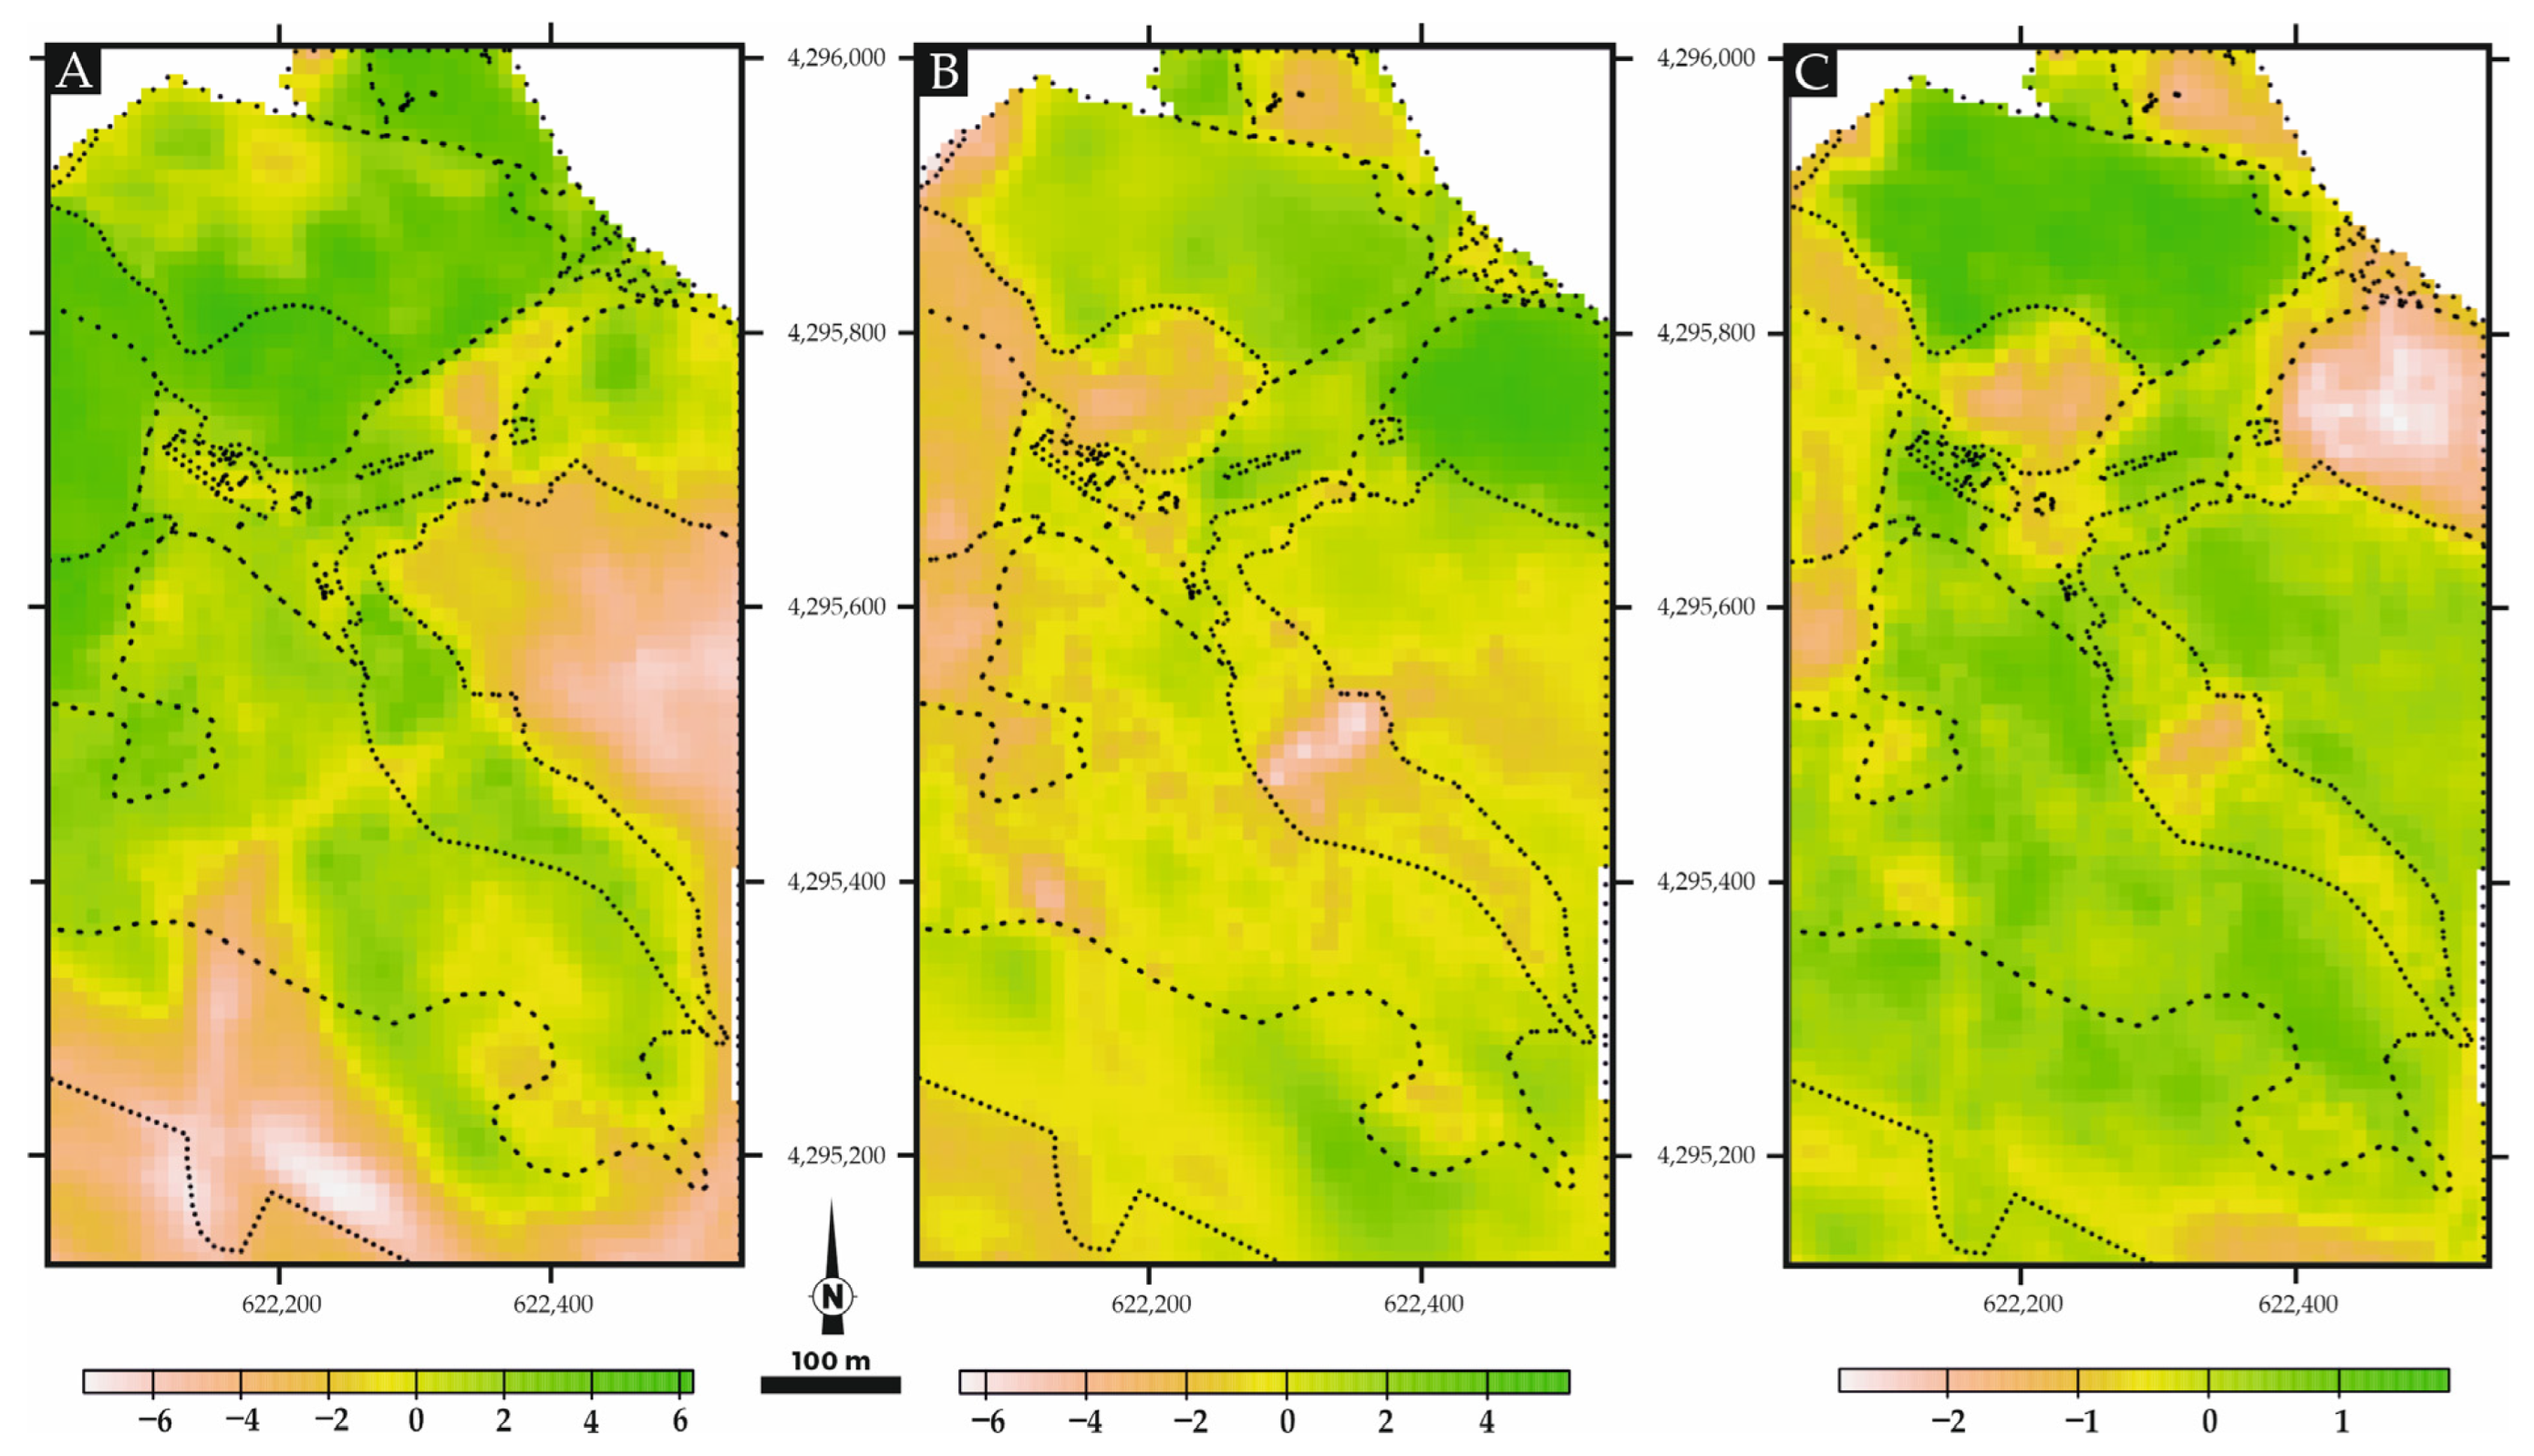
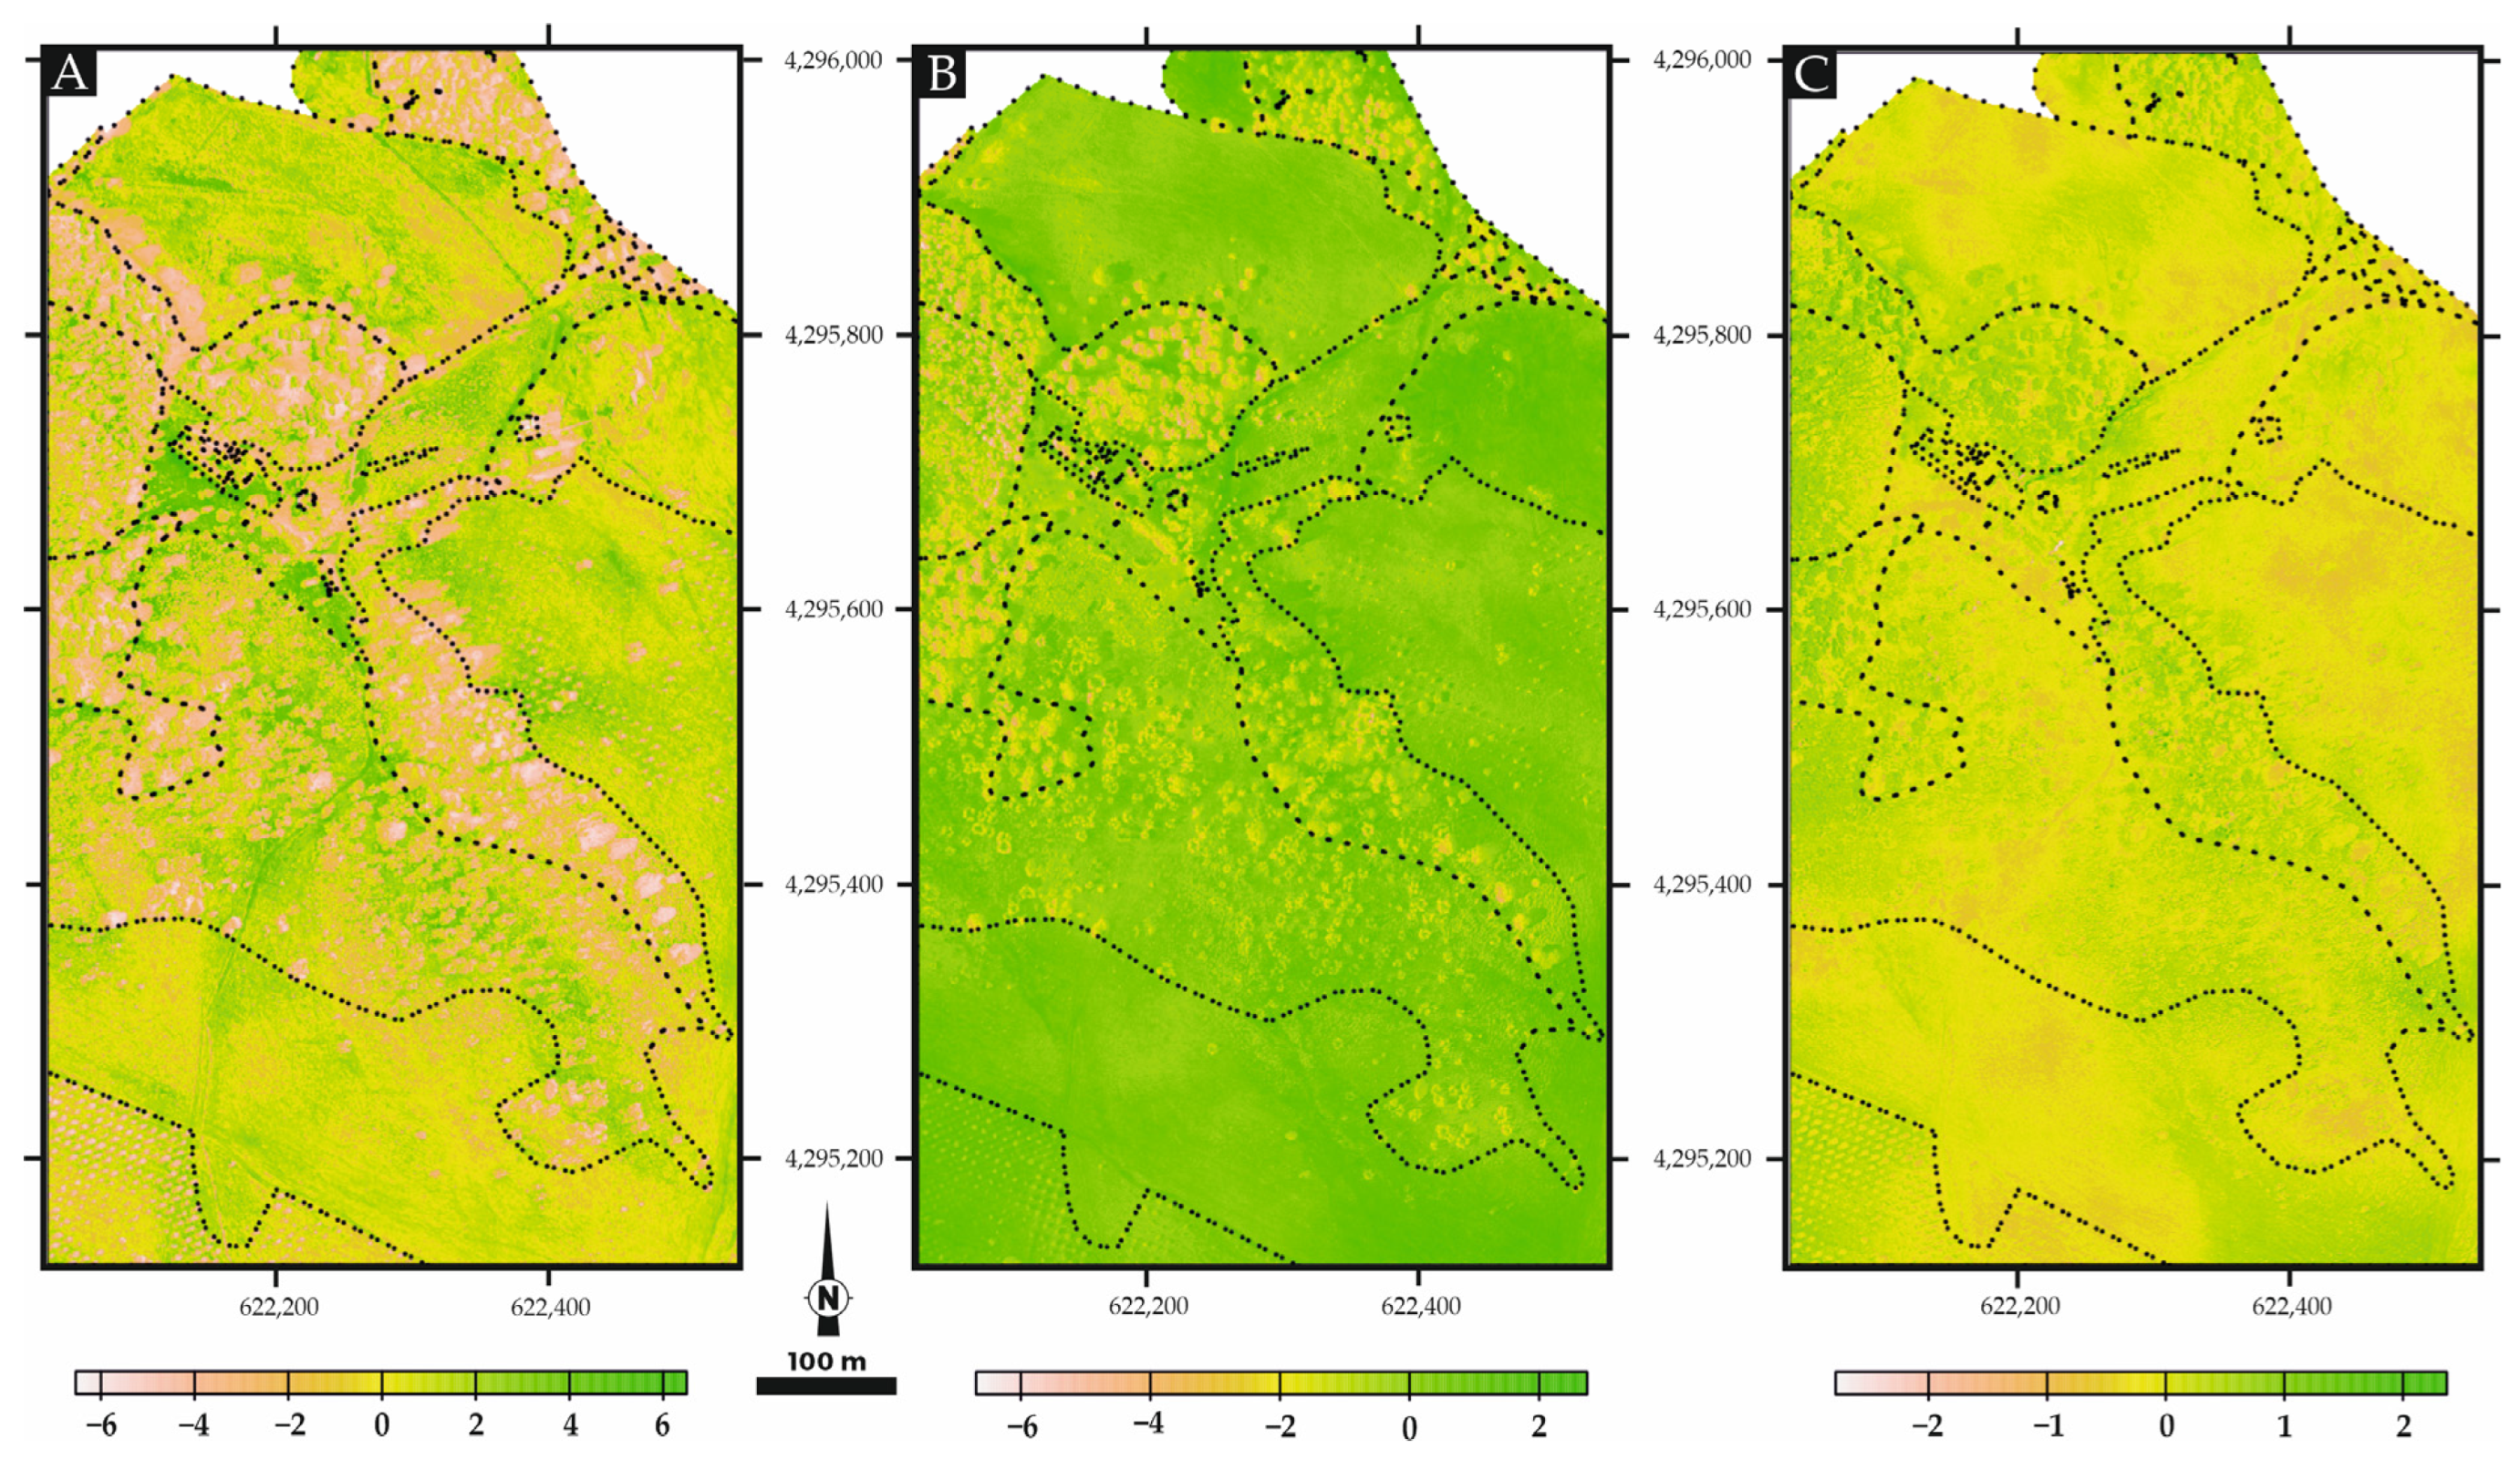
To understand the spatial variation of the different components, a map of each component was created (Figure 15).
The map of the PC1 shows that this component is representing what might be considered agricultural soil, bare soil, or the olive trees cultivated areas, where the soil is quite exposed. The PC2 map displays the higher values in the mine waste area, whereas the lower values are in the denser vegetated areas. The PC3 map shows the lower values in the mine waste zone and the higher values in agricultural soil areas. Although the PC only explains 4% of the variability, it is important for separating the types of soils. This is in line with what was found in the previous diagrams.

4.4. Drone Images

The drone images provide ground information with high spatial detail. Although the number of bands is more limited than the Sentinel-2 images, the gain in spatial resolution can be used to create more detailed images of the study area.

4.4.1. Band Composition and Band Ratios

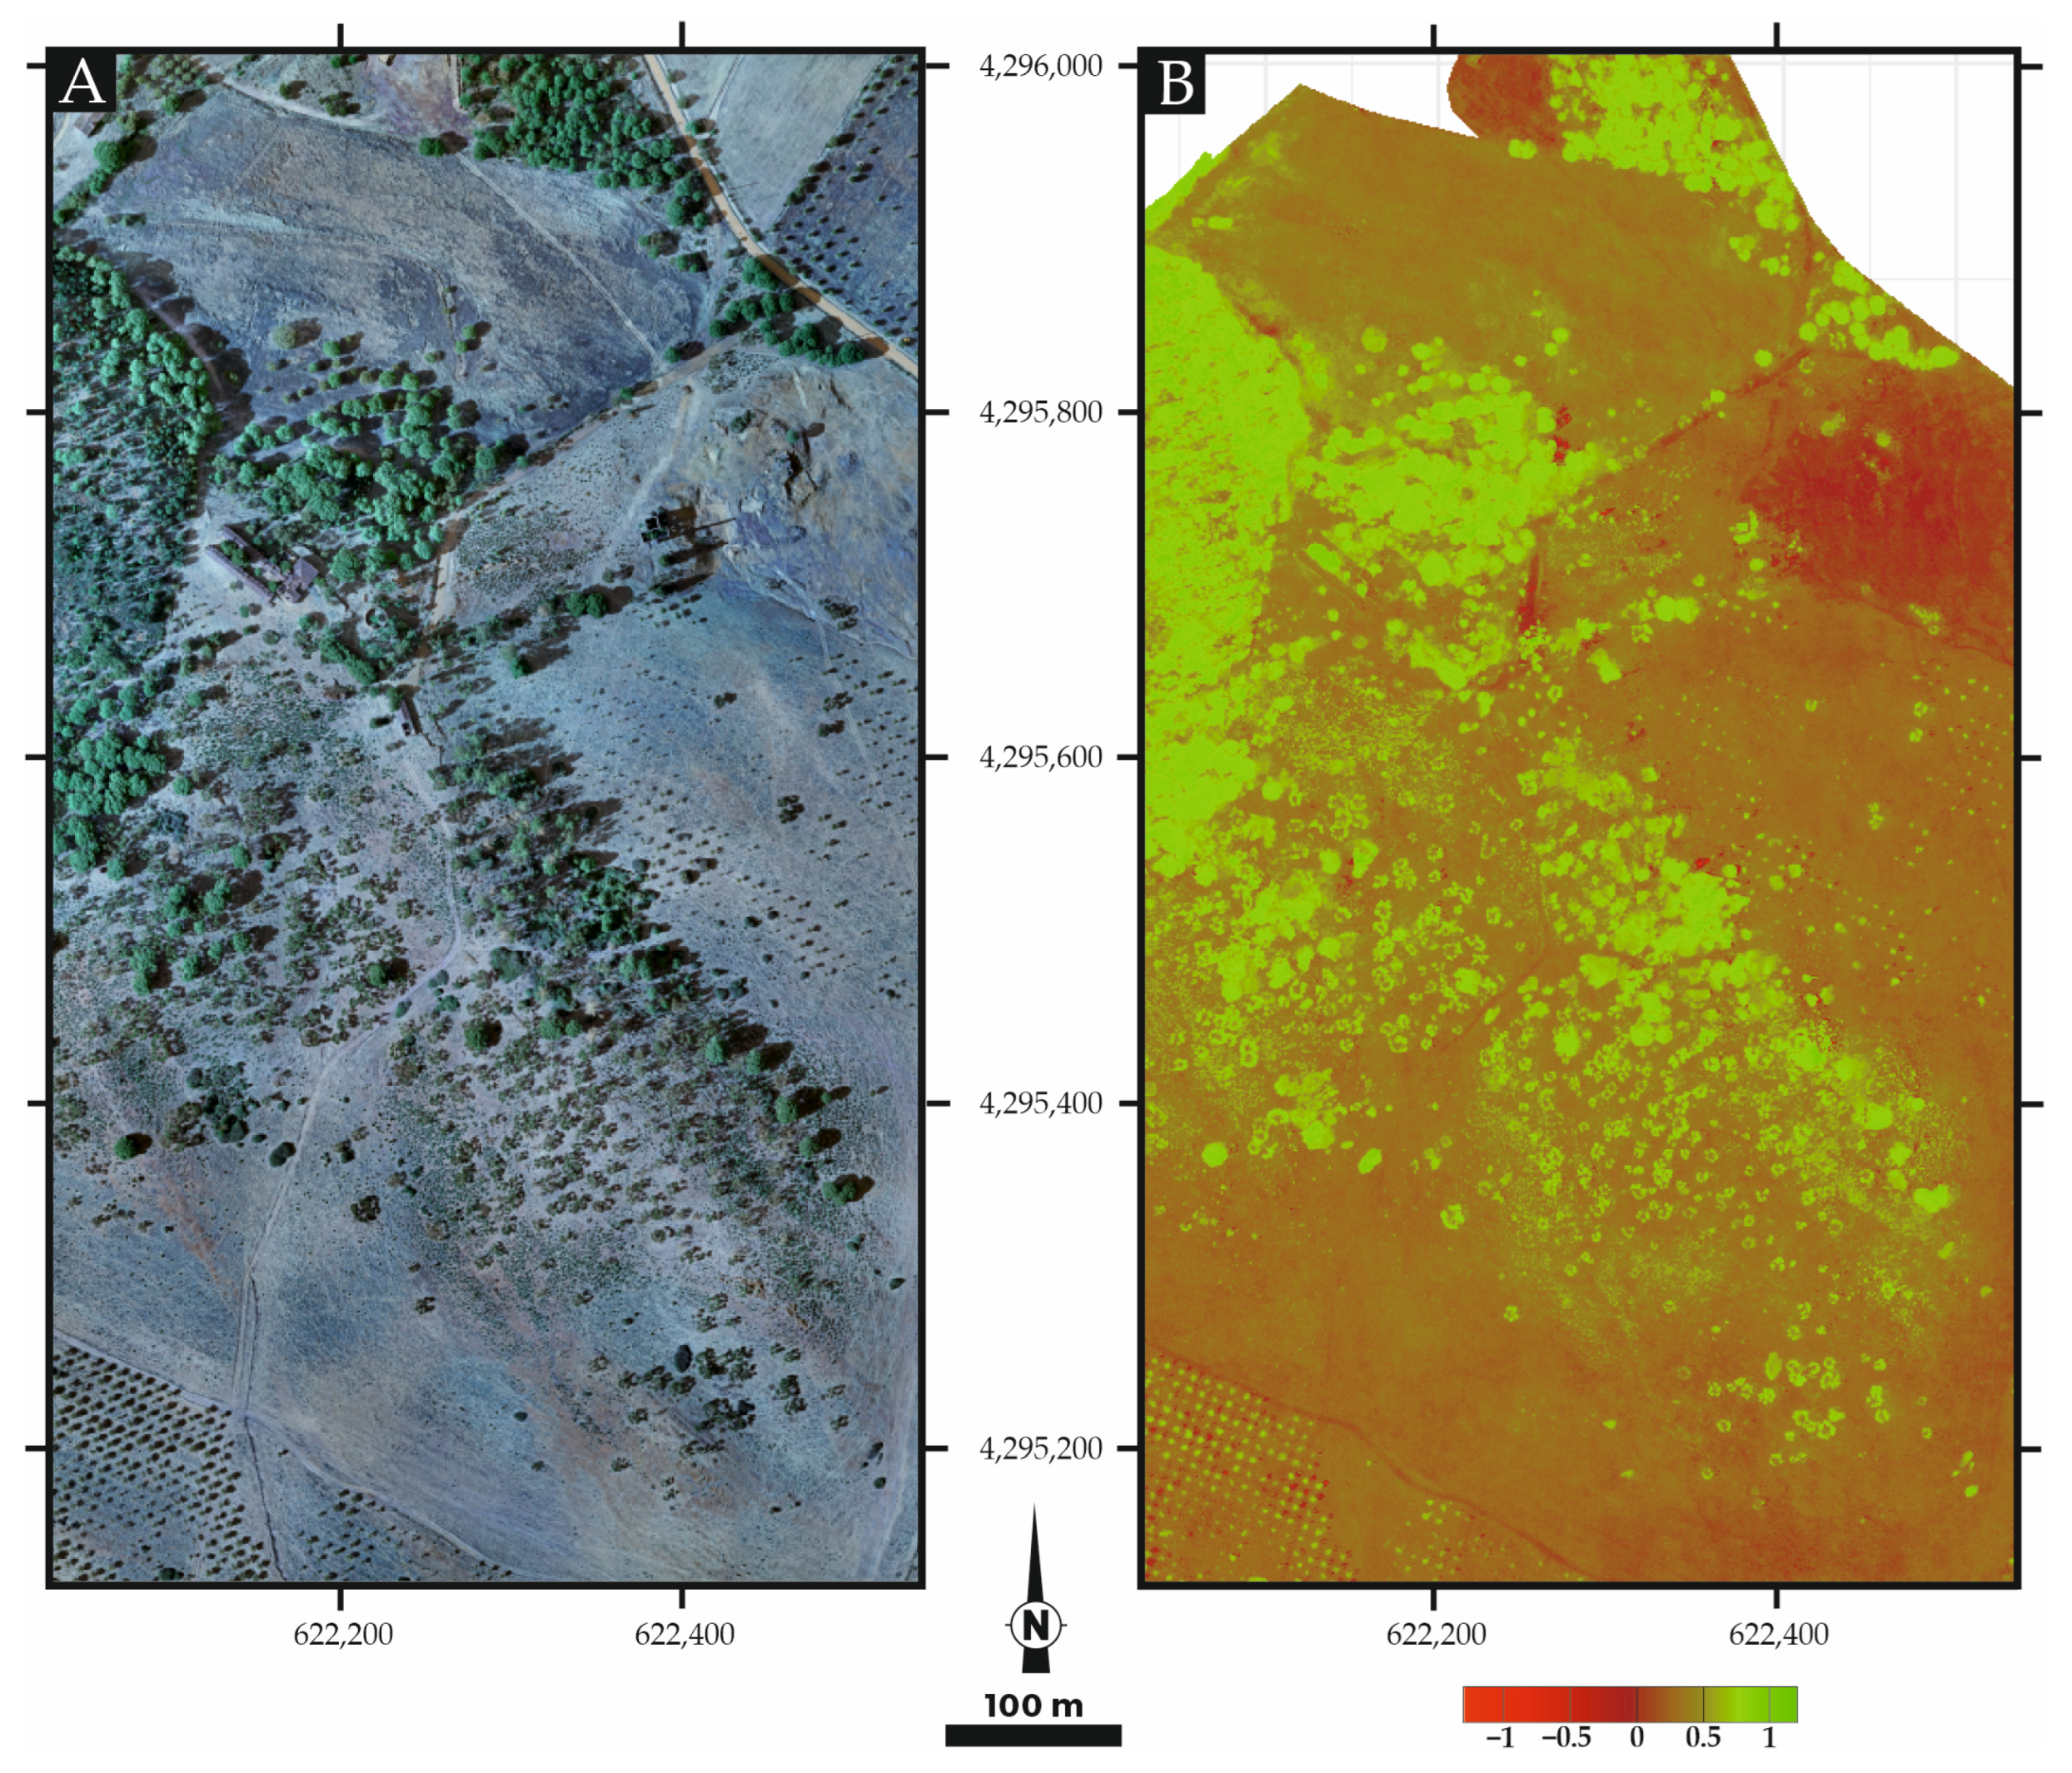
Figure 16 displays the obtained drone image in the combination of the RGB bands and the NDVI ratio (Normalized Difference Vegetation Index), which provides useful information to separate the vegetated areas (forest, trees, olive trees and shrubs) from the bare soil areas. The NDVI band ratio shows different levels of green according to the density of the vegetation. The soils are in a general brown colour (lower than 0.5), and the mine waste covered areas have a NDVI lower than 0.

4.4.2. Principal Components Analysis

Although only five bands are available for principal component extraction, PC1 explains 83.1%, whereas PC2 and PC3 explain 12.8% and 2.5%, respectively. The PC1 is dominated by B2 (green), B1 (blue), and B4 (sentera red), whereas PC2 is dominated mostly by B5 (sentera nir), and PC3 by B4 (sentera red).
The mapping of the main components is presented in Figure 17.
The image of PC1 (A) clearly demonstrates the agricultural soils in green—that is, positive values of PC1—whereas the vegetation displays yellow to brown colours—i.e., negative values. Nonetheless, the vegetation areas are often mixed with casted shadow zones that are nearby the trees. The roads are also clearly identified in this component with high PC1 values (green coloured). The PC2 (B) dominated by the B5 (sentera nir) clearly separates the vegetation areas (PC2 < 2) from soil, as this component is not influenced by the shadows. The PC3 displays mixed values in most of the land uses; as it is dominated by the B4 (red) component, it separates more iron-rich soil fractions (lower values of the PC3).

4.4.3. Classification Algorithms

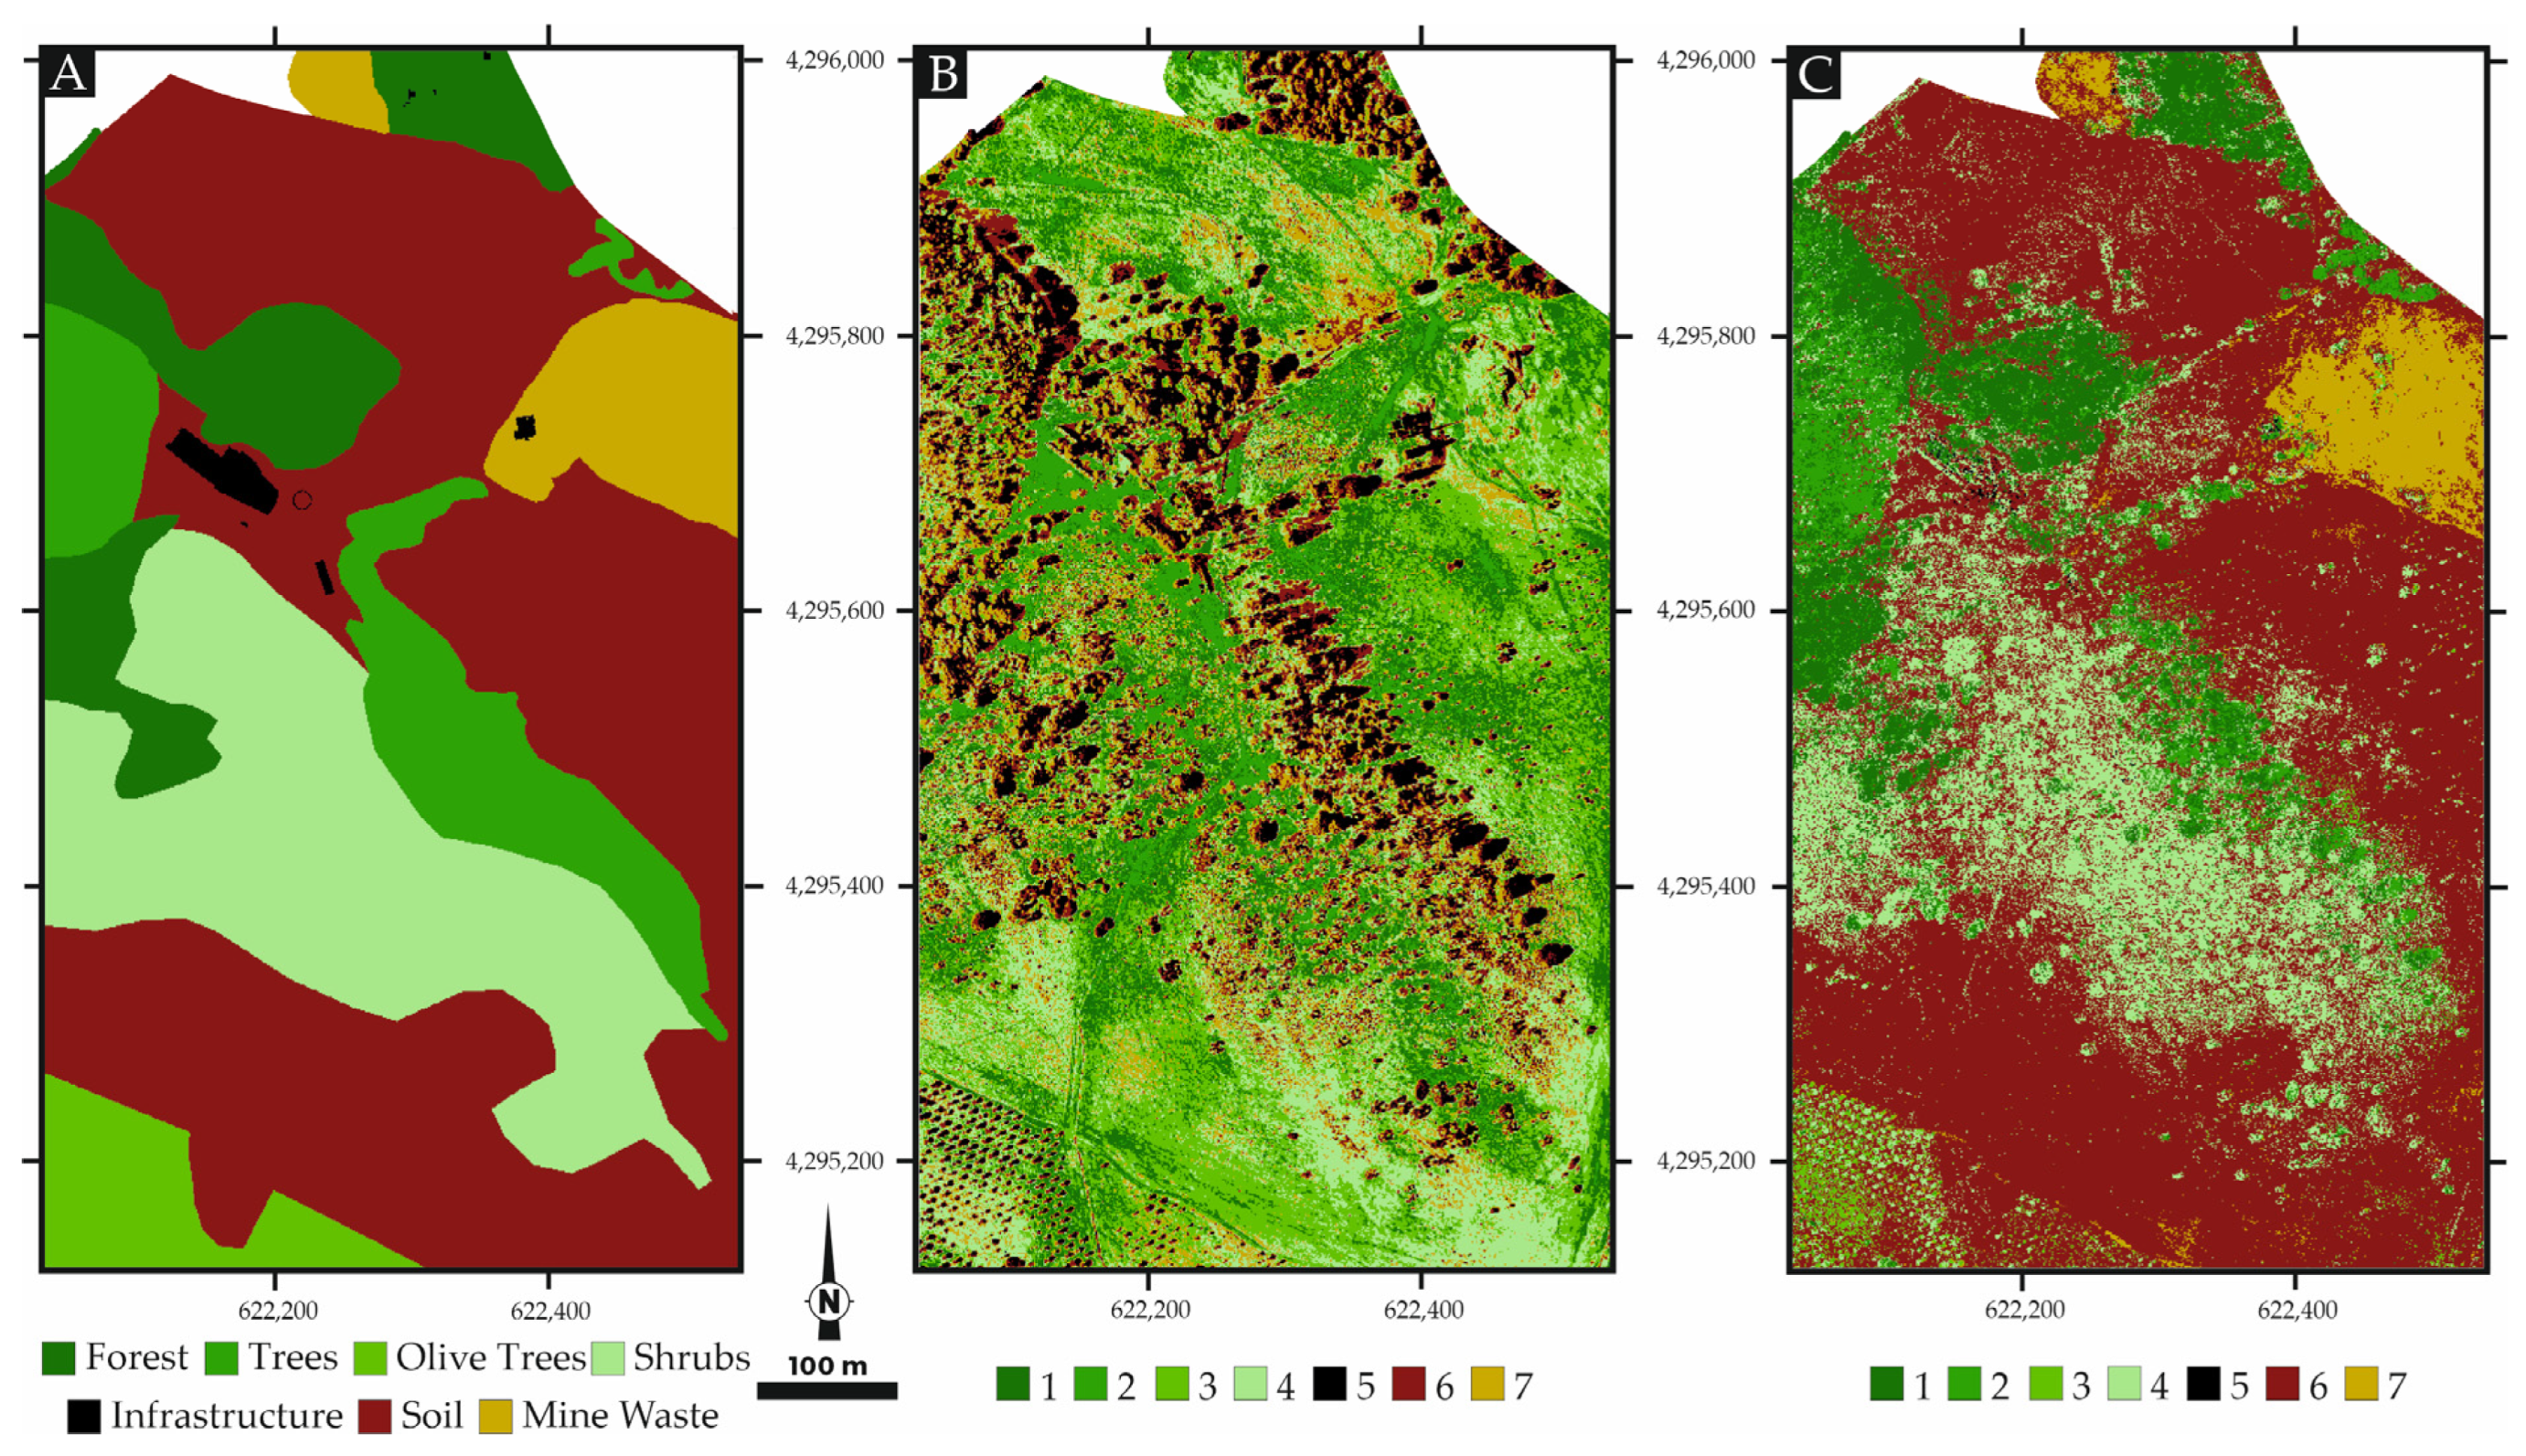
Classification algorithms were used to verify the agglomerative properties of the drone band set images. An unsupervised classification algorithm—K-means—was tested and confronted with the original classification (Figure 18). The K-means algorithm was tested with multiple numbers of clusters, and is presented in Figure 18—the case with seven clusters.
Complementarily, a supervised classification—random forest—was tested to identify the structures present. For this algorithm, a random sample of 10% of the pixels were used to train the model. The results are presented in Figure 19.
The results for the K-means classification clearly identify the vegetated areas, separating trees (clusters 1 and 2) from shrubs, grass (clusters 3 and 4), soils, and mine waste (clusters 6 and 7). Although the results are good, it fails to separate soils from mine waste areas. Cluster 5 is not clearly connected with any recognizable structure in the field.
The results of the random forest classifier are also quite impressive, as they can map the identified structures with good precision. This algorithm performance is very good in separating soils (cluster 5) from mine waste soils (cluster 6). Forest, shrubs, and olive tree areas are also identified correctly (clusters 0, 3, and 2, respectively). Cluster 5 is also, in this case, composed by very few pixels, hence it is difficult to relate with any terrain feature.

5. Discussion

A thorough literature review reveals that the methodologies used in this study are often used either individually—e.g., [7,9,11,14]—or, less often, combined—e.g., [14,15,16]—to identify and characterize soils and minerals from contaminated areas.
In the case of ground techniques, it is a general conclusion in most of the literature that “The results confirmed that sensor fusion can effectively improve the accuracy of the spectrometer in detecting metal elements in the soil.” (see [43]). When confronting the individual results from each technique for the characterization of soils, the pXRF results are slightly better [44]. However, the combination of both techniques greatly improves the results [8,45], even providing good results when the values are below the limits of detection from the pXRF equipment.

5.1. Portable XRF

Our pXRF data is in conformity with other results obtained for other mineral deposits in the region [7,23,26,46,47], mainly for copper vein mines of the OMZ. However, the As values are extremely high and should be looked over due to environmental issues. The comparison with soils in the vicinity of copper mines from the Iberian Pyrite belt reveals that the Mostardeira soils have Cu contents compatible with values from these types of deposits (c.f., [7,26]).
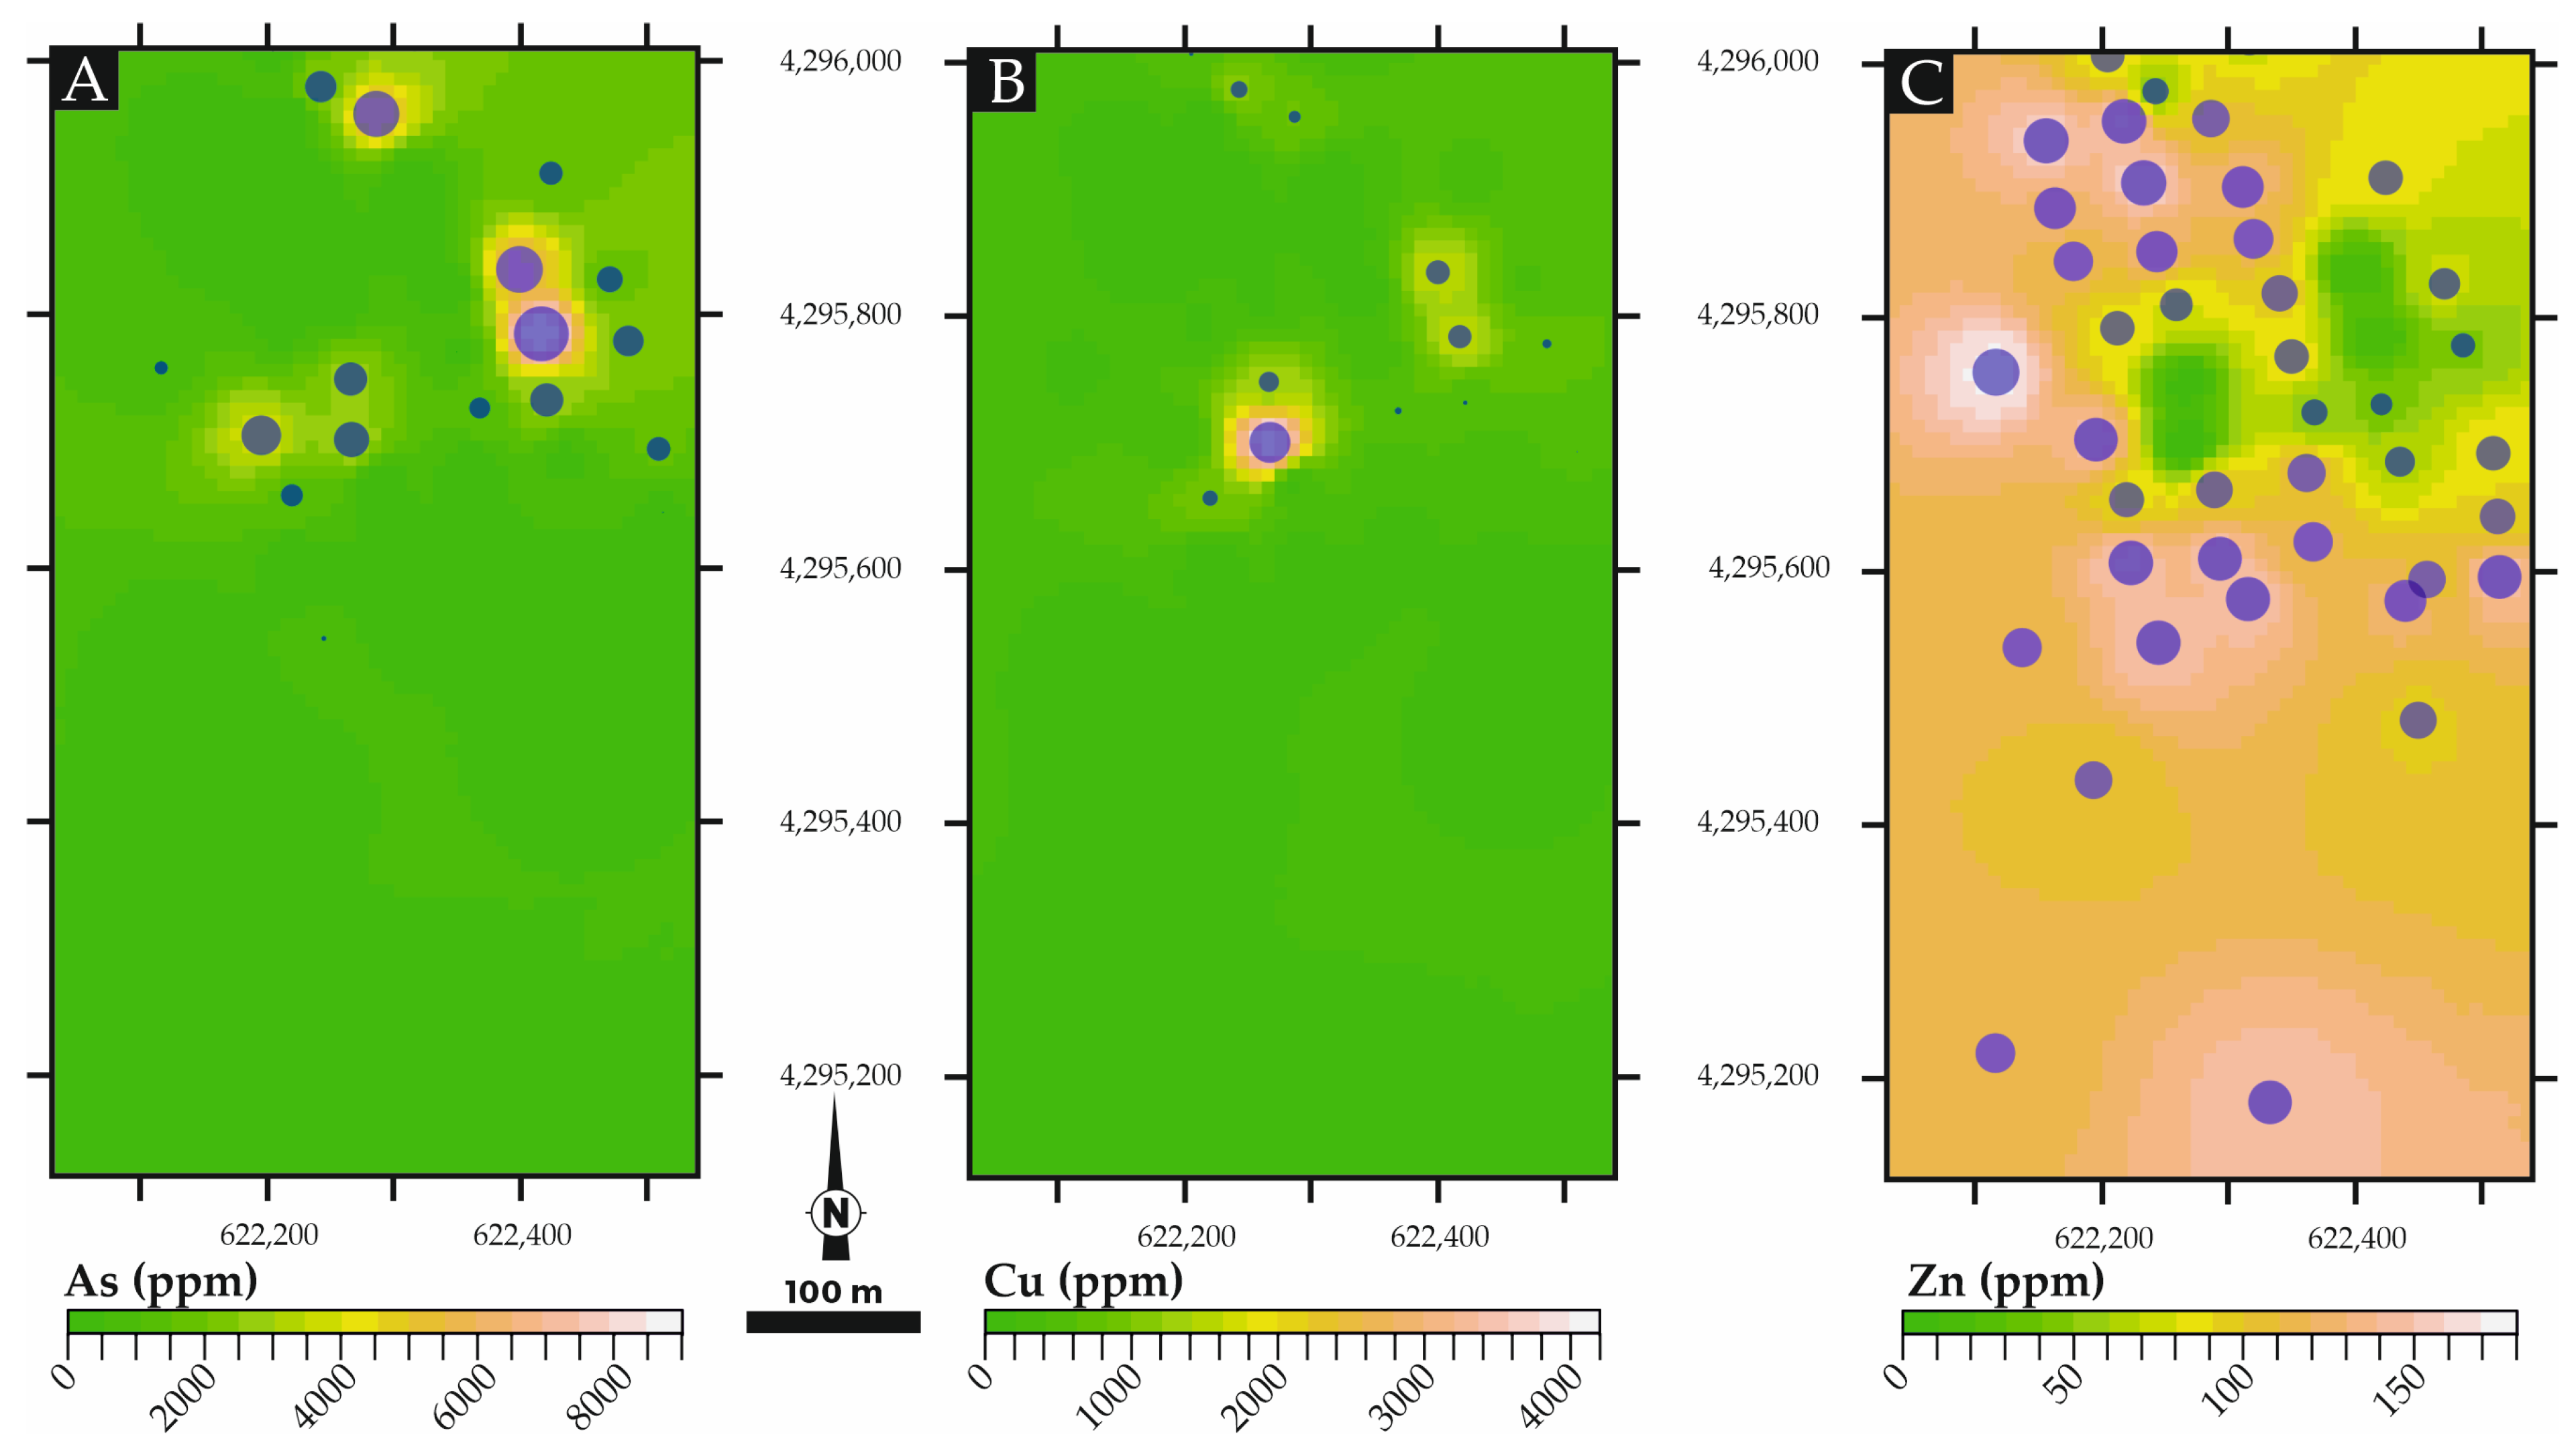
The chemical elements identified can be ascribed to three groups—Cu, Ni and As—originating from the surficial alteration of the main sulphides—chalcopyrite and arsenopyrite—that were explored during the mining period. The second group is mainly characterized by the presence of Fe and Mn, which are elements that are relatively immobile in surface conditions when in the form of oxides or hydroxide. Finally, metals that are mobile in surface conditions and that should have originated from the alteration of primary sulphides in surface conditions might mobilize, as inferred for the case of Zn. This explains the negative correlation of Zn with Cu and As. Figure 19 provides the interpolation of the pXRF results for Cu, Zn, and Mn, identifying areas with main metallic contents (Supplementary Material Figure S4a–c). The unusual behaviour of V, as no correlation with other metals is found, is presumed to be due to the fact that V could be incorporated into organic matter depending on the redox conditions of deposition, and posteriorly decomposed during weathering or hydrothermal fluid circulation.
The principal components analysis allows the separation of agricultural soils from mine waste soils, mainly identifiable by the relation of Fe and Co with the mine waste soils, and by the Zn in the agricultural soils. The bare soil data is identifiable using the PC2-PC3 diagram mainly by its presence as opposite to the Cu vector. Consequently, the PCA analysis reveals as a very useful tool for the characterization of the different SU types.
The clustering with K-means does not allow separation between bare soils and agricultural soils; however, it provides insights into the behaviour of the mine waste soils. Although this approach was not fully successful, it provides complementary information on the data that might be useful for understanding mine waste soils. Recent studies indicate that this might be the case [48].

5.2. Optical Spectroradiometry

Regarding the optical spectroscopy results, one must note that the range of wavelengths used in this study are in the Vis–NIR region, electronic transitions which are dominated mainly by the behaviour of iron oxides and of organic matter—specifically, the slope of the spectrum part (probably related to soil OM structure) [49]. Not only do the values increase with the wavelength, but so does the variance, (c.f. the ‘sd’ column in Table 3). This shows that the differences in the reflectance are bigger mostly above the red band, reflecting the different SU types.
The principal components PC1–PC2 diagram (Figure 11B) of the optical spectroscopy reveal that the X2 and NIR vectors point in the direction of the agricultural soil’s centroids—an indication of the influence of these bands in the definition of these types of soil. As these soils are dominated by the presence of Zn, this element must be influencing the spectral behaviour. In fact, [15] states that the spectral reflectance tended to decrease with the increase of Zn contents in wavelengths in the range of 580–1850 nm. It is recognized that iron oxides and hydroxides such as hematite and goethite, respectively, have distinct absorption features in the vis-NIR wavelengths [16]. Due to crystal field transition, goethite has asymmetrical absorptions at 480 and 670 nm. Hematite has an absorption at about 550 nm due to charge transfer, and a weaker crystal absorption near 670 nm [50]. These absorptions originating from the presence of iron oxides and hydroxides in the lower part of the spectrum (X1, blue and green) might explain the bigger proximity of the mine waste centroid to the X1 and blue vectors in the same diagram. The PC2–PC3 diagram identifies NIR and X2 as influencing the PC2, whereas red is influencing PC3. In this diagram, the centroids from the three SU types defined in the study region are in different quadrants, being agricultural soil in the positive quadrates for PC1 and PC2, bare soils in the negative quadrant for PC1 and the positive quadrant for PC2, and mine waste soils in the negative part of PC2 and PC3, clearly separating the three groups.
Figure 9 shows selected spectra that are characteristic of each of the soil use types. The agricultural spectra (Figure 9A) have a continuous increase in reflectance values from the 350 to the 100 nm range. The mine waste soils (Figure 9B) spectra have a steeper increase in reflectance until the 600 nm wavelength, and flattens significantly after these values. The bare soil spectra have a steep increase in values until the 700 nm wavelength, forming a peak that suddenly decreases and flattens after the 760 nm wavelength.
The obtained spectra were compared with the “Soils and Mixtures” reference spectra from the USGS spectral library [41] in the 350–1000 nm range, and we determined a comparison index defined as the mean absolute difference calculated for the entire data range. The most represented spectral references that match the ones obtained in this study are presented in Table 4.
The “Clinosoizite Epidote” spectrum is a mixed sample with impurities that compares well with many of the spectra obtained in our work. Its mix nature with Mn and Fe impurities is clearly the feature that results in its good comparability. The “Hematitic Alt. Tuff” is a sample that contains considerable amounts of Fe oxides in a quartz-siliceous matrix, thus being comparable to the soils in the study area. The “Sand DWO-2-DELar1 no oil” is a spectrum that is mainly composed by sand grains, representing a sample with argillitic and silicic matrix with low Fe-Mn contents.
These spectra correspond roughly to what was expected in a region with agricultural soils (sand and clay dominated) combined with mine waste areas (dominated by Fe and Mn particles).

5.3. Sentinel-2 Images

The Sentinel-2 satellite image is of limited resolution due to the small size of the study area. Nevertheless, the band composition (B12-B11-B2) used clearly identifies the mine waste soils in a purple colour, which results from the combination of B12 (Red) and B2 (Blue). Other authors have already proven the utility of these images in identifying this type of spectral response. Specifically, concerning Sentinel 2, dedicated geological indices provide important information about iron oxides, ferrous iron, and clay content—e.g., [21,35,37,51,52]. Our results are in line with these conclusions.
The band combinations results are also in accordance with the existing literature; nevertheless, it must be emphasized that the B11/B4 combination is an excellent tool for identifying the contaminated soils.
Concerning the use of principal component analysis, although PC1 explains more than 60% of the variance, this value it is not originated in any clear feature recognized in the terrain by the land cover. Fortunately, PC2 provides a clear separation of the different land covers identified in the terrain, separating forest, shrubs, soils, and mine waste into usable forms, mostly influenced by the vis-NIR (B2-B5 bands) and SWIR (B11, B12 bands). As a complement, using the PC3, the mine waste is separatable from the other land cover types. For instance, mine waste is dominated by the bands B1, B2, and B3. The map in Figure 15C clearly corresponds to the mine waste land cover.

5.4. Drone Images

The literature reveals mixed results on what concerns the use of high spatial resolution images to identify mining activity features, be it mine waste or acid mine drainage [21,51,52,53]. Most studies are related to the use of structures from motion- or LIDAR-based algorithms to identify terrain geometric features, not the physical and chemical properties of the soils.
The drone images have a very high spatial resolution; therefore, the small features like tree canopies, shrubs, or casted shadows greatly influence the image interpretation results. Therefore, thorough pre-processing must be undertaken to better classify the different features in the image. This first analysis presented in this work reveals that the NDVI band ratio is efficient for separating the different vegetation types and identifying the mine waste soils.
In the case of drone images, the principal components analysis is not very effective, probably due to the reduced number of bands available. Nevertheless, it is useful for identifying canopies and casted shadows, which is a useful result for separating exposed soil areas from vegetated areas, especially when used in combination with the NDVI ratio.
The K-means algorithm is efficient in mapping and separating the finest detailed features described in the land cover, providing a spatially consistent result compared with the base mapping performed by the authors. Concerning the random forest results, they are very good for producing land cover maps, as is demonstrated by the obtained results.

6. Conclusions

This work proposes a multidisciplinary approach to identifying and characterizing regions where mining activities occurred, in which an environmental burden exists, and where there is consequently the urge to address the problem. The methodology presented is data-driven, and includes ground-based and airborne studies. The Mostardeira case study has scarce published information regarding the environmental state [47], thus justifying updated monitoring. Furthermore, a constant growth in intensive agriculture in the region, be it olives, almonds, or vineyards, implies the necessity to obtain state-of-the-art information on the terrain’s environmental status.
Herein, we highlight the main conclusions from our study:
  • The ground techniques identified the presence of contaminated soils (e.g., As and Cu) with values of metals that are in concentrations higher than those recommended by the Portuguese environmental agency.
  • Airborne—i.e., drone and satellite images—allowed us to map the different types of land cover in the study area, revealing the limited geographic distribution of the contaminated soils.
  • The interpolation of ground data does not allow the mapping of the total extent of the contaminated area, but a combination of this approach with drone and satellite images reveals that this is in a limited area, and can certainly be remediated.
  • The multidisciplinary methodological approach has proved to be successful in identifying not only the environmental problem, but also characterizing its cartographic distribution.
  • The integration of statistical methods with machine learning and artificial intelligence techniques constitutes a valued way to gain additional insights into understanding factors that play a significant role in diverse natural and anthropogenic processes, whether they have a chemical or physical nature.
Therefore, we should emphasize that the use of a data-driven approach for defining a baseline for characterizing these problematic situations, relatively common in the Ossa-Morena Zone, in the Portuguese sector, is a key tool for decision makers and environmental agencies for recommending measures for the mitigation and remediation of these cases.
The methodologies used in this work are fast, cheap, and provide good results for the first characterization of existing contamination. Naturally, more precise methodologies like ICP-MS instead of portable X-ray fluorescence, and a drone equipped with hyperspectral camera, will be used at some point for more precise results.
In future research endeavours, our focus will shift towards gaining a deeper understanding of the intricate relationships between ground truth data and airborne images. One pivotal avenue of exploration involves the sub-pixel integration of information, wherein we will investigate innovative methods to bridge the gap between observed data points and aerial imagery, fostering a more comprehensive and nuanced comprehension of the landscape. Furthermore, the distinct scales of observation present in our study will be integrated through advanced statistical and machine learning techniques. This multi-scale approach will empower us to extract invaluable insights from the complex interplay of environmental factors and guide the development of more robust and accurate models for environmental assessment and monitoring.

Supplementary Materials

The following supporting information can be downloaded at: https://www.mdpi.com/article/10.3390/rs15225295/s1, Figure S1—Correlation matrices for pXRF and pSpec data. Figure S2—Selected scatter plots of metals: discriminated (colors) by Soil Use. Figure S3—Selected scatter plots of metals: discriminated by K-means cluster. Figure S4—Interpolated maps (IDW) of Fe, Mn, and V.

Author Contributions

Conceptualization, P.N., M.S. and J.R.; Methodology, P.N., M.S., J.R., M.P. and G.R.; Software, P.N.; Validation, P.N. and J.R.; Formal Analysis, P.N.; Investigation, P.N.; Data curation, P.N.; Writing—Original draft preparation, P.N.; Writing—review and editing, P.N., J.R., M.S., M.P. and G.R.; Visualization, P.N.; Supervision, P.N.; Project administration, P.N.; Funding acquisition, P.N. and M.P. All authors have read and agreed to the published version of the manuscript.

Funding

This research was funded by FCT (Fundação para a Ciência e Tecnologia, I.P.) and ICT (Instituto das Ciências da Terra), grants UIDB/04683/2020 and UIDP/04683/2020. This research is a contribution to the project “ZOM-3D Metallogenic Modelling of Ossa-Morena Zone: Valorization of the Alentejo Mineral Resources” (ALT20-03-0145—FEDER-000028), funded by Alentejo 2020 (Regional Operational Program of Alentejo) through the FEDER/FSE/FEEI. JR acknowledges FCT for the support of the PhD grant with reference UI/BD/150937/2021. MS thanks the financial support of FCT through the PhD grant PRT/BD/153588/2021 promoted by Agência Espacial Portuguesa (PTSpace; Portuguese Space Agency).

Data Availability Statement

Data available on request due to privacy or ethical restrictions.

Acknowledgments

To the editorial MDPI team and the three anonymous reviewers.

Conflicts of Interest

The authors declare no conflict of interest.

References

  1. Pardo Abad, C.J. Environmental Recovery of Abandoned Mining Areas in Spain: Sustainability and New Landscapes in Some Case Studies. J. Sustain. Res. 2019, 1, e190003. [Google Scholar] [CrossRef]
  2. Sinnett, D.E.; Sardo, A.M. Former Metal Mining Landscapes in England and Wales: Five Perspectives from Local Residents. Landsc. Urban. Plan. 2020, 193, 103685. [Google Scholar] [CrossRef]
  3. Kuter, N. Reclamation of Degraded Landscapes Due to Opencast Mining. In Advances in Landscape Architecture; Intech Open: London, UK, 2013. [Google Scholar] [CrossRef]
  4. Fazle Bari, A.S.M.; Lamb, D.; MacFarlane, G.R.; Rahman, M.M. Soil Washing of Arsenic from Mixed Contaminated Abandoned Mine Soils and Fate of Arsenic after Washing. Chemosphere 2022, 296, 134053. [Google Scholar] [CrossRef]
  5. Pelica, J.; Barbosa, S.; Reboredo, F.; Lidon, F.; Pessoa, F.; Calvão, T. The Paradigm of High Concentration of Metals of Natural or Anthropogenic Origin in Soils—The Case of Neves-Corvo Mine Area (Southern Portugal). J. Geochem. Explor. 2018, 186, 12–23. [Google Scholar] [CrossRef]
  6. Huang, Y.C.; Huang, C.Y.; Minasny, B.; Chen, Z.S.; Hseu, Z.Y. Using PXRF and Vis-NIR for Characterizing Diagnostic Horizons of Fine-Textured Podzolic Soils in Subtropical Forests. Geoderma 2023, 437, 116582. [Google Scholar] [CrossRef]
  7. Nogueira, P.; Vicente, S.; Maia, M.; Roseiro, J.; Nogueira, P.; Vicente, S.; Maia, M. High Resolution Geochemical Mapping in the Mociços Mine (Ossa-Morena Zone, Portugal). Contributes from Machine Learning Methods. Comun. Geológicas 2020, 107, 55–62. [Google Scholar]
  8. Lemière, B.; Melleton, J.; Auger, P.; Derycke, V.; Gloaguen, E.; Bouat, L.; Mikšová, D.; Filzmoser, P.; Middleton, M. PXRF Measurements on Soil Samples for the Exploration of an Antimony Deposit: Example from the Vendean Antimony District (France). Minerals 2020, 10, 724. [Google Scholar] [CrossRef]
  9. Lemière, B. A Review of PXRF (Field Portable X-ray Fluorescence) Applications for Applied Geochemistry. J. Geochem. Explor. 2018, 188, 350–363. [Google Scholar] [CrossRef]
  10. Nogueira, P.; Afonso, P.; Roseiro, J.; Maia, M.; São Pedro, D.; Moreira, N.; Matos, J.X.; Batista, M.J. Portable X-ray Fluorescence and Clustering Methods Applied to Mineral Exploration: The Significance and Nature of Batigelas Anomaly (Ossa-Morena Zone-Cabeço de Vide, Portugal). Comun. Geológicas 2020, 107, 47–53. [Google Scholar]
  11. Zhou, S.; Wang, J.; Wang, W.; Liao, S. Evaluation of Portable X-ray Fluorescence Analysis and Its Applicability As a Tool in Geochemical Exploration. Minerals 2023, 13, 166. [Google Scholar] [CrossRef]
  12. Purwadi, I.; van der Werff, H.; Lievens, C. Reflectance Spectroscopy and Geochemical Analysis of Rare Earth Element-Bearing Tailings: A Case Study of Two Abandoned Tin Mine Sites in Bangka Island, Indonesia. Int. J. Appl. Earth Obs. Geoinf. 2019, 74, 239–247. [Google Scholar] [CrossRef]
  13. Cull, S.; Cravotta, C.A.; Klinges, J.G.; Weeks, C. Spectral Masking of Goethite in Abandoned Mine Drainage Systems: Implications for Mars. Earth Planet. Sci. Lett. 2014, 403, 217–224. [Google Scholar] [CrossRef]
  14. Zhao, D.; Xie, D.; Yin, F.; Liu, L.; Feng, J.; Ashraf, T. Estimation of Pb Content Using Reflectance Spectroscopy in Farmland Soil Near Metal Mines, Central China. Remote. Sens. 2022, 14, 2420. [Google Scholar] [CrossRef]
  15. Guo, B.; Zhang, B.; Su, Y.; Zhang, D.; Wang, Y.; Bian, Y.; Suo, L.; Guo, X.; Bai, H. Retrieving Zinc Concentrations in Topsoil with Reflectance Spectroscopy at Opencast Coal Mine Sites. Sci. Rep. 2021, 11, 19909. [Google Scholar] [CrossRef] [PubMed]
  16. Lamine, S.; Pandey, M.K.; Petropoulos, G.P.; Brewer, P.A.; Srivastava, P.K.; Manevski, K.; Toulios, L.; Bachari, N.-E.-I.; Macklin, M.G. Spectroradiometry as a Tool for Monitoring Soil Contamination by Heavy Metals in a Floodplain Site. Hyperspectral Remote Sens. 2020, 249–268. [Google Scholar] [CrossRef]
  17. Frutuoso, R.; Lima, A.; Teodoro, A.C. Application of Remote Sensing Data in Gold Exploration: Targeting Hydrothermal Alteration Using Landsat 8 Imagery in Northern Portugal. Arab. J. Geosci. 2021, 14, 459. [Google Scholar] [CrossRef]
  18. Alarifi, S.S.; Abdelkareem, M.; Abdalla, F.; Abdelsadek, I.S.; Gahlan, H.; Al-Saleh, A.M.; Alotaibi, M. Fusion of Multispectral Remote-Sensing Data through GIS-Based Overlay Method for Revealing Potential Areas of Hydrothermal Mineral Resources. Minerals 2022, 12, 1577. [Google Scholar] [CrossRef]
  19. Hu, B.; Xu, Y.; Wan, B.; Wu, X.; Yi, G. Hydrothermally Altered Mineral Mapping Using Synthetic Application of Sentinel-2A MSI, ASTER and Hyperion Data in the Duolong Area, Tibetan Plateau, China. Ore Geol. Rev. 2018, 101, 384–397. [Google Scholar] [CrossRef]
  20. Mielke, C.; Boesche, N.K.; Rogass, C.; Kaufmann, H.; Gauert, C.; de Wit, M. Spaceborne Mine Waste Mineralogy Monitoring in South Africa, Applications for Modern Push-Broom Missions: Hyperion/OLI and EnMAP/Sentinel-2. Remote Sens. 2014, 6, 6790–6816. [Google Scholar] [CrossRef]
  21. Quental, L.; Gonçalves, P.; De Oliveira, D.; Batista, M.J.; Matos, J.X.; Sousa, A.J.; Marsh, S.; Carreiras, J.; Dias, R. Multispectral and Hyperspectral Remote Sensing as a Source of Knowledge in the Portuguese Sector of the Iberian Pyrite Belt. Comun. Geológicas 2020, 107, 21–39. [Google Scholar]
  22. Matos, J.X.; Rosa, C. Diagnóstico Preliminar de Minas Abandonadas—Área Sul; IGM: Lisbon, Portugal, 2001. [Google Scholar]
  23. Mateus, A.; Munhá, J.; Inverno, C.; Matos, J.X.; Martins, L.; Oliveira, D.; Jesus, A.; Salgueiro, R. Mineralizações No Sector Português Da Zona de Ossa Morena. In Geologia de Portugal; Dias, R., Araújo, A., Terrinha, P., Kullberg, J.C., Eds.; Escolar Editora: Lisboa, Portugal, 2013; Volume 1, pp. 577–619. [Google Scholar]
  24. Albardeiro, L.; Morais, I.; Matos, J.X.; Solá, R.; Salgueiro, R.; Pereira, Z.; Mendes, M.; Batista, M.J.; de Oliveira, D.; Díez-Montes, A.; et al. Time-Space Evolution of Iberian Pyrite Belt Igneous Activity: Volcanic and Plutonic Lineaments, Geochronology, Ore Horizons and Stratigraphic Constraints. Gondwana Res. 2023, 121, 235–258. [Google Scholar] [CrossRef]
  25. Brandão, J.; Matos, J.X. Memória do cobre. Nota sobre a criação de um parque arqueo-indústrial na Mina da Herdade da Mostardeira (Estremoz, Portugal). In Proceedings of the Primer Simpósio sobre la Minería y la Metalurgie Antigua en el SW Europeo, Serós, Spain, 5–7 May 2000; pp. 427–437. [Google Scholar]
  26. Fernandes, G.P. Mineralizações de Cobre Da Mina de Miguel Vacas: Caracterização Petrográfica e Geoquímica. Ph.D. Thesis, Faculdade de Ciências da Universidade de Lisboa, Lisboa, Portugal, 2012. [Google Scholar]
  27. Lotze, F. Zur Gliederung Der Varisziden Der Iberischen Meseta. Geotekt. Forschg. 1945, 6, 78–92. [Google Scholar]
  28. Araújo, A.; Piçarra Almeida, J.; Borrego, J.; Pedro, J.; Oliveira, T. As regiões Central e Sul da Zona de Ossa-Morena. In Geologia de Portugal; Dias, R., Araújo, A., Terrinha, P., Kullberg, J.C., Eds.; Escolar Editora: Lisboa, Portugal, 2013; Volume 1. [Google Scholar]
  29. QGIS Development Team. QGIS Geographic Information System, version 3.32; QGIS Development Team, 2023. [Google Scholar]
  30. R Core Team. R: A Language and Environment for Statistical Computing; R Core Team: Vienna, Austria, 2023. [Google Scholar]
  31. Spectroradiometer User Manual ASD FieldSpec ® HandHeld 2 TM Spectroradiometer User Manual; ASD: Longmont, CO, USA, 2017.
  32. Cardoso-Fernandes, J.; Teodoro, A.C.; Lima, A.; Perrotta, M.; Roda-Robles, E. Detecting Lithium (Li) Mineralizations from Space: Current Research and Future Perspectives. Appl. Sci. 2020, 10, 1785. [Google Scholar] [CrossRef]
  33. Guglietta, D.; Conte, A.M.; Paciucci, M.; Passeri, D.; Trapasso, F.; Salvatori, R. Mining Residues Characterization and Sentinel-2A Mapping for the Valorization and Efficient Resource Use by Multidisciplinary Strategy. Minerals 2022, 12, 617. [Google Scholar] [CrossRef]
  34. Isgró, M.A.; Basallote, M.D.; Caballero, I.; Barbero, L. Comparison of UAS and Sentinel-2 Multispectral Imagery for Water Quality Monitoring: A Case Study for Acid Mine Drainage Affected Areas (SW Spain). Remote. Sens. 2022, 14, 4053. [Google Scholar] [CrossRef]
  35. Hanelli, D.; Barth, A.; Volkmer, G.; Köhler, M. Modelling of Acid Mine Drainage in Open Pit Lakes Using Sentinel-2 Time-Series: A Case Study from Lusatia, Germany. Minerals 2023, 13, 271. [Google Scholar] [CrossRef]
  36. Henrich, V.; Krauss, G.; Götze, C.; Sandow, C. Entwicklung Einer Datenbank Für Fernerkundungsindizes. Boch. AK Fernerkund. 2012, 4–5+10. Available online: https://www.indexdatabase.de (accessed on 1 September 2023).
  37. Segal, D. Theoretical Basis for Differentiation of Ferric-Iron Bearing Minerals, Using Landsat MSS Data. In Proceedings of the Symposium for Remote Sensing of Environment, 2nd Thematic Conference on Remote Sensing for Exploratory Geology, Fort Worth, TX, USA, 6 September 1982; pp. 949–951. [Google Scholar]
  38. Rowan, L.C.; Mars, J.C. Lithologic Mapping in the Mountain Pass, California Area Using Advanced Spaceborne Thermal Emission and Reflection Radiometer (ASTER) Data. Remote Sens. Env. Environ. 2003, 84, 350–366. [Google Scholar] [CrossRef]
  39. Volesky, J.C.; Stern, R.J.; Johnson, P.R. Geological Control of Massive Sulfide Mineralization in the Neoproterozoic Wadi Bidah Shear Zone, Southwestern Saudi Arabia, Inferences from Orbital Remote Sensing and Field Studies. Precambrian Res. 2003, 123, 235–247. [Google Scholar] [CrossRef]
  40. Hartigan, J.A.; Wong, M.A. Algorithm AS 136: A K-Means Clustering Algorithm. J. R. Stat. Soc. Ser. C 1979, 28, 100–108. [Google Scholar] [CrossRef]
  41. Kokaly, R.F.; Clark, R.N.; Swayze, G.A.; Livo, K.E.; Hoefen, T.M.; Pearson, N.C.; Wise, R.A.; Benzel, W.; Lowers, H.A.; Driscoll, R.L.; et al. USGS Spectral Library Version 7; Data Series 1035; USGS: Reston, VA, USA, 2017. [CrossRef]
  42. Bédard, É.; De Bronac de Vazelhes, V.; Beaudoin, G. Performance of Predictive Supervised Classification Models of Trace Elements in Magnetite for Mineral Exploration. J. Geochem. Explor. 2022, 236, 106959. [Google Scholar] [CrossRef]
  43. Li, F.; Xu, L.; You, T.; Lu, A. Measurement of Potentially Toxic Elements in the Soil through NIR, MIR, and XRF Spectral Data Fusion. Comput. Electron. Agric. 2021, 187, 106257. [Google Scholar] [CrossRef]
  44. Rouillon, M.; Taylor, M.P. Can Field Portable X-ray Fluorescence (PXRF) Produce High Quality Data for Application in Environmental Contamination Research? Environ. Pollut. 2016, 214, 255–264. [Google Scholar] [CrossRef] [PubMed]
  45. Choe, E.; van der Meer, F.; van Ruitenbeek, F.; van der Werff, H.; de Smeth, B.; Kim, K.W. Mapping of Heavy Metal Pollution in Stream Sediments Using Combined Geochemistry, Field Spectroscopy, and Hyperspectral Remote Sensing: A Case Study of the Rodalquilar Mining Area, SE Spain. Remote Sens. Environ. 2008, 112, 3222–3233. [Google Scholar] [CrossRef]
  46. Abreu, M.M.; Matias, M.J.; Magalhães, M.C.F.; Basto, M.J. Impacts on Water, Soil and Plants from the Abandoned Miguel Vacas Copper Mine, Portugal. J. Geochem. Explor. 2008, 96, 161–170. [Google Scholar] [CrossRef]
  47. Rosado, L. Caracterização Biogeoquímica de Minas Abandonadas: Os casos da Mina de São Domingos e da Mina da Mostardeira. Master’s Thesis, Universidade de Évora, Évora, Portugal, 2009. [Google Scholar]
  48. Xu, H.; Croot, P.; Zhang, C. Discovering Hidden Spatial Patterns and Their Associations with Controlling Factors for Potentially Toxic Elements in Topsoil Using Hot Spot Analysis and K-Means Clustering Analysis. Environ. Int. 2021, 151, 106456. [Google Scholar] [CrossRef]
  49. Shand, C.A.; Wendler, R. Portable X-ray Fluorescence Analysis of Mineral and Organic Soils and the Influence of Organic Matter. J. Geochem. Explor. 2014, 143, 31–42. [Google Scholar] [CrossRef]
  50. Chabrillat, S.; Ben-Dor, E.; Cierniewski, J.; Gomez, C.; Schmid, T.; van Wesemael, B. Imaging Spectroscopy for Soil Mapping and Monitoring. Surv. Geophys. 2019, 40, 361–399. [Google Scholar] [CrossRef]
  51. Van der Meer, F.D.; van der Werff, H.M.A.; van Ruitenbeek, F.J.A. Potential of ESA’s Sentinel-2 for Geological Applications. Remote Sens. Environ. 2014, 148, 124–133. [Google Scholar] [CrossRef]
  52. van der Werff, H.; van der Meer, F. Sentinel-2 for Mapping Iron Absorption Feature Parameters. Remote Sens. 2015, 7, 12635–12653. [Google Scholar] [CrossRef]
  53. Crowley, J.K.; Williams, D.E.; Hammarstrom, J.M.; Piatak, N.; Chou, I.M.; Mars, J.C. Spectral Reflectance Properties (0.4–2.5 Μm) of Secondary Fe-Oxide, Fe-Hydroxide, and Fe-Sulphate-Hydrate Minerals Associated with Sulphide-Bearing Mine Wastes. Geochem. Explor. Environ. Anal. 2003, 3, 219–228. [Google Scholar] [CrossRef]
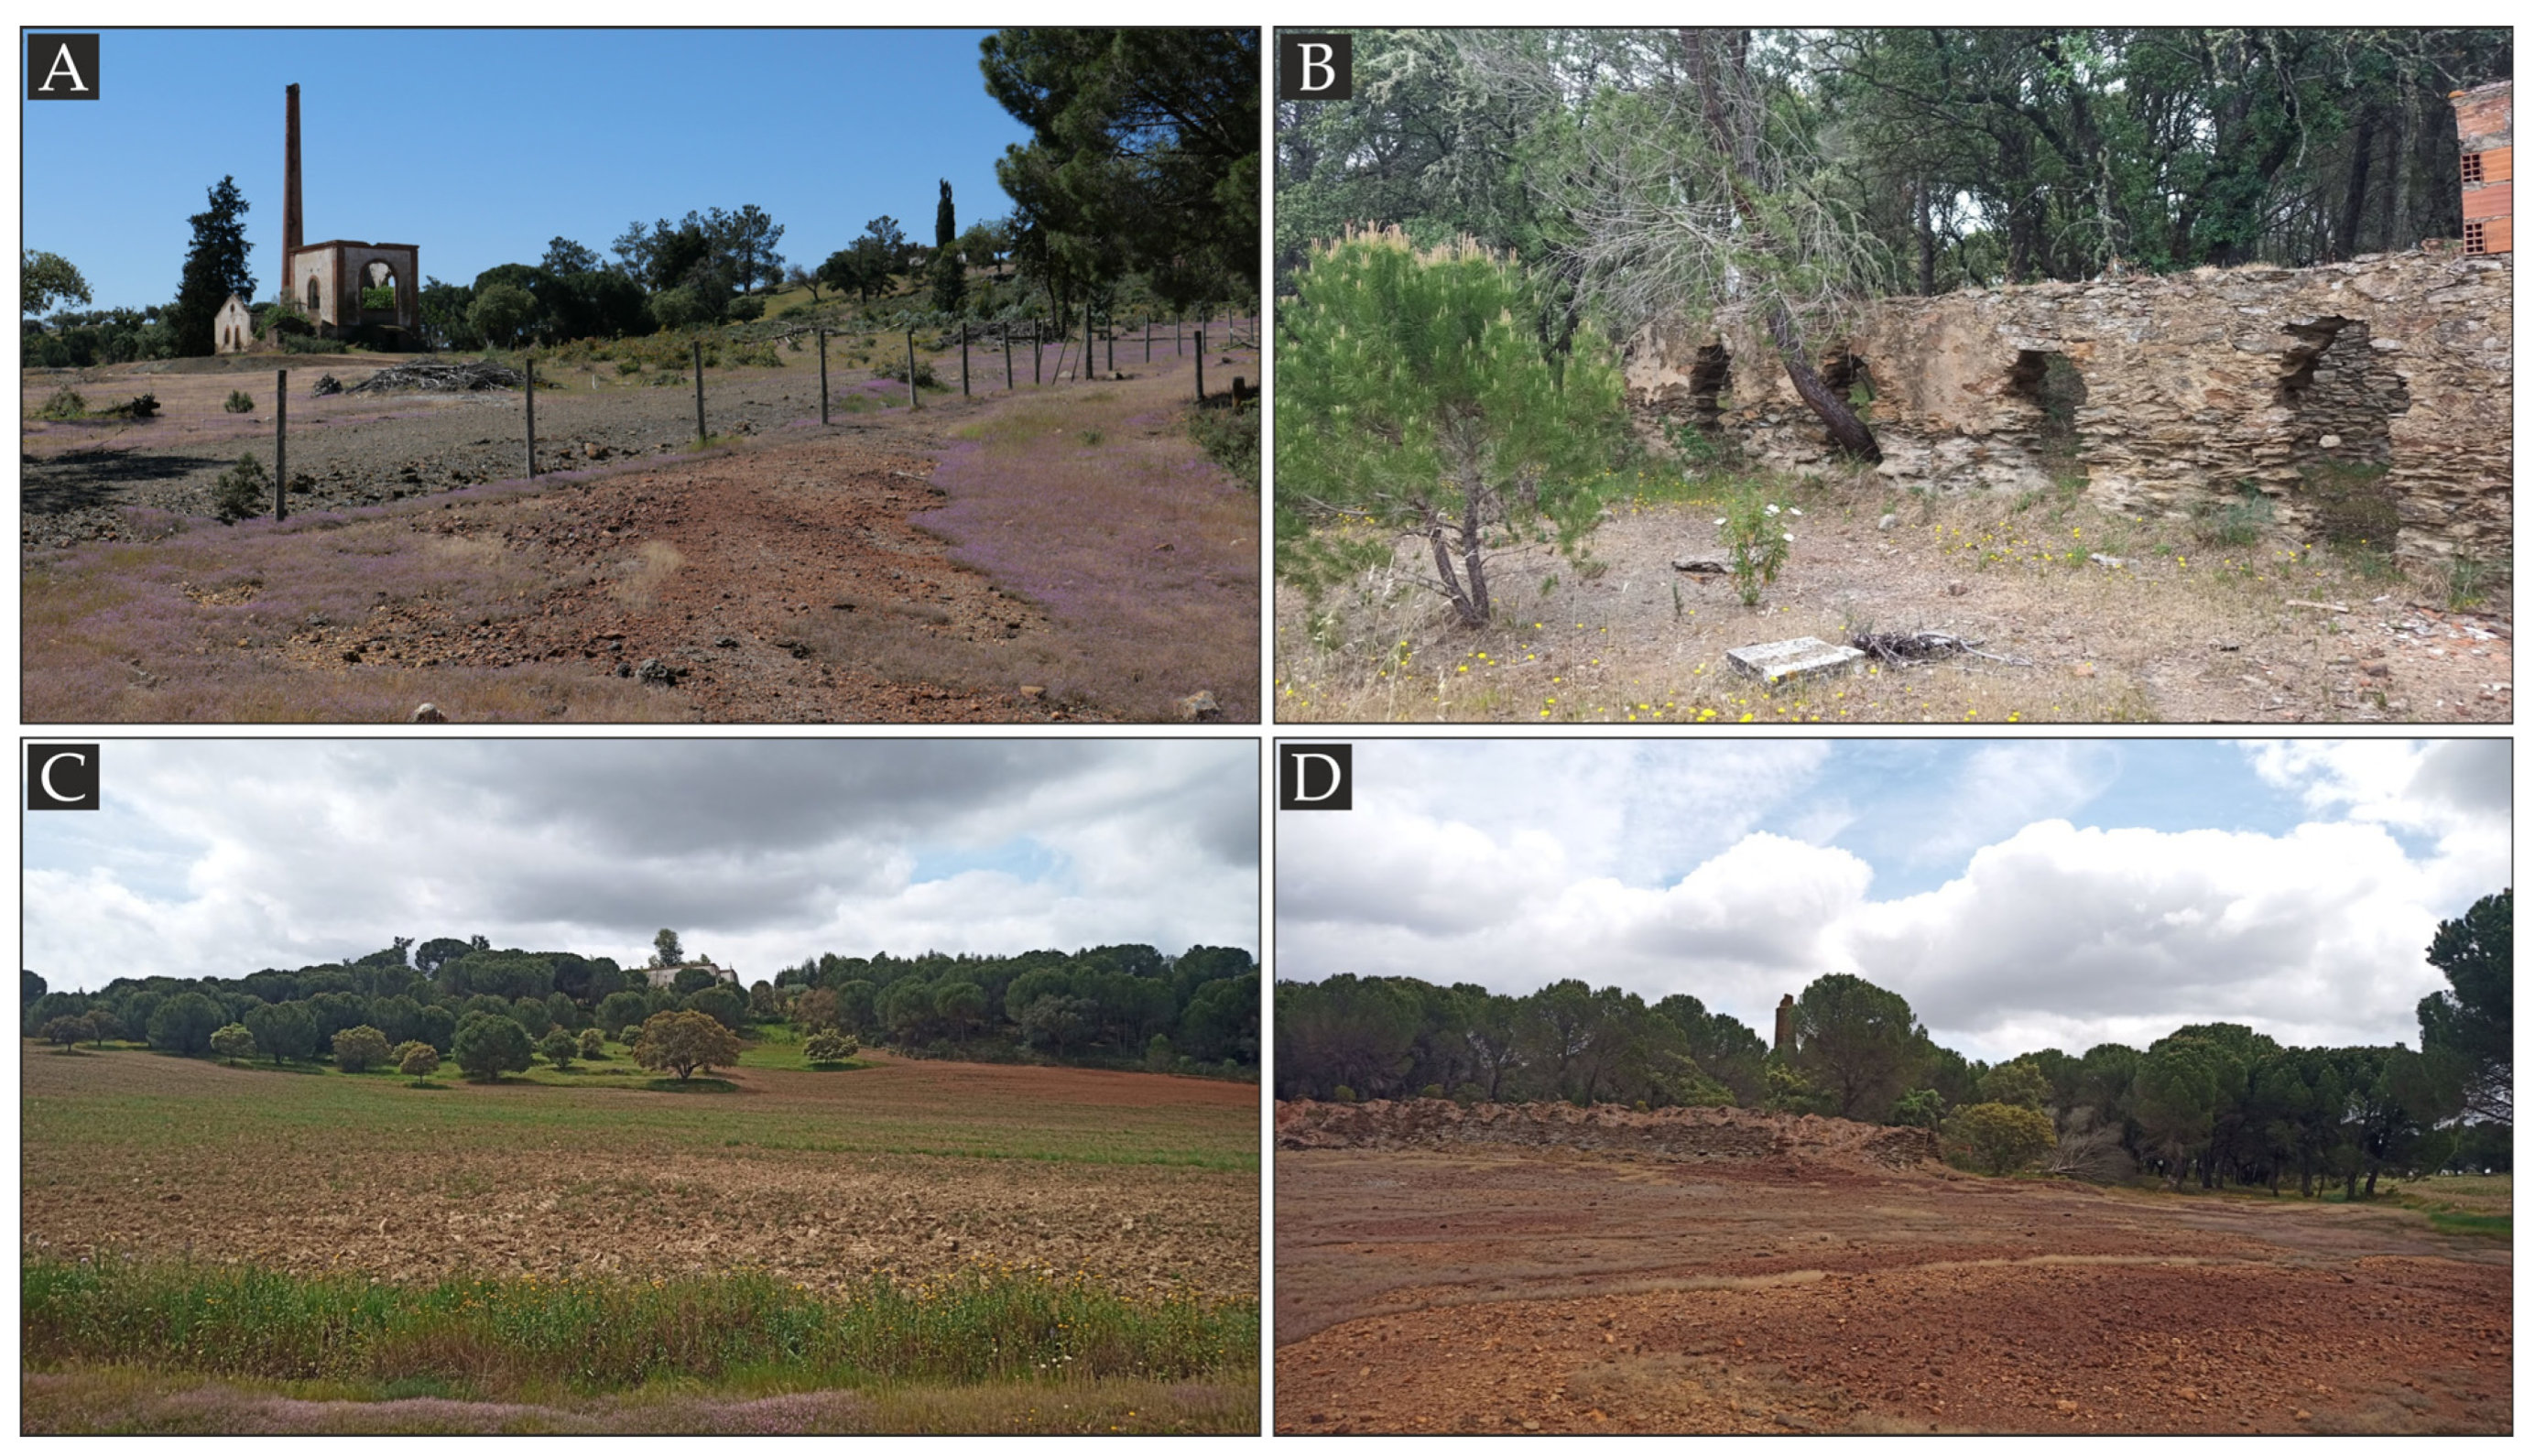
Figure 2. The Mostardeira abandoned mine site. (A) In the first plan, the mine waste zone, and in the second plan, the vertical shaft for ore extraction; (B) the ruins of the ustulation plant; (C) the agricultural soil in the first plan and the pine trees areas in the background; (D) The aspect of the mine waste soil.
Remotesensing 15 05295 g002
Figure 3. Flowchart of the methodology applied.
Remotesensing 15 05295 g003
Figure 4. Land cover divided into the seven categories based on drone images and the location of the point site analysis grid. P01–P50 Point Site numbers.
Remotesensing 15 05295 g004
Figure 5. Scatter plot of As vs. Cu in ppm, discriminated (colours) by soil use (SU).
Remotesensing 15 05295 g005
Figure 6. (A) Scree plot and variable contributions for the three principal components: (B) Contributions to PC1, (C) contributions to PC2, and (D) contributions to PC3. Dashed line corresponds to the “elbow” in the curve that selects all components just before the line flattens out.
Remotesensing 15 05295 g006
Figure 7. Biplot of the three principal components from the pXRF data. (A) PC1 vs. PC2. (B) PC2 vs. PC3.
Remotesensing 15 05295 g007
Figure 8. Binary plot of log(As) vs. log(Cu) in ppm. The points are coloured by the K-means clustering groups. The symbols correspond to the soil use types.
Remotesensing 15 05295 g008
Figure 9. (A) Selected spectra from the agricultural soils; (B) selected spectra from the mine waste soils; (C) selected spectra from the bare soils.
Remotesensing 15 05295 g009
Figure 10. Boxplot of the reflectances for the measured spectra.
Remotesensing 15 05295 g010
Figure 11. (A) Scree plot for the PCA analysis, (B) biplot of PC1 vs. PC2, and (C) biplot of PC2 vs. PC3. The colours of the points represent the defined soil use and the number corresponds to the site points.
Remotesensing 15 05295 g011
Figure 12. (A) True colour image of the study area, (B) composite false colour image (B12-B11-B2). The red dotted line is the corresponding land cover classification.
Remotesensing 15 05295 g012
Figure 13. (A) True colour image of the study area, (B) iron oxides ratio (B11/B8a), (C) ferric ratio (B3/B4), and (D) gossan ratio (B11/B4).
Remotesensing 15 05295 g013
Figure 14. (A) Scree plot with the variance explained for all the principal components considered, (B) plot of PC1 vs. PC2, and (C) plot of PC2 vs. PC3. Ellipses represent 75% of the points in a land use group.
Remotesensing 15 05295 g014
Figure 15. Map of the different principal components: (A) PC1, (B) PC2, and (C) PC3. The black dashed line represents the defined categories of land cover.
Remotesensing 15 05295 g015
Figure 16. (A) True colour image of the drone and (B) NDVI band ratio.
Remotesensing 15 05295 g016
Figure 17. Map of the three principal components based on the drone image: (A) PC1, (B) PC2, and (C) PC3. The black lines correspond to the land uses defined.
Remotesensing 15 05295 g017
Figure 18. (A) Map of the defined land cover, (B) K-means clustering classification, and (C) random forest classification.
Remotesensing 15 05295 g018
Figure 19. (A) Inverse distance weight (IDW) map of As, (B) IDW map of Cu, and (C) IDW map of Zn. Purple dots size proportional to the chemical elements’ values measured.
Remotesensing 15 05295 g019
Table 1. Soil use types for the classification for the different point sites. (Px).
Agricultural Soil Mine Waste SoilBare Soil
P5, P14, P18, P19P1, P11, P12, P13, P16P4, P6, P7, P8, P9
P23, P28, P29, P30, P38P17, P20, P21, P22, P24P10, P15
P39, P40, P44, P45, P46P25, P26, P27P42, P43
P48, P49, P50P31, P32, P33, P34, P35
P36, P37, P47
Table 2. Geochemical analysis of elements.
Element 1APAMeansdMedianSkewKurtosisMinMax
Fe 4.083.373.133.7419.310.7128.72
As1812391974257254610,057
Co223344205265375
Cr1606865563180491
Cu180435690174416434960
Mn 7274495812121523867
Ni130542350247158
Pb4584726242332664
V8613430140−270174
Zn340984999000253
1 All elements in ppm except Fe in %. Highlighted values indicate average and maximum content above APA reference values.
Table 3. Statistical analysis of the six selected wavelength bands.
BandMeansdMedianSkewKurtosisMinMax
X1 (400)0.090.060.061.350.800.030.27
Blue (490)0.150.090.121.330.850.060.44
Green (560)0.230.120.191.260.790.080.62
Red (665)0.310.150.261.452.230.100.88
X2 (800)0.340.130.300.74−0.500.130.63
NIR (840)0.350.130.310.71−0.510.130.64
Table 4. Selected USGS spectral library spectra that best compare with the spectra obtained in point sites on the Mostardeira mine site.
Spectrum TitleDescription
Clinozoisite Epidote HS299The sample contains some epidote and quartz impurities. The sample probably contains some Mn3+ and Fe3+ substituting for its aluminum, which would explain its reddish-brown color
Hematitic Alt. Tuff CU91-223Hematitically altered rhyolite tuff from the relict eastern hydrothermal center at Cuprite, NV. Sample was collected from the northwest part of the eastern center.
Sand DWO-3-DEL2ar1 no oilThe area measured is at the end of the Mississippi river delta, an area known as the Bird’s Foot. This spectrum is the average reflectance (using an artificial light source) of bare sand that appeared to be oil-free.
Disclaimer/Publisher’s Note: The statements, opinions and data contained in all publications are solely those of the individual author(s) and contributor(s) and not of MDPI and/or the editor(s). MDPI and/or the editor(s) disclaim responsibility for any injury to people or property resulting from any ideas, methods, instructions or products referred to in the content.