Article

Comparative Microencapsulation of Six Vegetable Oils in Gum Arabic Freeze-Dried Systems: Surfactant Effects on Encapsulation Efficiency and Stability


1
Science 351—Disruptive & Sustainable R&D Innovations, HIESE, Quinta Vale do Espinhal, EM 558-1, Vale do Espinhal, 3230-343 Coimbra, Portugal
2
CQC-IMS, Department of Chemistry, University of Coimbra, Rua Larga, 3004-535 Coimbra, Portugal
3
Gph—Laboratory Services, Lda, R. Pedro Nunes Bloco C, Alto de São João, 3030-199 Coimbra, Portugal
*
Authors to whom correspondence should be addressed.
Colloids Interfaces 2026, 10(1), 22; https://doi.org/10.3390/colloids10010022
Submission received: 19 December 2025 / Revised: 26 January 2026 / Accepted: 4 February 2026 / Published: 11 February 2026
(This article belongs to the Section Interfacial Properties)

Abstract

Gum arabic (GA) is a promising polymer for oil microencapsulation due to its emulsifying and film-forming properties and regulatory acceptance. Here we introduce a fully natural, low-energy emulsion–freeze-drying route and a head-to-head screening framework that compares surfactant chemistry and oil identity under identical processing conditions. Rice oil was used as a model to evaluate two oil:GA ratios (1:3 and 1:0.3, solid basis) and three surfactants (Tween 80, sodium cocoyl glutamate (SCG), and lecithin) at 0.1–1%. Emulsions were characterized by Dynamic Light Scattering (DLS) (z-average, PDI), emulsification index, and viscosity, then freeze-dried and evaluated for encapsulation efficiency (EE). High oil load (1:0.3) gave EE = 0% for all conditions, whereas GA-rich emulsions (1:3) enabled encapsulation, with 0.1% surfactant selected as optimal. Using this formulation window, six oils (rice, jojoba, aloe vera, sweet almond, safflower, sesame) were screened, yielding EE values from 0 to 95%. Safflower and sesame showed high EE without surfactant, while rice, sweet almond, aloe vera, and jojoba benefited mainly from SCG or lecithin. Despite producing smaller droplets, Tween 80 generated polydisperse, low-stability emulsions and did not improve EE. Overall, EE is governed by GA–surfactant interfacial cohesion and oil chemistry rather than droplet size alone.

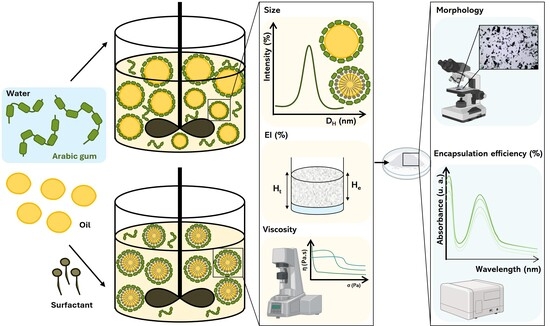
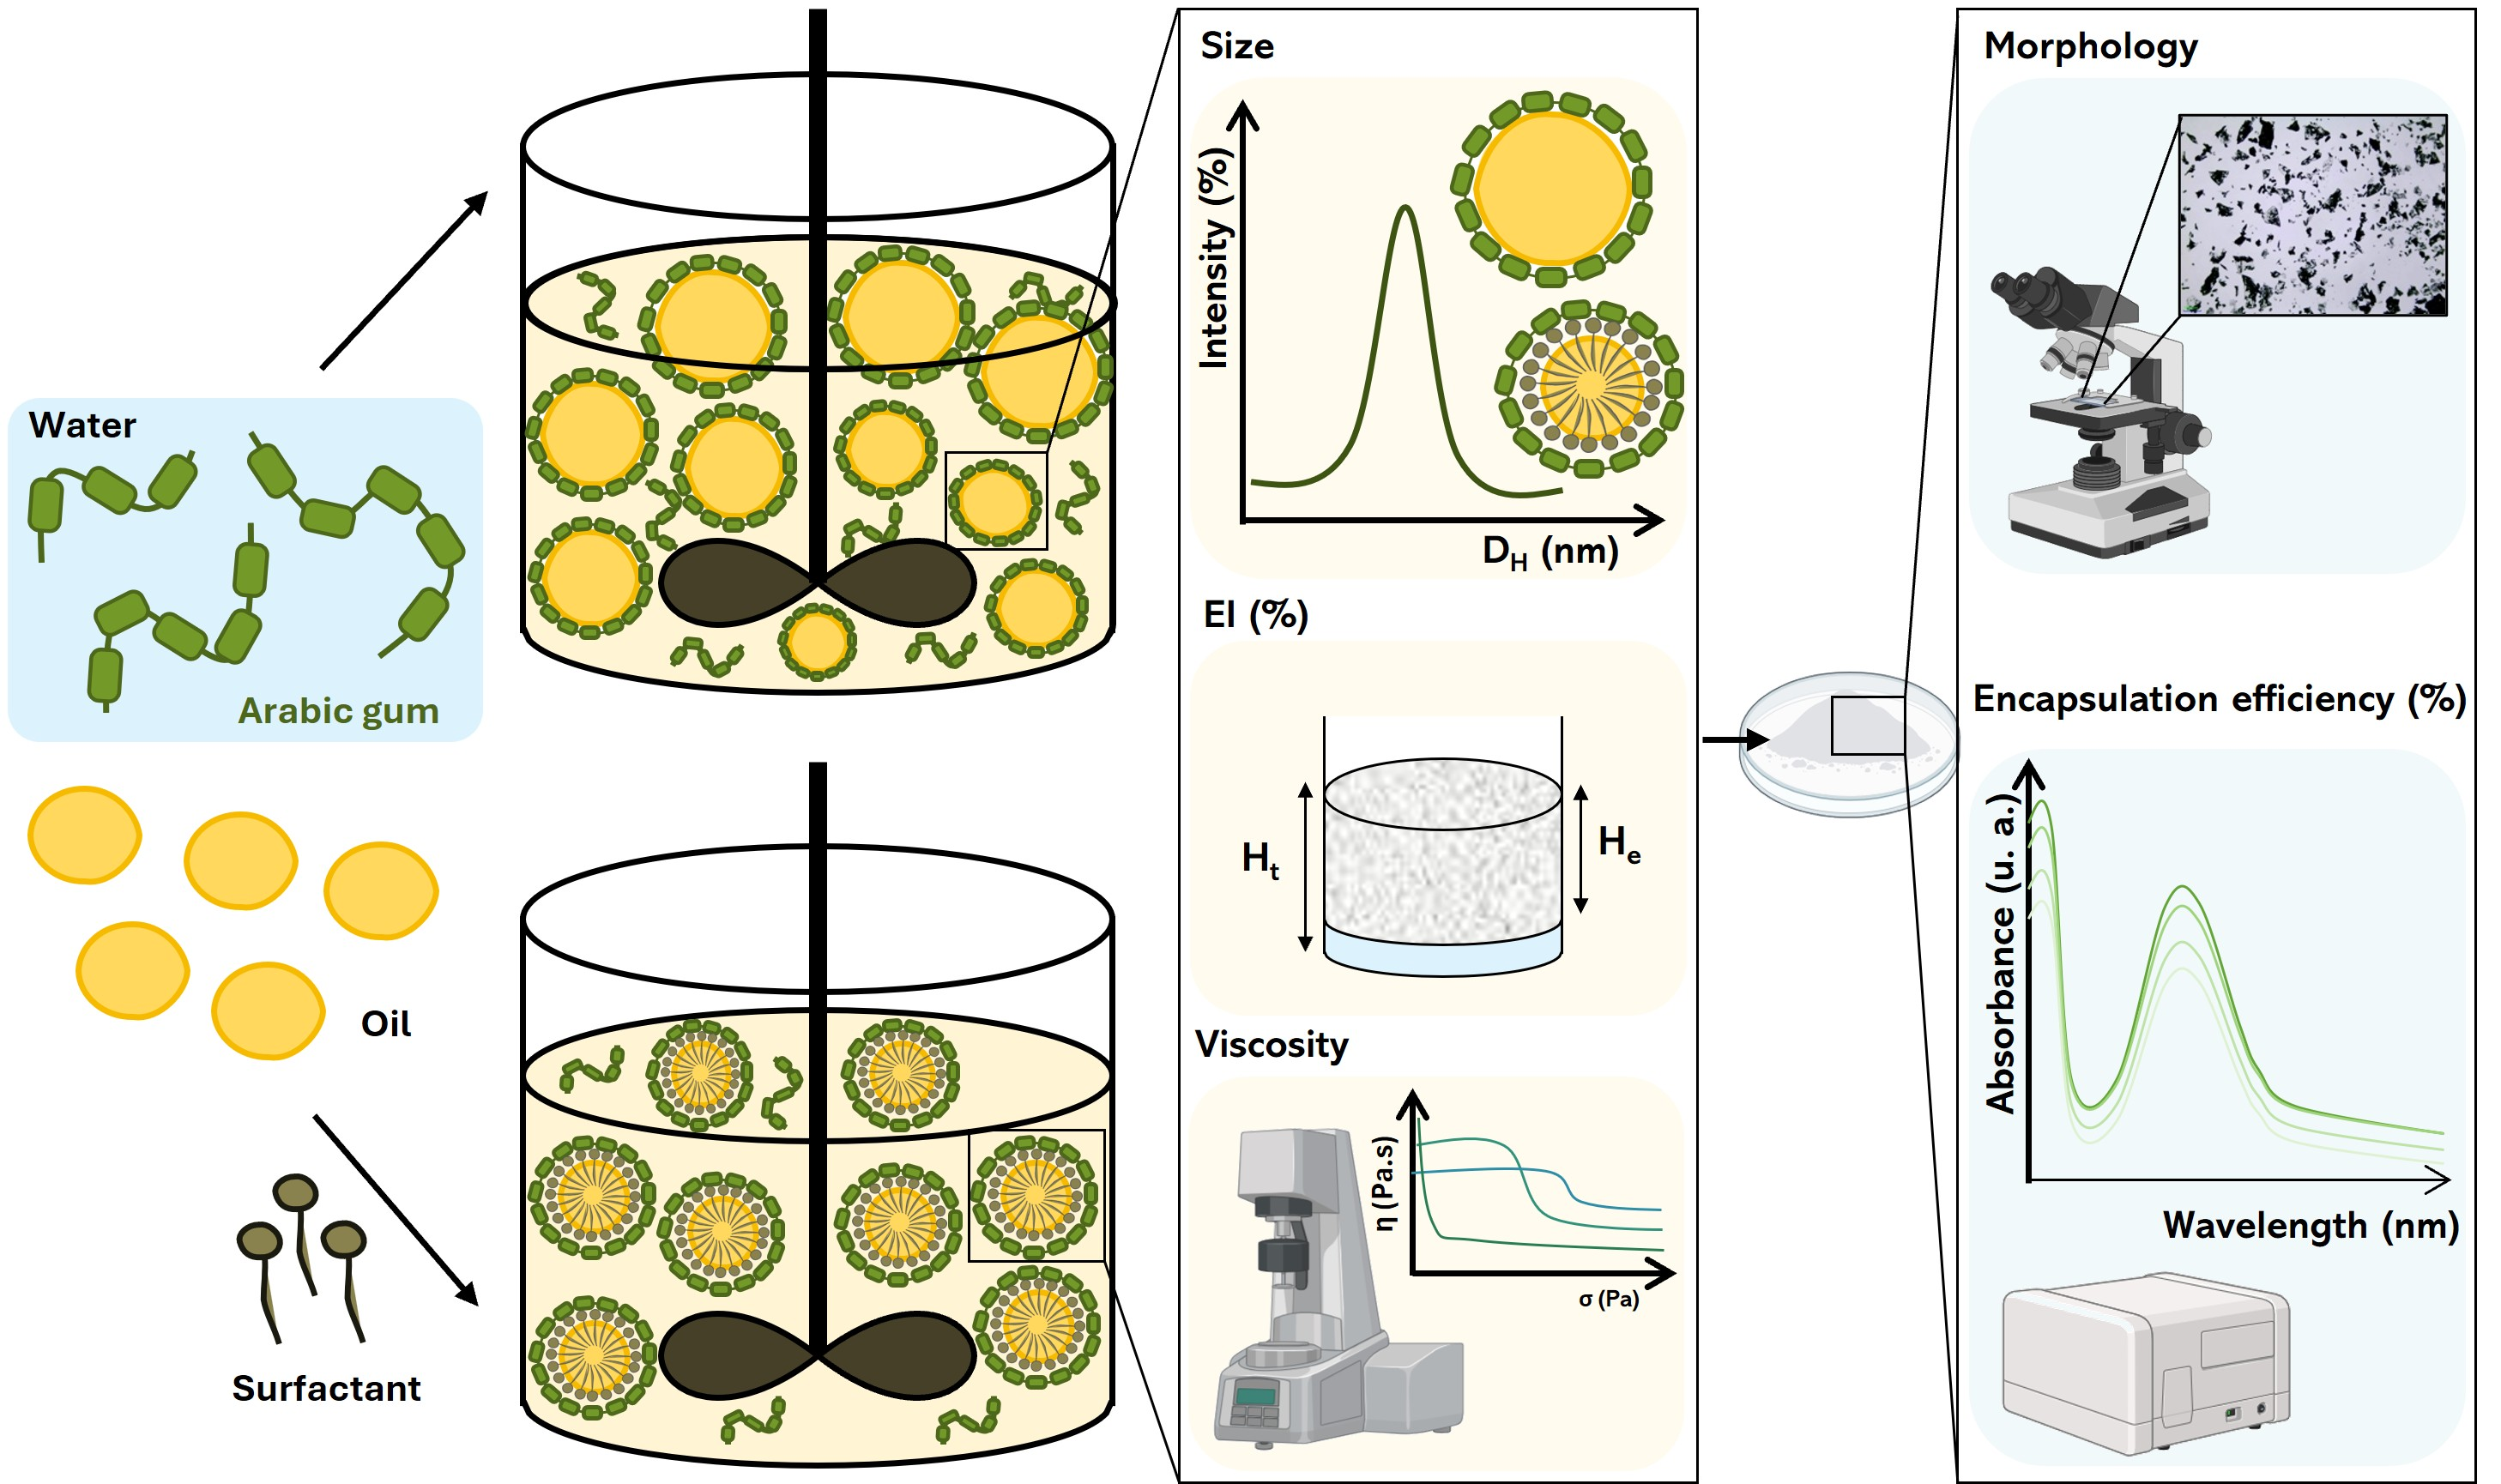
Graphical Abstract

1. Introduction

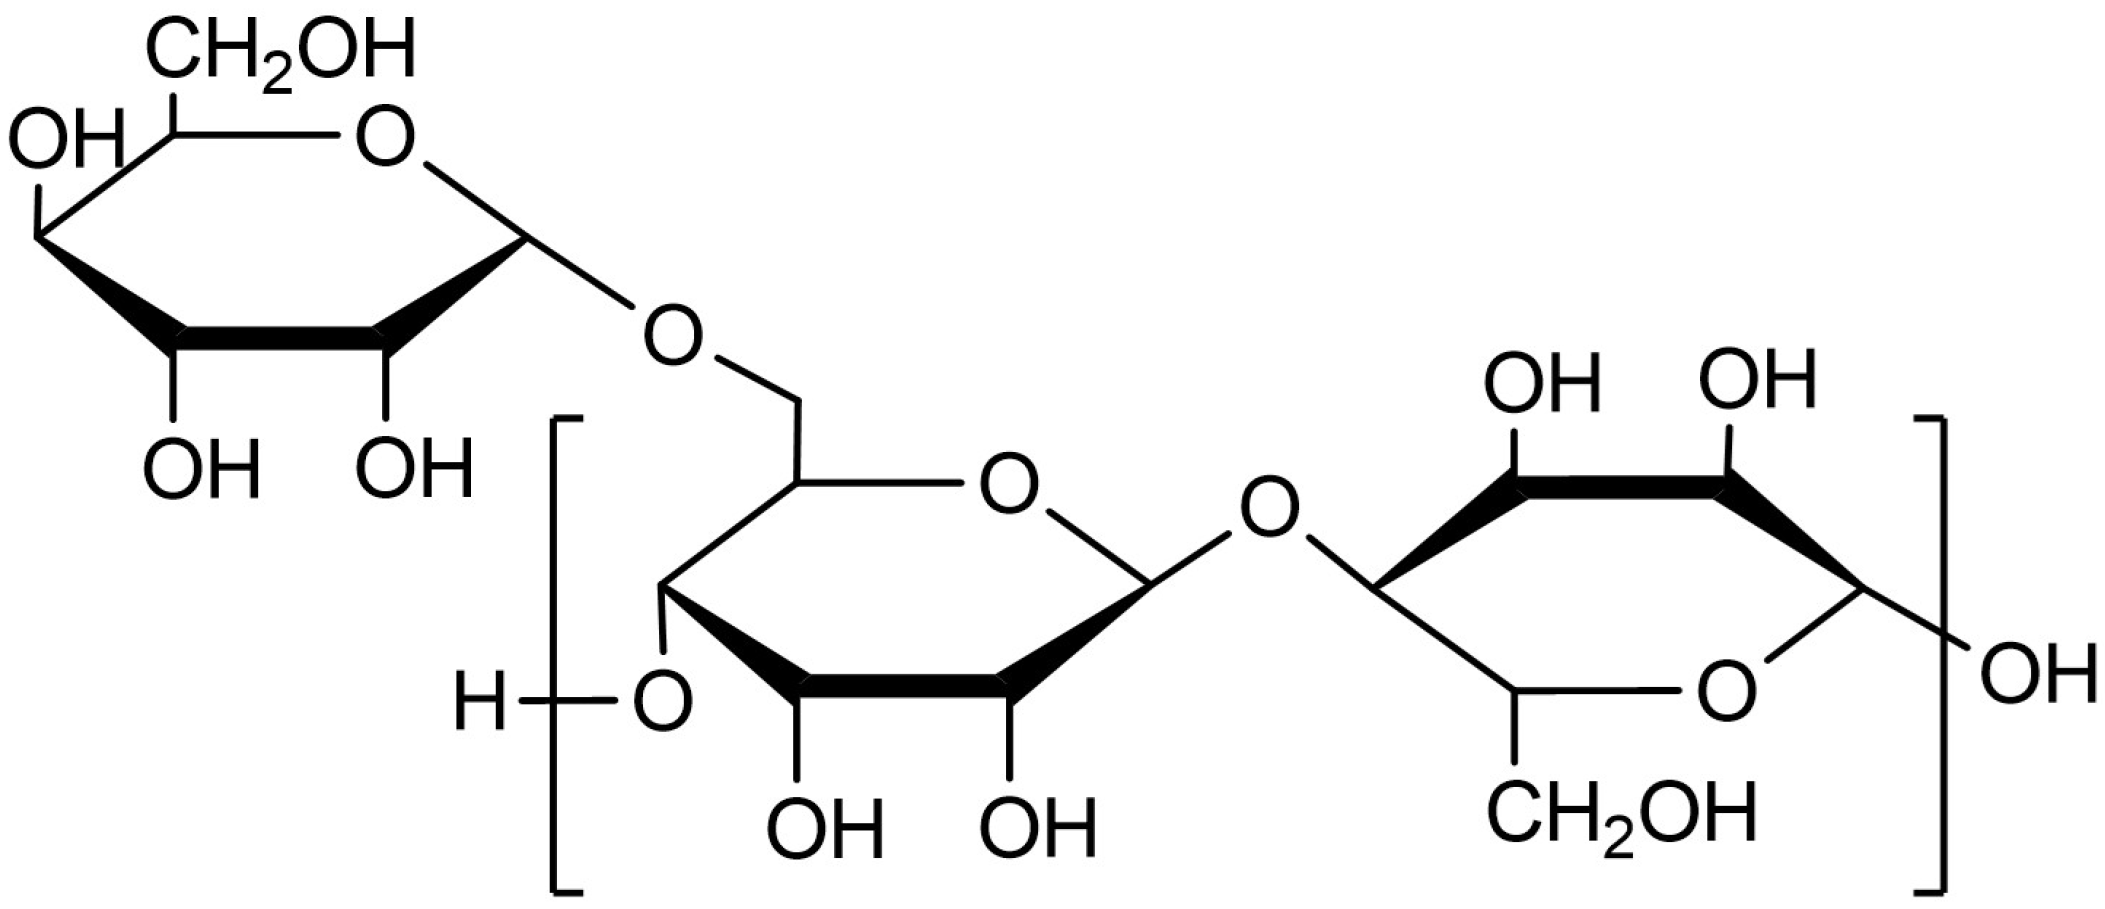
Microencapsulation has emerged as a versatile strategy to protect sensitive bioactive compounds, improve their stability, and control their release in complex formulations. Among the various encapsulation materials available, natural polysaccharides have attracted increasing attention due to their biodegradability, safety, and broad regulatory acceptance in food, cosmetic, and nutraceutical applications. Gum arabic (GA), Figure 1, is often chosen as an encapsulating agent for oils because of its excellent natural emulsifying and film-forming abilities. As a complex polysaccharide, it helps stabilize oil-in-water emulsions, which is a key step before drying processes like spray-drying or freeze-drying. One of its main advantages is that it can be used at relatively high concentrations without making the emulsion too thick or difficult to process. This allows for good encapsulation efficiency (EE) while keeping the system workable. Gum arabic also forms a protective barrier around oil droplets, which helps prevent oxidation and the loss of volatile compounds during processing and storage. For these reasons, it has become one of the most commonly used biopolymers for encapsulating essential oils and other sensitive lipophilic ingredients in food, cosmetic, and pharmaceutical formulations [1].
Gum arabic can be used as a wall material in different microencapsulation methods. Using the coacervation method, GA was frequently used in combination with gelatin to encapsulate different compounds such as xylitol [2], vitamin C [3], aspartame [4], sucralose [5], peppermint oil [6], paprika oleoserin [7], phenolic compounds [8], and proanthocyanidin [2,3,4,5,6,7,8,9]. Besides gelatin, which is the preferred choice, GA can also be combined with proteins to encapsulate omega-3 ethyl ester [10] and tuna oil and probiotic bacteria [10,11]. In spray-drying, GA is frequently used with maltodextrin and/or starches, and also with proteins or other carbohydrates, to encapsulate oils, pigments, and bioactives [12,13,14,15,16,17]. While spray drying has been extensively explored, fewer studies have systematically addressed GA-based encapsulation via freeze-drying, despite its relevance for thermosensitive compounds. It is particularly suitable for preserving the stability of vegetable oils, enabling the production of microparticles with high resistance to thermal and oxidative degradation, as well as good EE. One of the main advantages of freeze-drying is the formation of porous structures due to the sublimation process. These structures promote excellent rehydration characteristics in the final product [18]. This process consists of freezing the material and subsequently removing water by sublimation under reduced pressure. We can divide this process into three stages: (1) freezing, the water solidifies and forms ice crystals; (2) primary drying, under vacuum, sublimation of the ice takes place, beginning at the exposed surface and progressing inward; (3) secondary drying, removal of water that did not crystallize or sublimate. Before freeze-drying, the emulsion is an important step. An emulsion typically consists of a mixture of two immiscible liquids, with one of them dispersed as fine spherical droplets within the other. The way these droplets are formed and stabilized plays a crucial role in determining the quality and efficiency of the encapsulation, as well as the physical stability of the final product. This emulsion can be converted into powder microcapsules through drying processes such as spray-drying or freeze-drying [19].
Some researchers have also explored emulsion-based freeze-drying as a straightforward strategy for encapsulating sensitive compounds. Chranioti et al. investigated the encapsulation of fennel oleoresin, using binary and ternary mixtures of GA with modified starch, maltodextrin, and chitosan. The best results are obtained with the combination of GA and modified starch, achieving ca. 75% of EE [20]. Oliveira et al. used different ratios of inulin and GA to encapsulate Buriti oil, and the best results were obtained with a proportion of 1:1, with an EE of ca. 93% [21]. Oancea et al. encapsulate anthocyanins from sour cherries in a whey protein (5%) and GA (2%) solution, where it was possible to encapsulate ca. 70% [22]. Su et al. produced emulsions of amino acids with polyglycerol polyricinoleate as emulsifier and GA and xanthan gum as stabilizers. The best results indicated an encapsulation of 80% using 2% of GA and 0.3% xanthan gum [23]. Todorovic et al. encapsulate bilberry extract with GA, maltodextrin, and the combination of these two polymers (1:1), and although they do not refer to the EE, the microcapsules present a high phenolic and monomeric anthocyanins content and a preserved antioxidant capacity [24].
Most published studies on emulsion-based freeze-drying investigate a single oil (or a narrow set of oils) together with one wall material/emulsifier system, often under study-specific processing conditions. This limits direct cross-comparisons and makes it difficult to separate the influence of oil identity from that of interfacial formulation on encapsulation performance. Although oil microencapsulation using gum arabic has been reported, systematic side-by-side evaluations of multiple oils combined with different surfactants under identical formulation and processing conditions are still limited. Consequently, it remains unclear whether EE is mainly controlled by intrinsic oil properties or by formulation-dependent interfacial phenomena (e.g., interfacial stabilization and matrix cohesion).
In this context, the present work provides a controlled comparative framework using a unified GA-based platform: several vegetable oils are processed using the same emulsification and freeze-drying protocol and are compared under surfactant-free conditions and in the presence of Tween 80, sodium cocoyl glutamate (SCG), or lecithin (at defined concentrations and oil:GA ratios). By combining EE measurements with emulsion stability and microstructural characterization, this study clarifies that surfactant-driven droplet break-up does not necessarily translate into higher stability or EE, and highlights the key role of interfacial stability and GA–surfactant cohesion—modulated by surfactant chemistry and oil:GA ratio—in governing oil retention within the dried matrix.

2. Materials and Methods

2.1. Materials

Arabic gum was obtained from Acros Organics (Geel, Belgium), Tween 80 from Panreac AppliChem (Barcelona, Spain), soy lecithin from Santiveri (Barcelona, Spain), and (SCG) from Camassia (Almería, Spain). Jojoba, aloe vera, safflower, sweet almond, and sesame oils were purchased from Gran Velada (Zaragoza, Spain), and rice oil from Plena Natura (Lisbon, Portugal). Hexane (98%) was acquired from José Manuel Gomes dos Santos (Lisbon, Portugal).

2.2. Methods

2.2.1. Microcapsules Production

Gum arabic was pre-dissolved in water to prepare the wall material solution. The oil-to-GA ratio was defined on a solid-mass basis (water excluded), considering the dry GA mass present in the GA solution; thus, oil:GA ratios of 1:3 and 1:0.3 (w/w) refer to moil/mGA,dry. The surfactant concentration was expressed as wt% relative to the total emulsion mass. The study was performed in two steps: (i) surfactant screening using rice oil and three surfactants (Tween 80, SCG, and lecithin) at 0.1, 0.5 and 1.0 wt%; and (ii) oil screening under fixed conditions (0.1 wt% surfactant, oil:GA 1:3) by varying the oil type (rice, safflower, sweet almond, aloe vera, jojoba, and sesame oils). The exact compositions of all formulations are provided in Supplementary Information (Tables S1 and S2).
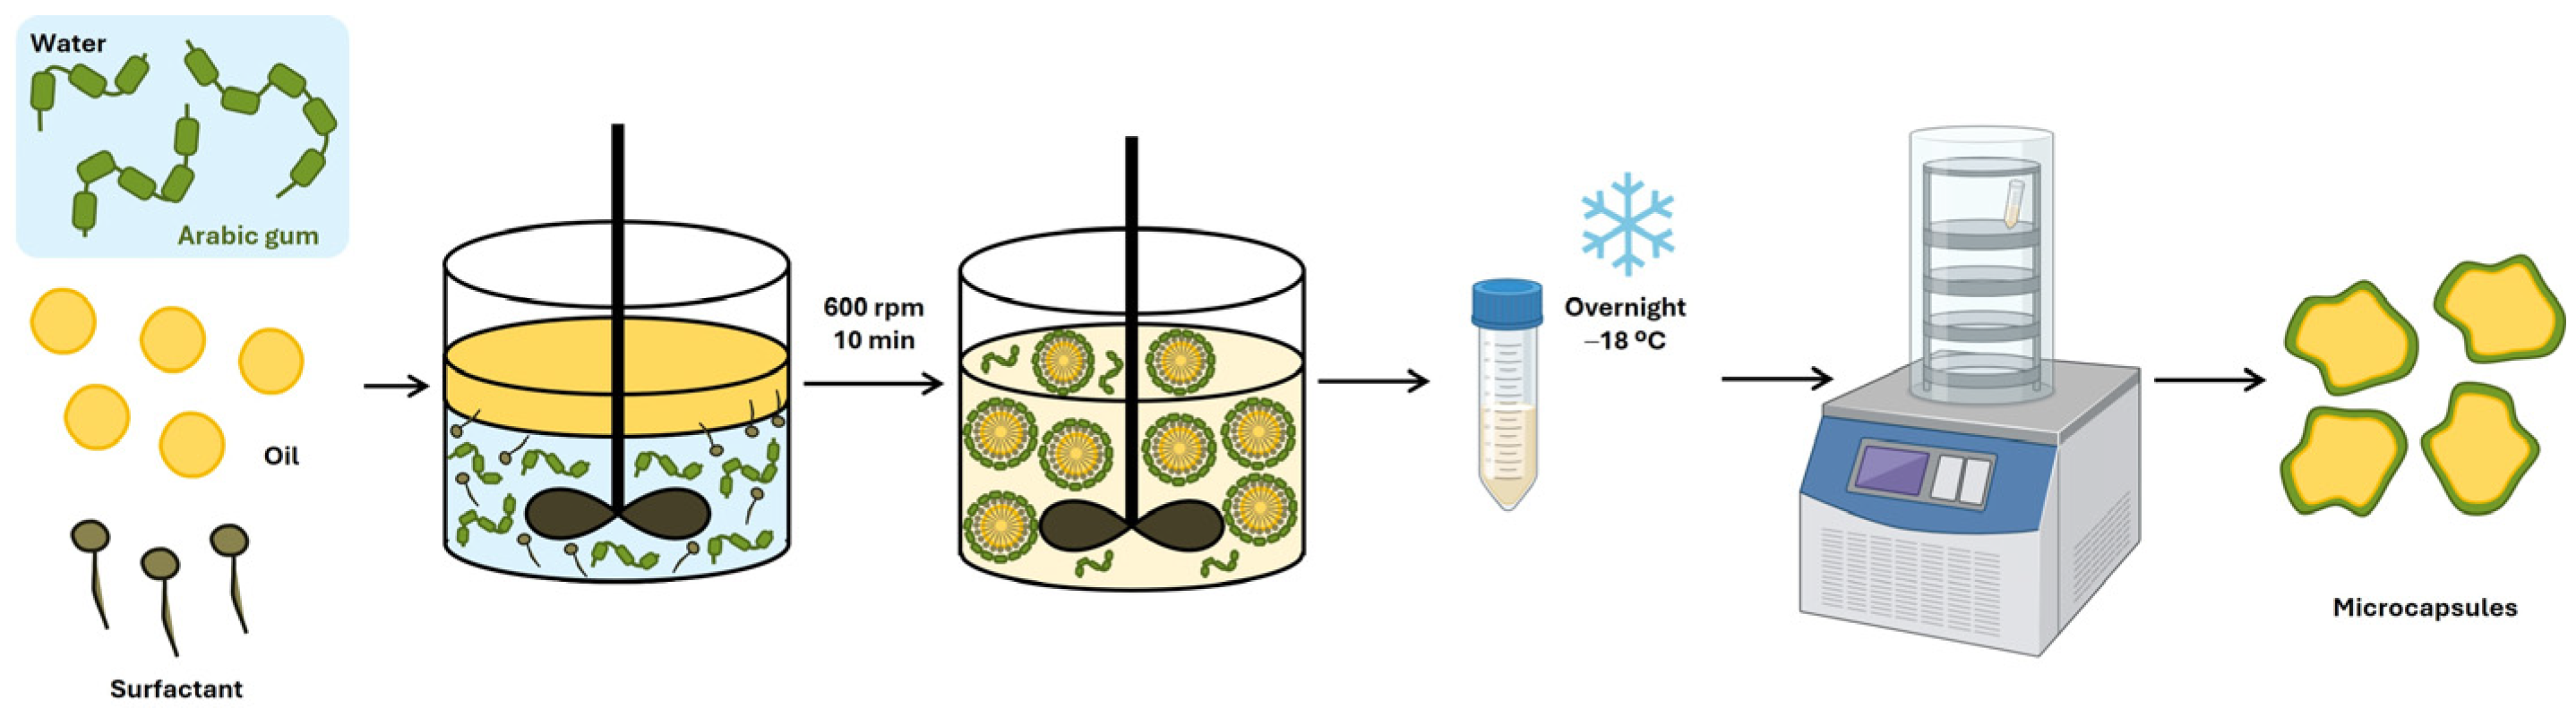
First, an emulsion was prepared by adding the oil phase (with the surfactant/emulsifier when applicable) to a 15% (w/v) GA solution and mechanically stirring at 600 rpm for 10 min. For encapsulation, the emulsion was frozen at −18 °C overnight and subsequently freeze-dried at −54 °C and 0.771 mbar (Labogene Scanvac Coolsafe) for 48 h. A schematic overview of the emulsion preparation and encapsulation steps is provided in Figure 2 for clarity.

2.2.2. Emulsion Characterization

The particle size of the emulsion was analyzed by Dynamic Light Scattering using a Malvern Zetasizer ULTRA (Malvern Instruments, Malvern, UK), equipped with a 633 nm wavelength laser and a backscattering angle of 173°. Prior to measurement, emulsions were diluted 1:10 (v/v) in distilled water, transferred to disposable polystyrene cuvettes, and measured at 25 °C, in triplicate. Data was processed using ZS Xplorer software (version 4.0.0.683) It should be noted that Dynamic Light Scattering (DLS) provides an intensity-weighted hydrodynamic diameter and, for micrometer-scale and/or highly polydisperse emulsions, the reported z-average should be interpreted as a comparative indicator rather than an absolute droplet size. In multimodal systems, a small fraction of larger droplets or aggregates can disproportionately bias the mean and inflate the PDI.
The rheological measurements (rotational test) were carried out on a Kinexus Lab+ (Netzsch, Selb, Germany) using a plate-plate geometry (20 mm, 0,5 mm gap) at 25 °C. Rheological measurements were performed by applying shear stress in the range of 0.1 to 100 Pa. For comparative purposes, the apparent viscosity at 10 Pa was selected as a representative value, since most samples exhibited either Newtonian or shear-thinning behavior that stabilized in this intermediate range, and these are the results presented and discussed herein.
The EI was determined to evaluate the physical stability of the emulsions. Immediately after preparation, the emulsions were transferred into graduated tubes and left undisturbed at room temperature. After 24 h, the height of the emulsified layer (Hₑ) and the total height of the sample (Hₜ) were measured. The EI was calculated using the following equation:
E I % = H e H t × 100

2.2.3. Microcapsules Characterization

After freeze-drying the emulsions, the resulting powder was analyzed by optical microscopy (Kern Optics OBN 135, Kern & Sohn GmbH, Balingen, Germany) both before and after the hexane-washing step. Microcapsules were placed on a glass slide before imaging. Images were analyzed at 4× magnification and processed using S-EYE 1.9.20 software. For microstructural characterization, scanning electron microscopy (SEM) was performed using a TESCAN VEGA3 SBH microscope (Brno, Czech Republic). Samples were directly mounted on carbon tape and sputter-coated with an ~6 nm Au/Pd layer SPI Module Sputter Coater (SPI Supplies, West Chester, PA, USA) for 90 s at 15 mA. SEM imaging was carried out at an accelerating voltage of 5–15 kV with a working distance of 10 mm.
The EE of the microcapsules was evaluated by quantifying the amount of non-encapsulated (free) oil material released upon surface washing with a non-polar solvent [12]. Briefly, 0.5 g of the dried microcapsules was dispersed in 5 mL of hexane, a solvent capable of extracting the surface oil or non-encapsulated oil material without disrupting the capsule wall. The suspension was stirred in a vortex at 2000 rpm for 3 min to ensure efficient surface extraction, then filtered. To ensure quantitative transfer and complete surface washing, the retained solids were further rinsed on the cellulose-based filter paper with an additional 10 mL of hexane, and the combined filtrate was collected. The filtrate was analyzed by UV–Vis spectrophotometry (PG instruments T80, Leicester, UK), measuring the absorbance at the oil-specific wavelength using 1 cm path-length cuvettes (jojoba: 230 nm; rice: 231 nm; sweet almond, aloe vera, safflower, and sesame: 234 nm). For each oil, calibration curves were established in hexane (5–7 concentration levels) over the following ranges (mg/L): jojoba, 645–5000 (R2 = 0.9943); sweet almond, 100–400 (R2 = 0.99409); rice, 200–2000 (R2 = 0.99548); aloe vera, 20–420 (R2 = 0.99361); safflower, 20–200 (R2 = 0.99105); and sesame, 20–200 (R2 = 0.98389). Linear regression was used to obtain calibration equations, which were applied to quantify the surface oil concentration in the filtrates. All measurements were performed in triplicate (n = 3).
The EE was calculated using the equation:
E E % = T o t a l   o i l S u r f a c e   o i l T o t a l   o i l × 100
where total oil corresponds to the theoretical oil content initially added during formulation (based on the oil:GA ratio defined on a solid-mass basis), and surface oil corresponds to the oil quantified in the hexane wash. In cases where the UV–Vis quantification of surface oil returned values below the calibration range (including negative values due to baseline noise), EE was reported as 0%, i.e., not quantifiable under the present analytical conditions.

2.2.4. Statistical Analysis

Data was analyzed using one-way ANOVA to compare all conditions within each dataset, followed by Tukey’s HSD post hoc test for multiple pairwise comparisons among means. Statistical significance was set at α = 0.05.

3. Results and Discussion

3.1. Oil Load and Surfactant Effects in Rice Oil Encapsulation

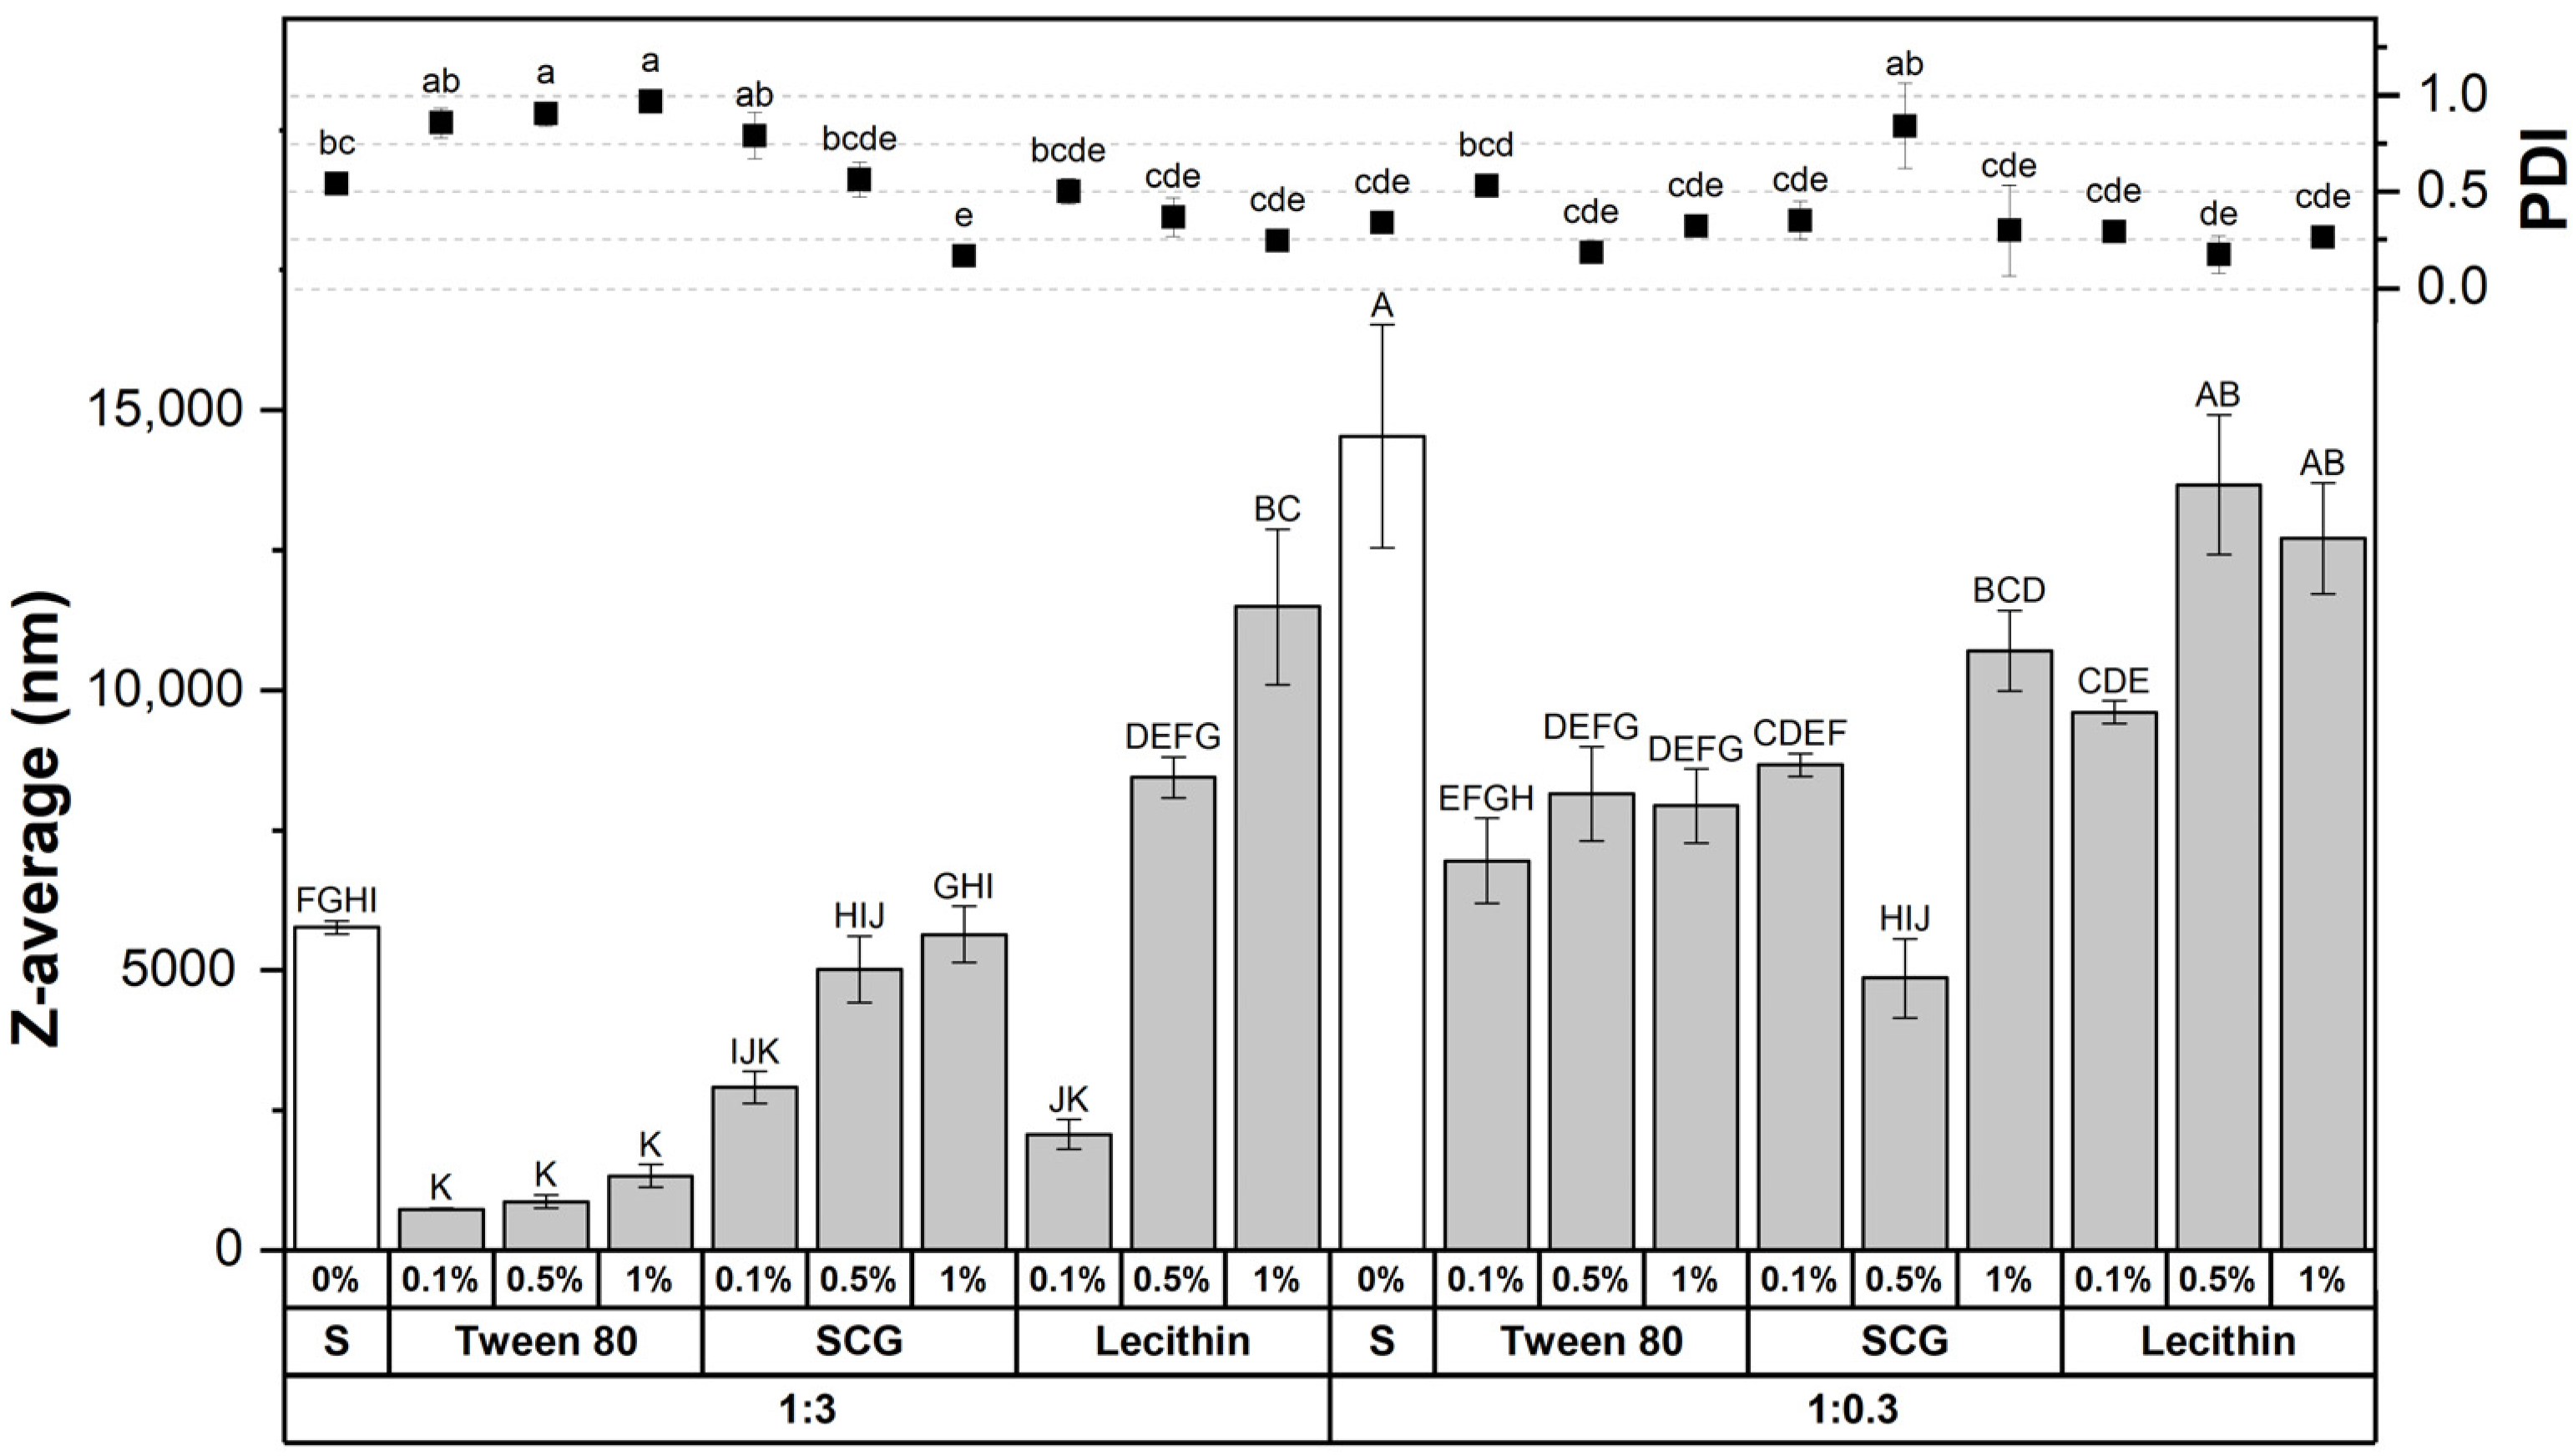
Rice-oil emulsions were prepared at oil:GA ratios of 1:3 and 1:0.3 and with 0.1–1 wt% surfactant, as described in Section 2.2.1. In Figure 3, it is possible observe that the oil-to-polymer ratio and the type and concentration of surfactant significantly influence the particle size (z-average) and PDI. In the GA-rich formulation (oil:GA = 1:3), the surfactant-free emulsion showed a micrometer-scale z-average (c.a. 5.8 µm; PDI 0.5), indicating a heterogeneous dispersion. Adding Tween 80 reduced the z-average to the lowest values, consistent with more efficient droplet breakup, but the PDI increased sharply (0.86–0.97), revealing a highly polydisperse/multimodal system. The small rise in z-average at higher Tween 80 levels, while still far below the control, is consistent with this broad size distribution.
SCG and lecithin followed a similar overall pattern, but their z-average values were consistently higher than those obtained with Tween 80 at the same concentration, suggesting lower efficiency in generating extensive interfacial area under GA-rich conditions. Here, interfacial cohesion denotes the integrity and strength of the GA–surfactant interfacial film that stabilizes droplets against coalescence. With increasing concentration, both surfactants led to larger apparent sizes. For SCG, sizes remained below the surfactant-free emulsion, indicating partial stabilization despite the formation of larger associated structures. In contrast, higher concentration of lecithin (0.5–1%), present z-averages above the surfactant-free system, consistent with lipid self-assembly and/or structured aggregates dominating the DLS signal. For both SCG and lecithin, PDI decreased with concentration, pointing to more uniform associated structures rather than progressively smaller droplets.
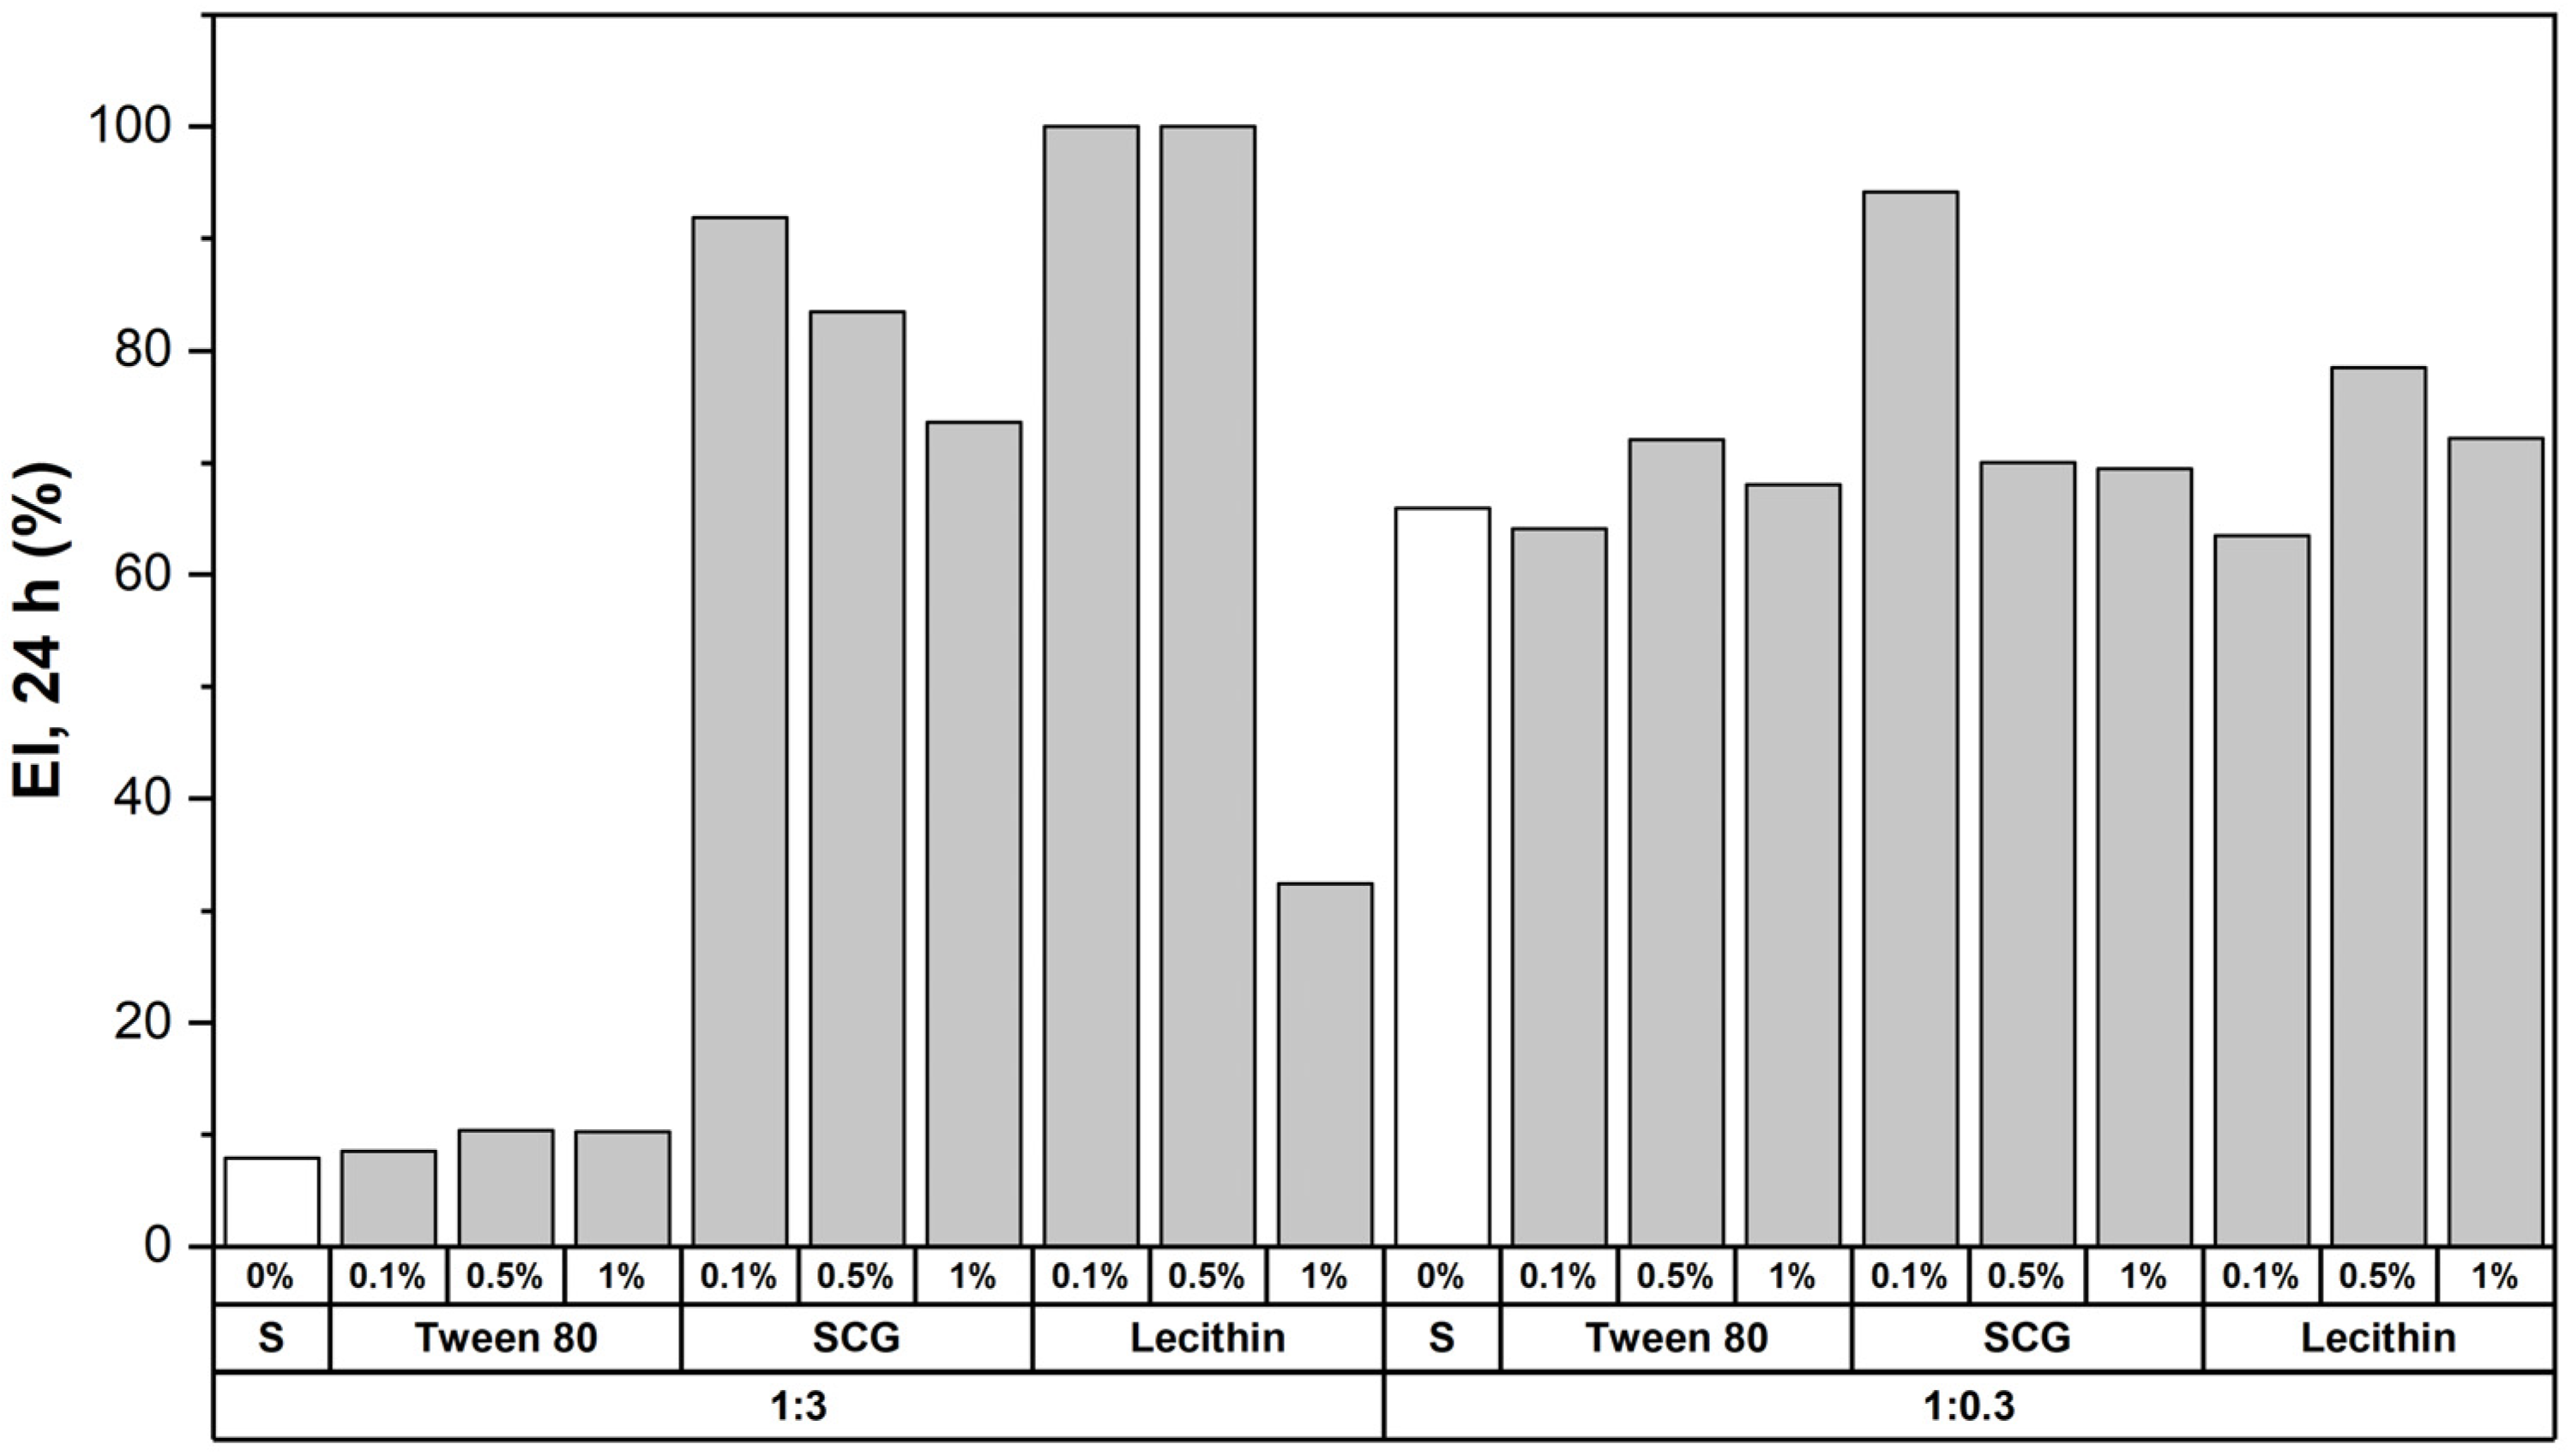
Emulsification stability after 24 h, Figure 4, did not directly track the DLS z-average, indicating that separation was driven mainly by the prevailing destabilization mechanism (e.g., flocculation/aggregation) rather than mean droplet size alone. Accordingly, Tween 80 gave very low EI despite the smallest apparent sizes, consistent with the highly polydisperse nature of these dispersions, where a minor fraction of large clusters can accelerate creaming. For SCG, stability decreased with concentration, in line with the formation of larger associated structures. Lecithin provided full stability at 0.1–0.5%, but stability dropped sharply at 1%, suggesting that excess lecithin promotes aggregate-dominated microstructures that compromise kinetic stability.
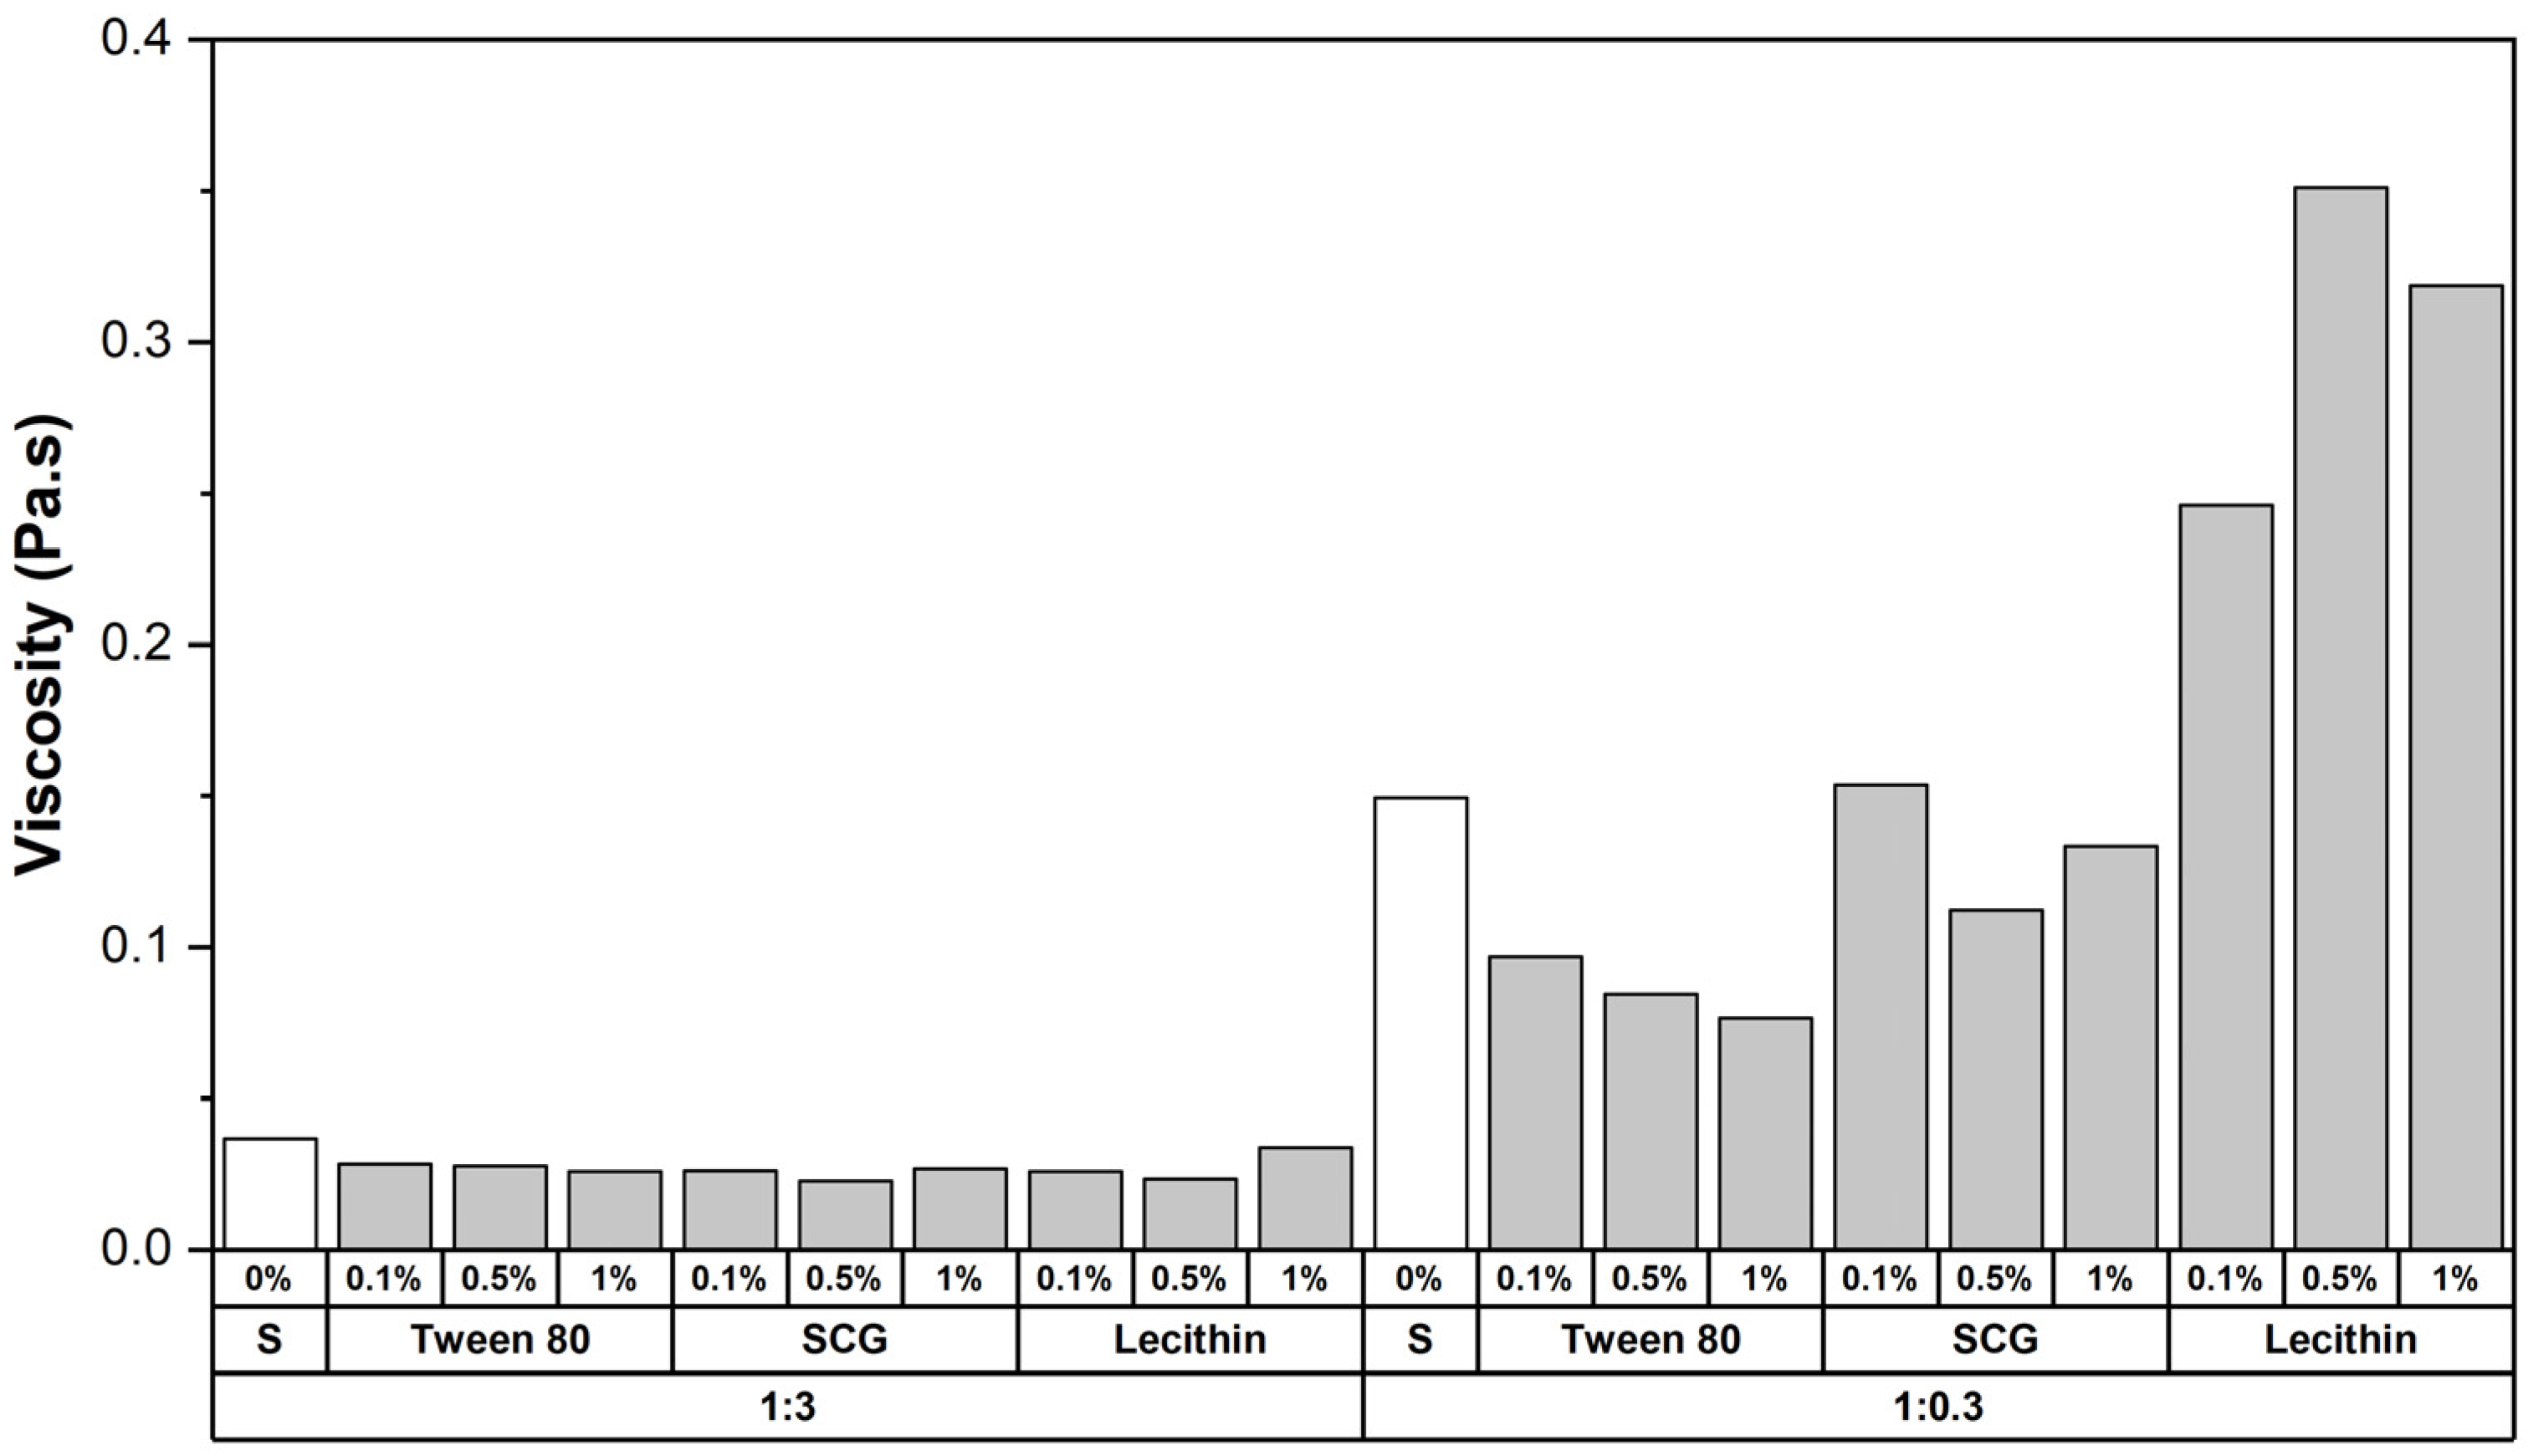
In the system with less GA (oil:GA = 1:0.3), all formulations remained in the micrometer range (4.9–13.7 µm) and exhibited non-linear responses to surfactant concentration, consistent with interfacial-coverage limitations and increased susceptibility to coalescence/flocculation. Importantly, the DLS trends align with rheology: viscosity increased with surfactant concentration, Figure 5, suggesting progressive development of associated structures (e.g., droplet clusters and/or surfactant–GA assemblies) that enhance the effective dispersed-phase volume and microstructural connectivity. In contrast, the GA rich system (oil:GA = 1:3) consistently displayed low viscosities (0.02–0.04 Pa·s), which is consistent with the lower effective dispersed-phase fraction and the stronger steric stabilization imparted by the higher GA content, limiting persistent flocculation and preventing the formation of a viscosity-enhancing droplet network.
Encapsulation efficiencies exhibited a marked dependence on both the oil:GA ratio and the nature and concentration of the surfactant (Table 1). At the higher oil load (1:0.3), all formulations yielded EE values close to zero, irrespective of surfactant type. This suggests that, despite the relatively high EI observed for these concentrated systems, the core:wall ratio was too high to sustain an intact GA matrix during drying: droplet coalescence and oil migration are likely to produce particles enriched in surface oil, which is fully removed by hexane extraction. Importantly, freeze-drying imposes destabilization pathways that are not captured by droplet size alone. During freezing, ice-crystal growth and cryoconcentration increase local droplet crowding and promote coalescence and oil expulsion, while subsequent dehydration can drive oil migration toward particle surfaces. Therefore, successful encapsulation requires not only initial emulsification, but also an interfacial film and a continuous GA-rich matrix that remain mechanically robust throughout freezing and drying, limiting oil transport and surface oil formation [25]. In contrast, the 1:3 formulations, which contain a larger amount of GA per unit oil, afforded measurable encapsulation. The surfactant-free system showed only a modest EE (7.2 ± 0.8%), whereas the addition of 0.1% SCG and 0.1–0.5% lecithin markedly increased EE to 38.0 ± 0.7% and 21–53%, respectively. These results can be rationalized by considering the interfacial architecture: Tween 80, which gave EE ≈ 0% at all concentrations, is expected to form thin, highly mobile non-ionic films that interact weakly with GA and provide limited resistance to coalescence and oil release during drying. This apparent decoupling between droplet size and EE reflects that GA-stabilized emulsions rely on a complex, GA-rich interfacial film whose packing and properties depend on GA adsorption and organization at the interface. When low-molecular-weight surfactants dominate the interface, competitive adsorption can reduce the biopolymer contribution to interfacial viscoelasticity and barrier character, yielding dispersions that may appear small by DLS but provide insufficient mechanical resistance during freezing/dehydration, thereby favoring oil migration and poor EE [26,27]. In contrast, SCG and lecithin at low levels promote the formation of thicker, more cohesive mixed GA–surfactant layers that facilitate the development of a continuous polysaccharide matrix upon dehydration, leading to more efficient oil entrapment. At pH ≈ 4.5 (pH of the emulsion), both surfactants exhibit a negative charge (as confirmed by zeta potential measurements), indicating that this effect does not arise from electrostatic complexation with GA (also anionic) but rather from reduced interfacial mobility and enhanced viscoelasticity of the mixed interfacial films. At 1% SCG or lecithin, EE dropped back to zero, consistent with a regime where excess surfactant remains predominantly in the aqueous phase, promoting oil solubilization/transport and/or disrupting formation of a continuous GA-rich matrix upon dehydration. Under such conditions, a larger fraction of oil becomes weakly retained (surface-associated or readily extractable), which is captured by the hexane-wash quantification [28].
These encapsulation results clearly indicated that the 1:0.3 formulations were unsuitable for microencapsulation, as no oil was retained regardless of the surfactant used. In contrast, only the 1:3 systems produced measurable EE, and effective entrapment occurred exclusively at low surfactant levels. Based on this optimization, all subsequent experiments with other oils were carried out using the 1:3 ratio and a fixed surfactant concentration of 0.1%, the only condition that consistently enabled encapsulation.

3.2. Impact of Core Oil and Surfactant Type on GA Microencapsulation

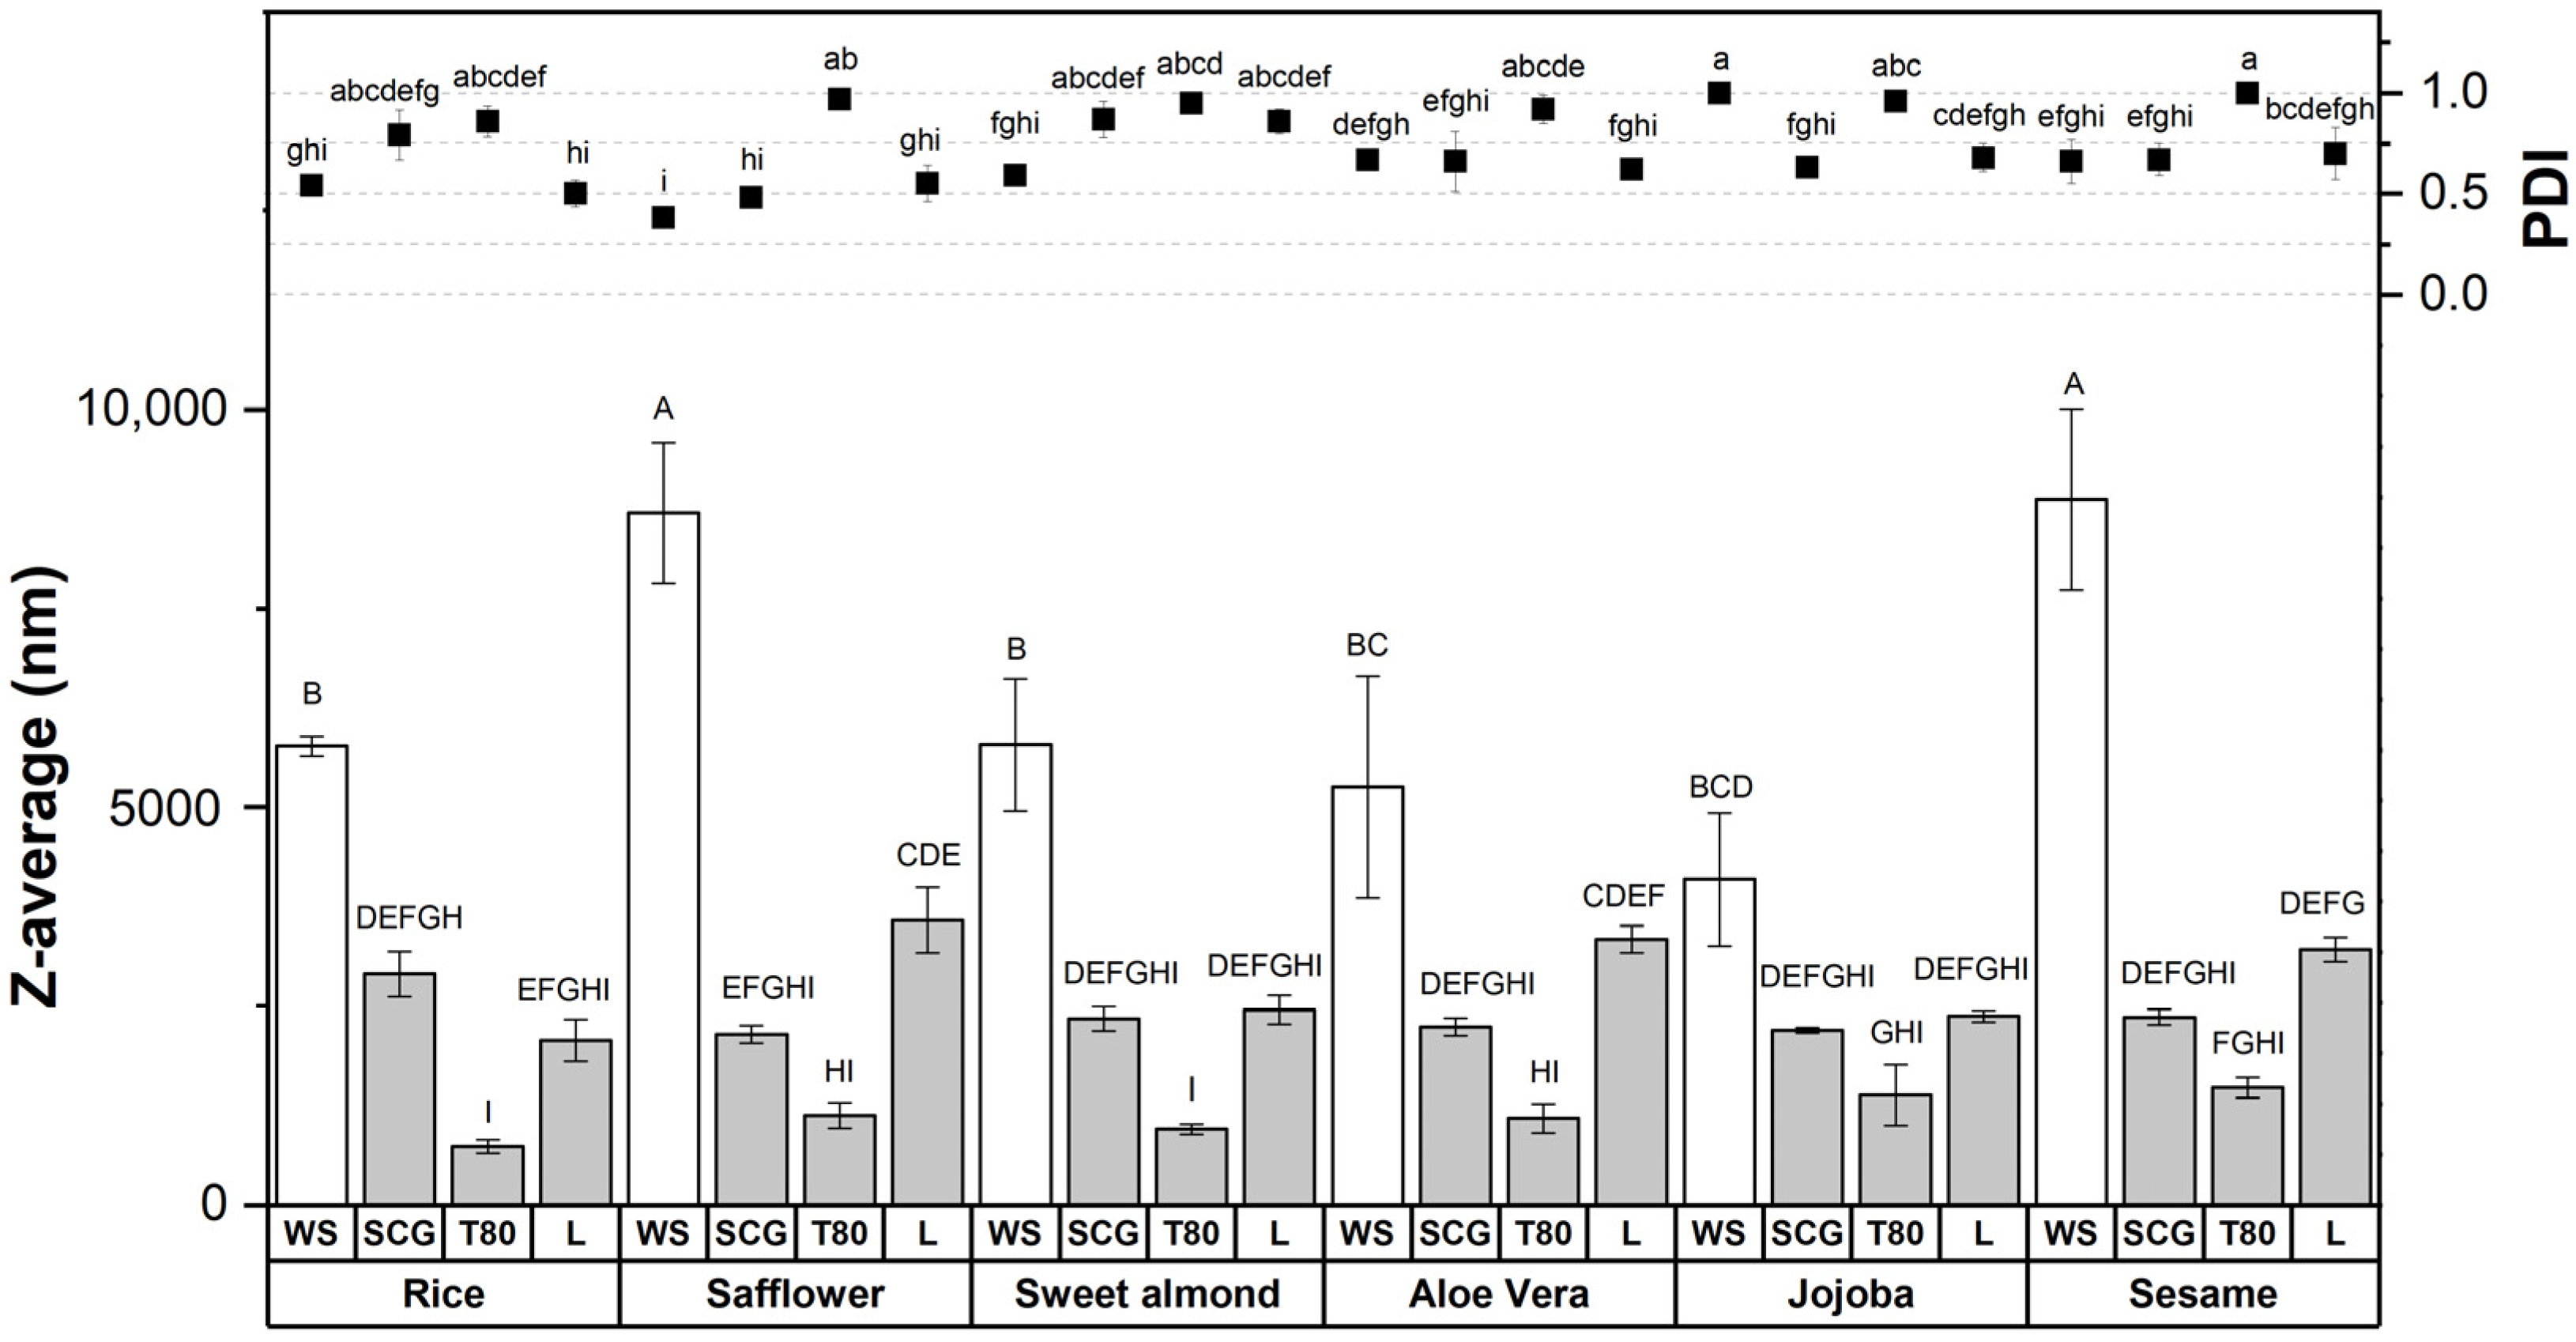
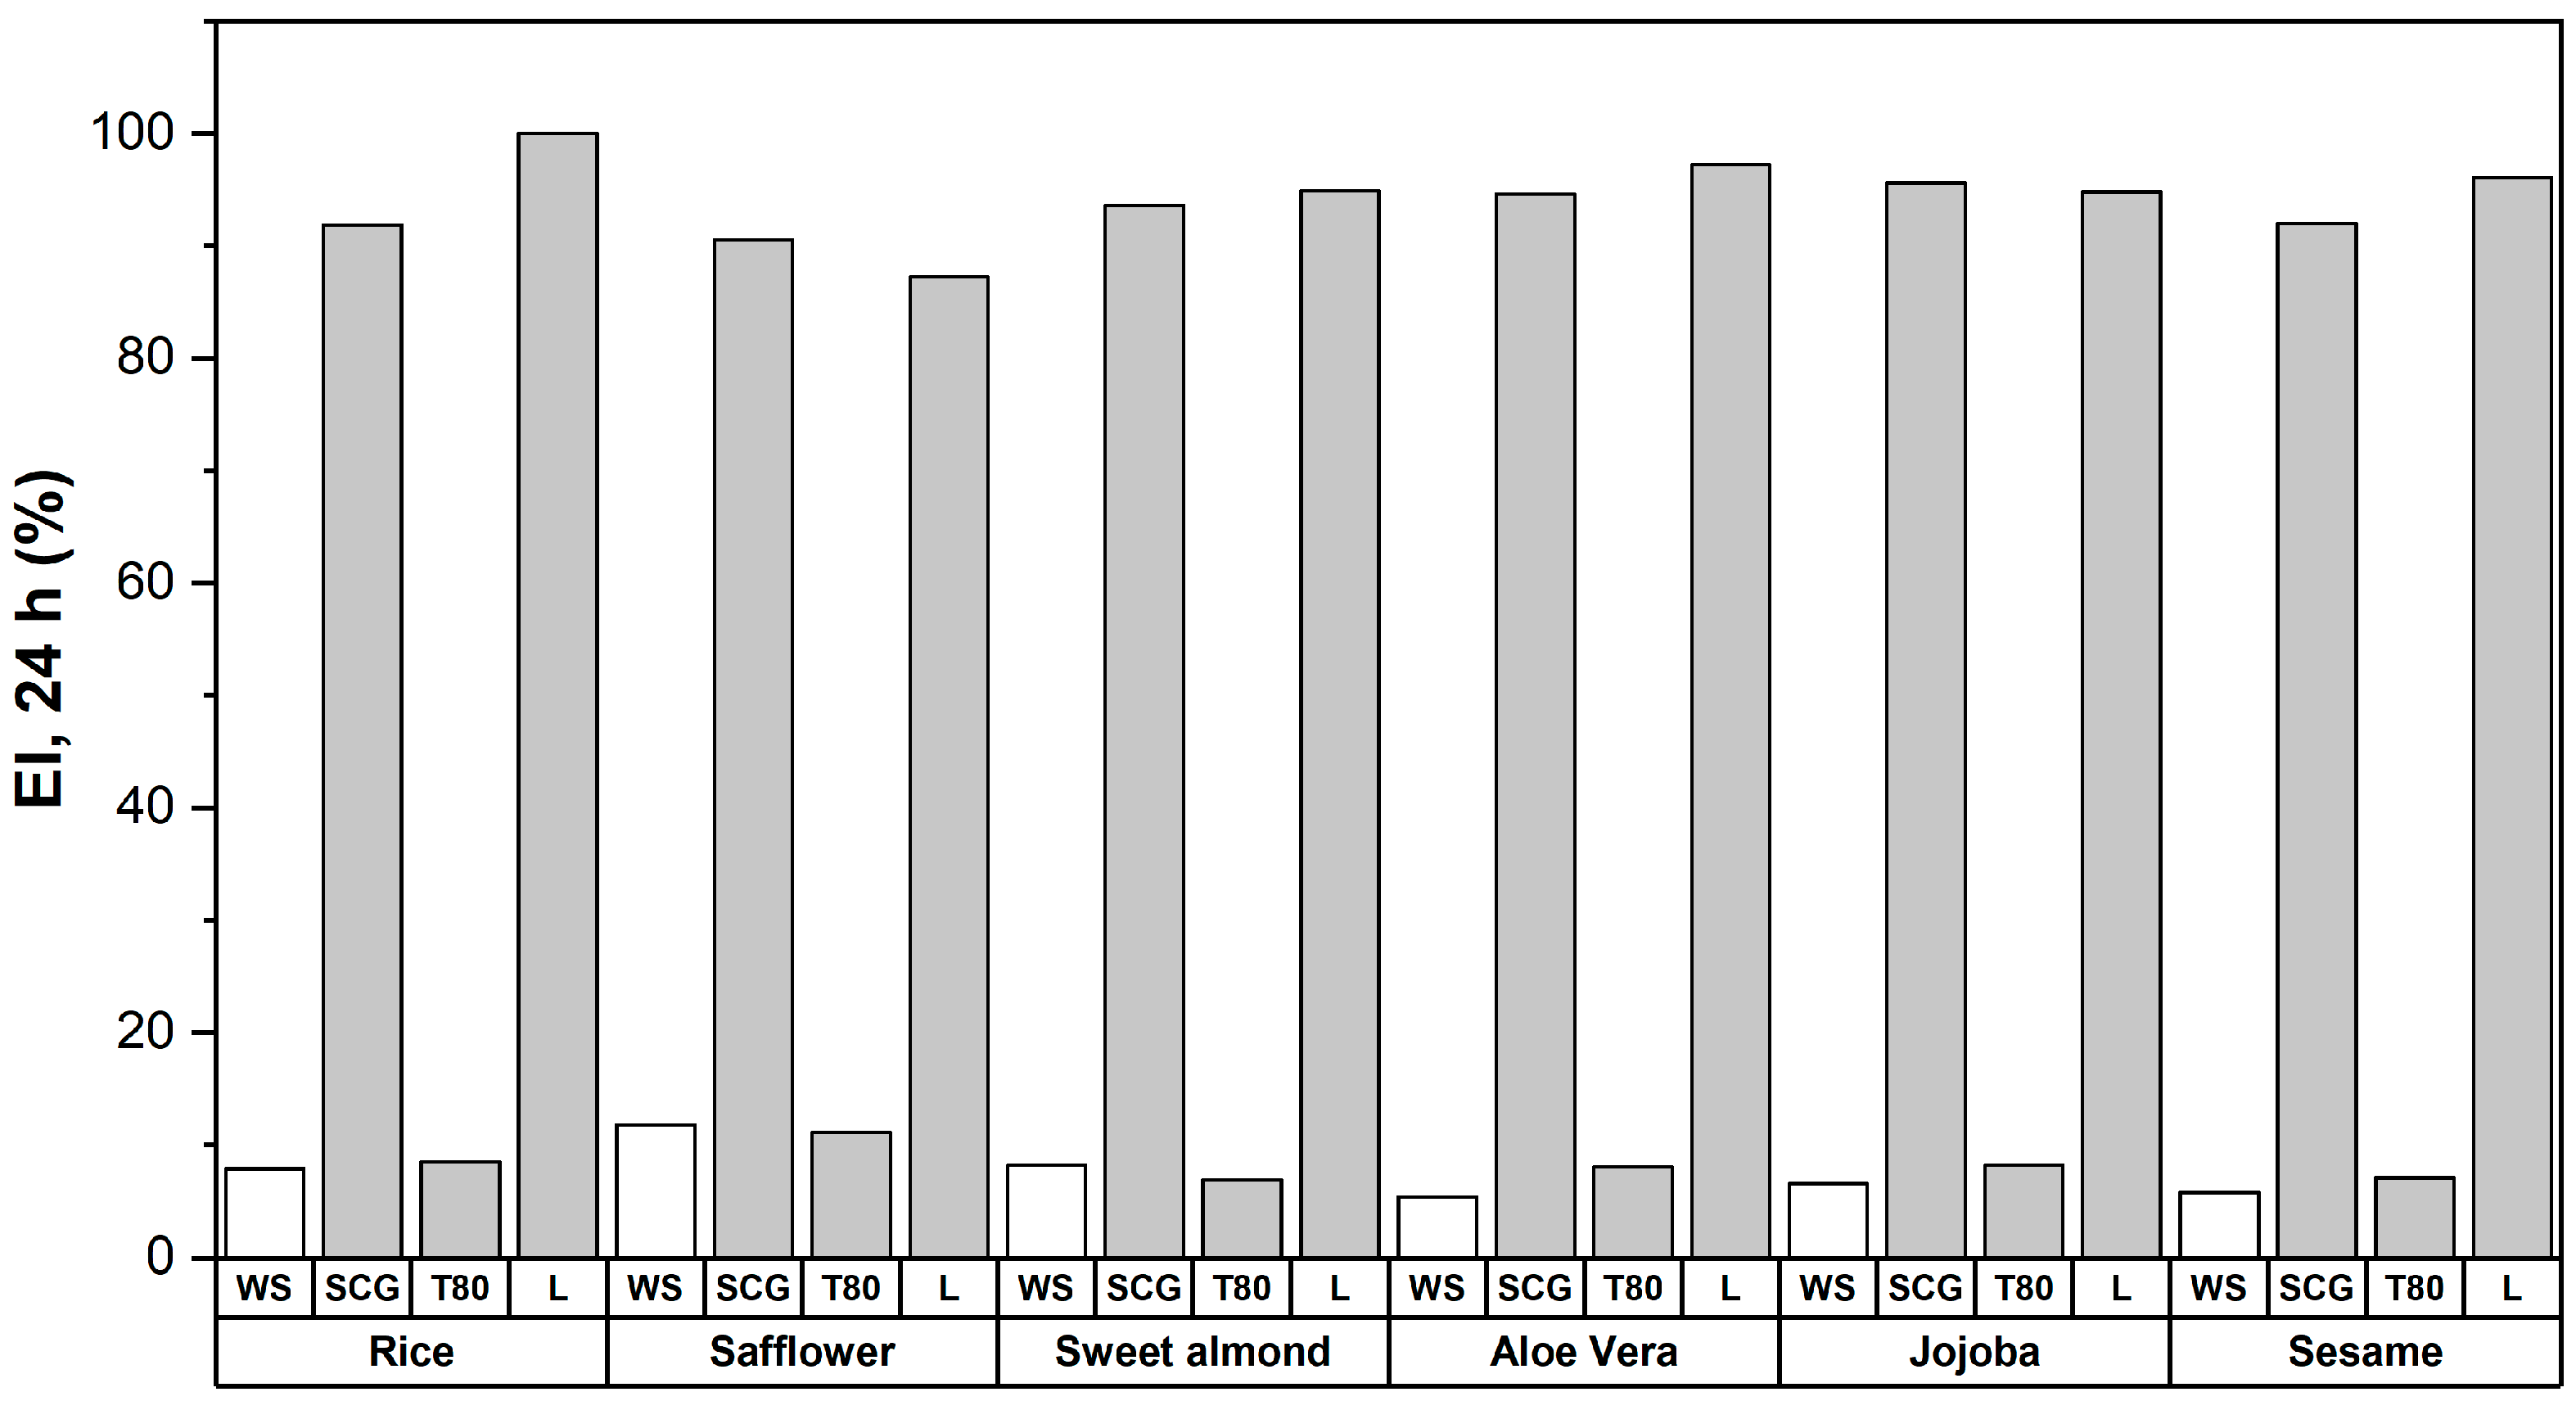
Similarly to the previous approach, the z-average and PDI were first determined for emulsions prepared with different oils, in order to assess the effect of adding 0.1% surfactant (Figure 6). The z-average values indicated a clear effect of surfactant addition on the apparent hydrodynamic size of the dispersed phase. Across the tested oils, emulsions prepared without surfactant displayed the largest droplet sizes between 5 and 10 μm, indicating limited disruption of the oil phase during homogenization. The incorporation of surfactants systematically reduced the z-average, with lecithin- and SCG-stabilized systems showing intermediate droplet sizes (between 2 and 4 μm), while Tween 80 produced the smallest droplets (700–1500 nm). These trends are supported by the full-size distributions reported in the Supplementary Information (Figures S1–S6), which also highlight the polydisperse nature of several samples. This pattern demonstrates that interfacial tension reduction facilitates droplet break-up, even though it does not necessarily guarantee long-term stability. Indeed, despite the small z-average values obtained with Tween 80, these formulations exhibited very low EI, Figure 7, highlighting that droplet size alone is not sufficient to ensure emulsion stability. Regarding the PDI, in several cases, emulsions without surfactant showed relatively low PDI values, indicating a coarse but comparatively narrow size distribution generated by shear-limited break-up. Upon surfactant addition, PDI generally increased, particularly for Tween 80, which consistently exhibited the highest values (close to 1.0). This behavior suggests that, although Tween 80 promotes extensive droplet break-up and yields very small average sizes, the resulting systems are highly heterogeneous, with very small droplets coexisting with larger ones formed by coalescence during storage. Lecithin and SCG produced intermediate PDI values, consistent with more controlled droplet formation and reduced coalescence, in agreement with their high EI.
Lecithin and SCG consistently resulted in very high EI values (>87%) for all tested oils, demonstrating efficient interfacial stabilization and resistance to phase separation. These results indicate that emulsion stability in this system is governed primarily by interfacial mechanisms, i.e., adsorption behavior, interfacial tension reduction, and oil–surfactant compatibility. In addition, the net negative interfacial charge observed for both surfactants at the working pH is expected to contribute to colloidal stability by increasing electrostatic repulsion between oil droplets, thereby suppressing flocculation and coalescence.
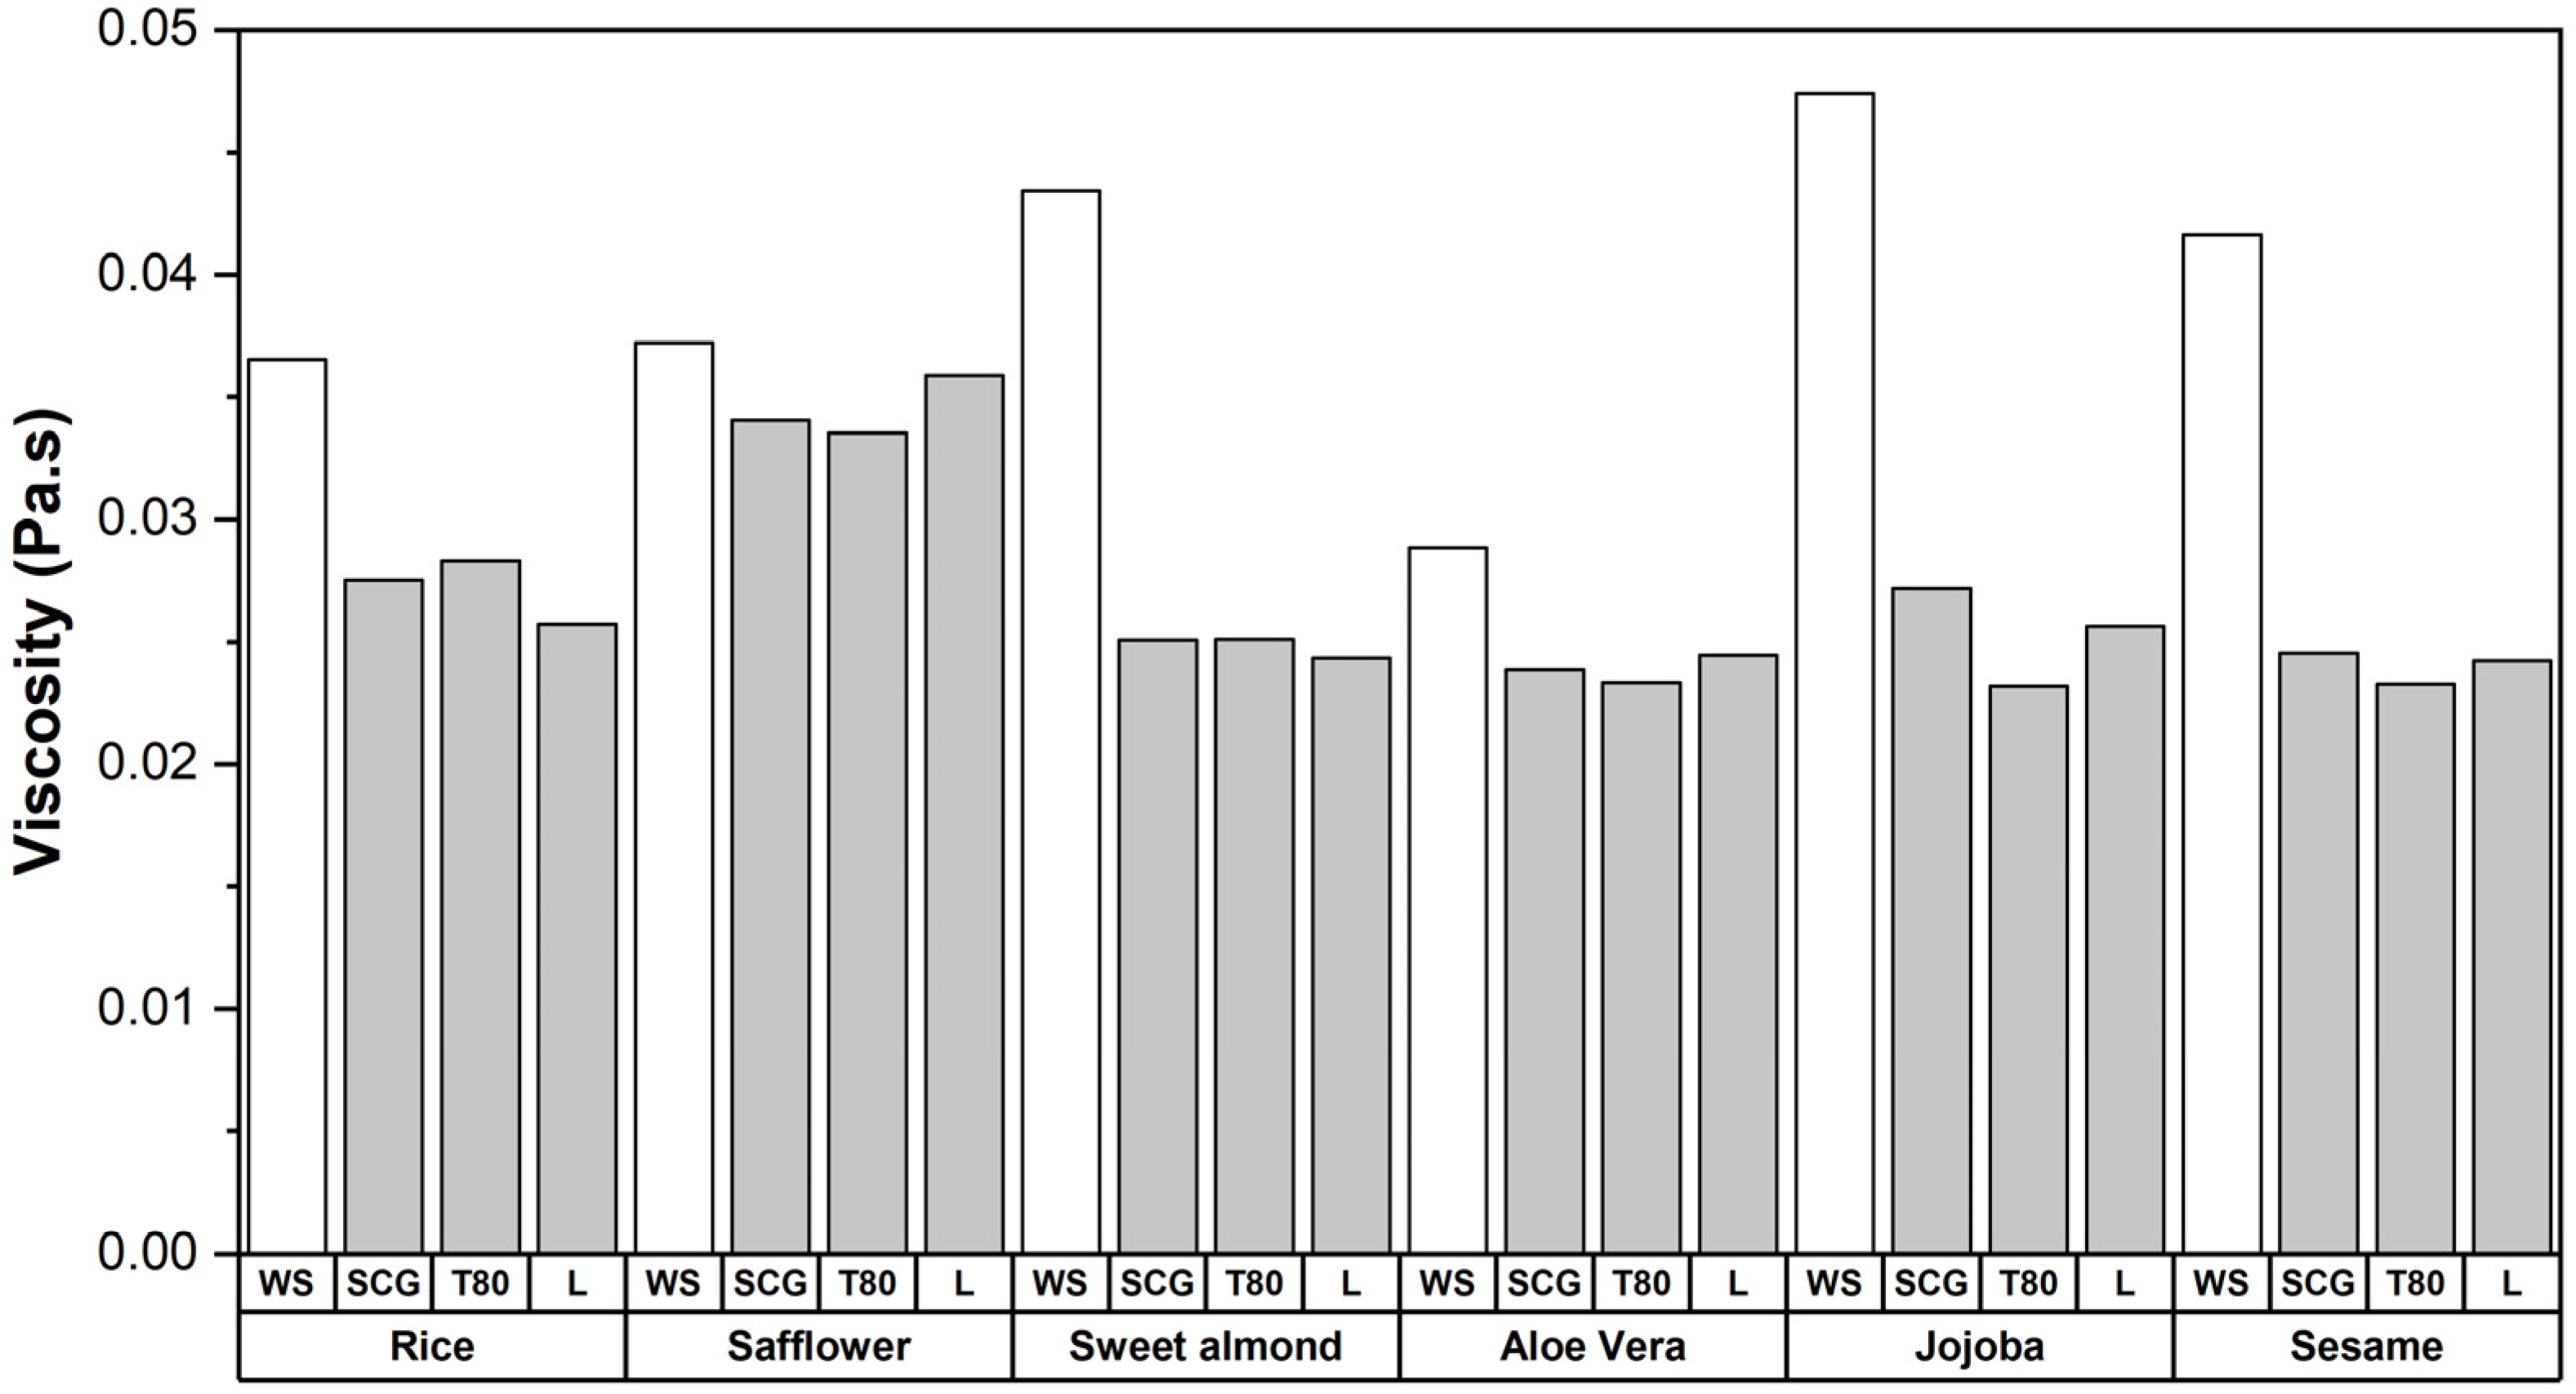
The apparent viscosity measured at 10 Pa remained low for all formulations (0.02–0.04 Pa·s), Figure 8, and decreased systematically upon addition of any of the three surfactants, irrespective of their emulsification performance. This tendency can be attributed to reduced droplet–droplet interactions once surfactant molecules adsorb at the interface: surfactant addition limits weak flocculation and transient clustering, leading to a slightly more fluid system under shear. The small magnitude of these variations confirms that all systems remained dilute and non-structured.
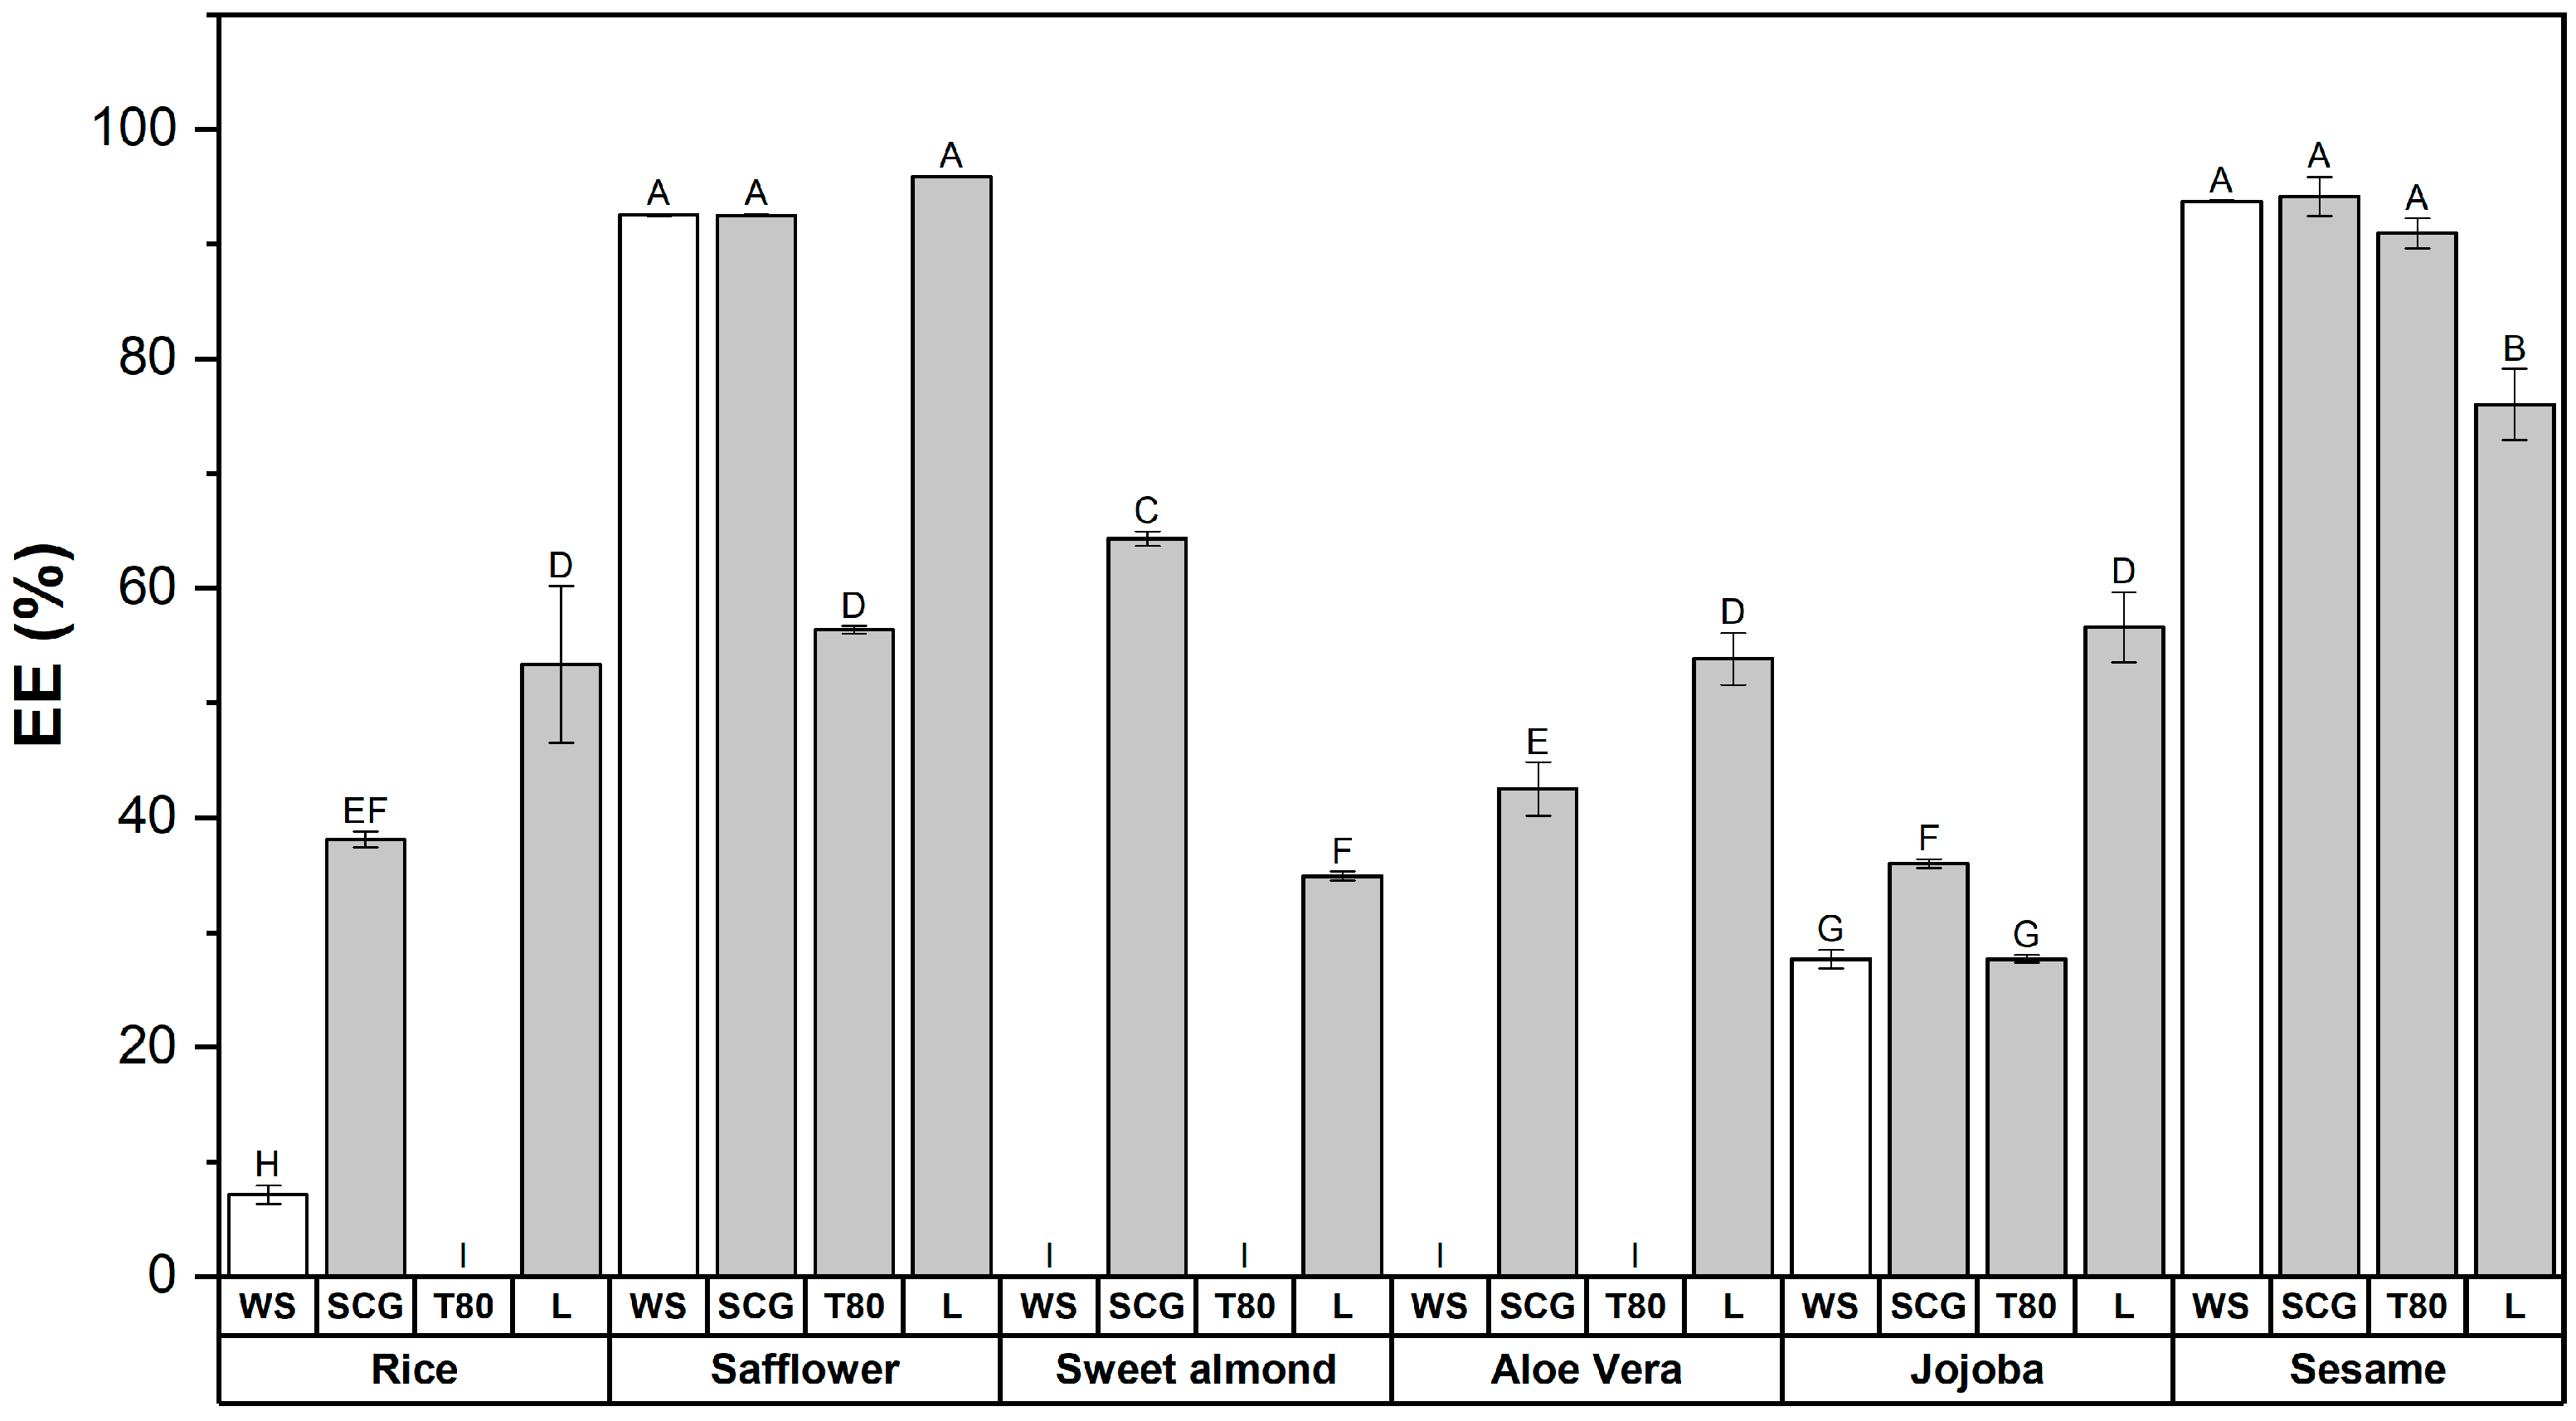
Following freeze-drying, the resulting systems exhibited EE ranging from 0 to 95%, Figure 9. Without surfactant (WS), GA yielded high encapsulation efficiencies for certain oils, particularly safflower and sesame (93% and 94%, respectively). In contrast, rice oil showed low EE (7%), while sweet almond and aloe vera oils exhibited negligible encapsulation; jojoba oil displayed intermediate performance (28%). This behavior indicates that the intrinsic properties of the core oil strongly influence how efficiently droplets are entrapped by the GA matrix. The strong dependence of EE on oil identity observed in this study is fully consistent with the mechanisms described by Huang et al., who demonstrated that core retention is governed primarily by the hydrophobicity, interfacial behavior, and aqueous-phase migration propensity of the oil [25]. In our system, oils such as safflower and sesame, highly hydrophobic triacylglycerol oils containing natural amphiphilic minor lipids, achieved high EE even without added surfactant. Beyond hydrophobicity and aqueous-phase migration discussed earlier, the composition of the oil itself, particularly its unsaponifiable fraction, also plays a decisive role in emulsion stability and encapsulation behavior. Ogrodowska et al. demonstrated that vegetable oils differ markedly in their content of minor components such as sterols, tocopherols, phenolic compounds, and phospholipids, and that these unsaponifiable constituents significantly affect droplet formation and emulsion stability [26]. Oils richer in amphiphilic unsaponifiable compounds can reduce interfacial tension and, more importantly, reinforce the interfacial film, suppressing coalescence and oil migration during processing; any reduction in apparent droplet size is therefore a secondary outcome, whereas improved core retention after drying primarily reflects a more robust interfacial layer. This aligns closely with our results: safflower and sesame oils, which contain relatively high levels of natural minor lipids with interfacial activity (e.g., sesamin, sesamolin, tocopherols), achieved the highest EE even without added surfactant, whereas rice, almond and aloe oils, typically poorer in amphiphilic unsaponifiable matter or containing components that stiffen the oil–water interface, exhibited very low EE without the use of surfactant.
The addition of SCG or lecithin systematically improved EE for the oils that were poorly encapsulated without surfactant (rice, sweet almond, aloe vera), whereas with Tween 80, the EE remained zero for these same oils. This can be supported by Machado et al., who show that lecithin, rich in phosphatidylcholine, forms highly stable bilayers and vesicular structures at the oil–water interface, reducing permeability and oil loss during processing; this provides a mechanistic explanation for the high EE obtained with lecithin in our emulsions and the poor performance of Tween 80, which does not form similarly cohesive interfacial structures [27]. In line with this, Banasaz et al. reported that glutamate-based amino-acid surfactants strongly adsorb at the oil–water interface and form compact, negatively charged interfacial layers that provide electrostatic stabilization and minimize droplet coalescence, offering a clear rationale for the high EI and EE values obtained with SCG in our formulations compared with the non-ionic Tween 80 [28]. More broadly, Holmberg et al. demonstrated that glutamate-derived surfactants form densely packed, hydrogen–bonded interfacial monolayers with enhanced mechanical robustness, particularly in combination with hydrophilic polymers, which is fully consistent with the strong interfacial stabilization achieved by SCG in the presence of GA in our system [29].
For the other oils, the EE using Tween 80 was inferior to those obtained with lecithin or SCG and, in a few cases, even lower than the WS formulations. These results align with our emulsion data, where Tween 80 produced small but highly polydisperse and unstable droplets (low EI, high PDI), indicating that a small z-average alone is not sufficient to guarantee high EE; rather, EE is maximized when the surfactant promotes a robust GA–surfactant interfacial film that limits coalescence and oil migration during drying.
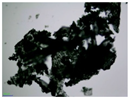
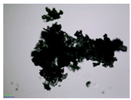
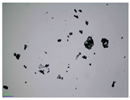
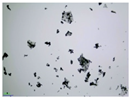
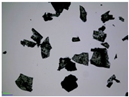
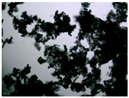
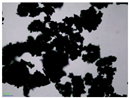
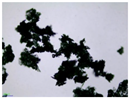
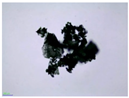
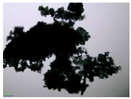
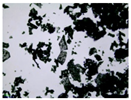
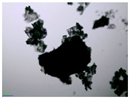
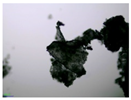
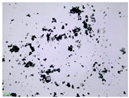
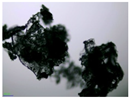
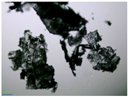
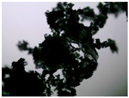
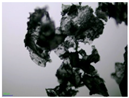
Optical microscopy was used as a qualitative tool to visually compare the powders before and after hexane washing (Table 2). After washing, samples exhibiting higher encapsulation efficiencies tended to show more aggregated particle structures, which is consistent with a higher level of oil retention within the matrix and reduced removal of surface oil. Conversely, powders associated with low encapsulation efficiencies appeared more dispersed after washing, consistent with greater extraction of non-encapsulated oil. Although these observations are qualitative and were obtained at low magnification, they provide supportive visual evidence that complements the quantitative EE results.
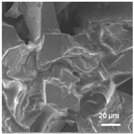
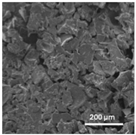
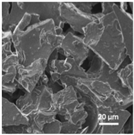
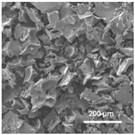
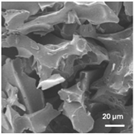
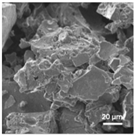
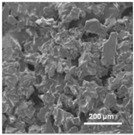
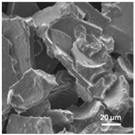
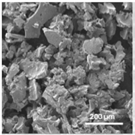
To complement the optical microscopy observations and better relate encapsulation performance to microstructure, SEM was carried out on two representative systems with contrasting EE behavior: sesame oil, which showed consistently high EE (94%) both without surfactant and with SCG, and sweet almond oil, which exhibited very low EE without surfactant (0%) but a marked improvement upon SCG addition (64%), Table 3. Overall, SEM images showed predominantly irregular flake-/plate-like particles, consistent with a collapsed gum arabic matrix formed during freeze-drying rather than perfectly spherical capsules. In sweet almond powders, the WS formulation appeared weakly consolidated and became more disrupted after hexane washing, supporting extensive removal of non-encapsulated oil, whereas the SCG formulation displayed a more cohesive, compact morphology that was better preserved after washing, consistent with enhanced oil retention and higher EE. In contrast, sesame powders appeared compact and structurally robust both with and without SCG, and hexane washing induced only minor changes, in agreement with the high EE observed under both conditions.

4. Conclusions

This study systematically evaluated the combined effects of oil load, surfactant type, and surfactant concentration on the emulsion properties and encapsulation performance of GA–based microcapsules produced by freeze-drying. By jointly analyzing droplet size (z-average), PDI, EI, viscosity, and EE, clear structure–function relationships were established.
The oil-to-GA ratio was identified as a critical parameter. Formulations with a high oil load (oil:GA = 1:0.3) were unsuitable for microencapsulation (EE = 0%), indicating that the available GA is insufficient to form a continuous protective matrix during drying, leading to extensive oil migration and surface oil removal. In contrast, with GA-rich formulations (oil:GA = 1:3), it was possible to achieve high encapsulation efficiencies, depending on both the oil type and the surfactant used. Tween 80 promoted extensive droplet break-up and produced the smallest apparent droplet sizes; however, the resulting emulsions were highly polydisperse and kinetically unstable, yielding very low EI and zero EE for several oils. These results demonstrate that minimizing droplet size alone is not sufficient to ensure efficient encapsulation. In contrast, SCG and lecithin promoted more cohesive interfacial architectures, leading to higher emulsification stability and significantly improved EE at low concentration (0.1%).
Oils rich in hydrophobic triacylglycerols and amphiphilic unsaponifiable components (e.g., safflower and sesame) were efficiently encapsulated even in the absence of added surfactant, whereas oils such as rice, sweet almond, and aloe vera required interfacial reinforcement by SCG or lecithin to achieve meaningful encapsulation. These findings confirm that oil hydrophobicity, interfacial activity, and minor lipid composition critically influence oil retention during drying.
This study demonstrates that high encapsulation efficiencies can be obtained through a simple encapsulation approach relying solely on natural-origin components, making it suitable for food, cosmetic, and nutraceutical applications.

Supplementary Materials

The following supporting information can be downloaded at: https://www.mdpi.com/article/10.3390/colloids10010022/s1, Table S1: Exact formulation of rice oil-GA emulsions prepared at different oil:GA ratios, without surfactant and with Tween 80, SCG or Lecithin at 0.1, 0.5 and 1%; Table S2: Exact formulation of oil-GA emulsions prepared with different oils at an oil:GA ratio of 1:3, without surfactant or with 0.1% SCG, Tween 80 or lecithin. Figure S1: Particle size distributions of rice oil-GA emulsions (oil:GA = 1:3) prepared without surfactant (A), or with 0.1% SCG (B), Tween 80 (C), or Lecithin (D). Figure S2: Particle size distributions of safflower oil-GA emulsions (oil:GA = 1:3) prepared without surfactant (A), or with 0.1% SCG (B), Tween 80 (C), or Lecithin (D). Figure S3: Particle size distributions of sweet almond-GA emulsions (oil:GA = 1:3) prepared without surfactant (A), or with 0.1% SCG (B), Tween 80 (C), or Lecithin (D). Figure S4: Particle size distributions of aloe vera-GA emulsions (oil:GA = 1:3) prepared without surfactant (A), or with 0.1% SCG (B), Tween 80 (C), or Lecithin (D). Figure S5: Particle size distributions of jojoba-GA emulsions (oil:GA = 1:3) prepared without surfactant (A), or with 0.1% SCG (B), Tween 80 (C), or Lecithin (D). Figure S6: Particle size distributions of sesame emulsions (oil:GA = 1:3) prepared without surfactant (A), or with 0.1% SCG (B), Tween 80 (C), or Lecithin (D).

Author Contributions

Conceptualization, E.M.; methodology, E.M. and M.L.C.; validation, F.E.A.; investigation, E.M., M.L.C., and C.F.J.; resources, F.E.A.; writing—original draft preparation, E.M.; writing—review and editing, M.L.C., C.F.J., A.A.S.A., F.E.A., M.L., and D.R.; supervision, F.E.A.; project administration, D.R.; funding acquisition, D.R. All authors have read and agreed to the published version of the manuscript.

Funding

This research was funded by COMPETE 2030, Portugal 2030, and the European Union, through the project Adikte—Sustainable Beauty Products (No. 14342).

Data Availability Statement

The data presented in this study are available in this article.

Acknowledgments

The authors acknowledge COMPETE 2030, Portugal 2030, and the European Union for the funded project.

Conflicts of Interest

Authors Elodie Melro, Marta L. Correia, Carolina F. Jesus, Andreia A. S. Alves and Filipe E. Antunes are employed by Science 351–Disruptive & Sustainable R&D Innovations, Lda. Margarida Lindo and Daniel Ribeiro are employed by Gph–Laboratory Services, Lda. The authors declare no commercial or financial relationships that could be construed as a potential conflict of interest.

Abbreviations

The following abbreviations are used in this manuscript:
DLSDynamic Light Scattering
EEEncapsulation efficiency
EIEmulsification index
GAGum arabic
HₑHeight of the emulsified layer
HₜTotal height of the sample
LLecithin
PDIPolydispersity index
SSurfactant
SCGSodium cocoyl glutamate
T80Tween 80
WSWithout surfactant

References

  1. Al-Hamayda, A.; Abu-Jdayil, B.; Ayash, M.; Tannous, J. Advances in Microencapsulation Techniques Using Arabic Gum: A Comprehensive Review. Ind. Crops Prod. 2023, 205, 117556. [Google Scholar] [CrossRef] [Scilit]
  2. Santos, M.G.; Bozza, F.T.; Thomazini, M.; Favaro-Trindade, C.S. Microencapsulation of Xylitol by Double Emulsion Followed by Complex Coacervation. Food Chem. 2015, 171, 32–39. [Google Scholar] [CrossRef] [Scilit]
  3. Comunian, T.A.; Thomazini, M.; Alves, A.J.G.; de Matos Junior, F.E.; de Carvalho Balieiro, J.C.; Favaro-Trindade, C.S. Microencapsulation of Ascorbic Acid by Complex Coacervation: Protection and Controlled Release. Food Res. Int. 2013, 52, 373–379. [Google Scholar] [CrossRef] [Scilit]
  4. Rocha-Selmi, G.A.; Bozza, F.T.; Thomazini, M.; Bolini, H.M.A.; Fávaro-Trindade, C.S. Microencapsulation of Aspartame by Double Emulsion Followed by Complex Coacervation to Provide Protection and Prolong Sweetness. Food Chem. 2013, 139, 72–78. [Google Scholar] [CrossRef] [Scilit]
  5. Rocha-Selmi, G.A.; Theodoro, A.C.; Thomazini, M.; Bolini, H.M.A.; Favaro-Trindade, C.S. Double Emulsion Stage Prior to Complex Coacervation Process for Microencapsulation of Sweetener Sucralose. J. Food Eng. 2013, 119, 28–32. [Google Scholar] [CrossRef] [Scilit]
  6. Dong, Z.; Ma, Y.; Hayat, K.; Jia, C.; Xia, S.; Zhang, X. Morphology and Release Profile of Microcapsules Encapsulating Peppermint Oil by Complex Coacervation. J. Food Eng. 2011, 104, 455–460. [Google Scholar] [CrossRef] [Scilit]
  7. Alvim, I.D.; Grosso, C.R.F. Microparticles Obtained by Complex Coacervation: Influence of the Type of Reticulation and the Drying Process on the Release of the Core Material. Food Sci. Technol. 2010, 30, 1069–1076. [Google Scholar] [CrossRef] [Scilit]
  8. Sánchez, F.M.; García, F.; Calvo, P.; Bernalte, M.J.; González-Gómez, D. Optimization of Broccoli Microencapsulation Process by Complex Coacervation Using Response Surface Methodology. Innov. Food Sci. Emerg. Technol. 2016, 34, 243–249. [Google Scholar] [CrossRef] [Scilit]
  9. de Souza, V.B.; Thomazini, M.; Echalar Barrientos, M.A.; Nalin, C.M.; Ferro-Furtado, R.; Genovese, M.I.; Favaro-Trindade, C.S. Functional Properties and Encapsulation of a Proanthocyanidin-Rich Cinnamon Extract (Cinnamomum Zeylanicum) by Complex Coacervation Using Gelatin and Different Polysaccharides. Food Hydrocoll. 2018, 77, 297–306. [Google Scholar] [CrossRef] [Scilit]
  10. de Conto, L.C.; Grosso, C.R.F.; Gonçalves, L.A.G. Chemometry as Applied to the Production of Omega-3 Microcapsules by Complex Coacervation with Soy Protein Isolate and Gum Arabic. LWT 2013, 53, 218–224. [Google Scholar] [CrossRef] [Scilit]
  11. Eratte, D.; McKnight, S.; Gengenbach, T.R.; Dowling, K.; Barrow, C.J.; Adhikari, B.P. Co-Encapsulation and Characterisation of Omega-3 Fatty Acids and Probiotic Bacteria in Whey Protein Isolate–Gum Arabic Complex Coacervates. J. Funct. Foods 2015, 19, 882–892. [Google Scholar] [CrossRef] [Scilit]
  12. Akram, S.; Bao, Y.; Butt, M.S.; Shukat, R.; Afzal, A.; Huang, J.Y. Fabrication and Characterization of Gum Arabic- and Maltodextrin-Based Microcapsules Containing Polyunsaturated Oils. J. Sci. Food Agric. 2021, 101, 6384–6394. [Google Scholar] [CrossRef] [Scilit] [PubMed]
  13. Kausadikar, S.; Gadhave, A.D.; Waghmare, J. Microencapsulation of Lemon Oil by Spray Drying and Its Application in Flavour Tea. Adv. Appl. Sci. Res. 2015, 6, 69–78. [Google Scholar]
  14. Akhavan Mahdavi, S.; Jafari, S.M.; Assadpoor, E.; Dehnad, D. Microencapsulation Optimization of Natural Anthocyanins with Maltodextrin, Gum Arabic and Gelatin. Int. J. Biol. Macromol. 2016, 85, 379–385. [Google Scholar] [CrossRef] [Scilit]
  15. Li, C.; Wang, J.; Shi, J.; Huang, X.; Peng, Q.; Xue, F. Encapsulation of Tomato Oleoresin Using Soy Protein Isolate-Gum Aracia Conjugates as Emulsifier and Coating Materials. Food Hydrocoll. 2015, 45, 301–308. [Google Scholar] [CrossRef] [Scilit]
  16. Kha, T.C.; Nguyen, M.H.; Roach, P.D.; Stathopoulos, C.E. A Storage Study of Encapsulated Gac (Momordica Cochinchinensis) Oil Powder and Its Fortification into Foods. Food Bioprod. Process. 2015, 96, 113–125. [Google Scholar] [CrossRef] [Scilit]
  17. Nunes, G.L.; de Araújo Etchepare, M.; Cichoski, A.J.; Zepka, L.Q.; Jacob Lopes, E.; Barin, J.S.; de Moraes Flores, É.M.; da Silva, C.D.B.; de Menezes, C.R. Inulin, Hi-Maize, and Trehalose as Thermal Protectants for Increasing Viability of Lactobacillus Acidophilus Encapsulated by Spray Drying. LWT 2018, 89, 128–133. [Google Scholar] [CrossRef] [Scilit]
  18. da Silva, L.C.; Castelo, R.M.; Cheng, H.N.; Biswas, A.; Furtado, R.F.; Alves, C.R. Methods of Microencapsulation of Vegetable Oil: Principles, Stability and Applications—A Minireview. Food Technol. Biotechnol. 2022, 60, 308–320. [Google Scholar] [CrossRef] [Scilit]
  19. Sousa, V.I.; Parente, J.F.; Marques, J.F.; Forte, M.A.; Tavares, C.J. Microencapsulation of Essential Oils: A Review. Polymers 2022, 14, 1730. [Google Scholar] [CrossRef] [Scilit]
  20. Chranioti, C.; Tzia, C. Arabic Gum Mixtures as Encapsulating Agents of Freeze-Dried Fennel Oleoresin Products. Food Bioprocess Technol. 2014, 7, 1057–1065. [Google Scholar] [CrossRef] [Scilit]
  21. Pereira de Oliveira, J.; Almeida, O.P.; Campelo, P.H.; Carneiro, G.; de Oliveira Ferreira Rocha, L.; Santos, J.H.P.M.; Gomes da Costa, J.M. Tailoring the Physicochemical Properties of Freeze-Dried Buriti Oil Microparticles by Combining Inulin and Gum Arabic as Encapsulation Agents. LWT 2022, 161, 113372. [Google Scholar] [CrossRef] [Scilit]
  22. Oancea, A.-M.; Hasan, M.; Vasile, A.M.; Barbu, V.; Enachi, E.; Bahrim, G.; Râpeanu, G.; Silvi, S.; Stănciuc, N. Functional Evaluation of Microencapsulated Anthocyanins from Sour Cherries Skins Extract in Whey Proteins Isolate. LWT 2018, 95, 129–134. [Google Scholar] [CrossRef] [Scilit]
  23. Su, Y.; Sun, Y.; McClements, D.J.; Chang, C.; Li, J.; Xiong, W.; Sun, Y.; Cai, Y.; Gu, L.; Yang, Y. Encapsulation of Amino Acids in Water-in-Oil-in-Water Emulsions Stabilized by Gum Arabic and Xanthan Gum. Int. J. Biol. Macromol. 2022, 220, 1493–1500. [Google Scholar] [CrossRef] [Scilit]
  24. Todorović, A.; Šturm, L.; Salević-Jelić, A.; Lević, S.; Osojnik Črnivec, I.G.; Prislan, I.; Skrt, M.; Bjeković, A.; Poklar Ulrih, N.; Nedović, V. Encapsulation of Bilberry Extract with Maltodextrin and Gum Arabic by Freeze-Drying: Formulation, Characterisation, and Storage Stability. Processes 2022, 10, 1991. [Google Scholar] [CrossRef] [Scilit]
  25. Huang, Q.; Mills, T.; Zhang, Z. The Effect of Core Oil on the Encapsulation Efficiency and Mechanical Properties of Microcapsules Prepared Using Complex Coacervation Followed by Spray Drying/Coating. Int. J. Food Sci. Technol. 2025, 60, vvae005. [Google Scholar] [CrossRef] [Scilit]
  26. Ogrodowska, D.; Tanska, M.; Brandt, W.; Czaplicki, S. Impact of the Encapsulation Process by Spray- And Freeze-Drying on the Properties and Composition of Powders Obtained from Cold-Pressed Seed Oils with Various Unsaturated Fatty Acids. Pol. J. Food Nutr. Sci. 2020, 70, 241–252. [Google Scholar] [CrossRef] [Scilit]
  27. Machado, A.R.; Assis, L.M.A.; Machado, M.I.R.; Souza-Soares, L.A. Importance of Lecithin for Encapsulation Processes. Afr. J. Food Sci. 2014, 8, 176–183. [Google Scholar] [CrossRef] [Scilit]
  28. Banasaz, S.; Morozova, K.; Ferrentino, G.; Scampicchio, M. Encapsulation of Lipid-Soluble Bioactives by Nanoemulsions. Molecules 2020, 25, 3966. [Google Scholar] [CrossRef] [Scilit]
  29. Holmberg, K.; Bilén, F.; Bordes, R. Development of Amino Acid-Based Surfactants: From Synthesis to Applications. Curr. Opin. Colloid Interface Sci. 2025, 75, 101884. [Google Scholar] [CrossRef] [Scilit]
Figure 1. Chemical structure of gum arabic.
Colloids 10 00022 g001
Figure 2. Schematic diagram of the emulsion preparation and encapsulation steps.
Colloids 10 00022 g002
Figure 3. Z-average (bars) and PDI (squares) of emulsions prepared at two rice oil-to-gum arabic (GA) ratios (1:3 and 1:0.3) using Tween 80, sodium cocoyl glutamate (SCG), and lecithin, compared with the surfactant-free system (0% S, white bars). Values are a mean ± SD (n = 3). Different letters indicate statistically significant differences (one-way ANOVA followed by Tukey’s HSD, α = 0.05).
Colloids 10 00022 g003
Figure 4. Emulsification index (EI) at 24 h of emulsions prepared at two rice oil-to-gum arabic (GA) ratios (1:3 and 1:0.3) using Tween 80, sodium cocoyl glutamate (SCG), and lecithin, compared with the surfactant-free system (0% S, white bars).
Colloids 10 00022 g004
Figure 5. Viscosity at 10 Pa of emulsions prepared at two rice oil-to-gum arabic (GA) ratios (1:3 and 1:0.3) using Tween 80, sodium cocoyl glutamate (SCG), and lecithin, compared with the surfactant-free system (0% S, white bars).
Colloids 10 00022 g005
Figure 6. Z-average (columns) and PDI (squares) of oil-GA emulsions (1:3) prepared with different oils, without surfactant (WS, white bars) or with 0.1% surfactant (SCG, Tween 80 (T80) and Lecithin (L). Values are a mean ± SD (n = 3). Different letters indicate statistically significant differences (one-way ANOVA followed by Tukey’s HSD, α = 0.05).
Colloids 10 00022 g006
Figure 7. Emulsification index (EI) at 24 h of oil-GA emulsions (1:3) prepared with different oils, without surfactant (WS, white bars) or with 0.1% surfactant (SCG, Tween 80 (T80) and Lecithin (L).
Colloids 10 00022 g007
Figure 8. Viscosity at 10 Pa of oil-GA emulsions (1:3) prepared with different oils, without surfactant (WS, white bars) or with 0.1% surfactant (SCG, Tween 80 (T80), and Lecithin (L).
Colloids 10 00022 g008
Figure 9. Encapsulation efficiency (EE), expressed as percentage (%), of oil–GA microcapsules (1:3) prepared with different oils, WS (white bars) or with 0.1% surfactant (SCG, T80 or L). Values are mean ± SD (n = 3). Different letters indicate statistically significant differences (one-way ANOVA followed by Tukey’s HSD, α = 0.05).
Colloids 10 00022 g009
Table 1. Encapsulation efficiency of rice oil microcapsules produced from GA emulsions at different oil:GA ratios and surfactant conditions. Values are mean ± SD (n = 3). Different letters indicate statistically significant differences (one-way ANOVA followed by Tukey’s HSD, α = 0.05).
Oil:GAWithout SurfactantTween 80SCGLecithin
0.1%0.5%1%0.1%0.5%1%0.1%0.5%1%
1:37.2 ± 0.8 d00038.0 ± 0.7 b0053 ± 7 a21 ± 2 c0
1:0.30000000000
Table 2. Optical microscopy images (4× amplification) of GA microcapsules containing different oils, after freeze-drying (before hexane washing) and after hexane washing.
Without SurfactantSCGTween 80Lecithin
RiceBefore hexane washingColloids 10 00022 i001Colloids 10 00022 i002Colloids 10 00022 i003Colloids 10 00022 i004
After hexane washingColloids 10 00022 i005Colloids 10 00022 i006Colloids 10 00022 i007Colloids 10 00022 i008
SafflowerBefore hexane washingColloids 10 00022 i009Colloids 10 00022 i010Colloids 10 00022 i011Colloids 10 00022 i012
After hexane washingColloids 10 00022 i013Colloids 10 00022 i014Colloids 10 00022 i015Colloids 10 00022 i016
Sweet
almond
Before hexane washingColloids 10 00022 i017Colloids 10 00022 i018Colloids 10 00022 i019Colloids 10 00022 i020
After hexane washingColloids 10 00022 i021Colloids 10 00022 i022Colloids 10 00022 i023Colloids 10 00022 i024
Aloe VeraBefore hexane washingColloids 10 00022 i025Colloids 10 00022 i026Colloids 10 00022 i027Colloids 10 00022 i028
After hexane washingColloids 10 00022 i029Colloids 10 00022 i030Colloids 10 00022 i031Colloids 10 00022 i032
JojobaBefore hexane washingColloids 10 00022 i033Colloids 10 00022 i034Colloids 10 00022 i035Colloids 10 00022 i036
After hexane washingColloids 10 00022 i037Colloids 10 00022 i038Colloids 10 00022 i039Colloids 10 00022 i040
SesameBefore hexane washingColloids 10 00022 i041Colloids 10 00022 i042Colloids 10 00022 i043Colloids 10 00022 i044
After hexane washingColloids 10 00022 i045Colloids 10 00022 i046Colloids 10 00022 i047Colloids 10 00022 i048
Table 3. Representative SEM micrographs (200× and 1000×) of freeze-dried oil–GA (1:3) powders prepared with sweet almond and sesame oils, without surfactant (WS) or with 0.1% SCG, acquired before and after hexane washing.
Without SurfactantSCG
Sweet
almond
Before
hexane
washing
Colloids 10 00022 i049Colloids 10 00022 i050Colloids 10 00022 i051Colloids 10 00022 i052
After
hexane washing
Colloids 10 00022 i053Colloids 10 00022 i054Colloids 10 00022 i055Colloids 10 00022 i056
SesameBefore
Hexane
washing
Colloids 10 00022 i057Colloids 10 00022 i058Colloids 10 00022 i059Colloids 10 00022 i060
After
Hexane
washing
Colloids 10 00022 i061Colloids 10 00022 i062Colloids 10 00022 i063Colloids 10 00022 i064
Disclaimer/Publisher’s Note: The statements, opinions and data contained in all publications are solely those of the individual author(s) and contributor(s) and not of MDPI and/or the editor(s). MDPI and/or the editor(s) disclaim responsibility for any injury to people or property resulting from any ideas, methods, instructions or products referred to in the content.