Article

Ion-Exchange Synthesis of Molybdenum Blue Dispersions: Colloidal Properties, Self-Assembly and Thermal Phase Transformation


1
Department of Colloid Chemistry, D. Mendeleev University of Chemical Technology of Russia, Miusskaya Sq., 9, 125047 Moscow, Russia
2
Moscow Center for Advanced Studies, Kulakova Str. 20, 123592 Moscow, Russia
3
Department of General Physics, Perm National Research Polytechnic University, 614990 Perm, Russia
*
Author to whom correspondence should be addressed.
Colloids Interfaces 2026, 10(1), 23; https://doi.org/10.3390/colloids10010023
Submission received: 25 December 2025 / Revised: 31 January 2026 / Accepted: 11 February 2026 / Published: 13 February 2026
(This article belongs to the Section Colloidal Systems)

Abstract

High-purity precursors are often required for the targeted synthesis of functional nanomaterials. Molybdenum blue (MB) dispersions are promising precursors for the production of functional materials based on molybdenum oxides and carbides. Here, a facile, spectator-ion-free synthesis of molybdenum blue dispersions via a tailored ion-exchange strategy is reported. By eliminating extrinsic counter-ions, we achieve uniform toroidal nanoclusters (~3.5 nm) of {Mo154} wheel-type molybdenum blue with a precise mixed-valence Mo5+/Mo6+ framework and long time aggregative and sedimentation stability. Moderate reduction ratios yield crystalline monoclinic MoO2, whereas high reduction ratios drive an in situ carbothermal reduction, selectively yielding hexagonal β-Mo2C/η-MoC phases. This approach establishes a versatile, scalable pathway for engineering molybdenum blue nanoparticles as precursors for oxide- and carbide-based advanced functional materials.

Graphical Abstract

1. Introduction

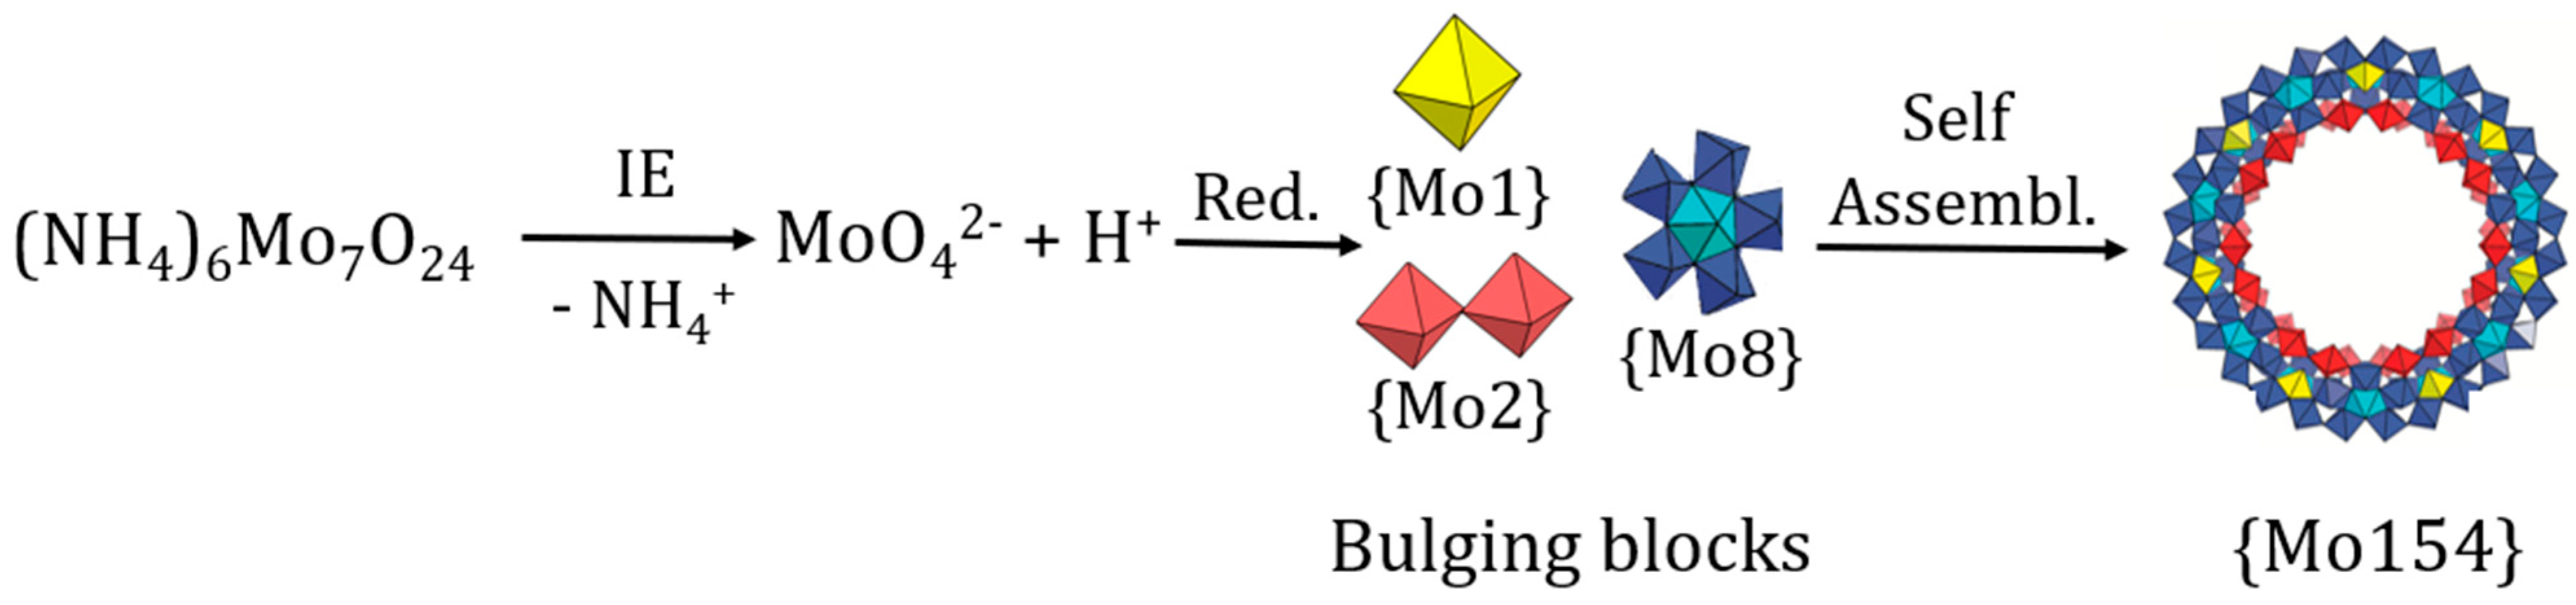
In recent years, there has been steady interest in the synthesis of a unique class of compounds of molybdenum blue and their use to produce molybdenum oxide/carbide materials [1,2]. Molybdenum blues (polyoxometalate molybdenum blue complexes) are discrete multianionic clusters and are composed of repeating Mo building units. MB wheels such as {Mo176} and {Mo154} are made from pentagon-centered {Mo8} building blocks joined by equal numbers of {Mo1} and {Mo2} dimer units with the ring sizes of the MB wheels modulated by the {Mo2} [3].
However, under typical synthetic conditions, these units do not necessarily exist as isolated molecular entities but rather form dispersed nanoscale clusters and colloidal assemblies characterized by structural heterogeneity and dynamic self-organization. The electronic configuration of their mixed-valence Mo5+/Mo6+ framework gives rise to an intense intervalence charge-transfer band, responsible for their characteristic deep-blue color and pronounced redox activity [4].
MBs can be viewed as colloidal dispersions of giant polyoxomolybdate clusters, typically stabilized in aqueous media by electrostatic and hydration forces [1,2,3,4]. These nano scaled structures (2–5 nm) may further assemble into larger supramolecular aggregates while retaining dynamic equilibrium with the solvent. The colloidal nature of MBs bridges molecules and particles, imparting unique optical and rheological behavior. Their stability and aggregation depend sensitively on pH, ionic strength, and the presence of coordinating ligands, making them valuable model systems for studying this kind of dispersed system [5,6,7,8,9].
These properties make MBs highly attractive for cutting-edge applications. Recent breakthroughs have demonstrated their use as efficient catalysts for hydrogen evolution reactions [10,11], active components in memristive devices for neuromorphic computing [12], and functional materials for electrochemical and biosensing platforms [13].
Beyond their intrinsic properties, MBs also serve as versatile precursors for molybdenum-based materials, including oxides and carbides. Controlled thermal or chemical conversion of MBs enables retention of their nanoscale architecture, leading to products with high surface area, uniform porosity, and finely dispersed active sites [14,15,16,17]. This molecularly derived route provides a soft-chemistry pathway to engineer nanostructured catalysts and conductive materials for energy and environmental technologies.
Molybdenum blues have also found promising applications in sol–gel processes, where their colloidal nature and mixed-valence redox activity enable controlled sol–gel transition and structural templating. Acting as a reactive precursor, MBs can facilitate the formation of homogeneous metal–oxide or metal–carbon networks and hybrid materials under mild conditions, providing a versatile pathway toward advanced catalytic and electronic coatings [15,18].
Despite growing interest, realizing the full potential of MBs remains challenging. Conventional synthesis methods—typically involving chemical or photochemical reduction of Mo(VI) precursors—often rely on harsh reagents, multi-step protocols, and non-ambient conditions [19,20]. A persistent drawback is the formation of ionic by-products that compromise material purity and performance, necessitating cumbersome post-synthesis purification steps.
To address these limitations, ion-exchange synthesis has recently emerged as a sustainable route for producing high-purity nanomaterials [21,22,23,24,25,26]. However, its use for metastable clusters such as MBs has been hindered by precursor instability, which usually triggers uncontrolled oxide precipitation rather than controlled polyoxoanion assembly.
In this work, we demonstrate a direct, room-temperature ion-exchange-assisted reduction method for pristine molybdenum blue dispersions. By generating isopolymolybdic acid in situ, we decouple cluster formation from ionic background effects. Crucially, we reveal that the molar ratio of the organic reducing agent serves as a “phase-selector.” This control allows for the deterministic synthesis of either semiconducting oxides or metal carbides via an intrinsic carbothermal mechanism, providing a robust platform for phase-selective nanomaterial engineering.

2. Materials and Methods

2.1. Materials

Ammonium heptamolybdate tetrahydrate ((NH4)6Mo7O24·4H2O), L-ascorbic acid (C6H8O6), and potassium tetraiodomercurate(II) (K2[HgI4]) were purchased from CT Lantan (Moscow, Russia). The strongly acidic cation exchange resin KU-2-8 (styrene-divinylbenzene copolymer with sulfonic acid functional groups) was also sourced from CT Lantan. All chemicals were of analytical grade and used as received without further purification. Deionized (DI) water was used for the preparation of all aqueous solutions.

2.2. Synthesis of Molybdenum Blue Colloidal Dispersions

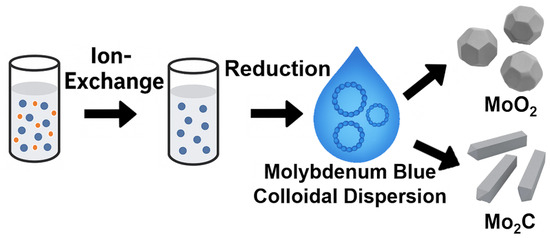
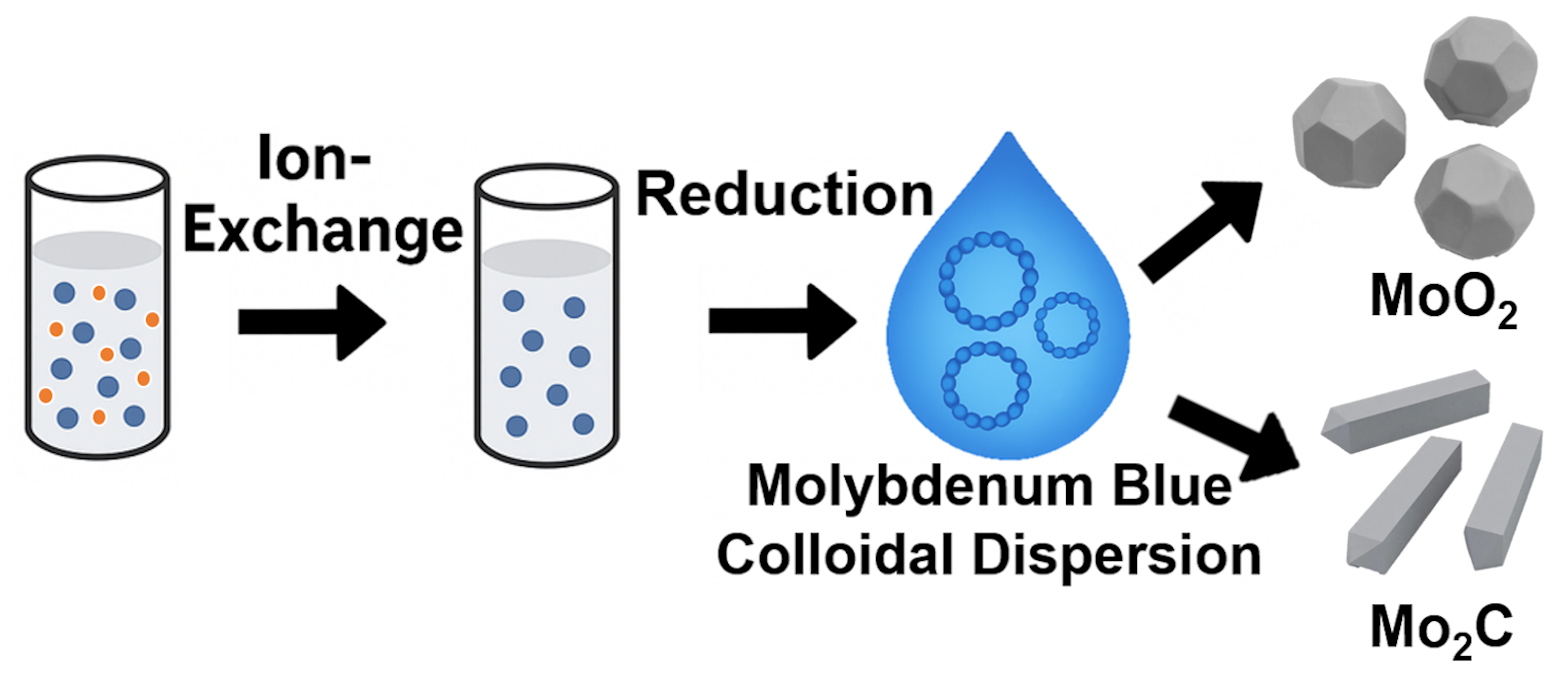
Molybdenum blue dispersions were synthesized via an ion-exchange-assisted reduction method (Figure 1). In a typical procedure, an aqueous solution of ammonium heptamolybdate was passed through a glass column (2 cm diameter, 30 cm length) packed with the KU-2-8 cation exchange resin in its H+ form. This process was performed to generate a solution of isopolymolybdic acid by completely removing ammonium counter-ions. The complete removal of NH4+ ions was qualitatively confirmed using Nessler’s reagent (K2[HgI4]), where the absence of a yellow-brown precipitate indicated a successful exchange.
The resulting isopolymolybdic acid solution, standardized to a molybdenum concentration of 0.3 M, was then chemically reduced by adding a predetermined amount of ascorbic acid. The synthesis was systematically investigated by varying the molar ratio of the reducing agent to molybdenum ([R]/[Mo]) from 0.01 to 5.0. The reaction was carried out at ambient temperature under constant stirring. The progress of the redox reaction was monitored in real time by measuring the oxidation–reduction potential (ORP) of the solution and UV–Vis spectra.

2.3. Characterization Techniques

pH and ORP Measurements: The pH and ORP of the dispersions were monitored using an HI-8314 pH meter–millivoltmeter (Hanna Instruments, Vöhringen, Germany) equipped with a combined glass pH electrode and a platinum electrode. The instrument was calibrated with standard buffer solutions prior to measurements. The measurement uncertainty was ±0.01 for pH and ±1 mV for ORP.
UV–Visible Spectroscopy: absorption spectra were recorded on a Leki SS2110 UV scanning spectrophotometer (MEDIORA OY, Helsinki, Finland). Aliquots of the MB dispersions were diluted 250-fold with HCl solutions of matching pH to prevent particle aggregation or dissolution. Spectra were acquired in the 200–1100 nm range using 10 mm path length quartz cuvettes.
Transmission Electron Microscopy (TEM): The morphology and primary particle size of the synthesized MB nanoparticles were characterized using a JEOL JEM-2100 transmission electron microscope (JEOL Ltd., Akishima, Japan) operated at an accelerating voltage of 200 kV. For sample preparation, a 20 µL droplet of the MB dispersion was deposited onto a carbon-coated copper grid and allowed to air-dry under ambient conditions for 30–40 min. Particle size distributions were obtained by analyzing the acquired TEM micrographs using the ImageJ software (v. 2.1).
Fourier-Transform Infrared (FTIR) Spectroscopy: The structural characterization of the MB material was performed using a Nicolet 380 FTIR spectrometer (Thermo Fisher, Scientific Inc., Waltham, MA, USA) equipped with an Attenuated Total Reflectance (ATR) accessory. Spectra were collected in the wavenumber range of 4000–350 cm−1 with a resolution of 4 cm−1. Prior to analysis, the MB dispersion was dried, and the resulting powder was thoroughly mixed with KBr to prepare a pellet.
Raman spectra of the molybdenum blue dispersions were recorded using a confocal Raman microscope Horiba LabRAM HR Evolution (HORIBA Ltd., Kyoto, Japan). Prior to measurement, the colloidal samples were drop-cast onto cleaned silicon wafers. The laser excitation wavelength was 532 nm, with a laser power at the sample of <1 mW to avoid sample heating or photoreduction. The scattered light was collected in back-scattering geometry, using a 100× objective (NA = 0.90) and a 600 lines/cm diffraction grating. To ensure reproducibility, spectra were collected from no less than three different spots on each film, and their variation was slight. The most typical spectra chosen for subsequent analysis were baseline corrected and normalized to the intensity of the most intense band for comparative analysis. Prior to measurement, the instrument was calibrated with the Si line at 520.7 cm−1.
The zeta potential (ζ) of the molybdenum blue dispersions was determined from electrophoretic mobility measurements using a Photocor Compact-Z instrument (Photocor Ltd., Moscow, Russia). The zeta potential was then obtained from the measured mobility using the Henry equation [27]:
ζ = 3 η 2 ε ε 0 f 1 ( κ r )
where η is the dynamic viscosity of the medium, ε is the dielectric permittivity, r is the radius of the particles, k is the inverse of the thickness of the diffuse part of the double electric layer, and f(κr) is Henry’s correction function. The Oshima correction [28] was applied to estimate f(κr) more accurately:
f 1 κ r = 1 + 0.5 1 + 2.5 κ r 1 + 2 exp κ r 3
The Henry function was computed according to Oshima’s analytical approximation, providing reliable ζ-potential values for colloids with ionic environments. For each sample, at least five independent measurements were performed, and the resulting ζ-potential values were averaged. The standard deviation never exceeded ±3–5 mV, confirming the reproducibility of the method.
Thermogravimetric (TGA) and differential thermal (DTA) analyses were performed using a Combined TG-DSC analyzer ZCT-B (Jing Yi Gao Ke Co., Ltd., Beijing, China). Approximately 10–15 mg of xerogel powder was placed in an alumina crucible and heated from 25 to 1350 °C at a constant rate of 5 °C min−1 under a continuous flow of argon. The instrument simultaneously recorded mass loss and differential thermal signal relative to an inert reference crucible.
X-ray diffraction (XRD) patterns of xerogel samples after thermal treatment (60 min at 900 °C in N2 atmosphere) were recorded using a DX-2700BH diffractometer (Dandong Haoyuan Instrument Co., Ltd., Dandong, China) equipped with a Cu Kα radiation source (λ = 1.5406 Å) operating at 40 kV and 40 mA. The diffraction data were collected in the 2θ range of 20–100° with a step size of 0.02° and a scanning rate of 1–2° min−1. Samples were gently ground into fine powders and mounted on a low-background sample holder. Phase identification was performed by comparing the experimental patterns with reference data from the ICDD PDF-4+ database.
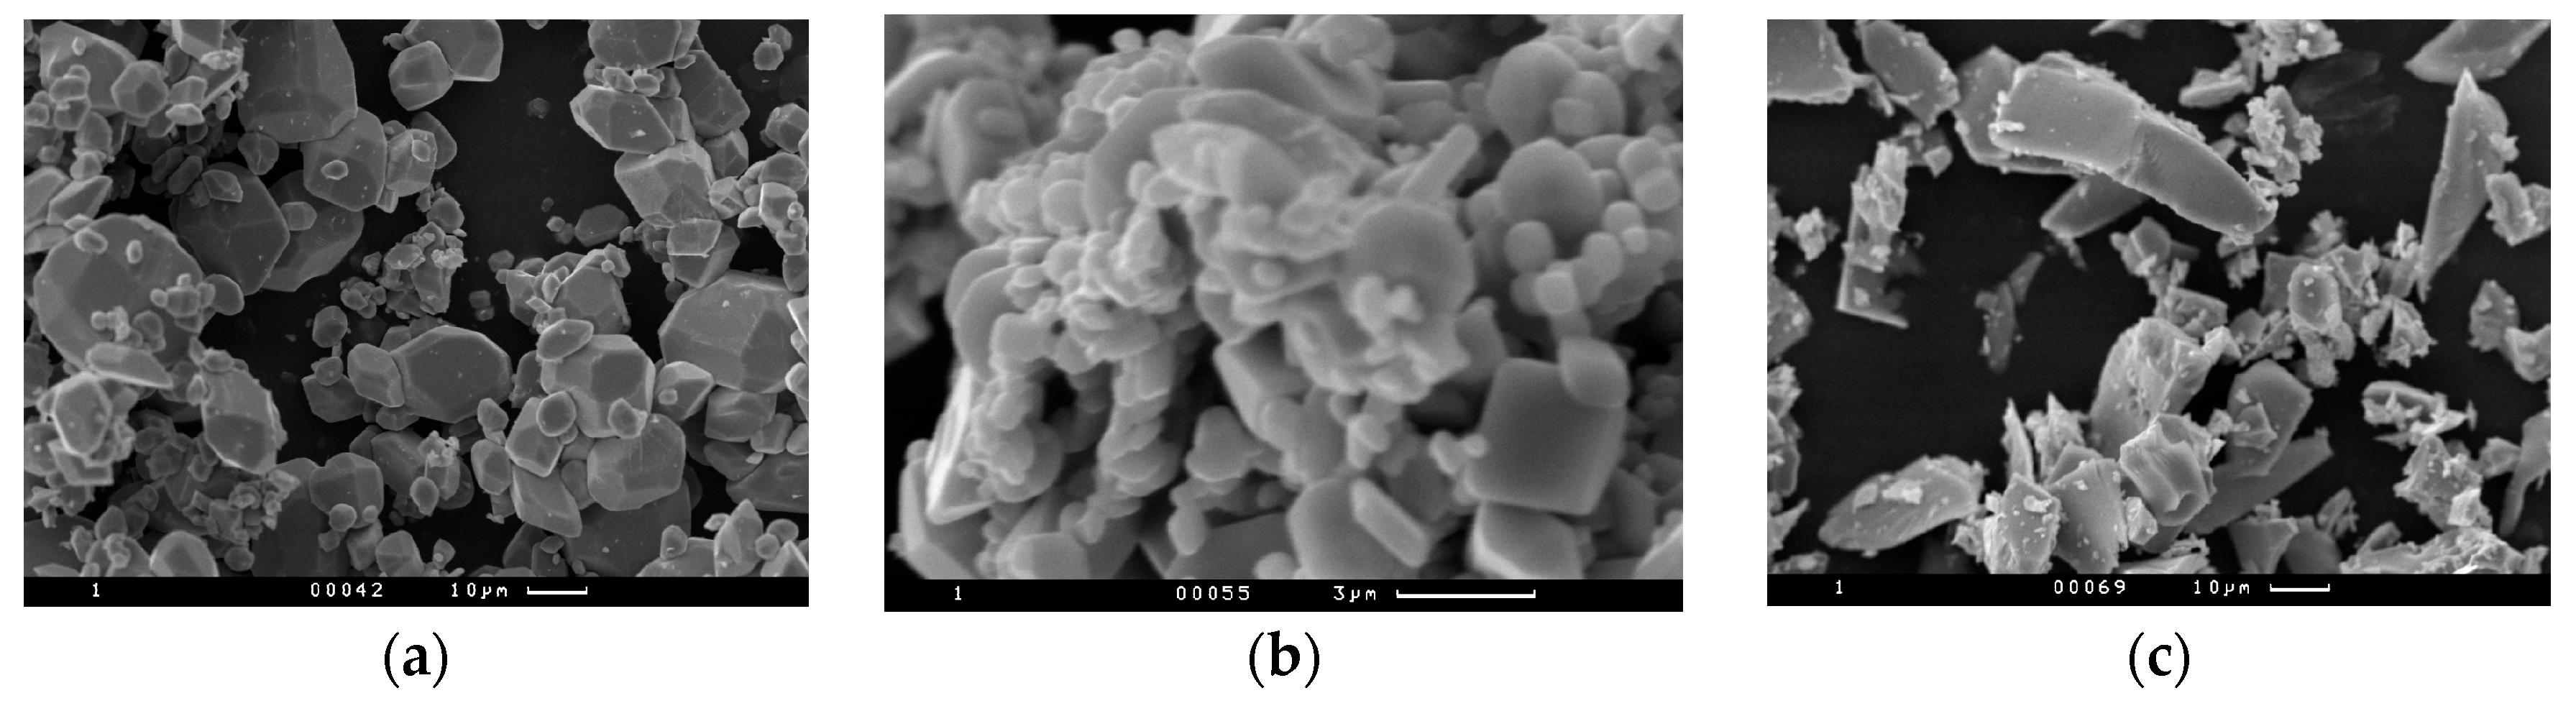
Scanning Electron Microscopy (SEM). The morphological investigation was conducted on the xerogel samples after thermal treatment (60 min at 900 °C in N2 atmosphere) using a JEOL JSM-6510LV Scanning Electron Microscope (JEOL, Tokyo, Japan). The instrument was operated under high vacuum conditions. The particles were sputter-coated with a thin layer of gold (Au). Imaging was carried out at an accelerating voltage typically ranging from 10 to 20 kV.

3. Results

3.1. Synthesis of Molybdenum Blue Dispersion

Dispersion formation occurs within a minute after the addition of the reducing agent, as evidenced by the appearance of a dark blue color of the system.
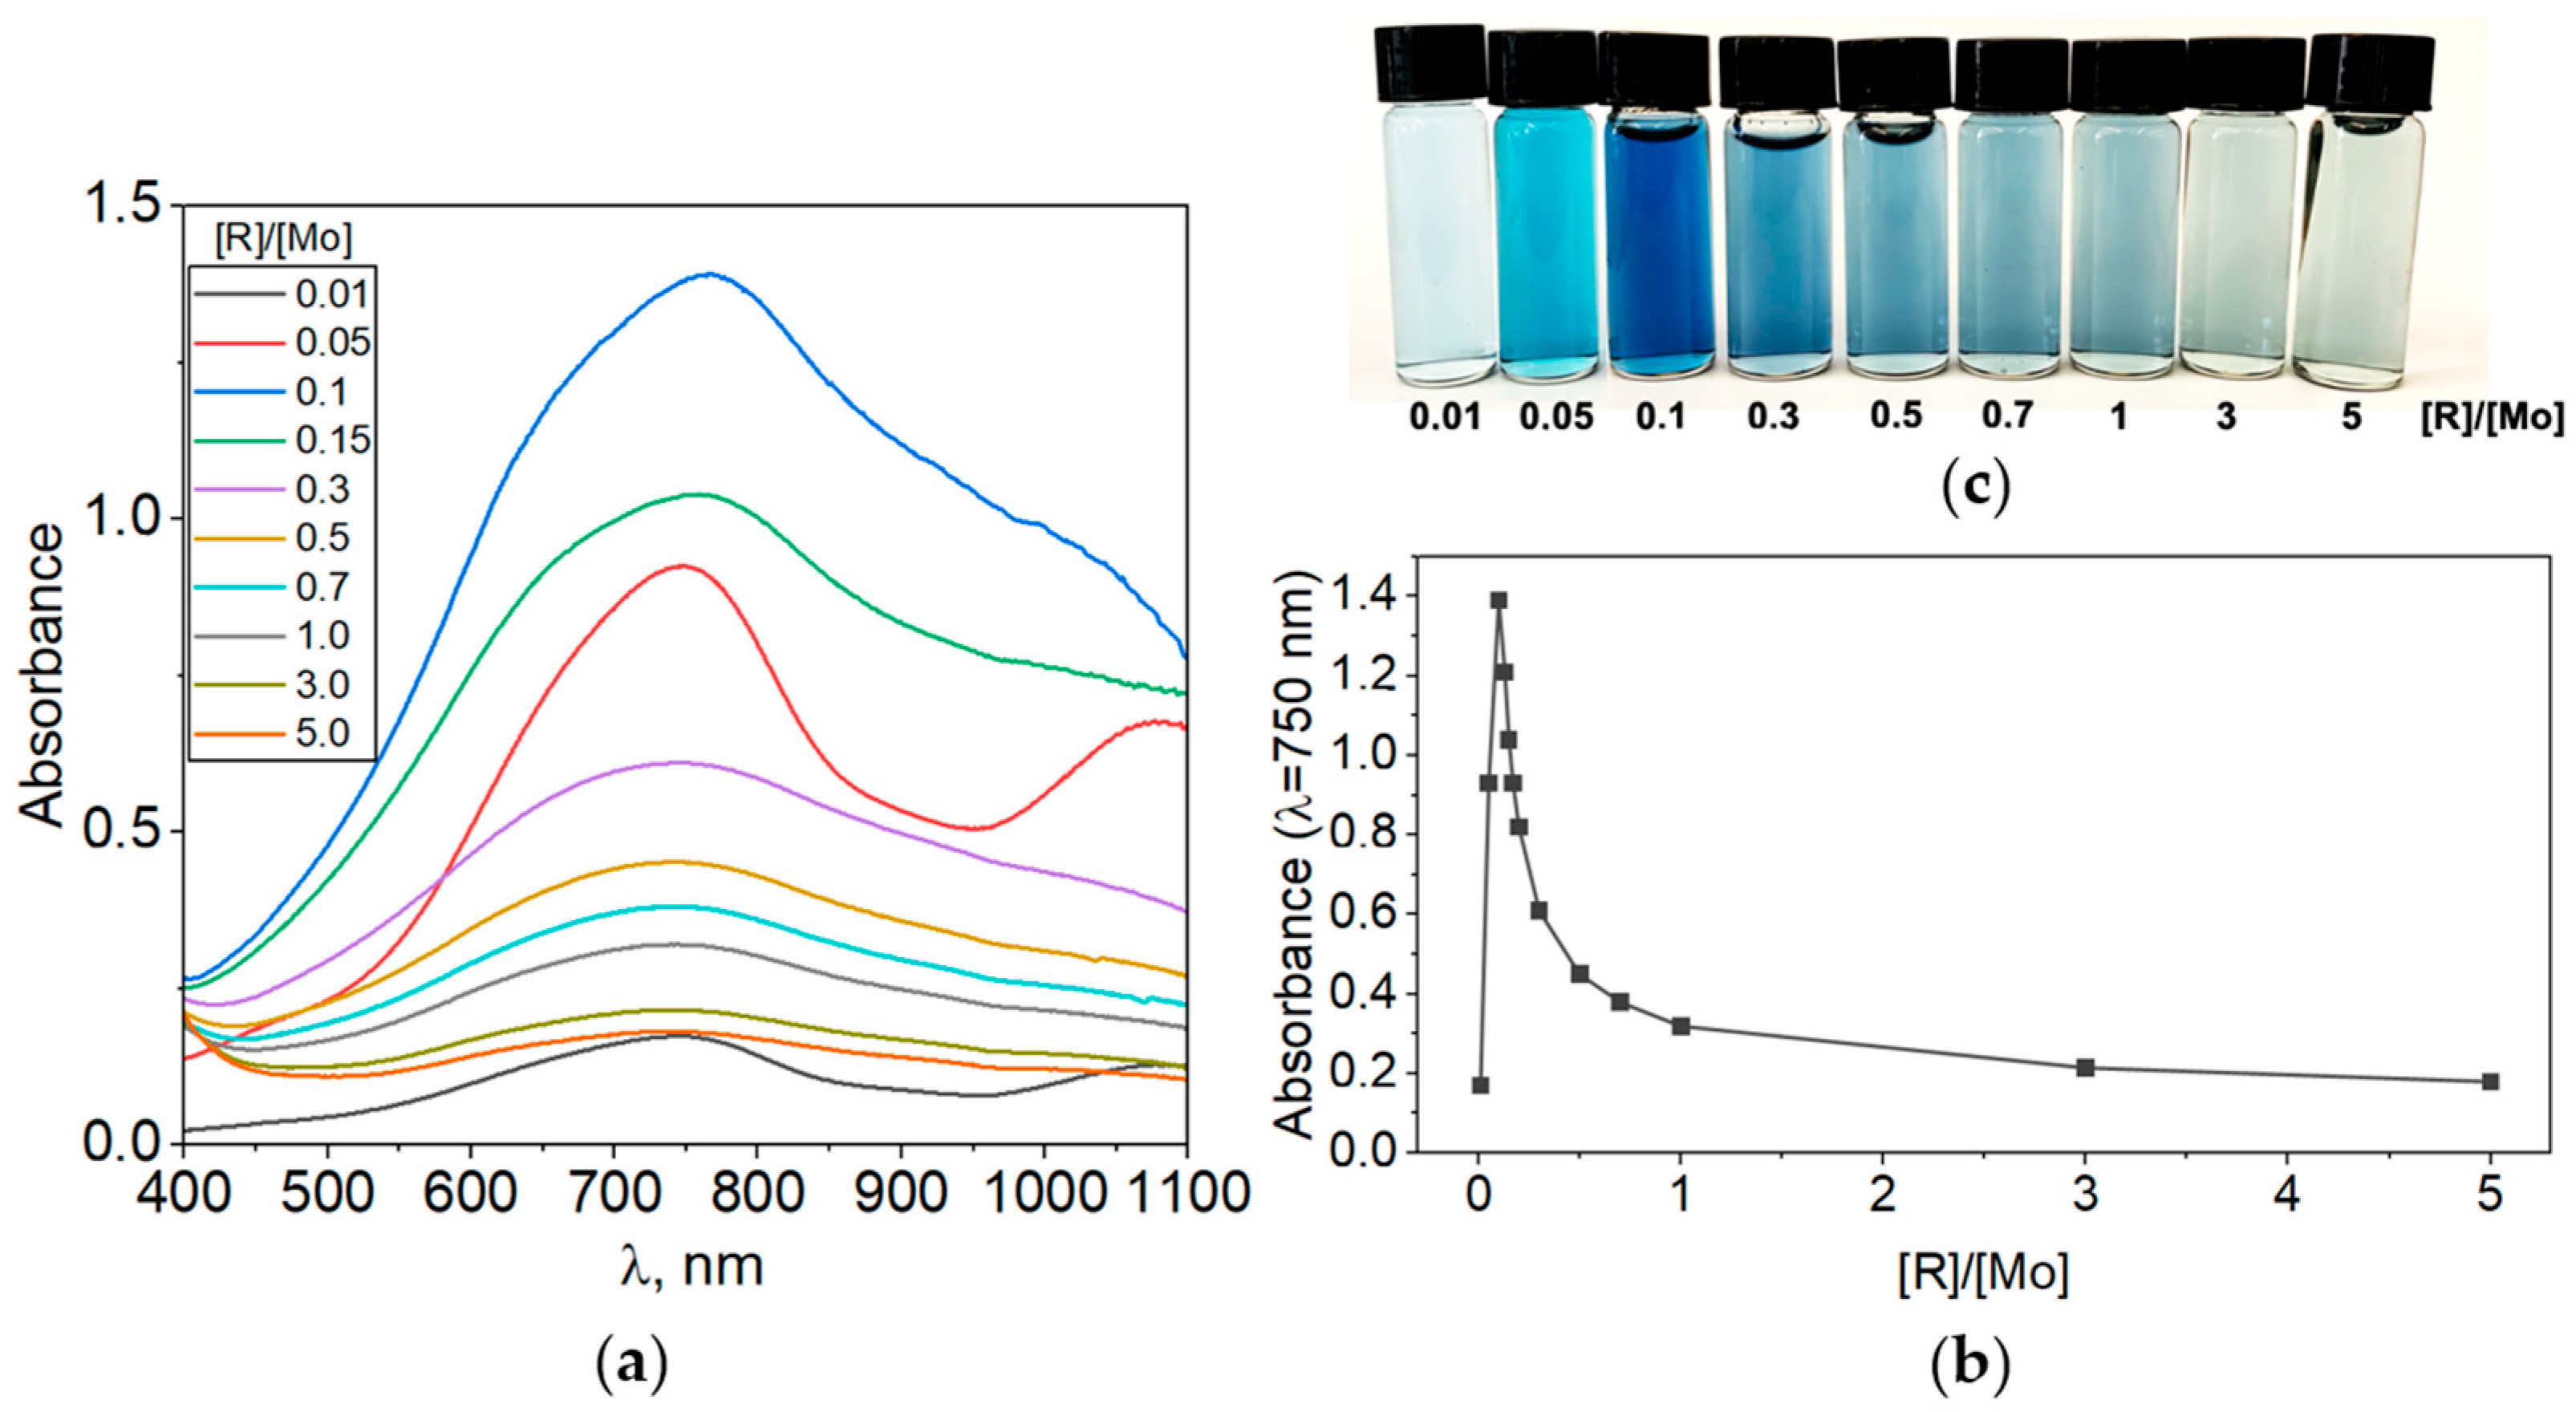
In the synthesized MB dispersions, two distinct behaviors were observed: one subset of samples with molar ratio [R]/[Mo] < 0.1 exhibits both a strong absorption band near ~750 nm and a second, broader absorption band around ~1100 nm; another subset ([R]/[Mo] ≥ 0.1) shows only the ~750 nm feature with no resolvable near-infrared band. The optical absorption profiles (Figure 2a) provide direct insight into the electronic connectivity of the clusters. Dispersions with [R]/[Mo] < 0.1 exhibit a broad near-infrared feature centered at ~1100 nm alongside the characteristic intervalence charge-transfer (IVCT) band at ~750 nm. The presence of the ~750 nm band is well-recognized as arising from an intervalence charge-transfer (IVCT) transition between Mo5+ and Mo6+ centers within the reduced polyoxomolybdate clusters, indicative of partial electronic delocalization in the Mo–O network [29,30]. This NIR band could be attributed to extended polaron delocalization across giant supramolecular assemblies or “wheel-type” {Mo154} architectures [9] that enable longer-distance electron transfer pathways and more delocalized electronic states [7]. The suppression of this feature at higher reduction ratios ([R]/[Mo] ≥ 0.1) suggests a confinement of charge carriers, indicating a transition to electronically isolated cluster units governed by the excess ligand environment. Other factors that may influence this dichotomy could be differences in ligand environment. For instance, a higher degree of reduction or more extensive Mo5+/Mo6+ mixed-valence connectivity may favor the emergence of the ~1100 nm band, whereas partial reduction and isolated cluster entities result only in the ~750 nm absorption [31]. Thus, monitoring the relative intensities and presence/absence of these two absorption bands provides a sensitive spectroscopic probe of degree of reduction, electronic connectivity and cluster isolation in MB colloidal systems.
The dependence of absorbance (λ = 750 nm) on the molar ratio of [R]/[Mo] (Figure 2b,c) exhibits a pronounced maximum at a ratio of approximately 0.1. This well-defined peak indicates the optimal degree of reduction for the formation of stable mixed-valence molybdenum blue species, where the balance between Mo5+ and Mo6+ centers provides the most efficient intervalence charge transfer. Based on this relationship, three representative systems with a molar ratio [R]/[Mo] of 0.05, 0.1, and 1.0 were selected for more detailed investigation in order to elucidate the structural, spectroscopic, and morphological characteristics across different reduction regimes.
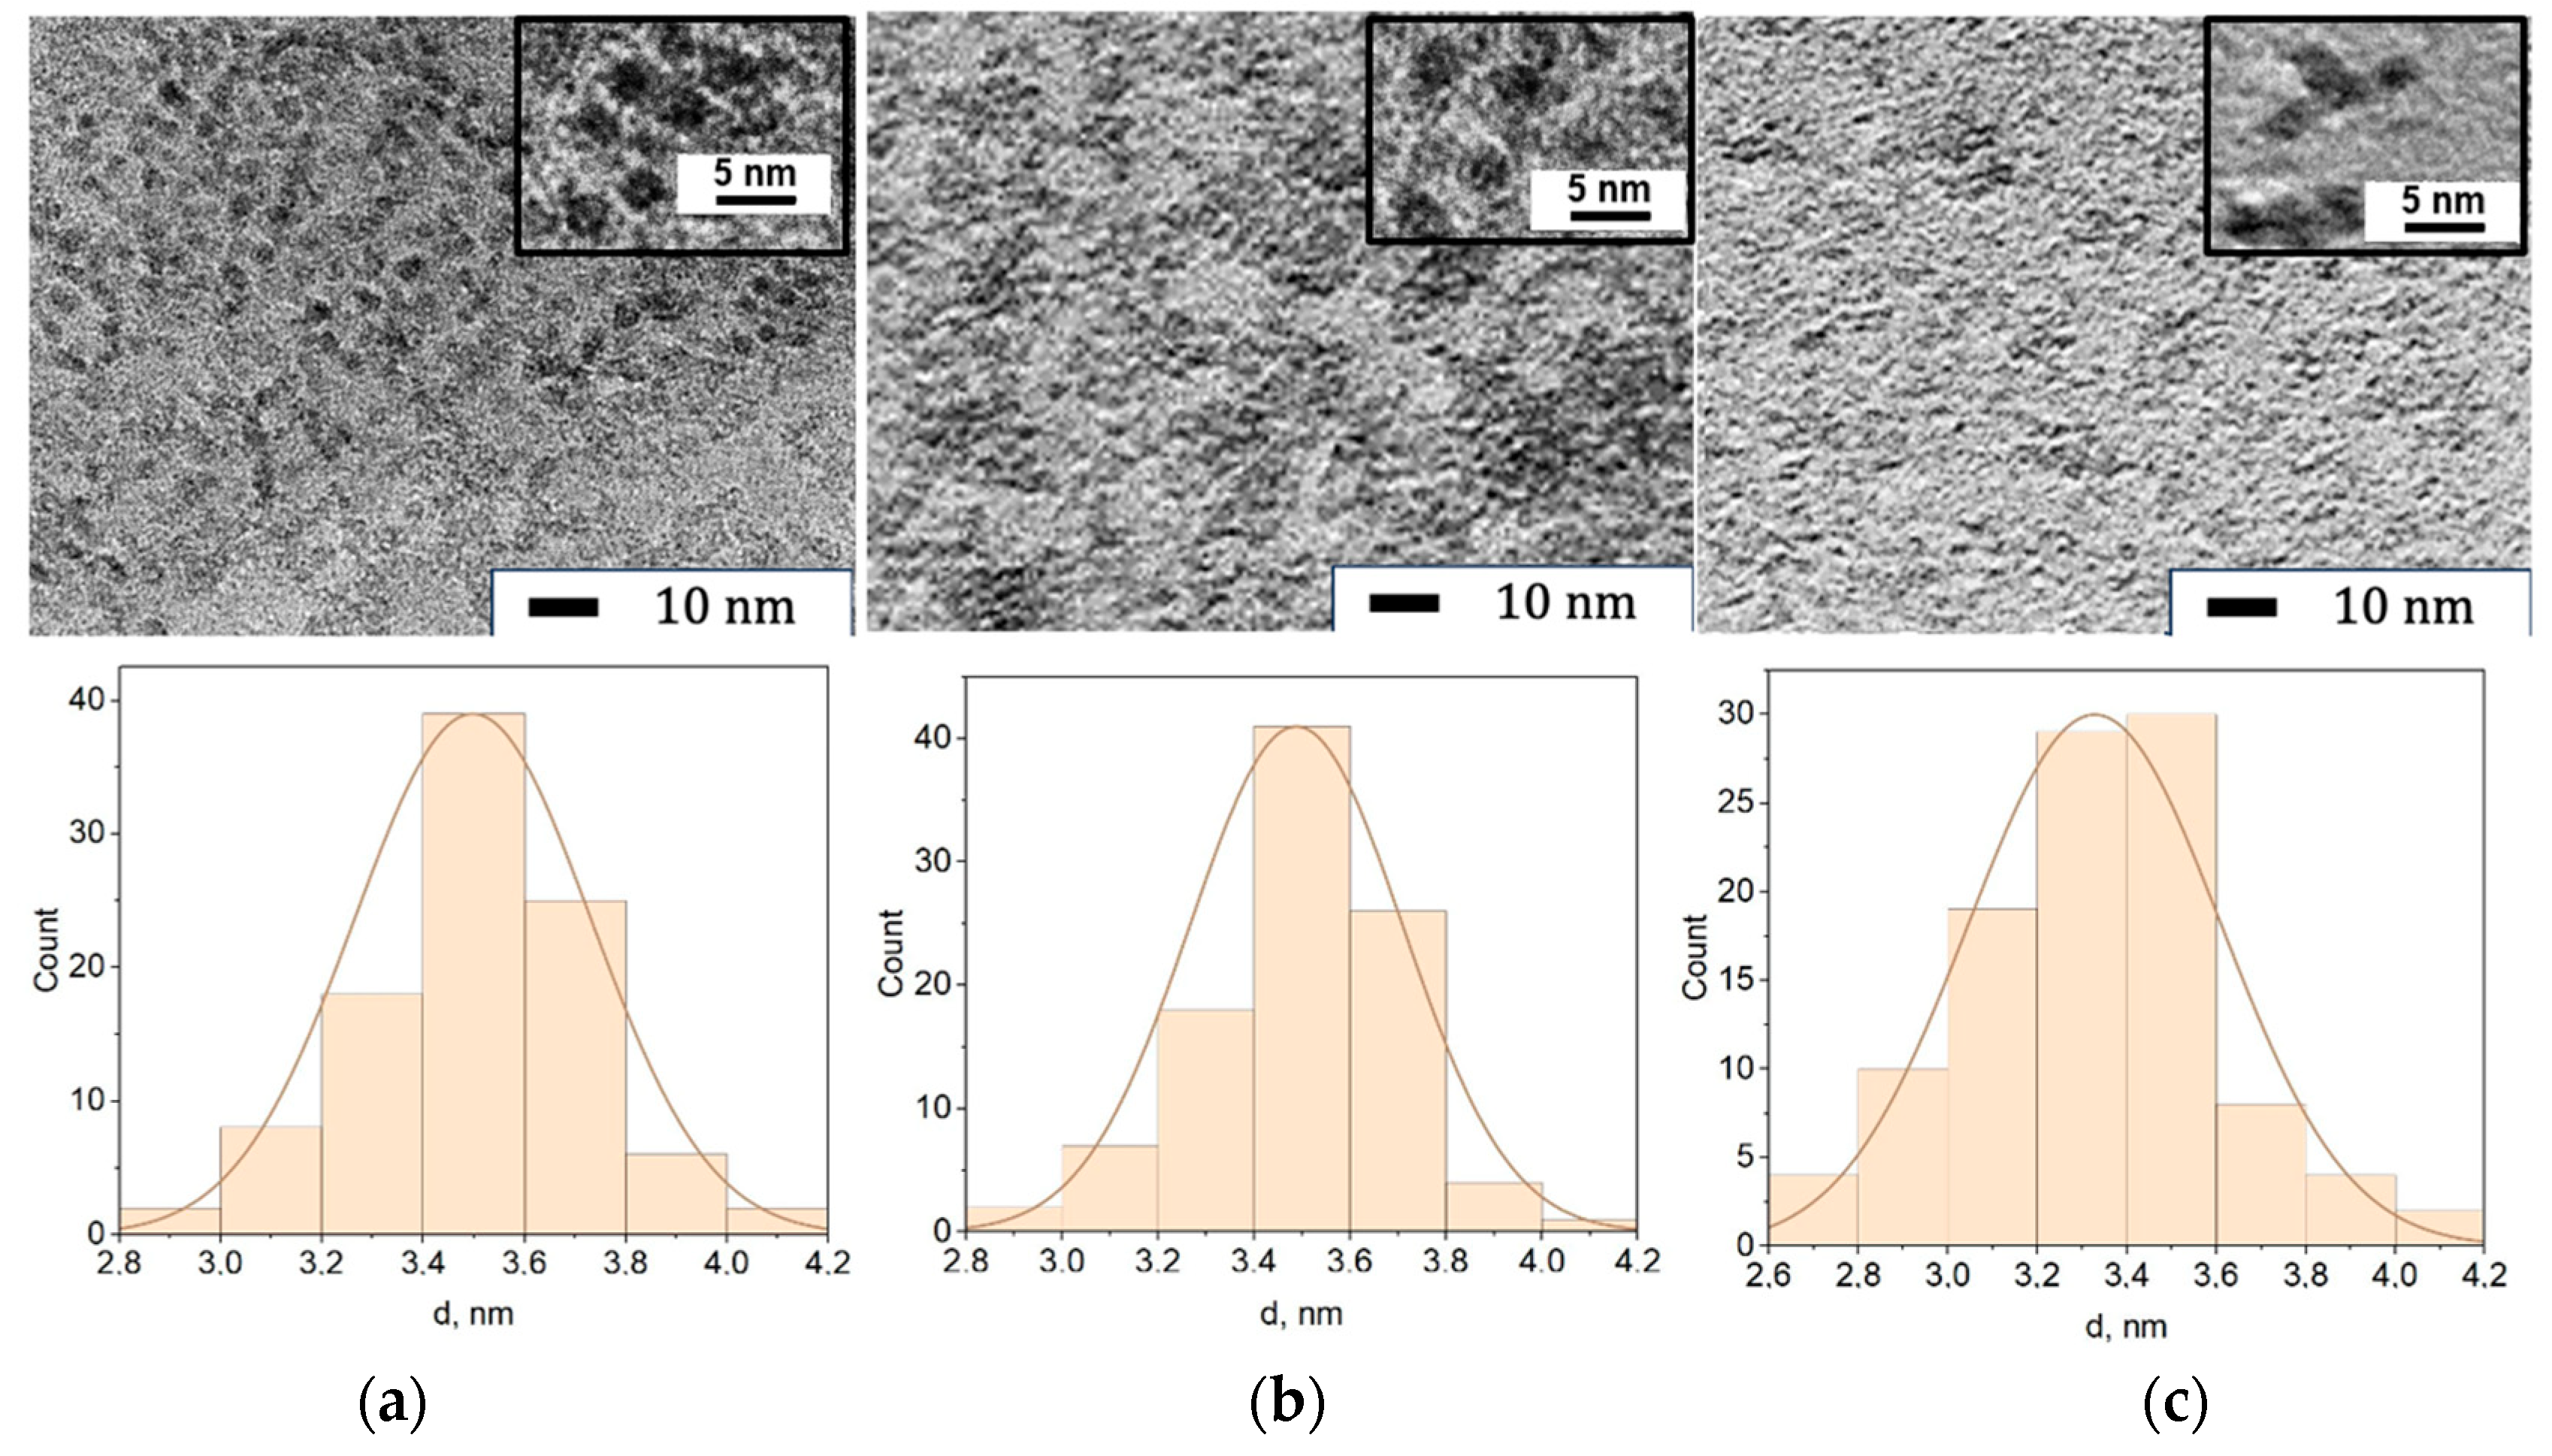
Transmission electron microscopy analysis of the three selected molybdenum blue systems revealed the presence of nearly spherical nanoparticles (Figure 3). In all cases, the particles exhibited well-defined boundaries and a narrow size distribution, with a predominant diameter of approximately 3.5 nm. This size is consistent with the dimensions typically reported for toroidal polyoxomolybdate clusters, such as the classical {Mo154} wheel-type structures [5,9]. The observed morphology suggests that the synthesized colloidal particles retain the characteristic toroidal framework of molybdenum blue clusters, confirming that the ion-exchange synthesis enables the controlled formation of discrete, nanoscale polyoxometalate entities with high structural uniformity.
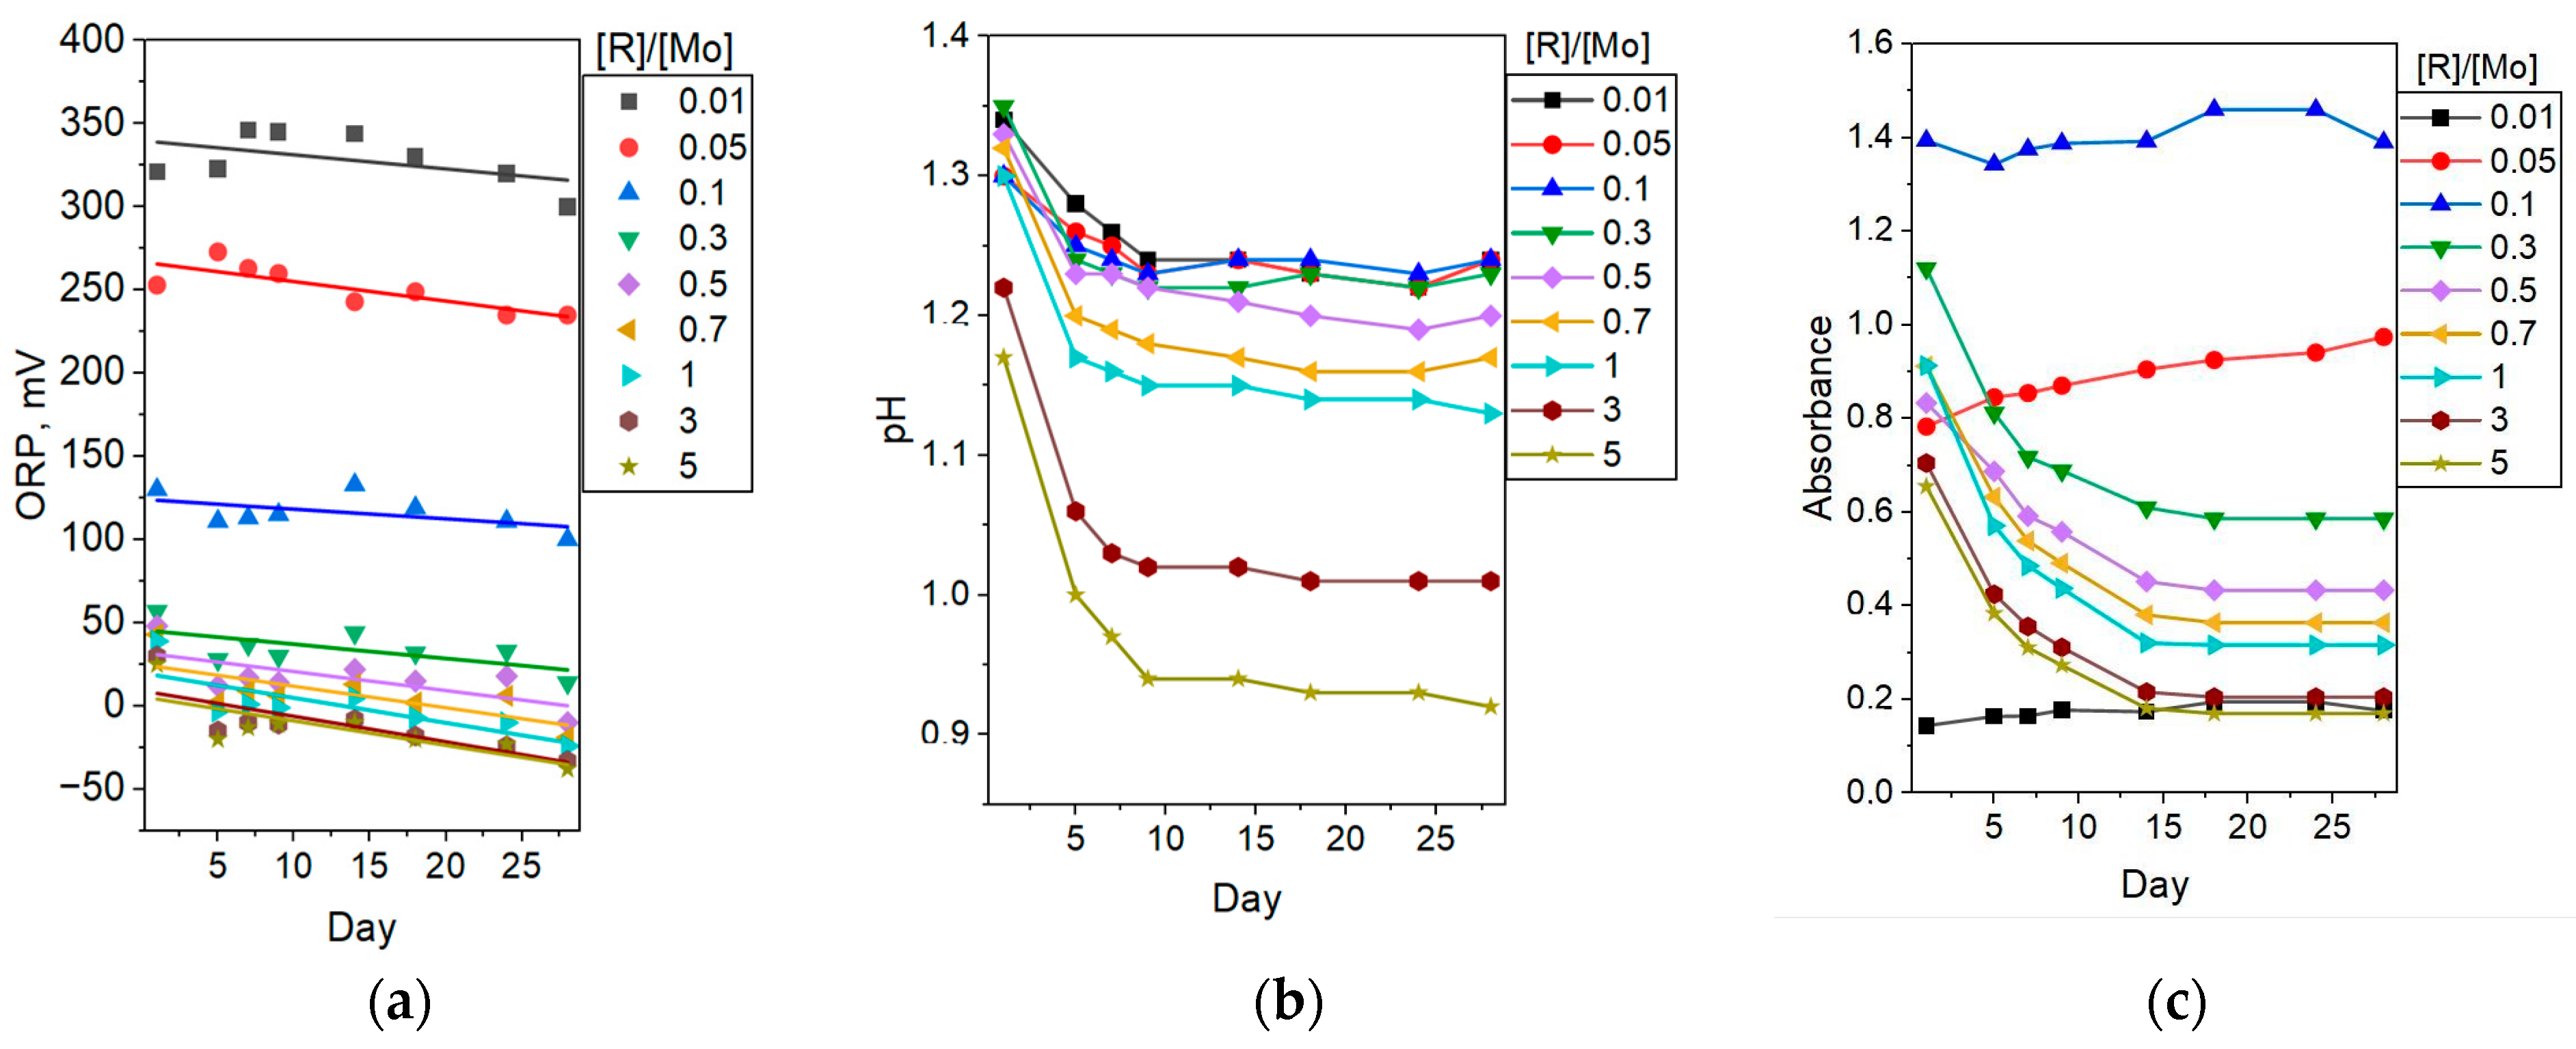
The self-assembly process of the dispersed phase particles was investigated by monitoring the time-dependent changes in redox potential (ORP), pH and optical density (Figure 4). Throughout the observation period, the ORP values remained nearly constant, indicating that no significant oxidation or further reduction of molybdenum centers occurred after the initial synthesis. In contrast, for samples with a [R]/[Mo] above 0.1, the optical density initially decreased during the first stage of aging. This decrease is likely associated with the ongoing process of reduction due to the processes of oxidation of excess ascorbic acid [32]. This process proceeds with the release of gases, which was observed in the experiments conducted in systems with [R]/[Mo] > 0.1, and the higher the ratio, the more gases are formed. This assumption is also supported by the absence of a peak at 1100 nm (UV–Vis spectrum), which characterizes these systems as more reduced. After approximately 14 days, the optical density and pH stabilized, suggesting that the system had reached a dynamic equilibrium corresponding to the completion of the self-assembly process. For samples with ratios below 0.1, the optical density remained nearly unchanged over time, consistent with the formation of more stable cluster species. Based on these observations, the characteristic timescale of dispersed phase self-organization in the synthesized molybdenum blue systems with [R]/[Mo] above 0.1 can be estimated to be about 14 days and for [R]/[Mo] ≤ 0.1 one day.

3.2. Properties of Molybdenum Blues Dispersions

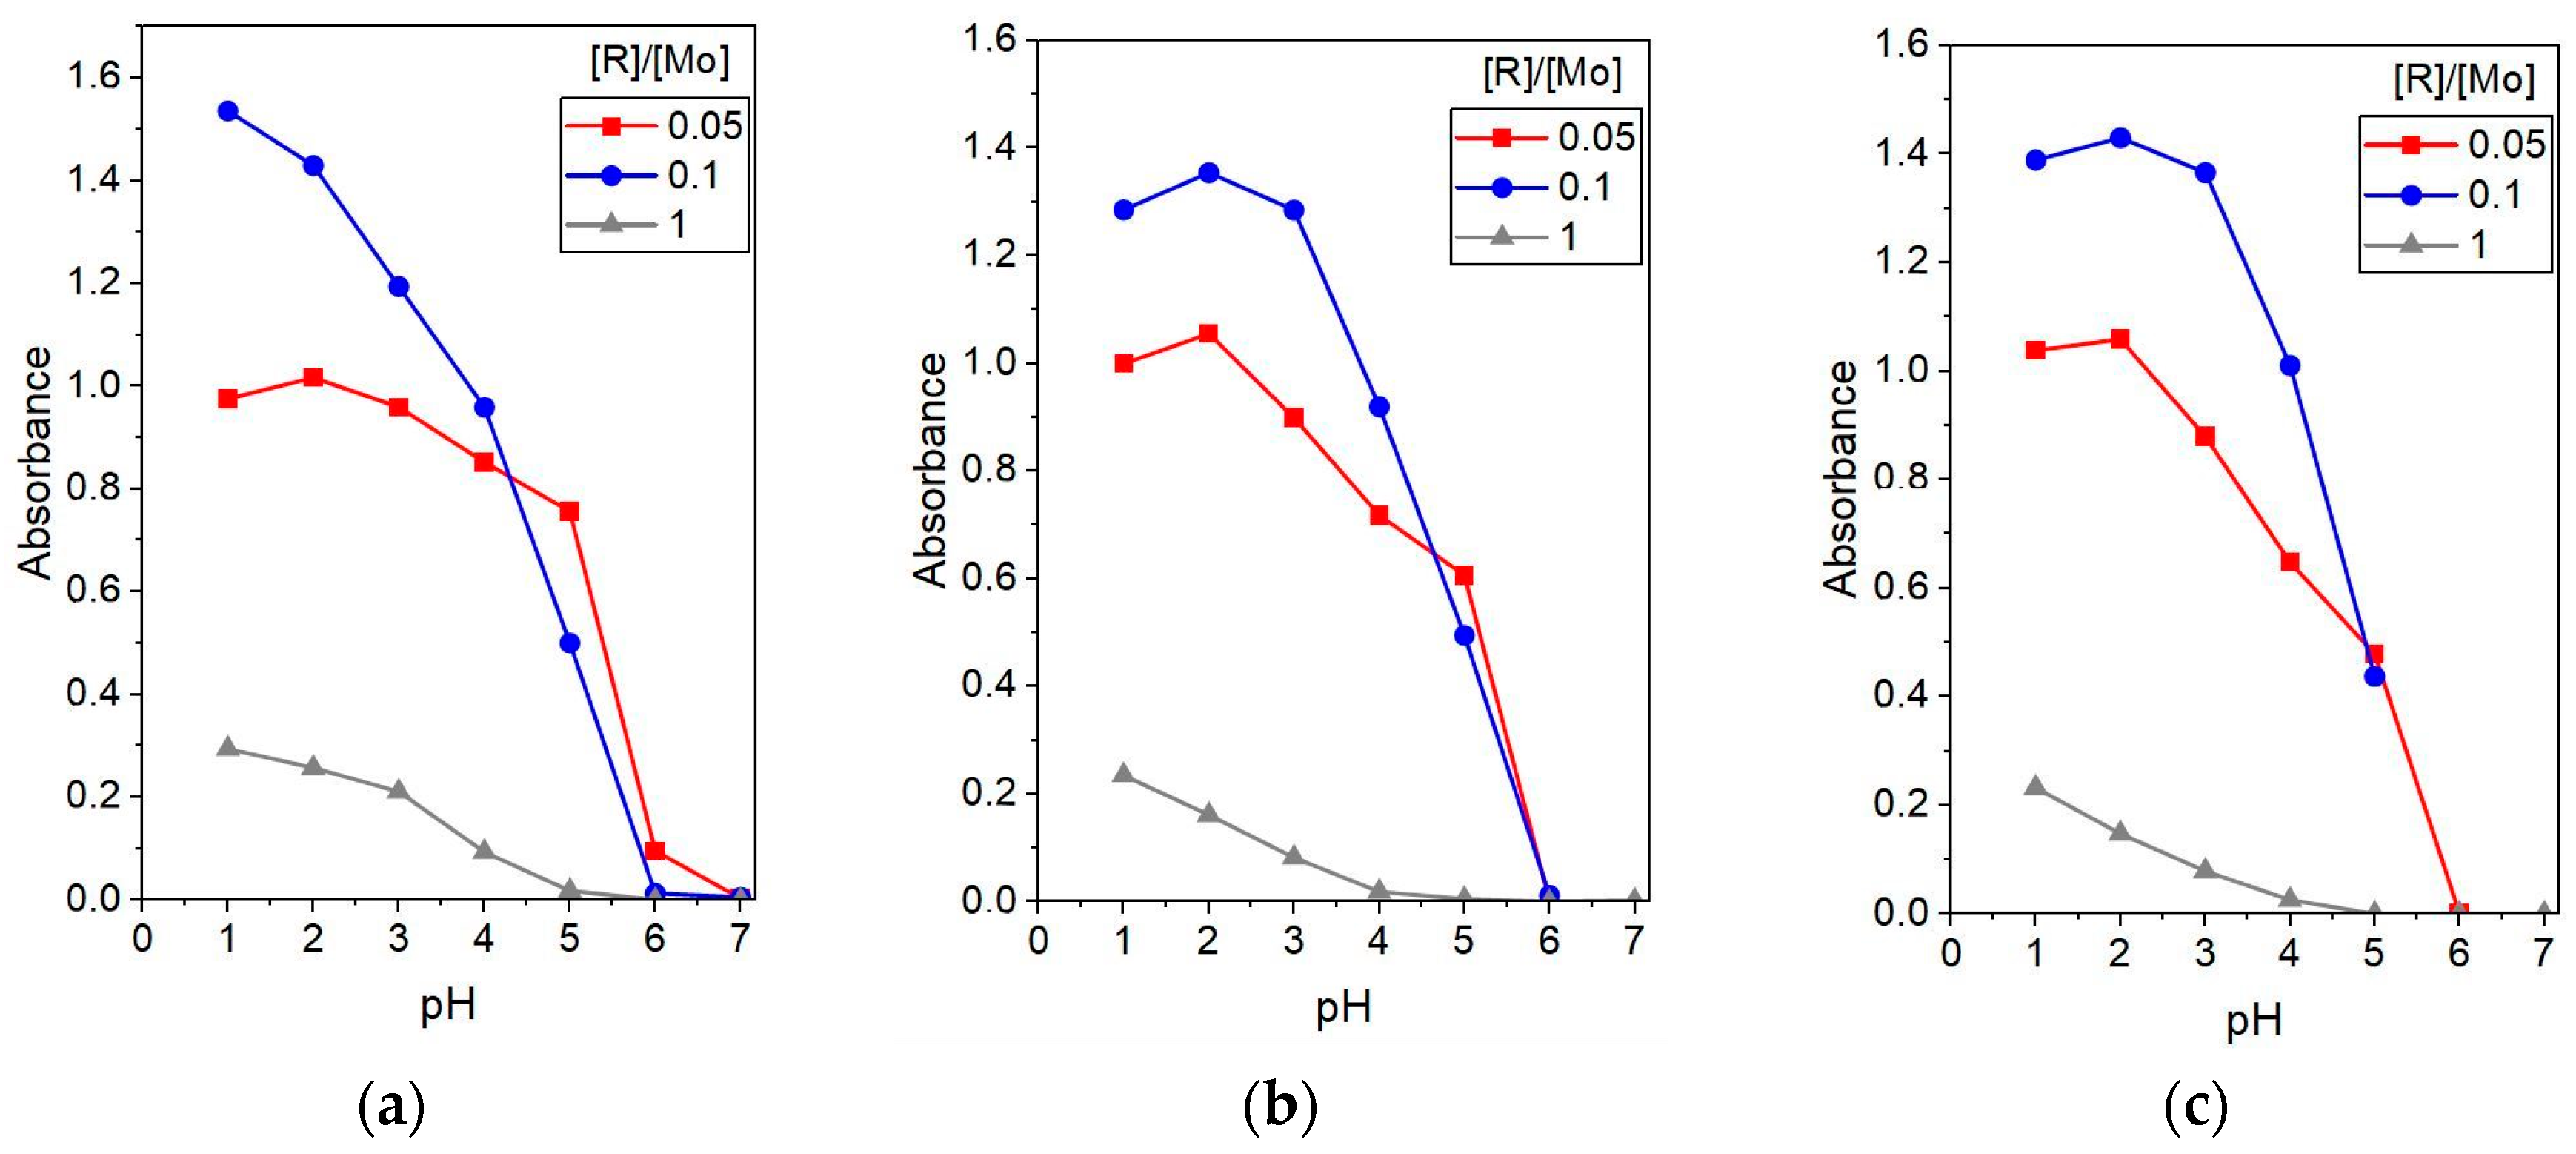
The aggregation stability of the selected molybdenum blue systems was evaluated by studying the dependence of optical density and electrokinetic potential on pH for dispersions prepared with [R]/[Mo] molar ratios of 0.05, 0.1, and 1.0 in the pH range from 1.0 to 7.0 (Figure 5).
For the system with [R]/[Mo] of 0.05, minor changes in optical density were observed during the first 24 h at pH 1.0–5.0, whereas a sharp decrease occurred at pH 6.0 and 7.0, indicating the onset of aggregation and partial precipitation. After 2 weeks, the samples at pH 1.0 and 2.0 remained stable, showing the highest optical density in this series, while those at pH 3.0–5.0 exhibited gradual fading of coloration. At pH 6.0, the optical density dropped to nearly zero, and at pH 7.0, visible sedimentation occurred.
For the system with [R]/[Mo] of 0.1, the optical density decreased across the pH range 1.0–5.0 within the first 24 h, followed by a sharp drop at pH 6.0–7.0. After 2 weeks, the samples maintained stable optical characteristics, with the dispersions at pH 1.0–3.0 exhibiting the highest absorbance values not only within this series but also compared to other systems. In contrast, samples at pH 5.0–7.0 showed precipitation, confirming reduced aggregative stability at elevated pH.
In the system with a molar ratio of 1.0, a significant decrease in optical density was already observed within the first 24 h for pH 1.0–4.0, while at pH ≥ 5.0, the absorbance values were close to zero. After 2 weeks, a further decline in optical density was recorded across all samples, accompanied by visible precipitation, indicating complete loss of aggregative stability.
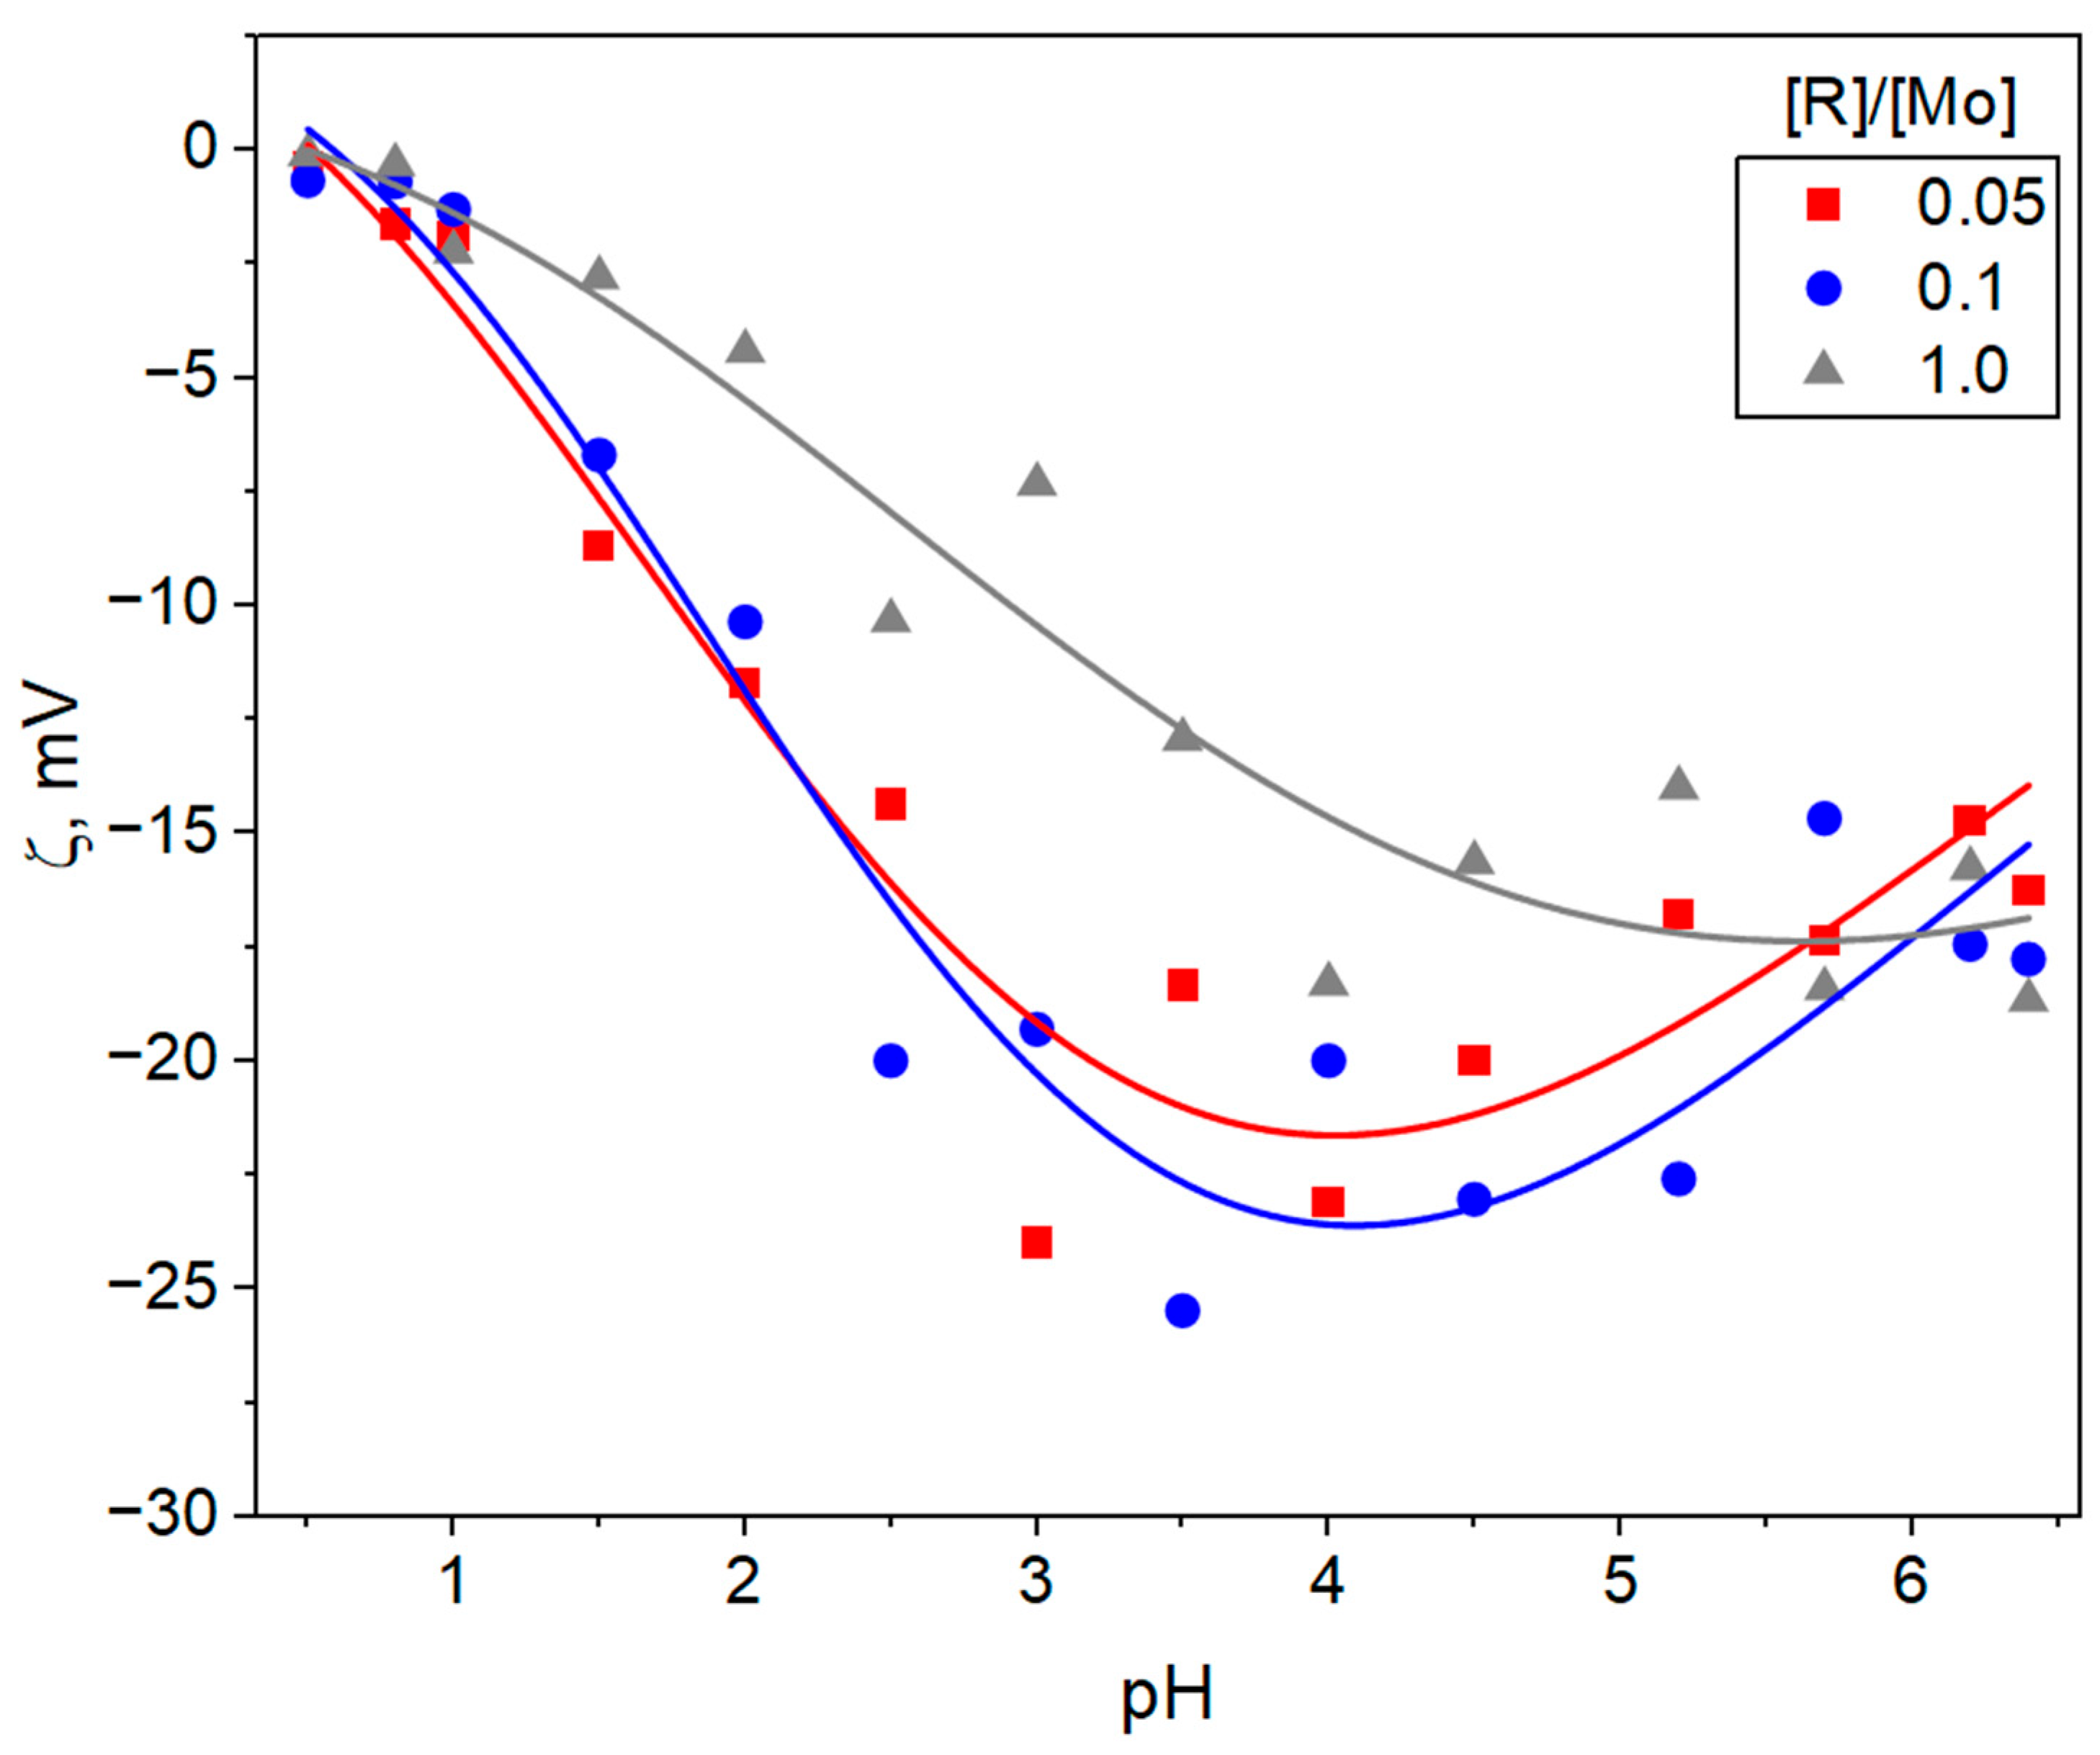
For all examined dispersions, the ζ-potential values were found to be negative across the entire investigated pH range (Figure 6), indicating that the dispersed particles possess an overall negatively charged surface predominantly due to terminal and bridging oxygen atoms of the polyoxomolybdate framework.
As the pH increased from 1.0 to 7.0, the magnitude of the negative ζ-potential increased, reaching its maximum values (from −18 to −25 mV) in the pH interval from 3.0 to 5.0 for all systems. This trend reflects enhanced deprotonation of surface hydroxyl groups and accumulation of negative charge on the cluster surface, leading to stronger electrostatic stabilization of the colloidal particles in this pH region. At lower pH values (1.0–2.0), protonation of surface sites partially neutralizes the negative charge, decreasing the ζ-potential magnitude and thus reducing electrostatic repulsion between particles. At higher pH values (>5.0), the ζ-potential tends to slightly decrease.
Based on the data on the pH range of aggregative stability and the values of the ζ- potential, it can be concluded that the aggregative stability of these systems is provided not only by the electrostatic factor. Probably, the structural factor also makes a significant contribution due to the high hydration of molybdenum blue nanoparticles.

3.3. Vibration Spectroscopy of MB Dispersions

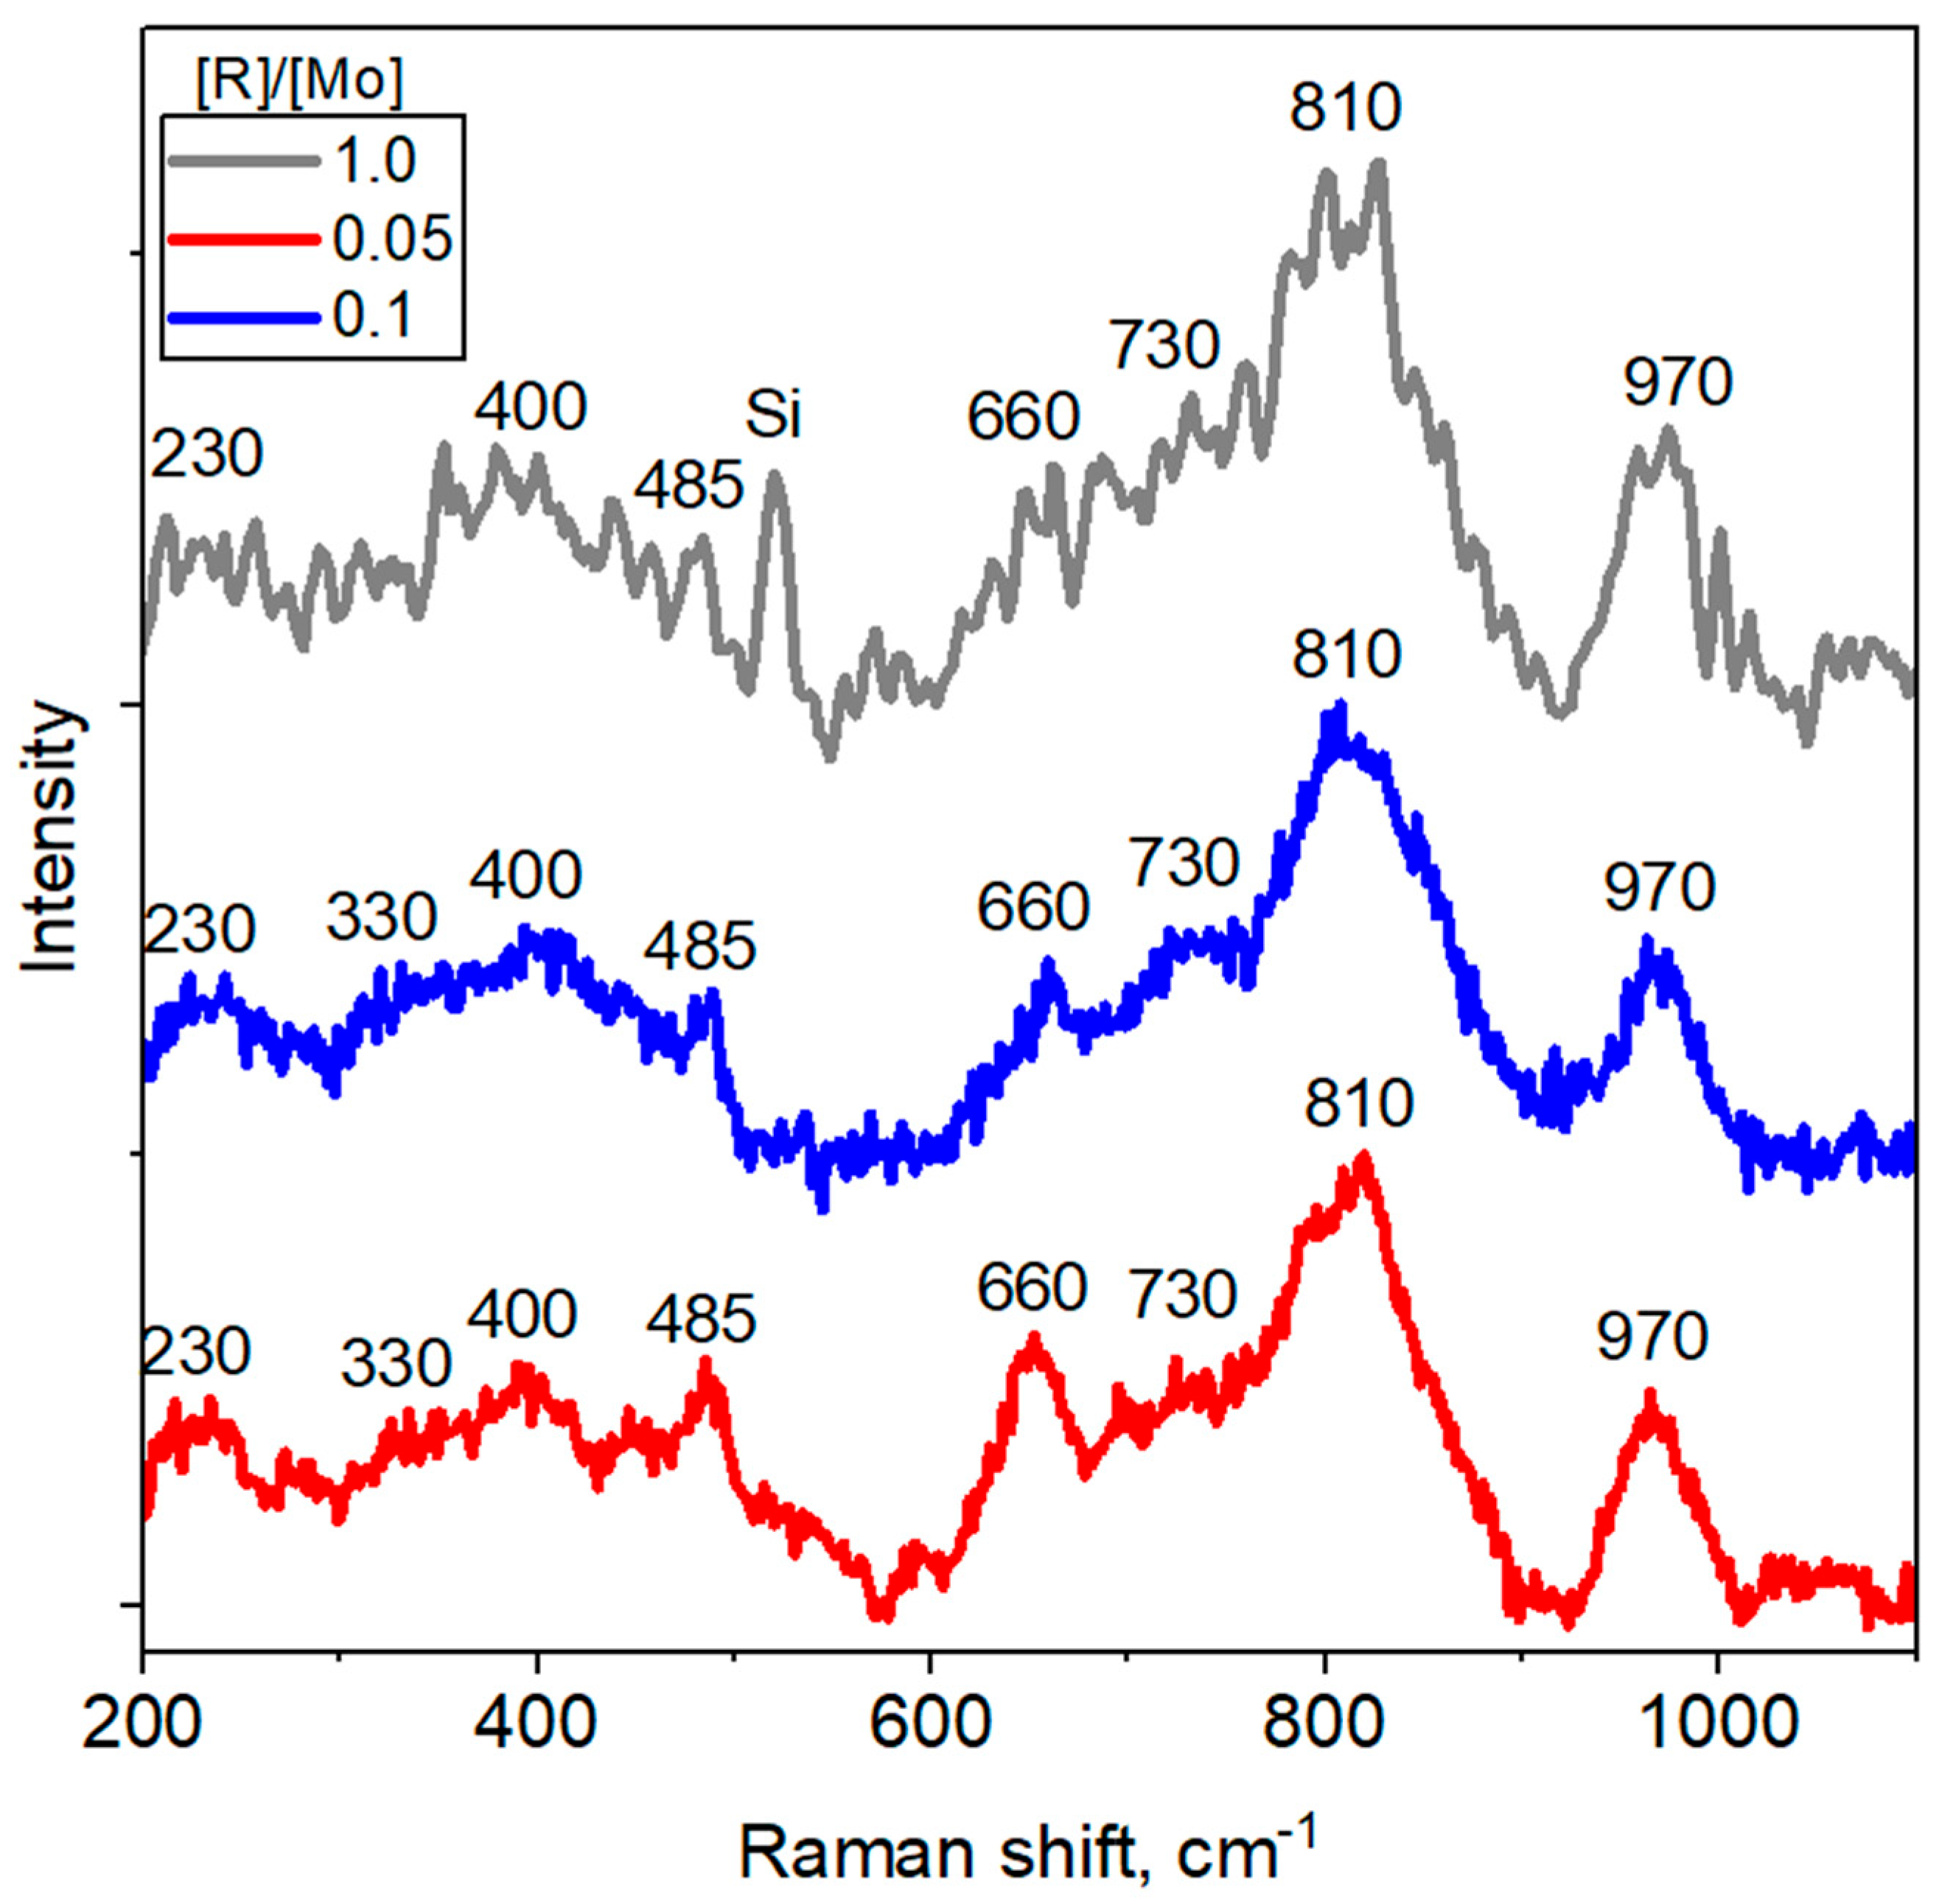
Figure 7 presents the normalized Raman spectra of the synthesized molybdenum blue dispersions. The spectra for all three systems with different molar ratios [R]/[Mo] showed the highly characteristic line pattern of wheel-type complexes in the 200–900 cm−1 range. These characteristic bands include peaks between 200–500 cm−1 (~230, 330, 400 and 460 cm−1) and a broad peak at ~810 cm−1.
The low-frequency band at ~230 cm−1 is attributed to deformation vibrations of O–Mo–O bridges, while the broad features near ~400 cm−1 correspond to bending modes of terminal Mo=O bonds. The bands at ~660 cm−1 and in the 730–810 cm−1 region are associated with asymmetric stretching vibrations of bridging Mo–O–Mo linkages, whereas the intense line at ~970 cm−1 is assigned to the stretching mode of terminal Mo=O bonds [33].
Notably, the pronounced band at ~810 cm−1 is characteristic of polyoxometalate-type clusters and is often associated with the {Mo6O19} “building-block” unit. Its presence suggests terminal O–Mo–O vibrations typical of molybdenum blue frameworks [9,34].
The persistence of the ~970 cm−1 band across all systems confirms retention of terminal Mo=O bonds, reflective of partially reduced Mo5+/Mo6+ species within the nanocluster network [9,35].
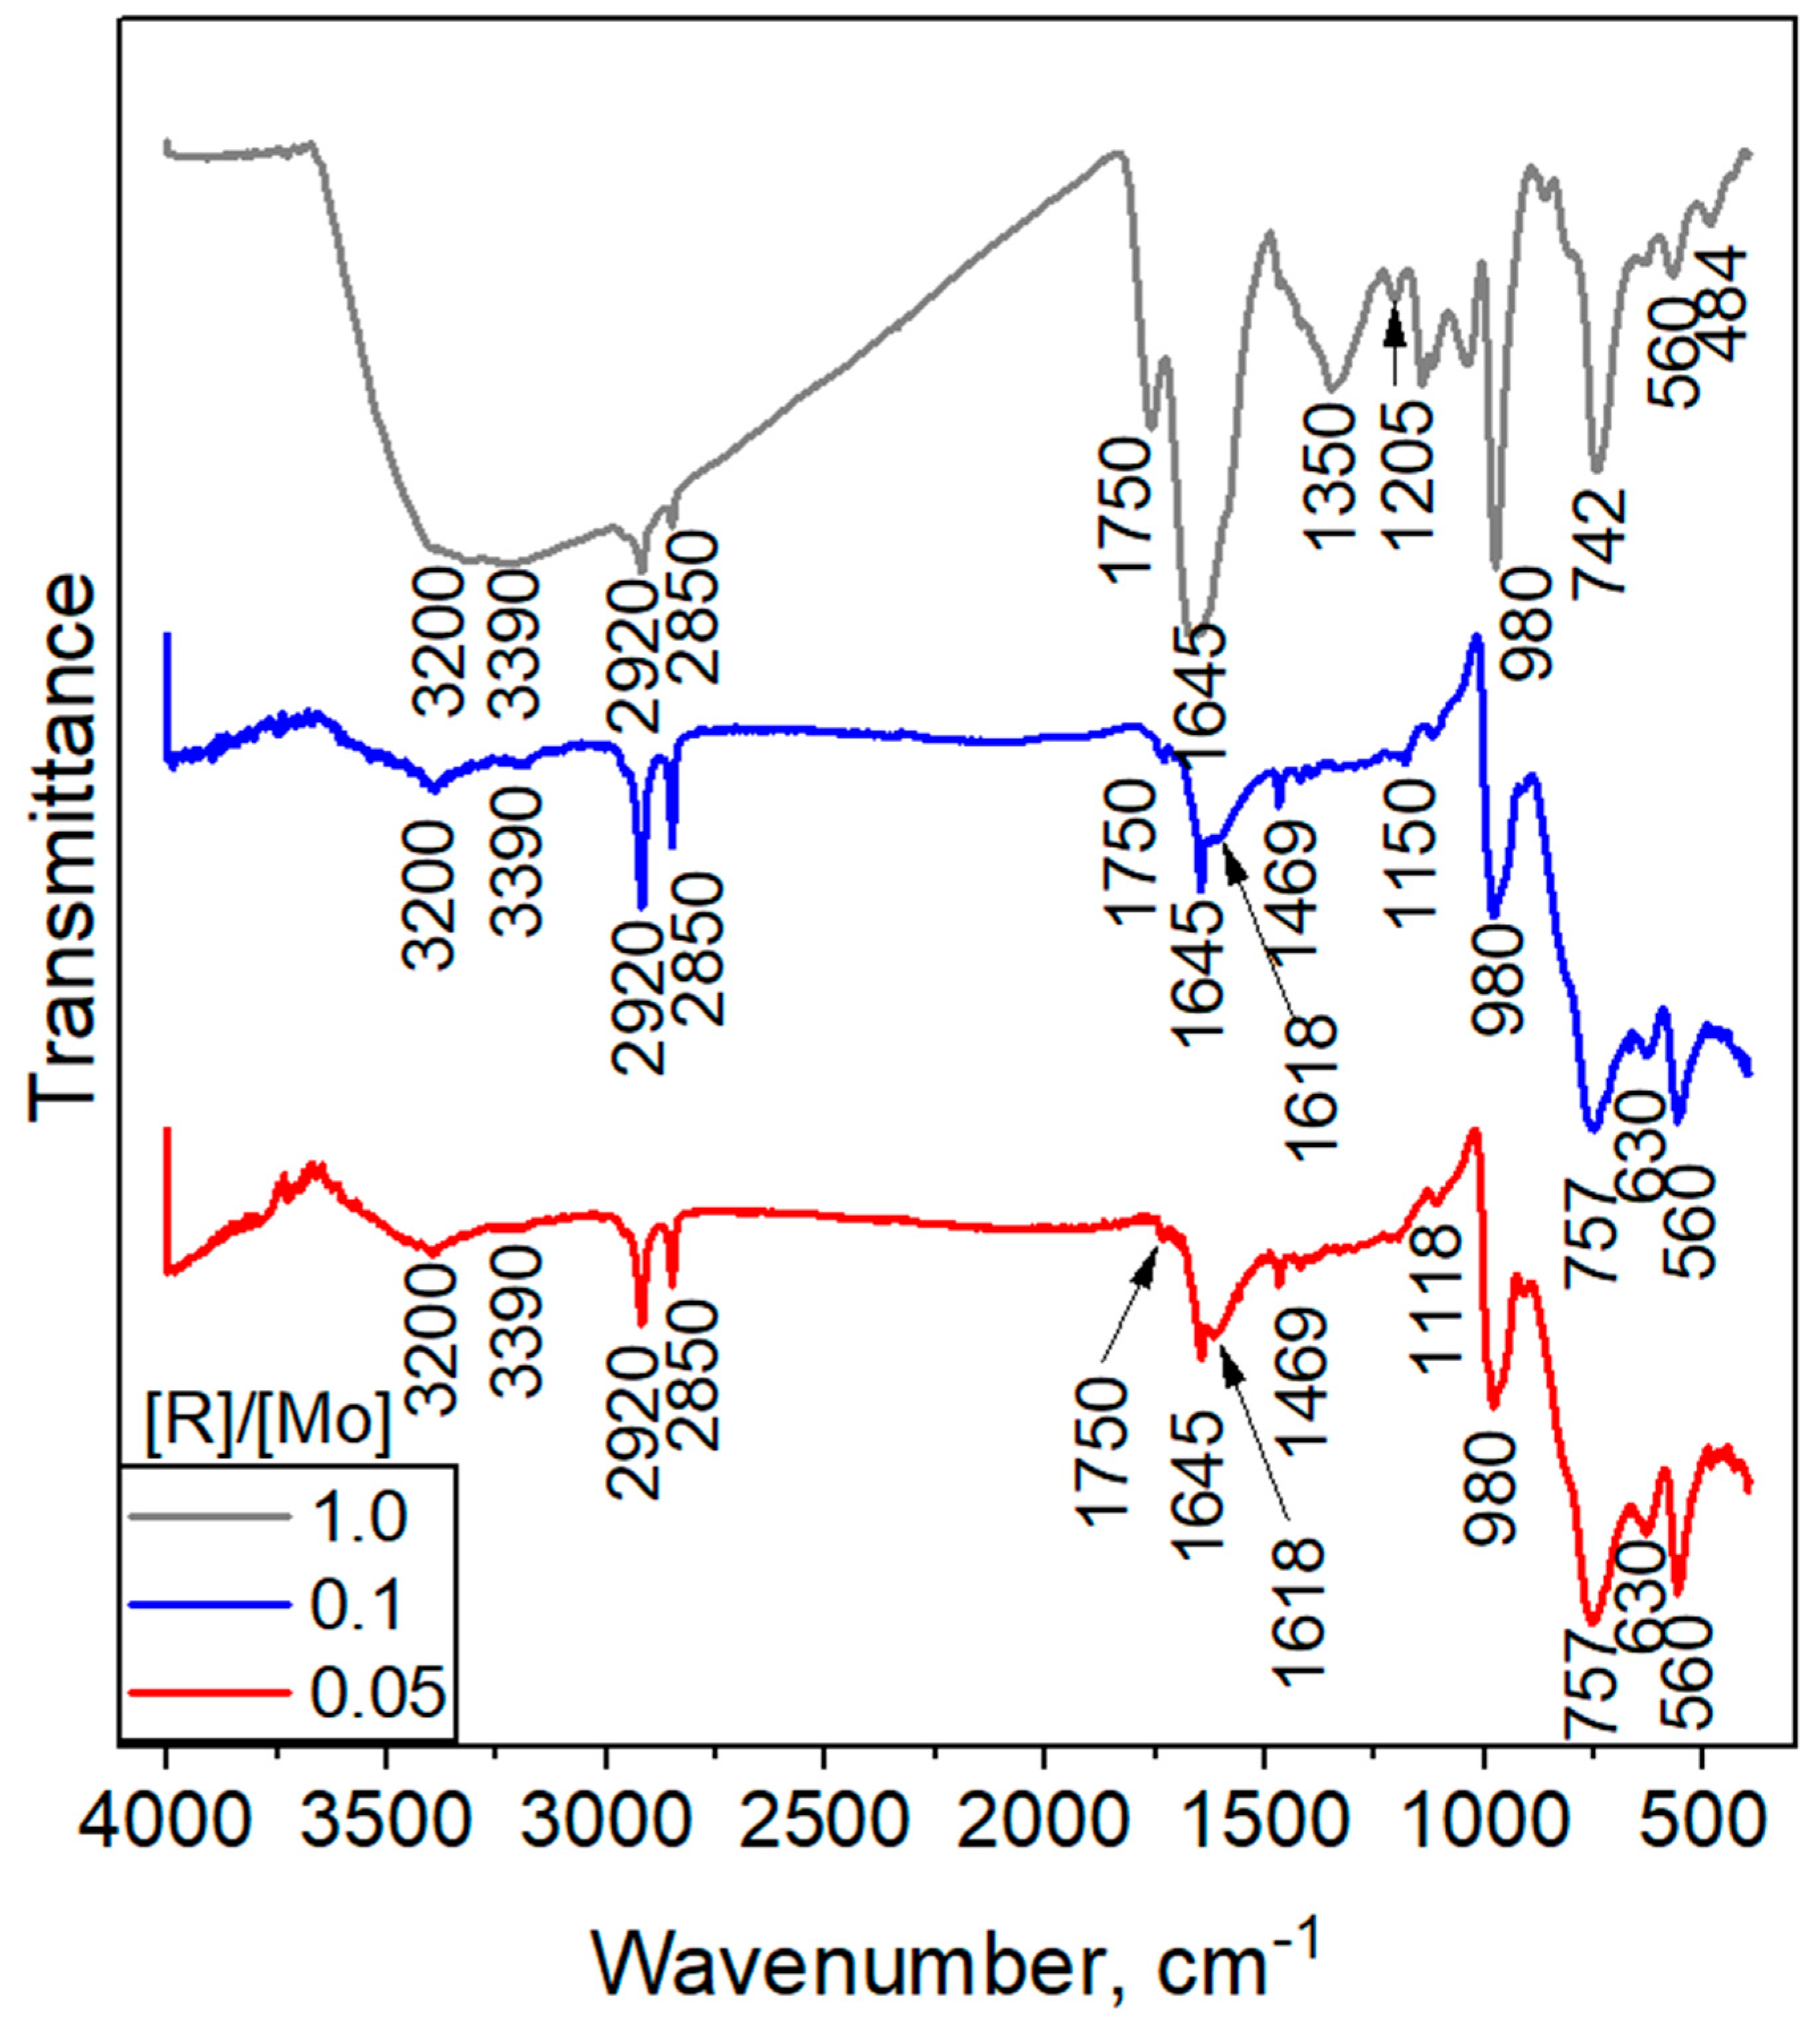
The Raman spectroscopy data are in good agreement with the IR spectroscopy data (Figure 8). Molybdenum blue particles have a large number of hydrogen bonds v(OH… H), as evidenced by the presence of a wide band in the region of 3100–3500 cm−1 [36]. These results proved a high concentration of OH groups on the surface of toroidal particles, as well as the presence of aqualigands and intracluster water molecules (including the inner space of the toroidal nanoparticles). The bands around the region of 1620 cm−1 correspond to bending vibrations of water (H2O).
The region below 1000 cm−1 contains bands related to vibrations of the polyoxomolybdate framework. In the range of 950–990 cm−1, closely spaced poorly resolvable bands are observed, which are related to the Mo=O bond. A band of 977 cm−1, corresponding to stretching vibrations of the Mo-O-Mo bond [37,38], is also presented in this region.
FTIR spectroscopy of the synthesized molybdenum blue dispersions (Figure 7) reveals a clear dichotomy between the low-reduction systems ([R]/[Mo] = 0.05 and 0.10) and the strongly reduced system ([R]/[Mo] = 1.0). The spectra for the 0.05 and 0.10 samples are essentially coincident and display absorption features at ~560, 630, 755, 980, 1120, 1180, 1420, 1470, 1617, 1650, 2850, 2919, 3217, and 3390 cm−1. The band at ≈980 cm−1 is assigned to stretching vibrations of terminal Mo=O groups and matches the strong Raman line near 970 cm−1, confirming retention of Mo=O motifs in these clusters. Low-frequency bands at ~560 and ~630 cm−1 are consistent with bridging Mo–O–Mo bending and deformation modes, whereas the feature at ~755 cm−1 corresponds to asymmetric Mo–O–Mo stretching (it correlates with the Raman signatures in the 730–810 cm−1 region associated with building blocks). The absorptions in the 1100–1200 cm−1 window likely arise from C–O or polyether-like vibrations and/or from complexed anions or ligand stretches; the bands at 1420 and 1470 cm−1 can be ascribed to C–H bending or carboxylate-type vibrations when organic species are present [39]. The pairs of bands at 1617 and 1650 cm−1 fall in the range typical for conjugated C=C/amide-I–like or coordinated water bending modes, and the strong CH stretching bands at 2850 and 2919 cm−1 indicate the presence of aliphatic organic fragments or residual reducing-agent residues. Finally, the broad absorptions at 3217 and 3390 cm−1 reflect O–H stretching of hydrogen-bonded water and protonated surface groups, consistent with strongly hydrated, colloidal POM clusters.
In contrast, the [R]/[Mo] = 1.0 spectrum shows several notable differences: prominent bands at 484, 742, and additional features at ~1205 cm−1, together with peaks at 1350, 1650, and a distinct carbonyl band at 1750 cm−1; aliphatic C–H stretches at 2850 and 2919 cm−1 remain, and a strong broad hump extending from ~1900 to 3500 cm−1 is observed. The appearance of the 484 cm−1 band indicates a shift in low-frequency Mo–O bending modes, consistent with structural condensation (increased bridging and altered Mo–O bond topology). The new absorptions in the 1000–1200 cm−1 region and the band at 1347 cm−1 point to a higher content of organic moieties or modified ligand coordination in the highly reduced sample. The well-defined band at 1759 cm−1 signals the presence of carbonyl functionality (ester/aldehyde/coordination-type C=O), which was absent or much weaker in the low-reduction samples, together with the broad 1900–3500 cm−1 envelope; this indicates intensive hydrogen-bonding, a heterogeneous population of O–H, and overlapping contributions from strongly interacting organic fragments. These IR observations agree with the Raman result for [R]/[Mo] = 1.0—both techniques therefore indicate a structurally more condensed, bridge-rich and organics-modified material at high reduction.
TEM, UV–Vis, FTIR and Raman data provide a consistent picture: all three systems are structurally similar and are best described as wheel-type molybdenum blue {Mo154}. In terms of colloidal systems, such structures are understood as nanosized particles.
The presence of a ζ-potential indicates electrostatic stabilization of molybdenum blue particles, but a low value of the ζ-potential (less than −25 mV) and an extended stability range (pH 1–5) indicate a significant contribution from non-DLVO forces. The highly hydrated nature of the toroidal clusters, as evidenced by the wide shell stretching along the O–H in the FTIR spectra, creates a hydration shell. This shell provides a structural component of the wedging pressure, preventing aggregation.

3.4. Thermal Treatment of the MB Xerogels

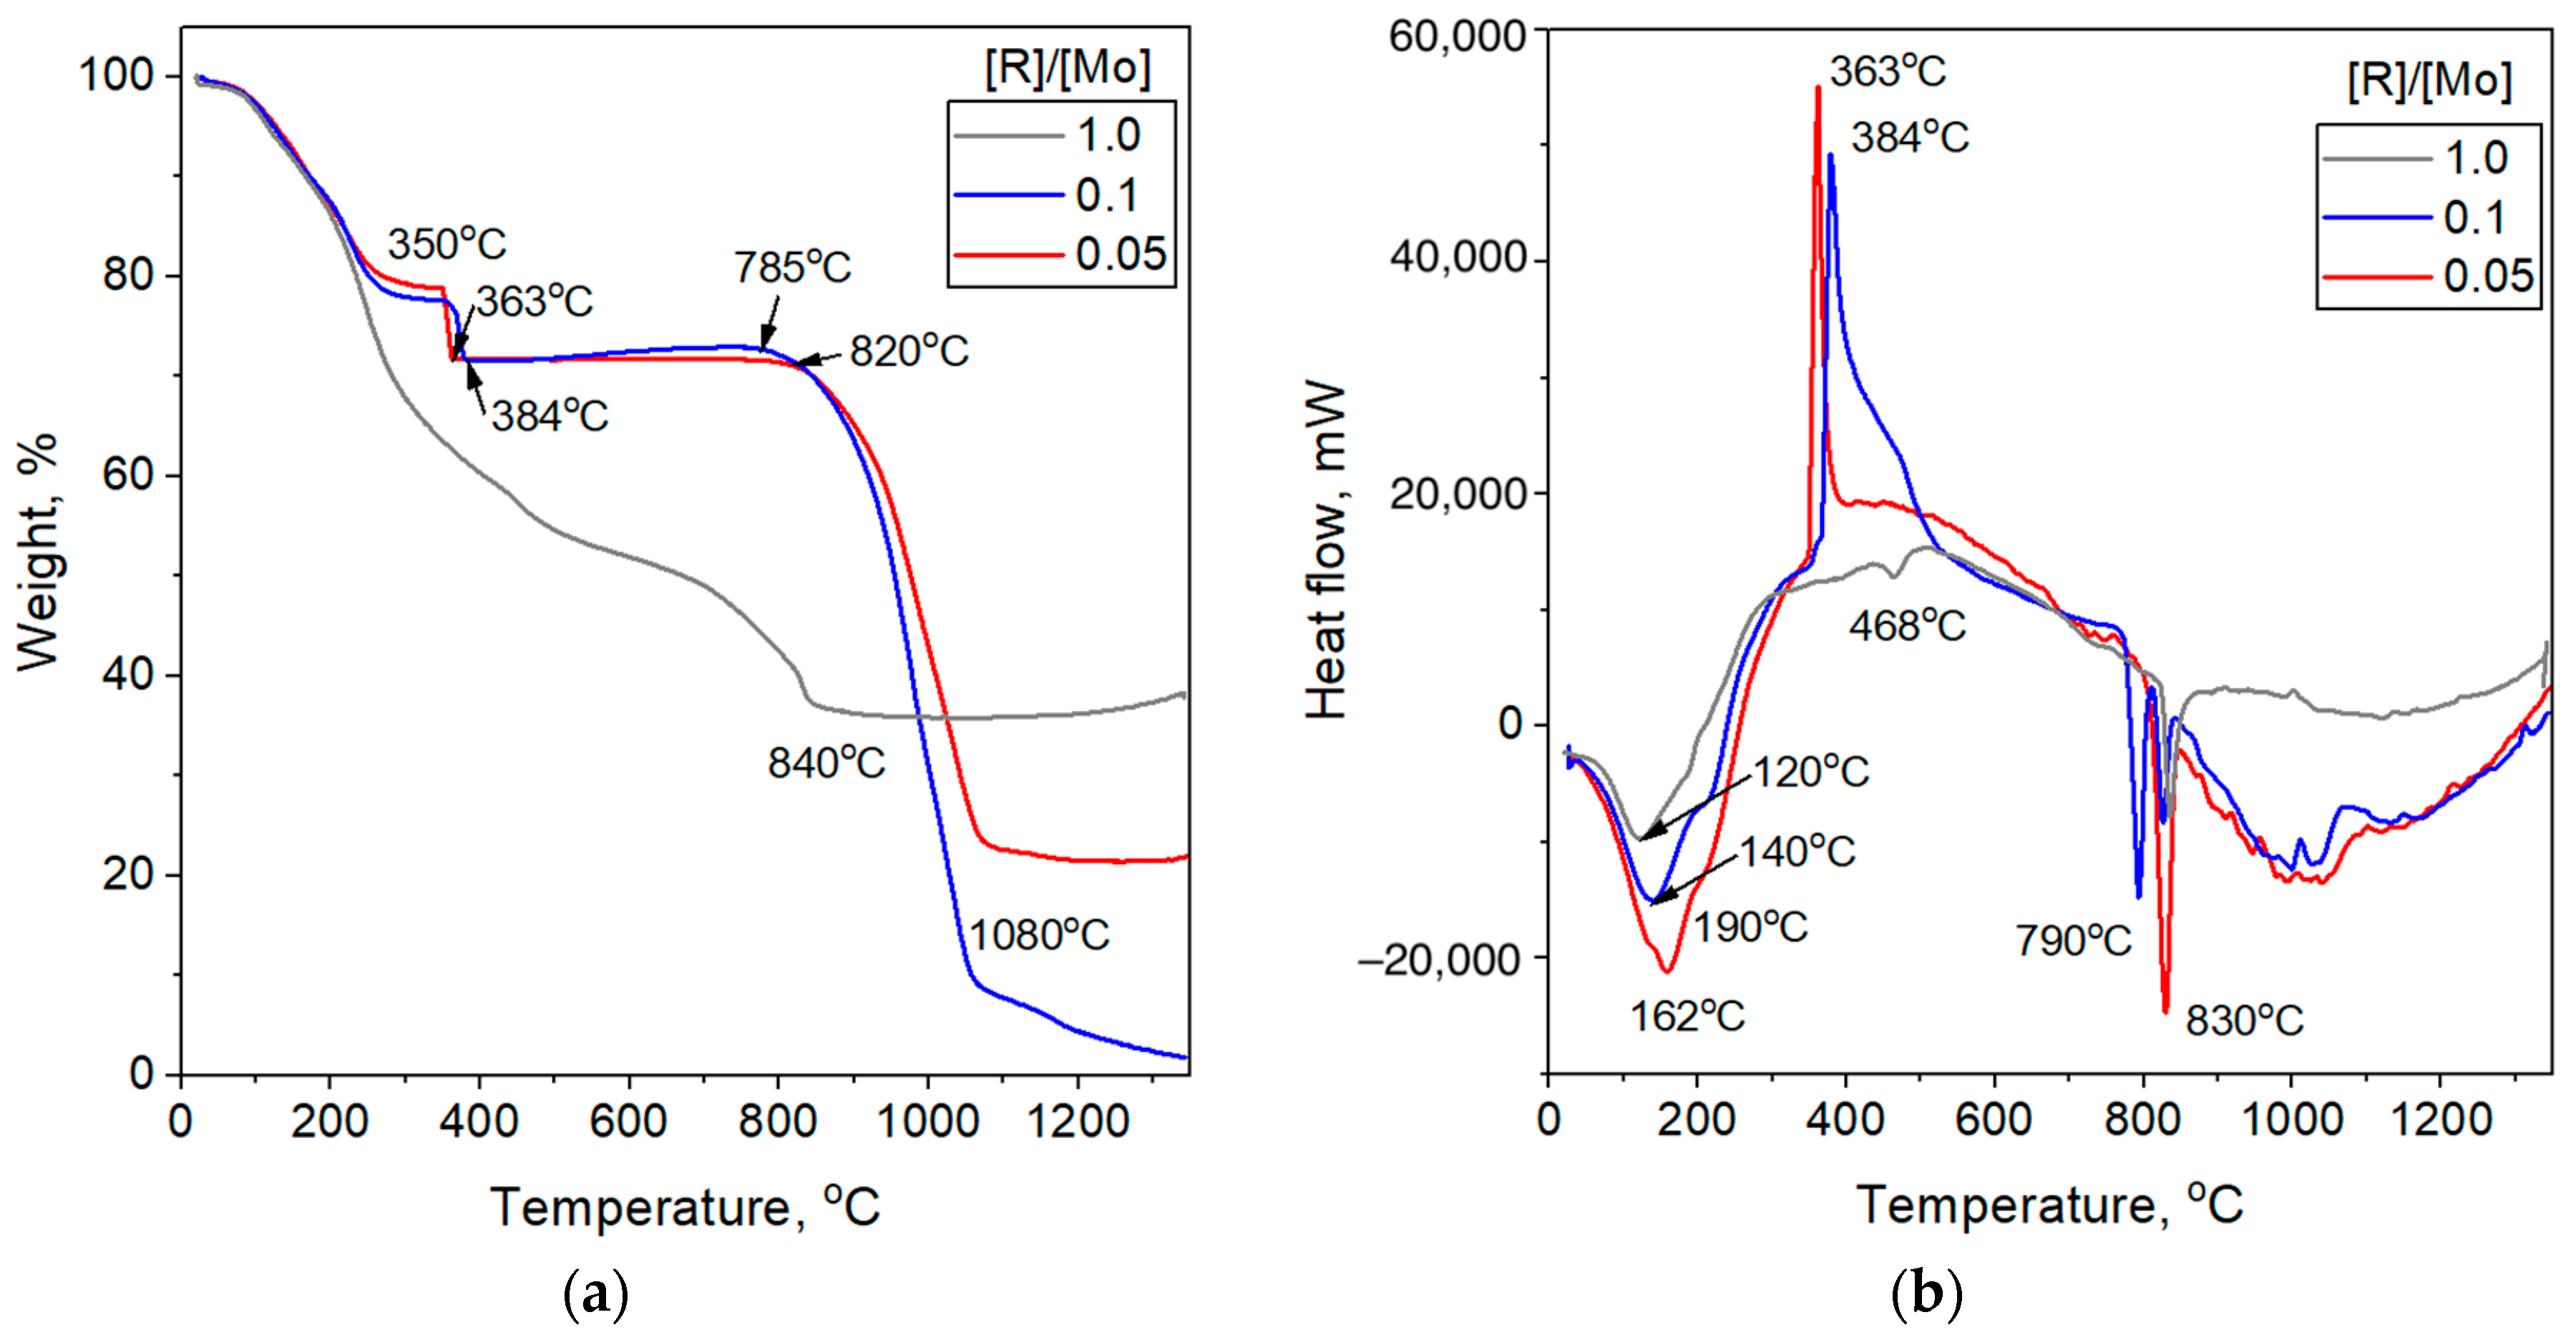
Thermogravimetric and differential thermal analyses were performed on the xerogels of the three representative molybdenum blue dispersions after drying (Figure 9). The thermal behavior of the low-reduction samples ([R]/[Mo] = 0.05 and 0.10) is essentially identical. Both materials exhibit a progressive mass loss of approximately 22% on heating from ambient temperature to ~380 °C, at which point a clear exothermic DTA peak is observed. Above 380 °C, the mass remains essentially constant up to roughly ~793–825 °C, where two endothermic DTA features (at ~793 °C and ~825 °C) are recorded. Beyond these endothermic events, the sample mass decreases again, with continuous loss extending up to approximately 1090 °C.
The highly reduced sample ([R]/[Mo] = 1.0) shows a distinctly different thermal profile. Mass loss proceeds continuously up to about 835 °C (no pronounced plateau comparable to that of the low-reduction materials). The DTA trace contains endothermic peaks at ~125 °C, ~464 °C, and ~835 °C.
The observed low-temperature mass loss (ambient → 125–380 °C) in all samples is assigned primarily to removal of physiosorbed and bound water (hydration shell), loss of volatile residual solvent, and decomposition of labile organic residues originating from the reducing agent and any surface-bound ligands. The presence of an exothermic event at ≈380 °C ([R]/[Mo] = 0.05 and 0.10) suggests oxidative combustion or exothermic decomposition of organic fragments: in an oxidizing atmosphere, this temperature is consistent with organic residue oxidation (combustion) or rapid condensation/polymerization reactions that release heat. In the [R]/[Mo] = 1.0 sample, the corresponding organic-decomposition signature appears as an endothermic event at ≈464 °C rather than an exotherm at 380 °C, and mass loss continues to higher temperatures—this indicates a different decomposition pathway, a larger organic content, or stronger binding of organics (more energy required for decomposition or conversion to char), which is consistent with spectroscopic evidence of enhanced organic features in the highly reduced material.
The plateau observed for the 0.05 and 0.10 molar ratio samples between ~380 °C and ~793–825 °C suggests the formation of a thermally stable inorganic residue after initial dehydration and organic removal. The two endothermic peaks at ~793 and ~825 °C likely reflect high-temperature structural changes in the molybdenum oxide phases formed upon heating (for example melting, phase transitions, or onset of sublimation of Mo-oxide species). The subsequent mass loss up to ~1050 °C is consistent with volatilization or sublimation of volatile Mo-oxides or continued decomposition of residual species at very high temperatures.
For the [R]/[Mo] = 1.0 material, the endotherm at ~120 °C is consistent with elimination of loosely bound water and low-boiling volatiles. The mid-range endotherm at ~468 °C most likely corresponds to decomposition of more strongly bound organics or transformation of organic residues into more refractory carbonaceous char; alternatively, it may reflect internal redox rearrangements within partially reduced Mo oxide clusters (oxygen release and structural reorganization) that consume heat. The high-temperature endotherm at ~835 °C parallels the high-T features of the low [R]/[Mo] ratio samples and likely marks a phase transition, melt or volatilization onset for higher oxides of molybdenum.
The thermograms therefore reveal two important differences between low- and high-reduction materials. First, low-reduction samples (0.05 and 0.10) lose a defined fraction of mass (≈22%) at relatively low temperature and then form a thermally robust inorganic residue up to ~800 °C, implying that most labile organics are removed below 400 °C and that the remaining inorganic framework is stable until high-temperature oxide transformations occur. Second, the [R]/[Mo] = 1.0 sample exhibits more protracted mass loss and distinct mid-temperature decomposition features, indicating either a higher loading of organic/reducing agent-derived species that decompose over a wider temperature range, formation of carbonaceous residues (char) that oxidize or gasify at higher temperatures, or structural redox rearrangements inherent to more strongly reduced MoxOy networks. These outcomes align with spectroscopic data showing increased organic signatures and altered Mo–O bonding in the highly reduced sample.
From an application and processing perspective, the plateau and well-defined mass-loss stages of the 0.05 and 0.10 molar ratio materials are advantageous for controlled thermal conversion to oxides: predictable removal of volatiles and a stable inorganic intermediate reduce the likelihood of explosive weight loss or formation of inhomogeneous phases. Conversely, the more complex thermal behavior of the 1.0 molar ratio system warns that thermal treatments of heavily reduced precursors may produce variable carbonaceous residues, evolve different gaseous products, and give rise to less reproducible final phases unless the organic content is removed or controlled prior to high-temperature processing.
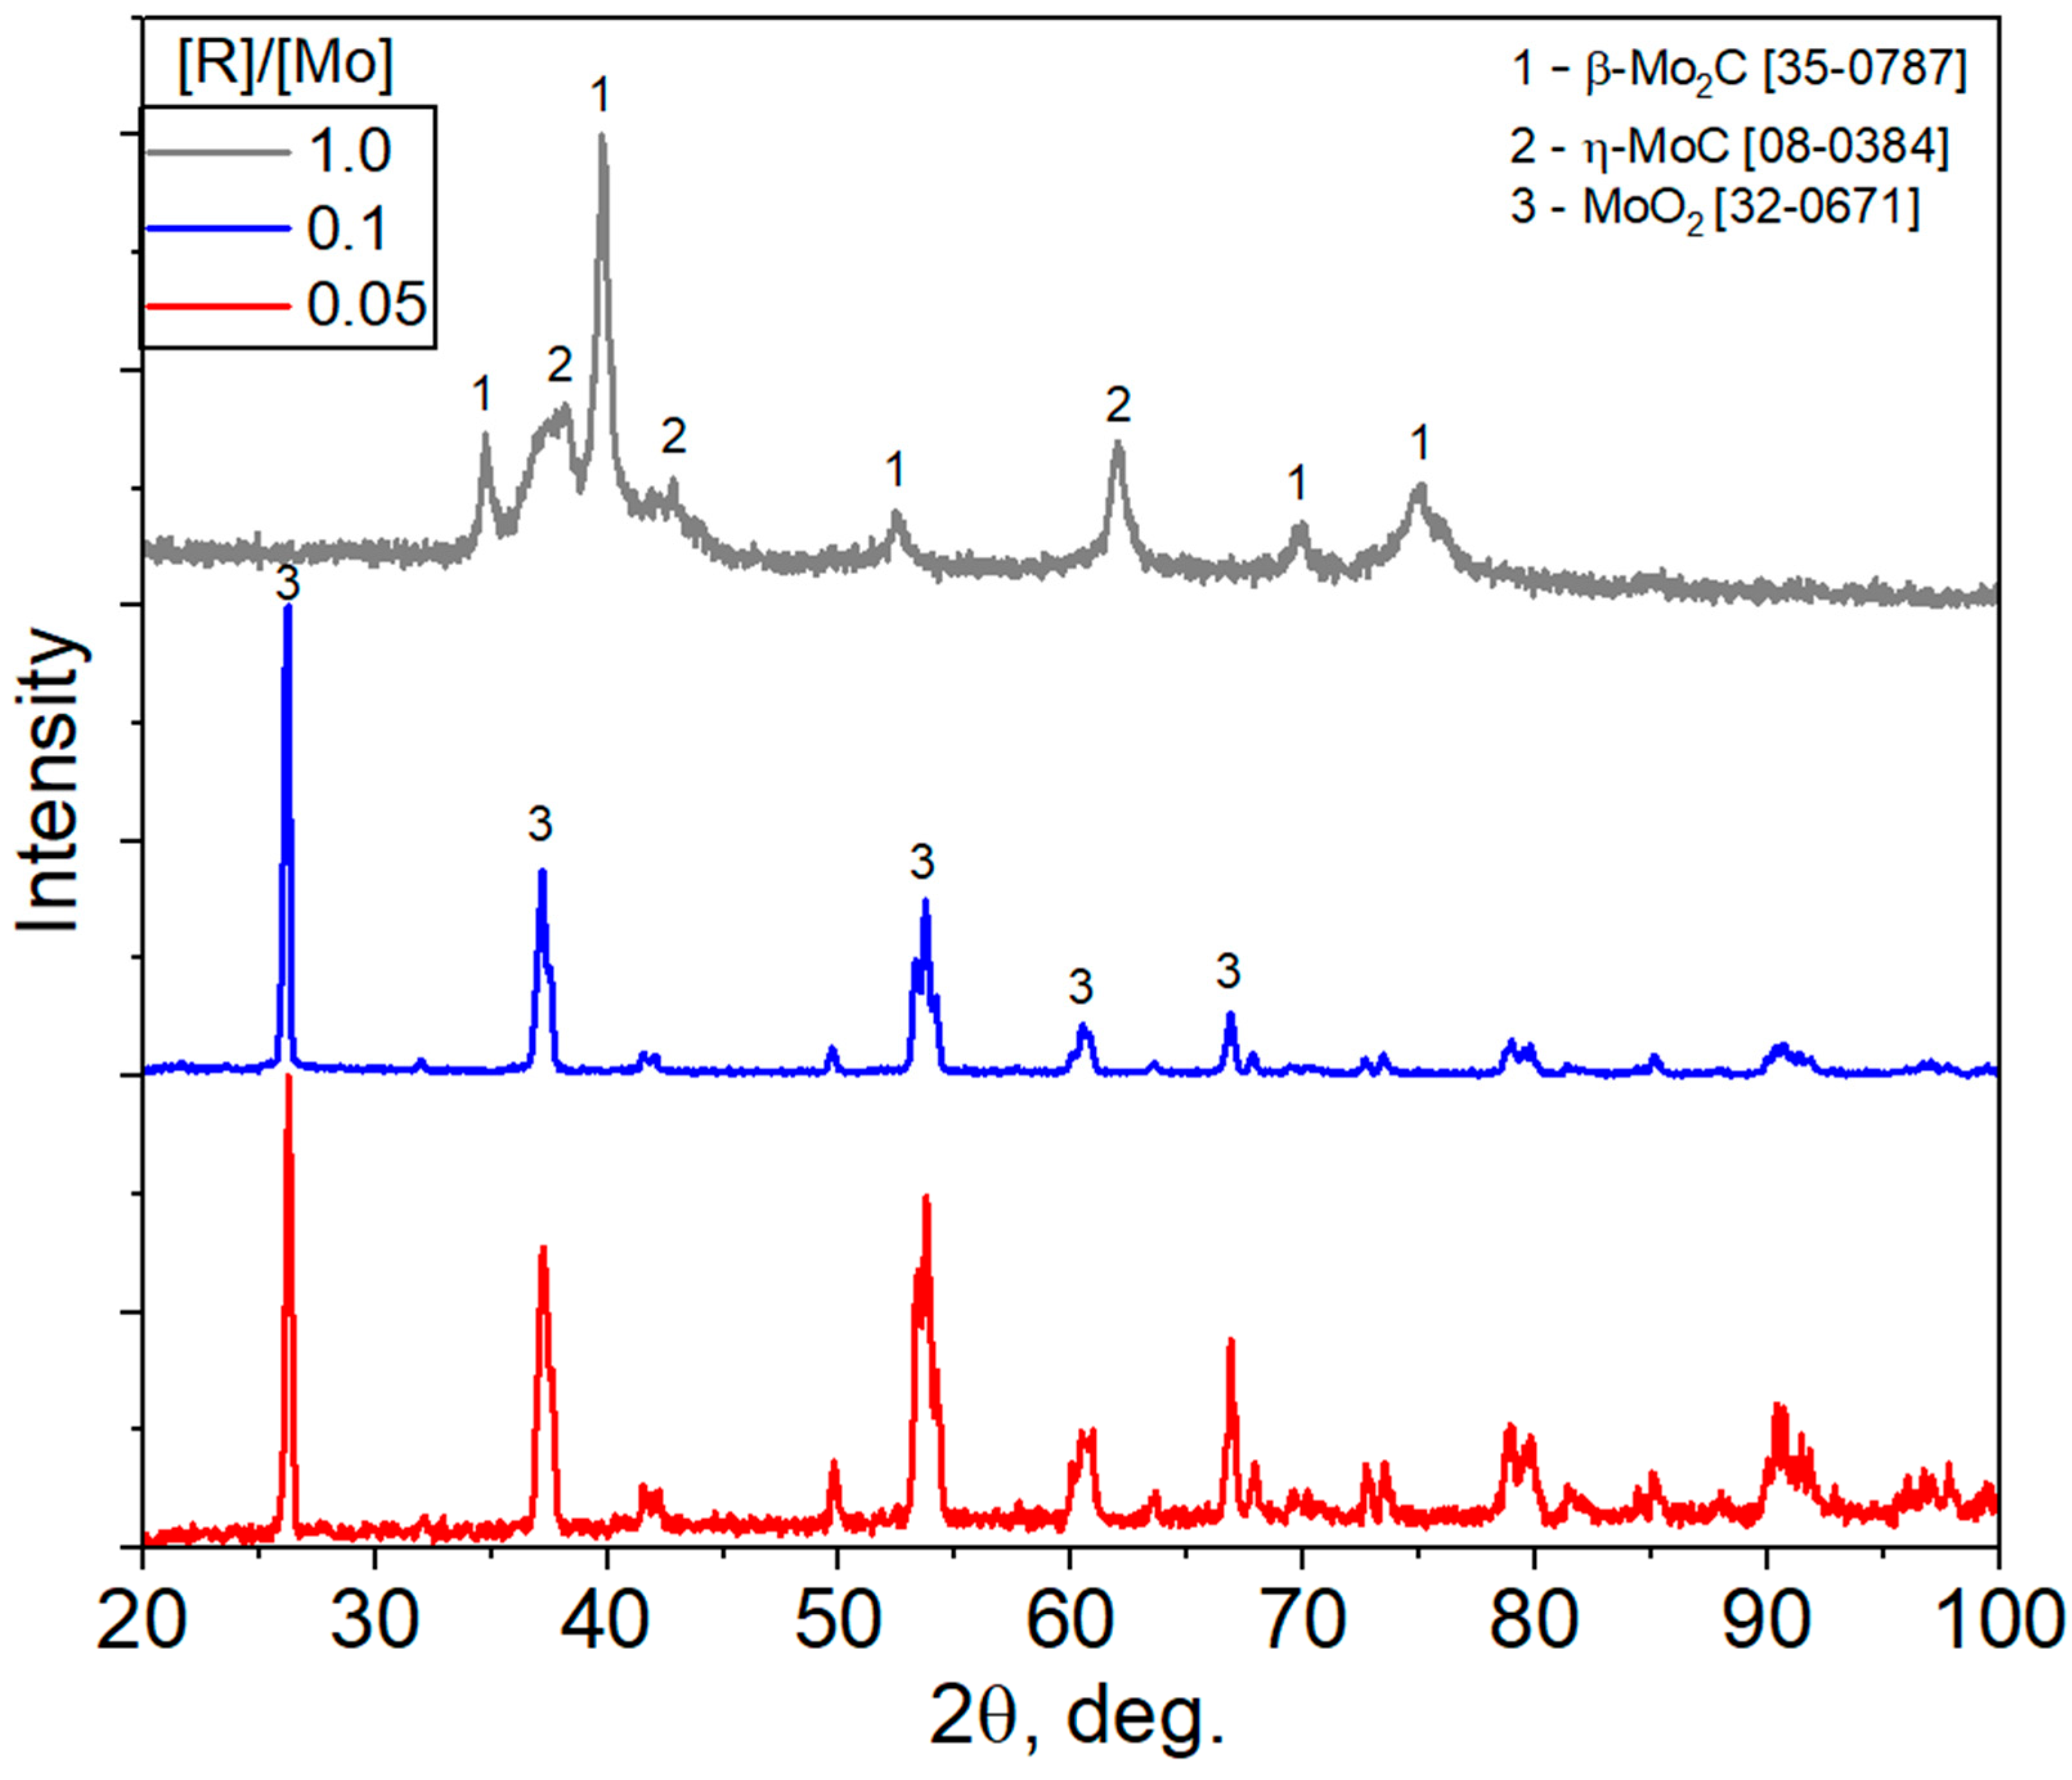
X-ray diffraction patterns of the xerogels obtained after thermal treatment (Figure 10) corroborate these findings. For the systems with [R]/[Mo] = 0.05 and 0.10, the diffraction peaks correspond closely to monoclinic MoO2 (PDF 32-0671), indicating that controlled reduction of the molybdenum blue clusters leads to the formation of crystalline molybdenum dioxide. This transformation is consistent with the exothermic event observed near 380 °C in the DTA curves, which likely reflects the reorganization of the mixed-valence polyoxomolybdate framework into MoO2.
In contrast, the system with [R]/[Mo] = 1.0 exhibits a distinctly different thermal behavior, characterized by a continuous mass loss up to 835 °C and the presence of multiple endothermic events at 125, 464, and 835 °C. These features point to a more complex decomposition process involving a higher content of organic material and a stronger reducing environment. Correspondingly, the XRD pattern of this sample shows reflections that can be unambiguously indexed to hexagonal molybdenum carbide β-Mo2C (PDF 35-0787) and η-MoC (PDF 08-0384). The formation of Mo2C under these conditions indicates that, at elevated reductant concentrations, organic components originating from the synthesis act as a carbon source during thermal treatment, promoting carbothermal reduction of Mo species.
SEM analysis revealed distinct morphological differences between the thermally treated xerogels obtained at varying [R]/[Mo] ratios (Figure 11). Samples synthesized at molar ratios of 0.05 and 0.1 exhibited MoO2 powders that had irregular polygonal structures, particle sizes with a mean diameter of 15 µm with a broad particle size distribution (Figure 11a), and particle sizes with a mean diameter of 2 µm with a narrow particle size distribution (Figure 11b). The higher content of the reducing agent leads to the formation of smaller and uniform MoO2 particles prone to aggregation during sintering.
In contrast, the sample prepared at a molar ratio of 1.0 (Figure 11c) displayed more elongated, anisotropic particles, characteristic of Mo2C-type morphologies.
Thus, the DTA/TGA, XRD, and SEM results demonstrate that the ion-exchange synthesis route enables precise control over the chemical nature of the final phase. Low and moderate reduction degrees lead to the formation of MoO2, while a high reduction degree ([R]/[Mo] = 1.0) results in carbothermal reduction to Mo2C due to excess organic content and strongly reducing conditions. This tunability highlights the dual role of molybdenum blues as colloidal precursors for producing oxide and carbide materials with tailored composition and morphology.

4. Discussion

A comprehensive comparison of the presented results with earlier studies of molybdenum blue (MB) dispersions synthesized without ion exchange [5,6] demonstrates that ion-exchange synthesis significantly modifies both the physicochemical and colloidal characteristics.

4.1. Self-Assembly and Optical Properties

In the present study, self-assembly of molybdenum blue dispersions should be understood not as the formation of long-range ordered supramolecular architectures, but as a time-dependent colloidal process involving gradual organization and stabilization of dispersed mixed-valence oxide clusters. This process is governed by interfacial interactions, electrostatic effects, and the redox conditions established during synthesis.
The evolution of the dispersions was monitored by simultaneous measurements of optical density and redox potential over time. For systems with [R]/[Mo] ratios exceeding 0.1, a pronounced decrease in optical density was observed during the initial aging period, while the redox potential remained nearly constant. This behavior indicates that self-assembly is not driven by further redox transformations of molybdenum species, but rather by restructuring and partial aggregation of pre-formed clusters accompanied by changes in their effective optical cross-section.
After approximately 14 days, the optical density reached a constant value, suggesting completion of the self-assembly process and establishment of a stable dispersed state. In contrast, for systems with [R]/[Mo] < 0.1, the optical density remained nearly unchanged over time, indicating that these dispersions rapidly attain a stable configuration without pronounced intermediate restructuring. The different temporal behaviors reflect variations in interparticle interactions arising from differences in cluster charge and composition.

4.2. Aggregative Stability and ζ-Potential

The dependence of ζ-potential on pH for all systems indicated that the synthesized molybdenum blue dispersions have a negative surface charge, and the ζ-potential magnitude increased with pH, reaching a maximum between pH 3 and 5. The region of aggregative stability was observed in the pH region of 1–5. That indicates that the aggregative stability of these systems is provided not only by the electrostatic factor. Probably, the structural factor also makes a significant contribution due to the high hydration of molybdenum blue particles. At higher pH (≥6), partial aggregation and precipitation occurred. This behavior aligns with the optical density trends and underscores the importance of surface protonation/deprotonation equilibria in the stabilization of MoxOy cluster dispersions.

4.3. Spectroscopic Characterization (Raman and FTIR)

Raman, UV-Vis and FTIR spectroscopy provided complementary insights into the molecular structure of the molybdenum blue clusters synthesized in this work. The Raman spectra of the samples showed characteristic bands at ~230, 330, 400, 485, and 810 cm−1, attributable to wheel-type {Mo154}. The FTIR spectra of the same systems displayed bands at ~560, 630, 755, 980, 1120, 1180, 1420, 1470, 1617, 1650, 2850, 2919, 3217, and 3390 cm−1, consistent with hydrated toroidal clusters. In contrast, the highly reduced system ([R]/[Mo] = 1.0) revealed the emergence of a carbonyl band at ~1759 cm−1 and a broad envelope from ~1900 to 3500 cm−1, which point to increased condensation, bridging, and organic/carbonaceous incorporation. These findings agree with and extend the structural observations of [5,6], but the present ion-exchange route gives clearer differentiation of reduction states.

4.4. Thermal Decomposition in Inert Atmosphere (TGA/DTA and XRD)

The thermal analysis (Figure 9) uncovers two divergent reaction pathways dictated by the precursor stoichiometry. For low reduction ratios ([R]/[Mo] ≤ 0.1), the decomposition proceeds, yielding thermodynamically stable MoO2. In stark contrast, the [R]/[Mo] = 1.0 system follows a reactive decomposition trajectory. The complex mass loss profile reflects the breakdown of the organic-rich matrix (ascorbate residues) entrapped within the xerogel. At elevated temperatures (>800 °C), these residues act as an in situ carbon source, driving a carbothermal reduction of the molybdenum oxide framework. This effectively scavenges oxygen from the lattice to form hexagonal β-Mo2C. Thus, the initial reductant concentration serves as a macroscopic “knob” to tune the final phase composition from dielectric oxides to conductive carbides without external carbon feeds.

4.5. Morphology and Structural Evolution (SEM and TEM)

TEM images showed uniform ~3.5 nm nanoparticles, consistent with toroidal nanoclusters. SEM of thermally treated xerogels further supported phase assignments: irregular polygonal particles for MoO2 (low-reduction) and plate-like aggregates for Mo2C (high-reduction). It should be noted that XRD confirms the formation of the same MoO2 crystalline phase for low reduction ratios ([R]/[Mo] ≤ 0.1), but with different particle size distribution: for systems with [R]/[Mo] = 0.05, particles have size of 1 to 20 μm, and for [R]/[Mo] = 0.1 from 1.0 to 4.0 μm.
The observed morphological differences arise from variations in the colloidal precursor state and growth kinetics during thermal transformation, highlighting the role of interfacial and kinetic effects in phase formation.
For systems with a molar ratio of 0.05, the optical density is lower than for systems with a molar ratio of 0.1 (Figure 2). This indicates that there are more formed particles of the dispersed phase in the system with a 0.1 molar ratio, which means that in a system with a lower reducing agent content, molybdenum, which did not participate in the formation of particles, will be able to participate in the growth of oxide crystals under thermal treatment.

4.6. Comparison with Conventional Synthesis

Compared with traditional reduction routes that require strong reducing agents and result in residual ionic contamination [5,6], the current ion-exchange method enables clean, controlled reduction of molybdate. This not only yields size-uniform toroidal clusters but also allows direct tuning of final phase composition (oxide or carbide) via the [R]/[Mo] ratio. The distinct phase outcomes—MoO2 at [R]/[Mo] ratio ≤ 0.1 and Mo2C at high-reduction ([R]/[Mo] = 1.0)—highlight the improved synthetic flexibility and purity afforded by the ion-exchange approach.

4.7. Overall Implications

The integration of optical, electrokinetic, spectroscopic, thermal, and structural data demonstrates that ion-exchange synthesis is an effective and sustainable strategy for producing high-purity molybdenum blue dispersions with tunable composition and morphology. These materials serve as versatile precursors for advanced molybdenum-based oxides and carbides, and represent a significant advance over conventional synthesis methods.

5. Conclusions

We have established a robust, ion-exchange-mediated method for the fabrication of high-purity molybdenum blue nanoparticles. This approach effectively eliminates inorganic impurities, ensuring that the intrinsic properties of the clusters govern their assembly. Our results prove that the chemical history of the colloidal precursor dictates its functional fate: stoichiometric control allows for the selective synthesis of either MoO2 or Mo2C phases. This “precursor engineering” strategy offers a streamlined route for developing contamination-free transition metal materials for catalysis and nanoelectronics.

Author Contributions

Conceptualization, D.C., N.G.; methodology, D.C., N.G., M.M.; investigation, D.C., I.Z., A.S.; data curation, D.C., N.G., I.Z.; writing—original draft preparation, D.C.; writing—review and editing, N.G., M.M., V.N., I.Z. All authors have read and agreed to the published version of the manuscript.

Funding

This research received no external funding.

Data Availability Statement

The original contributions presented in this study are included in the article. Further inquiries can be directed to the corresponding authors.

Acknowledgments

During the preparation of this manuscript, the author used artificial intelligence-based language assistance (ChatGPT 5.0, OpenAI) for improving the clarity and readability of the manuscript. The scientific content, interpretation of results, and final conclusions were developed and approved by the authors. The authors have reviewed and edited the output and take full responsibility for the content of this publication.

Conflicts of Interest

The authors declare no conflicts of interest.

Abbreviations

The following abbreviations are used in this manuscript:
MBMolybdenum blue
POMPolyoxometallate
ORPOxidation reduction potential
TEMTransmission electron microscopy
FTIRFourier-transform infrared
TGAThermogravimetric analysis
DTADifferential thermal analysis
XRDX-ray diffraction
SEMScanning electron microscopy

References

  1. Pope, M. Chapter 4.10—Polyoxoanions: Synthesis and structure. In Comprehensive Coordination Chemistry II: Transition Metal Groups 3–6; Wedd, A.G., Ed.; Elsevier Science: New York, NY, USA, 2004; Volume 4, pp. 635–678. [Google Scholar]
  2. Müller, A.; Maiti, R.; Schmidtmann, M.; Bögge, H.; Das, S.K.; Zhang, W. Mimicking oxide surfaces: Different types of defects and ligand coordination at well defined positions of a molybdenum oxide based nanocluster. Chem. Commun. 2001, 20, 2126–2127. [Google Scholar] [CrossRef] [Scilit]
  3. Garrido Ribó, E.; Bell, N.L.; Xuan, W.; Luo, J.; Long, D.L.; Liu, T.; Cronin, L. Synthesis, Assembly, and Sizing of Neutral, Lanthanide Substituted Molybdenum Blue Wheels {Mo90Ln10}. J. Am. Chem. Soc. 2020, 142, 17508–17514. [Google Scholar] [CrossRef] [Scilit] [PubMed]
  4. Müller, A.; Meyer, J.; Krickemeyer, E.; Diemann, E. Molybdenum Blue: A 200-year-old Mystery Unveiled. Angew Chemie Int. Ed. 1996, 35, 458–463. [Google Scholar] [CrossRef] [Scilit]
  5. Gavrilova, N.; Myachina, M.; Harlamova, D.; Nazarov, V. Synthesis of Molybdenum Blue Dispersions Using Ascorbic Acid as Reducing Agent. Colloids Interfaces 2020, 4, 24. [Google Scholar] [CrossRef] [Scilit]
  6. Myachina, M.; Gavrilova, N.; Nazarov, V. Formation of Molybdenum Blue Nanoparticles in the Organic Reducing Area. Molecules 2021, 26, 4438. [Google Scholar] [CrossRef] [Scilit]
  7. Nakamura, I.; Miras, H.N.; Fujiwara, A.; Fujibayashi, M.; Song, Y.F.; Cronin, L.; Tsunashima, R. Investigating the Formation of “Molybdenum Blues” with Gel Electrophoresis and Mass Spectrometry. J. Am. Chem. Soc. 2015, 137, 4856–4863. [Google Scholar] [CrossRef] [Scilit]
  8. Lakhanpal, V.; Guillén-Soler, M.; Vilà-Nadal, L.; Long, D.L.; Cronin, L. Compression of Molybdenum Blue Polyoxometalate Cluster Rings with a New Range of Giant MB POM Clusters. J. Am. Chem. Soc. 2025, 147, 10579–10586. [Google Scholar] [CrossRef] [Scilit] [PubMed]
  9. Botar, B.; Ellern, A.; Kögerler, P. Mapping the formation areas of giant molybdenum blue clusters: A spectroscopic study. Dalton Trans. 2012, 41, 8951–8959. [Google Scholar] [CrossRef] [Scilit]
  10. Li, H.; Wang, T.; Xu, M.; Wang, P.; Gao, Z.; Zhang, W.; Liu, M.; Feng, M. Magnetic reinforcement of electrocatalytic HER performance on Keplerate polyoxomolybdate-derived multi-interfacial FeMo/Mo2C@C catalyst. J. Alloys Compd. 2024, 987, 174199. [Google Scholar] [CrossRef] [Scilit]
  11. Wu, Z.; Wang, J.; Guo, J.; Zhu, J.; Wang, D. Recent Progresses in Molybdenum-Based Electrocatalysts for the Hydrogen Evolution Reaction. J. Electrochem. 2016, 22, 192–204. [Google Scholar] [CrossRef]
  12. Minnekhanov, A.; Matsukatova, A.; Trofimov, A.; Nesmelov, A.; Zavyalov, S.; Demin, V.; Emelyanov, A. Reliable Memristive Synapses Based on Parylene-MoOx Nanocomposites for Neuromorphic Applications. ACS Appl. Mater. Interfaces 2023, 15, 54996–55008. [Google Scholar] [CrossRef] [Scilit] [PubMed]
  13. Long, D.L.; Tsunashima, R.; Cronin, L. Polyoxometalates: Building Blocks for Functional Nanoscale Systems. Angew. Chem. Int. Ed. 2010, 49, 1736–1758. [Google Scholar] [CrossRef] [Scilit]
  14. Myachina, M.; Gavrilova, N.; Poluboyarinova, K.; Nazarov, V. Properties of Molybdenum–Tungsten Blue Nanoparticles as a Precursor for Ultrafine Binary Carbides. Mater. Proc. 2021, 4, 1. [Google Scholar] [CrossRef] [Scilit]
  15. Gavrilova, N.; Myachina, M.; Dyakonov, V.; Nazarov, V.; Skudin, V. Synthesis of Microporous Mo2C-W2C Binary Carbides by Thermal Decomposition of Molybdenum-Tungsten Blues. Nanomaterials 2020, 10, 2428. [Google Scholar] [CrossRef] [Scilit]
  16. Bhattacharjee, J. Exploration of Molybdenum Oxide Compounds. A Review. Catal. Res. 2024, 4, 011. [Google Scholar] [CrossRef] [Scilit]
  17. Zhang, M.; Li, H.; Zhang, J.; Lv, H.; Yang, G.-Y. Research advances of light-driven hydrogen evolution using polyoxometalate-based catalysts. Chin. J. Catal. 2021, 42, 777–793. [Google Scholar] [CrossRef] [Scilit]
  18. Gavrilova, N.; Dyakonov, V.; Myachina, M.; Nazarov, V.; Skudin, V. Synthesis of Mo2C by Thermal Decomposition of Molybdenum Blue Nanoparticles. Nanomaterials 2020, 10, 2053. [Google Scholar] [CrossRef] [Scilit]
  19. Garrido Ribó, E.; Bell, N.L.; Long, D.L.; Cronin, L. Engineering Highly Reduced Molybdenum Blue Clusters: Reduction Degree, Structure and Function. Angew. Chem. Int. Ed. 2022, 61, e202201672. [Google Scholar] [CrossRef] [Scilit]
  20. Akimov, A.; Zhirov, N.; Prosvirin, I.; Gerasimov, E.; Akimov, A. Synthesis of Polyoxometallate Compounds Based on Molybdenum Blue: Stable Cluster Formation and Media Control. Inorg. Synth. 2025, 349, 125420. [Google Scholar] [CrossRef] [Scilit]
  21. Cho, G.; Park, Y.; Hong, Y.K. Ion exchange: An advanced synthetic method for complex nanoparticles. Nano Converg. 2019, 6, 17. [Google Scholar] [CrossRef] [Scilit] [PubMed]
  22. Son, D.H.; Hughes, S.M.; Yin, Y.; Alivisatos, A.P. Cation exchange reactions in ionic nanocrystals. Science 2004, 306, 1009–1012. [Google Scholar] [CrossRef] [Scilit] [PubMed]
  23. Luther, J.M.; Zheng, H.; Sadtler, B.; Alivisatos, A.P. 25th Anniversary Article: Ion Exchange in Colloidal Nanocrystals. Adv. Mater. 2013, 25, 6073–6092. [Google Scholar] [CrossRef] [Scilit]
  24. Zizak, Z.; Cvjetko Bubalo, M.; Vidović, S.; Kučić Grgić, D.; Radošević, K.; Grubišić, M.; Gajović, A. New sustainable, scalable and one-step synthesis of iron oxide nanoparticles by ion exchange process. Nanomaterials 2021, 11, 798. [Google Scholar] [CrossRef] [Scilit]
  25. Beberwyck, B.J.; Surendranath, Y.; Alivisatos, A.P. Sequential anion and cation exchange in colloidal nanocrystals for complete material transformations with morphological retention. J. Am. Chem. Soc. 2015, 137, 17843–17853. [Google Scholar] [CrossRef] [Scilit]
  26. Gao, F.; Cai, W.; Liu, L. Hollow micro/nanostructured materials prepared by ion-exchange synthesis and their potential applications. New J. Chem. 2014, 38, 4389–4408. [Google Scholar] [CrossRef] [Scilit]
  27. Henry, D.C. The Cataphoresis of Suspended Particles. Part I. The Equation of Cataphoresis. Proc. R. Soc. Lond. Ser. A Contain. Pap. A Math. Phys. Character 1931, 133, 106–129. [Google Scholar] [CrossRef] [Scilit]
  28. Ohshima, H. A simple expression for Henry’s function for the retardation effect in electrophoresis of spherical colloidal particles. J. Coll. Int. Sci. 1994, 168, 269–271. [Google Scholar] [CrossRef] [Scilit]
  29. Müller, A.; Sarkar, S.; Shah, S.Q.N.; Bogge, H.; Schmidtmann, M.; Sarkar, S.; Kogerler, P.; Hauptfleisch, B.; Trautwein, A.X.; Schunemann, V. Archimedean synthesis and magic numbers: “sizing” giant molybdenum-oxide-based molecular spheres of the keplerate type. Ang. Chem. Int. Ed. 1999, 38, 3238–3241. [Google Scholar] [CrossRef]
  30. Bugayev, A.; Nikitin, S. Optical bleaching of the IVCT-absorption bands of the molybdenum blues. Opt. Commun. 2000, 180, 69–71. [Google Scholar] [CrossRef] [Scilit]
  31. Nagul, E.; McKelvie, I.; Worsfold, P.; Kolev, S. The molybdenum blue reaction for the determination of orthophosphate revisited: Opening the black box. Anal. Chim. Acta 2015, 890, 60–82. [Google Scholar] [CrossRef] [Scilit] [PubMed]
  32. Dewhirst, R.A.; Fry, S.C. The oxidation of dehydroascorbic acid and 2,3-diketogulonate by distinct reactive oxygen species. Biochem. J. 2018, 475, 3451–3470. [Google Scholar] [CrossRef] [Scilit]
  33. Mestl, G.; Srinivasan, K.K. Raman Spectroscopy of Monolayer- Type Catalysts: Supported Molybdenum Oxides. Catal. Rev. Sci. Eng. 1998, 40, 451–570. [Google Scholar] [CrossRef] [Scilit]
  34. Maczka, M.; Pietraszko, A.; Paraguassu, W.; Souza Filho, A.; Freire, P.T.C.; Mendes Filho, J.; Hanuza, J. Structural and vibrational properties of K3Fe(MoO4)2(Mo2O7)—A novel layered molybdate. Phys. Condens. Matter 2009, 21, 095402. [Google Scholar] [CrossRef] [Scilit]
  35. Guedes, G.; Wang, S.; Fontana, F.; Figueiredo, P.; Lindén, J.; Correia, A.; Pinto, R.; Hietala, S.; Sousa, F.; Santos, H. Dual-Crosslinked Dynamic Hydrogel Incorporating {Mo154} with pH and NIR Responsiveness for Chemo-Photothermal Therapy. Adv. Mater. 2021, 33, 2007761. [Google Scholar] [CrossRef] [Scilit]
  36. Noro, S.; Tsunashima, R.; Kamiya, Y.; Uemura, K.; Kita, H.; Cronin, L.; Akutagawa, T.; Nakamura, T. Adsorption and catalytic properties of the inner nanospace of a gigantic ring-shaped polyoxometalate cluster. Angew. Chem. Int. Ed. 2009, 48, 8703–8706. [Google Scholar] [CrossRef] [Scilit]
  37. Ostroushko, A.A.; Korotayev, V.Y.; Tonkushina, M.O.; Grzhegorzhevskii, K.V.; Vazhenin, V.A.; Kutyashev, I.B.; Martynova, N.A.; Men’shikov, S.Y.; Selezneva, N.V. Electrotransport, sorption, and photochemical properties of nanocluster polyoxomolybdates with a toroidal structure. Russ. J. Phys. Chem. 2012, 86, 1268–1273. [Google Scholar] [CrossRef] [Scilit]
  38. Pope, M.T.; Müller, A. Polyoxometalate chemistry: An old field with new dimensions in several disciplines. Angew. Chem. Int. Ed. 1991, 30, 34–48. [Google Scholar] [CrossRef] [Scilit]
  39. Streletskiy, O.A.; Zavidovskiy, I.A.; Nuriahmetov, I.F.; Khaidarov, A.A.; Pavlikov, A.V.; Minnebaev, K.F. The Field-Effect Transistor Based on a Polyyne–Polyene Structure Obtained via PVDC Dehydrochlorination. J. Compos. Sci. 2023, 7, 264. [Google Scholar] [CrossRef] [Scilit]
Figure 1. The synthesis scheme, which includes the stage of ion exchange (IE), reduction of the obtained molybdate ions to building blocks, and subsequent self-organization of building blocks into a colloidal particle.
Colloids 10 00023 g001
Figure 2. Optical properties of the MBs. (a) Absorbance spectra for molybdenum blue dispersion on wavelength. (b) Dependence of the optical density (λ = 750 nm) on the molar ratio [R]/[Mo]. (c) Appearance of the samples (dilution by a factor of 250).
Colloids 10 00023 g002
Figure 3. TEM images and particle size distribution (numerical) of molybdenum blue: (a) [R]/[Mo] = 0.05, (b) [R]/[Mo] = 0.1, (c) [R]/[Mo] = 1.0.
Colloids 10 00023 g003
Figure 4. Dependences of the different parameters on time: (a) ORP; (b) pH; (c) optical density (λ = 750 nm) of MB.
Colloids 10 00023 g004
Figure 5. Dependence of the optical density (λ = 750 nm) of MB on pH: (a) 1 day; (b) 7 days; (c) 14 days.
Colloids 10 00023 g005
Figure 6. The dependence of ζ-potential of MB nanoparticles synthesized with different [R]/[Mo] ratios on pH.
Colloids 10 00023 g006
Figure 7. Normalized background-corrected Raman spectra of molybdenum blue dispersions synthesized at different molar ratios [R]/[Mo]. The band at ~230 cm−1 is assigned to O–Mo–O deformation vibrations, while the bands at ~485 and ~970 cm−1 correspond to bending and stretching modes of terminal Mo=O bonds, respectively. The bands in the 660–810 cm−1 region are attributed to asymmetric stretching vibrations of bridging Mo–O–Mo linkages, with the feature at ~810 cm−1 being characteristic of polyoxometalate-type building units.
Colloids 10 00023 g007
Figure 8. Normalized background-corrected FTIR spectra of molybdenum blue dispersions synthesized at different [R]/[Mo] ratios. All three samples exhibit nearly identical spectra, characterized by Mo–O–Mo vibrations below 800 cm−1, terminal Mo=O stretching near ~980 cm−1, and broad O–H stretching bands at 3100–3500 cm−1, indicating hydrated polyoxomolybdate frameworks. In contrast, the [R]/[Mo] = 1.0 sample shows additional low-frequency bands, new absorptions in the 1000–1200 and ~1750 cm−1 regions, and a broad 1900–3500 cm−1 envelope, consistent with the presence of organic and carbonyl-containing species.
Colloids 10 00023 g008
Figure 9. (a) TGA curves and (b) DTA curves of xerogels derived from molybdenum blue dispersions at different [R]/[Mo] ratios. Samples with [R]/[Mo] = 0.05 and 0.10 exhibit similar thermal behavior, showing ~22% mass loss up to ~380 °C with an exothermic event, followed by a stable plateau up to ~800 °C and high-temperature endothermic features. In contrast, the [R]/[Mo] = 1.0 sample displays continuous mass loss up to ~835 °C and distinct endothermic events, indicating a different decomposition pathway and higher organic content.
Colloids 10 00023 g009
Figure 10. XRD patterns of xerogels with different [R]/[Mo] molar ratios synthesized at 900 °C in inert atmosphere.
Colloids 10 00023 g010
Figure 11. SEM image of thermally treated xerogel at different [R]/[Mo]: (a) 0.05; (b) 0.1; (c) 1.0.
Colloids 10 00023 g011
Disclaimer/Publisher’s Note: The statements, opinions and data contained in all publications are solely those of the individual author(s) and contributor(s) and not of MDPI and/or the editor(s). MDPI and/or the editor(s) disclaim responsibility for any injury to people or property resulting from any ideas, methods, instructions or products referred to in the content.