You are currently viewing a new version of our website. To view the old version click .
  • Article
  • Open Access

2 June 2019

Effect of SLM Build Parameters on the Compressive Properties of 304L Stainless Steel

,
,
,
,
,
and
1
Department of Mechanical and Aerospace Engineering, Missouri University of Science and Technology, Rolla, MO 65409, USA
2
Department of Materials Science and Engineering, Missouri University of Science and Technology, Rolla, MO 65409, USA
3
Spirit AeroSystems, Wichita, KS 67210 USA
*
Author to whom correspondence should be addressed.
This article belongs to the Special Issue Selective Laser Melting: Materials and Applications

Abstract

Selective laser melting (SLM) is well suited for the efficient manufacturing of complex structures because of its manufacturing methodology. The optimized process parameters for each alloy has been a cause for debate in recent years. In this study, the hatch angle and build orientation were investigated. 304L stainless steel samples were manufactured using three hatch angles (0°, 67°, and 105°) in three build orientations (x-, y-, and z-direction) and tested in compression. Analysis of variance and Tukey’s test were used to evaluate the obtained results. Results showed that the measured compressive yield strength and plastic flow stress varied when the hatch angle and build orientation changed. Samples built in the y-direction exhibited the highest yield strength irrespective of the hatch angle; although, samples manufactured using a hatch angle of 0° exhibited the lowest yield strength. Samples manufactured with a hatch angle of 0° flowed at the lowest stress at 35% plastic strain. Samples manufactured with hatch angles of 67° and 105° flowed at statistically the same flow stress at 35% plastic strain. However, samples manufactured with a 67° hatch angle deformed non-uniformly. Therefore, it can be concluded that 304L stainless steel parts manufactured using a hatch angle of 105° in the y-direction exhibited the best overall compressive behavior.

1. Introduction

The demand for stronger, lighter, and more customizable parts has driven the development and research of new manufacturing methods, tools, and technologies. In this sense, the development and continuous improvement of manufacturing methods have dramatically changed the way designers and engineers pursue design and manufacturing [1]. Selective laser melting (SLM), a powder-bed fusion process of metal additive manufacturing (AM), involves the production of dense parts from a 3D computer-aided design model by the selective melting of metal powder by using a laser heat source. The SLM process is a timely and cost-effective method of building complex geometries that are impossible to manufacture using conventional processes [2].
During part fabrication in SLM, fine metal powder is introduced into the build chamber by a feeding system or powder hopper, and a soft distribution recoater blade is used to drag the powder across the build plate. A high-powered laser is then used to selectively melt the powder together to form a finished part based on the principles of rapid prototyping [3]. The complexity of the SLM process makes it difficult to characterize and understand the mechanical performance of parts made using this technique [4,5]. In AM, part anisotropy and mechanical performance are strongly affected by the process parameters. By varying the process parameters, the mechanical properties can be optimized. Many investigators have studied the effects of process parameters on the behavior of additively manufactured parts. For example, Popovich et al. [6] investigated the anisotropy of mechanical properties of parts manufactured using SLM. They found a dependence of the mechanical properties of Ti-6Al-4V on the build orientation. From their study, it was found that the strength of the produced part is dependent on the grain growth direction, which is controlled by the build orientation. Miranda et al. [7] developed a predictive model for the physical and mechanical properties of 316L stainless steel. They observed changes in the mechanical properties of the steel when the laser speed, scanning speed, and scanning spacing was changed. They attributed these changes in mechanical properties to variations in densification levels and residual porosity. The effects of build size, build orientation, and part thickness on the tensile properties of 304L stainless steel has also been studied by Ortiz Rios et al. [8]. During their study, they observed that the part size had no effects on the mechanical properties, however, part orientation did. Guan et al. [3] and Anam et al. [9] individually tried to investigate the hatch angle used during the SLM process. They both investigated different hatch angle sets and used different methods of assessments in their studies. Guan et al. concluded that a hatch angle of 105° produced the best part with respect to tensile strength while Anam et al. concluded that a 67° hatch angle produced the best part with respect to microstructure. Other works available in literature with respect to the effects of process parameters on the mechanical properties of AM parts can be found in [10,11,12].
304L stainless steel, a type of authentic steel, has gained a lot of interest over the years due to its chemical composition and mechanical properties [13]. When 304L stainless steel is used for part production in SLM, the low carbon content minimizes deleterious carbide precipitation, which minimizes the need for solution annealing. Some of the available works on SLM of 304L stainless steel can be found in [8,13,14,15,16]. SLM manufactured 304L stainless steel exhibits higher mechanical strength (yield and ultimate tensile strength) over conventionally manufactured 304L stainless steel, which makes it applicable for use in salt-water body applications that require high strength.
At the completion of an in-depth literature review, it was observed that although many works exist with respect to SLM process parameters, there is not enough information about the hatch angle and how it affects the mechanical properties of manufactured parts. The majority of available works considered a hatch angle of 67° in their studies; however, Guam et al. [3] claimed 105° produced better parts. It was also observed that most of the available process parameter investigations only considered tensile stress–strain curves, which in some cases does not represent the complete behavior of a material. In this work, the mechanical performance of SLM 304L stainless steel was investigated with respect to changes in the hatch angle and build orientation. Test specimens were built with three hatch angles (0°, 67°, and 105°) in three build orientations (x, y, and z) and tested in quasi-static compression. Build orientation was considered because previous works show that build orientation affects the mechanical properties of the SLM parts [8]. The yield strength and plastic flow stress at 35% plastic strain were evaluated. A two-way analysis of variance (two-way ANOVA) technique and Tukey’s test were used to evaluate the difference in mechanical responses caused by changes in the hatch angles and build orientations, while also considering hatch angle–build orientation interaction. The ANOVA technique is the most commonly used statistical tool for investigating effects and interactions between two or more factors. Some available studies using ANOVA in AM can be found in [17,18].

2. Materials and Methods

2.1. Fabrication

Argon gas atomized 304L stainless steel powder (Figure 1), ranging in particle size between 15 µm and 63 µm, was purchased from LPW technology and used in this study. The chemical composition of the powder is shown in Table 1. Kriewall et al. [13] conducted a detailed investigation on the powder used in this work. Octagonal samples were manufactured in an argon-filled environment using a Renishaw AM250 SLM machine (machine parameters are summarized in Table 2). Octagonal geometry was selected due to the convenience for machining samples built in the x- and y-direction.
Figure 1. SEM observations of the 304L powder used in this work, showing its morphology at different magnifications: (a) 500 μm, (b) 190 μm, and (c) 100 μm.
Table 1. Chemical composition (in wt.%) of 304L stainless steel powder.
Table 2. Selective laser melting (SLM) machine parameters.
In SLM, the selected scan strategy controls the shape of the melt pool and the resulting microstructure. Hatch angle at θ° can be defined as the angle between the scanning directions of two immediate scan layers, as shown in Figure 2. The hatch angle controls the variance in the 360° space, the spacing between similarly oriented layers, and beam titling. As there are 360 possible scanning directions, there are 360 possible hatch angles. Hatch angles at 67° and 105° were selected for this study because they have been studied by other investigators and are known to produce parts with excellent properties [3,9], while a 0° hatch angle was selected to investigate the effects of no rotation between consecutive layers.
Figure 2. Schematic view of the scan direction in-between layers (configuration (f) in Table 3).
Octagonal samples with a side length of 3.84 mm and height of 27.80 mm were manufactured with three different hatch angles and in three distinct orientations (Table 3), subsequently referred to as configurations (a) to (i). The x-direction (0°) was taken as the reference orientation (see Figure 3). The other two build directions (y-direction and z-direction) were obtained by rotating the reference sample (x-direction) 90° around the z- and y-axis, respectively. The direction of the height (longest side) of the octagonal cylinder was in correlation with the build direction in accordance to ISO/ASTM 52921 standard [19,20]. These three build directions (x-, y-, and z-direction) were considered for investigation because structures built using these orientations require little or no support material. After manufacturing, compression specimens were prepared for compression testing by machining the octagons into solid cylinders (diameter 6.35 ± 0.07 mm, height 6.35 ± 0.30 mm) using a computer numerical controlled lathe (at 250 rpm spindle and 0.006 in/rev feed). The samples were machined to produce smooth surfaces and flat parallel ends required for accurate testing.
Table 3. Summary of different build configurations studied during this study.
Figure 3. Schematic view of build orientations for manufacturing SLM parts.

2.2. Experimental Testing

2.2.1. Porosity

The percentage porosity in the manufactured parts was measured using the Archimedes’ method (ASTM B962). The samples were assumed to have little to no surface connected porosity, so the saturated weight was not measured, and oil impregnation of the parts was not done. The machined samples’ dry weight and suspended weight were used to calculate the bulk density of the parts (Equation (1)) while the ratio of the measured density and the density of 304L stainless steel was used to calculate the percentage porosity of the manufactured parts (Equation (2)).
ρ* = D/(D − S)
% porosity = 1 − (ρ*/ρ × 100)
where ρ* is the measured density, D is the dry weight of the specimen, S is the suspended weight, and ρ is the bulk density of stainless steel taken as 8.00 g/cc [21].

2.2.2. Compression Tests

Compression tests for each experimental case were performed using an MTS 380 frame, according to ASTM E9-09 standard [22]. Three samples were compressed per each case to check repeatability of the data. The crosshead speed of the frame was fixed to obtain an initial strain rate of 5 × 10⁻³ min−1 in the sample. Force and displacement changes were tracked during tests and used to plot the stress–strain curve. The machine crosshead displacement and load were converted into true stress–true strain using the following equations (Equation (3a–d)):
σ = (F/A0)
ε = (L − L0)/L0
σT = σ(1 − ε)
εT = ln(1 − ε)
where F is the measured force (N), A0 is the cross-sectional area of the sample (m2), L0 is the initial length of the sample (m), L is the final length of the sample (m), σ is the engineering stress (Pa), ε is the engineering strain (m/m), σT is the true stress (Pa), and εT is the true strain (m/m).
In order to compare and analyze the experimental data, two data points (yield strength and flow stress at 35% plastic strain) on the stress–strain curve were selected. The yield strength was selected because of its importance in part design. 35% plastic strain was selected because it was observed during testing that at this point, samples built with hatch angles of 0° and 67° showed profound non-uniform deformation, inferring that the engineering to true stress conversion was not valid at strains higher than this value. This non-uniform deformation will be presented later in this paper.

2.2.3. Examination

Micrographs of the machined and untested samples were taken using an optical microscope. The machined samples were mounted in Bakelite. They were then ground using 320 SiC paper to the desired area. The samples were polished with diamond solution to 1 micron with a final polish of 0.05 micron colloidal silica. A 60:40 nitric acid:water electrolyte ratio was used to facilitate electrolytic polishing, which was done at 6 V for 10 s. The machined samples were cut and prepared according to ASTM E3-11 [23].
Due to the observance of non-uniform deformation after compression, surface aspect ratio measurement and calculations were carried out in the tested samples. Equation (4) was used to calculate the surface aspect ratio. The input parameters used in Equation (4) were obtained by measurements of the longest and shortest Ferets of each compressed sample using image J. Figure 4 shows the visual representation of the measured parameters where Mf is the length of the major Feret (m) and Nf is length of the minor Feret (m).
As = (Mf/Nf)
Figure 4. Major and minor Feret measurement illustration.
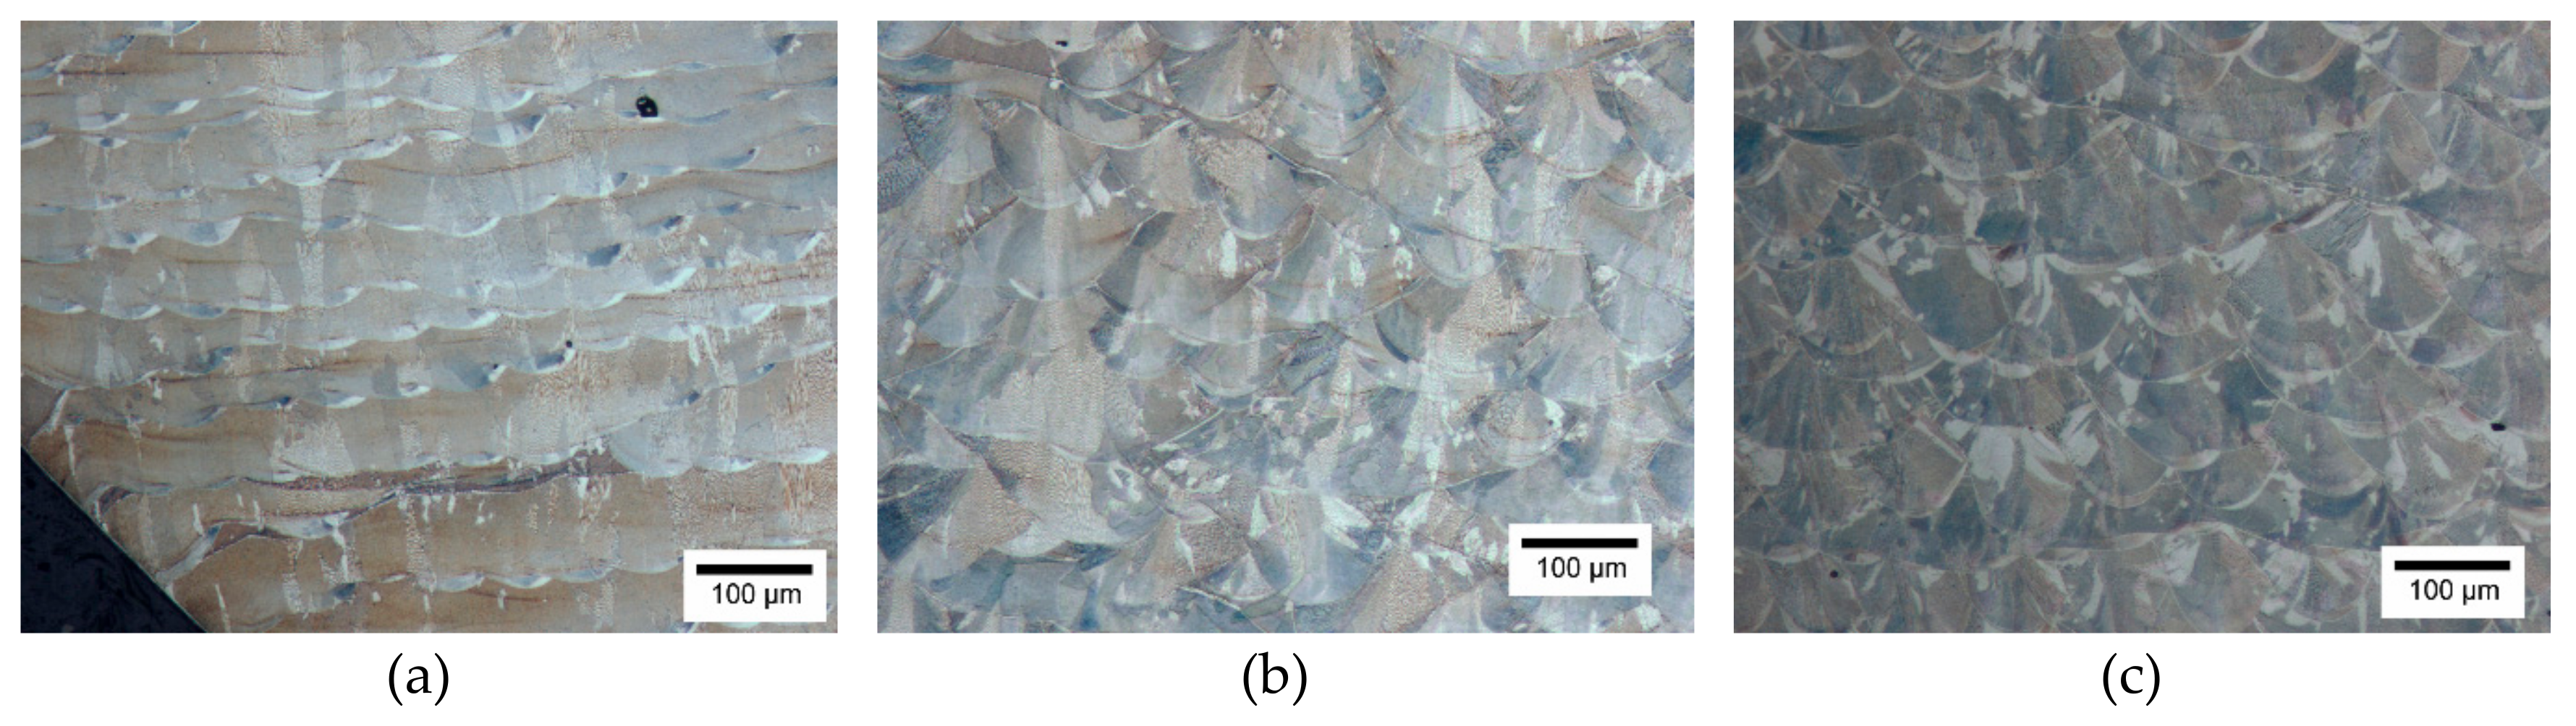
2.3. Statistical Analysis

In this study, two-way ANOVA was used in the analysis of the compression data. In a two-way ANOVA, the means of two groups of independent factors are compared. The aim of a two-way ANOVA is to test if there exists an interaction between the two independent variables on the dependent variable [24]. In a two-way ANOVA, the interaction term checks if the effect of one independent variables on the dependent variable is equal for all values of the other independent variable. The effects of hatch angle and build orientation were evaluated using a two-way ANOVA. These two build parameters, hatch angle and build orientation, were the independent variables (factors). The response variables were the yield strength and plastic flow stress at 35% plastic strain. These two points on the stress–strain curve (yield strength and flow stress at 35% plastic strain) were selected to investigate the effects of hatch angle and build orientation on the elastic and plastic properties of SLM 304L stainless steel. Table 4 shows the full-factorial design, while Table 5 shows the breakdown of the ANOVA table used during this analysis. For each case, three replicates were tested. The mathematical model used during this analysis is as follows [24]:
Yijk = μ + αi + βj + (αβ)ij + ϵijk, ϵ ~ iid N(0, σ2)
where Yijk is the kth observation at the ith factor A level and jth factor B level, μ is the overall mean, αi is the factor effect of factor A at level i, βj is the factor effect of factor B at level j, (αβ)ij represents the interaction effect of factors A and B, ϵijk is the random error, and ϵ ~ iid N(0, σ2) is a restriction placed on the error term, meaning the error terms are independent and identically distributed. These error terms are distributed normally around a zero mean value and a variance of ‘σ2’.
Table 4. Full-factorial design.
Table 5. ANOVA table for the factorial experiment.

3. Results and Discussions

3.1. Microstructural Analysis and Relative Density

The microstructure of the samples was inspected in the as-built state. Some of the optical images obtained are shown in Figure 5. The microstructure is typical of SLM-printed 304L etched with an electrolytic etchant [25,26], and consists of nearly 100% austenitic with a small amount of delta-ferrite phase, as reported by Amine et al. [25] for the same SLM 304L stainless steel. From Figure 5, the melt pool boundary can be seen as a thin white line, either in a cup shape or in a relatively straight line (depending on the orientation of the mounted specimen). The interior of the melt pool includes bright and dark regions, which consists of a cellular structure. The cellular structure is a fine feature that can be better visualized by higher resolution imaging, as shown in Figure 6 [27]. In 316L, which shows a similar microstructure to 304L, the cellular structure was found to contain highly entangled dislocations, and to be associated to the segregation of Cr and Mo to the cell walls [28]. It is likely that the electrolytic etchant used in this study preferentially etched the cell walls due to the concentration of dislocations there, which led to their distinct visibility in the optical microscope.
Figure 5. Microstructure side-by-side comparison of (a) 0°, (b) 67°, and (c) 105° hatch angle specimens built in the y-direction before compression test. Electrolytic etchant in 60:40 nitric acid:water solution.
Figure 6. Close inspection of the 0° hatch angle, y-direction specimen showing the cellular structure and melt pool boundary, at two different magnifications: (a) 50 µm and (b) 10 µm.
The density measurements done by Archimedes’ method resulted in densities ranging from 98.6% to 98.8% dense. There were no clear trends in the data, indicating that the hatch angle rotation and build orientation did not noticeably affect the density of the manufactured parts. Defects in SLM processes do not tend to be random due to the layer-by-layer nature of the process. This makes microstructural evaluation of defect distribution and volume difficult, as it is unknown if the microstructural image adequately captures these periodic defects. For this reason, a quantitative measurement of porosity via microstructural evaluation was not performed. Qualitatively, there were also no obvious differences in the microstructural porosity between specimens. Several pores can be seen in the images in Figure 5, confirming that full density was not achieved.

3.2. Compressive Behavior

After compression, the stress–strain curves were developed using Equations (3) and (4). The strains of these curves were calculated using the machine displacement. Due to the specimen size, inaccurate strain measurements were obtained at low displacements; therefore, the elastic moduli could not be evaluated. However, it was possible to compare the slopes of the different stress–strain curves. Figure 7 shows two examples of such comparisons.
Figure 7. True stress–strain curve of SLM 304L stainless steel showing the elastic region: (a) samples built with three hatch angles in the y-direction, (b) samples built in three orientations using hatch angle of 105°.
From Figure 7, it can be seen that by varying the hatch angle and build orientation, little changes (less than 10% in both cases) can be observed in the slopes of the stress–strain curves. It was assumed that these little variations were as a result of different experimental conditions.
After yielding, non-uniform plastic deformation, rather than barreling at the midpoint, was observed in some samples at high strains. This non-uniform plastic deformation has never been observed or reported in literature. Figure 8 shows the final geometry of the samples after compression. Samples built with a 0° hatch in the z-direction sheared and ovalled (Figure 8c), while samples built in the same orientation with a 67° hatch angle only sheared (Figure 8f). It was also observed that samples built with hatch angles of 0° and 67° formed an ellipsoid when built in the x-direction (Figure 8a and 8d). However, only samples built with a hatch angle of 0° sheared and formed an ellipsoid when built in the y-direction (Figure 8b). No shearing or ovalling was observed in samples built using a hatch angle of 105° after compression (Figure 8g–i).
Figure 8. Geometry of untested and tested samples (where ac equals samples built with a 0° hatch angle in the x-, y-, and z-direction, respectively, df equals samples built with a 67° hatch angle in the x-, y-, and z-direction, respectively, and gi equals samples built with a 105° hatch angle in the x-, y-, and z-direction, respectively).
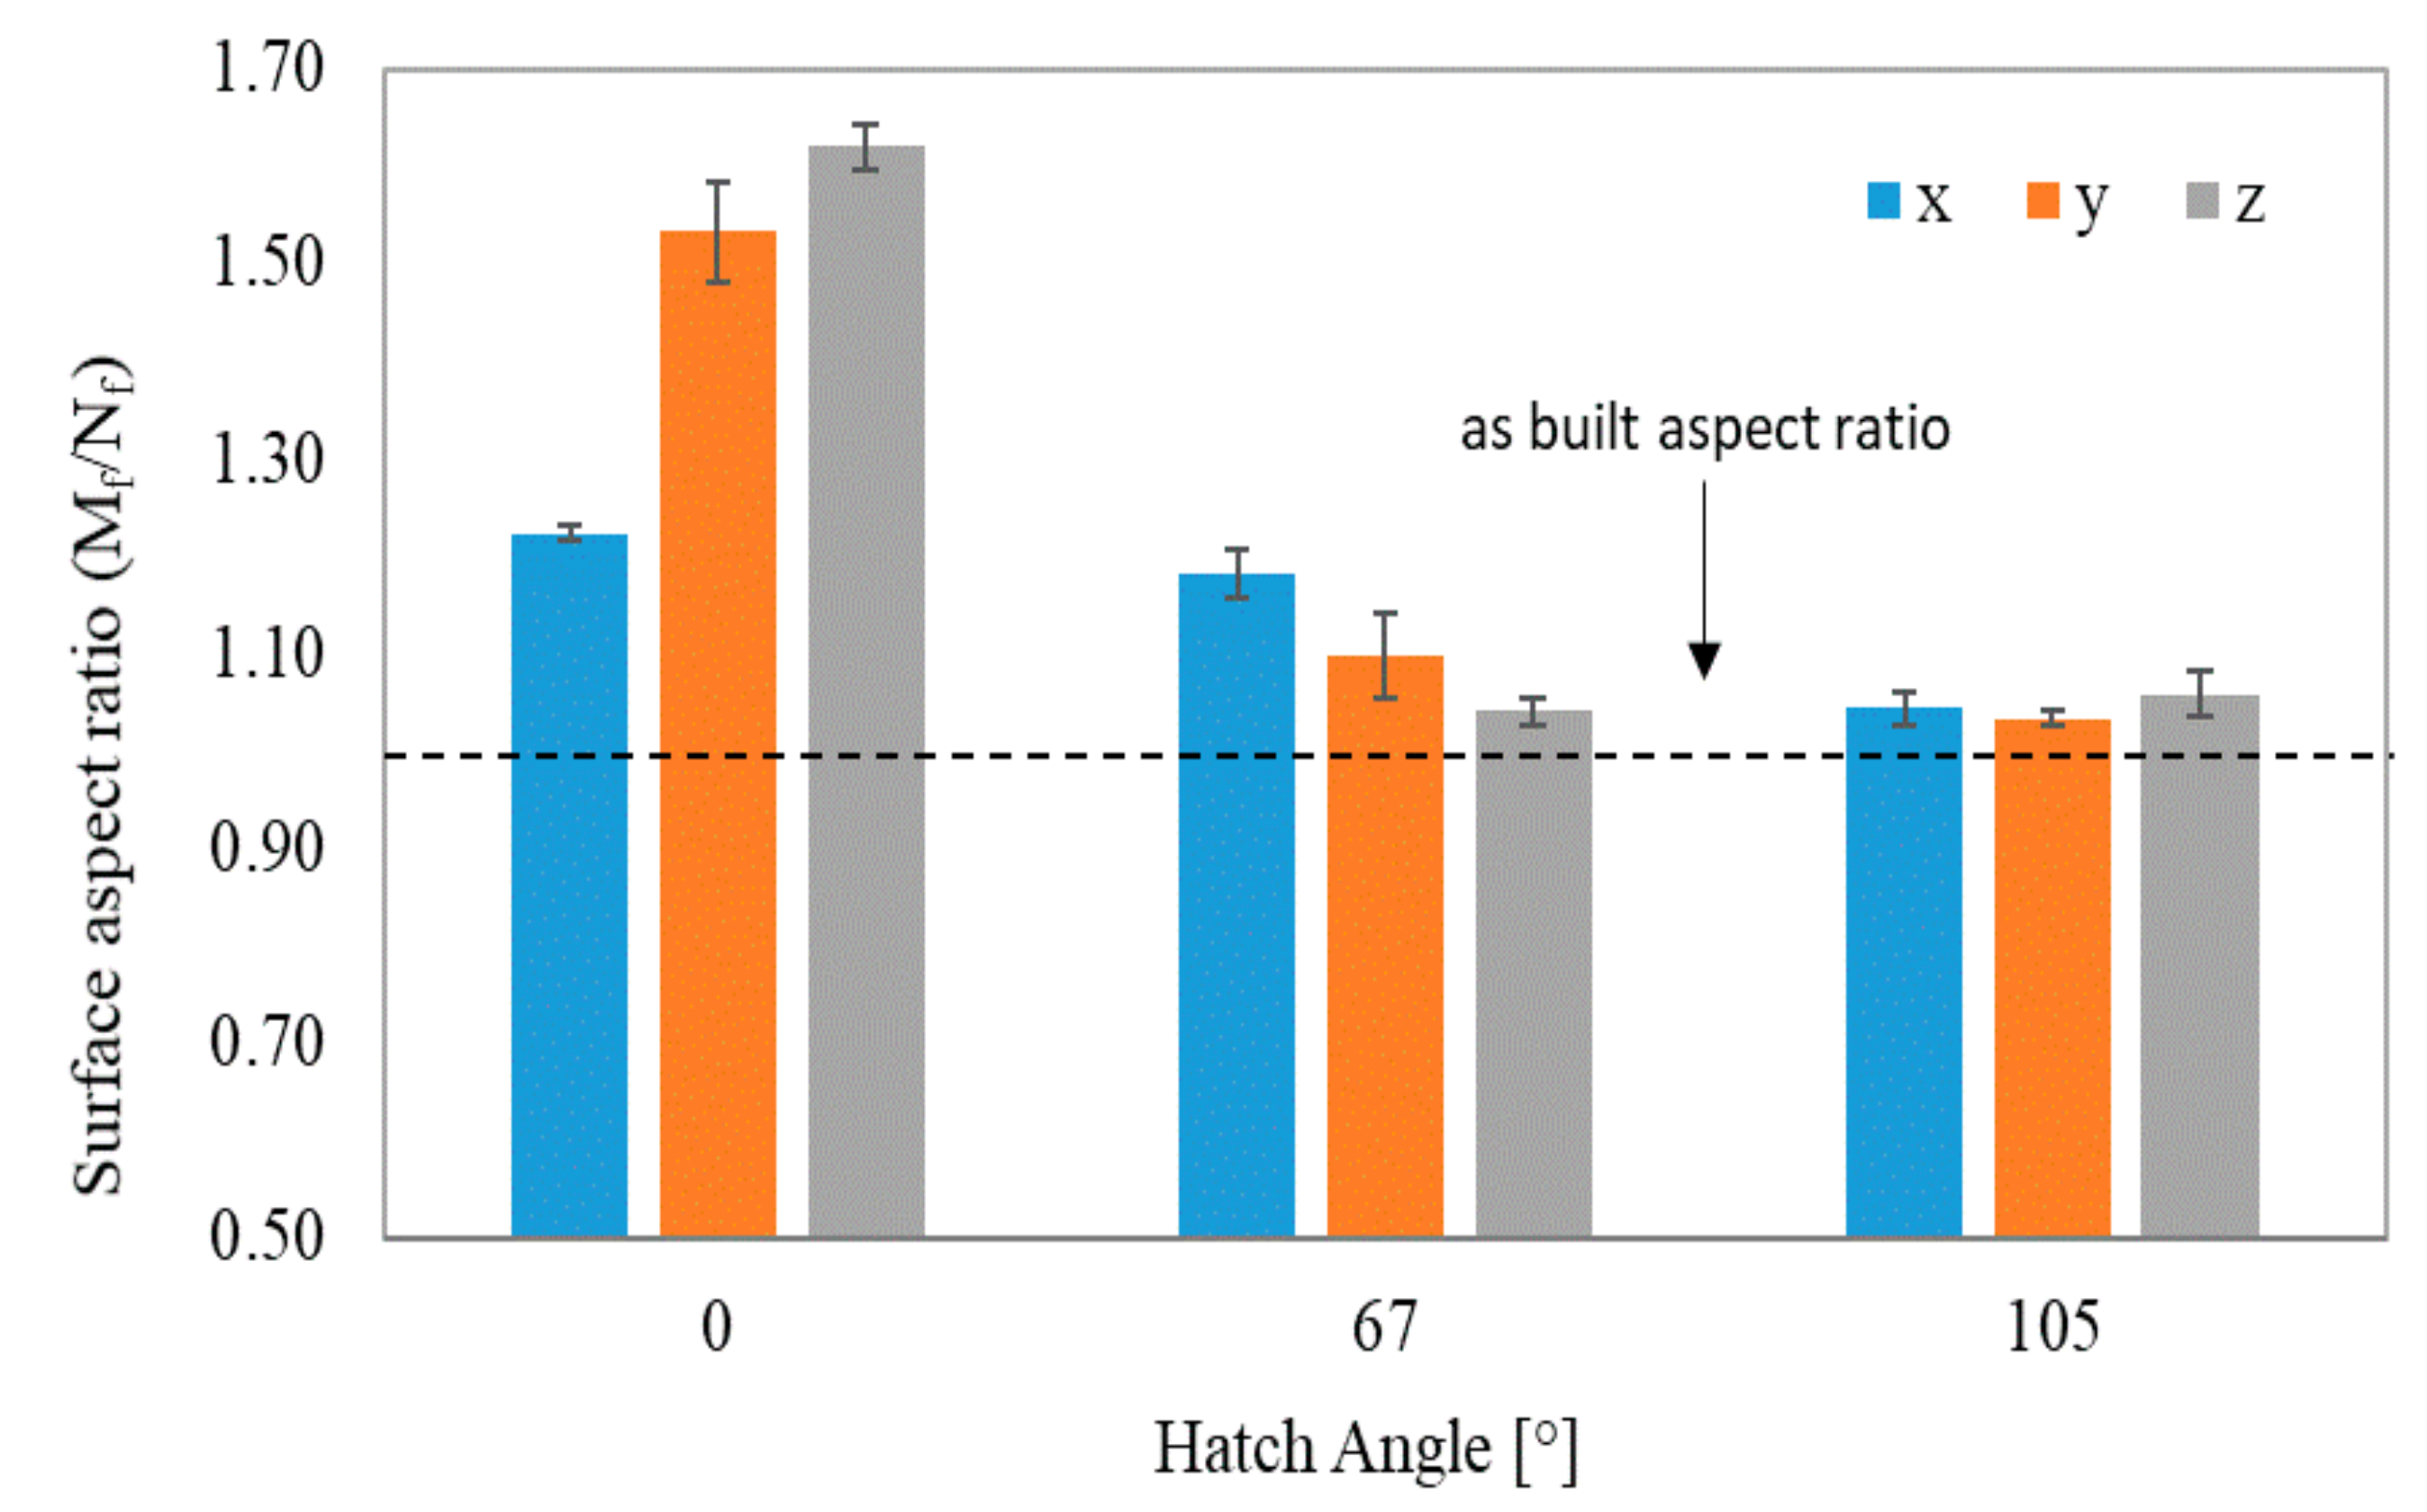
The degree of non-uniformity was evaluated quantitatively by surface aspect ratio calculations using Equation (4). Figure 9 shows the average surface aspect ratios calculated. From Figure 9, it can be observed that samples built with a 0° hatch angle were the least circular after compression followed by samples built using a 67° and 105° hatch angle, respectively. Samples built with a hatch angle of 105° had similar circularities in all build orientations.
Figure 9. Surface aspect ratio comparison of compressed samples built using different hatch angles and build orientations.
The compressive true stress–plastic strain curves are shown in Figure 10. From Figure 10, the yield strength (stress at 0% plastic strain) and flow stress at 35% plastic strain were extrapolated using a MATLAB code. Table 6 shows the full factorial design adopted for this study as well as the yield strength, flow stress at 35% plastic strain, the sample mean, and standard deviation. From Table 6, it can be seen that the manufactured samples showed higher strengths when the layer structure was parallel to the direction of the force (i.e., x- and y-direction) when compared to samples in which the structure was perpendicular to the loading direction (z-direction). This behavior was also recorded by Meier et al. [29] and Hitzler et al. [16] in their study. The data in Table 6 was used as input data for the two-way ANOVA analysis.
Figure 10. Plastic true stress–strain curve showing the compressive results for all tested conditions.
Table 6. Full factorial design of the two control factors with three replicates.

3.3. Statistical Analysis

A two-way ANOVA was performed using the experimental data in Table 6 to check which hatch angle and build orientation produced the best part with respect to compressive performance. The analysis of variance was carried out at a confidence level of 95% (α = 0.05) using JMP 14, a statistical commercial software. It was assumed that the data obtained from the experiments were normally distributed, the variance between the dependent variables were equal and the obtained data were independent and identically distributed. The ANOVA and treatment effects results for the analyzed response variables are reported in Table 7, Table 8, Table 9 and Table 10. During this study, four null hypotheses (H0) concerning the treatment effects were considered. These null hypotheses were considered in order (i.e., 1, 2, … 4) and are as follows:
Table 7. ANOVA results for yield strength (α = 0.05).
Table 8. Effects test for yield strength (α = 0.05).
Table 9. ANOVA results for flow stress at 35% plastic strain (α = 0.05).
Table 10. Effects table for flow stress at 35% plastic strain (α = 0.05).
  • H0Treat.Comb: μ11 – μ12 = … = μab (tests to see if the treatment combination means are equal).
    Reject H0 if MSTreat. Comb/MSError > Fα(ab − 1,ab(n−1))
  • H0I*II: (αβ)ij = 0; i,j (tests for the presence of interaction)
    Rejected H0I*II if MSI*II/MSError > F α((a−1)(b−1),ab(n−1))
  • H0I: α1 = α2 = … = αI = 0 (test to see if there is a difference between the hatch angle means)
    Reject H0I if MSI/MSError > F α(a−1,ab(n−1))
  • H0II: β1 = β2 = … = βII = 0 (tests to if there is a difference between the build orientation means)
    Reject H0II if MSII/MSError > F α(b−1,ab(n−1))
From Table 7 and Table 9, it can be observed that the p-value for C. total is <0.05, which means there exists a significant difference between the means of the treatment combinations (i.e., the null hypothesis H0 was rejected and the model can be used to analyze the experimental data). Since the model was found to be significant, the interaction between hatch angle and build orientation was examined using the effects table (Table 8 and Table 10) for both response variables.
From Table 8, the interaction effect on the measured yield strength was found to be insignificant (i.e., failed to reject the null hypothesis H0I*II(yield)) leading to the investigation of the main effects. The main effects, hatch angle and build orientation, were found to significantly influence the yield strength (i.e., null hypothesis H0I and H0II were rejected). Considering that the main effects were significant, a Tukey’s test (Table 11) was conducted on the main effect means to determine which factor levels produced the specimen with highest yield strength. From the Tukey’s test and the least squares means plot (Figure 11), it can be deduced that parts built with a hatch angle of 67° and a hatch angle of 105° produced parts with similar yield strengths, while samples built with a 0° hatch angle exhibited lower yield strengths. It can also be seen that parts built in the y-direction exhibited the highest mean average yield strength.
Table 11. Least square means (LS Means) Differences Tukey honestly significant difference (HSD) (yield strength); α = 0.050.
Figure 11. Least square mean plot (yield strength) for the two factors: (a) hatch angle, and (b) build orientation.
For the effects table for flow stress at 35% plastic strain (Table 10), the interaction term was found to be significant (i.e., the null hypothesis H0I*II(35% plastic) was rejected). This means the plastic flow stress experienced during the compression of the samples was dependent on both the hatch angle and build orientation. Given the presence of interaction between these factors, a Tukey’s test (Table 12) was conducted on the treatment combination means to determine which combination of factor levels produced the specimen with highest flow stress at 35% plastic strain. From the Tukey’s test and the least squares means plot (Figure 12), it can be deduced that samples built with hatch angles of 67° and 105° produced parts which flowed at statistically the same stress at 35% plastic strain, while samples built with a 0° hatch angle flowed at a lower stress.
Table 12. LSMeans Differences Tukey HSD (flow stress at 35% plastic strain); α = 0.050.
Figure 12. Least squares mean plot (flow stress at 35% plastic strain).

4. Conclusions

The objective of this study was to evaluate the best hatch angle and build orientation for manufacturing parts using SLM. Samples were manufactured using three hatch angles (0°, 67°, and 105°) in three build orientations (x-, y-, and z-direction), and tested in compression. The different compressive responses were evaluated using ANOVA and the Tukey’s test. This study considered hatch angle and build orientation interaction, which made the comparison more accurate. The statistical analysis showed that changes in the hatch angle, and build direction caused changes in the measured yield strength and flow stress. Samples built in the y-direction exhibited the highest yield strength irrespective of the hatch angle; although samples manufactured using hatch angles 0° exhibited the lowest yield strength when compared to samples manufactured using the other two hatch angles. Samples manufactured with a 0° hatch angle flowed at the lowest stress at 35% plastic strain. Samples manufactured with hatch angles of 67° and 105° flowed at statistically the same flow stress at 35% plastic strain. However, it is important to note that under compression, samples built with a hatch angle of 67° deformed non-uniformly which is a source of concern. It was observed that samples built with a 0° hatch angle in all directions (x, y, and z) deformed non-uniformly under compressive loading while only samples built in the x- and z-direction with a 67° hatch angle deformed non-uniformly. Samples built with a 0° hatch angle deformed by ovalling when built in the x-direction and sheared when built in the z-direction, while samples built with a 67° hatch angle formed an ellipsoid when built in the x-direction and sheared when built in the z-direction. Only samples built with a 105° hatch angle deformed symmetrically whilst showing excellent compressive properties. Considering the results obtained from the compression, ANOVA, and the Tukey’s test it can be concluded that 304L stainless steel parts manufactured in the y-direction using a 105° hatch angle showed the best overall compressive behavior.

Author Contributions

Conceptualization, K.C., J.N., H.M., M.W., and O.F.; methodology, O.F., M.S. and M.F.B.; formal analysis, O.F., and M.F.B.; investigation, O.F., K.C., and J.N.; resources, H.M. and M.W.; writing—original draft preparation, O.F., K.C., J.N. and M.F.B.; writing—review and editing, O.F., K.C., J.N., M.F.B., H.M., and M.W.; visualization, O.F., M.S. and M.F.B.; supervision, K.C. and J.N.; project administration, K.C.

Funding

This research received no external funding.

Acknowledgments

Support from Intelligent Systems Center (ISC) and Center for Aerospace Manufacturing Technologies (CAMT) at Missouri University of Science and Technology is gratefully acknowledged. The authors would also like to acknowledge Austin Sutton for his contributions, and Honeywell Federal Manufacturing and Technology for use of the Renishaw machine.

Conflicts of Interest

The authors declare no conflicts of interest.

References

  1. Rajak, N.K.; Kaimkuriya, A. Design and Development of Honeycomb Structures for Additive Manufacturing. Int. J. Trend Sci. Res. Develop. (IJTSRD) 2018, 2, 1198–1203. [Google Scholar] [CrossRef]
  2. Luisa, S.; Contuzzi, N.; Angelastro, A.; Domenico, A. Capabilities and Performances of the Selective Laser Melting Process. In New Trends in Technologies: Devices, Computer, Communication and Industrial Systems; IntechOpen: London, UK, 2010; pp. 233–252. [Google Scholar]
  3. Guan, K.; Wang, Z.; Gao, M.; Li, X.; Zeng, X. Effects of Processing Parameters on Tensile Properties of Selective Laser Melted 304 Stainless Steel. Mater. Design 2013, 50, 581–586. [Google Scholar] [CrossRef]
  4. Sames, W.J.; List, F.A.; Pannala, S.; Dehoff, R.R.; Babu, S.S. The Metallurgy and Processing Science of Metal Additive Manufacturing. Int. Mater. Rev. 2016, 61, 315–360. [Google Scholar] [CrossRef]
  5. Brown, B.; Everhart, W.; Dinardo, J. Characterization of Bulk to Thin Wall Mechanical Response Transition in Powder bed AM. Rapid Prototyp. J. 2016, 22, 801–809. [Google Scholar] [CrossRef]
  6. Popovich, A.A.; Sufiiarov, V.S.; Borisov, E.V.; Polozov, I.A.; Masaylo, D.V.; Grigoriev, A.V. Anisotropy of Mechanical Properties of Products Manufactured Using Selective Laser Melting of Powdered Materials. Rus. J. Non-Ferrous Metals 2017, 58, 389–395. [Google Scholar] [CrossRef]
  7. Miranda, G.; Faria, S.; Bartolomeu, F.; Pinto, E.; Madeira, S.; Mateus, A.; Carreira, P.; Alves, N.; Silva, F.S.; Carvalho, O. Predictive Models for Physical and Mechanical Properties of 316L Stainless Steel Produced by Selective Laser Melting. Mater. Sci. Eng. 2016, 657, 43–56. [Google Scholar] [CrossRef]
  8. Ortiz Rios, C.; Amine, T.L.; Newkirk, J.W. Tensile Behavior in Selective Laser Melting. Int. J. Adv. Manuf. Technol. 2018, 96, 1187–1194. [Google Scholar] [CrossRef]
  9. Anam, M.A.; Dilip, J.J.S.; Pal, D.; Stucker, B. Effect of Scan Pattern on the Microstructural Evolution of Inconel 625 during Selective Laser Melting. In Proceedings of the Annual International Solid FreeForm Fabrication Symposium, Austin, TX, USA, 4–6 August 2014; pp. 363–376. [Google Scholar]
  10. Wang, Z.; Palmer, T.A.; Beese, A.M. Effect of Processing Parameters on Microstructure and Tensile Properties of Austenitic Stainless Steel 304L Made by Directed Energy Deposition Additive Manufacturing. Acta Mater. 2016, 110, 226–235. [Google Scholar] [CrossRef]
  11. Yadroitsev, I.; Bertrand, P.; Smurov, I. Parametric Analysis of the Selective Laser Melting Process. Appl. Surface Sci. 2007, 253, 8064–8069. [Google Scholar] [CrossRef]
  12. Hanzl, P.; Zetek, M.; Bakša, T.; Kroupa, T. The Influence of Processing Parameters on the Mechanical Properties of SLM Parts. Proc. Eng. 2015, 100, 1405–1413. [Google Scholar] [CrossRef]
  13. Kriewall, C.; Sutton, A.; Leu, M.; Newkirk, J.; Brown, B. Investigation of Heat-Affected 304L SS Powder and its Effect on Built Parts in Selective Laser Melting. In Proceedings of the Solid Freeform Fabrication Conference—An Additive Manufacturing Conference, Austin, TX, USA, 8–10 August 2016; pp. 363–376. [Google Scholar]
  14. Karnati, S.; Axelsen, I.; Liou, F.F.; Newkirk, J.W. Investigation of Tensile Properties of Bulk and SLM Fabricated 304L Stainless Steel Using Various Gage Length Specimens. In Proceedings of the Solid Freeform Fabrication Conference—An Additive Manufacturing Conference, Austin, TX, USA, 8–10 August 2016; 592–604; pp. 592–604. [Google Scholar]
  15. Song, B.; Nishida, E.; Sanborn, B.; Maguire, M.; Adams, D.; Carroll, J.; Wise, J.; Reedlunn, B.; Bishop, J.; Palmer, T. Compressive and Tensile Stress–Strain Responses of Additively Manufactured (AM) 304L Stainless Steel at High Strain Rates. J. Dyn. Behav. Mater. 2017, 3, 412–425. [Google Scholar] [CrossRef]
  16. Hitzler, L.; Hirsch, J.; Heine, B.; Merkel, M.; Hall, W.; Öchsner, A. On the Anisotropic Mechanical Properties of Selective Laser-Melted Stainless Steel. Materials 2017, 10, 1136. [Google Scholar] [CrossRef] [PubMed]
  17. Read, N.; Wang, W.; Essa, K.; Attallah, M.M. Selective laser melting of AlSi10Mg: Process optimisation and mechanical properties development. Mater. Design 2015, 65, 417–424. [Google Scholar] [CrossRef]
  18. Calignano, F.; Manfredi, E.P.D.A.; Iuliano, L.; Fino, P. Influence of process parameters on surface roughness of aluminum parts produced by DMLS. Int. J. Adv. Manuf. Technol. 2013, 67, 2743–2751. [Google Scholar] [CrossRef]
  19. ASTM Standard 52921. Standard Terminology for Additive Manufacturing—Coordinate Systems and Test. In Annual ASTM Standard 2015; ASTM International: West Conshohocken, PA, USA, 2015; Volume 2013, pp. 1–13. [Google Scholar]
  20. Alsalla, H.; Hao, L.; Smith, C.W. Effect of build orientation on the surface quality, microstructure and mechanical properties of selective laser melting 316L stainless steel. Rapid Prototyp. J. 2017, 24, 9–17. [Google Scholar] [CrossRef]
  21. Riemer, B.W. Benchmarking dynamic strain predications of pulsed mercury spallation target vessels. J. Nucl. Mater. 2005, 343, 81–91. [Google Scholar] [CrossRef]
  22. ASTM Standard E9-09. Standard Test Methods of Compression Testing of Metallic Materials at Room Temperature. In Annual ASTM Standard 2012; ASTM International: West Conshohocken, PA, USA, 2012; Volume 3.01, pp. 92–100. [Google Scholar]
  23. ASTM Standard E3-11. Standard Guide for Preparation of Metallographic Specimens 1. In Annual ASTM Standard 2001; ASTM International: West Conshohocken, PA, USA, 2001; Volume 03, pp. 1–17. [Google Scholar]
  24. Montgomery, D.C. Design and Analysis of Experiments, 5th ed.; John Wiley & Sons Inc.: Hoboken, NJ, USA, 2005. [Google Scholar]
  25. Amine, T.; Kriewall, C.S.; Newkirk, J.W. Long-Term Effects of Temperature Exposure on SLM 304L Stainless Steel. J. Miner. Metals Mater. Soc. 2018, 70, 384–389. [Google Scholar] [CrossRef]
  26. Li, L.; Lough, C.; Replogle, A.; Bristow, D.; Landers, R.; Kinzel, E. Thermal Modeling of 304L Stainless Steel Selective Laser Melting. In Proceedings of the Solid Freeform Fabrication Conference—An Additive Manufacturing Conference, Austin, TX, USA, 7–9 August 2017; pp. 1068–1081. [Google Scholar]
  27. Wang, Y.M.; Voisin, T.; McKeown, J.T.; Ye, J.; Calta, N.P.; Li, Z.; Zeng, Z.; Zhang, Y.; Chen, W.; Roehling, T.T. Additively manufactured hierarchical stainless steels with high strength and ductility. Nat. Mater. 2017, 17, 63–71. [Google Scholar] [CrossRef] [PubMed]
  28. Qiu, C.; Al Kindi, M.; Aladawi, A.S.; Al Hatmi, I. A comprehensive study on microstructure and tensile behaviour of a selectively laser melted stainless steel. Sci. Rep. 2018, 8, 1–16. [Google Scholar] [CrossRef] [PubMed]
  29. Meier, H.; Haberland, C. Experimental Studies on Selective Laser Melting of Metallic Parts. Materialwiss. Werkstofftech. 2008, 39, 665–670. [Google Scholar] [CrossRef]

Article Metrics

Citations

Article Access Statistics

Multiple requests from the same IP address are counted as one view.