Article

Dimensional Quality and Distortion Analysis of Thin-Walled Alloy Parts of AlSi10Mg Manufactured by Selective Laser Melting

1
Department of Management Science and Engineering, School of Economics and Management, Beihang University (BUAA), Beijing 100191, China
2
Key Laboratory of Contemporary Design and Integrated Manufacturing Technology, School of Mechanical Engineering, Northwestern Polytechnical University, Shaanxi 710072, China
*
Authors to whom correspondence should be addressed.
J. Manuf. Mater. Process. 2019, 3(2), 51; https://doi.org/10.3390/jmmp3020051
Submission received: 21 May 2019 / Revised: 18 June 2019 / Accepted: 19 June 2019 / Published: 21 June 2019
(This article belongs to the Special Issue Selective Laser Melting: Materials and Applications)

Abstract

:
The quality and reliability in additive manufacturing is an emerging area. To ensure process quality and reliability, the influence of all process parameters and conditions needs to be understood. The product quality and reliability characteristics, i.e., dimensional accuracy, precision, repeatability, and reproducibility are mostly affected by inherent and systematic manufacturing process variations. This paper presents research on dimensional quality and distortion analysis of AlSi10Mg thin-walled parts developed by a selective laser melting technique. The input process parameters were fixed, and the impact of inherent process variation on dimensional accuracy and precision was studied. The process stability and variability were examined under repeatability and reproducibility conditions. The sample length (horizontal dimension) results revealed a 0.05 mm maximum dimensional error, 0.0197 mm repeatability, and 0.0169 mm reproducibility. Similarly, in sample height (vertical dimension) results, 0.258 mm maximum dimensional error, 0.0237 mm repeatability, and 0.0863 mm reproducibility were observed. The effect of varying design thickness on thickness accuracy was analyzed, and regression analysis performed. The maximum 0.038 mm error and 0.018 mm standard deviation was observed for the 1 mm thickness sample, which significantly decreased for sample thickness ≥2 mm. The % error decreased exponentially with increasing sample thickness. The distortion analysis was performed to explore the effect of sample thickness on part distortion. The 0.5 mm thickness sample shows a very high distortion comparatively, and it is reduced significantly for >0.5 mm thickness samples. The study is further extended to examine the effect of solution heat treatment and artificial aging on the accuracy, precision, and distortion; however, it did not improve the results. Conclusively, the sample dimensions, i.e., length and height, have shown fluctuations due to inherent process characteristics under repeatability and reproducibility conditions. The ANOVA results revealed that sample length means are not statistically significantly different, whereas sample height means are significantly different. The horizontal dimensions in the xy-plane have better accuracy and precision compared to the vertical dimension in the z-axis. The accuracy and precision increased, whereas part distortion decreased with increasing thickness.

1. Introduction

Quality and reliability are major concerns in the state-of-the-art Industry 4.0 technologies including Additive Manufacturing (AM). AM technologies have gained more attention recently due to their ability to manufacture complex and fully functional geometries by sequential addition of material (layer-after-layer) beginning from 3D digital models. AM Research is in progress in multiple directions, and there are many quality related issues that are still challenging and need to be addressed [1]. Among AM technologies, selective laser melting (SLM) recently emerged as the widely used technique in aerospace, automotive and biomedical productions due to its ability to build complex parts and parts having open cell structures along with the minimum amount of material wastage [2,3,4]. Several parameters and conditions in the SLM process have uncertainties and varying effects on the final product. These process parameters and conditions are under investigation to achieve the desired level of quality and reliability [5,6,7,8].
The AlSi10Mg material, due to its hypoeutectic microstructure, is equivalent to A360 die-cast aluminum in additive manufacturing [5,6]. The thin-walled parts of AlSi10Mg due to their exceptional characteristics including low thermal expansion coefficient, less weight, stiffness, high specific strength, corrosion resistance, high thermal and electrical conductivities have found wide applications in aerospace, automobile, energy, electronics, and railway industries [7,9,10]. At present, conventional manufacturing techniques including extrusion, casting and forging are used to produce a significant portion of aluminum alloys part of complex geometries, like thin-walled and asymmetrical forms and internal flow capillaries, resulting in lengthy production hold-ups and higher expenditures [11]. Current industrial applications of AlSi10Mg need innovative production techniques. Selective laser melting, a type of powder bed fusion (PBF) is a favorable AM technique with benefits such as complex geometry design, production flexibility, as well as cost and time savings [12,13,14]. There are different sets of process parameters such as part placement, scanning direction, scanning strategy, inert gas flow velocity, laser power, part built-up direction, hatch spacing, scanning speed, powder bed temperature and layer thickness to control the microstructure and mechanical properties of AlSi10Mg manufactured thin-walled parts with selective laser melting (SLM) technique [9,15,16,17,18].
In AM processes, the dimensional variation among the computer aided designed part, and the actual built part is defined as geometrical accuracy. Due to the layer by layer building process, many factors affect the geometrical accuracy of the actual parts. The mechanical precision of the manufacturing setup, such as layer thickness, concentrated laser spot size, and scanner’s position precision is amongst the factors affecting dimensional accuracy. The surface morphology that is described by numerous factors affects the geometrical accuracy as well. The factors mentioned above greatly depend upon the part positioning relative to the build direction [19]. Di W et al. [20] examined the geometrical characteristics of SLM built parts and concluded that the laser penetration, width of the laser beam, stair effect and powder adhesion play a key role in affecting the dimensional accuracy of different geometrical shapes produced by selective laser melting. Davidson et al. [21] focused upon SLM of duplex stainless steel powders and discovered that the geometrical precision varies with the direction. They found that the laser power and percent dimensional error are directly proportional and a geometrical error of 2–3% was reported on the average.
Calignano [22,23] investigated the dimensional accuracy of laser powder fusion using AlSi10Mg alloy and stated that the accuracy of parts produced is affected by the STL file, build direction, and process parameters. Thermal stress and the setting of process parameters have an impact on surface roughness and dimensional accuracy as well. Yap et al. [24] studied the effect of process parameters on the dimensional accuracy of parts developed on the PolyJet 3D printer by using three types of benchmarks and concluded that in order to develop thin walls successfully, the wall thickness should be greater than 0.4 mm. Raghunath and Pandey [25] in their study revealed that laser power and scan length are sources of deviation in the x-axis, laser power, and beam speed are sources of deviation in the y-axis, whereas, bed temperature, hatch spacing, and beam speed are sources of deviation in the z-axis. Han et al. [26] studied the effects of various process parameters upon geometrical accuracy and established that the precision can be enhanced by high scan speed that results in high density. Majeed et al. [27] investigated the dimensional and surface quality of parts-built by AM technique and optimized the process parameters. Zhu et al. [28] concluded that the thermal shrinkage would be higher for high laser power and low scan speed and smaller spacing. Furthermore, as compared to the x-y plane, the total shrinkage is significantly high in the z plane. Yu et al. [29] studied the influence of re-melting on surface roughness and porosity of AlSi10Mg parts developed by SLM and found a positive effect on both of these properties.
One of the main disadvantages of SLMed parts is residual stress that leads to part distortion. Distortion significantly affects the dimensional accuracy of a part and adversely hinders the efficient working of the built parts. Kruth et al. [30] concluded that residual stresses cause distortion that affects the geometrical accuracy of the physical parts. It happens due to locally focused energy distortion, resulting in high-temperature gradients, which happens while separating the built part from the substrate. Shiomi et al. [31] found that rapid cooling and heating produces a high-temperature gradient that further leads to the generation of thermal stress and hence, causes part distortion and cracks. Yasa et al. [32] and Beal et al. [33] investigated the effects of SLM process parameters and found that scan strategy has a significant role in cracks formation and distortion of built parts. Li et al. [34] focused on quick anticipation of distortion in SLMed parts by developing a Finite Element model. The experimental results also confirmed forecast distortions in different scan strategies. Shukzi Afazov et al. [35] forecast and compensated the distortion in large scale industrial parts by developing two models for distortion compensation. Keller et al. [36] attained quick simulation of part distortion by establishing a multi-scale modeling technique that implied an intrinsic strain obtained from a hatch model of several laser scans in selective laser melting.
The researchers in their studies have determined different optimized parameters for porosity, roughness, hardness, dimensions, etc., but in actual practice, even at the optimized setting, there is variation in these quality characteristics of developed parts. These variations can be determined by repeatability and reproducibility experimentation, and analysis. The part-quality characteristics, i.e., dimension accuracy, precision, and distortion, can vary in the different axis or directions or change with dimension. Furthermore, the surface treatment can improve some quality properties, i.e., hardness, porosity, etc., and it can also affect these characteristics. Therefore, exploration of these points is the main objective of this work.

2. Material and Experimental Method

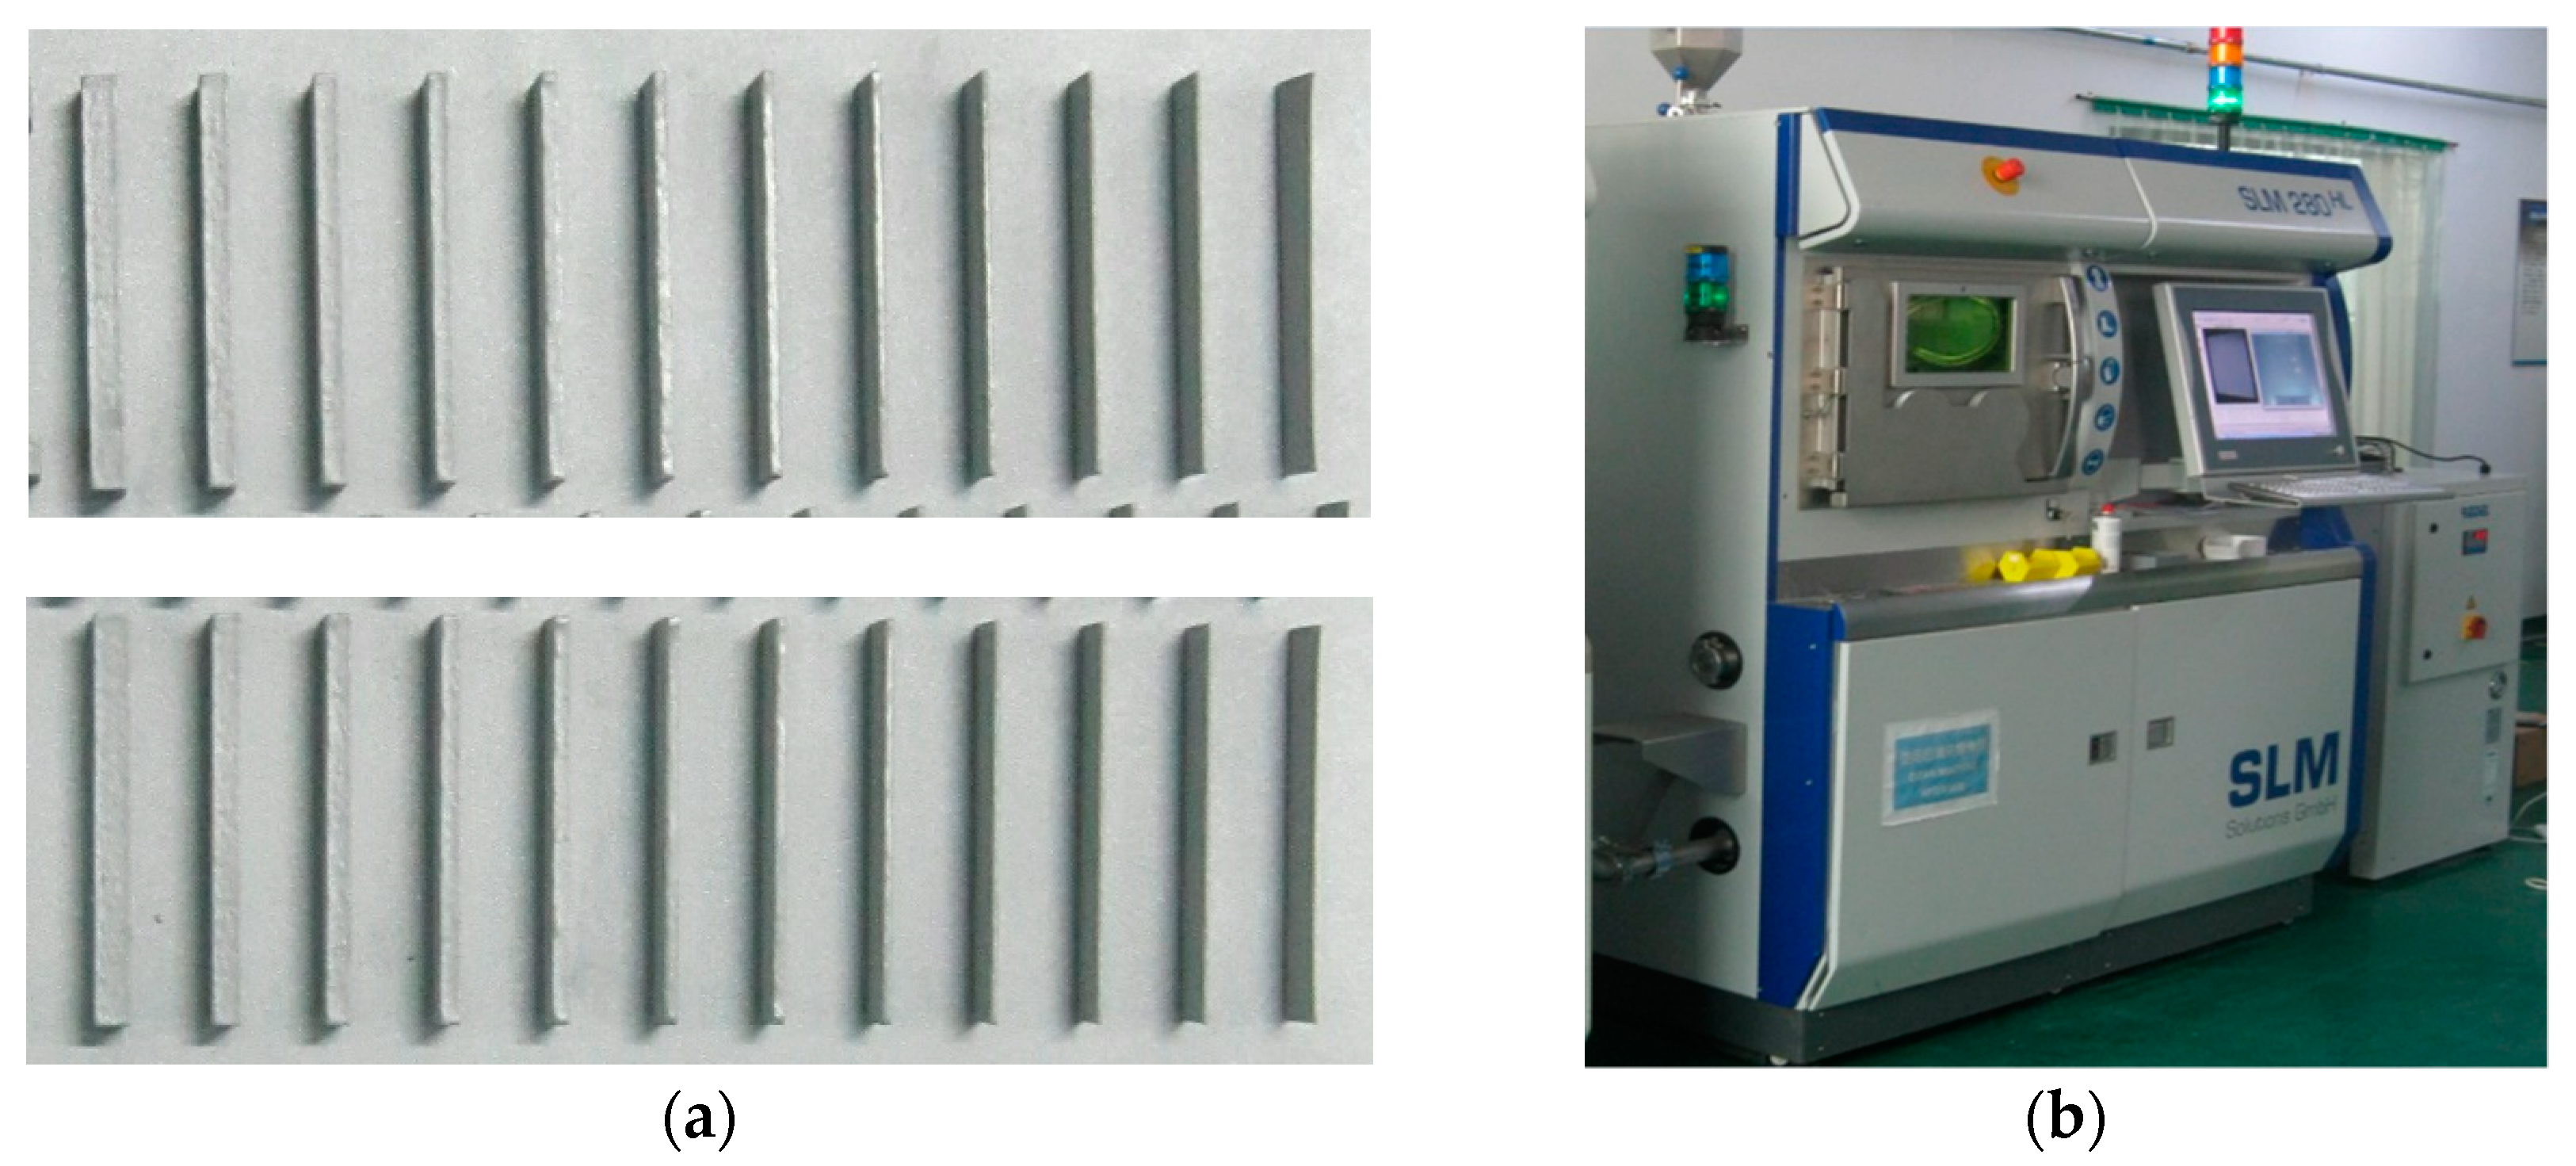
AlSi10Mg power was used for the building of thin-walled specimens whose morphology is shown in Figure 1. Specimens were built on an SLM 280 HL system, which was equipped with two 400 W fiber lasers. The chemical composition of AlSi10Mg powder was 10.1 % Si, 0.30% Mg, 0.11 % Fe, < 0.05% Ni and balance % aluminum. In this study, the processing parameters of 0.320 kW laser power, 0.90 m/s scanning speed, 25% overlap rate, 0.08 mm of hatch distance, 0.03 mm of layer thickness, vertical building direction, and 67° checkerboard scanning strategy were used [37].
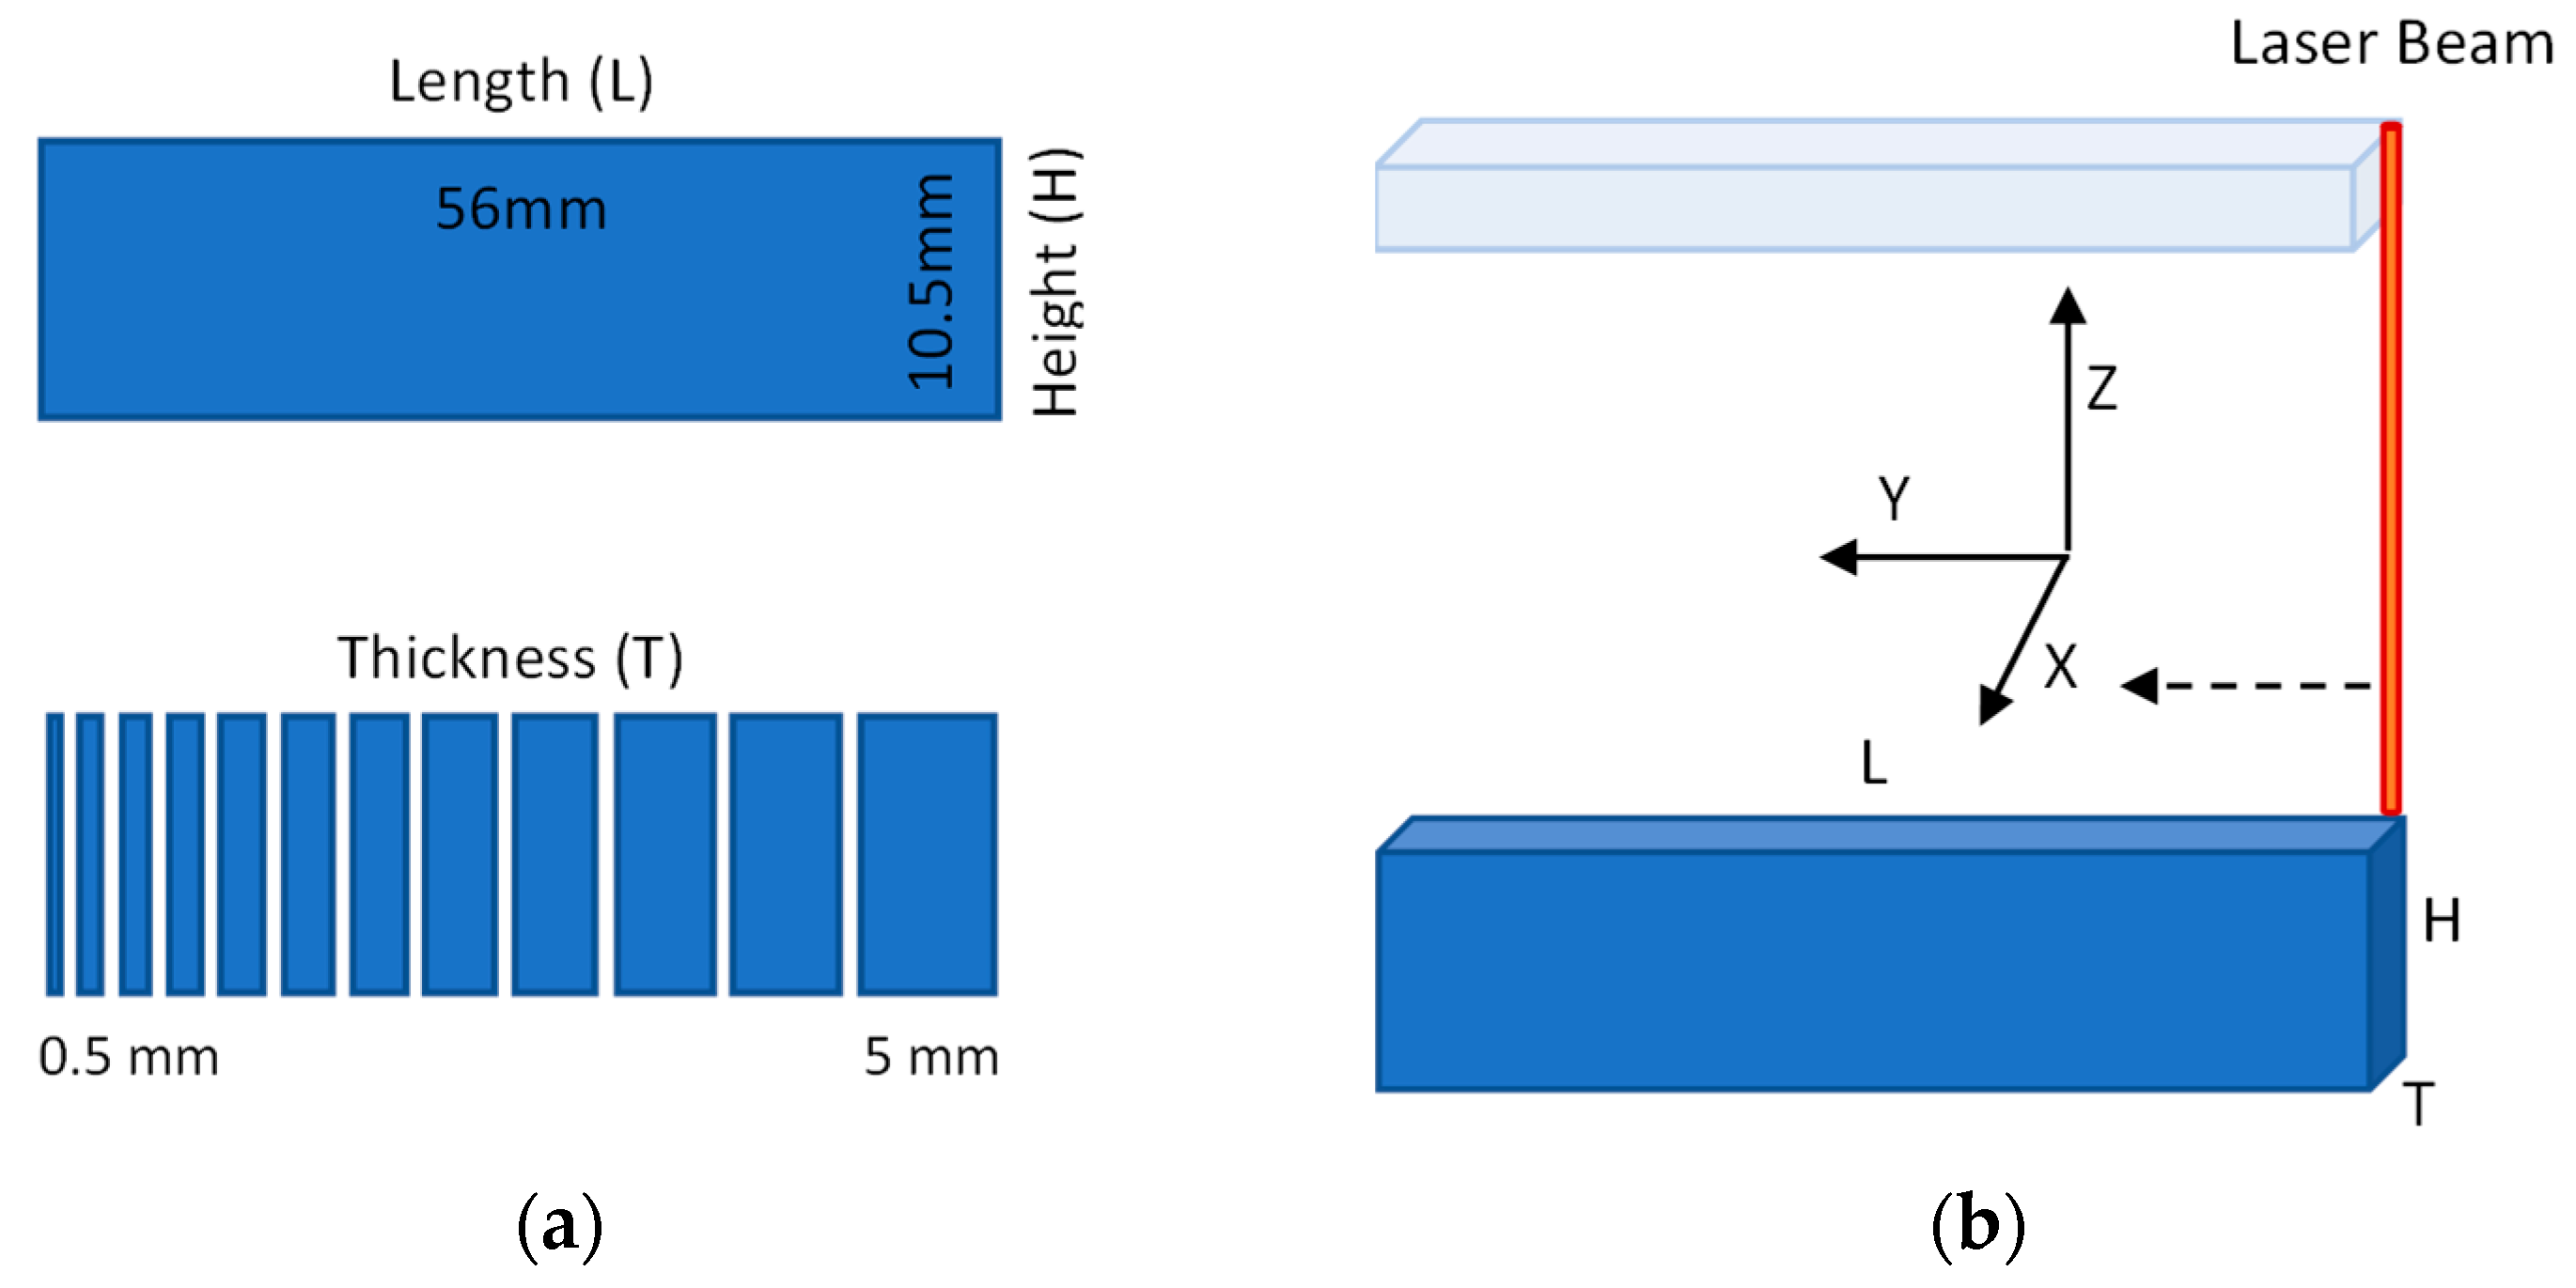
The two dimensions, length (L), and height (H) of samples were fixed at 56 mm and 10.5 mm respectively, and the wall thickness of each sample was varied from 0.50 mm to 5.0 mm to make 12 combinations. Total 12 × 4 (4 Sets) samples were fabricated with a size of 56 mm × 10.5 mm × Wt; where Wt is wall thickness (i.e., 0.50, 0.80, 1.0, 1.20, 1.50, 1.80, 2.0, 2.50, 3.0, 3.5, 4.0, 5.0 mm). The third dimension thickness was systematically varied to study the effect of varying thickness on the dimensional quality and distortion.
The first three sets were fabricated in a single production run. The first set of 12 samples was used in As-Built (AB) condition for repeatability, reproducibility, and distortion analysis. The remaining two sets were analyzed after Solution Heat Treatment (SHT) and Artificial Aging (AA). The fourth set was fabricated at the same settings on the same system using the same material but at different intervals of time for the reproducibility study with the first set. The whole experimental scheme is presented in Figure 2. The repeatability and reproducibility were performed with the first and fourth set by using two dimensions, i.e., length (L) and height (H), which are fixed and produced at fixed input process parameters settings.
The scheme for sample build-up and reference directions is shown in Figure 3. The sample length and thickness are created in the xy-plane, horizontal direction. The sample height is created in the z-axis, vertical direction. The samples were separated from the substrate by using a wire cut electrical discharge machine. The developed samples and AM system are shown in Figure 4.
The length of each sample was measured three times and height five times; the width or thickness measured five times, and the average values were estimated. For distortion analysis, the sample was marked from one edge to another with ten positions 1 to 10 along the length of the sample. The distortion (displacement) values are measured at these marked positions to relate the measured values to the location of the sample.
The effect of heat treatments is also investigated on the thin-walled specimens by applying SHT and AA. Two sets were applied SHT at 530 °C and 540 °C for 2 h in the electric furnace, and the specimens were instantly exposed to water quenching at room temperature after SHT. AA was performed on 530 °C SHT set at 155 °C for 12 h in the drying oven, and further, the samples were quenched in the air to room temperature [38,39].
The powder morphology was tested with SEM Tescan VEGA3 LMU Scanning Electron Microscope system. The samples dimensional quality measurements were taken by using Mitutoyo vernier caliper, and their distortion was examined by using a dial indicator on a flatbed.

3. Results and Discussion

The results and discussion part is distributed into four sections. In the first section, we have fixed the input process parameters and determined the dimensional variations in 12 samples at as-built (AB) condition. The variation in the dimension of the parts depicts the manufacturing process variations at fixed conditions. The accuracy, precision, repeatability, and reproducibility are examined based on as-built samples considering two sides of the sample. In the second section, the variation in thickness accuracy with increasing sample thickness is presented. Further, correlation and regression analysis are studied. In the third section, distortion analysis is presented. The variation and correlation between distortion and sample thickness are discussed. Lastly, the effect of SHT and AA on sample quality characteristics, i.e., dimensional accuracy, precision, and distortion, are discussed. The analysis performed by using MINITAB 18, MATLAB 07R, and Origin Pro 9.

3.1. Dimensional Quality under Repeatability (Process Variability)

The repeatability is a condition in which parameters and conditions, i.e., machine, man, method and material, are fixed and the products are developed repeatedly, or values are taken in a short interval of time repeatedly, and it is represented numerically by the standard deviation. In our study, the design length (L) and height (H) of the samples are fixed at 56 mm and 10.5 mm, respectively. Twelve samples are developed at the fixed input process parameters under same conditions. The dimensional values of the length and height of as-built samples are measured and mentioned in Table 1. The length and height are the average value of three and five readings of each sample, respectively. As the inputs parameters and conditions are fixed, the estimated standard deviations in length and height data represent the repeatability of the production process.
The accuracy and precision are estimated as sample error and standard deviation, respectively. The actual measured length observed between 55.977–56.013 mm, and the maximum error is 0.027 mm (0.048%). Similarly, the actual height observed between 10.422–10.664 mm, and the maximum error is 0.164 mm (1.562%).
Analysis of Variance (ANOVA) is performed to determine significant differences in the i) mean length and ii) mean height between the 12 samples of set 1 developed under fixed input parameter settings. Each sample has three values of length and five values of height. The p-value and F-value, mentioned in Table 1, shows the statistically significant difference between means and variation in means, respectively. The ANOVA performed at 95% confidence level by using the alpha level of 0.05. The normality of data checked, and normal probability plot of residuals indicated that residual data follow a normal distribution.
The repeatability estimated from ANOVA results, which is calculated by using the square root of mean squared error (MSE) value, also known as pooled standard deviation. The calculated repeatability (σr) for length and height is 0.0197 mm and 0.0237 mm, respectively.
Figure 5a shows the variation in the length of samples at repeatability condition. The interval on the bar represents the standard deviation, which is estimated based on three repeated values of each sample. The red line is the design or target length line. The results show a random distribution of values. It can be seen from the graph that the length of each sample is fluctuating and not consistent, which shows the degree of instability of the production process. Secondly, the target line falls within the standard deviation interval of most of the samples. The ANOVA results revealed that the length means of samples in set 1 are not statistically significantly different, which is indicated by p-value (p = 0.160 > 0.05).
Figure 5b shows the variation in the height of samples at repeatability condition. The standard deviation interval is calculated based on five repeated values of each sample. The height of each sample is inconsistent, which shows higher instability in the production process. The target line even falls within the standard deviation interval of only a few samples. The ANOVA results revealed that the height means of samples in set 1 are statistically significantly different, which is indicated by p-value (p = 0.000 < 0.05).
The height means values of some sample, i.e., 1, 4, 5, 8, and 12, are statistically significantly different as revealed from ANOVA results. The variation in the samples is due to the effect of solidification, random shrinkage behavior, and residual stresses. The layers can shrink non-uniformly due to low or high-temperature regions, and this non-uniformity shrinkage results in dimensional variations. The sample 4 and 5 have statistical significance and show a higher value than the target value. This may be due to laser heat, which penetrates more to bond unwanted powder particles. Further, it also can be attributed to the bed temperature variation as the part build at center or region of higher temperature, have larger dimension as compared to part build at the edge of the bed or the region of low temperature.
The results show variation or fluctuations in dimensional values and standard deviation, which are due to inherent random errors or effects of manufacturing process or system. It can be revealed from the results that the sample height is more inconsistent, have more error and standard deviation as compared to sample length. The sample length and width or thickness boundary is created as a result of the laser beam boundary in the xy-plane, as shown in Figure 3, whereas the sample height is in the z-axis, the direction in which the bed moves equal to one layer thickness and re-coater spread a new layer of powder. The sample dimension, which is created by a laser beam in the xy-plane, has more accuracy and precision as compared to the dimension created in the z-axis. This is because of internal stresses or shrinkage in xy-plane is lesser as compare to the z-axis, the vertical direction.
This shows that the variation of dimensional quality in different directions and the dimensions created in xy-plane will be more accurate and precise as compared to the dimension in the z-axis. This will help designers to achieve more accuracy in any specific part dimension which can be done by setting part build up a position in a direction that keeps the dimensions in the xy-plane that needs more accuracy and precision.

3.2. Dimensional Quality under Reproducibility (Process Variability)

The reproducibility is a condition in which one or more conditions are changed, i.e., machine, man, location, or time while keeping the same method and material. Two sets consisting of twelve samples in each set are developed at different time interval and production run. Table 2 shows the summarized results of both sets under reproducibility condition.
Analysis of Variance (ANOVA) is performed to determine significant differences in the i) mean length and ii) mean height between the set 1 and set 4 which are developed under fixed input parameters setting at different interval of time. Set 1 and set 4 considered as two groups having 12 values in each group. The p-value and F-value, mentioned in Table 2, shows the statistically significant difference between means and variation in means respectively. The ANOVA performed at 95% confidence level by using the alpha level of 0.05. The normality of data is checked, and a normal probability plot of residuals indicated that residual data follow a normal distribution.
The ANOVA results revealed that length means in set 1 and set 4 are not statistically significantly different which is indicated by p-value (p = 0.086 > 0.05) whereas the height means in set 1 and set 4 are statistically significantly different which is indicated by p-value (p = 0.019 < 0.05).
The reproducibility estimated from ANOVA results, which is calculated by using the square root of mean squared error (MSE) value, also known as pooled standard deviation. The calculated reproducibility (σR) is 0.0169 mm and 0.0863 mm for length and height, respectively.
The results revealed that the length and height show inconsistency and variability. The maximum dimensional error of 0.258 mm (2.457%) and a maximum standard deviation of 0.0863 mm observed under reproducibility condition. The height has less accuracy and precision as compared to the length and has shown the same trend as in repeatability condition.

3.3. Dimensional Quality with Variable Dimension

The dimensional quality is examined with the varying dimension. The sample design thickness is varied from 0.5 mm to 5 mm and, accuracy and precision are calculated from the actual thickness of the samples, as shown in Table 3. The results show that both % Error and the standard deviation are decreased with the increasing sample thickness. The maximum error of 0.038 mm is observed in the whole range.
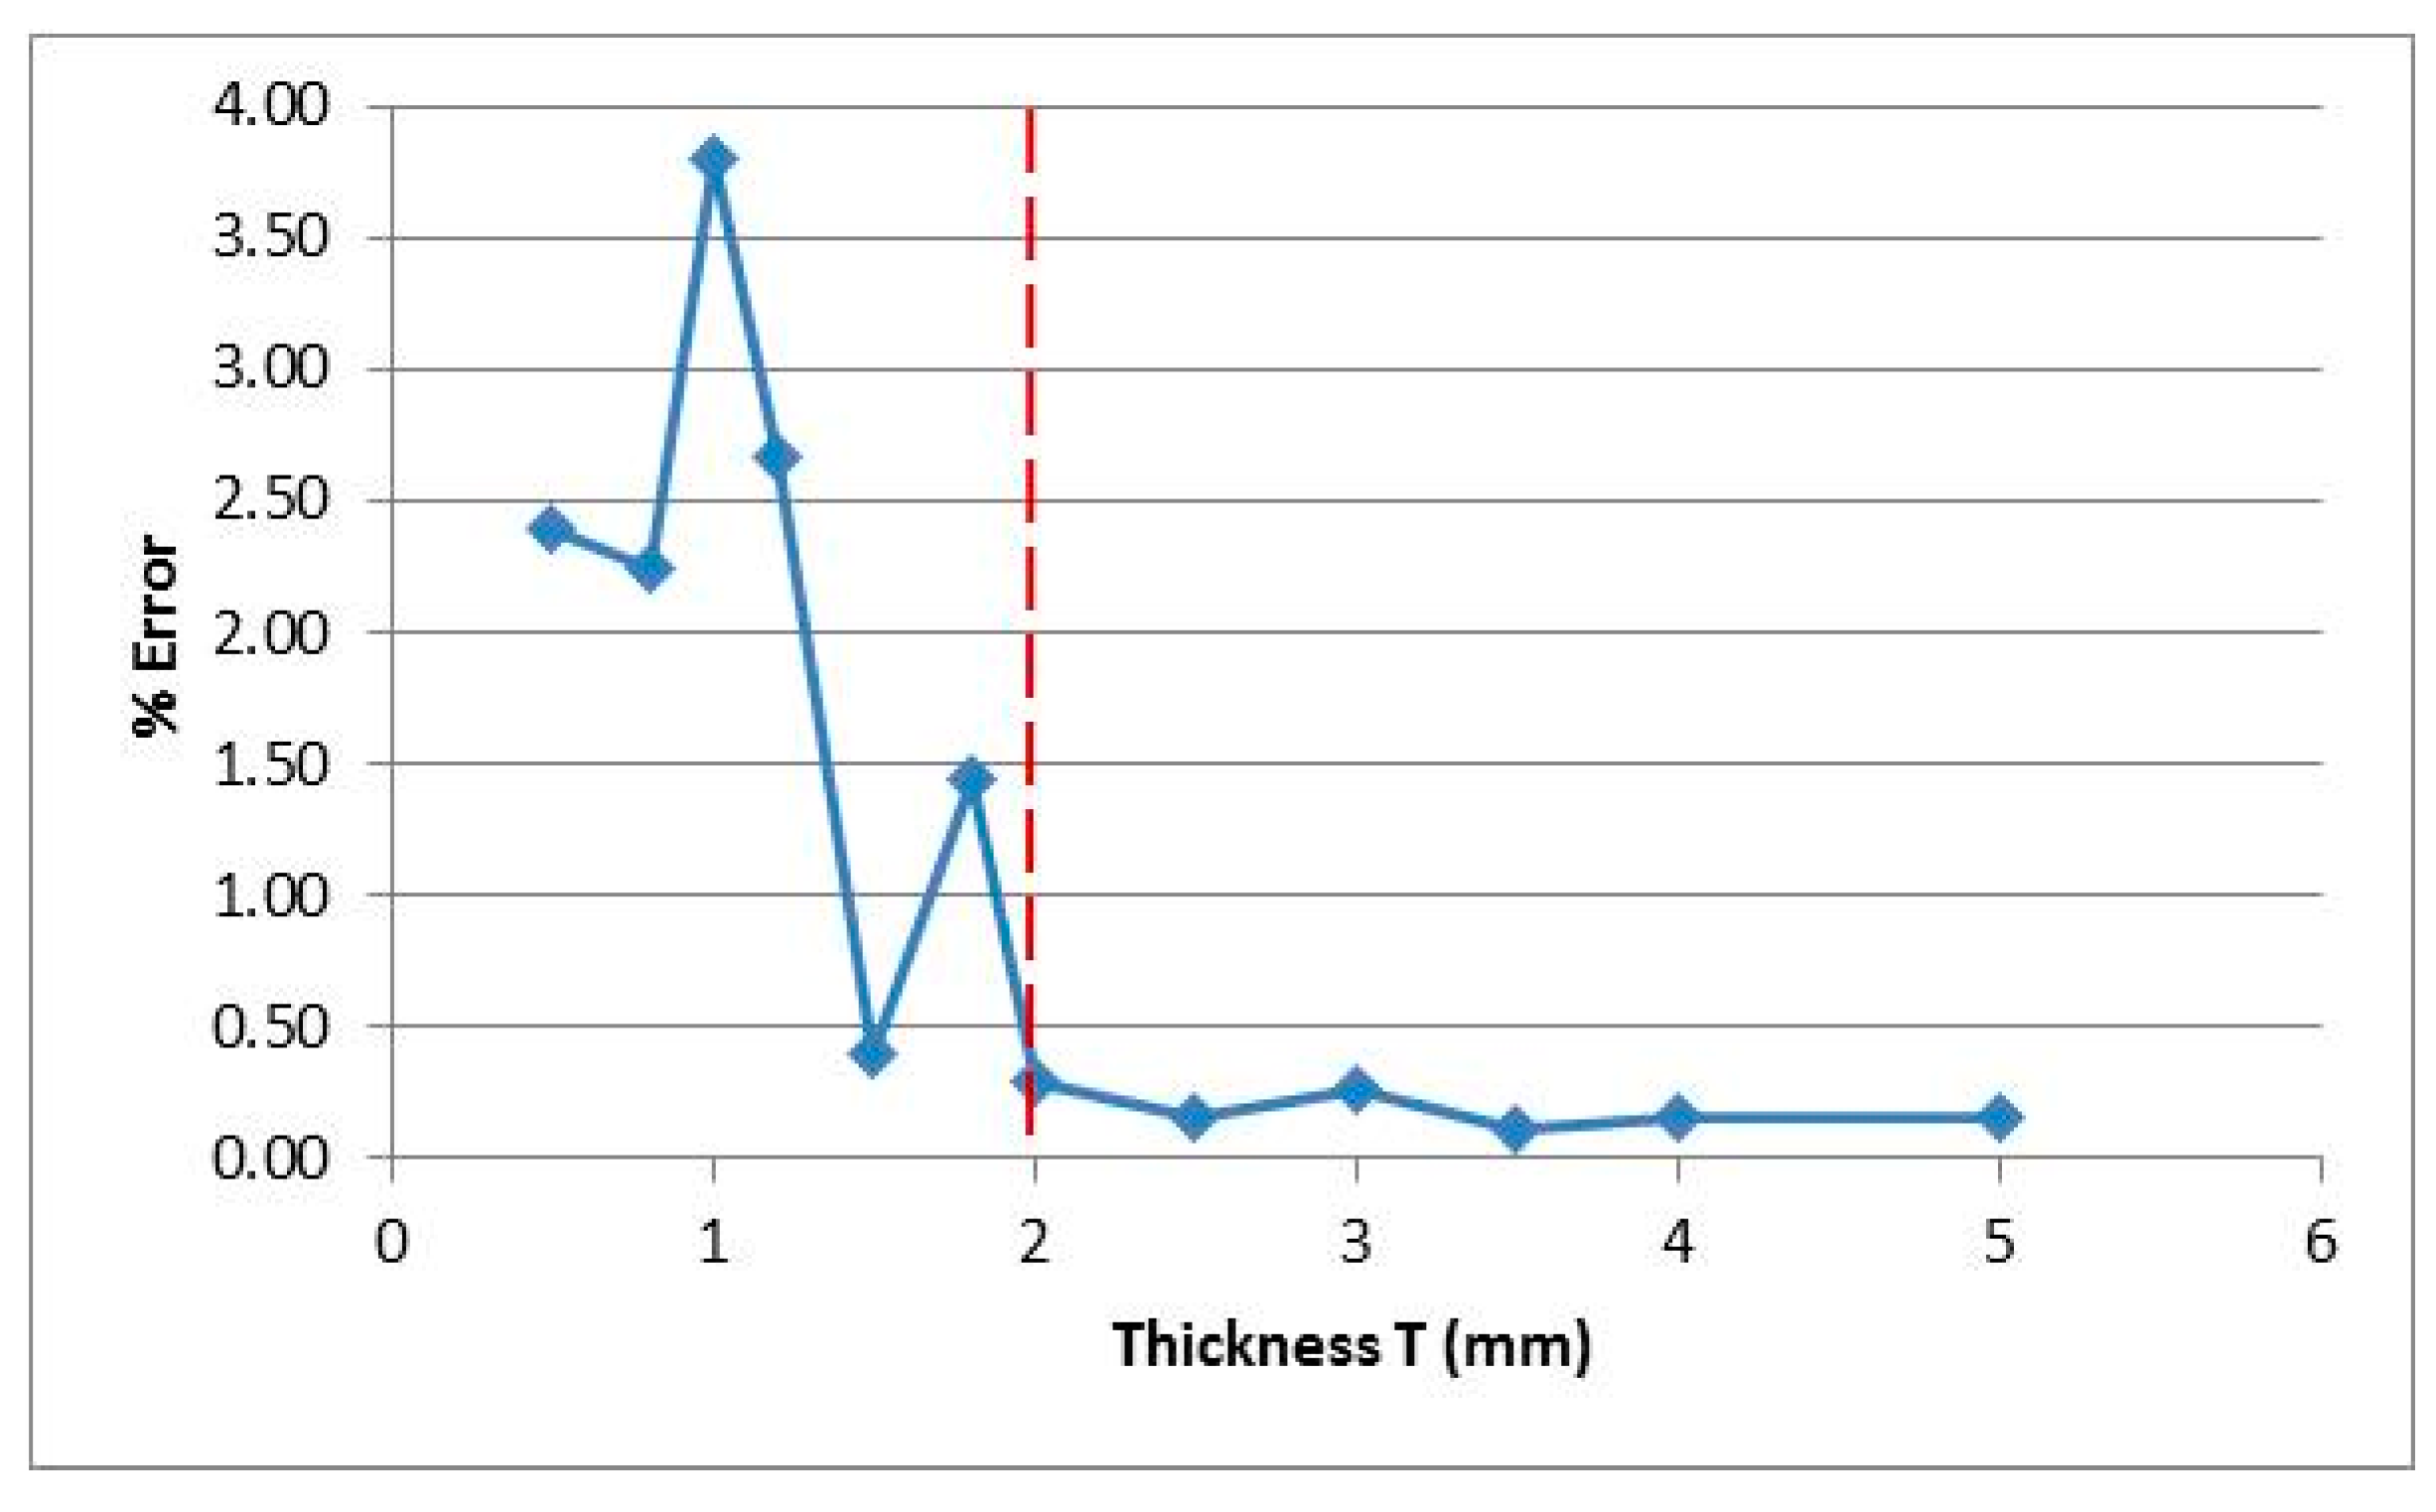
The % Error value is random and higher in the region between 0.5 mm to 2 mm sample thickness. Whereas the % Error decrease and remain less than 0.30% in the region from 2 mm to 5 mm sample thickness, as shown in Figure 6. Similarly, the precision is higher with increasing the sample thickness. The results show that the dimensional quality will be better with increasing sample thickness, and it will be lower with decreasing thickness. This will be important for a product designer to consider these effects while designing the product, especially where a higher degree of accuracy and precision is required.
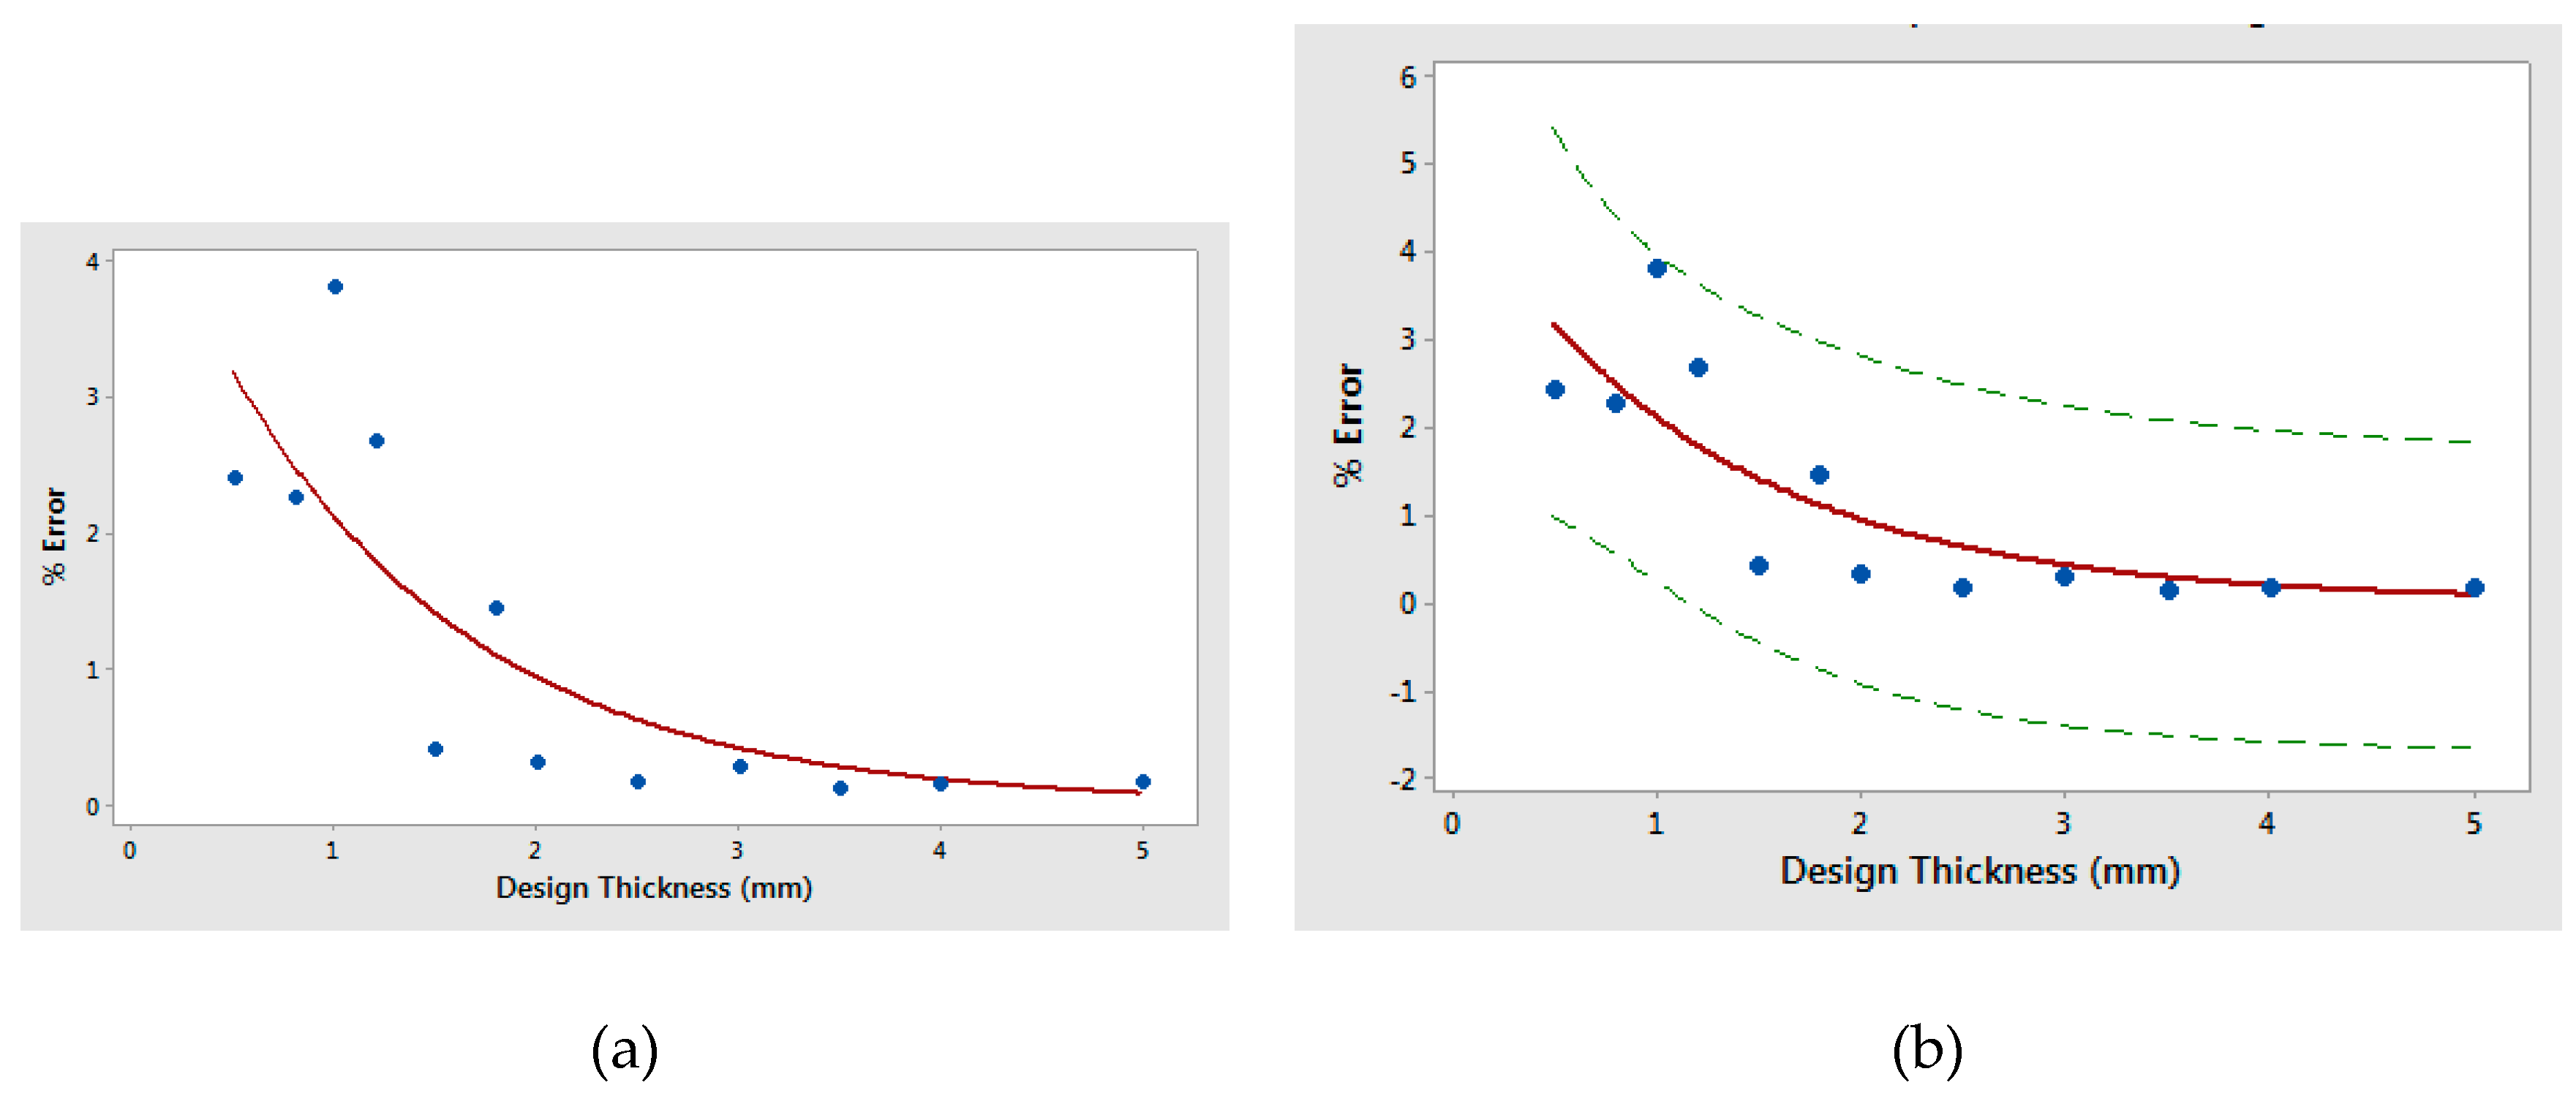
The correlation and regression analysis are performed to determine the strength of the relationship between sample Thickness (T) and % Error. The correlation coefficient r is −0.73, which shows a negative relationship. The % Error decreased exponentially with the increasing thickness, which is presented by the regression model, as shown in Equation (1) and Figure 7. The R-squared value of the model is 0.6348 (63.48%). The p-value is 0.0006 (>0.05), which show the significance of the relationship.
% Error = 4.7792 × exp(−0.814255 × T)

3.4. Distortion Analysis

The final quality of part depends on the material characteristics and production process parameters. The part deflection or distortion is a result of a combination of these factors. The residual stresses in a developed part cause the distortion. The distortion is measured by measuring the displacement using a dial indicator on a flatbed at ten points on each sample in as-built condition, and the results are shown in Table 4.
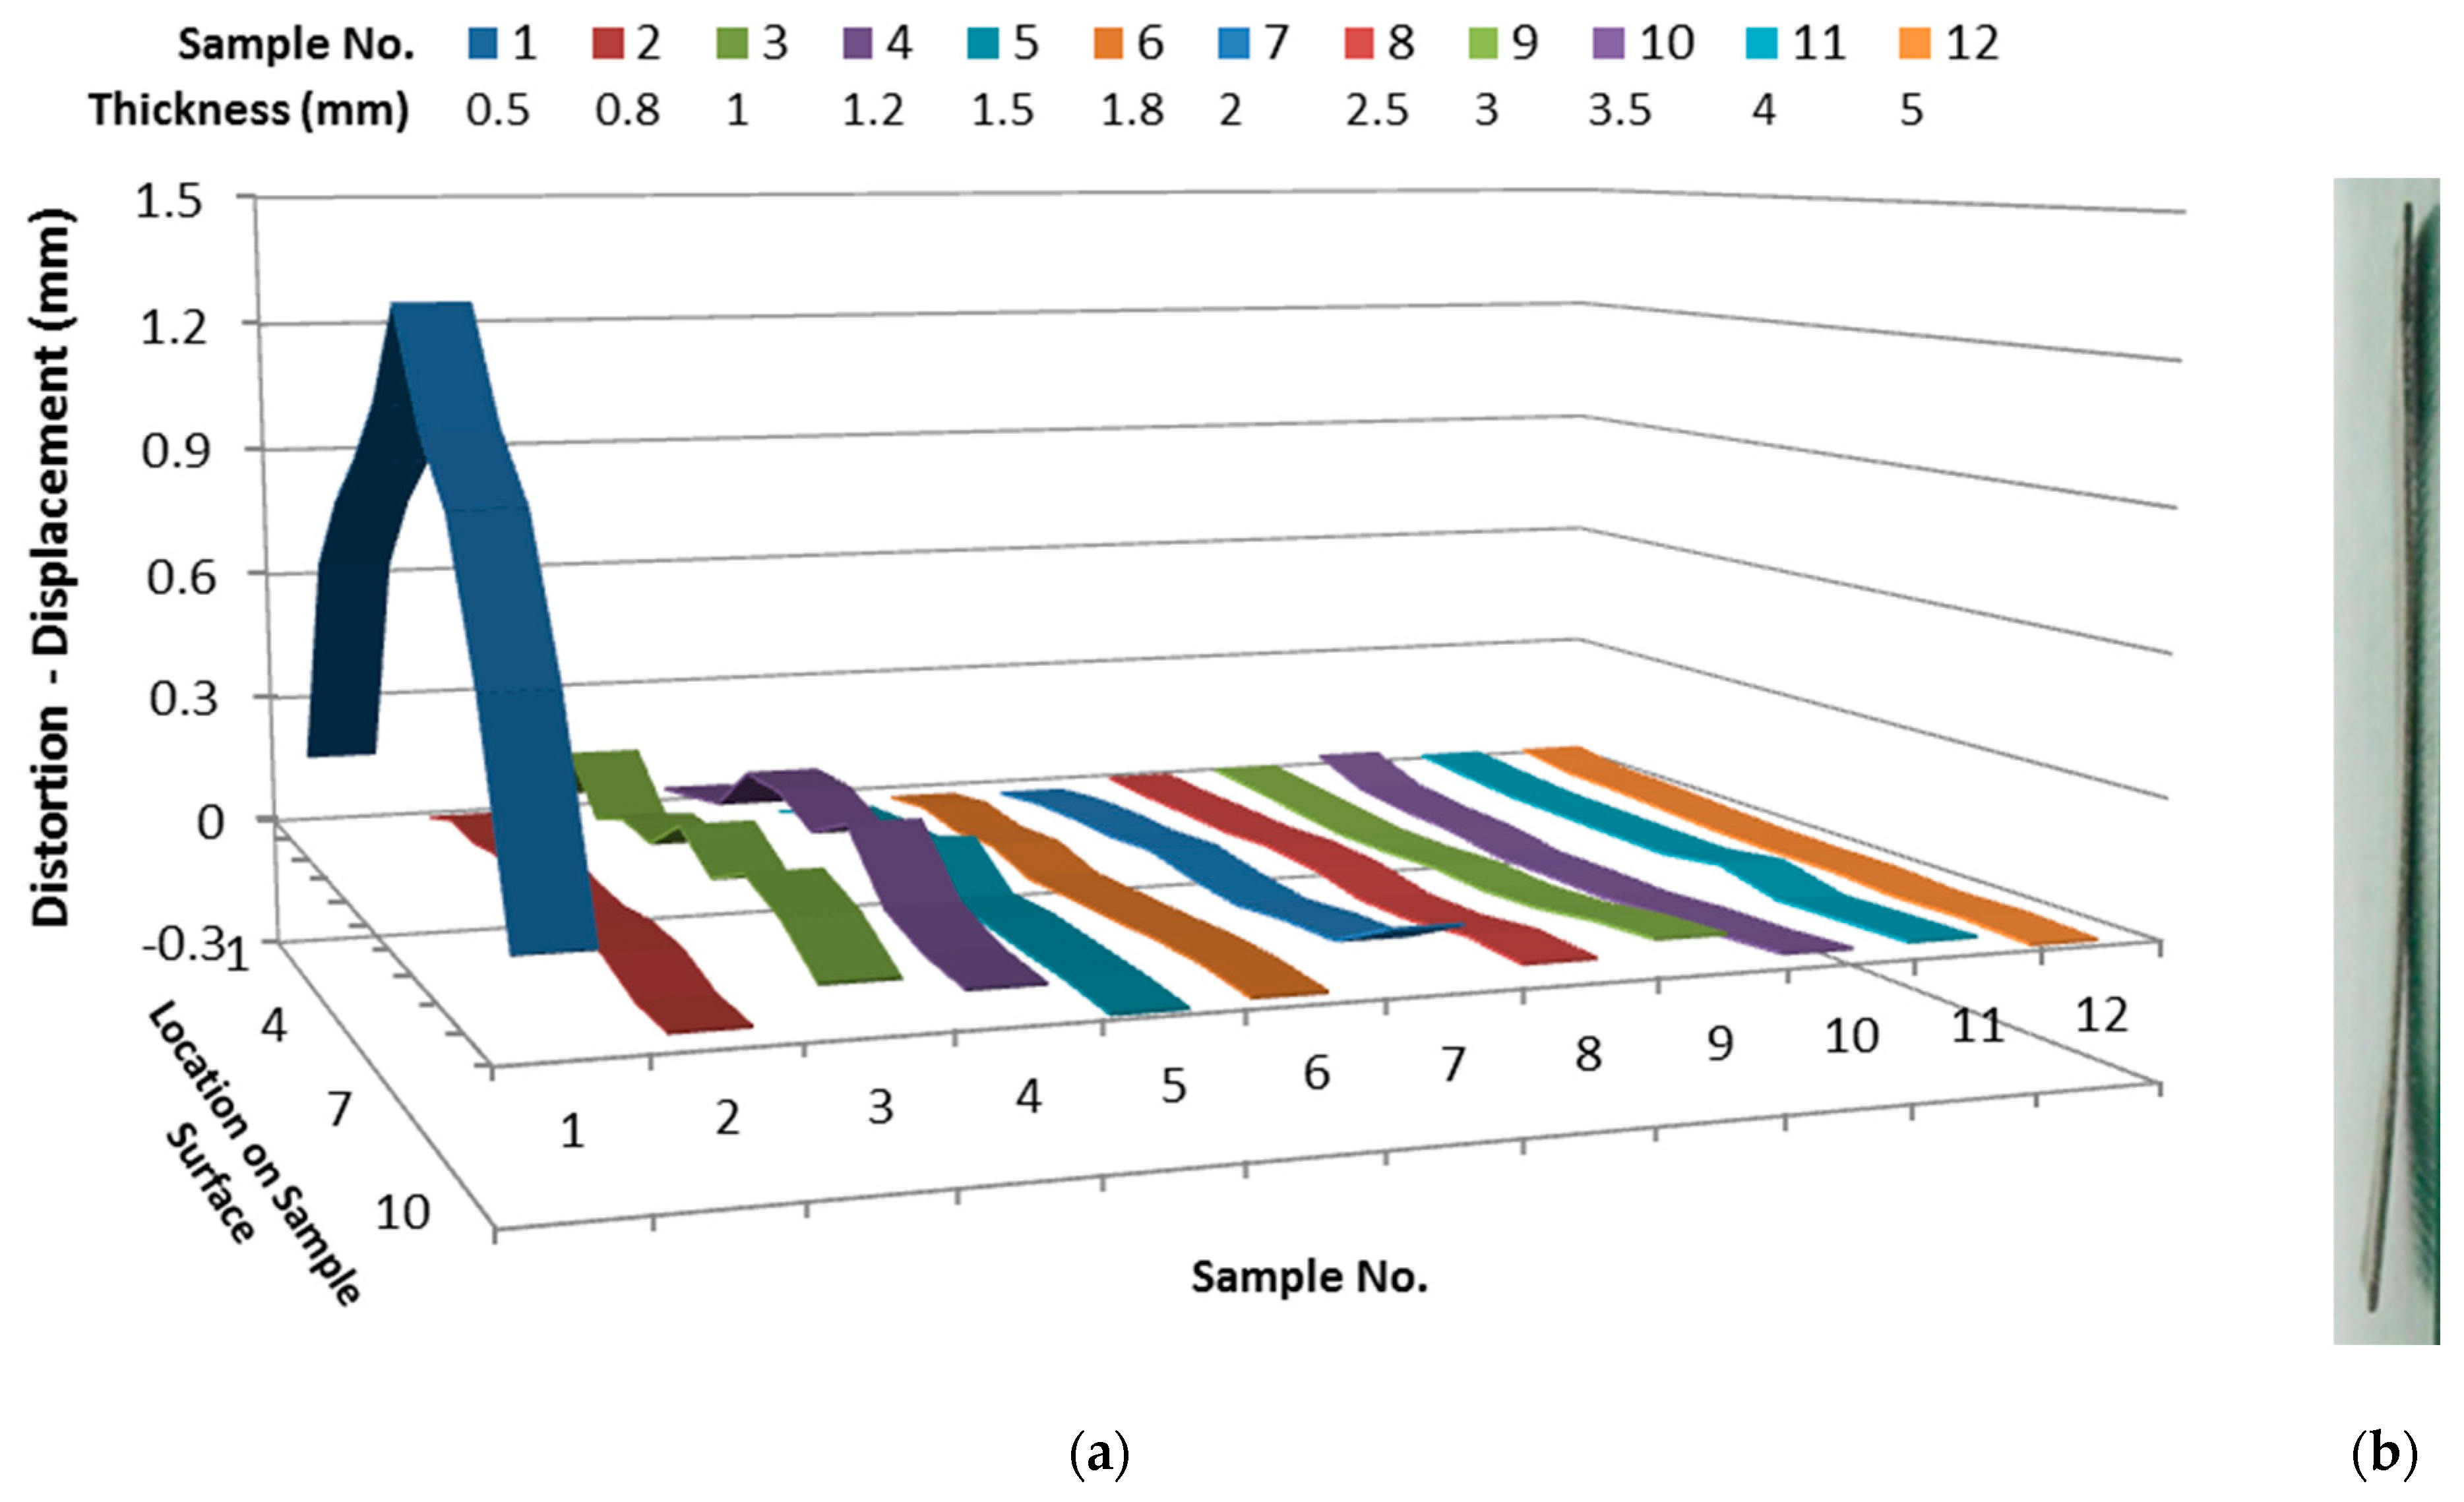
The shrinkage value is subtracted from the measurement to get the actual distortion value. The positive and negative values indicate the side of deflection with reference to the central axis. The maximum mean distortion is 0.782 mm, and the maximum distortion at any single point is 1.312 mm, which is observed for 0.5 mm thickness. The maximum standard deviation of 0.038 mm is also observed for the 0.5 mm thickness sample.
Figure 8 shows the distortion variation or profile on the sample surface at 1 to 10 marked points. The distortion has higher values and variations in the region between 0.5–1.5 mm thicknesses. The 0.5 mm thickness sample has a maximum distortion and peak value at the middle location of the sample. The distortion considerably decreased after 0.5 mm sample thickness.
The differences in the distortion values are due to the residual stresses developed in the samples, that are the result of laser heat thermal cycling, i.e., heating and cooling during layer by layer development of samples. There is a temperature gradient between the bottom and each new upper layer. The thin samples are more prone to residual stresses, shrinkage, and bending as compared to thicker samples due to wall thickness, which cause higher distortion comparatively.

3.5. Effect of Heat Treatments (SHT and AA)

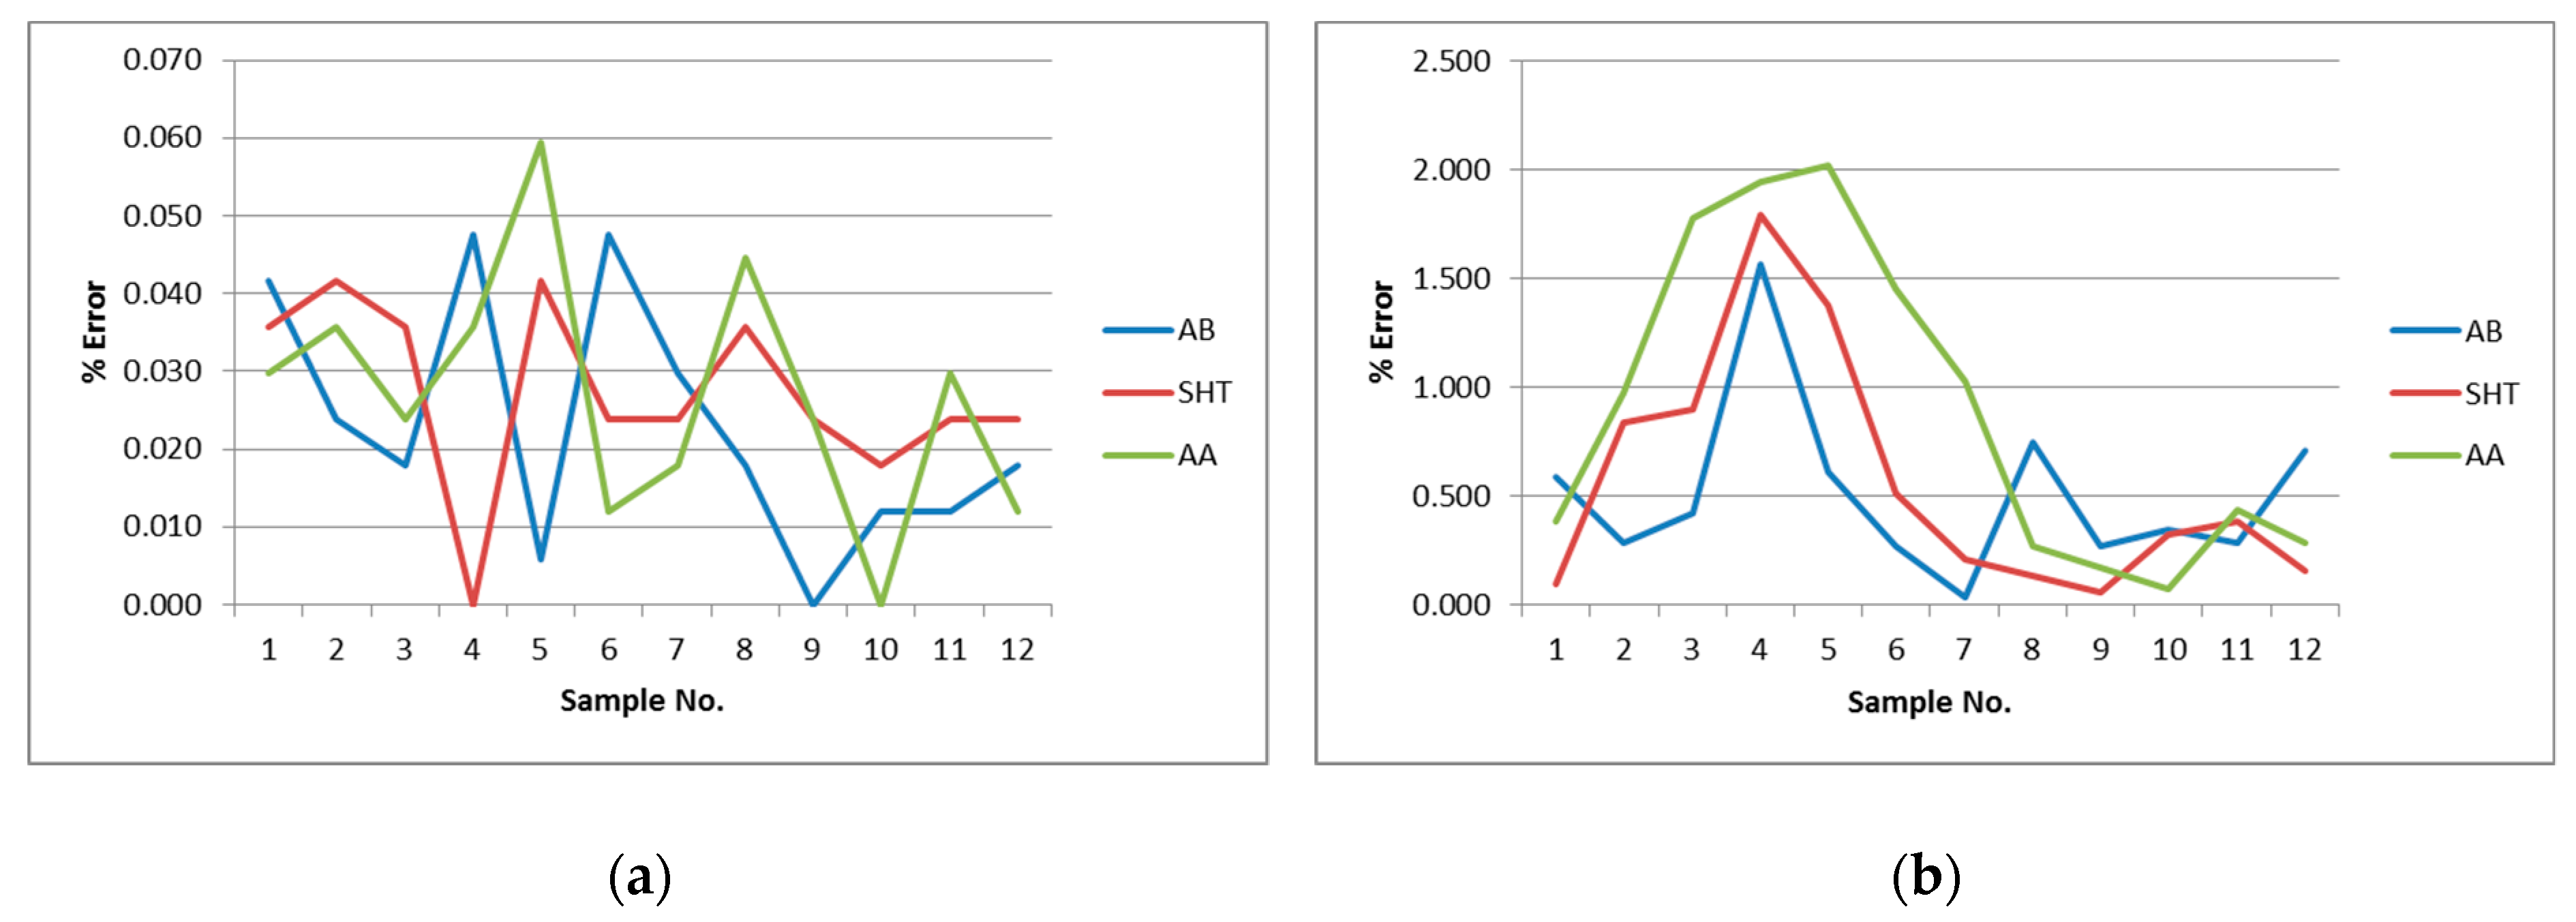
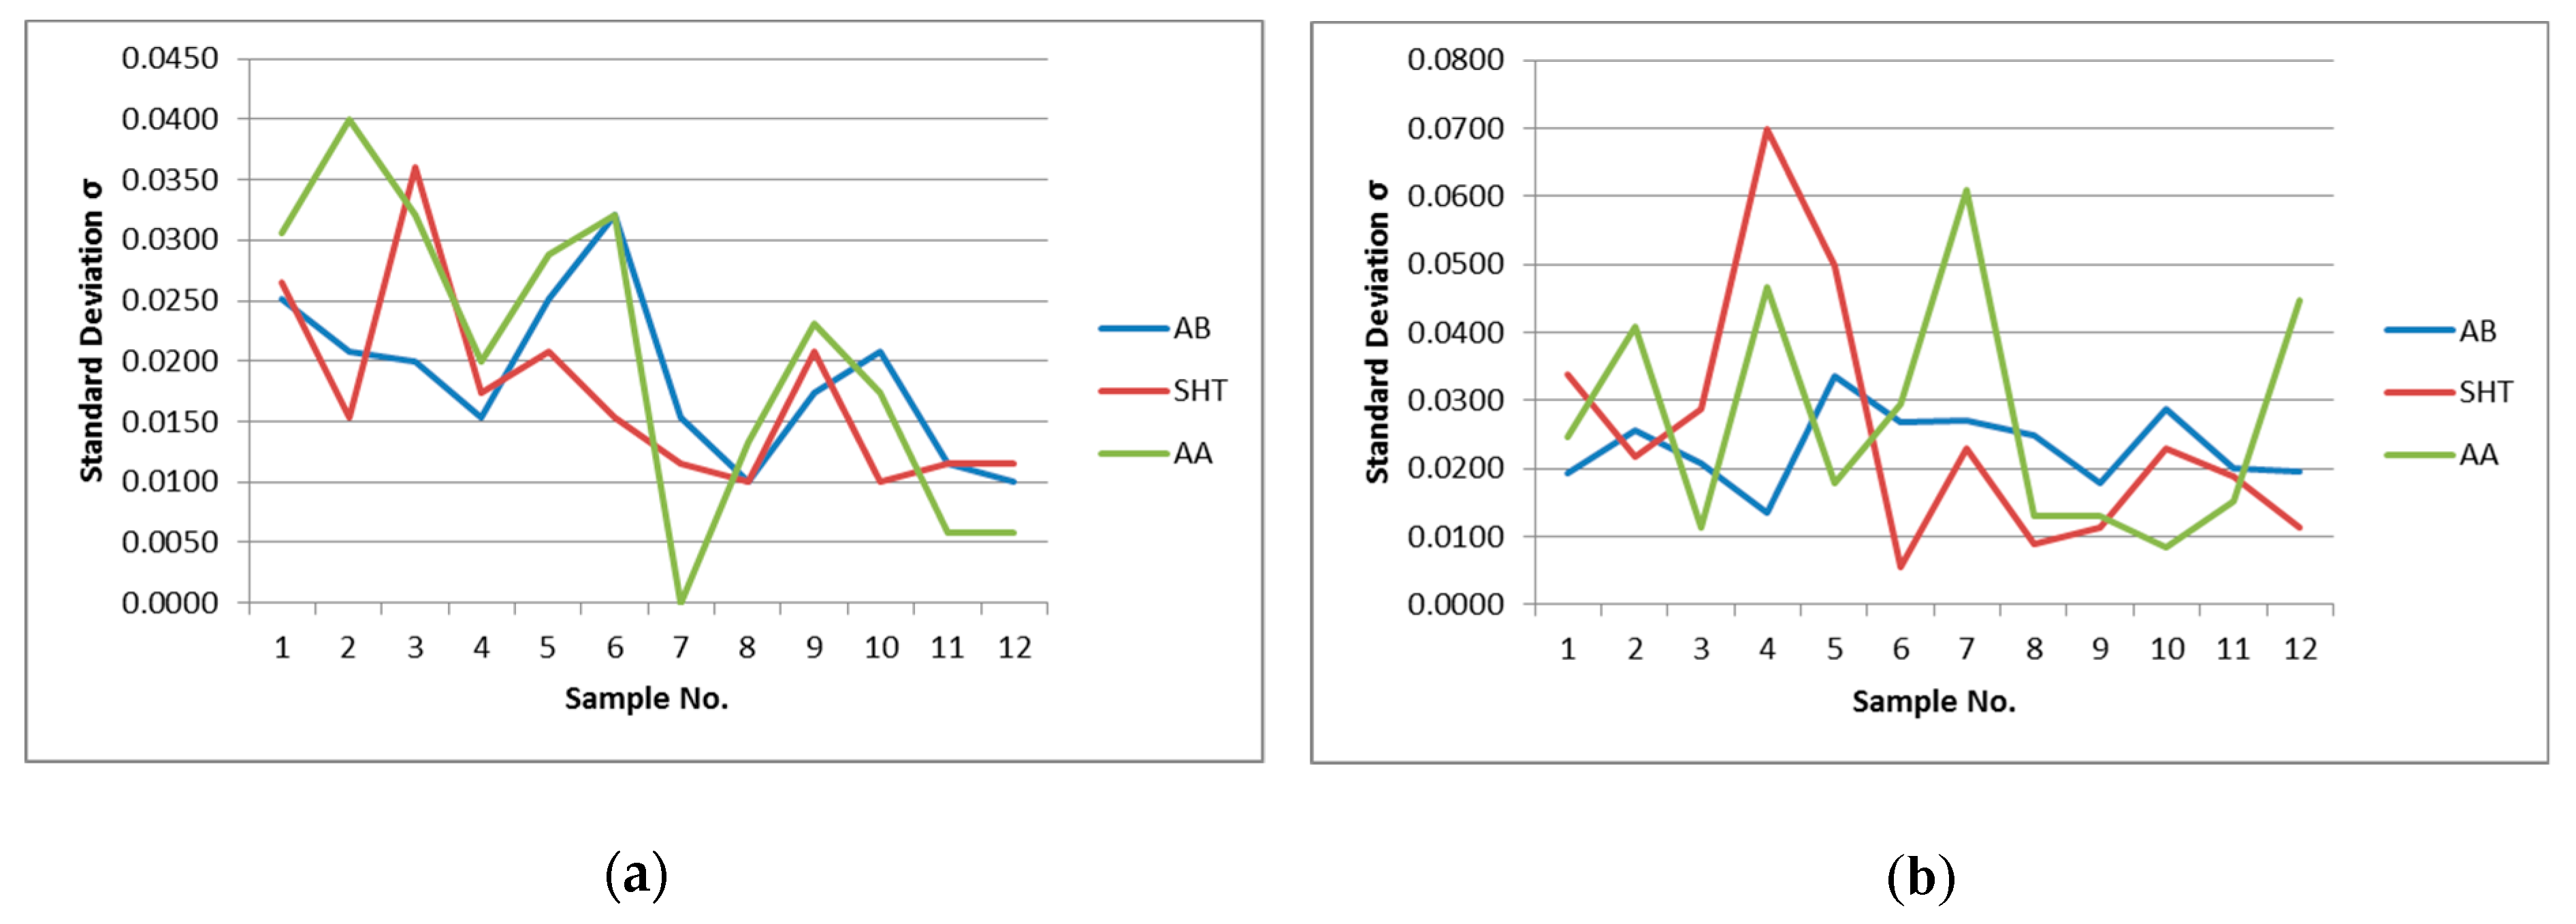
The samples are further analyzed to investigate the effect of SHT and AA on dimensional quality and distortion. Figure 9 and Figure 10 show the results of % error and standard deviation in sample length and height under AB, SHT, and AA conditions. The result shows that SHT and AA have no clear effect on dimensional accuracy and precision. The results are random and do not depict any trend.
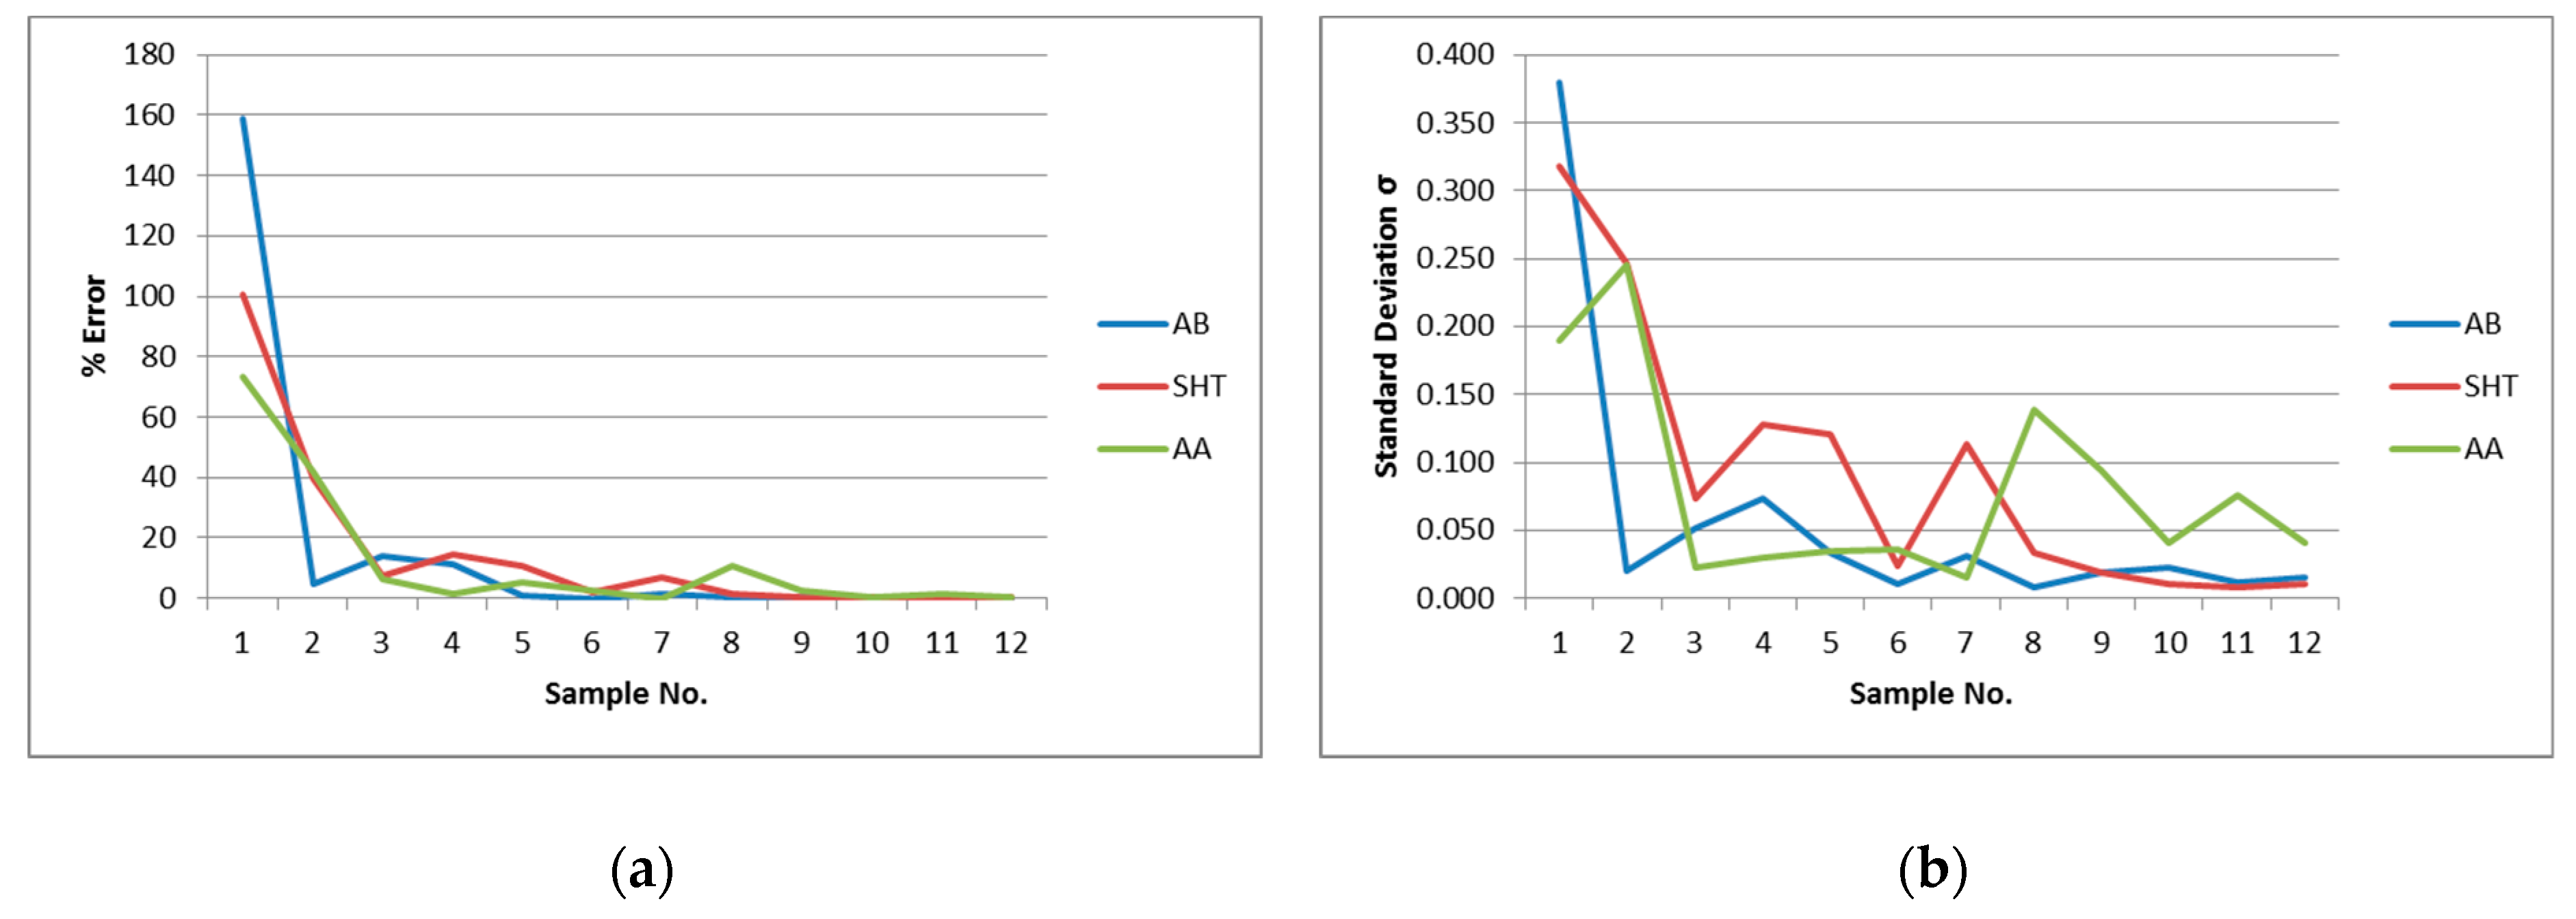
Figure 11 shows the results of distortion under AB, SHT, and AA aging conditions. The results are random and do not depict any beneficial effect of SHT and AA on distortion. Conclusively SHT and AA do not give any advantage in improving dimensional quality, i.e., accuracy and precision and reducing distortion.

4. Conclusions

In this paper, the dimensional quality, accuracy, and precision are investigated under repeatability and reproducibility conditions. The effect of increasing sample dimension, i.e., thickness, on the accuracy and precision, is studied followed by correlation and regression analysis. The distortion analysis is performed to examine the effect of SHT and AA for any improvement in dimensional quality and distortion. The following conclusive results are observed based on results and analysis;
  • The manufacturing process has shown instability and random variations under repeatability condition, which is due to the inherent variability or random errors in the system.
  • The dimensional quality results revealed that in sample length (horizontal dimension), 0.05 mm maximum dimensional error, 0.0197 mm repeatability (σr), and 0.0169 mm reproducibility (σR) observed. Similarly, in sample height (vertical dimension), 0.258 mm maximum error, 0.0237 mm repeatability (σr), and 0.0863 mm reproducibility (σR) observed.
  • The ANOVA results revealed that length means (horizontal dimension) is not statistically significantly different under repeatability and reproducibility conditions. Whereas, the height means (vertical dimension) are statistically significantly different under repeatability and reproducibility conditions.
  • The results show the variation of dimensional quality in horizontal and vertical directions. The dimensions created in xy-plane (horizontal direction) observed more accurate and precise as compared to the z-axis dimension (vertical direction).
  • The dimensional error decreased with increasing sample thickness. The error reduces to less than 0.3% for thickness greater than 2 mm. The correlation analysis has revealed a negative correlation (r = −0.73) between % error and sample thickness. The regression model revealed an exponential decrease of %error with increasing thickness, Rsq = 0.6348 (63.48%), and p-value 0.0006 (<0.05), which shows the significance of the relationship.
  • The sample distortion decreased with increasing sample thickness. The 0.5 mm thickness sample has shown very high distortion, whereas, the distortion reduced significantly for the 0.8–1.5 mm thickness samples.
  • The solution heat treatment and artificial aging did not give any advantage in improving dimensional quality or reducing distortion in comparison with as-built condition results. It is not proven suitable for improvement purpose, but these HT conditions may improve other mechanical properties of parts like tensile strength, elongation, etc.

Author Contributions

Conceptualization, A.A., A.M. and G.J.; methodology, A.A., A.M.; samples fabrication and measurement, A.M. and Z.A.; validation and formal analysis, A.A. and A.M.; investigation, A.A., A.M. and Z.A.; data curation, A.A. and A.M.; writing—original draft preparation, A.A.; writing—review and editing, A.A., A.M. and Z.A.; visualization, A.A. and G.J.

Funding

This research was funded by the National Natural Science Foundation of China, grant number 51505423 and 51705428.

Acknowledgments

The authors would like to thank Yingfeng Zhang, Jingxiang Lv, and Tao Peng for their valuable guidance and support during this research.

Conflicts of Interest

The authors declare no conflict of interest.

References

  1. Colosimo, B.M.; Huang, Q.; Dasgupta, T.; Tsung, F. Opportunities and challenges of quality engineering for additive manufacturing. J. Qual. Technol. 2018, 50, 233–252. [Google Scholar] [CrossRef] [Green Version]
  2. Joshi, S.C.; Sheikh, A.A. 3D printing in aerospace and its long-term sustainability. Virtual Phys. Prototyp. 2015, 10, 175–185. [Google Scholar] [CrossRef]
  3. Wong, K.K.; Ho, J.Y.; Leong, K.C.; Wong, T.N. Wong Fabrication of heat sinks by Selective Laser Melting for convective heat transfer applications. Virtual Phys. Prototyp. 2016, 11, 159–165. [Google Scholar] [CrossRef]
  4. DebRoy, T.; Wei, H.L.; Zuback, J.S.; Mukherjee, T.; Elmer, J.W.; Milewski, J.O.; Beese, A.M.; Wilson-Heid, A.; De, A.; Zhang, W. Additive manufacturing of metallic components—Process, structure and properties. Prog. Mater. Sci. 2018, 92, 112–224. [Google Scholar] [CrossRef]
  5. Vončina, M.; Kores, S.; Mrvar, P.; Medved, J. Effect of Ce on solidification and mechanical properties of A360 alloy. J. Alloys Compd. 2011, 509, 7349–7355. [Google Scholar] [CrossRef]
  6. Li, X.P.; Wang, X.J.; Saunders, M.; Suvorova, A.; Zhang, L.C.; Liu, Y.J.; Fang, M.H.; Huang, Z.H.; Sercombe, T.B. A selective laser melting and solution heat treatment refined Al–12Si alloy with a controllable ultrafine eutectic microstructure and 25% tensile ductility. Acta Mater. 2015, 95, 74–82. [Google Scholar] [CrossRef]
  7. Martin, J.H.; Yahata, B.D.; Hundley, J.M.; Mayer, J.A.; Schaedler, T.A.; Pollock, T.M. 3D printing of high-strength aluminium alloys. Nature 2017, 549, 365–369. [Google Scholar] [CrossRef]
  8. Majeed, A.; Lv, J.; Zhang, Y.; Shamim, K.; Qureshi, M.E.; Muzamil, M.; Zafar, F.; Waqas, A. An investigation into the influence of processing parameters on the surface quality of AlSi10Mg parts by SLM process. In Proceedings of the 2019 16th International Bhurban Conference on Applied Sciences and Technology (IBCAST-2019), Islamabad, Pakistan, 8–12 January 2019. [Google Scholar]
  9. Kempen, K.; Thijs, L.; Van Humbeeck, J.; Kruth, J.P. Processing AlSi10Mg by selective laser melting: Parameter optimisation and material characterisation. Mater. Sci. Technol. 2015, 31, 917–923. [Google Scholar] [CrossRef]
  10. Jung, J.G.; Ahn, T.Y.; Cho, Y.H.; Kim, S.H.; Lee, J.M. Synergistic effect of ultrasonic melt treatment and fast cooling on the refinement of primary Si in a hypereutectic Al–Si alloy. Acta Mater. 2018, 148, 31–40. [Google Scholar] [CrossRef]
  11. Cáceres, C.H.; Davidson, C.J.; Griffiths, J.R. The deformation and fracture behaviour of an Al-Si-Mg casting alloy. Mater. Sci. Eng. A 1995, 197, 171–179. [Google Scholar] [CrossRef]
  12. Gu, D.D.; Meiners, W.; Wissenbach, K.; Poprawe, R. Laser additive manufacturing of metallic components: Materials, processes and mechanisms. Int. Mater. Rev. 2012, 57, 133–164. [Google Scholar] [CrossRef]
  13. Herzog, D.; Seyda, V.; Wycisk, E.; Emmelmann, C. Additive manufacturing of metals. Acta Mater. 2016, 117, 371–392. [Google Scholar] [CrossRef]
  14. Olakanmi, E.O.; Cochrane, R.F.; Dalgarno, K.W. A review on selective laser sintering/melting (SLS/SLM) of aluminium alloy powders: Processing, microstructure, and properties. Prog. Mater. Sci. 2015, 74, 401–477. [Google Scholar] [CrossRef]
  15. Anwar, A.B.; Pham, Q.C. Selective laser melting of AlSi10Mg: Effects of scan direction, part placement and inert gas flow velocity on tensile. J. Mater. Process. Technol. 2017, 240, 388–396. [Google Scholar] [CrossRef]
  16. Trevisan, F.; Calignano, F.; Lorusso, M.; Pakkanen, J.; Aversa, A.; Ambrosio, E.; Lombardi, M.; Fino, P.; Manfredi, D. On the Selective Laser Melting (SLM) of the AlSi10Mg Alloy: Process, Microstructure, and Mechanical Properties. Materials 2017, 10, 76. [Google Scholar] [CrossRef]
  17. Krishnan, M.; Atzeni, E.; Canali, R.; Calignano, F.; Manfredi, D.; Ambrosio, E.P.; Iuliano, L. On the effect of process parameters on properties of AlSi10Mg parts produced by DMLS. Rapid Prototyp. J. 2014, 20, 449–458. [Google Scholar] [CrossRef]
  18. Read, N.; Wang, W.; Essa, K.; Attallah, M.M. Selective laser melting of AlSi10Mg alloy: Process optimisation and mechanical properties development. Mater. Des. 2015, 65, 417–424. [Google Scholar] [CrossRef] [Green Version]
  19. Strano, G.; Hao, L.; Everson, R.M.; Evans, K.E. Surface roughness analysis, modelling and prediction in selective laser melting. J. Mater. Process. Technol. 2013, 213, 589–597. [Google Scholar] [CrossRef]
  20. Wang, D.; Wu, S.; Bai, Y.; Lin, H.; Yang, Y.; Song, C. Characteristics of typical geometrical features shaped by selective laser melting. J. Laser Appl. 2017, 29, 022007. [Google Scholar] [CrossRef]
  21. Davidson, K.; Singamneni, S. Selective Laser Melting of Duplex Stainless Steel Powders: An Investigation. Mater. Manuf. Process. 2016, 31, 1543–1555. [Google Scholar] [CrossRef]
  22. Calignano, F.; Lorusso, M.; Pakkanen, J.; Trevisan, F.; Ambrosio, E.P.; Manfredi, D.; Fino, P. Investigation of accuracy and dimensional limits of part produced in aluminum alloy by selective laser melting. Int. J. Adv. Manuf. Technol. 2017, 88, 451–458. [Google Scholar] [CrossRef]
  23. Calignano, F. Investigation of the accuracy and roughness in the laser powder bed fusion process. Virtual Phys. Prototyp. 2018, 13, 97–104. [Google Scholar] [CrossRef]
  24. Yap, Y.L.; Wang, C.; Sing, S.L.; Dikshit, V.; Yeong, W.Y.; Wei, J. Material jetting additive manufacturing: An experimental study using designed metrological benchmarks. Precis. Eng. 2017, 50, 275–285. [Google Scholar] [CrossRef]
  25. Raghunath, N.; Pandey, P.M. Improving accuracy through shrinkage modelling by using Taguchi method in selective laser sintering. Int. J. Mach. Tools Manuf. 2007, 47, 985–995. [Google Scholar] [CrossRef]
  26. Han, X.; Zhu, H.; Nie, X.; Wang, G.; Zeng, X. Investigation on Selective Laser Melting AlSi10Mg Cellular Lattice Strut: Molten Pool Morphology, Surface Roughness and Dimensional Accuracy. Materials 2018, 11, 392. [Google Scholar] [CrossRef] [PubMed]
  27. Majeed, A.; Lv, J.; Peng, T. A framework for big data driven process analysis and optimization for additive manufacturing. Rapid Prototyp. J. 2019, 25, 308–321. [Google Scholar] [CrossRef]
  28. Zhu, H.H.; Lu, L.; Fuh, J.Y.H. Study on shrinkage behaviour of direct laser sintering metallic powder. Proc. Inst. Mech. Eng. Part B J. Eng. Manuf. 2006, 220, 183–190. [Google Scholar] [CrossRef]
  29. Yu, W.; Sing, S.L.; Chua, C.K.; Tian, X. Influence of re-melting on surface roughness and porosity of AlSi10Mg parts fabricated by selective laser melting. J. Alloys Compd. 2019, 792, 574–581. [Google Scholar] [CrossRef]
  30. Kruth, J.-P.; Badrossamay, M.; Yasa, E.; Deckers, J.; Thijs, L.; Van Humbeeck, J. Part and Material Properties in Selective Laser Melting of Metals. In Proceedings of the 16th International Symposium on Electromachining (ISEM–XVI), Shanghai, China, 19–23 April 2010. [Google Scholar]
  31. Shiomi, M.; Osakada, K.; Nakamura, K.; Yamashita, T.; Abe, F. Residual Stress within Metallic Model Made by Selective Laser Melting Process. CIRP Ann. 2004, 53, 195–198. [Google Scholar] [CrossRef]
  32. Yasa, E.; Deckers, J.; Craeghs, T.; Badrossamay, M.; Kruth, J.P. Investigation on occurrence of elevated edges in selective laser melting. In Proceedings of the 20th Annual International Solid Freeform Fabrication Symposium, SFF 2009, Austin, TX, USA, 3–5 August 2009; pp. 673–685. [Google Scholar]
  33. Beal, V.E.; Erasenthiran, P.; Hopkinson, N.; Dickens, P.; Ahrens, C.H. Scanning strategies and spacing effect on laser fusion of H13 tool steel powder using high power Nd: YAG pulsed laser. Int. J. Prod. Res. 2007, 46, 217–232. [Google Scholar] [CrossRef]
  34. Li, C.; Fu, C.H.; Guo, Y.B.; Fang, F.Z. Fast Prediction and Validation of Part Distortion in Selective Laser Melting. Procedia Manuf. 2015, 1, 355–365. [Google Scholar] [CrossRef] [Green Version]
  35. Afazov, S.; Denmark, W.A.; Toralles, B.L.; Holloway, A.; Yaghi, A. Distortion Prediction and Compensation in Selective Laser Melting. Addit. Manuf. 2017, 17, 15–22. [Google Scholar] [CrossRef]
  36. Keller, N.; Ploshikhin, V. New method for fast predictions of residual stress and distortion of AM parts. In Proceedings of the Solid Freeform Fabrication Symposium, Austin, TX, USA, 4–6 August 2014; Volume 25, pp. 4–6. [Google Scholar]
  37. Majeed, A.; Zhang, Y.; Lv, J.; Peng, T.; Waqar, S.; Atta, Z. Study the effect of heat treatment on the relative density of SLM built parts of AlSi10Mg alloy. In Proceedings of the 48th International Conference on Computers and Industrial Engineering (CIE 2018), Auckland, New Zealand, 2–5 December 2018. [Google Scholar]
  38. Aboulkhair, N.T.; Tuck, C.; Ashcroft, I.; Maskery, I.; Everitt, N.M. On the Precipitation Hardening of Selective Laser Melted AlSi10Mg. Metall. Mater. Trans. A 2015, 46, 3337–3341. [Google Scholar] [CrossRef]
  39. Li, W.; Li, S.; Liu, J.; Zhang, A.; Zhou, Y.; Wei, Q.; Yan, C.; Shi, Y. Effect of heat treatment on AlSi10Mg alloy fabricated by selective laser melting: Microstructure evolution, mechanical properties and fracture mechanism. Mater. Sci. Eng. A 2016, 663, 116–125. [Google Scholar] [CrossRef]
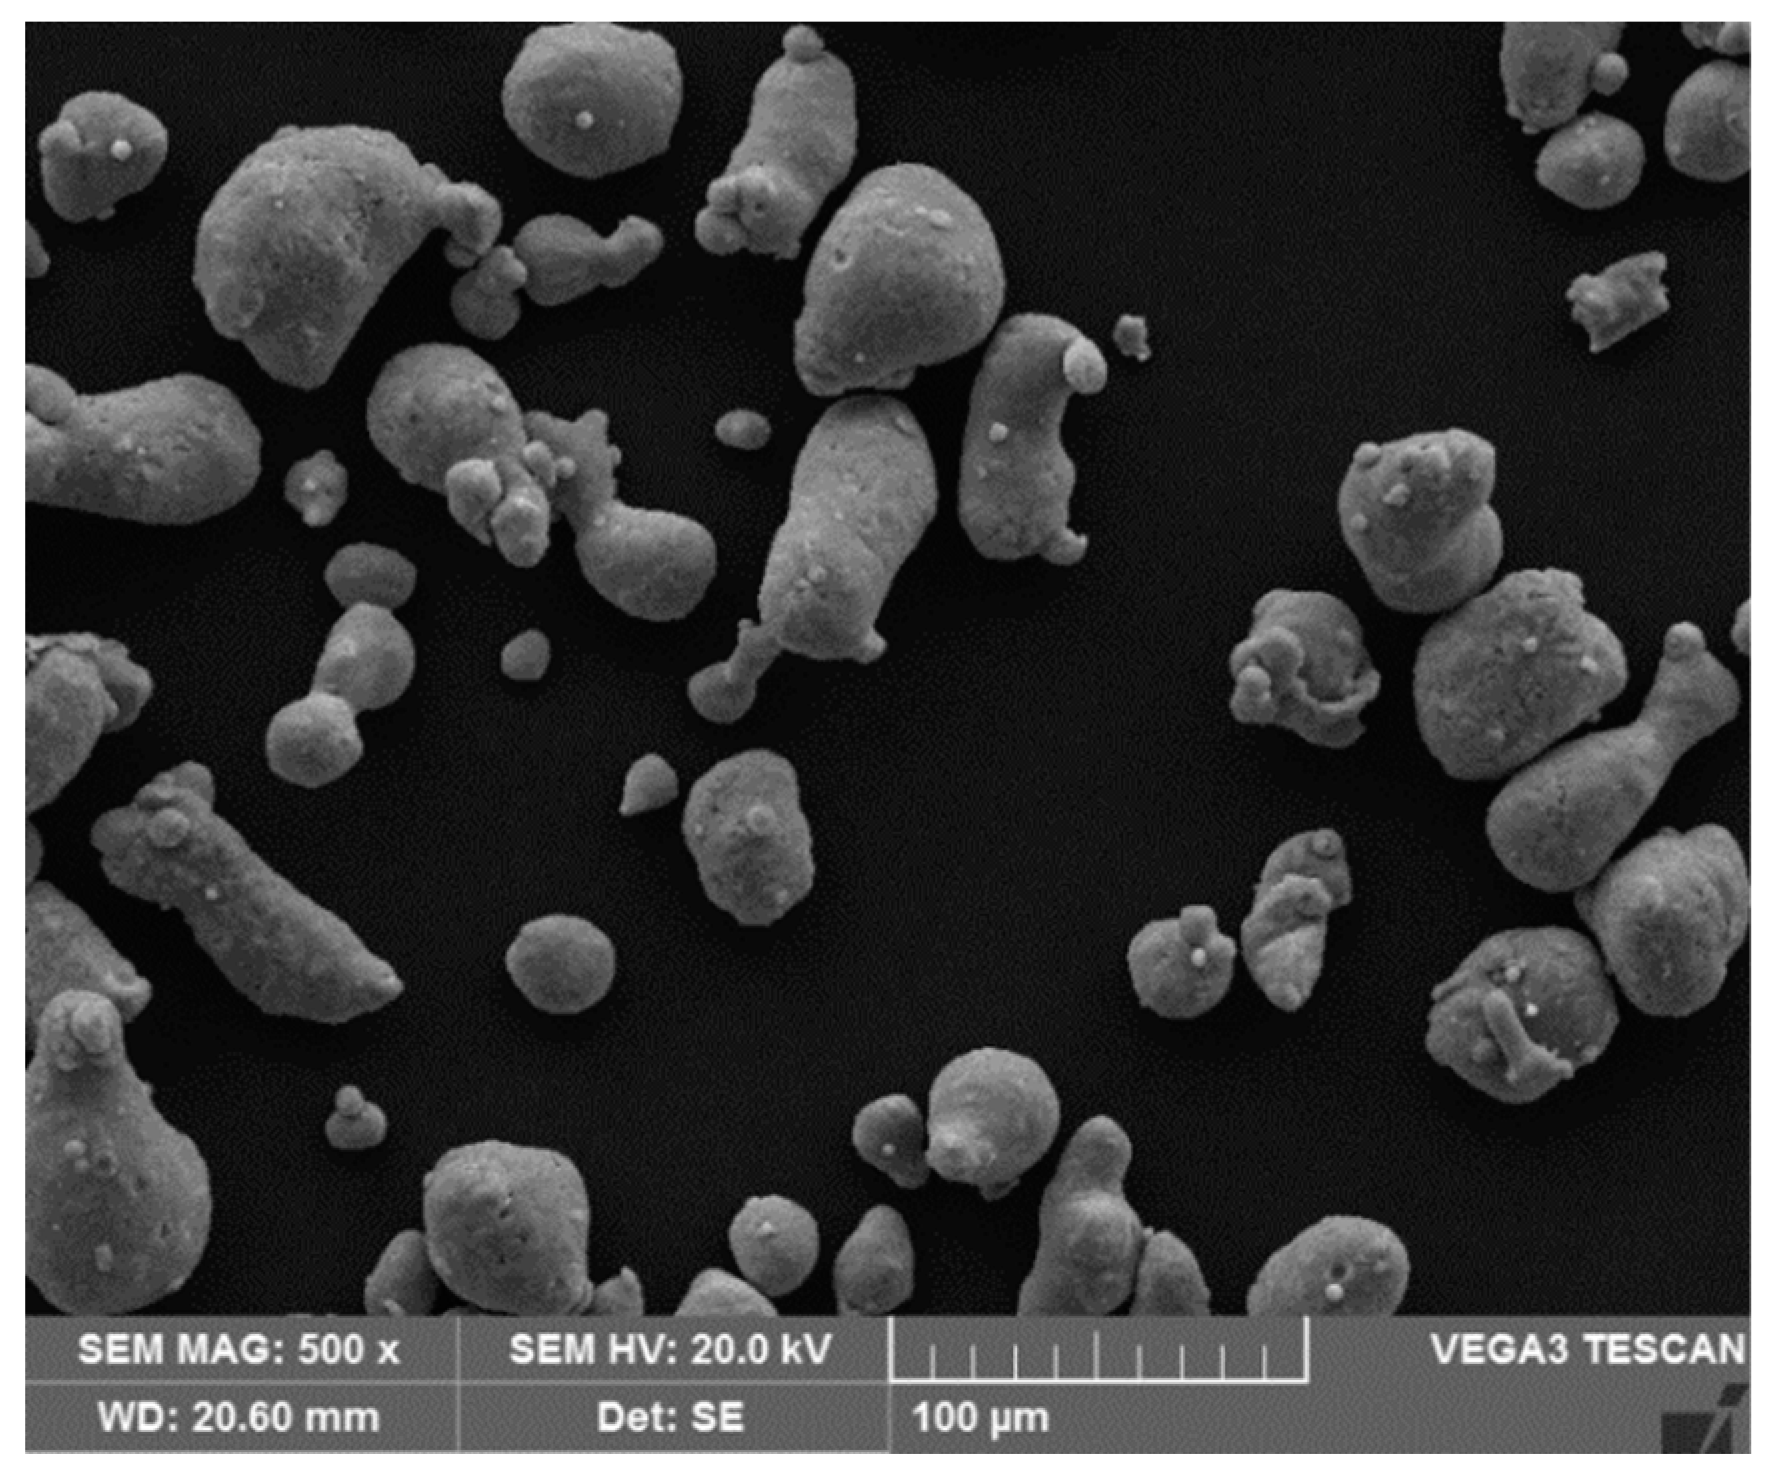
Figure 1. The morphology of AlSi10Mg powder particles.
Jmmp 03 00051 g001
Figure 2. Experimental Scheme.
Jmmp 03 00051 g002
Figure 3. (a) Sample sizing and analyzed dimensions length (L), height (H), and thickness (T). (b) Sample build-up scheme.
Jmmp 03 00051 g003
Figure 4. (a) Developed Samples (b) SLM 280HL System.
Jmmp 03 00051 g004
Figure 5. (a) Length and (b) height variation in developed samples with standard deviation.
Jmmp 03 00051 g005
Figure 6. Experimental results show that % error in actual thickness decrease with increasing sample thickness. The % error reduces less than 0.3% for thickness greater than 2 mm.
Jmmp 03 00051 g006
Figure 7. (a) Fitted line plot for a regression model. Sample thickness and % error in the thickness of developed samples decrease exponentially with increasing thickness. (b) Prediction plot showing the values falls within the 95% prediction interval. The central red line is fitted line, and the outer blue lines represent 95% prediction interval.
Jmmp 03 00051 g007
Figure 8. (a) The distortion profile is showing that it is decreasing with increasing sample thickness. (b) A sample showing distortion.
Jmmp 03 00051 g008
Figure 9. % Error in sample (a) length and (b) height comparison in As-Built (AB), Solution Heat Treatment (SHT), and Artificial Aging (AA) conditions.
Jmmp 03 00051 g009
Figure 10. Standard Deviation σ in sample (a) length and (b) height comparison in AB, SHT, and AA conditions.
Jmmp 03 00051 g010
Figure 11. (a) Distortion % Error and (b) Distortion Standard Deviation Comparison under AB, SHT, and AA conditions.
Jmmp 03 00051 g011
Table 1. Measurement and ANOVA results of the samples (set 1) under repeatability condition.
Sample Length (L)Sample Height (H)
Sample NoDesign Length (mm)Actual Mean Length (mm)% ErrorSample NoDesign Height (mm) Actual Mean Height (mm)% Error
15655.9770.042110.510.4380.590
25656.0130.024210.510.5300.286
35655.9900.018310.510.5440.419
45655.9730.048410.510.6641.562
55655.9970.006510.510.5640.610
65655.9730.048610.510.5280.267
75655.9830.030710.510.5040.038
85655.9900.018810.510.4220.743
95656.0000.000910.510.4720.267
105656.0070.0121010.510.4640.343
115656.0070.0121110.510.4700.286
125656.0100.0181210.510.4260.705
Overall Mean Length (mm)55.993Overall Mean Height (mm)10.502
Max. Error (mm)0.027Max Error (mm)0.164
Repeatability σr (mm)0.0197Repeatability σr (mm)0.0237
p-value0.160p-value0.000
F-value1.61F-value42.73
Table 2. Measurement and ANOVA results of set 1 and set 4 developed under reproducibility condition.
ParameterLength (L)Height (H)
Set 1Set 4Set 1Set 4
Design Value (mm)565610.510.5
Mean Value (mm)55.99356.00610.50210.591
Max. Error in any sample (mm)0.027 (0.048%)0.050 (0.089%)0.164 (1.564%)0.258 (2.457%)
Reproducibility σR (mm)0.01690.0863
p-value0.086 (>0.05)0.019 (<0.05)
F-value3.236.39
Table 3. Measurement results of sample thickness.
Sample NoDesign Thickness (mm)Actual Thickness T (mm)
Mean Thickness (mm)% ErrorMax Error (mm)Standard Deviation σ
10.50.4882.400.0380.0130
20.80.7822.250.0045
310.9623.800.0179
41.21.1682.670.0084
51.51.4940.400.0089
61.81.7741.440.0055
721.9940.300.0089
82.52.4960.160.0089
933.0080.270.0084
103.53.5040.110.0055
1144.0060.150.0055
1255.0080.160.0045
Table 4. Distortion measurement results of the thickness of samples.
Sample NoDesign Thickness (mm)Distortion (Displacement Measurement) mm
12345678910MeanStd. Dev.% Distorted
10.50.1740.6630.8330.9491.091.3121.0740.9350.6180.1720.7820.380158.62
20.80.0110.050.0440.0620.0440.0350.0510.0470.0110.0070.03620.0204.54
310.0550.1910.0820.1250.1160.1990.1350.1920.1540.0790.13280.05113.89
41.20.050.0750.1010.2130.2150.170.2320.1030.0630.0480.1270.07311.20
51.5-0.0230.0220.0340.040.0870.0050.010.001-0.006-0.0210.01490.0331.04
61.8-0.0030.0170.0020.014-0.015-0.009-0.0040.0040.004-0.0090.00010.0100.01
72-0.0080.0110.0190.020.0330.0150.0060.0250.0330.1080.02620.0311.36
82.50.0150.0120.0140.0130.0250.02-0.0010.0040.0250.0190.01460.0080.60
930.0220.0130.002-0.008-0.0040.0070.0020.0130.0370.050.01340.0180.45
103.50.043-0.001-0.013-0.016-0.034-0.031-0.031-0.018-0.0120.001-0.01120.0230.33
1140.0290.0170.0070.0060.0040.0030.025-0.00700.0060.0090.0110.23
1250.0290.0110.007-0.001-0.008-0.01-0.009-0.017-0.012-0.019-0.00290.0150.06