Article

Monitoring and Cordoning Wildfires with an Autonomous Swarm of Unmanned Aerial Vehicles

1
VTT Technical Research Centre of Finland, 02150 Espoo, Finland
2
Netherlands Organisation for Applied Scientific Research, 2597 AK Den Haag, The Netherlands
3
VTT Technical Research Centre of Finland, 90570 Oulu, Finland
*
Author to whom correspondence should be addressed.
Drones 2022, 6(10), 301; https://doi.org/10.3390/drones6100301
Submission received: 29 August 2022 / Revised: 27 September 2022 / Accepted: 5 October 2022 / Published: 14 October 2022

Abstract

:
Unmanned aerial vehicles, or drones, are already an integral part of the equipment used by firefighters to monitor wildfires. They are, however, still typically used only as remotely operated, mobile sensing platforms under direct real-time control of a human pilot. Meanwhile, a substantial body of literature exists that emphasises the potential of autonomous drone swarms in various situational awareness missions, including in the context of environmental protection. In this paper, we present the results of a systematic investigation by means of numerical methods i.e., Monte Carlo simulation. We report our insights into the influence of key parameters such as fire propagation dynamics, surface area under observation and swarm size over the performance of an autonomous drone force operating without human supervision. We limit the use of drones to perform passive sensing operations with the goal to provide real-time situational awareness to the fire fighters on the ground. Therefore, the objective is defined as being able to locate, and then establish a continuous perimeter (cordon) around, a simulated fire event to provide live data feeds such as e.g., video or infra-red. Special emphasis was put on exclusively using simple, robust and realistically implementable distributed decision functions capable of supporting the self-organisation of the swarm in the pursuit of the collective goal. Our results confirm the presence of strong nonlinear effects in the interaction between the aforementioned parameters, which can be closely approximated using an empirical law. These findings could inform the mobilisation of adequate resources on a case-by-case basis, depending on known mission characteristics and acceptable odds (chances of success).

1. Introduction

1.1. Wildfires, a Major Global Environmental Issue

Wildfires are an increasingly common and destructive natural disaster [1,2,3,4,5], a fact widely recognised to be a consequence of climate change. Forest fires are a relevant factor in climate change, both as a cause [6] and as a consequence [1]. They release CO 2 [7] in the atmosphere and destroy an important carbon sink. Furthermore, there is a wide consensus that they are becoming more frequent and severe because of global warming [8].
At the time of writing (summer 2022), wildfires have been raging throughout Europe and North America for weeks, destroying thousands of hectares of forest in densely populated regions, forcing the evacuation of thousands of people, and causing billions of euros worth of damage in lost property alone as well as loss of natural habitat and biodiversity [9,10,11]. Even in the best-case scenario in which climate change is brought under control, humanity is facing decades of global warming and record-breaking temperatures, as this trend is certain to continue for the foreseeable future. In this unfavourable context, climate adaptation is our only short to medium-term option, which includes trying to use any available technological solution to try and alleviate the damage caused to our environment.
Forest fires occur somewhat unpredictably, but can be quite destructive [12]. The annual global impact of thousands of forest fires can hardly be assessed [9]; it is estimated to be anywhere from in the millions of hectares [13,14], ranging up to a billion hectares of forest destroyed annually [15]. This is only expected to get worse for the time being [1,2,3,4,5].
The damages caused by forest fires are economic [5], ecological [11], social and environmental [10], with the destruction of economic value actually being the lesser issue [16] in the greater scheme of things. This is because forests do play an important role in the planet’s ecological balance [9] and—obviously—as our (human’s) natural environment [16]. Due to this, forest fires are considered a major global environmental issue [17].

1.2. Monitoring Large Forests in Remote Areas Using Modern Sensing Technologies

Especially in remote areas, forest fires are normally only detected once the fire has spread considerably [5,9]. In [10] the authors emphasize the need to detect (and map) a fire as early as possible, ideally in its initial stage. To achieve and facilitate this, various sensing technologies are used to detect either (or a combination of) gas, open flames or smoke [14]. These sensors have in the past been deployed on various platforms, such as e.g., planes [4,18], drones [18,19,20,21] and even satellite systems [5,9,10,15,20,22,23] (even microsatellites [18]). Indeed, multiple test projects focusing on forest fire detection using satellite data were conducted in the late 90’s in Finland and the surrounding countries [15].
Sensors [24] can be mounted and connected physically or—increasingly—wirelessly [9] (the latter constituting a Wireless Sensor Networks, WSNs) [9,10]. Existing sensor–networks and –systems [9,20] often use optical [12,25] or infrared sensors [22]. New sensors [24,26] (e.g., using kinetic energy [27]) and even sensor types (such as sensors based on the Melanophila acuminata beetle [28] in nature; cf. [29]) are being developed.
The (often vast) expanses that require monitoring make even the deployment of the most sustainable and cheapest sensors a challenge. Recently, wireless sensors have been used as payloads for (potentially autonomously operating) sensing platforms such as drones [19,21] planes [4,18] or rovers to detect, map and monitor forest fires [9,20].
In this paper, we report on current investigations (the FireMan (https://fcai.fi/news/2022/8/15/using-drone-swarms-to-monitor-and-combat-future-wildfires accessed on 1 October 2022) project, funded by the Academy of Finland) into the use of unmanned aerial vehicles (UAVs) [21,30] as mobile sensing platforms for the monitoring of forest wildfires.

1.3. Using Unmanned and Autonomous (Aerial) Sensing Platforms for Remote Fire Monitoring

UAVs are a tool that can greatly benefit the prevention and fighting of wildfires in different phases [31,32,33]. The prevention phase seeks to prevent the occurrence of fires and limit their consequences; aerial image data collected by drones can be used to plan these tasks. Fire surveillance involves the activities performed to locate fires as early as possible, and may have up to four objectives: search of potential fires, detection [9] to alert firefighters, diagnosis [34] to get relevant data about the fire, and prognosis to predict [14] fire propagation. Fire extinguishing involves not only the actions performed to put out the flames but also supporting activities such as creating for example firewalls, entry and exit routes for ground vehicles, runways, heliports. This paper focuses only on the surveillance phase, which are discussed from the drone usage perspective.
In the prevention phase, typically manned small aircraft are nowadays used. This approach is however a rather costly and emission-intensive way to monitor large geographical areas. Therefore, for example, a swarm of electrical and unmanned drones [20] with long flight times would be a more cost-effective and environmentally-friendly solution. In the fire surveillance phase, drones are currently often still operated manually by a dedicated pilot who is part of the fire crew. This approach is inefficient from the resources perspective, as one fireman is then tied to this drone control during the fire. Additionally, a problem in a wildfire situation is that the visual-line-of-sight (VLoS) to the drone can be blocked with the smoke in the air. Therefore, novel solutions are needed.
With automation, the target is typically to reduce the need for human involvement in drone operations. In future scenarios, the UASs will operate fully autonomously in swarms [30], beyond-visual-line-of-sight (BVLoS), carrying out various tasks, and observing and understanding the environment with intelligent sensors [24] and analytics in real-time [35,36,37]. The direct benefits of this approach include savings due to the reduction of manual human work, the replacement of current manned aircraft applications with autonomous unmanned lightweight drones, and the replacement of fossil fuel-based solutions with clean and green energy sources with low emissions. Drones are also especially suitable for wildfire missions, as the fires occur typically in summery and dry weather that are optimal conditions for drones to fly in. Furthermore, combining ground vehicles (such as in our case fire trucks) with UAV operations by using the vehicles as charging stations [38,39,40] are being considered and field tested; with the right technical solutions, flights operating even 24 hours a day can be implemented in the foreseeable future [41].
With that in mind, we set off to determine the extent to which simple autonomous features could be leveraged to improve the usability of drone swarms while reducing the need for human input. We deliberately chose to follow a parsimonious approach and use the most basic interaction and decision-making functions possible, to ensure that the proposed method is both robust and implementable using existing development toolkits and readily available technology. Accordingly, the focus of the present study is not the design of an advanced framework to conduct complex swarm operations, but the investigation of the performance of a simple distributed algorithm that relies on emergent collective dynamics to complete a fire surveillance task.

1.4. Scope

In wildfire and forest fire detection [16] research, one commonly distinguishes between two aspects of the study: (a) the reliable detection of a fire in a complex and noisy environment, potentially rich in false positives requiring disambiguation, as well as (b) the model for the subsequent spread of the fire [20]. The latter can either be derived from experiments (cf. e.g., [42,43]) or be based on physics [44,45]. In this paper, we only provide a simple model for the spread of the fire, using a cellular automation based on the same principles as the “Prometheus” model [46], cf. Section 2.1 for the details and motivation.
In our simulation fire is the only heat source. We can therefore safely ignore the first aspect mentioned above. The field of processing data / data streams with the intent to identify a wildfire is diverse and large. Artificial intelligence techniques [36] and models [11,12], especially various forms of machine learning [14,22,34,47] are applied to determine whether a recorded event is a true or false positive.
Common counter-measures to forest fires come in various flavors: besides the many approaches to facilitate the early detection of a fire there are also various interventions that can be implemented to reduce the probability of a fire starting in the first place [9]. We focus exclusively on the monitoring and cordoning of fires and leave their prevention (actions prior to detection) to the experts in other domains.
Other than for the detection of fires, drones are also increasingly used for the combating thereof [33,48] or to monitor other environmental aspects (such as e.g., wildlife [31]) during a fire. The drones in this article are exclusively tasked with locating a fire and subsequently tracking its progression; they are not involved in any actions beyond that. The basic Concept of Operations (ConOps) [49] here is that the drones are deployed in response to a suspected fire event with the objective of facilitating situational awareness for fire crews.

1.5. Contribution of This Article

In this paper, we try to make the case for the deployment of autonomous swarms of UAVs as an integral part of defence measures against wildfires. To do so, we present evidence, gathered by means of numerical experimentation, that such swarms would be able to monitor and accurately map a wildfire event in real-time, providing better situational awareness to fire crews than is available today.
We argue that such a mission can be decomposed into three separate functions requiring variable levels of cooperation between units:
  • Detection: the first mission of autonomous devices in the vicinity of a fire event is to pinpoint its location in a possibly much larger area— this is a partially cooperative activity (division of labour to minimise cover times [50]).
  • Evasion: when in close proximity to the fire, an autonomous device must be able to keep itself out of harm’s way, usually by maintaining a safe distance (which may vary depending on environmental conditions and position relative to the blaze)— primarily an individual activity.
  • Encirclement: whether it’s to guide the fire crews or implement their own containment strategy, autonomous devices must be able to form a (dynamic) perimeter around the wildfire— necessarily a cooperative activity.
Encircling a dynamic event such as a wildfire without prior knowledge as to its exact location or boundaries is a challenging objective for an autonomous swarm: the distributed algorithm must be executable in such a way that the sum of all individual decisions is the desired collective configuration (self-organisation). Specifically, it requires the ability to: (1) judiciously share relevant information between certain peers to facilitate recruitment, (2) assign a position in the perimeter to every participant to “close the loop” without central control or hierarchy, and (3) determine when the manoeuvre is successful (i.e., the fire is fully contained inside the established perimeter).
The work presented here consists specifically and exclusively in a systematic study of the collective behaviour and performance of a drone swarm governed by a simple, readily implementable yet fully decentralised decision-making algorithm, in the context of fire monitoring.

2. Modelling

2.1. The Wildfire Model

It should be noted that the approach discussed in this paper does not require the drones to have an understanding of how a fire is likely to progress. Our work is specifically focused on the swarm’s ability to encircle the fire without using any information about it or the environment other than the heat from the fire, as perceived by the dones’ sensors.
As a result, the model presented in this section does not make any claims about adequately predicting where a fire will spread to and how fast. Instead, the presented model need only allow the simulation of a realistically behaving fire which the drones will then attempt to encircle by relying exclusively on the emergent behaviour of the swarm, arising from the drones’ movement bias towards a detected heat source, from their ability to retreat away from locations exhibiting dangerously high temperature and from maintaining a preferred separation distance to each other. See Section 3 for the swarm behaviour.

2.1.1. Motivating the Scope of the Model

“Fire spread is a dynamic process, which depends on environmental variables, such as wind speed, moisture content, fuel type and density, ground slope, etc. Developing an accurate fire spread model that can predict fire size and shape over time is an ongoing research challenge
[20]. (2021)
Developing a detailed and representative model for the spread of fire in some heterogeneous environment is an unsolved challenge [20], in part due to the complexity of the interconnected physico-chemical phenomena that play a role [51]. Both, the exact modelling of these phenomena, as well as the real-time collecting of precise environmental data required to do so, are trading off precision for cost and are therefore bound to be compromises: increased realism comes at growing cost. Due to this, any model for a fire will be bounded, the question is only what the acceptable bounds are.
In this paper the performance of a swarming approach is evaluated against a class of scenarios, defined by a fire model. To specify the claims (with regard to the approach) which we can, and cannot, make on the basis of the obtained results we first discuss (and motivate) the simplifications of our model over others used in the literature. Unsurprisingly, the intended application dictates the required precision for, and number of, the variables included in the model. For example, a common use for fire models is to provide reliable forecasting with regard to the spread of the fire. With this goal in mind [52], for example, uses a static database for the topology of the environment and, like [53] argues that a these details are as important as atmospheric specifications. However, our model is not required (or indeed, designed) to provide this level of detail or realism. To evaluate our swarming approach, we are exclusively concerned with providing a realistic development of a fire to encircle and not with predicting or forecasting the actual spread of a real fire. This means that we can hold our model to a lower standard because it only needs to provide a challenging stress test for our approach (as opposed to a reliable prediction of where the fire will really spread, and at which time).
This is important in order to justify the relatively small number of tuning parameters used in our model (flat topology, simple fuel depletion model, see Section 2.1.2; fire propagation, see Section 2.1.3 and heat modelling, see Section 2.1.4). As pointed out in [54], the accuracy of the spread predicted by a fire model depends on the reliability of the input parameters, i.e., how accurately the situation on the ground is described. In [55], the authors list more than 15 different variables describing the climate (such as e.g., relative humidity and wind speed), the topography (such as e.g., slope and elevation) and other features of the landscape (such as e.g., the existence of roads, lakes or settlements), and the type of fuel (e.g., vegetation type and surface water content). In [56] the authors consider 4 different classes of fuel and assign (potentially different) properties to the members of each.
A realistic wildfire behaviour model, good enough to adequately and reliably predict the spread of a real wild fire is out of the scope of this article; the interested reader is referred to e.g., [57] for recent publications discussing different models. We are focusing specifically and exclusively on devising distributed algorithms that would allow a swarm of UAVs to monitor such an event as safely and efficiently as possible given various constraints (the speed of the drones relative to the fire propagation rate, the number of units, the direction of the wind etc.). Nevertheless, we needed a “good enough” model to simulate a credible wildfire. To that end, we created a simple cellular automaton [58,59,60,61] based on the same principles as those underpinning the widely used “Prometheus” model [46]. In the interest of transparency, the world representation and transition rules governing this automaton are described below.

2.1.2. Environment Topology, Fuel and the Depletion of Fuel Due to Fire

In the literature, fire models are often based on cellular automata [58,59,60,61] and our model follows this direction: we start from a hexagonal grid in which every cell has 6 equidistant neighbours (as opposed other setups, such as 4 in the so-called von Neumann neighbourhood or 8 in the Moore neighbourhood [58]) representing the forest. Each cell is characterised by several variables: its position in the mesh (x and y coordinates), the amount of fuel it contains before the start of the fire event ( fuel 0 , a real number between 0 and 1), the current amount of fuel (which progressively decreases when the cell is on fire) and its state, which can be “intact”, “burning” or “burnt”. This 3-state-model differs from e.g., [58] where 4 states are used, but it can be argued that the states “not burnable” and “burned” [sic] in [58] are simply merged into a single state in our model, namely “burnt”. To capture the topology, each cell also maintains a list of pointers to its 6 neighbours, which is used to simulate propagation.
When a cell is on fire, the amount of fuel it contains is multiplied by a constant k < 1 on every time-step:
fuel t + 1 = k t × fuel t fuel t = k t × fuel 0
The default value of k = 0.995 . On every time step, a burning cell has a chance to transition to the “burnt” state, meaning that the fire is extinguished and will no longer be able to propagate from this location. We used the Hill function to compute the probability P of such a transition:
P = 1 1 + fuel lowFuel α
The probability that a fire is still burning in a cell t time-steps after its ignition is:
P t * = i = 1 t 1 1 1 + k i × fuel 0 lowFuel α
By default, lowFuel = 0.001 and α = 2 .
With these parameter values, a cell starting with maximum fuel ( fuel 0 = 1 ) has a 50% chance to have burned itself out after t = 882 time-steps, at which point 0.012 amount of fuel will remain (i.e., just above 1% of the original flammable material). To reach a 99% chance takes t = 1072 time-steps, at which point only 0.0046, or less than half a percent of the initial amount of fuel will remain. This is illustrated in Figure 1.

2.1.3. Fire Propagation through the Environment

Fire propagation is the result of a burning cell igniting one of its intact neighbours [62]. On every time-step, every cell on fire with at least one intact neighbour is included in a list which we refer to as the “front”. For every element of this list, the same procedure is executed independently. A random real number x is drawn in the interval [ 0 , 1 ] . If x is higher or equal to a threshold p 0 (comprised between 0 and 1 and identical for all cells throughout the simulation), nothing happens, and the next burning cell on the propagation front is tested. If x < p 0 , a wildfire spreading event has occurred (e.g., an ember has landed in one of the burning cell’s neighbours). Parameter p 0 can be regarded as the base propagation rate of the fire and its value chosen to make it faster or slower by default.
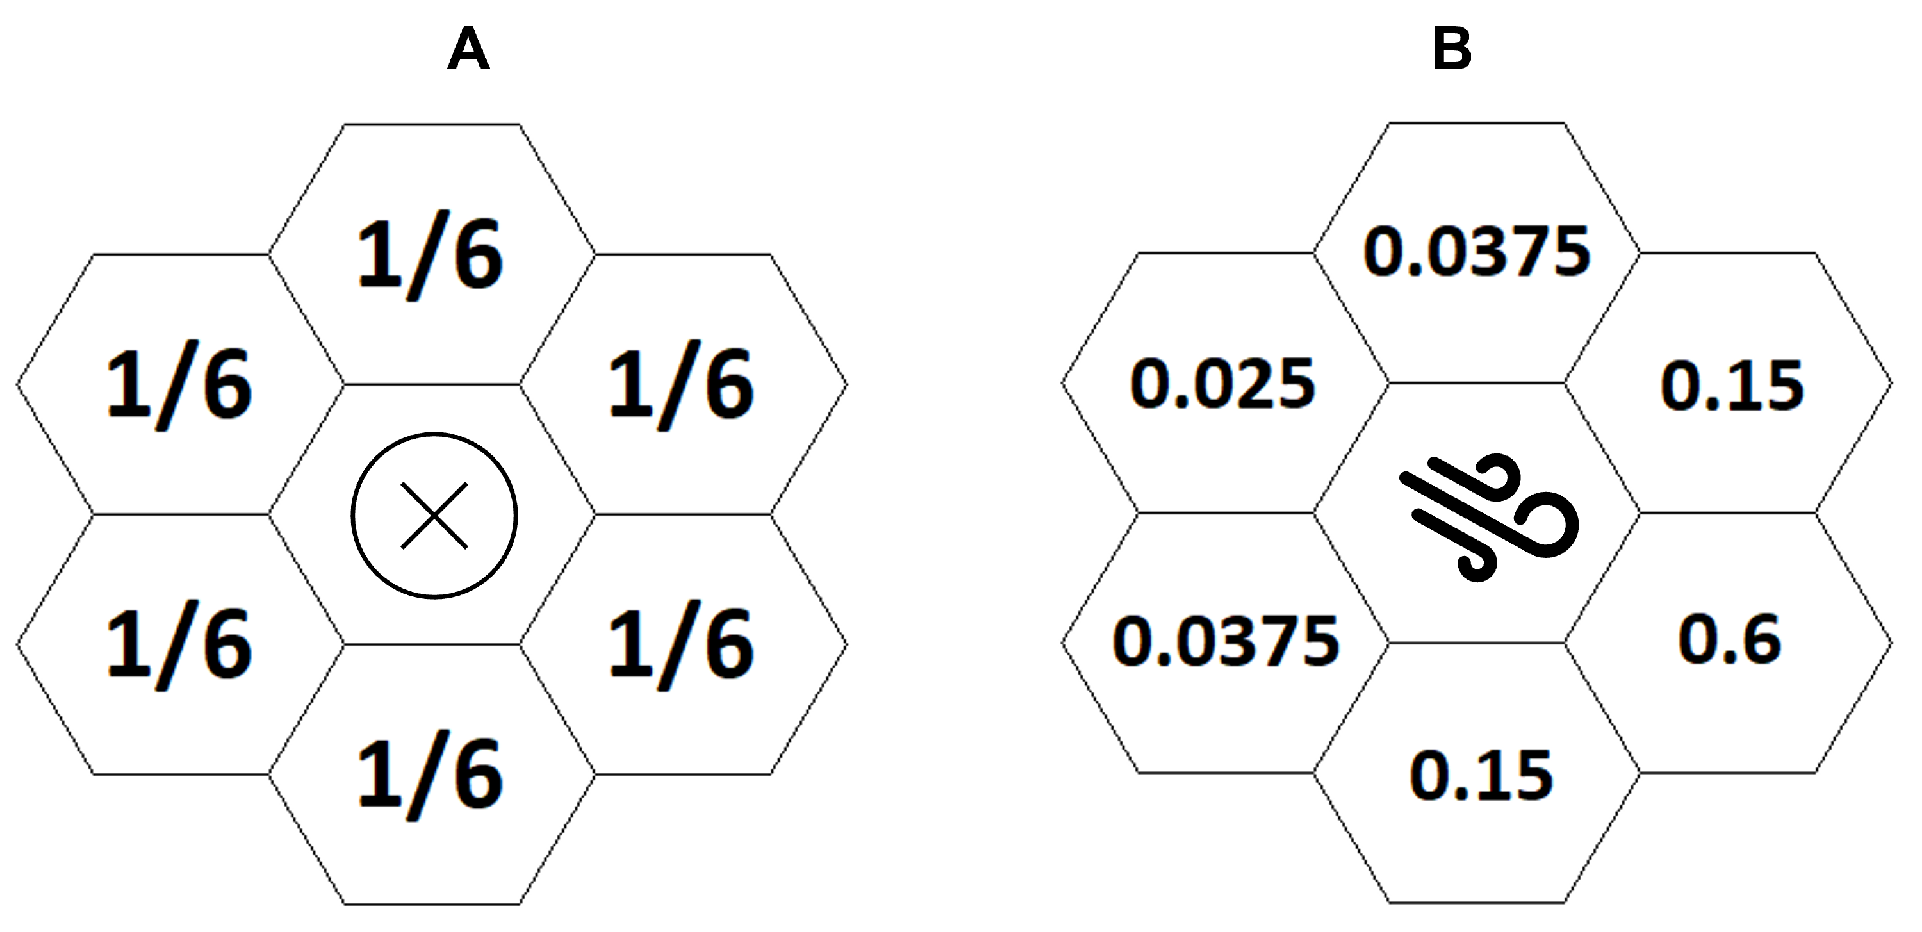
When a propagation event is detected, the direction of the fire advance must be determined. In the literature, wind speed [62] and topography [52] are considered crucial factors in determining direction and speed, respectively, of a fire. In our model this is done by performing another random test against a set of weighted values corresponding to the 6 possible directions (hexagonal mesh). If all directions are equiprobable ( w 1 = w 2 = = w 6 = 1 / 6 ), it indicates that nothing is pushing the fire into one direction (e.g., there is no wind) and it will statistically be spreading radially and homogeneously from the point of ignition. Changing the weights can be used to bias progression (e.g., downwind and/or uphill). This is illustrated in Figure 2.
When the target of the propagation event has been selected, a third and final random test is performed to determine if it has indeed been ignited. This is done by drawing another random real number x in the interval [ 0 , 1 ] : if x < fuel present in the target cell, then a new fire has been lit and the cell will be added to the front on the following time-step.
This last test can be used to model the effect of obstacles to fire propagation (e.g., by setting the value of fuel to zero for cells corresponding to bodies of water, lowering it for clearings or treated vegetation etc.). N.B. these rules only allow for propagation between adjacent cells. A version of the simulation engine in which the fire can jump ahead has been tested but has not been used to produce the results presented here, as it was deemed unnecessary to the investigation of collective behaviour in a swarm of UAVs.

2.1.4. Heat Propagation through the Environment

In our model, every burning cell (see Section 2.1) radiates thermal energy at a rate proportional to the stage of the fire: maximum when it has just been lit up (fuel = fuel 0 ), then progressively cooling down as flammable material is being consumed. This is obviously a simplification, but it is exclusively used to determine what the drone perceives and it does not at all affect the spread of the fire itself. The total amount of thermal energy reaching a drone’s location determines the ambient temperature T experienced by this drone:
T = i = 1 N fuel i × 1 + w dir ( i ) fuel 0 , i × r i 2
Parameter w dir ( i ) simulates heat transfer asymmetry exactly as in the wildfire propagation model. For instance, in the asymmetrical example from Figure 2B, if the burning cell is situated northwest of the UAV then w dir ( i ) = 0.6 , if it is to the southeast then w dir ( i ) = 0.025 . This mechanism is designed to qualitatively account for the fact that the heat transfer is not happening in a vacuum through radiation but is submitted to the influence of air currents. Variable r i is the distance between heat source i and the drone, N is the total number of burning cells.

2.2. The Drone Model

2.2.1. Motivating the Scope of the Model

As already stated above, we use a number of simplifications in our simulations. Drones are assumed to be able to measure the ambient temperatures at their location which is approximated using Equation (4) from the heat propagation model.

2.2.2. The Impact of Heat Sources in the Environment on the Drone

We are aware that Equation (4) does not accurately model how a wildfire affects ambient air temperature beyond its immediate surroundings and that random fluctuations linked to other phenomena such as convection may make it a difficult variable to measure or use in practice. Nevertheless, it does incorporate most key elements (fire intensity, range, and wind direction) and is compatible with available literature [63]. As such, it should provide a sufficient basis to be improved upon, or a proxy for some other physical quantity that may be a better real-time indicator for the distance and severity of a nearby fire event.
In addition to knowing their ambient temperature (remember that T is calculated by the simulation using complete knowledge of the world), drones can also remotely measure the intensity of a fire in a burning location. However, for this they are restricted to their subjective perception, realized by their own on-board remote sensing equipment.

2.2.3. The Drone Perception Model

The UAVs in our simulations are assumed to be carrying a sensor device such as an infra-red [22] or a thermal camera, allowing them to detect the heat signature of a distant fire. This is, however, restricted by the orientation of the camera which in our simulation is assumed to be capable of rotating. By default, the field of vision covers a 120° angle.
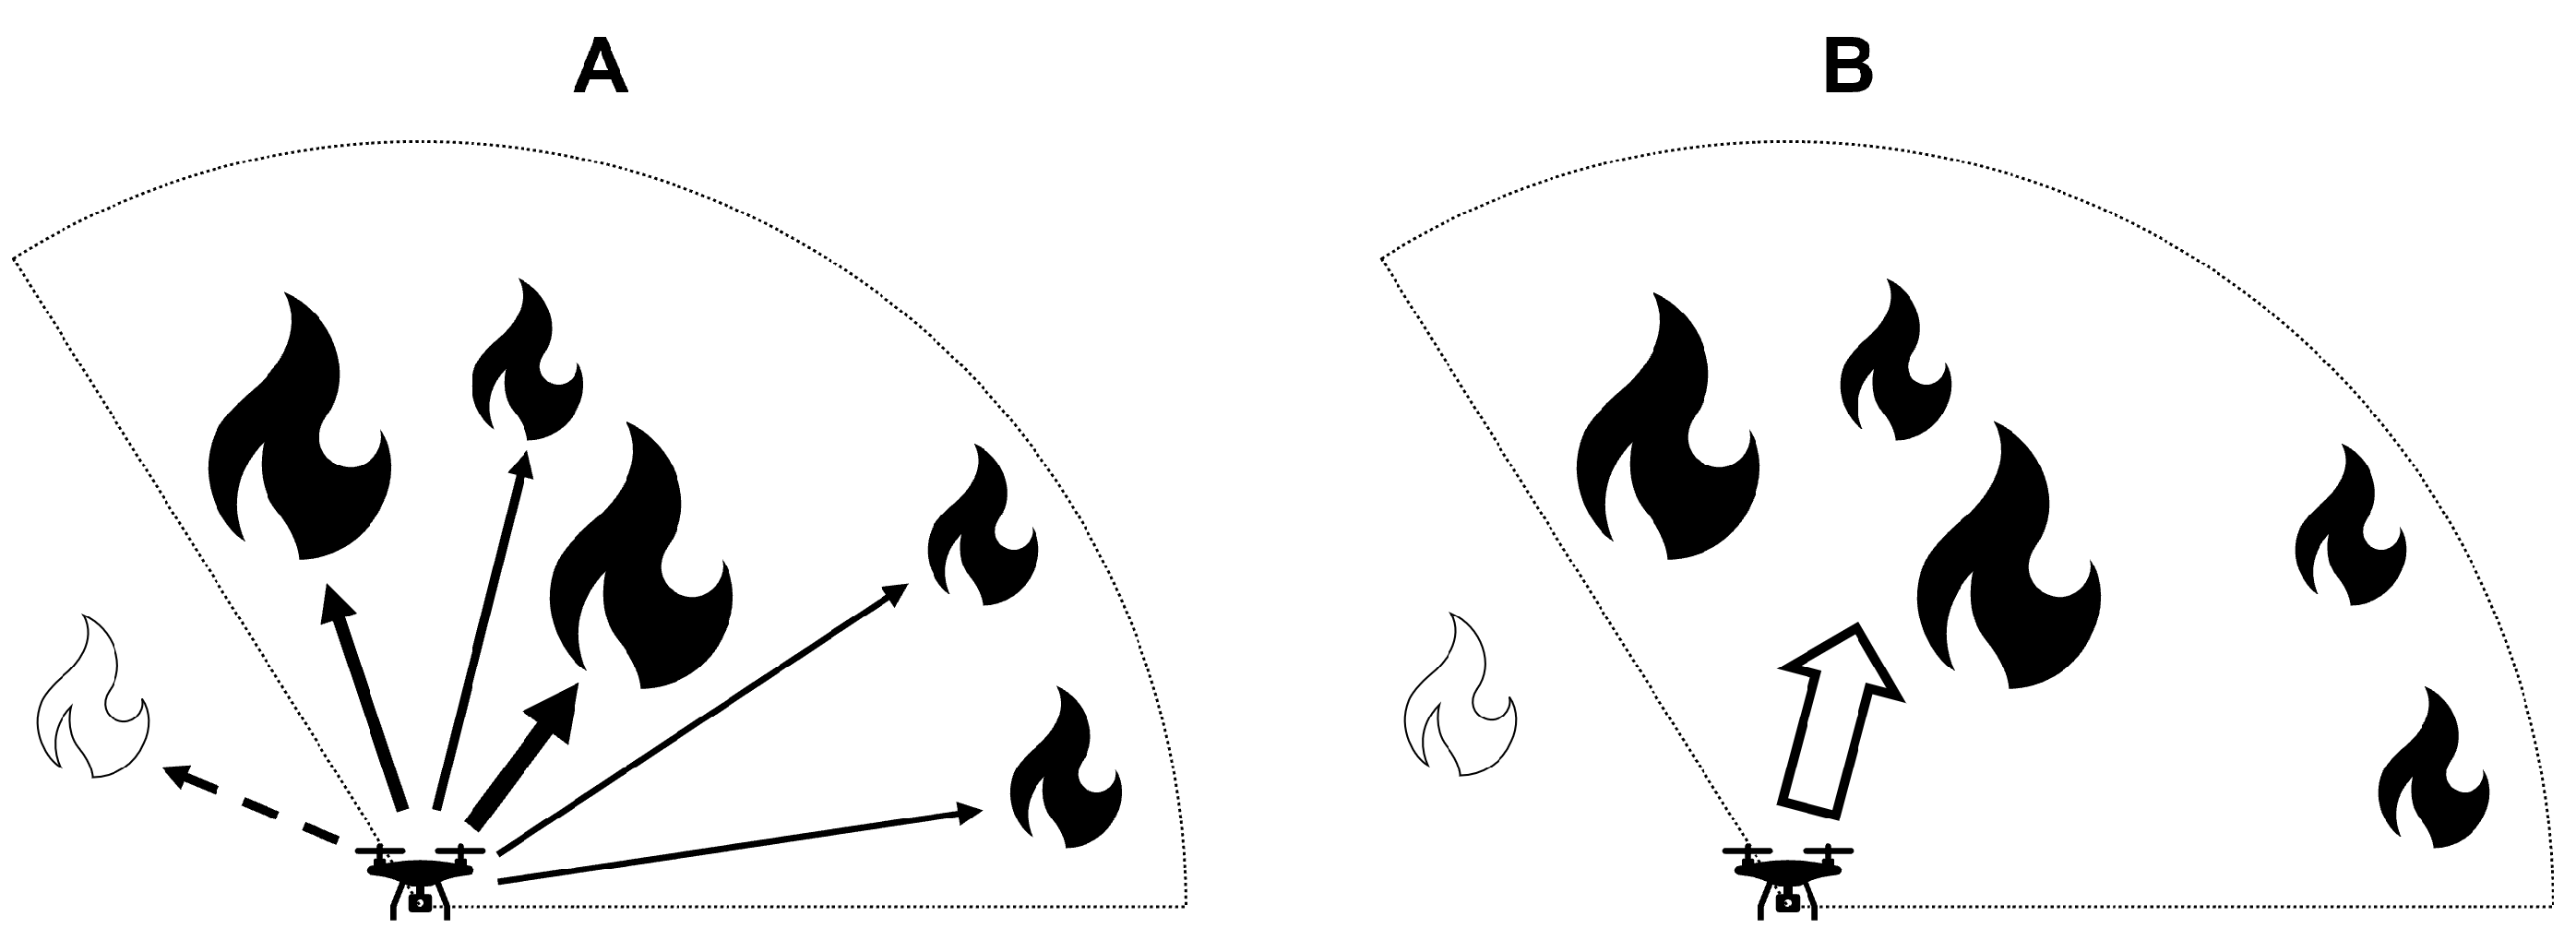
Just because the camera of a drone that is searching points into the direction of a burning location does not automatically mean that it detects the fire. This determination is based on the aggregate heat that is sensed: when one or more burning cells are located inside the drone’s cone of vision, their vectorised heat signatures (unaffected by air currents) are added to a resultant vector. Only if this vector exceeds some threshold does the drone detect a fire and only then does it change into tracking mode (see Section 3.1 for different drone behaviours).
The calculated vector points into the average direction of burning locations in the field of vision, weighted by distance and intensity, as illustrated in Figure 3. As long as a drone is in the searching mode (as long as it has not detected a fire itself) the drone’s camera rotates at a fixed speed ( 20 ° / s by default) independently of the direction of travel.

2.2.4. The Drone Communication Model

Drones are assumed to continuously broadcast their location (e.g., GPS coordinates) and to keep track of their two nearest neighbours, so that this information is always readily available to every member of the swarm. Obviously, UAVs can only communicate with each other as long as they are within each other’s communication reach [20]. However, in our simulation, communication range was assumed to be higher than the maximum distance between two units, meaning that a drone’s reachable peers always include every other member of the swarm. Section 3.3 describes how this ability to communicate with each other (combined with the fact that a drone knows which peers are closest to it) enables members of the swarm to recruit others and to thereby (potentially) encircle the fire.

3. Controlling the Swarm

In all the numerical experiments, each UAV (or drone) is autonomous in the sense that it makes individual path-planning decisions based solely on locally available information (whether it comes from onboard sensors or from data communicated by its peers). Furthermore, all units in the swarm are identical: none has a particular role or status, none is being remotely controlled by a human operator (although this option could be considered in a real-world deployment to influence collective behaviour as discussed in [64]).
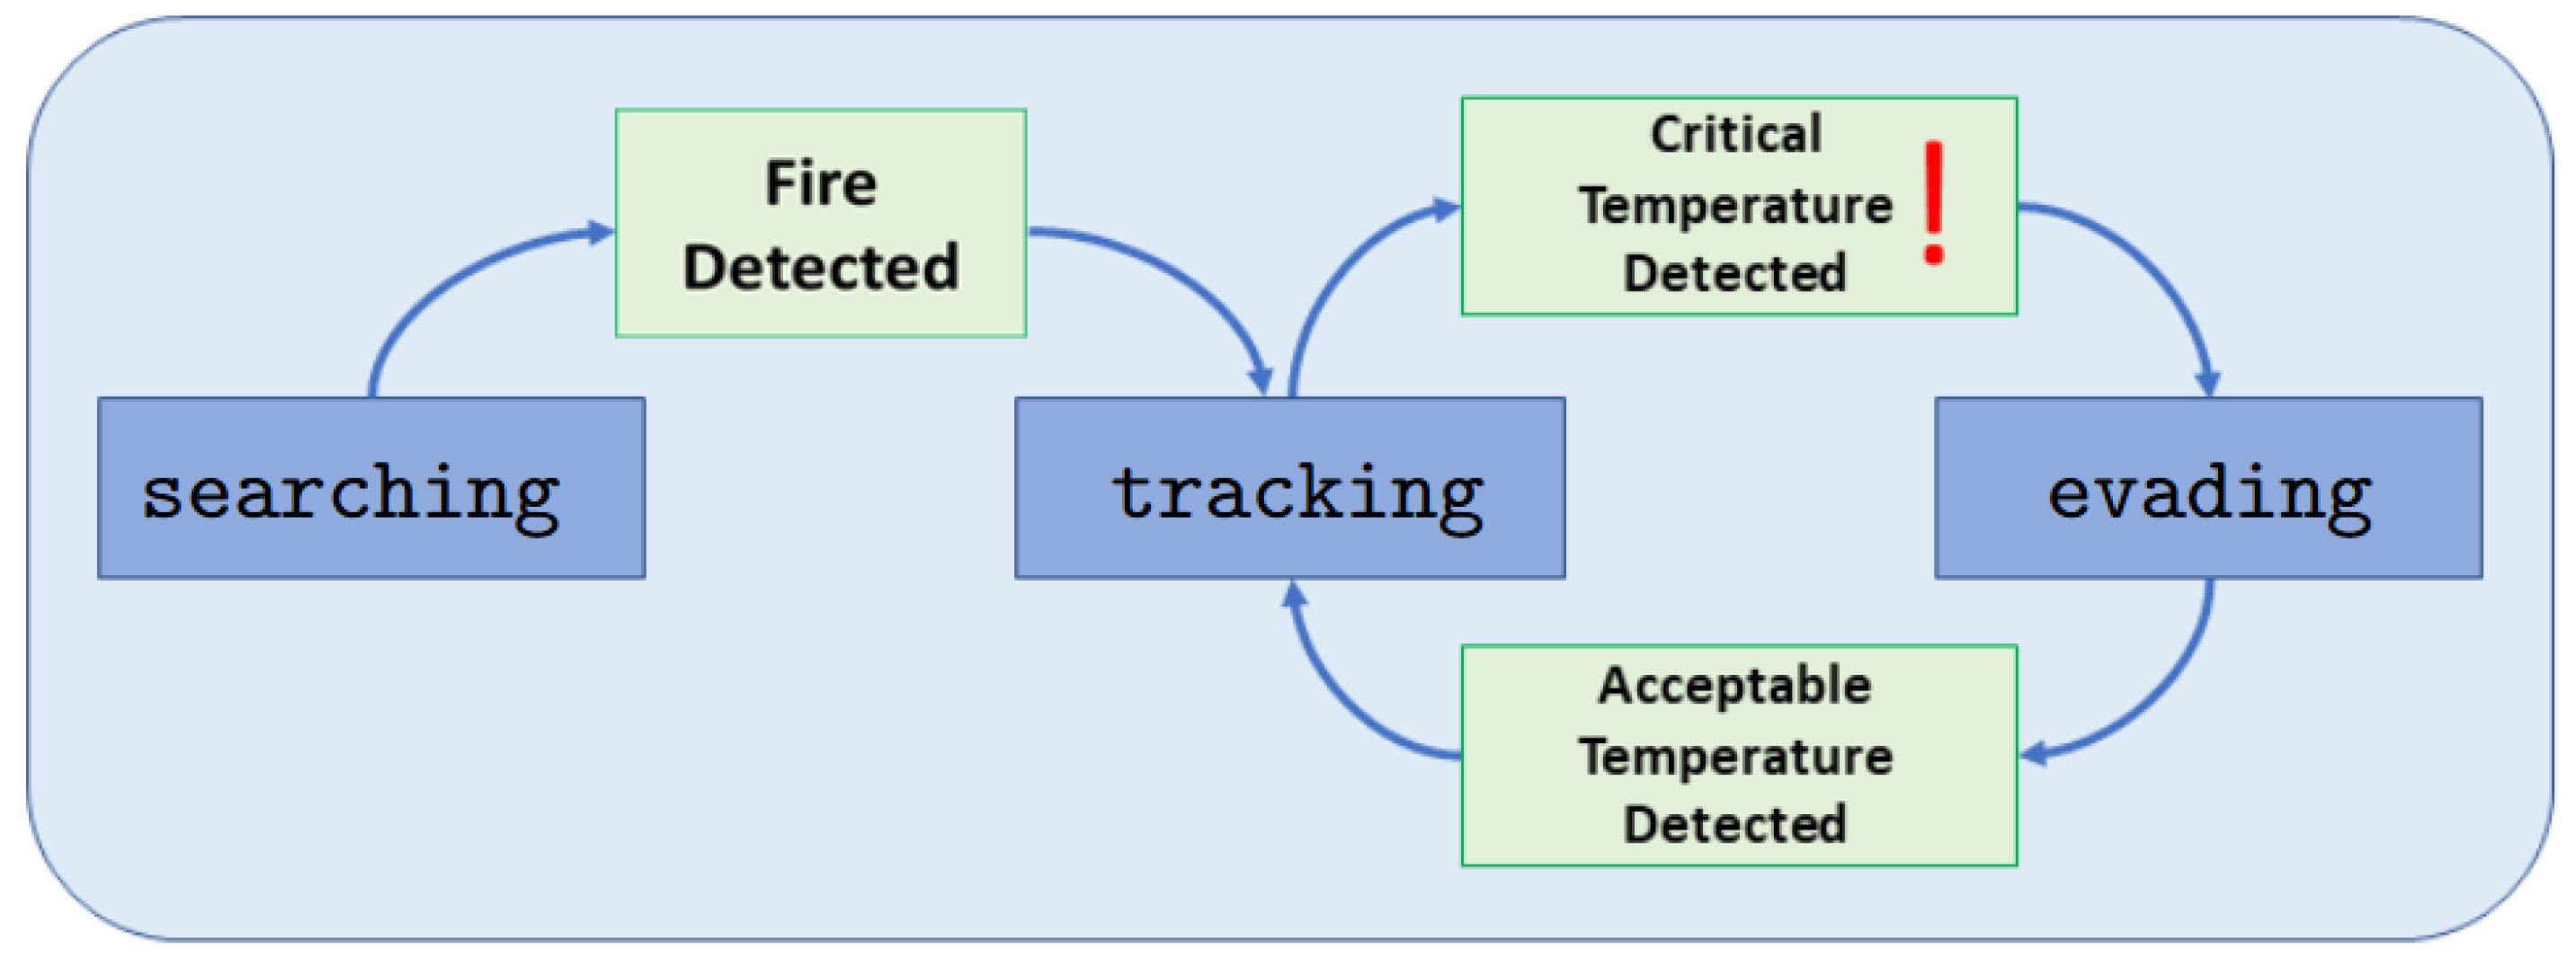
In the collective intelligence framework that was developed, a UAV can be in one of three states: searching (when not aware of any fire event), tracking (when directly monitoring an event or responding to another drone’s recruitment call) or evading (when finding itself in an unsafe environment). Each of these states and the circumstances in which a unit may transition between them are detailed below, see also Figure 4.

3.1. Different Behaviours of a Drone

3.1.1. Behaviour 1: Searching

As the name suggests, this is the default state in which a UAV operates while surveying the designated area: a rectangular region over which a hexagonal grid is superimposed. While in this mode, the drone simply moves in a straight line at the target speed towards its next waypoint. Upon reaching it, a new waypoint is randomly selected among the edge cells of the area of interest. This results in a movement pattern in which the UAVs appear to be “bouncing off the walls” of the designated rectangle at a random angle. While in this state, the only other input to the unit’s path-planning is the symmetrical repulsive force that drones exert on each other (see tracking, Section 3.1.2). This is meant to keep a safe separation distance between them and to improve collective coverage by preventing multiple UAVs from simultaneously monitoring the same area. As previously indicated, while searching, a drone’s thermal camera is rotating at a constant angular speed of 20 /s.

3.1.2. Behaviour 2: Tracking

If the UAV has itself detected at least one heat source but neither of its two nearest neighbours has, it centres its thermal camera on the resultant vector and accelerates into the corresponding direction. If the drone has been recruited but has not yet directly detected any fire, its thermal camera keeps rotating but it accelerates toward the nearest or second nearest neighbour that has started the recruitment. When both the unit and its nearest neighbour(s) have detected a heat source, or when the distance between them is lower than the target separation (by default, 200 m), the drone accelerates into a direction that combines the resultant vector of the fire tracking procedure (see Figure 3B) with the push-pull function linking every UAV to its two nearest peers. Both vectors are normalised and assigned an identical weight in the calculation of the resulting acceleration.
The intensity of the push-pull force between two UAVs is inversely proportional to the square of the distance between them. When they are further apart than the target separation distance, the force is either null (if both drones are in searching mode) or attractive, pulling them closer to each other (if both are in tracking mode). When closer to each other than the target distance, the force is always present and repulsive.

3.1.3. Behaviour 3: Evading

A drone enters this state (usually transitioning from tracking mode) when the ambient temperature exceeds a predetermined threshold, which is assumed to reflect an upper limit to safe operating conditions. When in this state, a UAV acts in self-preservation, ignores all other factors, and accelerates directly away from the most intense heat source within its cone of vision (NB: this may not be in the directly opposite direction to the resultant vector, which sums up all detected fires). When the temperature drops below the threshold (as a result of the drone moving away from the fire), it transitions back to the tracking state. If the ambient temperature exceeds a critical value (by default twice the threshold), the unit is assumed to be lost. This relatively rare event may occur when a UAV finds itself surrounded by flames and reverses into a fire while attempting to pull away from another. In a real-world deployment, it is advisable to modify the evasion procedure accordingly, e.g., by forcing the unit to gain altitude before backing away. It can also be observed in the early stages, when a drone has come very close to a starting fire that does not yet generate much heat and suddenly finds itself engulfed in the fast-expanding blaze.

3.2. Triggers to Transition between Behaviours

As shown in Figure 4, there are a few triggers that start a behaviour change. Firstly, the transition between searching and tracking can be triggered by two events:
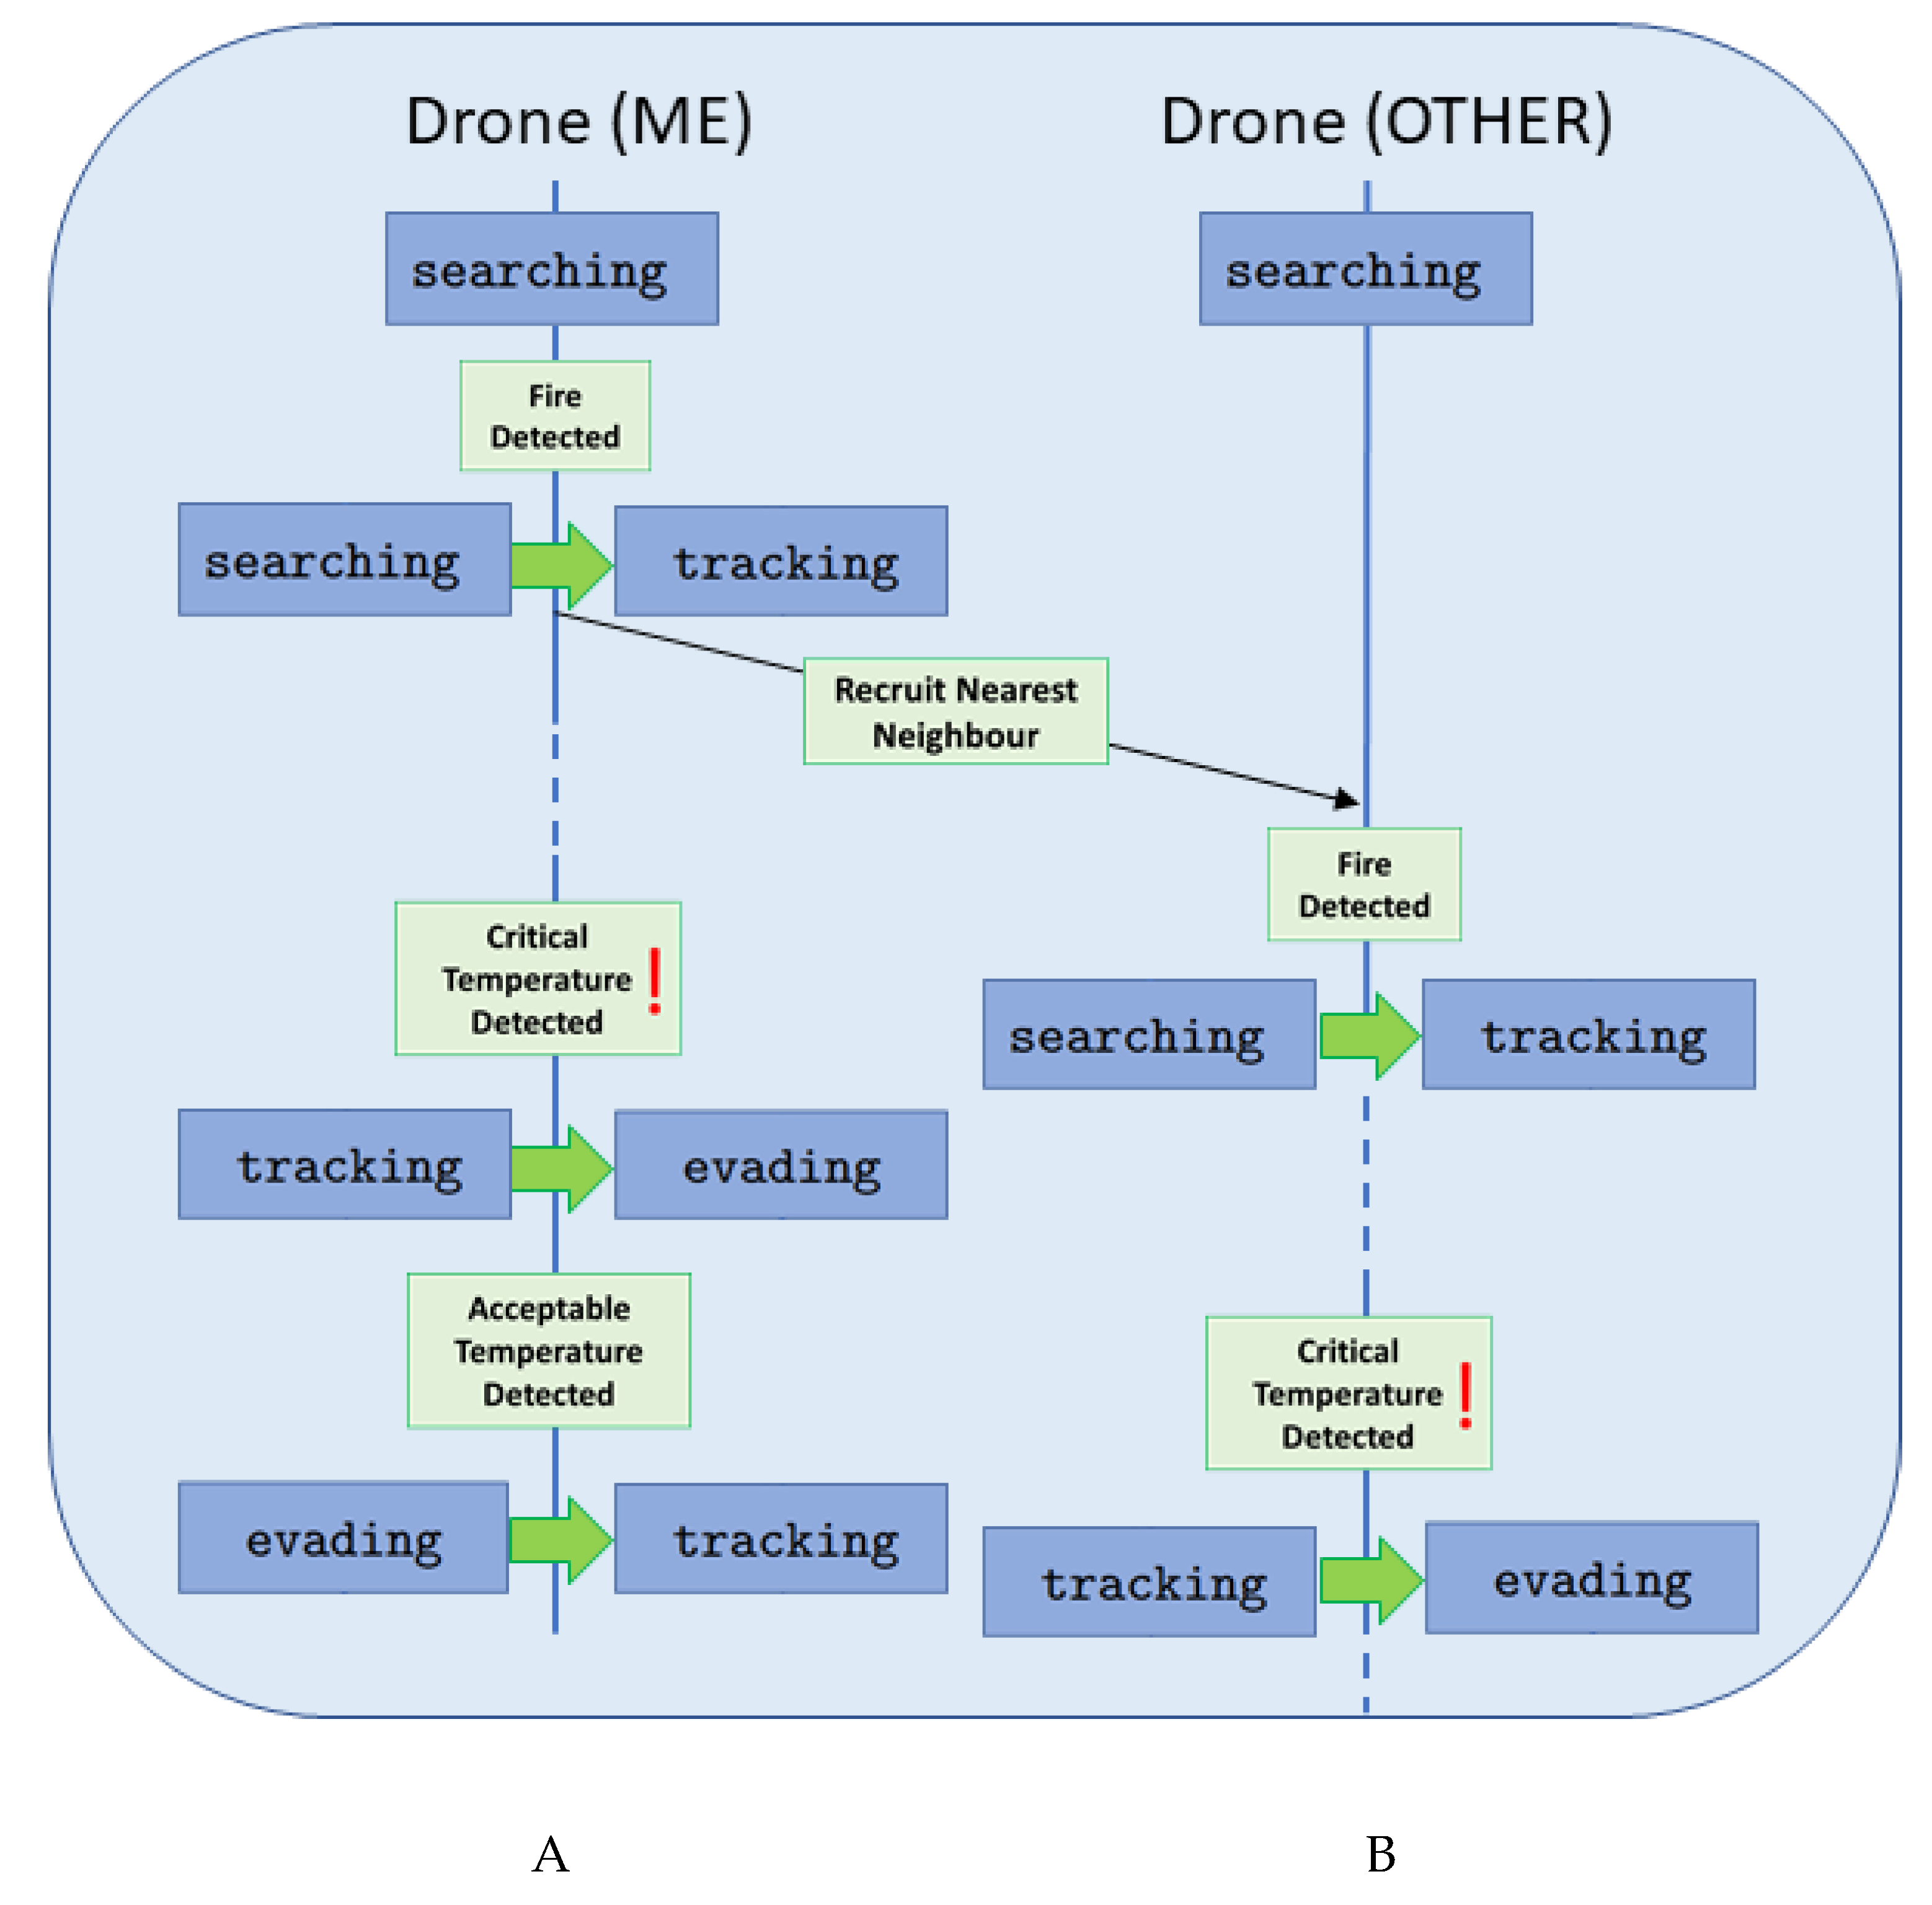
  • the UAV has detected a heat source. This occurs when the magnitude of the resultant vector (see Section 2.2.3) exceeds a predefined threshold; cf. Figure 5.
  • One of the two nearest neighbours of the UAV has detected a heat source, which starts the recruitment process. NB: a recruited drone that has not itself detected a heat source does not initiate recruitment. This is designed to prevent the whole swarm being recruited by cascade when the first unit detects the first fire; cf. Figure 5.
Once in tracking mode, only the presence of extreme heat conditions can trigger a drone to switch from the tracking mode to the evading behaviour; cf. Figure 5.

3.3. Encircling the Fire

The ability of a swarm to locate, and subsequently encircle a target is a current research topic (see e.g., [65]). Wildfire monitoring is a special case in which such an ability could also be of high importance. Special attention was paid to ensuring that an encirclement can be brought about by the swarm autonomously (and in a fully distributed manner) as well as that the individual drones are aware of an encirclement having been completed.
As mentioned in Section 2.2.4, drones are assumed to possess some communication infrastructure allowing them to communicate with each other. While a drone is searching these messages may be kept to a minimum, but once a drone locates a fire its communication footprint changes: at regular short intervals (1 s by default), every unit in tracking mode sends a token (point-to-point message) to its nearest neighbour.
Upon receiving such a token from one of its two nearest neighbours, a drone that is also in tracking mode immediately forwards it to its other nearest neighbour (i.e., if the token was received from the nearest, it is forwarded to the second nearest and vice versa) unless it has already been visited (on every hop, the unique ID of the last relay is appended to a list, contained in the token, that is initialised with the ID of the original sender). When this happens (i.e., the target neighbour is already in the list), one of two cases is possible:
  • The target neighbour is not the original sender: no forwarding occurs, and the token is simply dropped
  • The target neighbour is the original sender, in which case there is the possibility that a continuous and symmetrical loop (cordon) has been formed and the token is forwarded to its initiator.
Upon receiving its own token back (case 2), the original sender must perform a final check to determine if the last drone to receive the token is its second nearest neighbour. If this is the case, the establishment of an unambiguous perimeter is confirmed; cf. Figure 6.
When a symmetrical loop has been detected, a test is performed to determine whether it encircles the wildfire, forming a cordon (this is the case if every burning cell falls inside the polygon formed by the members of the loop, as in the example shown on Figure 6). If this is the case, the simulation run is halted, and the time and area of the fire are recorded.

4. Numerical Experiment Setup and Data Collection

Numerical experiments were conducted in a rectangular arena over which a hexagonal grid was superimposed. Every discrete cell in this grid is assumed to be a patch of forest 10 m across.

4.1. Simulation Setup

4.1.1. The Environment

By default, each cell is initialised with a randomised fuel 0 value comprised between 0.25 and 0.75 (flat distribution). The arena is 200 × 120 cells, corresponding to 1732 m × 1200 m after correcting for tessellation effects ( 200 × 10 m × cos ( π / 6 ) = 1732 m), or slightly above 2 km 2 ) (≈ 208 ha). Elevation was not modelled (flat terrain).

4.1.2. The Fire Source

In the homogeneous, radial propagation scenario (no wind), the central cell ( x = 100 , y = 60 in the default arena) was ignited at t = 0 . In the biased propagation scenario (north-westerly wind, see Figure 2), the fire was started in cell x = 40 , y = 30 .

4.1.3. The Fire Propagation

The time discretisation step was set to 250 milliseconds and the value of parameter p 0 was set to 0.05 , corresponding to an average base wildfire propagation speed of 2 m/s (1 discrete jump of 10 m every 20 time-steps, equivalent to 5 s). NB: because the average fuel density is 0.5 , the real speed is closer to 1 m/s (see Section 2 for details). However, cooperative stochastic effects (e.g., an intact cell that has two burning neighbours has two chances of being set on fire on every time step) may also cause the effective fire propagation rate to deviate from the base value.
As expected, results were found to be very stable and fire progression highly predictable in the homogeneous environment that was simulated (no obstacles to propagation, statistically even distribution of fuel, constant wind, flat terrain). Although accurate modelling of wildfire spreading dynamics is outside the scope of this paper, some statistics are provided in Table 1 and Table 2 for reference purposes.
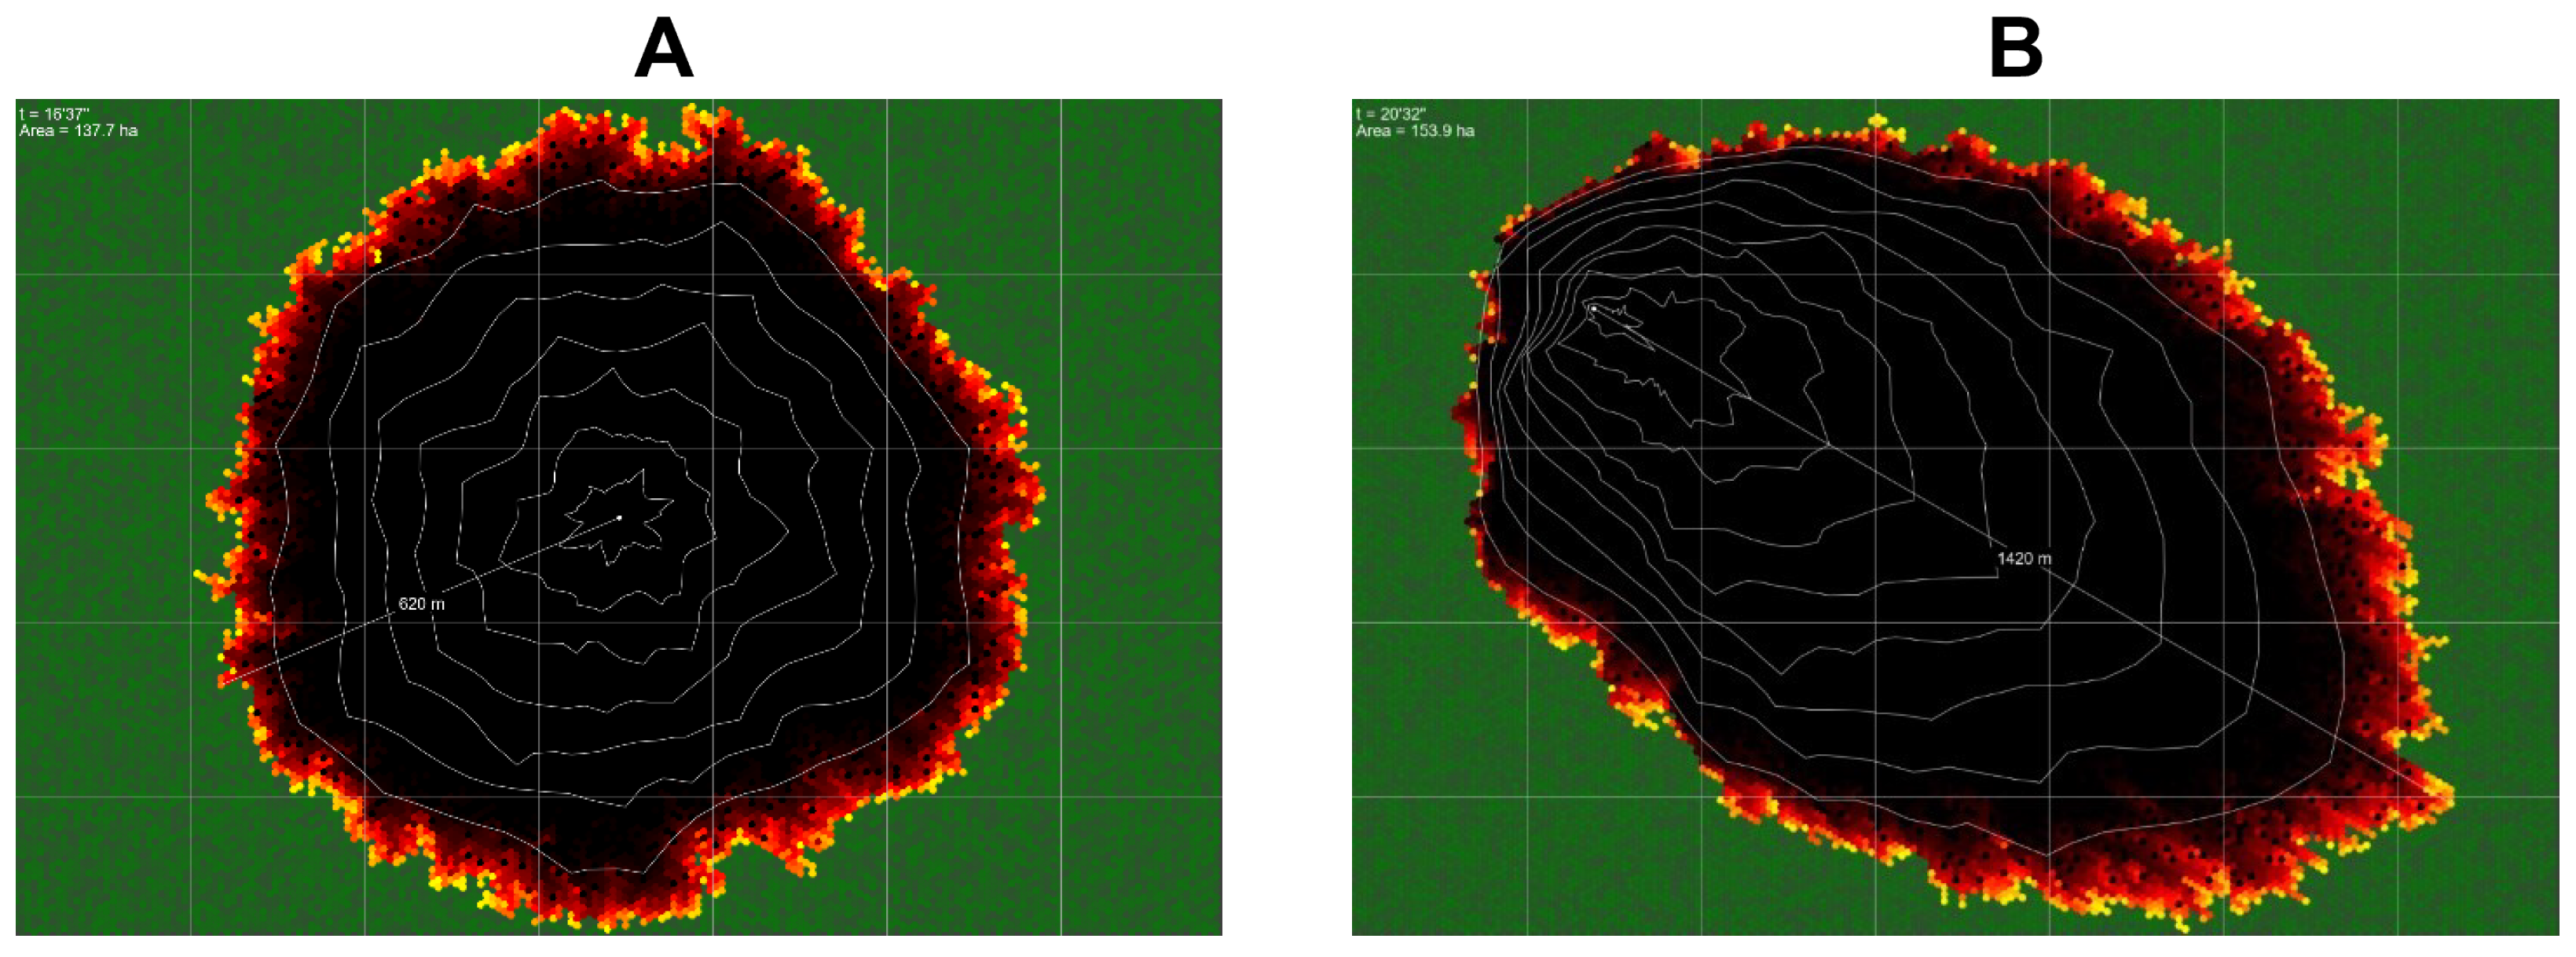
It is worth observing that, in contrast with the total area burned, which is only marginally larger in the biased propagation scenario, the absence of wind in the symmetrical case almost halves the fire’s progression speed. This empirically realistic behaviour has a major impact on swarm performance. An example is provided in Figure 7 (screenshot).

4.1.4. The Movement of the Drones

By default, the target speed of a drone was set to 10 m/s or 36 km/h. Acceleration rate was set to a conservative 5 m/s 2 . Once the target velocity is reached, the drone is assumed to retain a tilting angle and rotor speed that would allow it to continue to travel at 10 m/s in the intended direction and at constant altitude. NB: the drones are assumed to be smart enough to achieve a target ground speed of 10 m/s, independently of their direction of movement. This implies that, in the biased propagation scenario, drones flying against the wind would maintain a higher air speed.
The detection range was set so that a single fire burning at maximum intensity is detectable from 100 m (threshold = 0.0001 = 1/100 2 m). Statistically, chances are that the fire has been spreading for some time before the first UAV comes close enough to detect it, and it is the cumulative heat signature of a larger burning area (visible from a distance) that triggers the transition searchingtracking, see Section 3.2.

4.1.5. The Termination Criteria

In all experiments, the simulation for the fire (and thus the data collection) was ended when the fire front reached one of the edges of the arena. Figure 7 shows two screenshots from the simulation where this has happened, one where there was no wind (Figure 7A) and one where the wind visibly impacted the growth of the fire (Figure 7B).
A second termination condition, triggered when the fire is encircled by an uninterrupted cordon of UAVs (reminder: the default target separation distance between drones is 200 m) was used. The motivation is that this is considered to be the best achievable outcome.
Once encirclement is achieved, the UAVs cannot add to, or improve upon, this situation anymore. From the application point of view, this at least guarantees that the blaze is being tracked from all possible angles. At that point the propagation front can be mapped in its entirety. In a more advanced scenario in which the UAVs are equipped with firefighting capabilities, it also creates the right conditions for a containment perimeter to be established (e.g., by using dedicated airborne units to spray a fire retardant along the edges of the polygon of which all drones participating in the cordon are the summits or by creating fire breaches using heavy digging equipment brought in on the ground.).

4.2. Data Collection

4.2.1. Performance Metric

Performance is always measured as the success rate (of encirclement). This means that, ultimately, we record the percentage of simulations in which the swarm successfully encircled the fire; with each individual simulation therefore being either a success or a failure. Parameters that were explored include: the number of UAVs in the swarm, the size of the arena and the (boolean) fire propagation dynamics (symmetrical vs. biased).

4.2.2. Recorded Data

With regard to the damage (growth, spread and evolution of the fire) two values are recorded to assess the damage caused by the fire: at the end of the simulation, the total surface Area burned [66], and the furthest Reach of the wildfire (relative to the point of ignition) are being recorded and time stamped. Area can, for example, be used to correlate swarm size with performance (i.e., the swarm’s ability to locate and cordon off the fire).
Two additional values are recorded: Time and Speed. The former records the time when the fire reached the edge of the environment (at which time the simulation stops). This value can be used as a benchmark and to evaluate the impact of wind on the fire model; it is mainly useful in the absence of drones. Speed, which is defined as Reach/Time.
In addition, we recorded the percentage of all simulations where the swarm successfully encircled the fire. Recall that there are two termination criteria, corresponding directly to a success (if the fire is encircled in time) or failure (otherwise). Once a fire is detected we timestamp the event; this data is then used e.g., in the results discussed in Figure 10.

5. Results of Numerical Experiments

5.1. The Impact of Wind on the Wildfire Model

All other parameters equal, results emphasise the critical roles played by wildfire propagation speed (higher in the biased scenario, compare Table 1 and Table 2) and swarm size in determining the chances that a fire can be cordoned successfully. Although this finding merely confirms intuition on a qualitative level, rigorous quantification of the effect for both parameters is essential to identify thresholds values and inform deployment strategy.
In other words, the evaluation of the outcomes of our wildfire simulation (for averaged results cf. Table 1 for simulations without wind, and Table 2 for those with wind) indicates that wind significantly impacts the spread of the fire (but interestingly does so only with regard to the spread, and not for the overall burnt area). Under the assumption that a certain number of drones are needed to handle any given scenario we conjecture that the number of needed drones will be higher in scenarios with wind (but otherwise identical).

5.2. The Impact of Swarm Size on Success

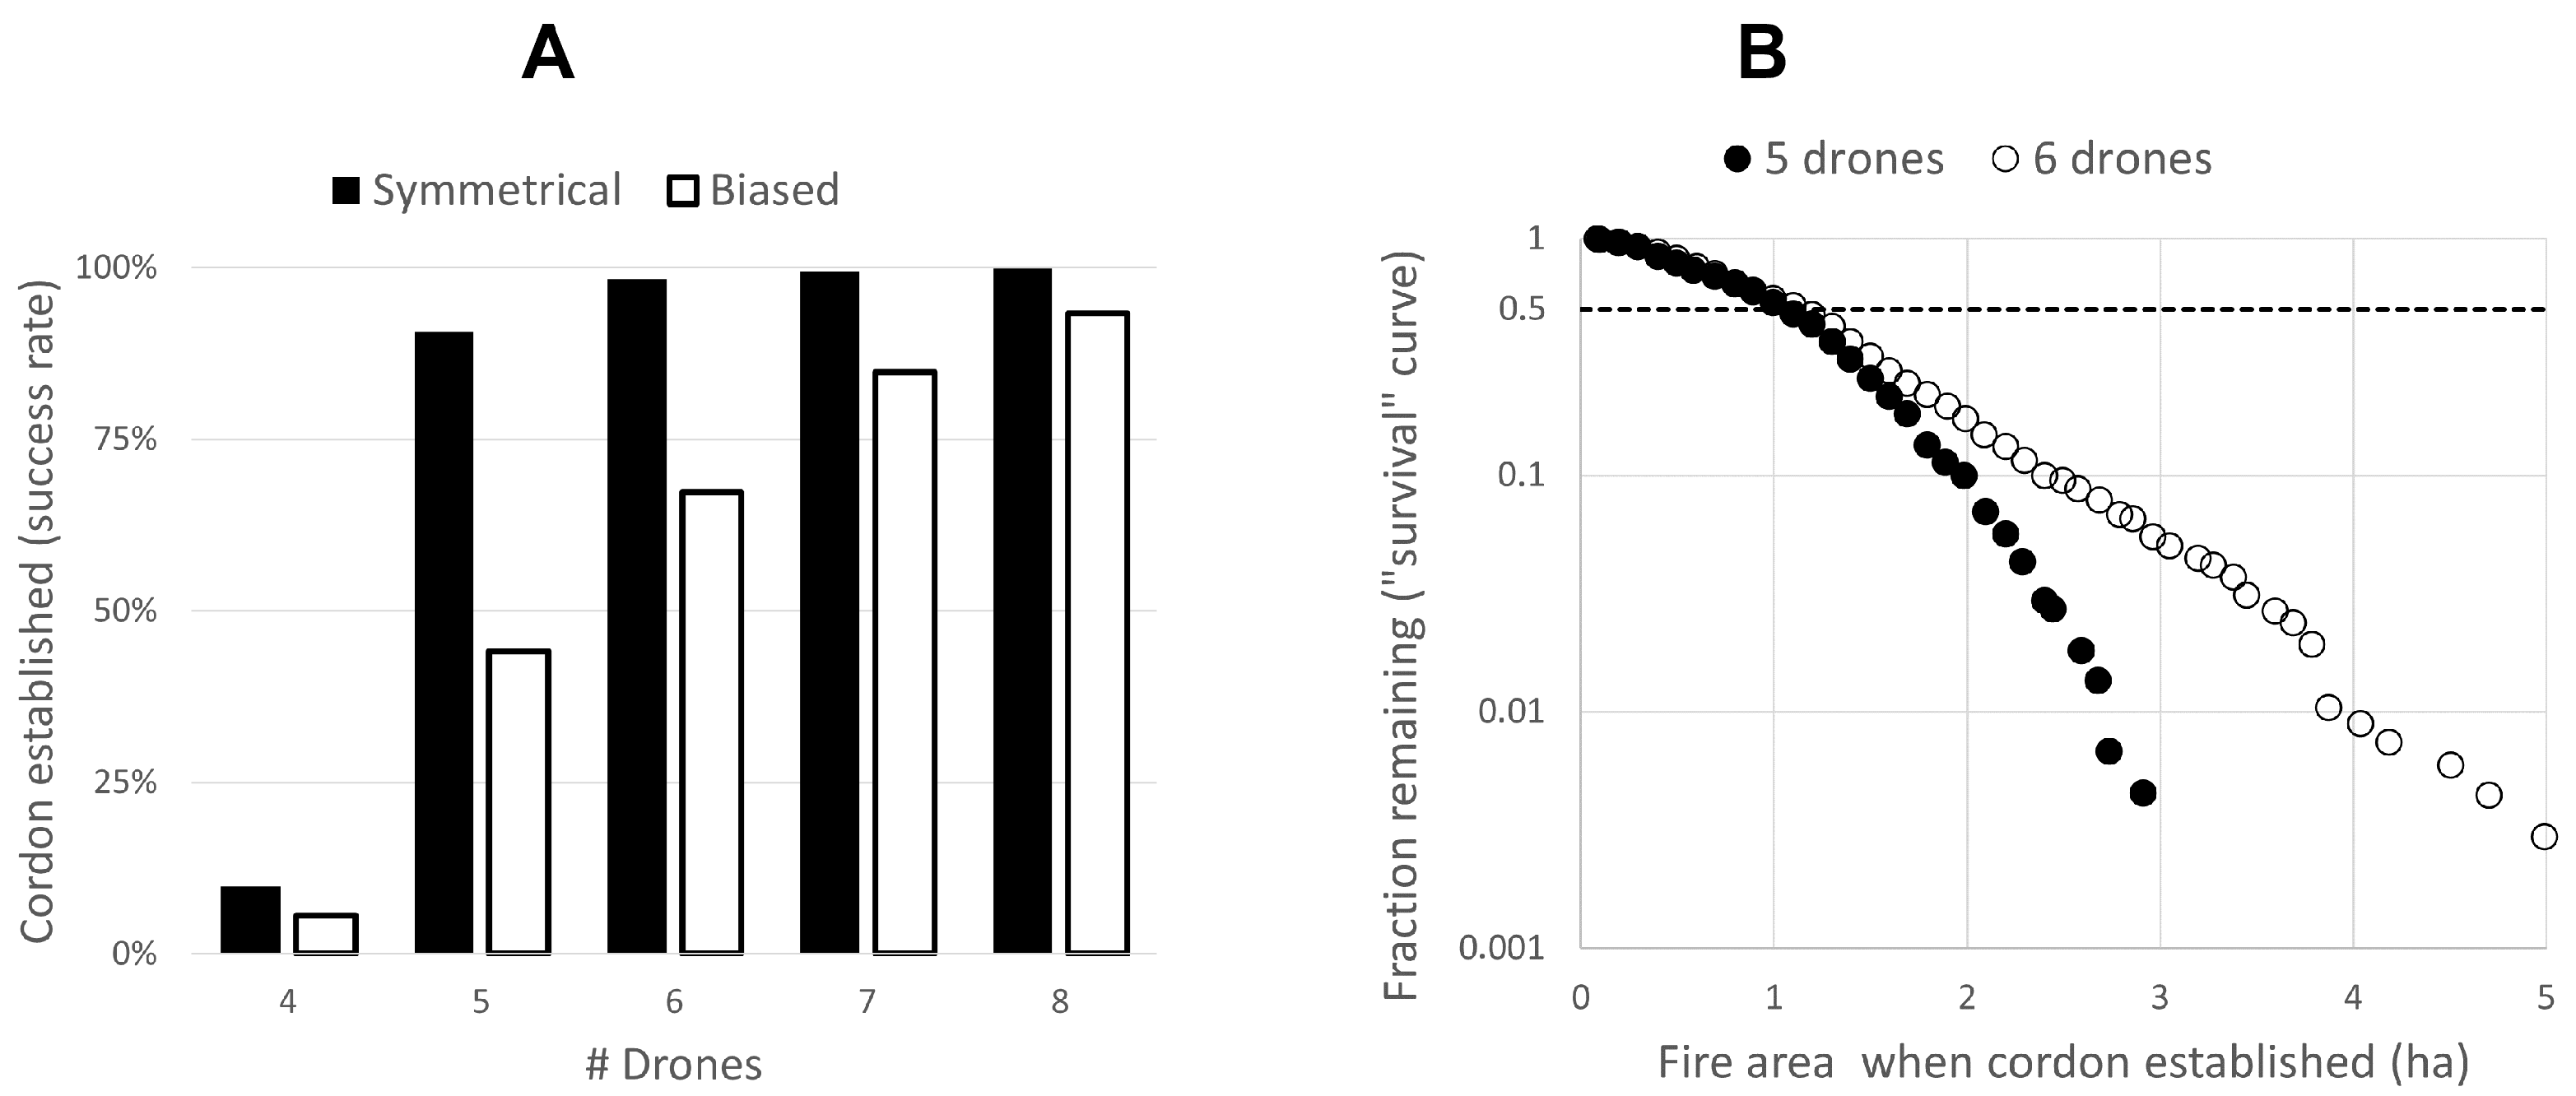
The influence of swarm size appears to be highly nonlinear, which is indicative of strong cooperative effects: in the symmetrical scenario, whilst under 10% of independent realisations resulted in successful encirclement by a swarm comprised of just 4 units, this figure jumps to over 90% when adding a single UAV to the fleet. In the biased propagation case (windy conditions), the threshold appears to be shifted to 6 units, with a 5 drones strong swarm falling short of achieving a 50% success rate. Nonlinearity is also weaker in the biased scenario (i.e., the transition between mostly successful and mostly unsuccessful is not as sharp as in the symmetrical case, see Figure 8A).

5.3. The Impact of Damaged Area on the Drones’ Ability to Contain the Fire

One result of possible interest is the surface area of the fire at the time when the simulation was halted because a cordon had been established (second end condition, see Section 4.1.5). As can be seen in Figure 8B, the probability that the UAVs will be capable of encircling a wildfire decreases nonlinearly with its surface area: for both 5 and 6 drones swarms, nearly half of the fires for which a perimeter was successfully created covered less than 1 ha at the time when this end condition was triggered. Another 40% or 30% (for the smaller and larger swarm sizes respectively) were encircled when their surface area was comprised between 1 and 2 ha. Out of 1000 realisations, no cordon was ever established around a fire larger than 3 ha by the 5-units strong swarm. Only once was a perimeter successfully created by a fleet of 6 units around a fire exceeding 5 ha.
These results are of course impacted by many other parameters such as the size of the arena, the target velocity for the UAVs, the target separation distance between searching units, and the sensitivity of the onboard sensors (i.e., thedetection range). All these parameters directly affect how quickly a fire is likely to be noticed, since they jointly determine the so-called cover time [50] (a suitable indicator of exploration performance in a persistent random walk scenario such as this one). Because of the strongly nonlinear relationship between the surface area of a fire and the probability that a cordon can still be established around it, an early warning coming when the blaze is still of modest size (<1 ha) substantially increases the swarm’s chances of success.

5.4. The Correlation between Swarm Size and Area to Be searched

The relationship between the size of the zone to be searched (arena) and the number of UAVs required to successfully establish a perimeter is of particular interest, since:
  • it has a direct impact on feasibility, and
  • it may inform the choice of how many drones to deploy, given the circumstances.
Accordingly, we performed a systematic investigation of performance for a variable number of UAVs operating in environments of variable sizes, in the hope to identify an empirical law linking the two.
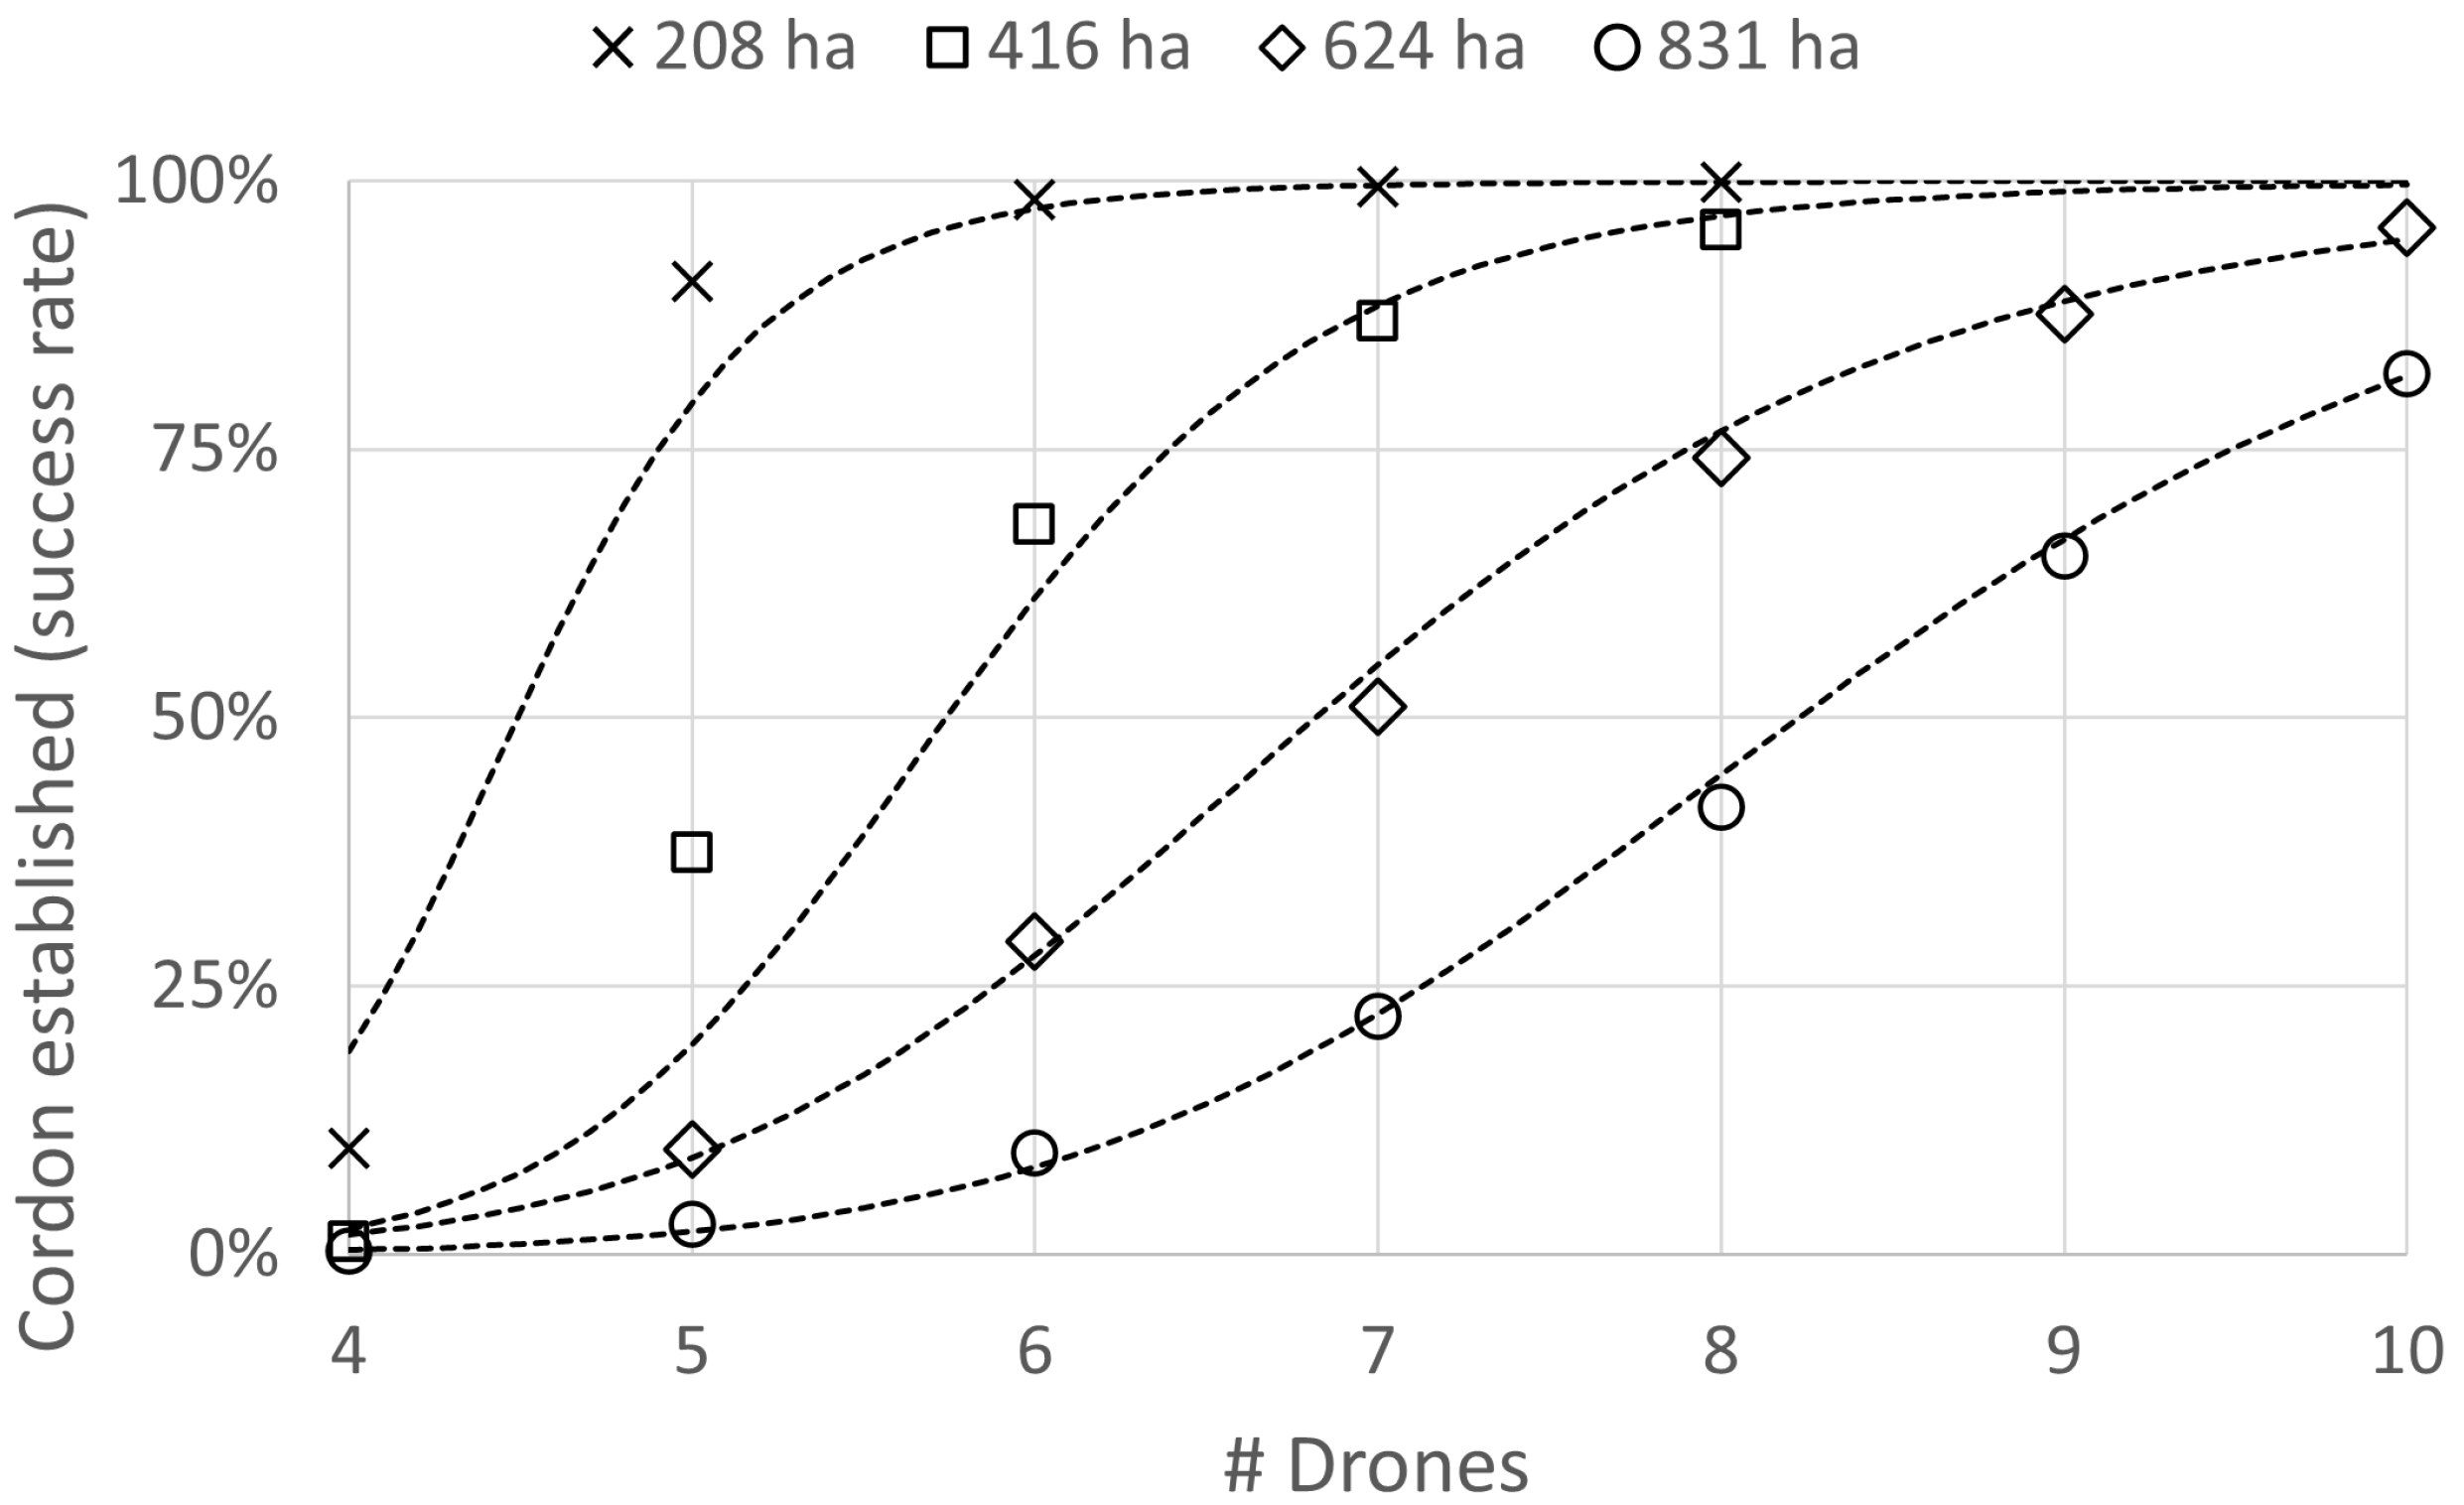
Figure 9 summarizes the results: as the area to search increases in size, the number of drones required to achieve a 50% chance of successful encirclement (threshold) appears to increase linearly. Furthermore, the numerical experiment results are increasingly well approximated by a sigmoid fitting (making statistical predictions more reliable).
The transition in the vicinity of the threshold becomes less sharp though (the curve is less steep), which is indicative of a more gradual improvement (e.g., adding a 9th drone to the swarm in the largest environment does not improve the odds nearly as much as adding a 5th drone in the smallest environment).
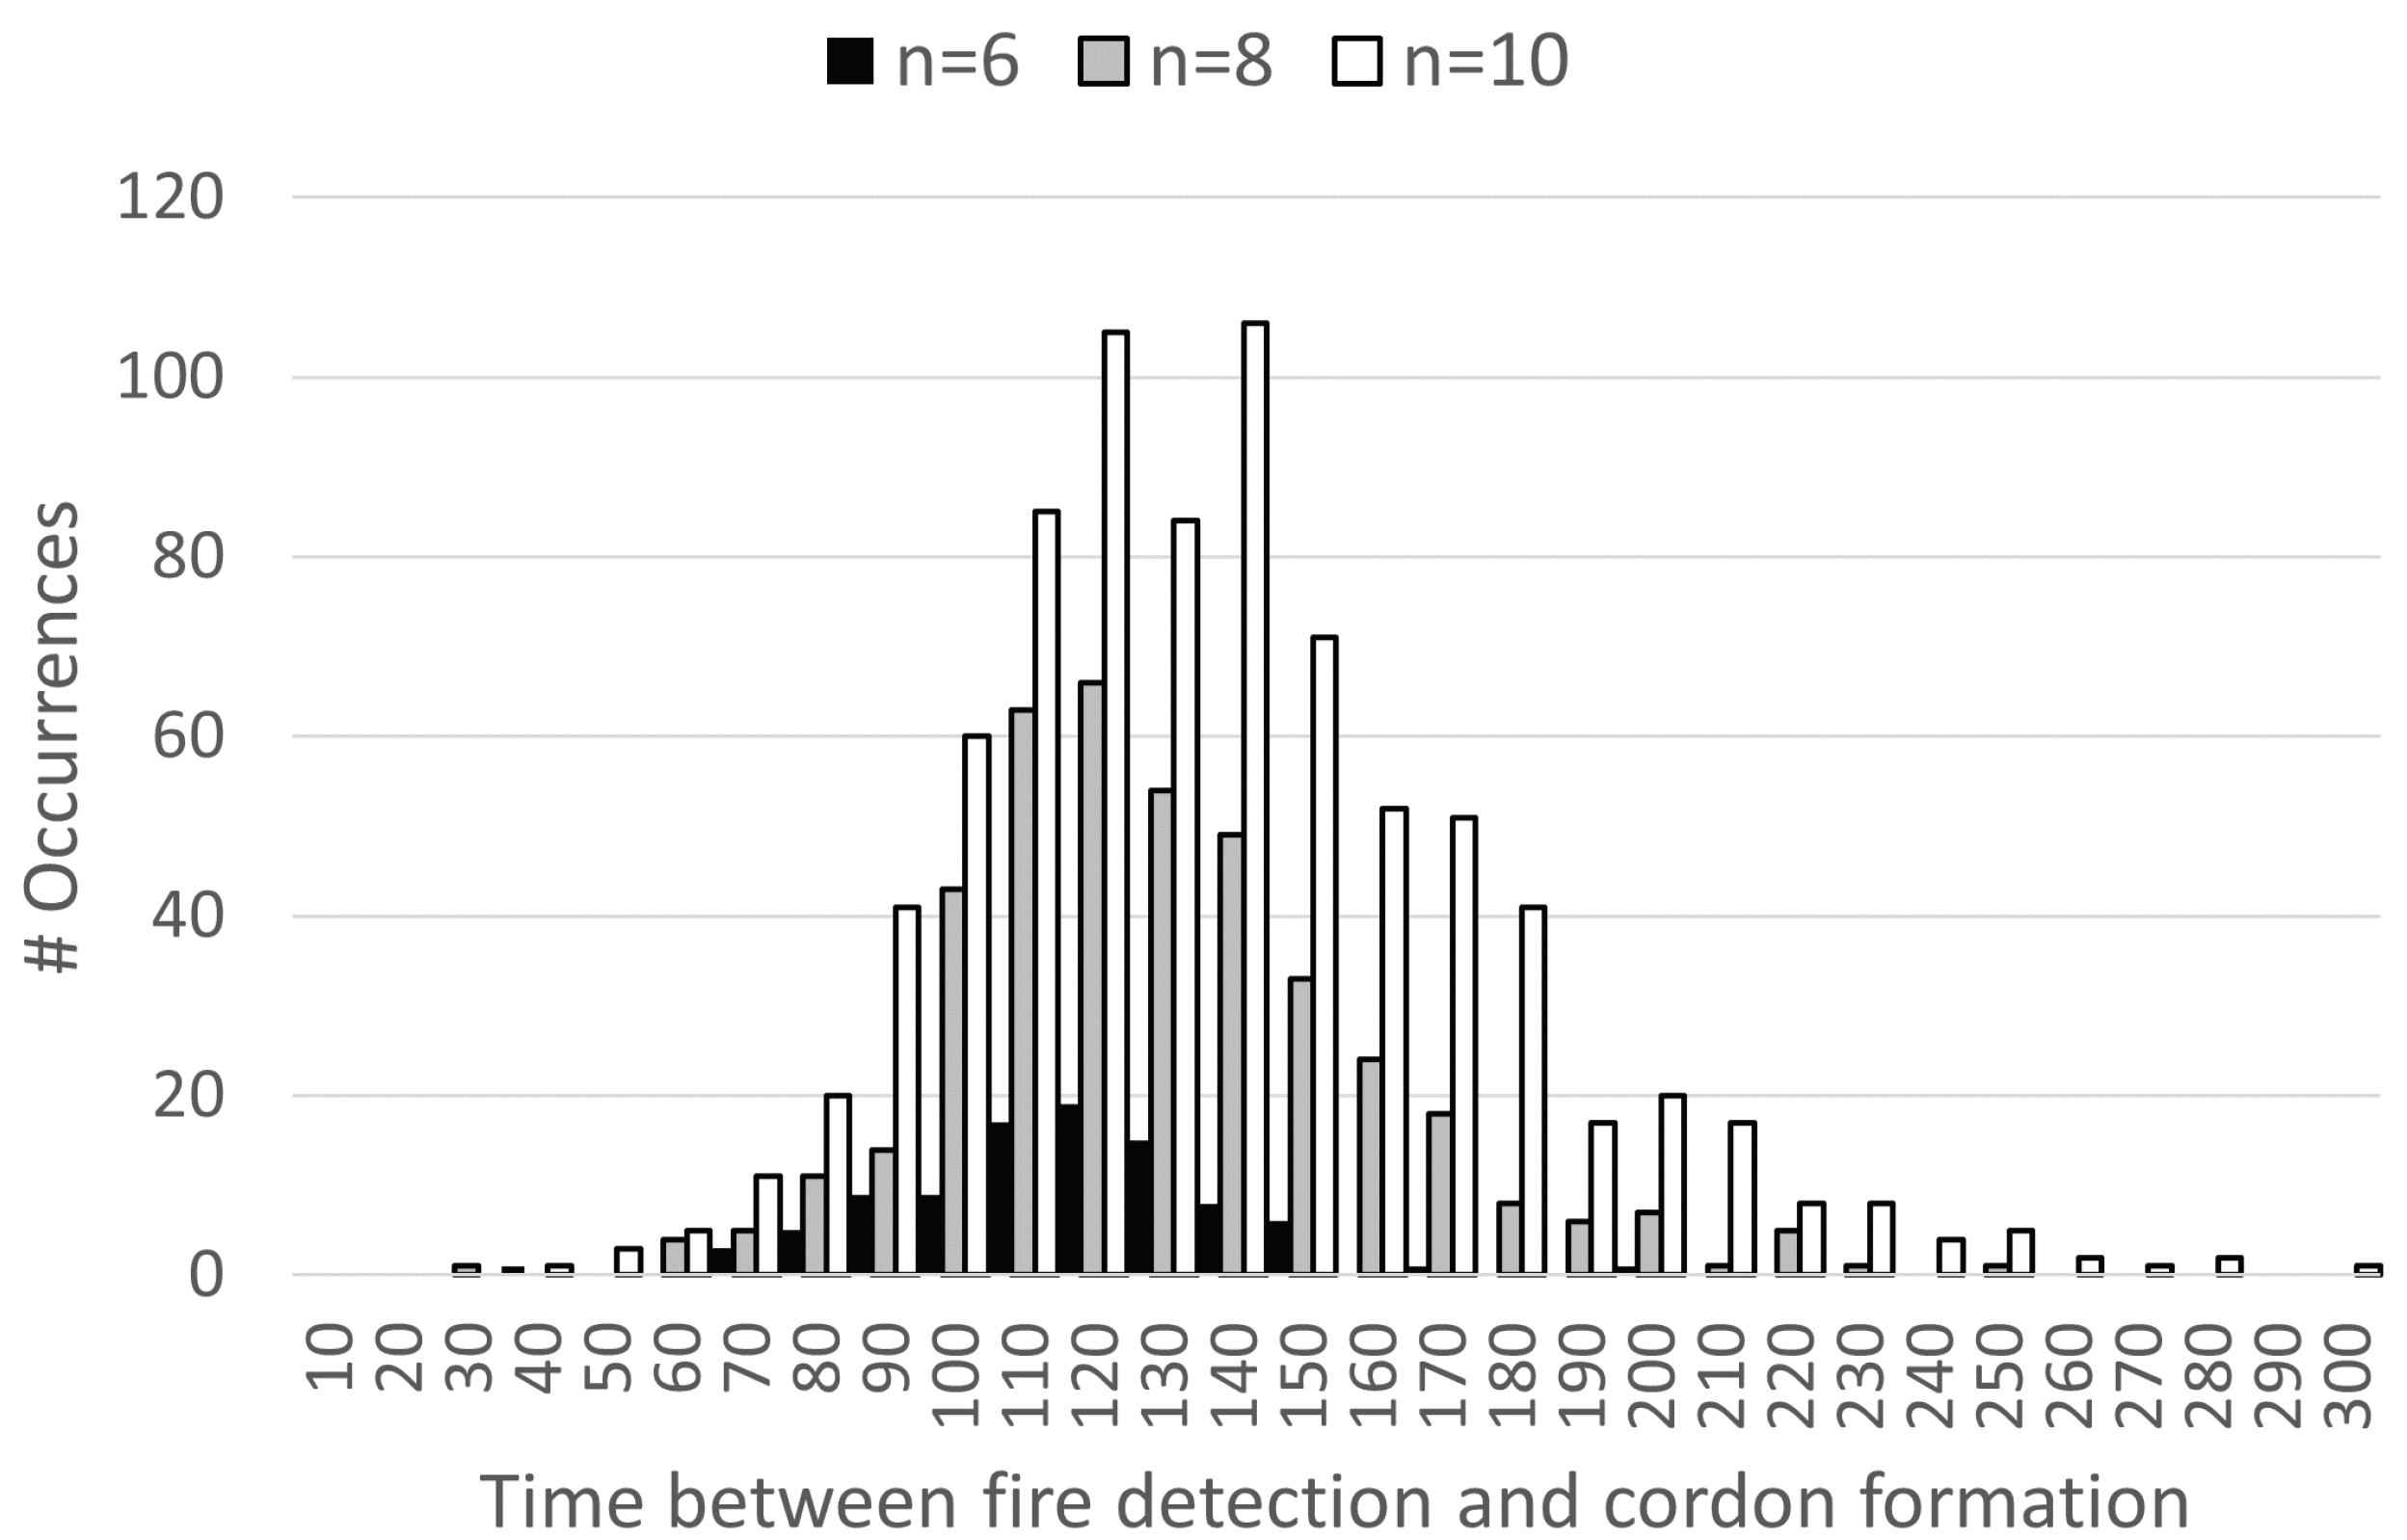
The interplay between the various operational parameters may be further illustrated by looking at the absolute number of successful outcomes (success rate) and their frequency distribution as a function of the time interval separating the moment a fire is initially located from its encirclement. A larger swarm is more often successful in part because of an improved ability to form a cordon a longer time after the fire was first detected.
This is clearly visible in Figure 10 , below, manifesting itself as a shift of the frequency distribution toward longer intervals.

6. Discussion, Conclusions and Future Work

Our results indicate that an autonomous, self-organising fleet of UAVs would in principle be capable to locate and subsequently monitor a wildfire, and to take the first step toward its containment (establishing a perimeter) without human intervention or supervision. This of course doesn’t exclude the possibility of some guidance being given to the swarm when useful information is available, such as the likely location of a fire, but it does emphasise that such an input is not required for the collective intelligence-based method to execute the mission. Although the swarm’s operation in this paper is planned to be fully autonomous, a human supervisor could monitor the swarm’s actions and its gathered data (cf. [30,64] for work on high-level human-in-the-loop control of swarms). In order to analyse the data gathered by the drone swarm, a dedicated data analyst would be needed who would then provide the analysed results to the fire brigade commander for making efficient operational decisions (e.g., regarding where to place the fire crews on the ground). Furthermore, before a fully autonomous level of operation is reached, the level of automation is typically gradually increased as the research and development of the physical swarm system advances. A semi-autonomous mode of operation would in some cases require the human operator to intervene into the operation of the swarm or guide the swarm on certain intervals on a suitable level of abstraction [64]. In this mode of operation, a key research question is also what would be an appropriate Concept of Operations [49] from the human factors perspective for the swarm operations. Another more detailed relevant question is also how to design an intuitive and user-friendly swarm control human-machine interface (HMI), especially for wildfire management. These and many other related human factors engineering (HFE) issues are a topic for further work.
For the sake of transparency, it may be worth drawing the reader’s attention onto the fact that some of the conclusions of our quantitative investigation are of a qualitative nature. This is the consequence of the parameters used in the simulation (e.g., drone speed, target separation distance, fire detection range etc.) having a direct impact on swarm behaviour. Since the values for these parameters may vary depending on the equipment used, many specific results such as, e.g., the swarm size above which success rate exceeds 50% (threshold), are not to be taken as absolute numbers. In other words: although we are confident that the various signatures that were detected are robust, the actual values of the corresponding variables must not be relied upon. For instance, the fact that performance improves increasingly slowly with swarm size as the search area becomes larger (see Section 5.4) is very likely an accurate prediction, but that the threshold value is between 8 and 9 UAVs in the largest arena may not be.
While on the topic of the limitations imposed by the choice of certain parameter values, we wish to acknowledge that the reason why the fire detection range was kept constant in all our numerical experiments is that we did not model altitude in the simulations. In practice, this means that the UAVs self-organise in a plane, which is assumed to correspond to a safe altitude, somewhere above the highest obstacle in the searching area (e.g., tallest tree) and below a ceiling corresponding, e.g., to the airspace used by manned aircraft. The possibility to vary altitude (and so detection range) in different mission phases will be the subject of future work. For instance, intuition suggests that while searching, flying at a higher altitude could result in locating fires earlier. The drones would then perhaps come down and fly a few meters above the canopy to increase image resolution while monitoring the event (cf. [37,67,68] for work on a drone swarm tasked with collectively providing surveillance coverage of an entire area). This change of target altitude would be part of the transition between the searching and tracking behaviours.
The choice of using only the two nearest neighbours as inputs to the local decision-making function is obviously not arbitrary. It was based on the fact that the necessary condition to form a perimeter comprised of discrete units within a predetermined range of each other is that each of them is capable of unambiguously identifying its clockwise and anti-clockwise neighbour in the cordon. It may however be beneficial to relax this rule at certain stages of the collective response. For instance, since our results confirm that a fast reaction time following the locating of the fire event is paramount, the fact that some units may remain in searching mode for some precious seconds or minutes due to this artificial constraint is likely counter-productive. This will be the subject of future work.
Other aspects to be further investigated include behavioural parameters, since these are by definition a design choice to optimise (as opposed to a constraint to be accommodated). Among these parameters is the target separation distance between UAVs, which was arbitrarily set to 200 m but could either be changed or turned into a dynamic parameter that can be adjusted in real-time in response to changing circumstances. For instance, when a cordon breaks as a result of its expansion around the propagating fire, it may be advantageous to increase this target value and form a looser perimeter, instead of allowing it to fragment into disconnected fronts. This parameter could also provide a means to address equipment shortages. For instance, fire management agencies with fewer drones than what would be required to complete a cordon using the default value could increase target separation distance to compensate. The envisioned concept of operation [49] is that of fire crews deploying their swarm (comprised of however many drones they can muster) upon arriving in the vicinity of a suspected fire event. Our results indicate that the number of drones available (and the aforementioned target separation distance) will determine their ability to form a cordon but even if they fail to do so, the swarm is able to self-organise into one or several front(s) and provide real-time data to the fire crew.
Finally, we wish to mention that wildfires are but one example of a dynamic phenomenon, the tracking and encirclement or edge detection of which may be a worthy objective. Others include, e.g., a diffusing airborne chemical (plume) or a [69] floating contaminant such as an oil spill or garbage patch (https://www.vttresearch.com/en/news-and-ideas/plastic-waste-rivers-recycling-jakarta-indonesia-target-study, accessed on 1 October 2022) [35], etc. For the latter example the demonstrated ability of the swarm to encircle and map an event may be paramount.
On the other hand, for the detection of transparent gases with the goal of determining the point of origin (e.g., a gas leak) the determining of a gradient [69], the modelling of a plume and the deduction of a potential source location [70] are the primary interests. All these are tasks our swarm approach could be tailored to tackle.

Author Contributions

Conceptualization, F.S., H.H., H.K. and T.L., methodology, F.S.; software, F.S.; validation, F.S., H.H., H.K. and T.L.; formal analysis, F.S.; investigation, F.S.; resources, F.S., H.H., H.K. and T.L.; data curation, F.S.; writing—original draft preparation, F.S.; writing—review and editing, H.H. and H.K.; visualization, F.S. and H.H.; supervision, F.S.; project administration, H.K.; funding acquisition, F.S., H.K. and T.L. All authors have read and agreed to the published version of the manuscript.

Funding

This research is funded by Academy of Finland (project grant number 348010) and conducted as part of the Unmanned aerial systems based solutions for real-time management of wildfires (FireMan) project. This research was also partly supported by the Academy of Finland project “Finnish UAV Ecosystem“ (FUAVE, project grant number 337878).

Institutional Review Board Statement

Not applicable.

Informed Consent Statement

Not applicable.

Data Availability Statement

Data are available upon reasonable request from the corresponding author.

Acknowledgments

We thank the anonymous reviewers for their time, the useful comments, and constructive criticism which improved the manuscript substantially.

Conflicts of Interest

The authors declare no conflict of interest.

References

  1. Alizadeh, M.R.; Abatzoglou, J.T.; Luce, C.H.; Adamowski, J.F.; Farid, A.; Sadegh, M. Warming enabled upslope advance in western US forest fires. Proc. Natl. Acad. Sci. USA 2021, 118, e2009717118. [Google Scholar] [CrossRef] [PubMed]
  2. Zhuang, Y.; Fu, R.; Santer, B.D.; Dickinson, R.E.; Hall, A. Quantifying contributions of natural variability and anthropogenic forcings on increased fire weather risk over the western United States. Proc. Natl. Acad. Sci. USA 2021, 118, e2111875118. [Google Scholar] [CrossRef] [PubMed]
  3. Williams, A.P.; Livneh, B.; McKinnon, K.A.; Hansen, W.D.; Mankin, J.S.; Cook, B.I.; Smerdon, J.E.; Varuolo-Clarke, A.M.; Bjarke, N.R.; Juang, C.S.; et al. Growing impact of wildfire on western US water supply. Proc. Natl. Acad. Sci. USA 2022, 119, e2114069119. [Google Scholar] [CrossRef] [PubMed]
  4. Ifimov, G.; Naprstek, T.; Johnston, J.M.; Arroyo-Mora, J.P.; Leblanc, G.; Lee, M.D. Geocorrection of Airborne Mid-Wave Infrared Imagery for Mapping Wildfires without GPS or IMU. Sensors 2021, 21, 3047. [Google Scholar] [CrossRef]
  5. Toan, N.T.; Thanh Cong, P.; Viet Hung, N.Q.; Jo, J. A deep learning approach for early wildfire detection from hyperspectral satellite images. In Proceedings of the 2019 7th International Conference on Robot Intelligence Technology and Applications (RiTA), Daejeon, Korea, 1–3 November 2019; pp. 38–45. [Google Scholar] [CrossRef]
  6. Carnicer, J.; Alegria, A.; Giannakopoulos, C.; Di Giuseppe, F.; Karali, A.; Koutsias, N.; Lionello, P.; Parrington, M.; Vitolo, C. Global warming is shifting the relationships between fire weather and realized fire-induced CO2 emissions in Europe. Sci. Rep. 2022, 12, 10365. [Google Scholar] [CrossRef] [PubMed]
  7. Shouse, B.; Forest Fires Kick Up Greenhouse Gas: Human Activities Led to Massive Fire, Carbon Dioxide Release in 1997. Science (News, Environment). 2002. Available online: https://www.science.org/content/article/forest-fires-kick-greenhouse-gas (accessed on 1 October 2022).
  8. Halofsky, J.E.; Peterson, D.L.; Harvey, B.J. Changing wildfire, changing forests: The effects of climate change on fire regimes and vegetation in the Pacific Northwest, USA. Fire Ecol. 2020, 16, 4. [Google Scholar] [CrossRef] [Green Version]
  9. Alkhatib, A.A.A. A Review on Forest Fire Detection Techniques. Int. J. Distrib. Sens. Networks 2014, 10, 597368. [Google Scholar] [CrossRef] [Green Version]
  10. Dampage, U.; Bandaranayake, L.; Wanasinghe, R.; Kottahachchi, K.; Jayasanka, B. Forest fire detection system using wireless sensor networks and machine learning. Sci. Rep. 2022, 12, 46. [Google Scholar] [CrossRef] [PubMed]
  11. Qian, J.; Lin, H. A Forest Fire Identification System Based on Weighted Fusion Algorithm. Forests 2022, 13, 1301. [Google Scholar] [CrossRef]
  12. Xue, Z.; Lin, H.; Wang, F. A Small Target Forest Fire Detection Model Based on YOLOv5 Improvement. Forests 2022, 13, 1332. [Google Scholar] [CrossRef]
  13. Dimitropoulos, S. Fighting fire with science. Nature 2019, 576, 328–329. [Google Scholar] [CrossRef] [PubMed] [Green Version]
  14. Ghali, R.; Akhloufi, M.A.; Jmal, M.; Souidene Mseddi, W.; Attia, R. Wildfire Segmentation Using Deep Vision Transformers. Remote Sens. 2021, 13, 3527. [Google Scholar] [CrossRef]
  15. Kelhä, V.; Herland, E.A.; Lohi, A. Satellite Based Forest Fire Detection and Automatic Alert System—Pilot Experiment. In Early Warning Systems for Natural Disaster Reduction; Zschau, J., Küppers, A., Eds.; Springer: Berlin/Heidelberg, Germany, 2003; pp. 649–653. [Google Scholar] [CrossRef]
  16. Karlikowski, T. Forest Fire Prevention and Control. In Proceedings of an International Seminar organized by the Timber Committee of the United Nations Economic Commission for Europe, Warsaw, Poland, 20–22 May 1981; van Nao, T., Ed.; Springer: Dordrecht, Netherlands, 1982; pp. 85–91. [Google Scholar] [CrossRef]
  17. Thapa, S.; Chitale, V.S.; Pradhan, S.; Shakya, B.; Sharma, S.; Regmi, S.; Bajracharya, S.; Adhikari, S.; Dangol, G.S. Forest Fire Detection and Monitoring. In Earth Observation Science and Applications for Risk Reduction and Enhanced Resilience in Hindu Kush Himalaya Region: A Decade of Experience from SERVIR; Bajracharya, B., Thapa, R.B., Matin, M.A., Eds.; Springer International Publishing: Cham, Switzerland, 2021; pp. 147–167. [Google Scholar] [CrossRef]
  18. Thomas, P.J.; Hersom, C.; Al Kenany, S.; Staley, D. Wildfire Detection with a Microsatellite. In Applications of Photonic Technology 2: Communications, Sensing, Materials, and Signal Processing; Lampropoulos, G.A., Lessard, R.A., Eds.; Springer US: Boston, MA, USA, 1997; pp. 633–640. [Google Scholar] [CrossRef]
  19. Moran, C.J.; Hoff, V.; Parsons, R.A.; Queen, L.P.; Seielstad, C.A. Mapping Fine-Scale Crown Scorch in 3D with Remotely Piloted Aircraft Systems. Fire 2022, 5, 59. [Google Scholar] [CrossRef]
  20. Bushnaq, O.M.; Chaaban, A.; Al-Naffouri, T.Y. The Role of UAV-IoT Networks in Future Wildfire Detection. IEEE Internet Things J. 2021, 8, 16984–16999. [Google Scholar] [CrossRef]
  21. Yuan, C.; Liu, Z.; Zhang, Y. Aerial Images-Based Forest Fire Detection for Firefighting Using Optical Remote Sensing Techniques and Unmanned Aerial Vehicles. J. Intell. Robot. Syst. 2017, 88, 635–654. [Google Scholar] [CrossRef]
  22. Kumar, S.S.; Hult, J.; Picotte, J.; Peterson, B. Potential Underestimation of Satellite Fire Radiative Power Retrievals over Gas Flares and Wildland Fires. Remote Sens. 2020, 12, 238. [Google Scholar] [CrossRef] [Green Version]
  23. Phua, M.H.; Tsuyuki, S. Assessing Impact of Multiple Fires on a Tropical Peat Swamp Forest Using High and Very High-Resolution Satellite Images. Fire 2021, 4, 89. [Google Scholar] [CrossRef]
  24. Allison, R.S.; Johnston, J.M.; Wooster, M.J. Sensors for Fire and Smoke Monitoring. Sensors 2021, 21, 5402. [Google Scholar] [CrossRef]
  25. Barmpoutis, P.; Papaioannou, P.; Dimitropoulos, K.; Grammalidis, N. A Review on Early Forest Fire Detection Systems Using Optical Remote Sensing. Sensors 2020, 20, 6442. [Google Scholar] [CrossRef] [PubMed]
  26. Dufour, D.; Le Noc, L.; Tremblay, B.; Tremblay, M.N.; Généreux, F.; Terroux, M.; Vachon, C.; Wheatley, M.J.; Johnston, J.M.; Wotton, M.; et al. A Bi-Spectral Microbolometer Sensor for Wildfire Measurement. Sensors 2021, 21, 3690. [Google Scholar] [CrossRef] [PubMed]
  27. Pang, Y.; Chen, S.; An, J.; Wang, K.; Deng, Y.; Benard, A.; Lajnef, N.; Cao, C. Multilayered Cylindrical Triboelectric Nanogenerator to Harvest Kinetic Energy of Tree Branches for Monitoring Environment Condition and Forest Fire. Adv. Funct. Mater. 2020, 30, 2003598. [Google Scholar] [CrossRef]
  28. Evans, W.G. Perception of Infrared Radiation from Forest Fires by Melanophila Acuminata de Geer (Buprestidae, Coleoptera). Ecology 1966, 47, 1061–1065. [Google Scholar] [CrossRef]
  29. Schmitz, H.; Norkus, V.; Hess, N.; Bousack, H. The Infrared Sensilla in the Beetle Melanophila acuminata as model for new infrared sensors. Proc. SPIE-Int. Soc. Opt. Eng. 2009, 98, 738–746. [Google Scholar] [CrossRef]
  30. Saffre, F.; Hildmann, H.; Karvonen, H.; Lind, T. Remote Sensing/Photogrammetry, Self-Swarming for Multi-Robot Systems (MRS) Deployed for Situational Awareness (SA). In Drones: New Developments and Environmental Applications.; Lipping, T., Linna, P., Narra, N., Eds.; Springer International Publishing: Cham, Switzerland, 2022; pp. 51–72. ISBN 978-3-030-77860-6. [Google Scholar]
  31. Ivanova, S.; Prosekov, A.; Kaledin, A. A Survey on Monitoring of Wild Animals during Fires Using Drones. Fire 2022, 5, 60. [Google Scholar] [CrossRef]
  32. Roldán-Gómez, J.J.; González-Gironda, E.; Barrientos, A. A Survey on Robotic Technologies for Forest Firefighting: Applying Drone Swarms to Improve Firefighters’ Efficiency and Safety. Appl. Sci. 2021, 11, 363. [Google Scholar] [CrossRef]
  33. Ausonio, E.; Bagnerini, P.; Ghio, M. Drone Swarms in Fire Suppression Activities: A Conceptual Framework. Drones 2021, 5, 17. [Google Scholar] [CrossRef]
  34. Guede-Fernández, F.; Martins, L.; de Almeida, R.V.; Gamboa, H.; Vieira, P. A Deep Learning Based Object Identification System for Forest Fire Detection. Fire 2021, 4, 75. [Google Scholar] [CrossRef]
  35. Liao, Y.H.; Juang, J.G. Real-Time UAV Trash Monitoring System. Appl. Sci. 2022, 12, 1838. [Google Scholar] [CrossRef]
  36. Wahyono; Harjoko, A.; Dharmawan, A.; Adhinata, F.D.; Kosala, G.; Jo, K.H. Real-Time Forest Fire Detection Framework Based on Artificial Intelligence Using Color Probability Model and Motion Feature Analysis. Fire 2022, 5, 23. [Google Scholar] [CrossRef]
  37. Hildmann, H.; Kovacs, E.; Saffre, F.; Isakovic, A.F. Nature-Inspired Drone Swarming for Real-Time Aerial Data-Collection Under Dynamic Operational Constraints. Drones 2019, 3, 71. [Google Scholar] [CrossRef] [Green Version]
  38. Moadab, A.; Farajzadeh, F.; Fatahi Valilai, O. Drone routing problem model for last-mile delivery using the public transportation capacity as moving charging stations. Sci. Rep. 2022, 12, 6361. [Google Scholar] [CrossRef] [PubMed]
  39. Ropero, F.; Muñoz, P.; R-Moreno, M.D.; Hildmann, H. A cooperative UGV-AUV path planning algorithm in R3-space for planetary exploration. In Proceedings of the 16th Symposium on Advanced Space Technologies in Robotics and Automation (ASTRA); ESA, European Space Agency: Noordwijk, The Netherlands, 1–2 June 2022. [Google Scholar]
  40. Ropero, F. Algorithms for the multi-robot systems on the cooperative exploration and last mile delivery problems. Ph.D. Thesis, Universidad de Alcala, Madrid, Spain, 2020. [Google Scholar]
  41. Lahmeri, M.A.; Kishk, M.A.; Alouini, M.S. Charging Techniques for UAV-Assisted Data Collection: Is Laser Power Beaming the Answer? IEEE Commun. Mag. 2022, 60, 50–56. [Google Scholar] [CrossRef]
  42. Boychuk, D.; Braun, W.J.; Kulperger, R.J.; Krougly, Z.L.; Stanford, D.A. A stochastic forest fire growth model. Environ. Ecol. Stat. 2009, 16, 133–151. [Google Scholar] [CrossRef]
  43. Cruz, M.G.; Alexander, M.E. Uncertainty associated with model predictions of surface and crown fire rates of spread. Environ. Model. Softw. 2013, 47, 16–28. [Google Scholar] [CrossRef]
  44. Mell, W.; Jenkins, M.A.; Gould, J.; Cheney, P. A physics-based approach to modelling grassland fires. Int. J. Wildland Fire 2007, 16, 1–22. [Google Scholar] [CrossRef]
  45. Rossi, J.L.; Chetehouna, K.; Collin, A.; Moretti, B.; Balbi, J.H. Simplified flame models and prediction of the thermal radiation emitted by a flame front in an outdoor fire. Combust. Sci. Technol. 2010, 182, 1457–1477. [Google Scholar] [CrossRef] [Green Version]
  46. Tymstra, C. Development and Structure of Prometheus: The Canadian Wildland Fire Growth Simulation Model; Northern Forestry Centre: Edmonton, AB, Canada, 2010. [Google Scholar]
  47. Pan, H.; Badawi, D.; Cetin, A.E. Computationally Efficient Wildfire Detection Method Using a Deep Convolutional Network Pruned via Fourier Analysis. Sensors 2020, 20, 2891. [Google Scholar] [CrossRef]
  48. Wang, K.; Yuan, Y.; Chen, M.; Lou, Z.; Zhu, Z.; Li, R. A Study of Fire Drone Extinguishing System in High-Rise Buildings. Fire 2022, 5, 75. [Google Scholar] [CrossRef]
  49. Laarni, J.; Väätänen, A.; Karvonen, H.; Lastusilta, T.; Saffre, F. Development of a Concept of Operations for a Counter-Swarm Scenario. In Proceedings of the Engineering Psychology and Cognitive Ergonomics - 19th International Conference, EPCE 2022, Held as Part of the 24th HCI International Conference, HCII 2022; Lecture Notes in Computer Science; Harris, D., Li, W.C., Eds.; Springer: Berlin/Heidelberg, Germany, June–July; 2022; pp. 49–63. [Google Scholar] [CrossRef]
  50. Chupeau, M.; Bénichou, O.; Voituriez, R. Cover times of random searches. Nat. Phys. 2015, 11, 844–847. [Google Scholar] [CrossRef] [Green Version]
  51. Rios, O.; Valero, M.M.; Pastor, E.; Planas, E. A Data-Driven Fire Spread Simulator: Validation in Vall-llobrega’s Fire. Front. Mech. Eng. 2019, 5, 8. [Google Scholar] [CrossRef]
  52. Rim, C.B.; Om, K.C.; Ren, G.; Kim, S.S.; Kim, H.C.; Kang-Chol, O. Establishment of a wildfire forecasting system based on coupled weather–Wildfire modeling. Appl. Geogr. 2018, 90, 224–228. [Google Scholar] [CrossRef]
  53. Coen, J.; Cruz, M.; Rosales-Giron, D.; Speer, K. Coupled Fire–Atmosphere Model Evaluation and Challenges. In Wildland Fire Dynamics; Speer, K., Goodrick, S., Eds.; Cambridge University Press: Cambridge, UK, 2022; pp. 209–249. [Google Scholar] [CrossRef]
  54. Koo, E.; Pagni, P.; Stephens, S.; Huff, J.; Woycheese, J.; Weise, D. A Simple Physical Model For Forest Fire Spread Rate. Fire Saf. Sci. 2005, 8, 851–862. [Google Scholar] [CrossRef] [Green Version]
  55. Wu, Z.; Wang, B.; Li, M.; Tian, Y.; Quan, Y.; Liu, J. Simulation of forest fire spread based on artificial intelligence. Ecol. Indic. 2022, 136, 108653. [Google Scholar] [CrossRef]
  56. Anderson, H.; Forest, I.; Range Experiment Station (Ogden, U. Aids to Determining Fuel Models for Estimating Fire Behavior; General technical report INT, U.S. Department of Agriculture, Forest Service, Intermountain Forest and Range Experiment Station: Larue County, KY, USA, 1981. [Google Scholar]
  57. Frost, S.M.; Alexander, M.E.; Jenkins, M.J. The Application of Fire Behavior Modeling to Fuel Treatment Assessments at Army Garrison Camp Williams, Utah. Fire 2022, 5, 78. [Google Scholar] [CrossRef]
  58. Giuseppi, A.; Germanà, R.; Fiorini, F.; Delli Priscoli, F.; Pietrabissa, A. UAV Patrolling for Wildfire Monitoring by a Dynamic Voronoi Tessellation on Satellite Data. Drones 2021, 5, 130. [Google Scholar] [CrossRef]
  59. Alexandridis, A.; Vakalis, D.; Siettos, C.I.; Bafas, G.V. A cellular automata model for forest fire spread prediction: The case of the wildfire that swept through Spetses Island in 1990. Appl. Math. Comput. 2008, 204, 191–201. [Google Scholar] [CrossRef]
  60. Gharakhanlou, N.M.; Hooshangi, N. Dynamic simulation of fire propagation in forests and rangelands using a GIS-based cellular automata model. Int. J. Wildland Fire 2021, 30, 652–663. [Google Scholar] [CrossRef]
  61. Karafyllidis, I.; Thanailakis, A. A model for predicting forest fire spreading using cellular automata. Ecol. Model. 1997, 99, 87–97. [Google Scholar] [CrossRef]
  62. Beer, T. The interaction of wind and fire. Bound.-Layer Meteorol. 1991, 54, 287–308. [Google Scholar] [CrossRef]
  63. Dennison, P.E.; Charoensiri, K.; Roberts, D.A.; Peterson, S.H.; Green, R.O. Wildfire temperature and land cover modeling using hyperspectral data. Remote Sens. Environ. 2006, 100, 212–222. [Google Scholar] [CrossRef]
  64. Saffre, F.; Hildmann, H.; Karvonen, H. The Design Challenges of Drone Swarm Control. In Proceedings of the Engineering Psychology and Cognitive Ergonomics; Harris, D., Li, W.C., Eds.; Springer International Publishing: Cham, Switzerland, July 2021; pp. 408–426. [Google Scholar]
  65. Fang, T.; Bao, W.; Zhu, X.; Li, F.; Yuan, Y.; Ma, L.; Wang, J. Cooperative Encirclement in Swarm Robotics Based on Triangle Antenna Model. In Proceedings of the 2020 3rd International Conference on Robotics, Control and Automation Engineering (RCAE), Chongqing, China, 5–8 November 2020; pp. 17–24. [Google Scholar] [CrossRef]
  66. Munawar, H.S.; Gharineiat, Z.; Akram, J.; Imran Khan, S. A Framework for Burnt Area Mapping and Evacuation Problem Using Aerial Imagery Analysis. Fire 2022, 5, 122. [Google Scholar] [CrossRef]
  67. Hildmann, H.; Almeida, M.; Kovacs, E.; Saffre, F. Termite algorithms to control collaborative swarms of satellites. In Proceedings of the International Symposium on Artificial Intelligence, Robotics and Automation in Space (i-SAIRAS 2018); i-SAIRAS 2018, European Space Agency: Madrid, Spain, May 2018. [Google Scholar]
  68. Almeida, M.; Hildmann, H.; Solmazc, G. Distributed UAV-swarm-based real-time geomatic data collection under dynamically changing resolution requirements. In Proceedings of the UAV-g 2017—International Conference on Unmanned Aerial Vehicles in Geomatics, in ISPRS Archives of the Photogrammetry, Remote Sensing and Spatial Information Sciences, Bonn, Germany, 4–7 September 2017. [Google Scholar]
  69. Elmakis, O.; Shaked, T.; Fishbain, B.; Degani, A. BREEZE-Boundary Red Emission Zone Estimation Using Unmanned Aerial Vehicles. Sensors 2022, 22, 5460. [Google Scholar] [CrossRef] [PubMed]
  70. Shah, A.; Allen, G.; Pitt, J.R.; Ricketts, H.; Williams, P.I.; Helmore, J.; Finlayson, A.; Robinson, R.; Kabbabe, K.; Hollingsworth, P.; et al. A Near-Field Gaussian Plume Inversion Flux Quantification Method, Applied to Unmanned Aerial Vehicle Sampling. Atmosphere 2019, 10, 396. [Google Scholar] [CrossRef]
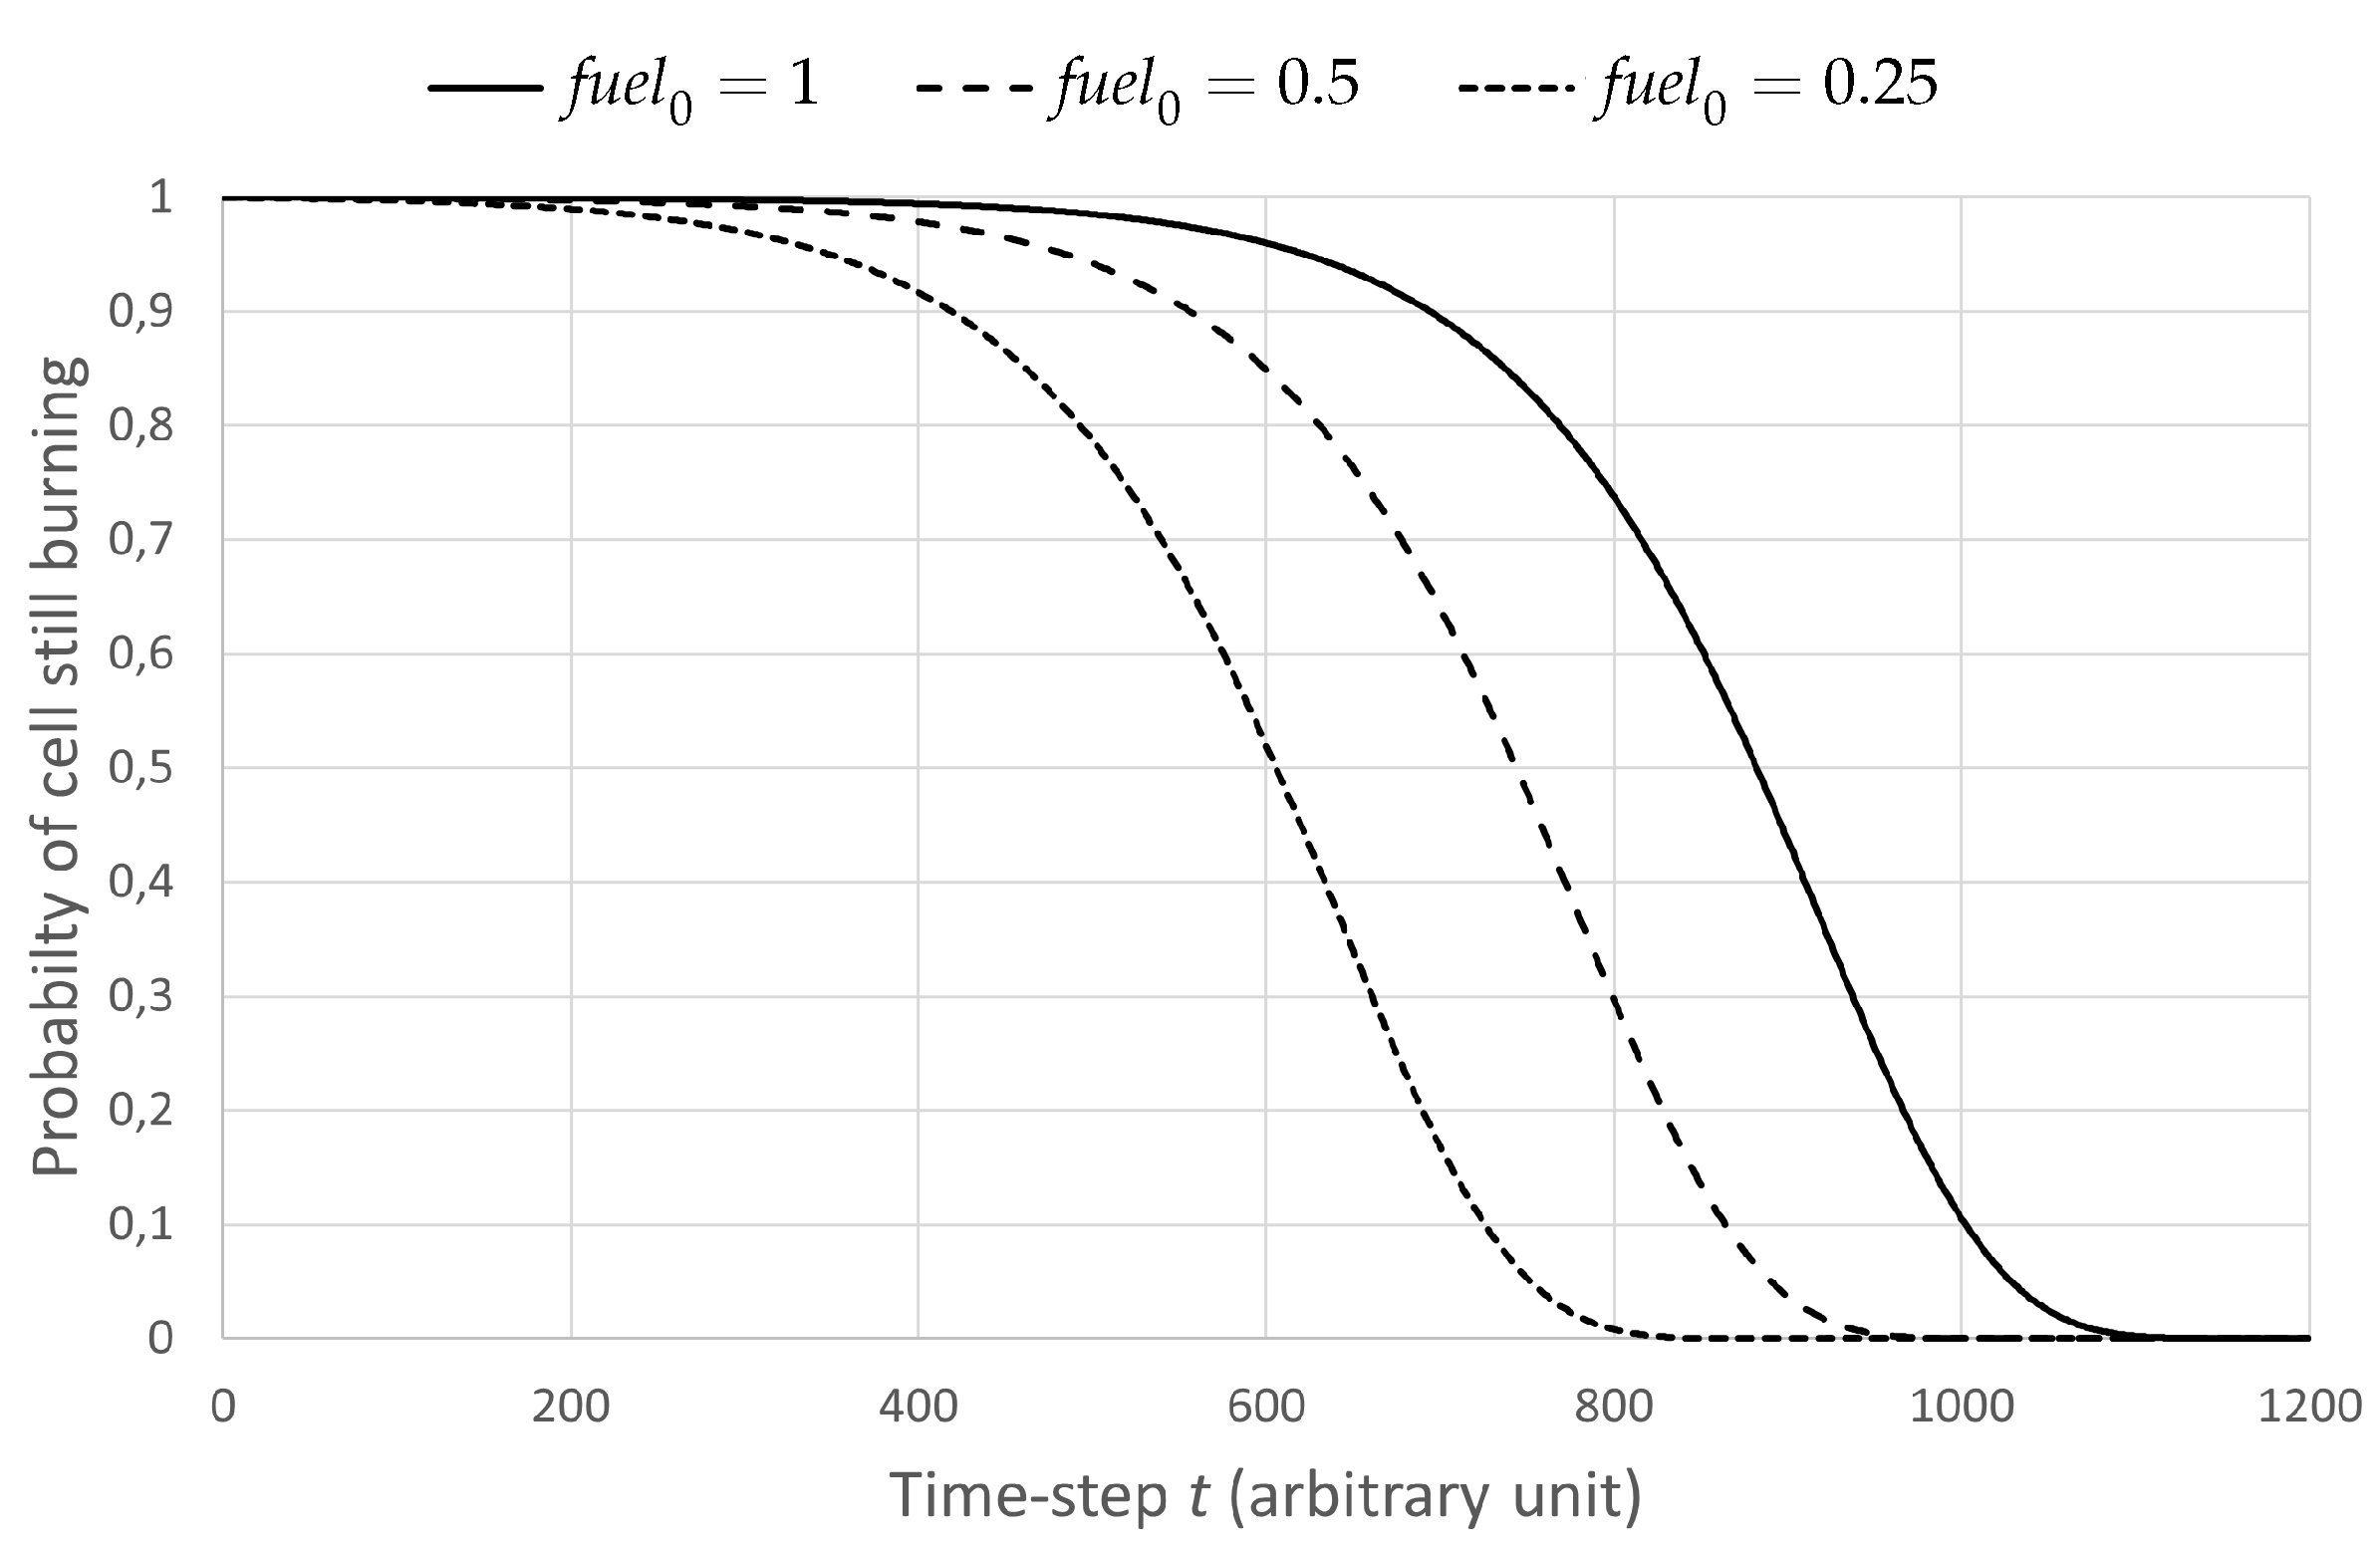
Figure 1. Survival curves indicating how long a fire is statistically expected to burn, for three different fuel 0 , the initial amount of fuel.
Drones 06 00301 g001
Figure 2. Illustration of weighting factors. No wind, symmetrical propagation (A). North-westerly wind favouring propagation towards the southeast (B).
Drones 06 00301 g002
Figure 3. Calculation of the resultant vector. All detected heat sources are added up, taking into account range and fire intensity (A). The nearby source outside the cone of vision (west-northwest) is not included. The resultant vector points into the average direction (B).
Drones 06 00301 g003
Figure 4. The three drone behaviours and the triggers that cause a behaviour switch.
Drones 06 00301 g004
Figure 5. The changes in behaviour when locating a fire (by the device itself, A or by a neighbouring drone, B). Once a device is in tracking mode, it can only change into evading mode if its ambient temperatures get too hot. Once an acceptable safety distance has been reached, a drone will automatically revert to the tracking behaviour until the mission is completed.
Drones 06 00301 g005
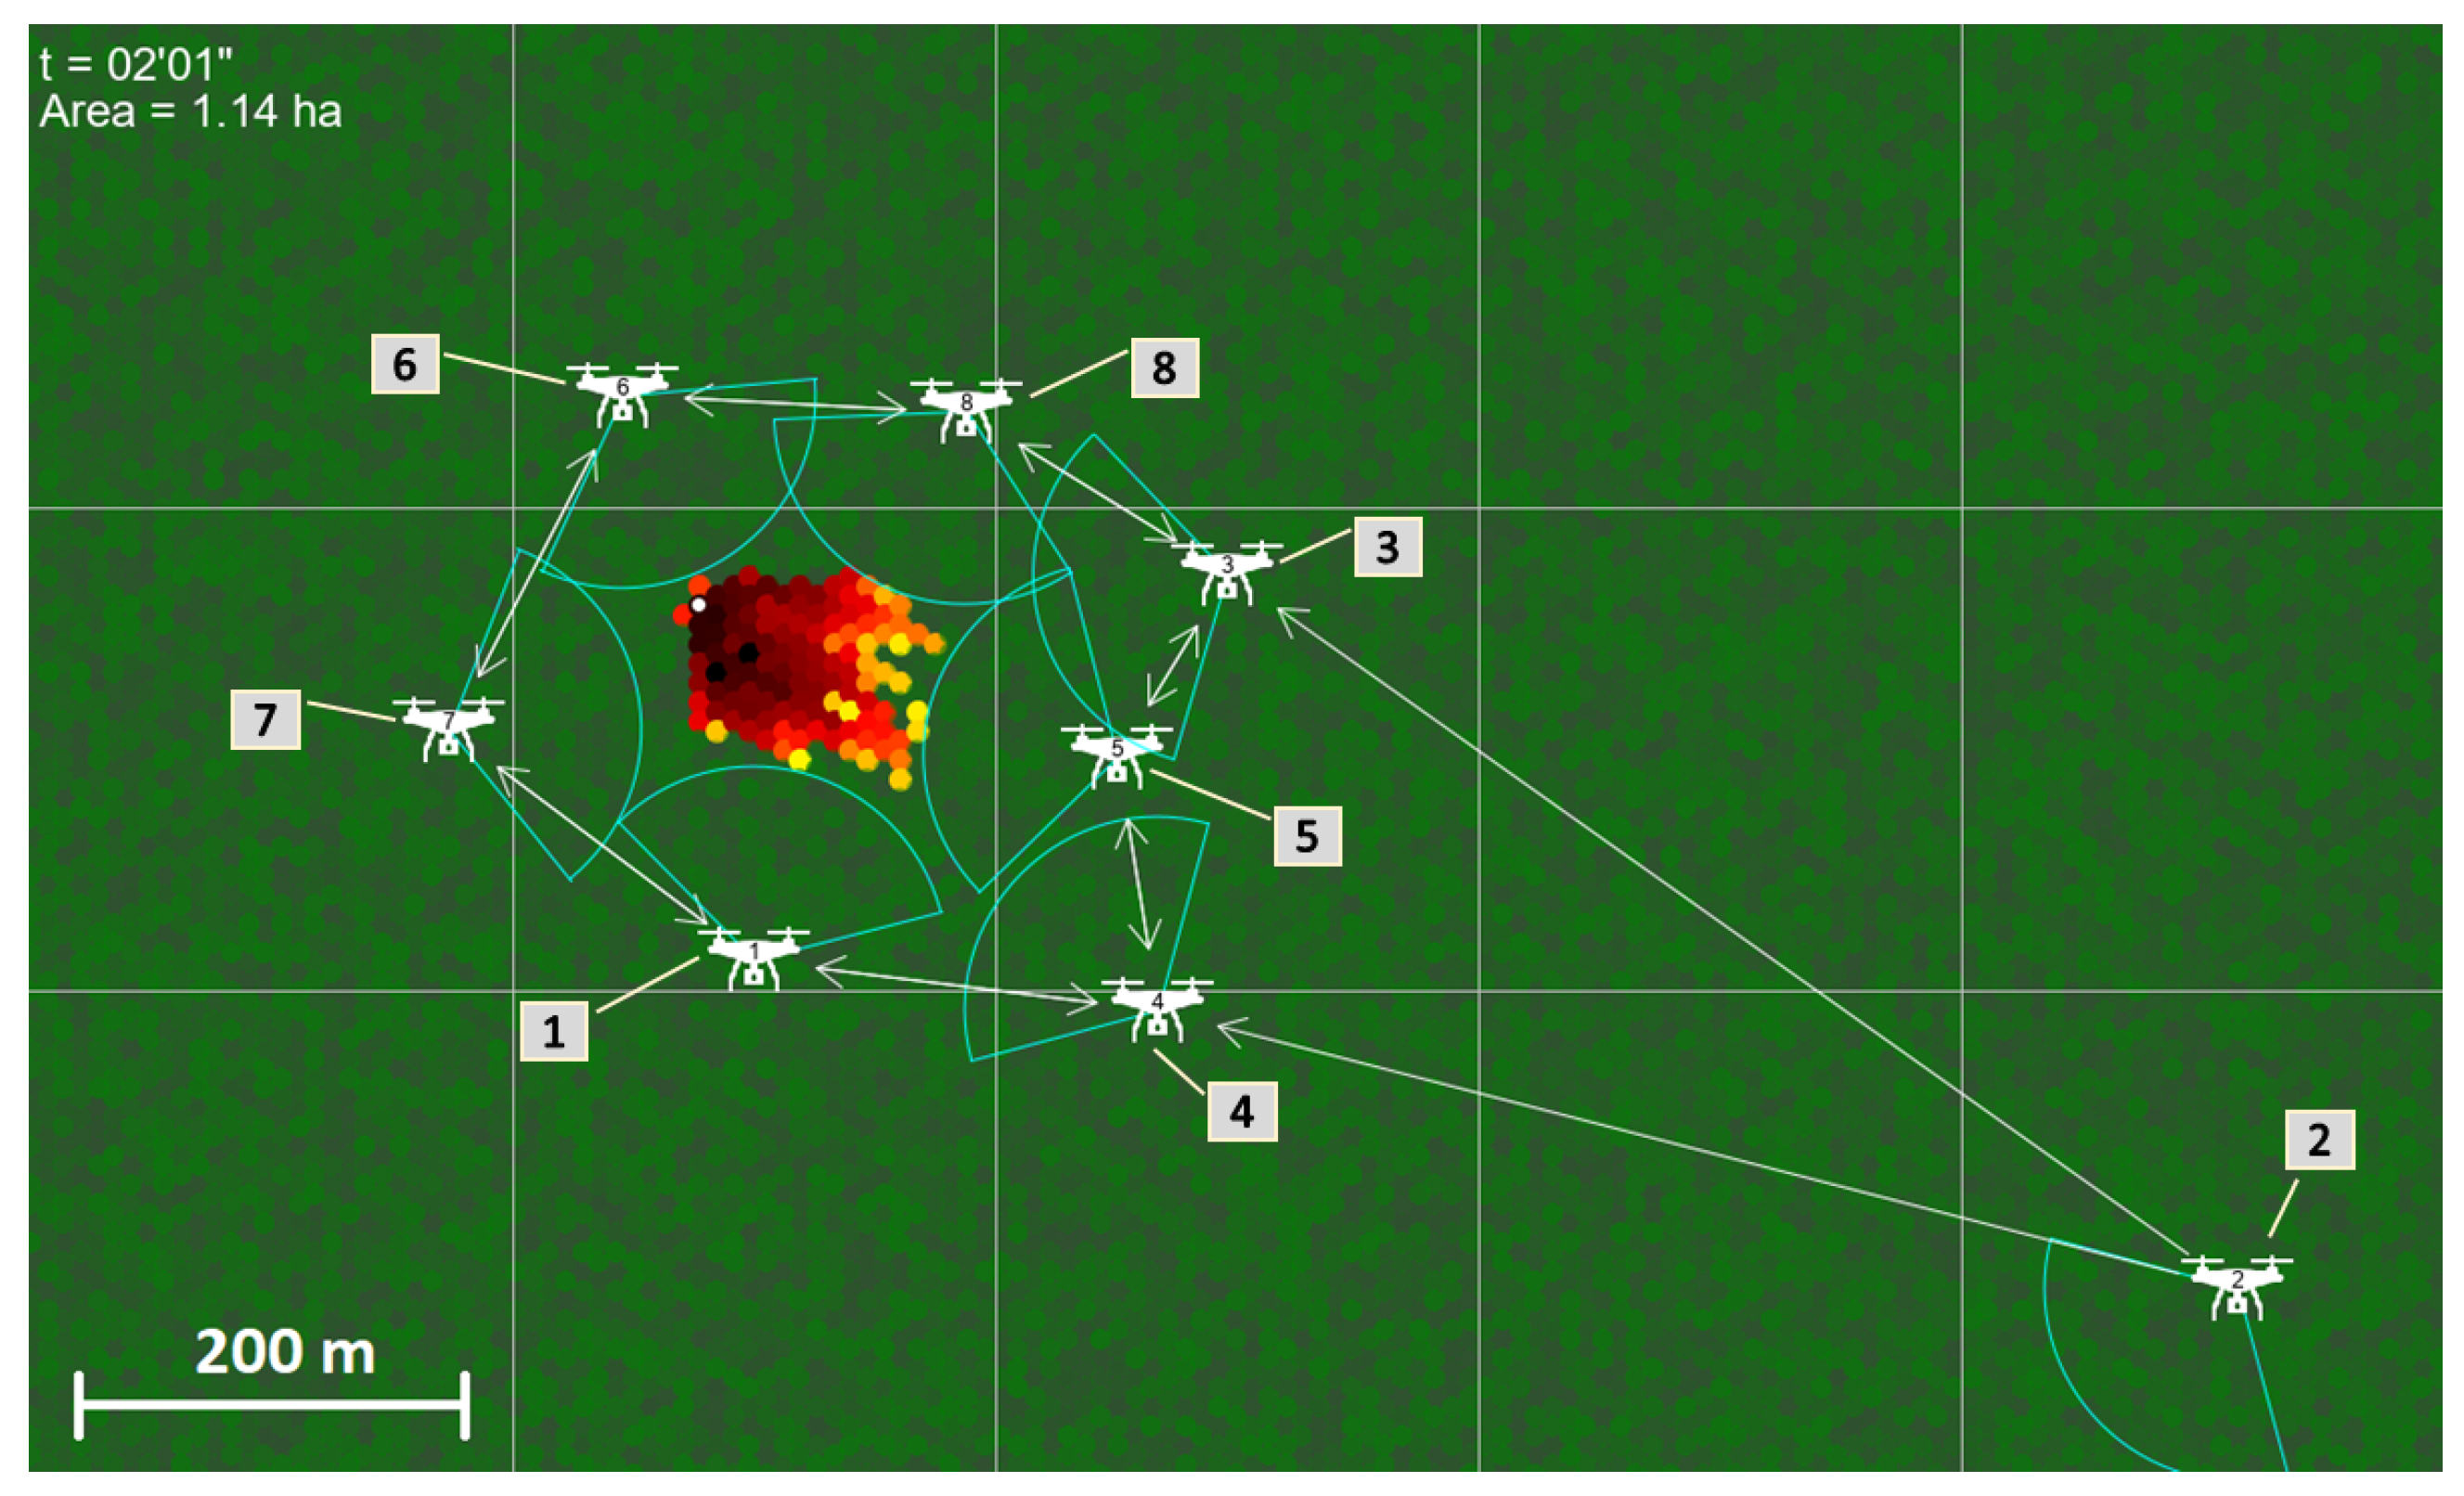
Figure 6. Example of a successfully established perimeter. The arrows point to the two nearest neighbours of every UAV. For a symmetrical cordon to be created, all the connections between its members must be bidirectional. This is the case here for the set containing drones 8,3,5,4,1,7,6 (2, whose nearest neighbours are 3 and 4 but is not one of theirs, is not included).
Drones 06 00301 g006
Figure 7. Typical outcome of a simulation run in the symmetrical (A) and biased propagation (B) scenarios (the white dot marks the point of origin). The furthest reach of the fire, the time it took for it to reach the edge of the arena and the total area destroyed up to that time are recorded. The elevation curves indicate progression and are 2′ apart.
Drones 06 00301 g007
Figure 8. Simulation results (1000 independent realisations per combination of parameter values). (A): comparison between symmetrical and biased fire propagation. (B): “survival” curve representation of the size (surface area) of the blaze when it was successfully encircled, in the biased propagation case.
Drones 06 00301 g008
Figure 9. Performance evaluation for variable arena and swarm sizes. Every data point is the fraction of simulation runs that resulted in a successful perimeter being established, out of 1000 independent realisations (symmetrical fire propagation scenario).
Drones 06 00301 g009
Figure 10. The Frequency distribution of successful encirclements as a function of the interval between locating a fire and establishing a perimeter, for three different swarm sizes ( n = 6 , 8 and 10), operating in the largest arena (≈831 ha). Results are for the symmetrical fire propagation scenario.
Drones 06 00301 g010
Table 1. Wildfire model behaviour with no wind, see Figure 7A. Compare these to Table 2 with results when adding wind. The provided statistics are computed from 1000 independent runs for each scenario. As introduced in Section 4.2.2, Area and Reach measure the extent of the fire.
Symmetrical (No Wind)
MinimumMaximum Average Sdev
Area74.81  ha153.56  ha120.7   ha10.99  ha
Reach590  m755  m630  m26  m
Time12   53 18   48 16   11 0   51
Speed0.56  m/s0.78  m/s0.65  m/s0.03  m/s
Table 2. Wildfire model, as in Table 1 but now with wind. Statistics are again computed from 1000 independent runs for each scenario; Time is the time at which the fire reached the edge of the arena—this is used as a bench-marking result in the absence of drones. Speed is defined as Reach/Time.
Biased (with Wind)
Minimum Maximum Average Sdev
Area89.43  ha169.48  ha139.44  ha11.73  ha
Reach1035  m1566  m1368  m76  m
Time15   28 22    1 19   25 0   55
Speed1.03  m/s1.34  m/s1.17  m/s0.05  m/s
Publisher’s Note: MDPI stays neutral with regard to jurisdictional claims in published maps and institutional affiliations.