Abstract
The objectives of this study were to characterize the effects of operational factors on spray application parameters for remotely piloted aerial application systems (RPAAS). The effects of application height and ground speed on spray pattern uniformity and droplet spectra characteristics were investigated for two RPAAS (DJI model MG-1 and HSE V6A) delivery vehicles equipped with original equipment manufacturer (OEM) nozzles. A spray mixture of tap water and fluorescent dye was applied at three different application heights in conjunction with four different ground speeds over the center line of a cotton string, suspended 1 m above ground. Fluorometric assessment of spray deposits on cotton strings and spray droplets captured on water-sensitive paper samplers described spray pattern and droplet spectra, respectively. Effective swath was determined based on the widest spray swath with a coefficient of variation (CV) ≤ 25%. Regardless of ground speed, application heights of 2 and 3 m yielded the largest effective swath for the MG-1. Neither application height nor ground speed significantly influenced effective swath for the V6A. These test results may provide guidance to remote aerial applicators as to the best application height and ground speed to use for their RPAAS for efficacious application of pest control products.
1. Introduction
The aerial application of pest control products in the United States by manned aircraft is usually conducted over large expanses of farmland, typically 50 ha or more. However, often agricultural spray applications are needed for site-specific management of crop pests in difficult terrain not easily accessible to manned aircrafts. Small remotely piloted aerial application systems (RPAASs), often referred to as UAVs, can fly and make spray applications autonomously based on preprogrammed flight paths. Advances in sensors and instruments installed on such aircrafts have resulted in innovative changes in production agriculture relative to pest management, plant genetics and agronomy [1,2,3]. Several researchers have deployed RPAASs to control crop pests in countries where pesticide applications face less regulatory oversight and where topography is predominated by mountains and rice fields. Qin, et al. [4] operated an RPAAS at an application height of 1.5 m and a ground speed of 5 m/s in a rice field and obtained uniform spray droplet distribution of chlorpyrifos in the lower canopy of rice foliage. Qin, et al. [5] applied fungicide for powdery mildew control with an RPAAS on wheat and found that an application height of 5 m and ground speed of 4 m/s improved spray coverage on upper wheat canopy. Xue, et al. [6] sprayed chlorpyrifos against rice leaf-folder, Cnaphalocrocis medinalis (Guenee) operating an UAV at different heights in southern China. Faithpraise, et al. [7] deployed an RPAAS to release Trichogramma and Tachinid parasites for control of armyworm on cereal crops and achieved improved suppression of the pest outbreak. Pan et al. [8] flew a four-rotor UAV on open center and round type canopy citrus trees at 1 m/s ground speed and three different flying heights and reported that open center canopy was more suitable for UAV deployment. Zhang et al. [9] developed a laboratory spraying platform which simulated UAV aerial spraying to determine application parameters that are laborious and time-consuming to obtain under field conditions. Martinez-Guanter et al. [10] designed and field-tested on citrus and olive orchards a UAV spraying system equipped with a spray tank under the bottom of a DJI platform and reported that it was economically efficacious compared to a conventional spray application. Hunter et al. [11] reported that an MG-1 platform was 0.3 to 3-fold more efficient in identifying and treating target weedy areas than ground-based broadcast applications. However, none of these studies were designed to obtain fundamental information on spray pattern uniformity and droplet characteristics which are prerequisites for the deployment of remotely piloted aerial vehicles to efficaciously suppress pest populations.
The objectives of this study were to determine the effects of application height and ground speed on spray pattern uniformity and droplet spectra characteristics from two RPAAS delivery systems. The intent was to use these data to provide guidance for remote aerial applicators to effectively deliver crop protection products via commercially available RPAAS aircrafts.
2. Materials and Methods
This study was conducted in an unpaved area surfaced with gravel in Burleson County, near College Station, Texas (30°40′ N, 96°18′ W). Two RPAASs, Agras MG-1 (Dà-Jiāng Innovations, Shenzhen, Guangdong, China) and V6A (Homeland Surveillance and Electronics, Seattle, WA, USA), were used to assess the effects of application height and ground speed on spray pattern and spray droplet spectra characteristics. The MG-1 was equipped with four XR110-01 nozzles (TeeJet Technologies, Wheaton, IL, USA), and the V6A was equipped with four CR80-005 nozzles (Lechler GmbH, Metzingen, Germany). The XR110-01 nozzles are flat fan nozzles with a 110° spray angle while the CR80-005 nozzles are a hollow cone design with an 80° spray angle. The flow rate for the XR110-01 nozzles was 354 mL/min. at 226 kPa while the flow rate for the CR80-005 nozzles was 197 mL/min at 517 kPa. Because of the difference in flow rates between the two nozzles, the V6A was operated at its maximum pressure and the MG-1, with a larger pump, was operated at its minimum pressure to better enable direct comparisons between the two units. For the V6A, the outboard nozzles were positioned 41 cm away from the inboard nozzles, which were 82 cm apart (Figure 1). For the MG-1, the nozzles on the same side were 58.4 cm apart, while the distance between nozzles on opposite sides was 139.7 cm (Figure 2). Three application heights (2, 3 and 4 m) in combination with four ground speeds (1, 3, 5 and 7 m/s) were used as treatments. Each treatment was replicated four times. For the V6A, the application heights and ground speeds were programmed through the mission planning software. For the MG-1, the height was visually estimated for lack of a height readout, while the ground speed was set through the remote controller. A spray mixture of tap water and Vision Pink™ dye (GarrCo Products, Converse, IN) at 20 mL/L was sprayed parallel to the prevailing wind over the center line of an 11-m long × 1 mm diameter cotton string, suspended 1 m above ground (Figure 3). The aircraft was flown directly into the wind. Weather conditions during the study are shown in Table 1. Standard surface meteorological measurements included wind speed (m/s), wind direction (°), Sigma Theta (°), wind gust (m/s), temperature (℃) and relative humidity (%). These measurements were taken during the study and were obtained from the Texas Farm Mesonet. Sigma Theta is a measure of horizontal fluctuations of wind direction. Wind gust is a sudden and brief increase in wind speed that usually lasts less than 20 s. Meteorological variability throughout studies such as these cannot be controlled. Although weather conditions do influence the results reported in this manuscript, every effort was taken to minimize the weather effects by orienting the string analysis system perpendicular to the wind (±30°), regardless of the wind direction, during each spray application.
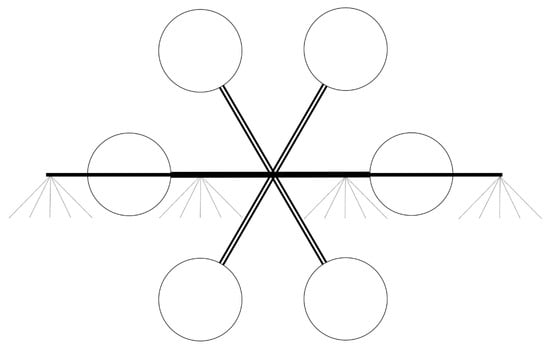
Figure 1.
Schematic of HSE V6A, showing rotor configurations and corresponding nozzle locations on spray boom. Circles represent rotor positions.

Figure 2.
Schematic of DJI Agras MG-1, showing rotor configurations and corresponding nozzle locations under rotor. Circles represent rotor positions.
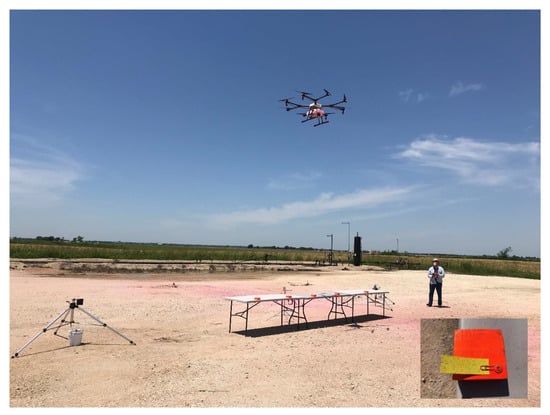
Figure 3.
Experimental design of the study conducted over a caliche surface showing the MG-1 aircraft flying over a cotton string strung between two tripods and WSP samplers attached to five wooden blocks placed on two tables contiguous to each other. Close up of a wooden block and a WSP sampler are shown in the inset.

Table 1.
Weather conditions during the study.
2.1. Determination of Spray Pattern and Effective Swath
The spray pattern and effective swath were determined by measuring the amount of fluorescent dye deposited on the cotton string after each spray pass. The spray deposits on the string were analyzed using the USDA Swath Analysis System, described earlier [12]. The spectrometer (fluorometer) (Model USB2000+, Ocean Optics, Inc., Dunedin, FL) used for the system had a wavelength measurement range of 350–1000 nm at a resolution of 0.32 nm per pixel. As the string went through the photocell, the strength of the emission signal at 575 nm varied depending on the amount of fluorescent dye deposited on the string. The analysis software read the signal strength at the highest value between 565 and 586 nm wavelengths. The string patterns were analyzed with a program written in LabView (National Instruments, Austin, TX, USA), a system engineering software package that produces input and output signals and creates graphical images. The software was custom built with a sampling frequency of 3.8 cm. It took four samples every 15.2 cm of the cotton string length and averaged those data points to smooth the data.
Two different methods were used to evaluate the spray pattern and effective swath from each aircraft. The first method conforms to ASABE standard S386 for spray pattern testing. This is the traditional method that has been used for decades to evaluate spray patterns from agricultural aircraft. Using this method, a series of three or four passes was made using the same aircraft and equipment setup. The spray patterns from these three or four passes were geometrically centered through the software using a centroid feature to compensate for spray pattern movement due to slight crosswinds or the aircraft deviating from the centerline of the string. An equal area function also was applied to compensate for varying strengths of signals between passes. If the spray pattern from one or more of the individual passes was deformed due to a strong crosswind, then that pass was eliminated from the average. The resulting passes were then averaged together to get an average spray pattern. In each case, there were always at least two spray patterns averaged together. The averaged spray pattern was then analyzed for effective swath based on the resulting coefficient of variation of that pattern over computer-simulated multiple passes throughout the field. The effective swath was determined by choosing the widest swath with a coefficient of variation (CV) less than or equal to 25%. The CV is a statistical index of the uniformity of spray deposits across the swath width and is the standard metric for spray swath uniformity from aerially applied materials [13,14]. Five simulated racetrack passes were used for this analysis. A racetrack pattern is the most common pattern for RPAAS systems, as it overlaps material deposited from the right side of the aircraft with material from the left side of the aircraft on subsequent passes.
The second spray pattern analysis method takes a different tack and looks at each pass individually and then simulates what that individual pass might look like if it were applied side-by-side throughout a field in a racetrack pattern. These individual spray patterns were also centered and the areas equalized as in the first method. Since there is typically high meteorological variability from pass to pass, the coefficient of variation for the spray patterns from this type of analysis is likely to be much higher than that for the first method for a given swath. However, this second method of pattern analysis may be more indicative of what is happening in the field during this type of spray operation.
We sought to normalize the spray rate (L/ha) determined by WSP samplers by removing the residual effect of ground speed and application height and to ascertain spray efficiency for the two aircrafts studied (V6A and MG-1). The nozzle flow rate and the ground speed of the aircraft were factored into the formula. Spray efficiency was thus calculated from the ratio of the actual or the measured spray rate to the theoretical application rate. The spray efficiencies of the two platforms (V6A and MG-1) were compared only for Method 1.
2.2. Spray Droplet Spectra
2.1.1. WSP Samplers
Spray droplet spectra were determined using water-sensitive paper (WSP) samplers. Five wooden blocks, each with a paper clip attached on the top, were placed 1 m apart on a table (0.76 m × 0.76 m × 1.8 m) located parallel to and centered on the cotton string. WSPs were inserted into each of the paper clips before each spray application. To enable enough drying time, the WSPs were removed approximately 1 min after each spray pass was completed and placed inside photonegative sleeves (Model # 35-7BXW; PrintFile® Archival Preservers, Apopka, FL, USA). They were then taken to the laboratory for analysis. Spray droplet images captured on WSPs were analyzed by the DropletScan™ scanner-based system [15]. Spray droplet spectra measured were Dv0.1, Dv0.5, Dv0.9, percent area coverage, and spray application rate. Dv0.1 is the droplet diameter (µm) where 10% of the spray volume is contained in droplets smaller than this value. Similarly, Dv0.5 and Dv0.9 are droplet diameters where 50 and 90% of the spray volumes are contained in droplets smaller than these values, respectively. Dv0.5 is commonly known as the volume median diameter (VMD).
The American Society of Agricultural and Biological Engineering has developed the ASABE S572.2 Droplet Size Classification, a standard to measure and interpret spray quality tips [16]. The spray droplet sizes that were released from the spray tips in this study were comprised of fine (106–235 µm), medium (236–340 µm), coarse (341–403 µm), and very coarse (404–502 µm) spray droplets.
2.1.2. Laser Droplet Sizing
It is commonly accepted that flat plate impaction collectors, like WSPs, have low collection efficiencies of smaller droplets compared to larger droplets. Reasons for this can be partly attributed to evaporation of the droplets during their descent to the target area after application and also because smaller spray droplets do not make an adequate visible stain on WSPs for image analysis [17]. Therefore, spray droplets exiting the nozzles (XR110-01 and CR80-005) also were measured using an existing laser diffraction technique [18]. Briefly, the laser diffraction sensor, fitted with the manufacturer denoted R7 lens, provided for a dynamic measurement size range of 18 to 3500 μm (Model HELOS-KR/VARIO, Sympatec GmbH System, Clausthal-Zellerfeld, Germany). Droplet spectra parameters for each nozzle were evaluated at a wind speed of 4 m/s using three replications. This speed was selected because it is near the maximum wind speed allowed on typical chemical labels for aerial application. This study was conducted in a low speed wind tunnel located at the Pesticide Application Technology Laboratory, West Central Research and Extension Center of the University of Nebraska-Lincoln in North Platte, NE, USA.
In addition to Dv0.1, Dv0.5, Dv0.9, spray coverage (%), and spray rate (L/ha) previously measured by WSP samplers, the laser diffraction technique also measured the relative span (RS) and the percentages of spray volume contained in droplets less than 100 and 200 µm. The RS is a dimensionless value indicative of the uniformity of the spray droplet spectrum and was calculated as follows: RS = (Dv0.9 − Dv0.1)/Dv0.5. The percentages of spray volume contained in droplets less than 100 and 200 µm are indicators of the fraction of the spray typically associated with elevated drift potential. According to ASABE Standard S572.2 [16], a standard which classifies droplet spectra relative to standard reference spray nozzles, the XR 110-01 nozzle produced a fine spray and the CR 80-005 produced a very fine spray.
2.3. Data Analysis
All data were analyzed using a PROC GLIMMIX procedure [19]. Variations due to the main effect of platform, application height, ground speed, and their interactions were evaluated. Interaction least square means were separated using Tukey’s Method at P < 5% and letter-grouped with PDMIX800 macro [20]. All graphical illustrations were produced using JMP® [21]. Spray efficiency of the two aircrafts tested in this report was compared using PROC TTEST [19]. The Dv0.5 spray droplets from WSP samplers were regressed against spray efficiency to determine whether any functional relationship existed between these two variables.
3. Results
3.1. Spray Pattern Uniformity and Effective Swath Using Method 1
Based on the traditional method of spray swath evaluation where multiple spray passes were averaged together, each aircraft model tested was able to produce an acceptable spray pattern with the manufacturer nozzles provided at any combination of tested application height and ground speed (Figure 4 and Figure 5). Since multiple passes were averaged together for this traditional method of pattern analysis, no statistical analysis was possible. The individual passes were the replications that would have been needed for statistical analysis. There were, however, apparent differences between the effective swaths of the MG-1 and the V6A. Over the full range of ground speeds, the effective swath for the MG-1 consistently seemed to be wider than that for the V6A (Figure 4). Application height appeared to influence effective swath more for the MG-1 than that for the V6A aircraft (Figure 5). As application height increased, effective swath decreased. The 2 m application height appears to produce a wider effective swath for both aircrafts.
Figure 4.
The effect of ground speed on effective swath for two RPAAS aircrafts. Spray pattern uniformity was analyzed using the traditional method of averaging multiple spray passes to determine the effective swath for each treatment.

Figure 5.
The effect of application height on effective swath for two RPAAS aircrafts. Spray pattern uniformity was analyzed using the traditional method of averaging multiple spray passes to determine the effective swath for each treatment.
3.2. Spray Pattern Uniformity and Effective Swath Using Method 2
When the spray passes were analyzed individually, statistical analysis of the data was possible and greater variability between spray passes was observed when compared to the averaging technique in the previous method. Much of the observed variability was likely due to inherent meteorological variability in wind speed and direction. Figure 6 shows a sample skewed distribution of the fluorescent dye deposition on cotton string for the V6A aircraft owing to crosswind with a concomitant increase in CVs. However, Figure 7 shows a sample spray pattern for the V6A with minimal crosswind effects. The effective swath for this type of pattern without crosswind interference is much wider. Comparable deposition profiles for the MG-1 aircraft are shown in Figure 8 and Figure 9, which demonstrate, respectively, crosswind and in-wind effects on spray pattern uniformity.
Figure 6.
Relative spray deposits expressed as spectrometer emission values along the cotton string locations for the V6A. This is a spray pattern with a crosswind component with CVs shown as an inset.
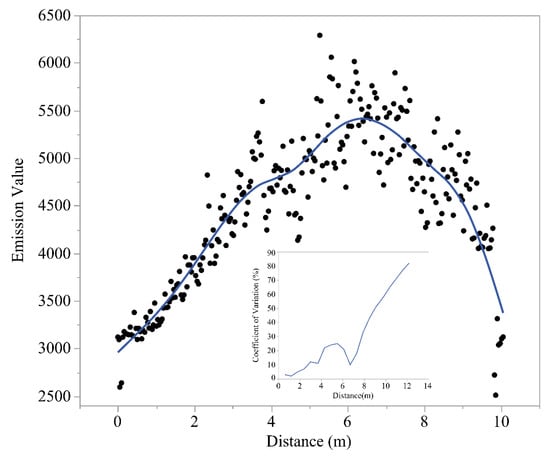
Figure 7.
Relative spray deposits expressed as spectrometer emission values along the cotton string locations for the V6A. This is an in-wind spray pattern with CVs shown as an inset.
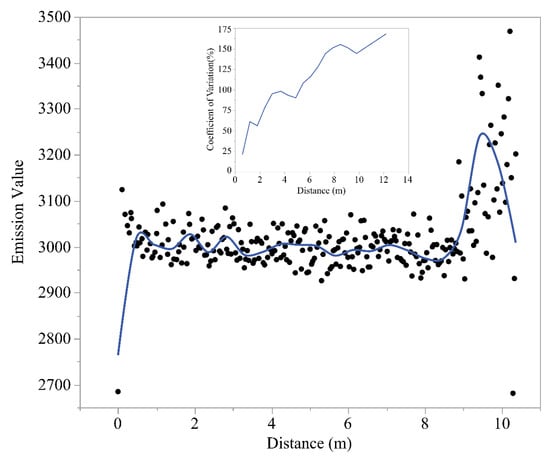
Figure 8.
Relative spray deposits expressed as spectrometer emission values along the cotton string locations for the MG-1. This is a spray pattern with a crosswind component with CVs shown as an inset.

Figure 9.
Relative spray deposits expressed as spectrometer emission values along the cotton string locations for the MG-1. This is an in-wind spray pattern with CVs shown as an inset.
The effective swath varied significantly between the MG-1 and V6A aircraft (F = 8.88; P = 0.0039; df = 1, 74) with the effective swath of the MG-1 consistently being wider than that of the V6A. The MG-1 had an overall effective swath of 5.3 m with a 95% confidence interval of ±0.7 m while the V6A produced an overall effective swath of 4.1 m with a 95% confidence interval of ±0.5 m.
Application height did not significantly influence effective swath for the V6A aircraft (Figure 10) but it did for the MG-1 (Figure 11). For the MG-1, the effective swath was significantly wider at the 2 m application height than at the 4 m height but the effective swath at the 2 and 3 m heights was comparable. Thus, at the 2 and 3 m application heights, any of the tested ground speeds would result in an acceptable spray pattern (CV ≤ 25%) at an effective swath of 5.9 m with a 95% confidence interval of ±0.8 m for the MG-1.
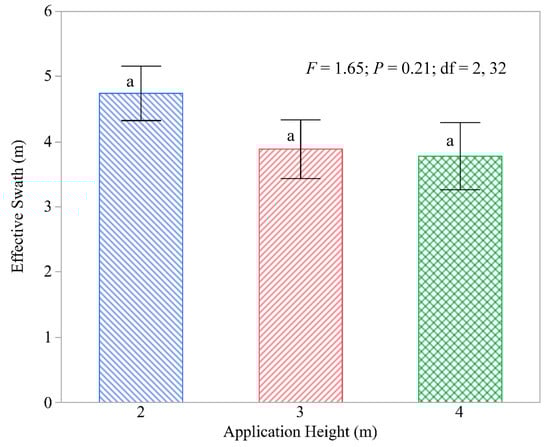
Figure 10.
Effect of application height on effective swath for the V6A aircraft. Means (± SEM) with the same lower-case letters are not significantly different at P < 0.05 according to Tukey’s Method.
Figure 11.
Effect of application height on effective swath for the MG-1 aircraft. Means (± SEM) with the same lower-case letters are not significantly different at P < 0.05 according to Tukey’s Method.
Ground speed did not have a significant impact on effective swath for either the V6A (Figure 12) or the MG-1 (Figure 13). The V6A was able to produce an acceptable spray pattern with the provided manufacturer nozzles at any combination of tested application heights and ground speeds.
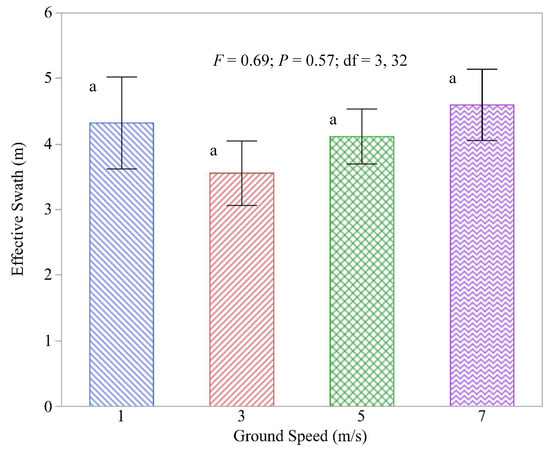
Figure 12.
Effect of ground speed on effective swath for the V6A aircraft. Means (± SEM) with the same lower-case letters are not significantly different at P < 0.05 according to Tukey’s Method.
Figure 13.
Effect of ground speed on effective swath for the MG-1 aircraft. Means (±SEM) with the same lower-case letters are not significantly different at P < 0.05 according to Tukey’s Method.
3.3. Comparison of Swath Analysis Techniques
The spray patterns for the tested treatments were analyzed using two different techniques. The first one, referred to as the traditional method, overlays multiple spray passes to obtain an average spray pattern for the aircraft for a specific treatment. That averaged pattern is then computer simulated across five racetrack spray swaths to achieve a coefficient of variation at different swath widths. This method is typically preferred when time and resources limit the number of spray passes that can be made, such as at a spray pattern test clinic. The second method analyzes each individual spray pass by itself. That individual pass also is simulated across five spray swaths to obtain a coefficient of variation for different swath widths. This method is probably more indicative of actual field applications, since it does not overlay multiple passes on top of each other. As a result, greater variability in spray deposits is observed across the spray swath. When a minimum standard of variability is exercised upon a spray swath (i.e., CV ≤ 25%), the effective swath using this technique will almost always be narrower than with the traditional method. Table 2 illustrates the differences in the resultant effective swaths using the two different methods of analyses. What can be seen from the data is that there is a significant reduction in swath when the individual swaths are analyzed independently. On average, there was a 1.2 m reduction in effective swath for both the V6A and MG-1 aircraft for an overall reduction of 37.9% and 29.7%, respectively. These values were not significantly different (F = 0.04; P = 0.84; df = 1, 22) and indicate that the reduction in effective swath was comparable between the two methods evaluated, regardless of the aerial platform. Table 3 shows that the spray efficiency averaged 51.69 and 100.74% for the V6A and MG-1 platforms, respectively. The spray efficiency was significantly greater for the MG-1 platform than that for the V6A platform (t = −2.58; P = 0.03; df = 11). The method used to determine effective swath width is ultimately up to the analyst. However, given that these tests must be conducted under field conditions with greater natural meteorological variability, Method 1 has been used for decades with little to no adverse effect on spray deposition or efficacy in the field.
Table 2.
The effect of swath analysis method on effective swath for two RPAAS platforms.
Table 3.
The spray efficiency of Method 1 as influenced by application height and ground speed for the two RPAAS platforms.
3.4. Spray Droplet Spectra on WSP Samplers
Application height did not significantly influence deposited spray droplet size, percent area coverage nor spray rate for the MG-1 (Table 4). Ground speed, however, significantly influenced spray droplet spectra, coverage and spray rate for the MG-1 (Table 4). Interactions between operational protocols were significant for Dv0.1 and Dv0.5 but not for Dv0.9. Similarly, a significant interaction between application height and ground speed was evident for percent area coverage but not for spray rate. The 3 m application height and 5 m/s ground speed significantly produced the largest Dv0.1 and Dv0.5 values for the MG-1. Likewise, the 2 m height and 1 m/s ground speed resulted in the highest percent area coverage and spray rate values for the MG-1.
Table 4.
Spray droplet parameters as influenced by application height and ground speed for the MG-1 aircraft.
Unlike the MG-1, application height did affect deposited droplet size, percent area coverage and spray rate for the V6A (Table 5). Ground speed affected Dv0.5, Dv0.9, percent area coverage and spray rate. The interaction between application height and ground speed was significant for Dv0.1 and percent area coverage but not for the other droplet parameters. The 2 m application height and 1 m/s ground speed produced the largest spray droplets, while the 3 m application height and 1 m/s ground speed produced the largest percent area coverage and spray rate. Spray droplet spectra were the smallest at the 4 m application height and 7 m/s ground speed. Similarly, percent area coverage and spray rate were the smallest at the 4 m application height and 7 m/s ground speed.
Table 5.
Spray droplet parameters as influenced by application height and ground speed for the V6A aircraft.
As seen in Figure 14, there was a tendency for the spray droplets (Dv0.5) to increase as the efficiency of spray application increased. The regression of Dv0.5 droplets on spray application efficiency indicated that there was a significant functional relationship between the two variables for the two aerial systems. The regression equation: Y = 213.39 + 0.45 * spray efficiency explained 58% of the variation for the MG-1 platform, while the regression equation: Y = 168.96 + 0.31 explained 25% of the variation for the V6A platform. The regression coefficient, 0.45 (t = 3.76; P = 0.0037), and the intercept, 213.39 (t = 15.36; P < 0.0001), were significantly greater than 0, each with 1, 10 df for the MG-1. Similarly, the regression coefficient, 0.31 (t = 1.83; P = 0.10), and the intercept, 168.96 (t = 16.56; P < 0.0001), were significantly greater than 0 for the V6A as well. However, the slope coefficient was significant only at the 10% level. This suggests that for the CR80-005 nozzle with a smaller orifice, the ability to increase Dv0.5 droplet size with an increase in application spray efficiency was limited.

Figure 14.
Relationship between spray droplets (Dv0.5) and spray efficiency for the MG-1 and V6A aircraft.
3.5. Wind Tunnel Analysis of Spray Droplet Spectra
Results from the spray nozzle tests in the wind tunnel indicated that the CR80-005 nozzle produced a significantly smaller droplet spectra than the XR110-01 nozzle (Table 6), as would be expected from a hydraulic nozzle with a smaller orifice. The percentage of spray volume comprised of droplets less than 100 and 200 µm was also significantly less for the XR110-01. The relative span data indicate that the droplet spectra from the CR80-005 nozzle were less variable than the XR110-01 nozzle. It should be noted that regardless of the differences between the two nozzles, both would be considered to have high potential for drift.
Table 6.
Wind tunnel analysis of spray droplet spectra for the XR110-01 and CR80-005 nozzles.
4. Discussion
4.1. Spray Pattern Uniformity and Effective Swath
The development of a uniform spray pattern is important to ensure relatively equal placement of applied materials to target areas and to suppress target pest populations through efficacious applications. The effective swaths of 5.3 ± 0.7 m for the MG-1 and 4.1 ± 0.5 m for the V6A compare favorably with those reported by Giles and Billing [22] who flew a much heavier (65 kg) Yamaha R-Max single-rotor UAS at 3–4 m above a vineyard canopy at 6 m/s and provided spray application and deposition rates comparable to that of manned aerial spraying. Thus, the effective swaths obtained in this study (4.1 to 5.3 m) compare favorably with those achieved by Giles and Billing [22], who reported effective swaths between 4.8 to 7.2 m. Application height significantly influenced effective swath for the MG-1 platform in this study. This is in agreement with Mat Su et al. [23] who reported that a similar MG-1 aircraft when operated over a rice paddy at 2 m application height and 1 to 2 m/s ground speed produced a uniform spray pattern with less drift potential. Similarly, Qin et al. [4] reported that an application height of 1.5 m and 5 m/s ground speed produced a uniform droplet distribution on rice paddy. Qin et al. [4] also reported that the downward air stream flow (downwash) from the RPAAS rotors probably facilitated droplet penetration into the lower rice canopy.
Many factors, including rotor downwash and the design and power ratings of the aircraft, are likely contributing to these measured differences in spray pattern uniformity and effective swath. However, some of the most important factors influencing effective swath and pattern uniformity are varying meteorological conditions, the most important of these being wind direction. Changes in wind direction during spray application passes tended to greatly affect spray pattern uniformity and the resulting effective swath. It can easily abbreviate a spray pattern and cause the material to stack on the upwind side. The result is a narrow deformed spray pattern. While these deformed patterns are unattractive on paper, their real effects in the field can be devastating. Over-application in certain areas of the field as a result of nonuniform spray patterns can end up wasting valuable products which can increase environmental loading. Under-application in areas of the field where there is not enough pattern overlap can result in loss of control of the target pest and perhaps even a buildup of target resistance to the applied chemicals due to application of sublethal doses. Additionally, from a research standpoint, the high variability in resulting effective swaths due to changing wind conditions makes it very difficult to separate out treatment differences. Conventional methods of conducting three to four spray pass replications are not adequate. Heavily replicated trials are needed to adequately separate out potential differences in effective swath due to independent operational variables such as platform, application height and ground speed. Richardson et al. [24] reported a highly variable swath pattern with large unexplained variance despite 65 flights being made with a multi-rotor MG-1 aircraft under varying ground speed, droplet size and application height. Similarly, Shilin et al. [25] studied spray deposition profiles of four UAVs with different payload capacities and found highly variable spray distribution patterns. Both Richardson et al. [24] and Shilin et al. [25] concluded that high precision and efficiency from RPAAS application systems has not yet been realized. It is well recognized that a certain number of replications must be examined on a given experimental area and date to provide an adequate estimate of sampling variance. However, available resources must be optimally allocated taking into consideration the cost of sampling in man-hours so that an accurate estimation of the coefficient of variation can be obtained.
Traditional methods of averaging multiple spray patterns for effective swath estimation may not be adequate to fully describe the variability in application rate that may exist in field scale applications. The significant differences in effective swath found between the traditional method and the new method which evaluates individual passes, points to a reevaluation of approach. The traditional method yields a wider swath, but at what cost? Further investigation will need to be conducted to characterize the efficacy of field applications under the more realistic scenario posed by the individual swath analysis technique. Richardson et al. [26,27] developed a simulation model to address deposition variability relative to underdosing or overdosing of pest control products using a conventional approach to determine effective swath pattern. Wen et al. [28] sprayed 1% fluorescent tracer solution on cotton using a quadcopter and analyzed spray pattern uniformity on paper strips using a spectrometer and found strong correlation with spray coverage and spray rate determined by WSP samplers. These approaches to swath analysis technique are useful analytical tools to help evaluate and improve swath pattern analysis for unmanned aerial vehicles.
4.2. Spray Droplet Spectra
Significant interaction between application height and ground speed relative to spray droplet parameters likely occurred due to complex aerodynamic factors related to rotor downwash from the aircraft that were outside the scope of the study. The highest Dv0.5 value of 335 µm, a medium spray droplet spectrum, was produced at 3 m height and 5 m/s ground speed by the MG-1, while the highest Dv0.5 of 225 µm, a fine spray droplet spectrum, was produced at 2 m height and 1 m/s ground speed by the V6A. Qin et al. [4] reported that when a 15 L unmanned aircraft was operated at a velocity of 5 m/s and an altitude of 1.5 m, a greater proportion of smaller droplets (50 to 100 µm) were deposited in the lower regions of the rice canopy (250 mm above ground) than when the aircraft was operated at a velocity of 3 m/s and at an altitude of 0.8 m. Lan and Chen [29] reported on optimal operational parameters for a wide variety of crops studied under varying altitude and flight speed conditions using a multitude of UAVs and found that the optimal height and speed varied from 1 to 7 m and 1.5 to 3.7 m/s, respectively. Yongjun et al. [30] flew a 10 L multi-rotor UAV and reported that the 1 m application height and 4 m/s ground speed optimized spray droplet distribution for blister stage corn, while the 2 m application height and 2 m/s ground speed were the optimal operational parameters for dough stage corn. Richardson et al. [31] reported that the percent of applied spray deposited within the swath was higher for extra coarse droplets (90%) than that for fine droplets (73%). This agrees with our research that the Dv0.5 droplets increased with spray efficiency for both MG-1 and V6A aircraft, although the relationship was weaker for the V6A model. These data appear to suggest that although specific combinations of application height and ground speed produced desired outcomes as reported by other researchers, whether it be canopy penetration, increased deposition or a large effective swath, more data are needed to unravel the complexity of the relationships between different variables, which is beyond the scope of this study.
Compared to the estimation of spray droplet spectra in a controlled environment like the wind tunnel, WSP sampling is usually conducted under field conditions where the vagaries of weather play a major role on spray deposition. Kirk et al. [32] reported that aerially applied larger droplets are primarily under the influence of gravity, while smaller droplets are more influenced by wind and wind turbulence and that the interactions of these phenomena with spray droplets are probably responsible for the collection efficiency of spray deposits on artificial collectors. Also, spray droplets <50 µm in diameter do not make a measurable stain on WSP samplers because they lack adequate moisture and weight to generate the stain [17]. Furthermore, the spray droplets that make a stain on WSP cards do not represent actual droplet diameters as the stain expands once it contacts the WSPs and thus a spread factor based on empirical testing must be applied to the data to obtain the actual droplet size. Smaller droplets on WSP samplers can be completely masked by larger droplets, and the scanning software must be able to recognize at least 1/3rd of the droplet to correctly identify it. Droplet masking is more severe with heavier application rates [33]. The factors discussed here may help explain the difference in droplet spectra measurements between the laser and WSP data.
The spray droplet spectra were relatively small for both the MG-1 and V6A aircraft and would have a relatively high drift potential compared to other nozzles. Although we did not investigate the drift potential of spray droplets, research data obtained from computer modeling and field experiments under varied environmental conditions indicated that spray droplets in this range that are less than 200 μm have a higher drift potential than larger droplets, with the smaller droplets having the greatest potential to drift [34,35,36,37,38,39]. While the nozzles tested in this study were original equipment manufacturer (OEM) nozzles, other nozzles, with a lower drift potential, could be installed by users to obtain a larger, less-driftable spray droplet spectrum.
5. Conclusions
The results of this study describe the effects of application height and ground speed on spray pattern uniformity, effective swath and droplet spectra characteristics for two remotely piloted aerial application systems. Application height significantly influenced effective swath for the MG-1 but not for the V6A. Ground speed did not significantly influence effective swath for either aircraft model. The 3 m application height at 5 m/s ground speed yielded the largest Dv0.5 spray for the MG-1, while 2 m application height and 1 m/s ground speed resulted in a similar result for the V6A aircraft. The differences in effective swath between these two RPAASs reveal that besides operational protocols, rotor downwash and the design and power ratings of each of these vehicles likely will impact the performance and efficiency of these aerial spray application systems. Traditional methods of spray pattern analysis need to be revisited as they may overestimate an effective swath that will produce uniform spray patterns for maximum chemical efficacy.
Author Contributions
Conceptualization, D.E.M., W.E.W., and methodology, D.E.M., W.E.W., M.A.L.; and formal analysis, M.A.L.; writing—original draft preparation, D.E.M., M.A.L.; writing—review and editing, D.E.M., W.E.W., M.A.L. In addition, all authors approve the submitted version; and agree to be personally accountable for the submitted contributions.
Funding
This research received no external funding.
Acknowledgments
The authors would like to thank the University of Nebraska-Lincoln Agricultural Research Division and the Daugherty Water for Food Global Institute for their support of this project. In addition, they would like to thank Phil Jank with the USDA-ARS Aerial Application Technology Research Unit for his assistance collecting string data and Greg Kruger with the Department of Agronomy and Horticulture at the University of Nebraska-Lincoln for conducting the wind tunnel analyses.
Disclaimer
Mention of trade names or commercial products in this article is solely for the purpose of providing specific information and does not imply recommendation or endorsement by the U. S. Department of Agriculture.
Conflicts of Interest
The authors declare no conflict of interest.
References
- Baluja, J.; Diago, M.P.; Balda, P.; Zorer, R.; Meggio, F.; Morales, F.; Tardaguila, J. Assessment of vineyard water status variability by thermal and multispectral imagery using an unmanned aerial vehicle (uav). Irrig. Sci. 2012, 30, 511–522. [Google Scholar]
- Ge, Y.; Thomasson, J.A.; Sui, R. Remote sensing of soil properties in precision agriculture: A review. Front. Earth Sci. 2011, 5, 229–238. [Google Scholar] [CrossRef]
- Saari, H.; Pellikka, I.; Pesonen, L.; Tuominen, S.; Heikkilä, J.; Holmlund, C.; Mäkynen, J.; Ojala, K.; Antila, T. Unmanned aerial vehicle (uav) operated spectral camera system for forest and agriculture applications. In Remote Sensing for Agriculture, Ecosystems, and Hydrology XIII; International Society for Optics and Photonics; SPIE: Bellingham, WA, USA, 2011; p. 81740H. [Google Scholar]
- Qin, W.-C.; Qiu, B.-J.; Xue, X.-Y.; Chen, C.; Xu, Z.-F.; Zhou, Q.-Q. Droplet deposition and control effect of insecticides sprayed with an unmanned aerial vehicle against plant hoppers. Crop Prot. 2016, 85, 79–88. [Google Scholar]
- Qin, W.; Xue, X.; Zhang, S.; Gu, W.; Wang, B. Droplet deposition and efficiency of fungicides sprayed with small uav against wheat powdery mildew. Int. J. Agric. Biol. Eng. 2018, 11, 27–32. [Google Scholar] [CrossRef]
- Xue, X.; Qin, W.; Sun, Z.; Zhang, S.; Zhou, L.; Wu, P. Effects of n-3 uav spraying methods on the efficiency of insecticides against planthoppers and cnaphalocrocis medinalis. Acta Phyophylacica Sin. 2013, 40, 273–278. [Google Scholar]
- Faithpraise, F.; Idung, J.; Chatwin, C.; Young, R.; Birch, P. Modelling the control of african armyworm (spodoptera exempta) infestations in cereal crops by deploying naturally beneficial insects. Biosys. Eng. 2015, 129, 268–276. [Google Scholar]
- Ansley, R.J.; Ansley, R.J.; Jones, D.L.; Jacoby, P.W.; Kramp, B.A.; Pinchak, W.E.; Teague, W.R. Long-term grass yields following chemical control of honey mesquite. J. Range Manag. 2004, 57, 49–57. [Google Scholar]
- Zhang, Y.; Li, Y.; He, Y.; Liu, F.; Cen, H.; Fang, H. Near ground platform development to simulate uav aerial spraying and its spraying test under different conditions. Comput. Electron. Agric. 2018, 148, 8–18. [Google Scholar]
- Martinez-Guanter, J.; Agüera, P.; Agüera, J.; Pérez-Ruiz, M. Spray and economics assessment of a uav-based ultra-low-volume application in olive and citrus orchards. Precis. Agric. 2019. [Google Scholar] [CrossRef]
- Hunter, J.E., III; Gannon, T.W.; Richardson, R.J.; Yelverton, F.H.; Leon, R.G. Integration of remote-weed mapping and an autonomous spraying unmanned aerial vehicle for site-specific weed management. Pest Manag. Sci. 2019. [Google Scholar] [CrossRef]
- Woldt, W.; Martin, D.; Latheef, M.; Kruger, G.; Wright, R.; McMechan, J.; Proctor, C.; Jackson-Ziems, T. Field evaluation of commercially available small unmanned aircraft crop spray systems. In 2018 ASABE Annual International Meeting; American Society of Agricultural and Biological Engineers: St. Joseph, MI, USA, 2018; pp. 1–15. [Google Scholar]
- Grift, T.; Walker, J.; Gardisser, D. Spread pattern analysis tool (spat): II. Examples of aircraft pattern analysis. Trans. ASAE 2000, 43, 1351. [Google Scholar] [CrossRef][Green Version]
- Carpenter, T.G.; Reichard, D.L.; Khan, A.S. Spray deposition from a row-crop airblast sprayer. Trans. ASAE 1983, 26, 338. [Google Scholar]
- Whitney, R.W.; Gardisser, D.R. Dropletscan Operators Manual; WRK of Oklahoma and WRK of Arkansas: Stillwater, OK, USA, 2003. [Google Scholar]
- ASABE. Spray Nozzle Classification by Droplet Spectra; ASABE: St. Joseph, MI, USA, 2018. [Google Scholar]
- Hoffmann, W.C.; Kirk, I.W. Comparison of three imaging systems for water-sensitive papers. Appl. Eng. Agric. 2005, 21, 961–964. [Google Scholar] [CrossRef]
- Fritz, B.K.; Hoffmann, W.C. Measuring spray droplet size from agricultural nozzles using laser diffraction. J. Vis. Exp. 2016, 16, e54533. [Google Scholar] [CrossRef] [PubMed]
- SAS. SAS Version 9.4; SAS Institute. Inc.: Cary, NC, USA, 2012. [Google Scholar]
- Saxton, A. User’s Guide for Design and Analysis: Sas Macro Collection Danda.Sas.; University of Tennessee: Knoxville, TN, USA, 2012. [Google Scholar]
- SAS. Jmp® 14; SAS Institute Inc.: Cary, NC, USA, 2018. [Google Scholar]
- Giles, D.; Billing, R. Deployment and performance of a uav for crop spraying. Chem. Eng. Trans. 2015, 44, 307–312. [Google Scholar]
- Mat Su, A.; Yahya, A.; Mazlan, N.; Hamdani, M.S.A. Evaluation of the spraying dispersion and uniformity using drone in rice field application. In Proceedings of the 2018 Msae Conference, at Faculty of Engineering, Universiti Putra Malaysia, Selangor, Malaysia, 7–8 February 2018; pp. 1–4. [Google Scholar]
- Richardson, B.; Rolando, C.A.; Somchit, C.; Dunker, C.; Strand, T.M.; Kimberley, M.O. Swath pattern analysis from a multi-rotor unmanned aerial vehicle configured for pesticide application. Pest Manag. Sci. 2019. [Google Scholar] [CrossRef]
- Shilin, W.; Jianli, S.; Xiongkui, H.; Le, S.; Xiaonan, W.; Changling, W.; Zhichong, W.; Yun, L. Performances evaluation of four typical unmanned aerial vehicles used for pesticide application in china. Int. J. Agric. Biol. Eng. 2017, 10, 22–31. [Google Scholar] [CrossRef]
- Richardson, B.; Kimberley, M.; Gous, S. Aircraft calibration for pest eradication operations using pesticides formulated as solid baits. Trans. ASABE 2011, 54, 1245–1254. [Google Scholar] [CrossRef]
- Richardson, B.; Kimberley, M.O.; Schou, W.C. Defining acceptable levels of herbicide deposit variation from aerial spraying. Appl. Eng. Agric. 2004, 20, 259–267. [Google Scholar]
- Wen, Y.; Zhang, R.; Chen, L.; Huang, Y.; Yi, T.; Xu, G.; Li, L.; Hewitt, A.J. A new spray deposition pattern measurement system based on spectral analysis of a fluorescent tracer. Comput. Electron. Agric. 2019, 160, 14–22. [Google Scholar]
- Lan, Y.; Chen, S. Current status and trends of plant protection uav and its spraying technology in china. Int. J. Precis. Agric. Aviat. 2018, 1, 1–9. [Google Scholar] [CrossRef]
- Yongjun, Z.; Shenghui, Y.; Chunjiang, Z.; Liping, C.; Lan, Y.; Yu, T. Modelling operation parameters of uav on spray effects at different growth stages of corns. Int. J. Agric. Biol. Eng. 2017, 10, 57–66. [Google Scholar]
- Richardson, B.; Rolando, C.A.; Kimberley, M.O.; Strand, T.M. Spray application efficiency from a multi-rotor unmanned aerial vehicle configured for aerial pesticide application. Trans. ASABE 2019. [Google Scholar] [CrossRef]
- Kirk, I.W.; Bouse, L.F.; Carlton, J.B.; Franz, E.; Stermer, R.A. Aerial spray deposition in cotton. Trans. ASAE 1992, 35, 1393–1399. [Google Scholar] [CrossRef]
- Williams, W.; Gardisser, D.; Wolf, R.; Whitney, R. Field and Wind Tunnel Droplet Spectrum Data for the cp Nozzle; Paper No. AA99-007; American Society of Agricultural Engineers/National Agricultural Aviation Association: Reno, NV, USA, 1999. [Google Scholar]
- Zabkiewicz, J. Adjuvants and herbicidal efficacy-present status and future prospects. Weed Res. Oxf. 2000, 40, 139–149. [Google Scholar] [CrossRef]
- Elsik, C.M.; Stridde, H.M.; Schweiner, T.M. Spray drift reduction technology adjuvant evaluation. ASTM Int. 2010, 7, 1–19. [Google Scholar] [CrossRef]
- Hewitt, A.J.; Johnson, D.R.; Fish, J.D.; Hermansky, C.G.; Valcore, D.L. Development of the spray drift task force database for aerial applications. Environ. Toxicol. Chem. 2002, 21, 648–658. [Google Scholar] [CrossRef]
- Teske, M.; Thistle, H.; Mickle, R. Modeling finer droplet aerial spray drift and deposition. Appl. Eng. Agric. 2000, 16, 351–357. [Google Scholar] [CrossRef]
- Downer, R.; Wolf, T.; Chapple, A.; Hall, F.; Hazen, J. Characterizing the impact of drift management adjuvants on the dose transfer process; Proc. Fourth Int. Symp. on Adjuvants for Agrochemicals: Rotorua, New Zealand, 1995. [Google Scholar]
- Hoffmann, W.C.; Fritz, B.K.; Thornburg, J.W.; Bagley, W.; Birchfield, N.B.; Ellenberger, J. Spray Drift Reduction Evaluations of Spray Nozzles Using a Standardized Testing Protocol; DTIC Document: Fort Belvoir, VA, USA, 2010. [Google Scholar]
© 2019 by the authors. Licensee MDPI, Basel, Switzerland. This article is an open access article distributed under the terms and conditions of the Creative Commons Attribution (CC BY) license (http://creativecommons.org/licenses/by/4.0/).