Thermal Infrared and Visual Inspection of Photovoltaic Installations by UAV Photogrammetry—Application Case: Morocco


Abstract
1. Introduction
2. PV Technology: Brief Overview, Common Defects and Inspection Techniques
2.1. Brief Overview
2.2. PV Defects
2.2.1. Mismatches
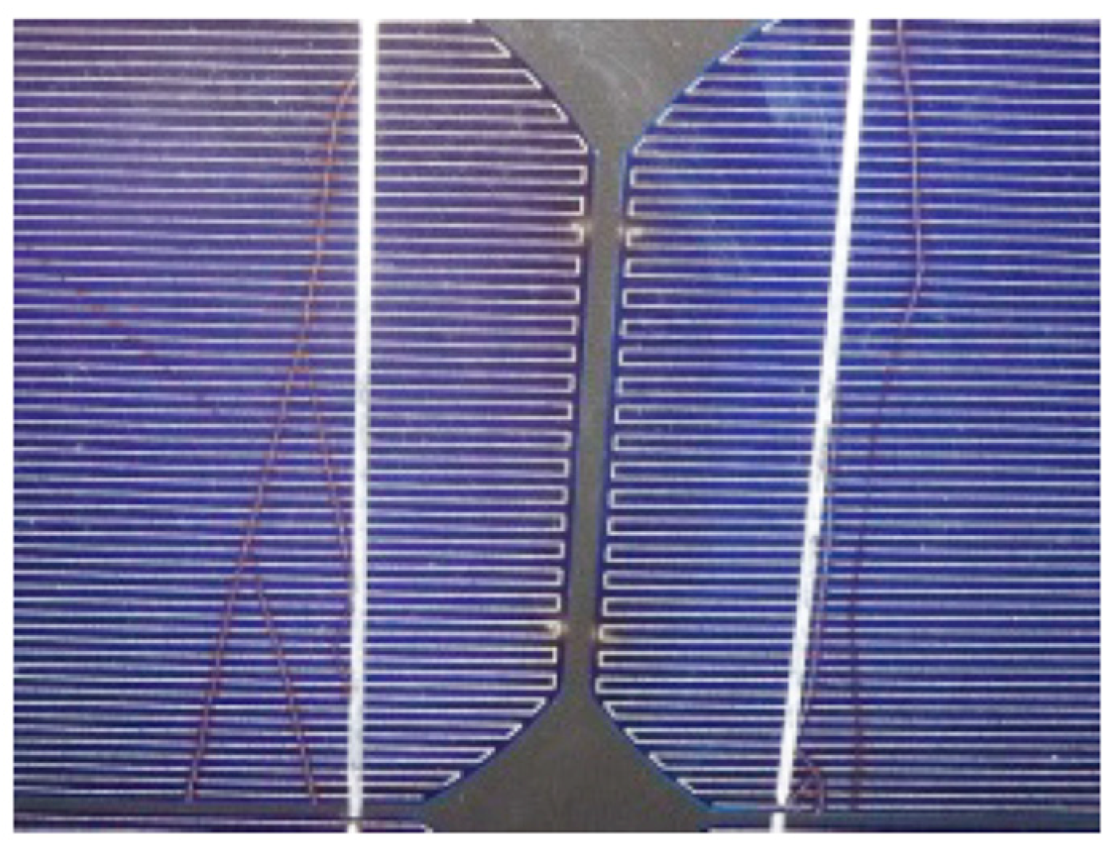
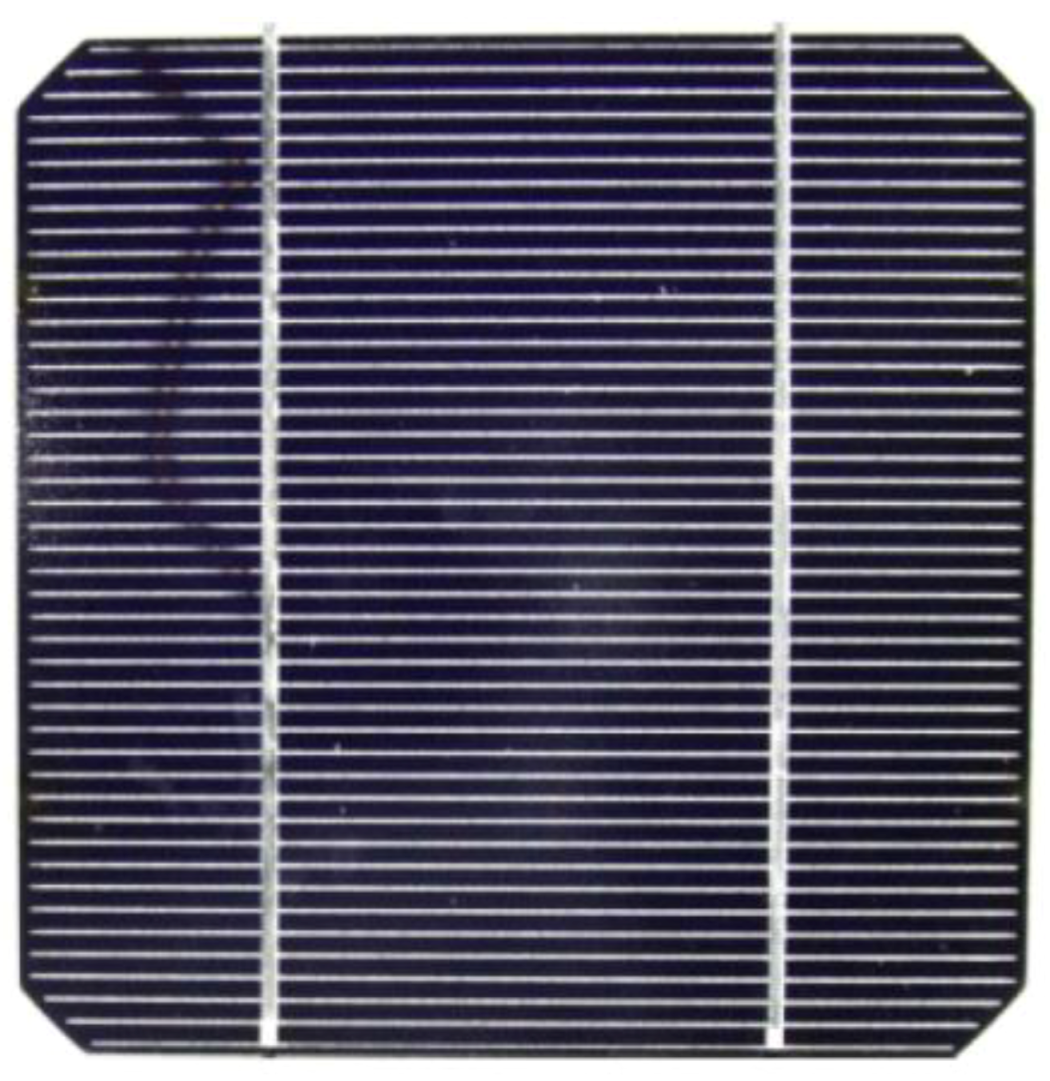
2.2.2. Cracks
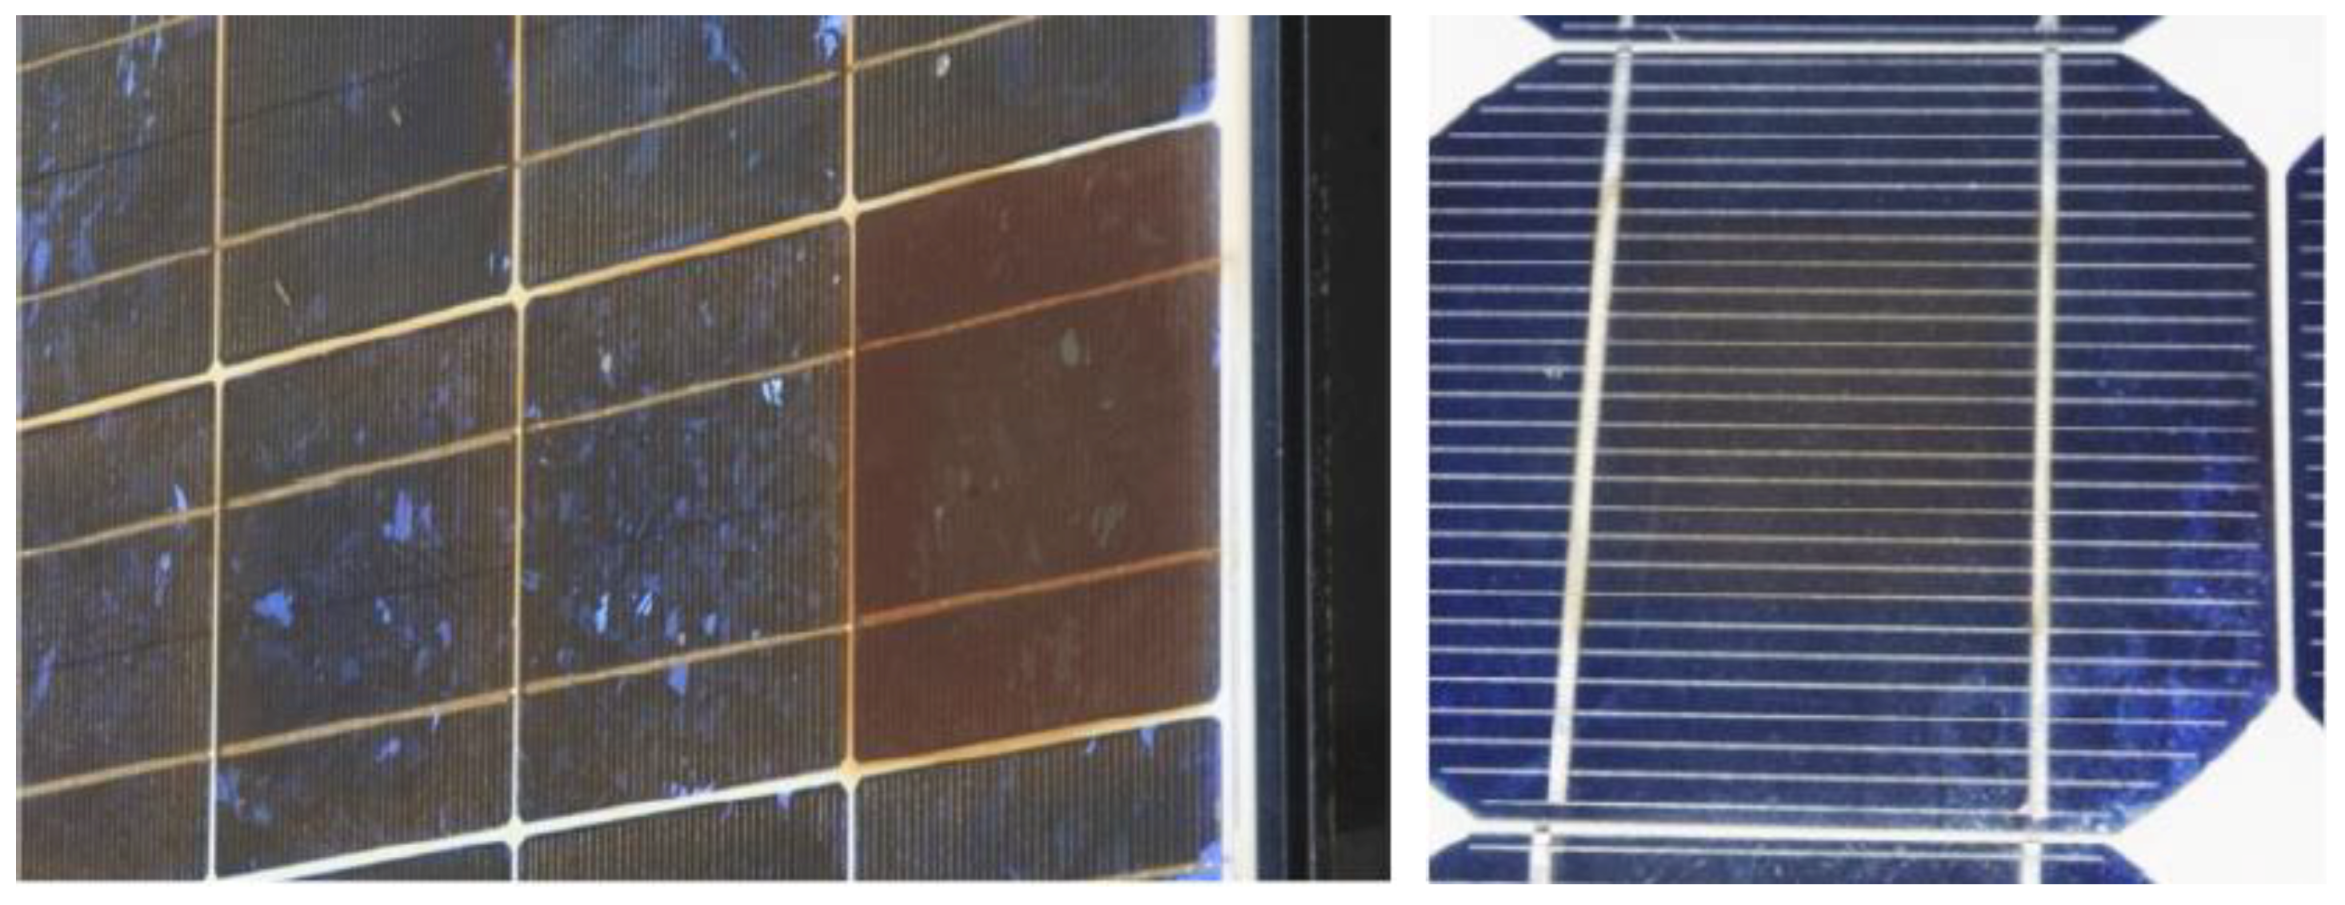
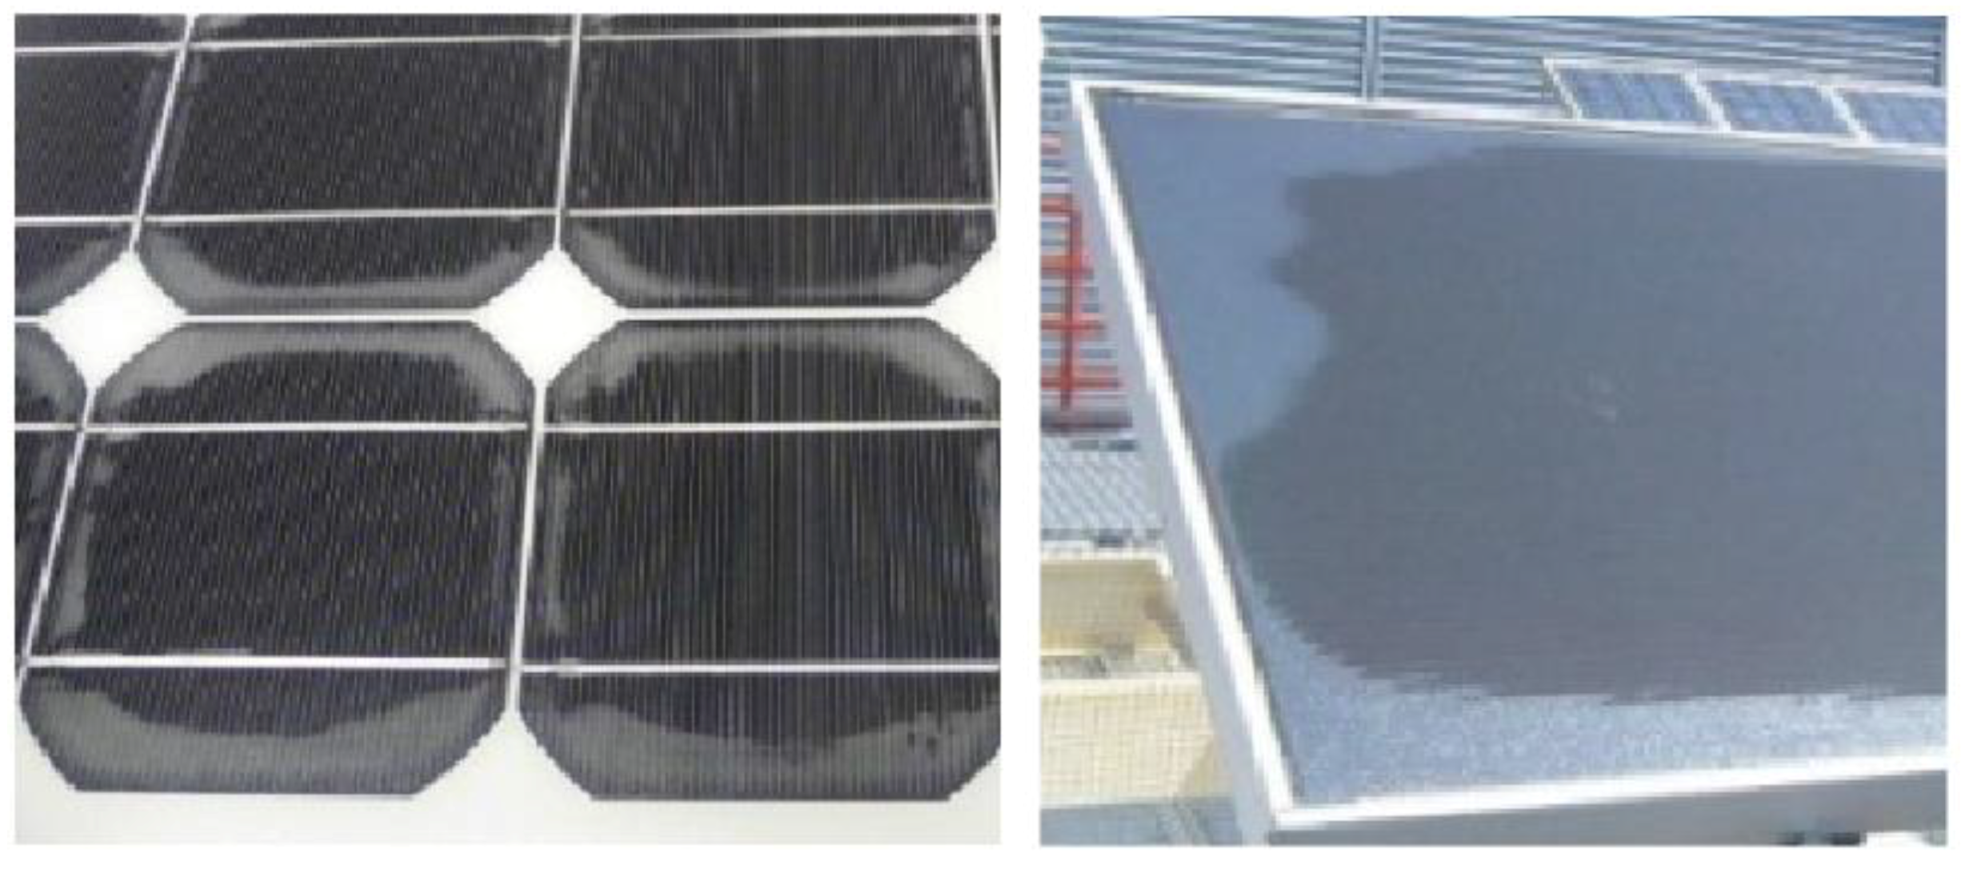
2.2.3. Discolorations
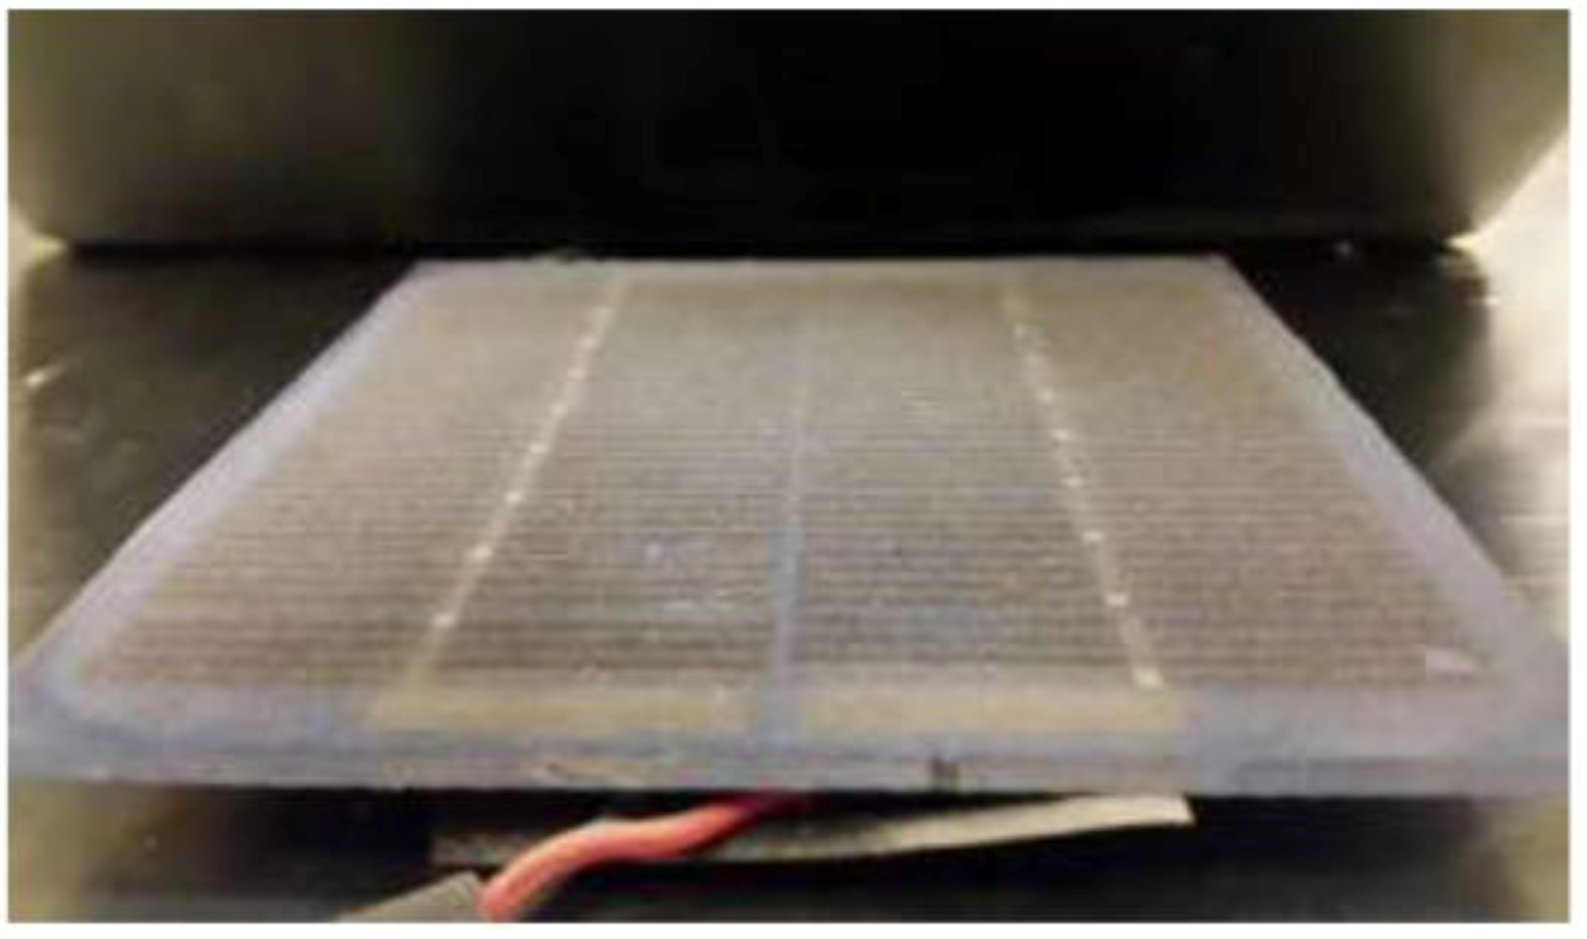
2.2.4. Soiling
2.2.5. Delaminations
2.2.6. Snail Trails/Tracks
2.3. Common PV Inspection Techniques
2.3.1. Visual Inspection
2.3.2. I-V Measurements
2.3.3. Electroluminescence
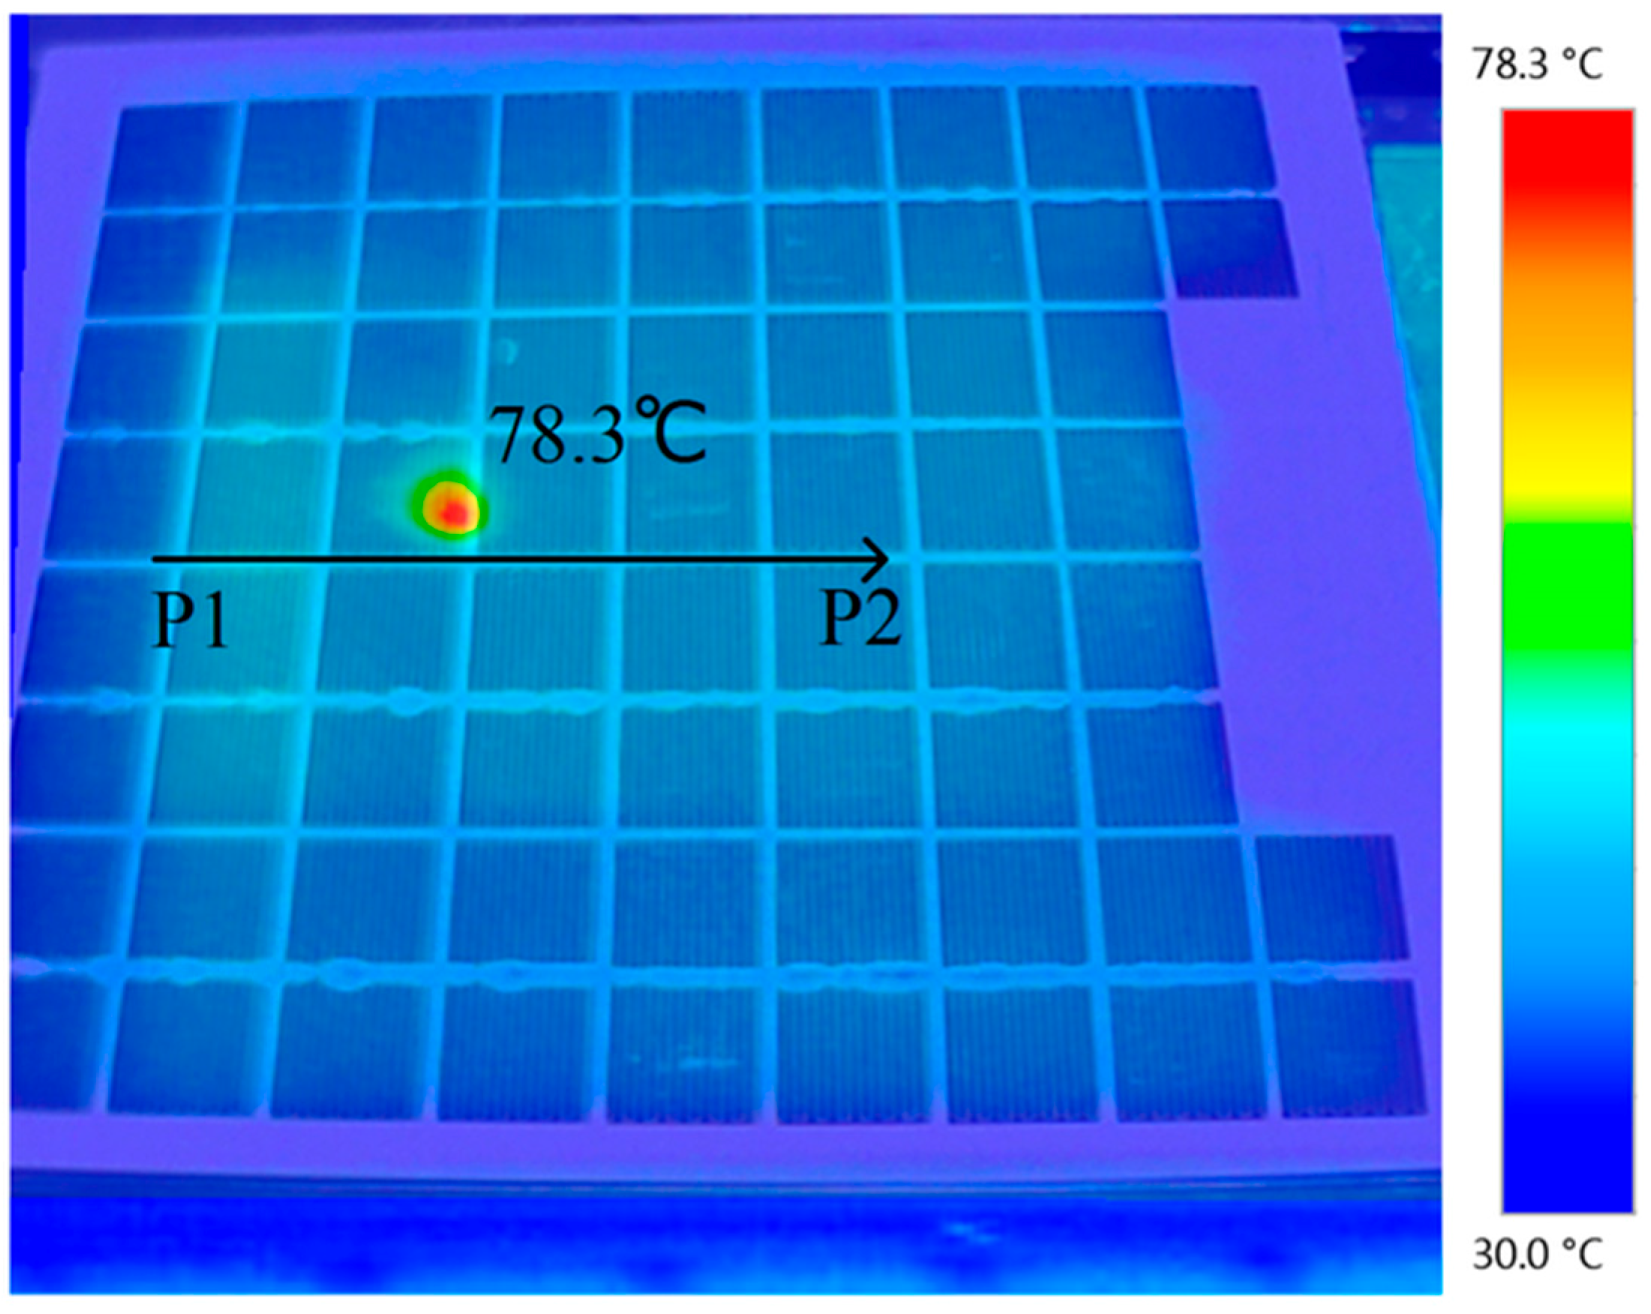
2.3.4. Infrared Thermography
3. UAV for PV Inspection
4. Experimental Study
- acquisition of thermal and visual images for the installations to inspect;
- image processing in order to generate thermal and visual orthomosaics;
- investigation of generated orthomosaics to detect and locate present defects;
- validation of detected defects; and,
- proposition, test, and validation of an automatic hotspots extraction method.
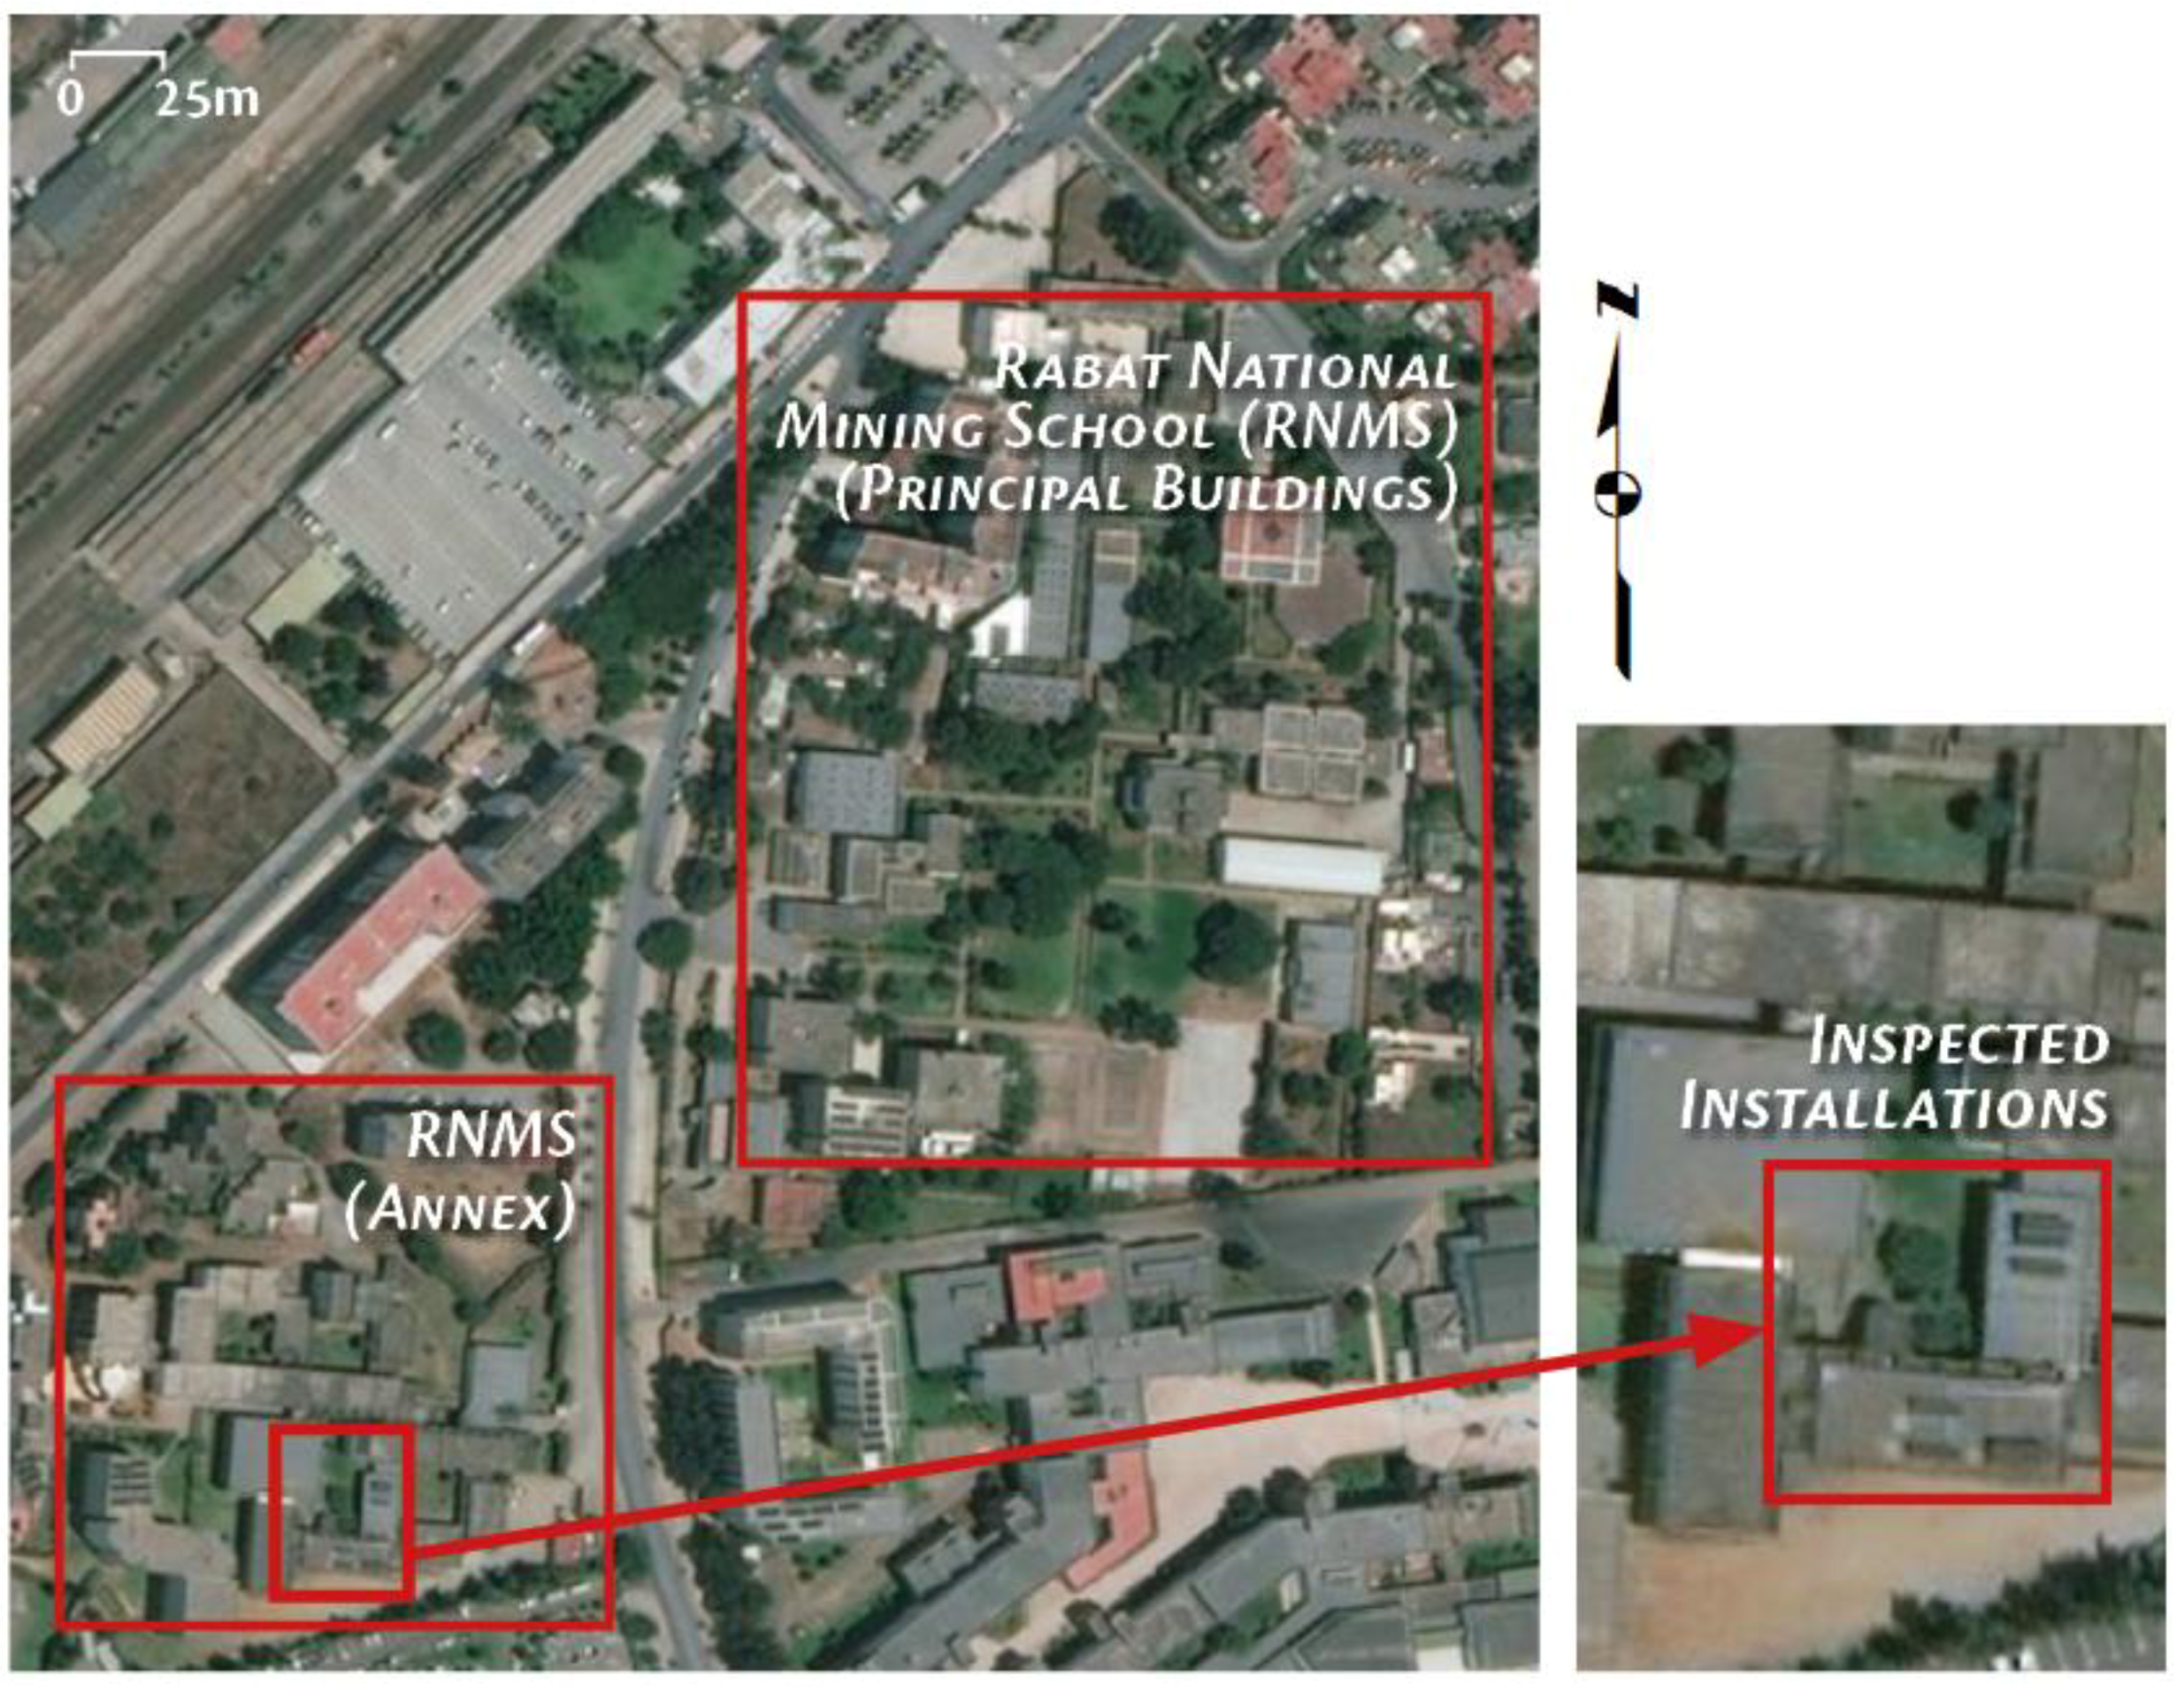
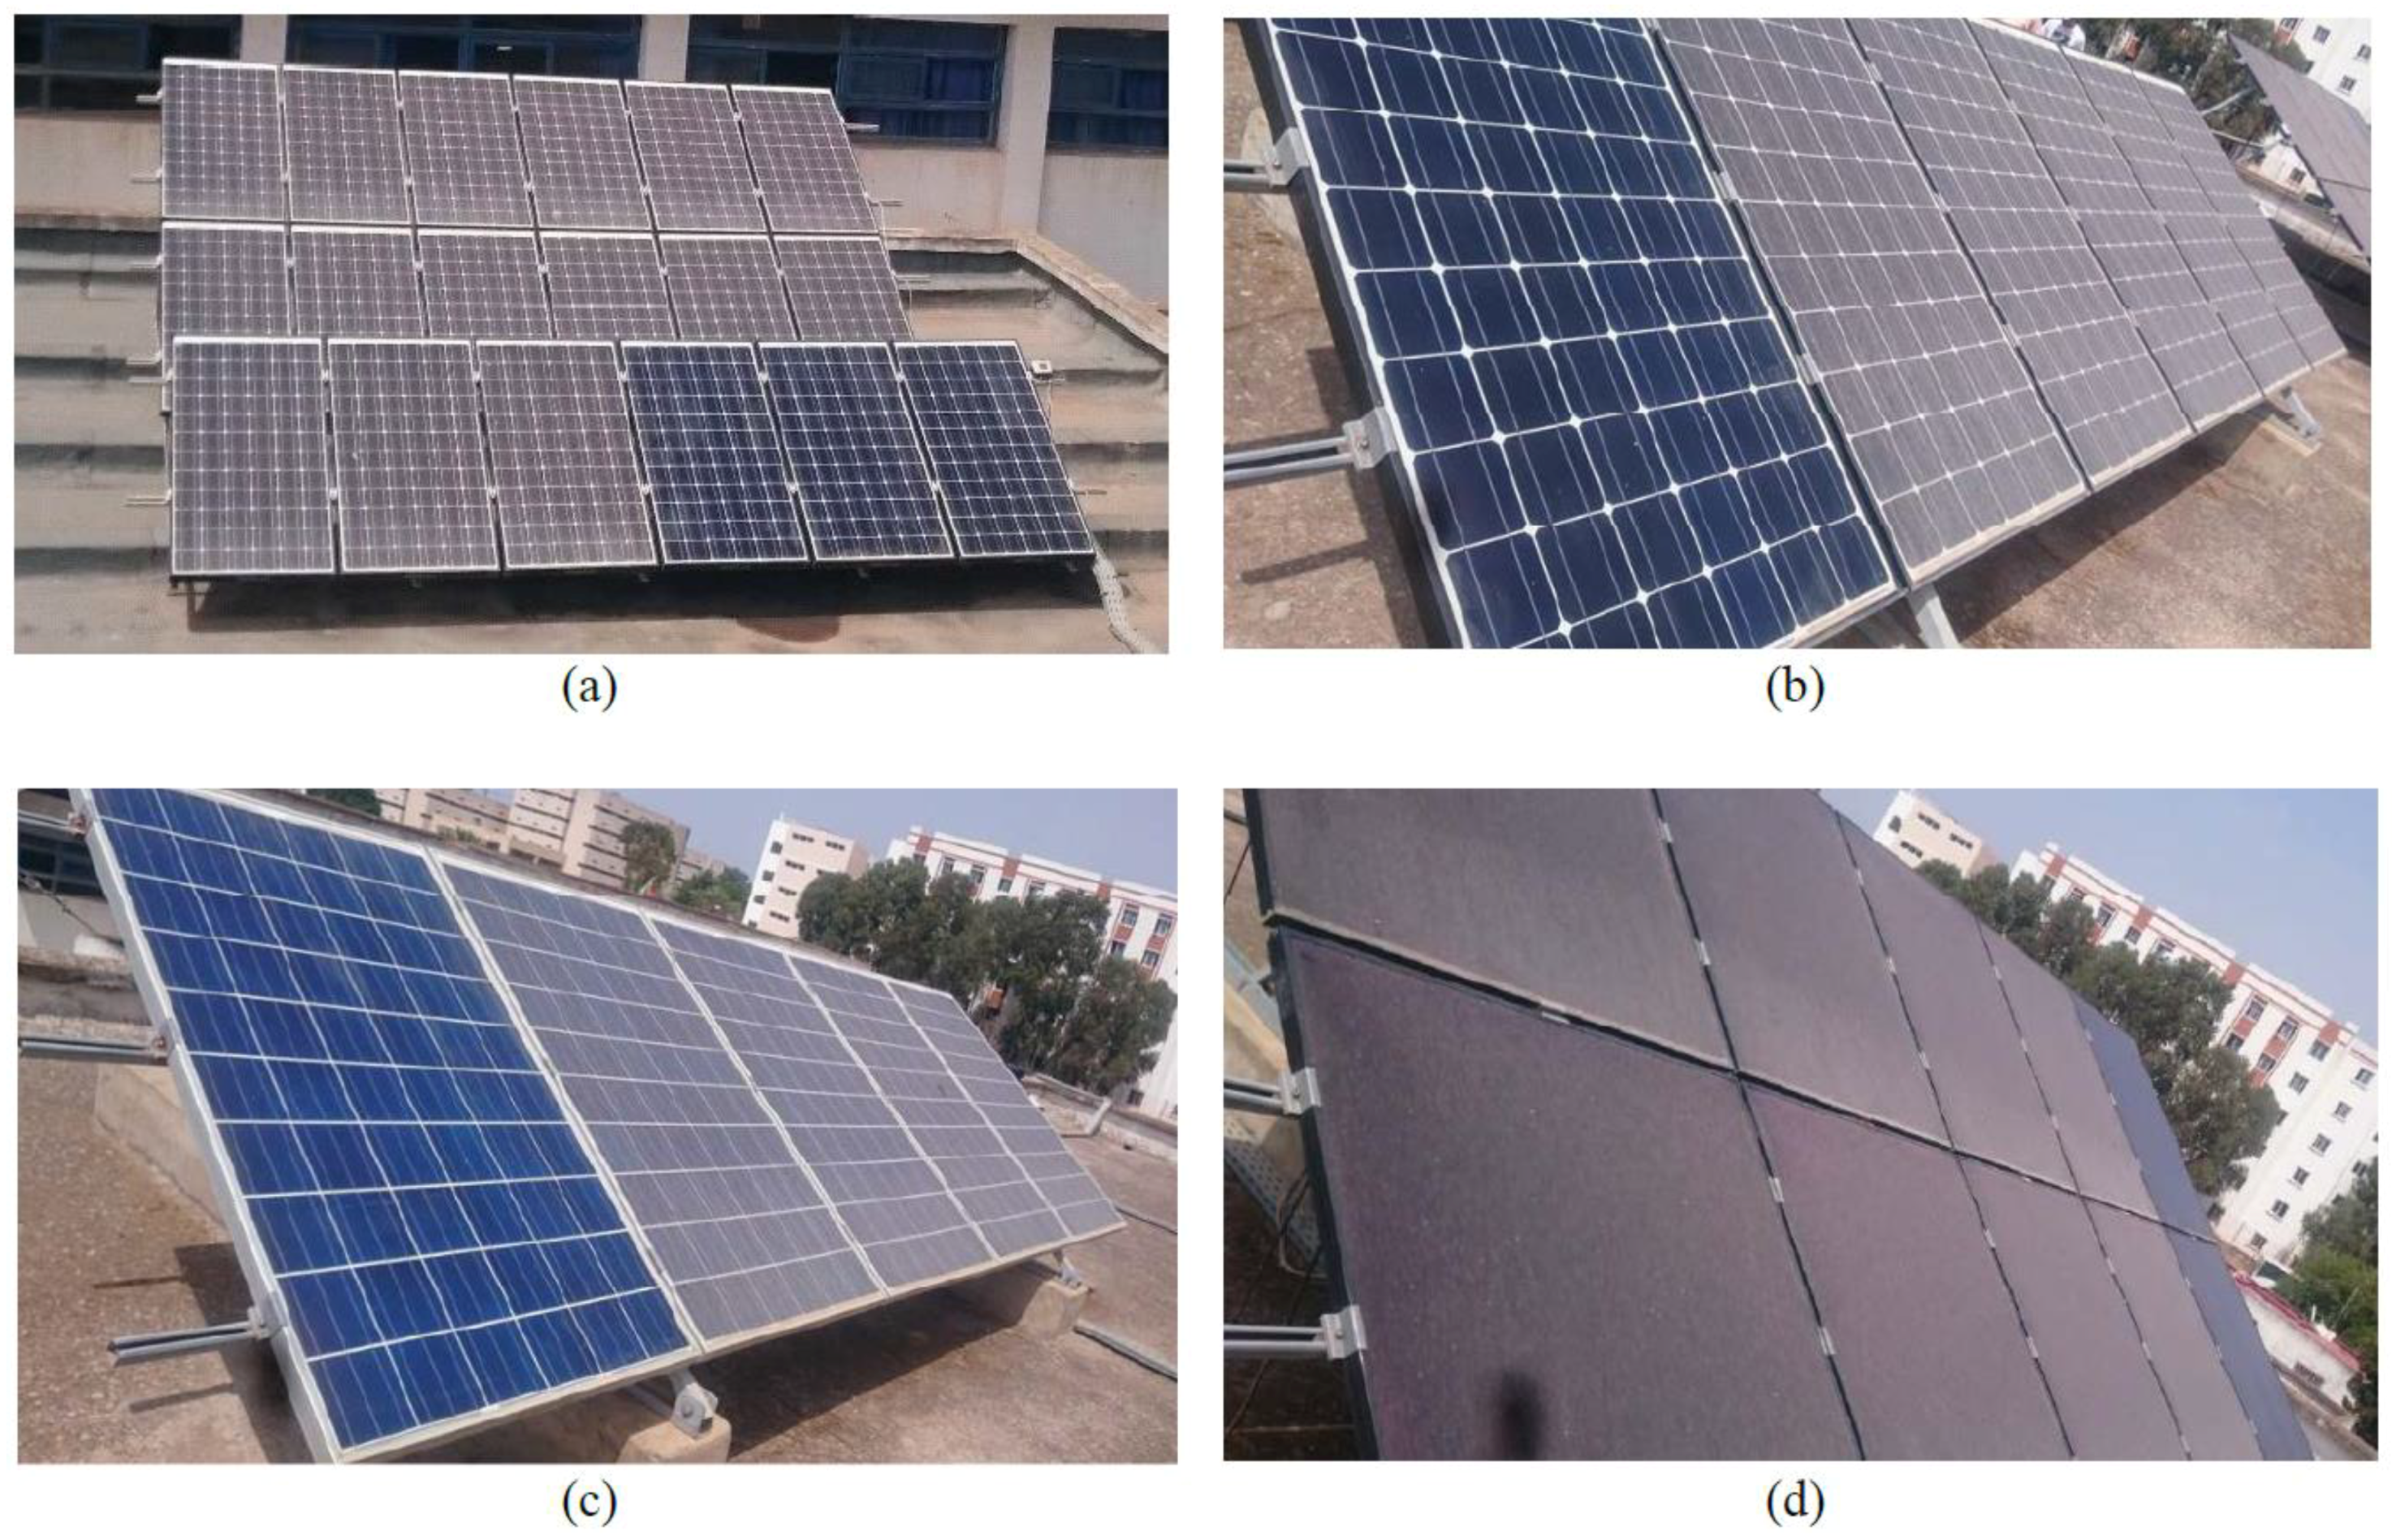
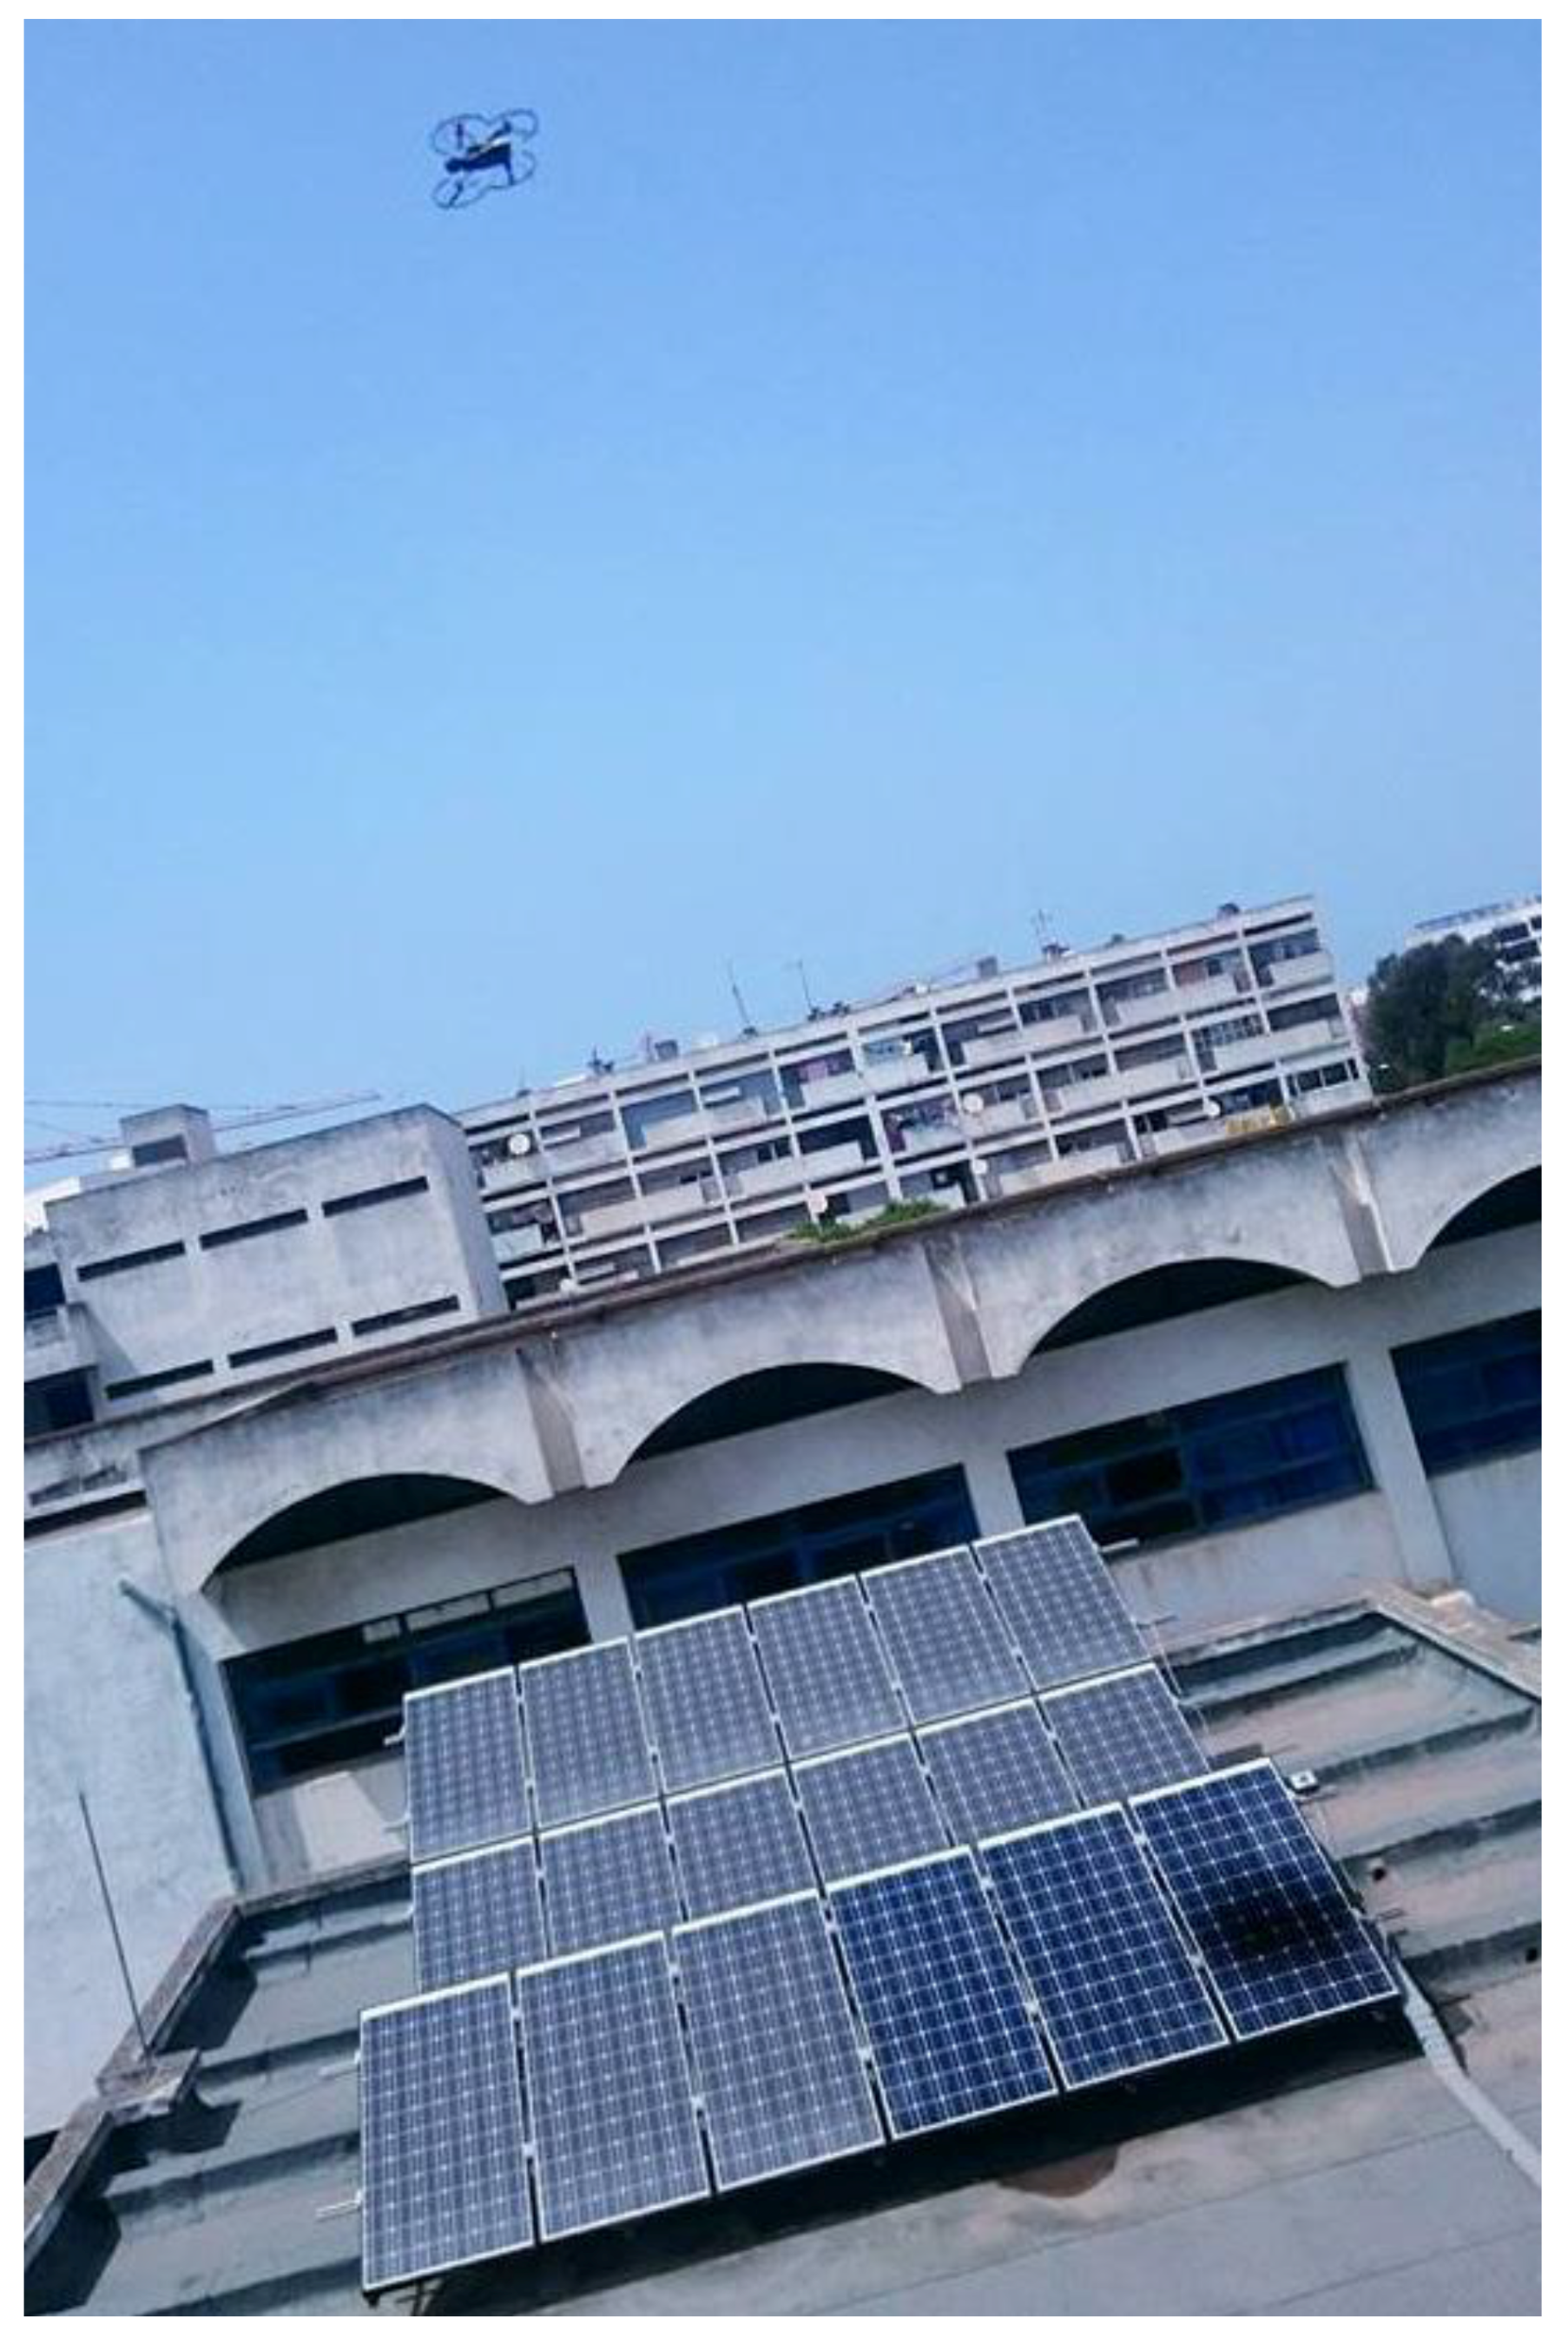
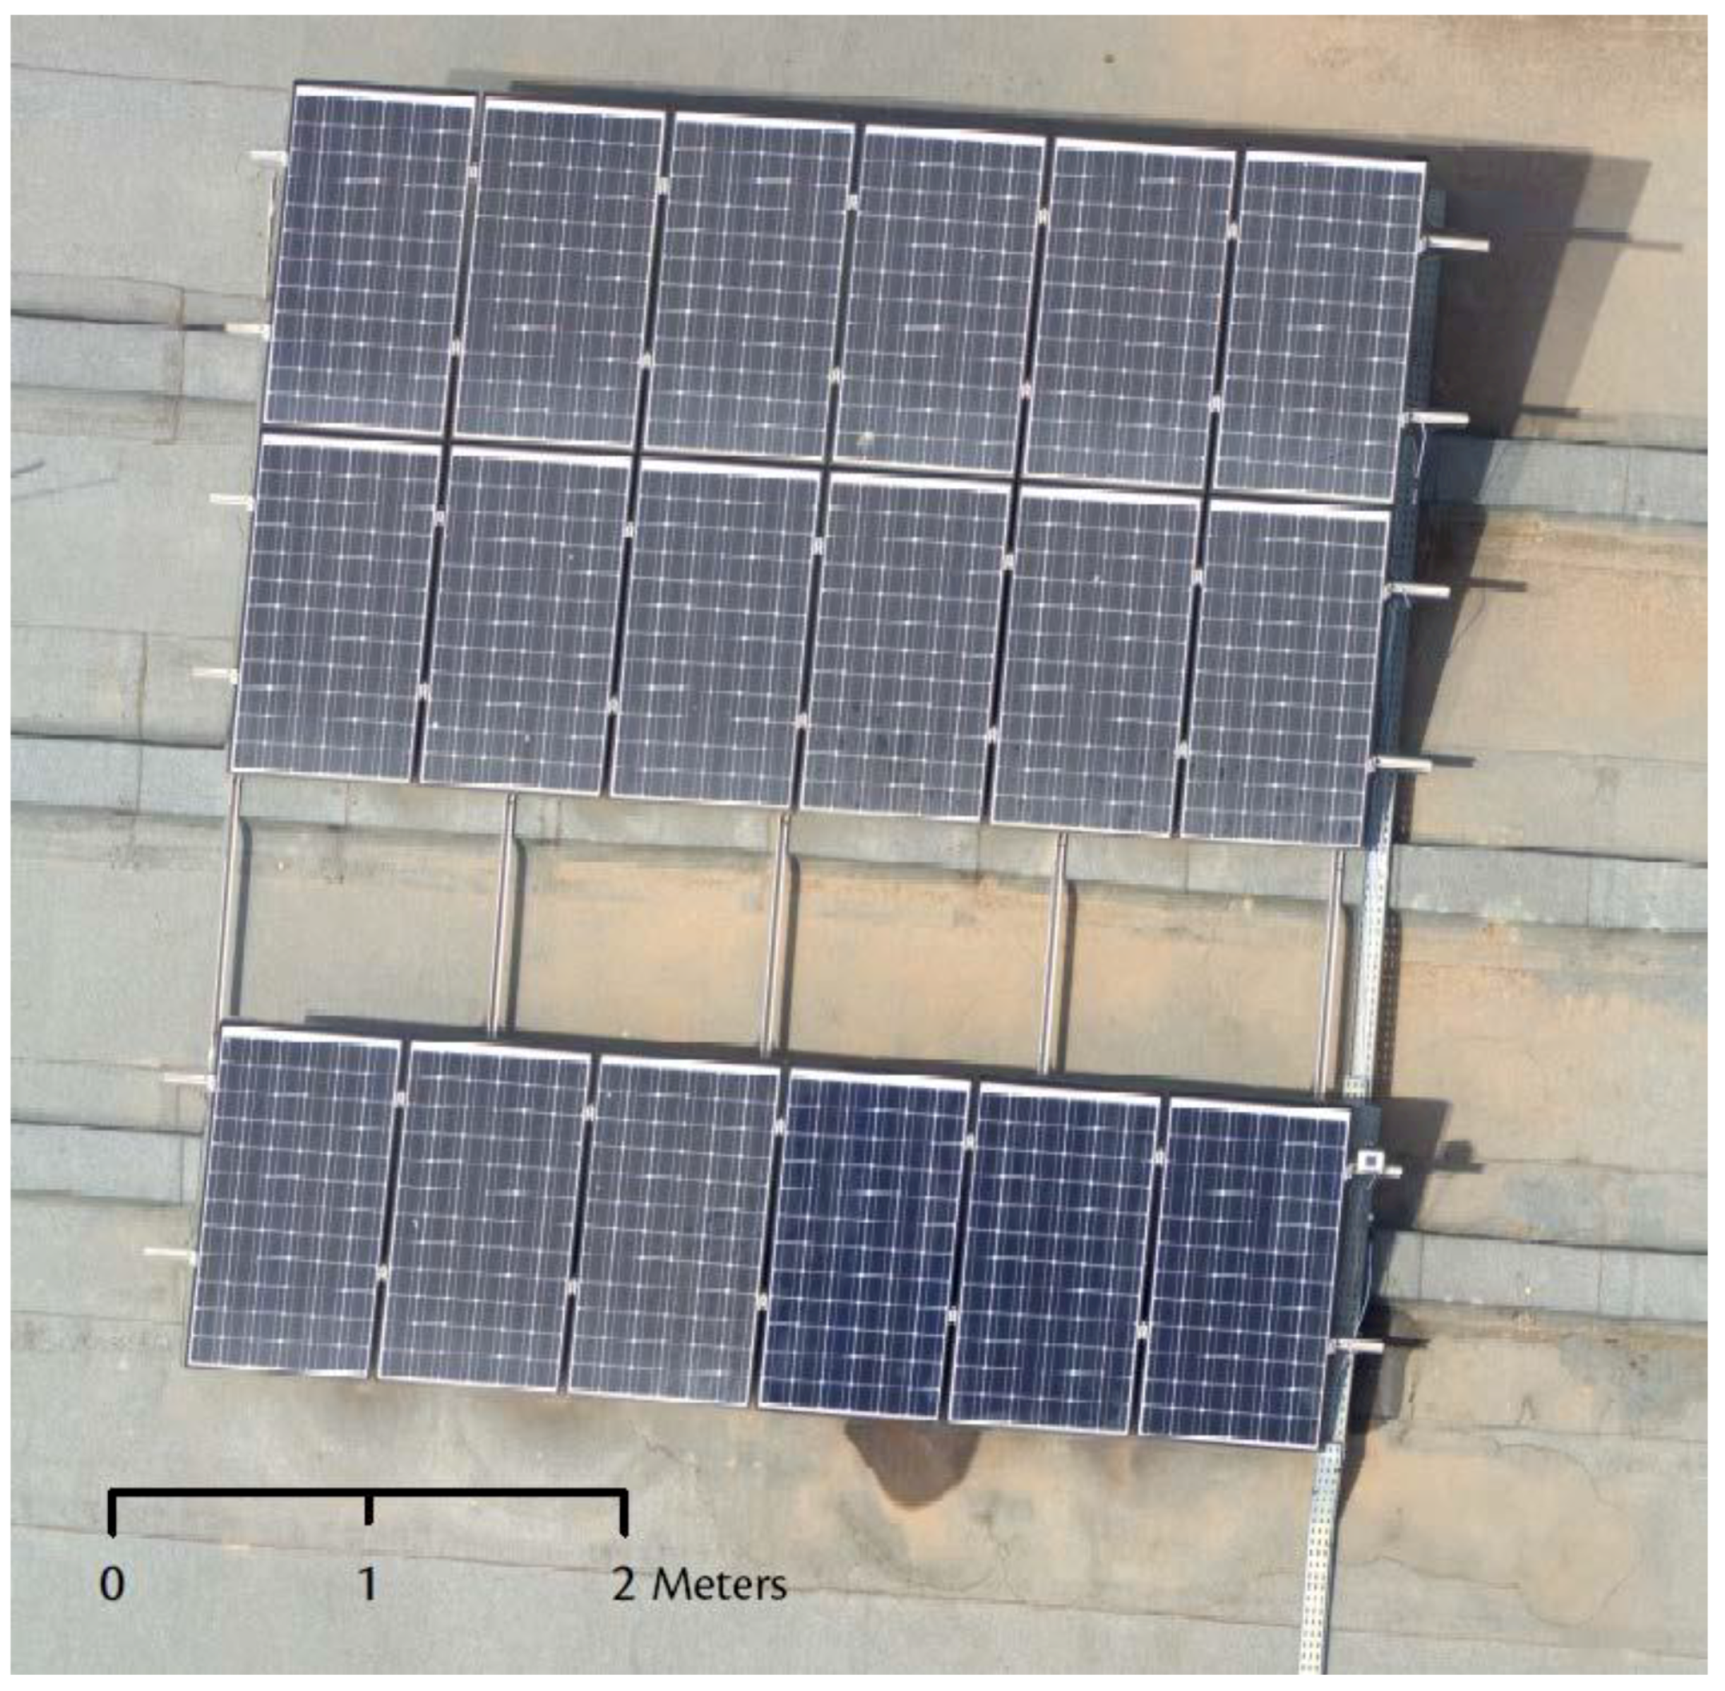
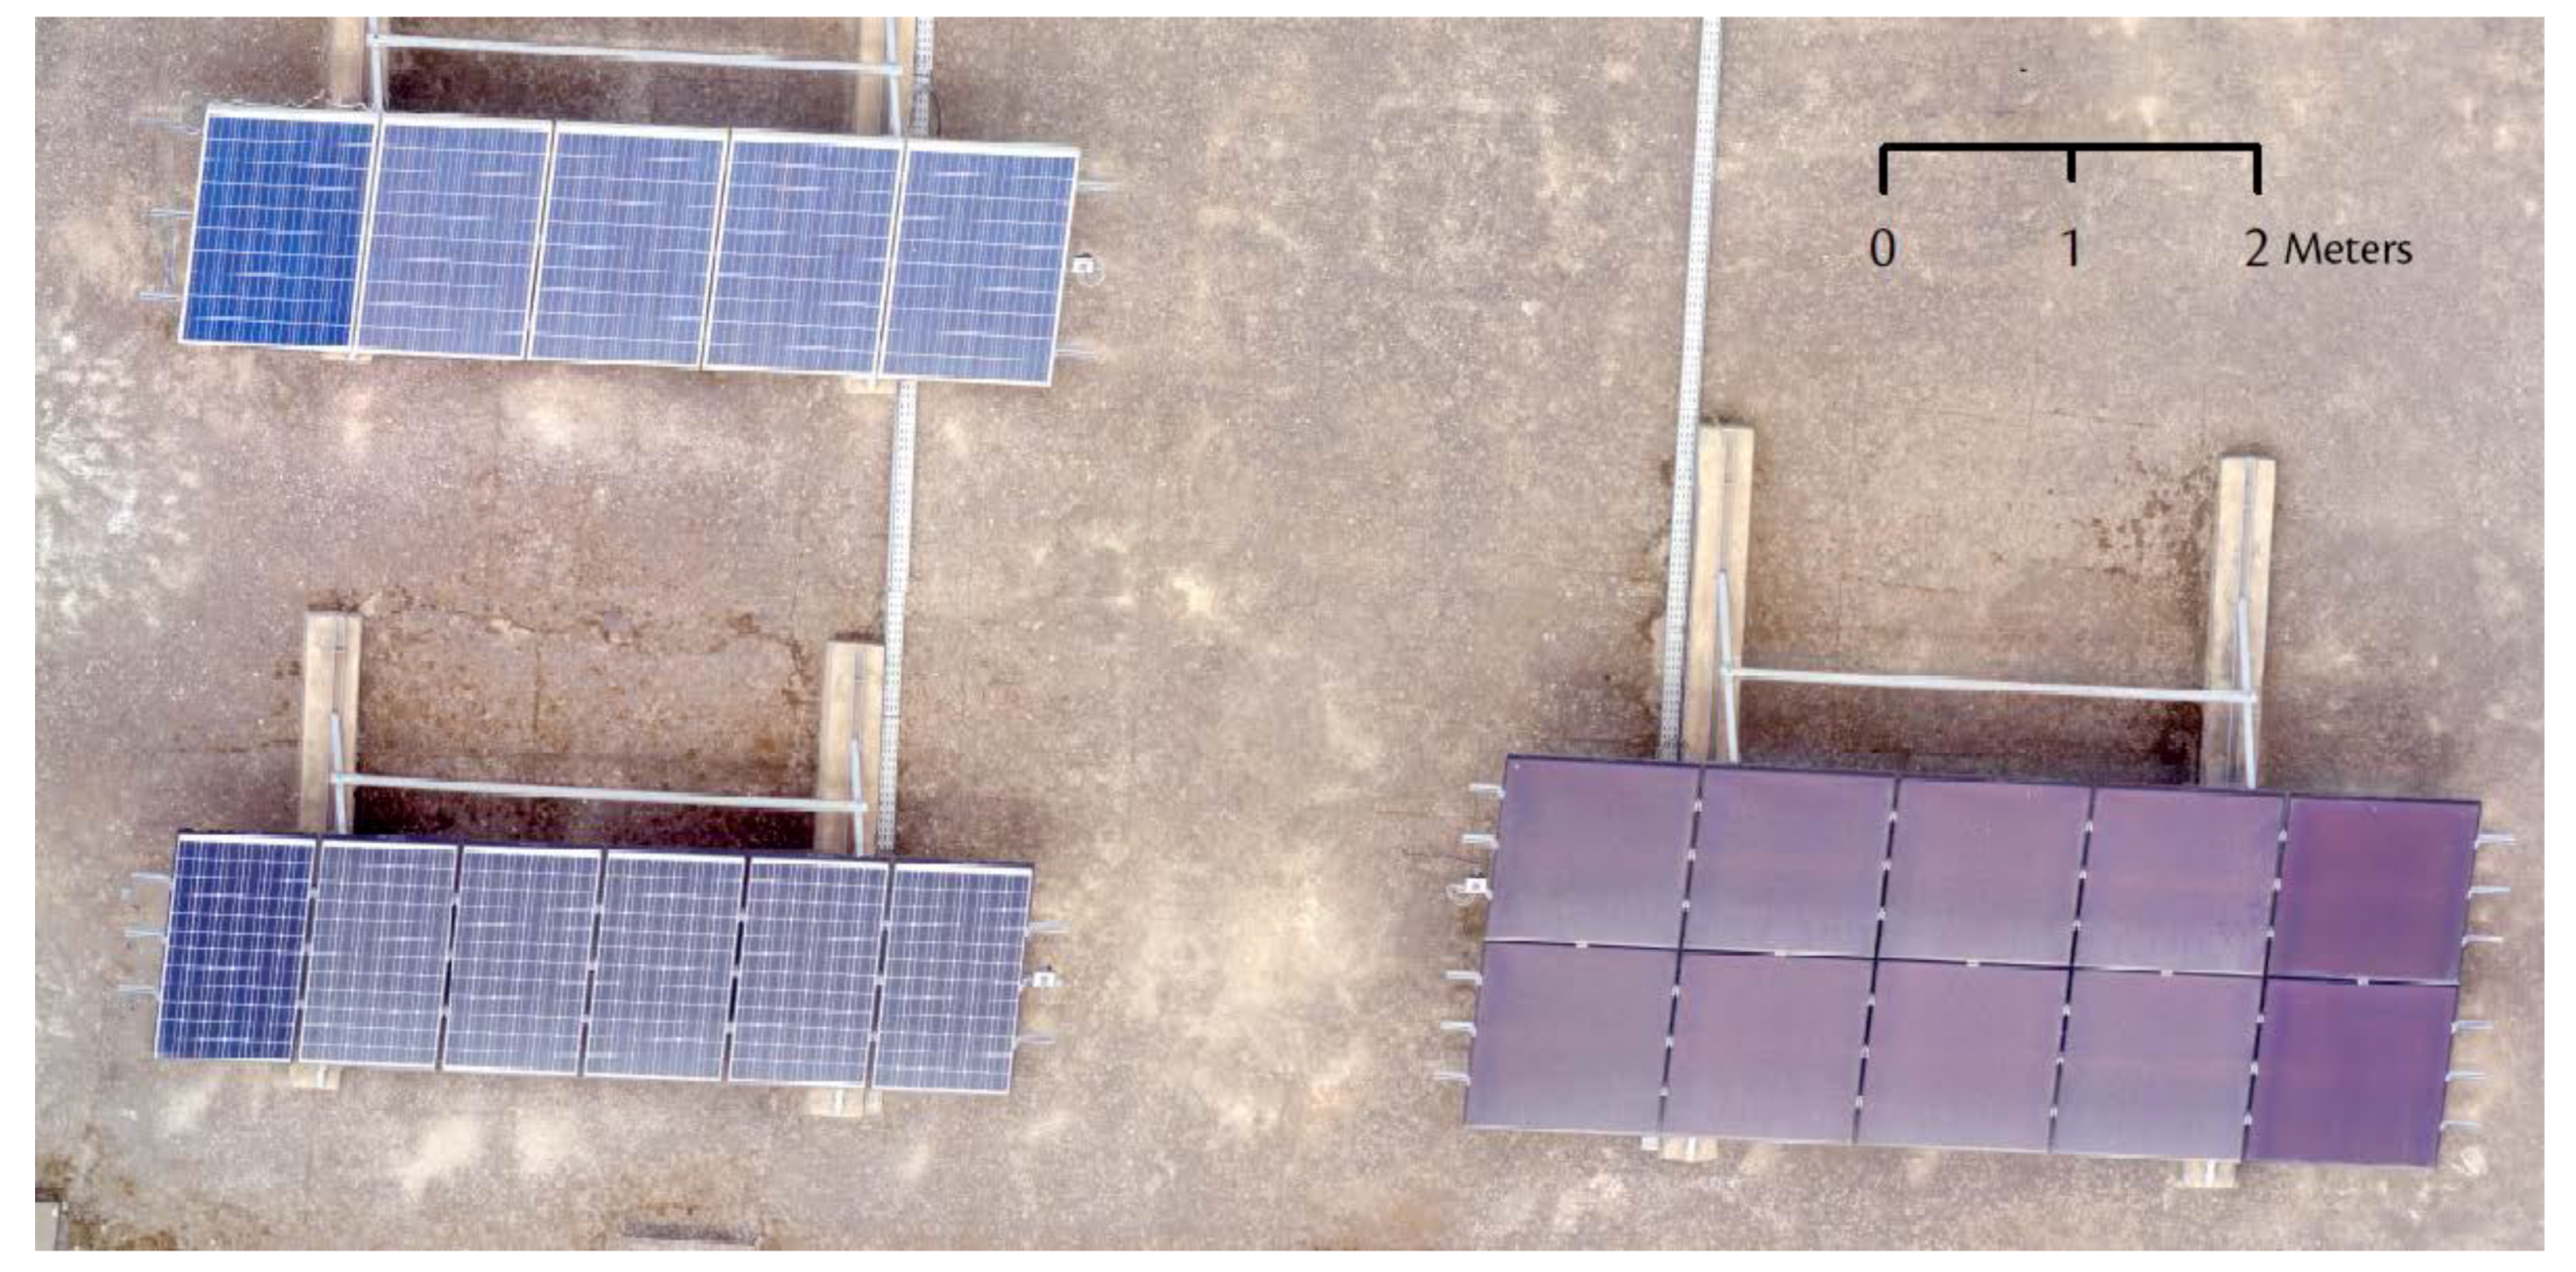
4.1. Inspection Sites
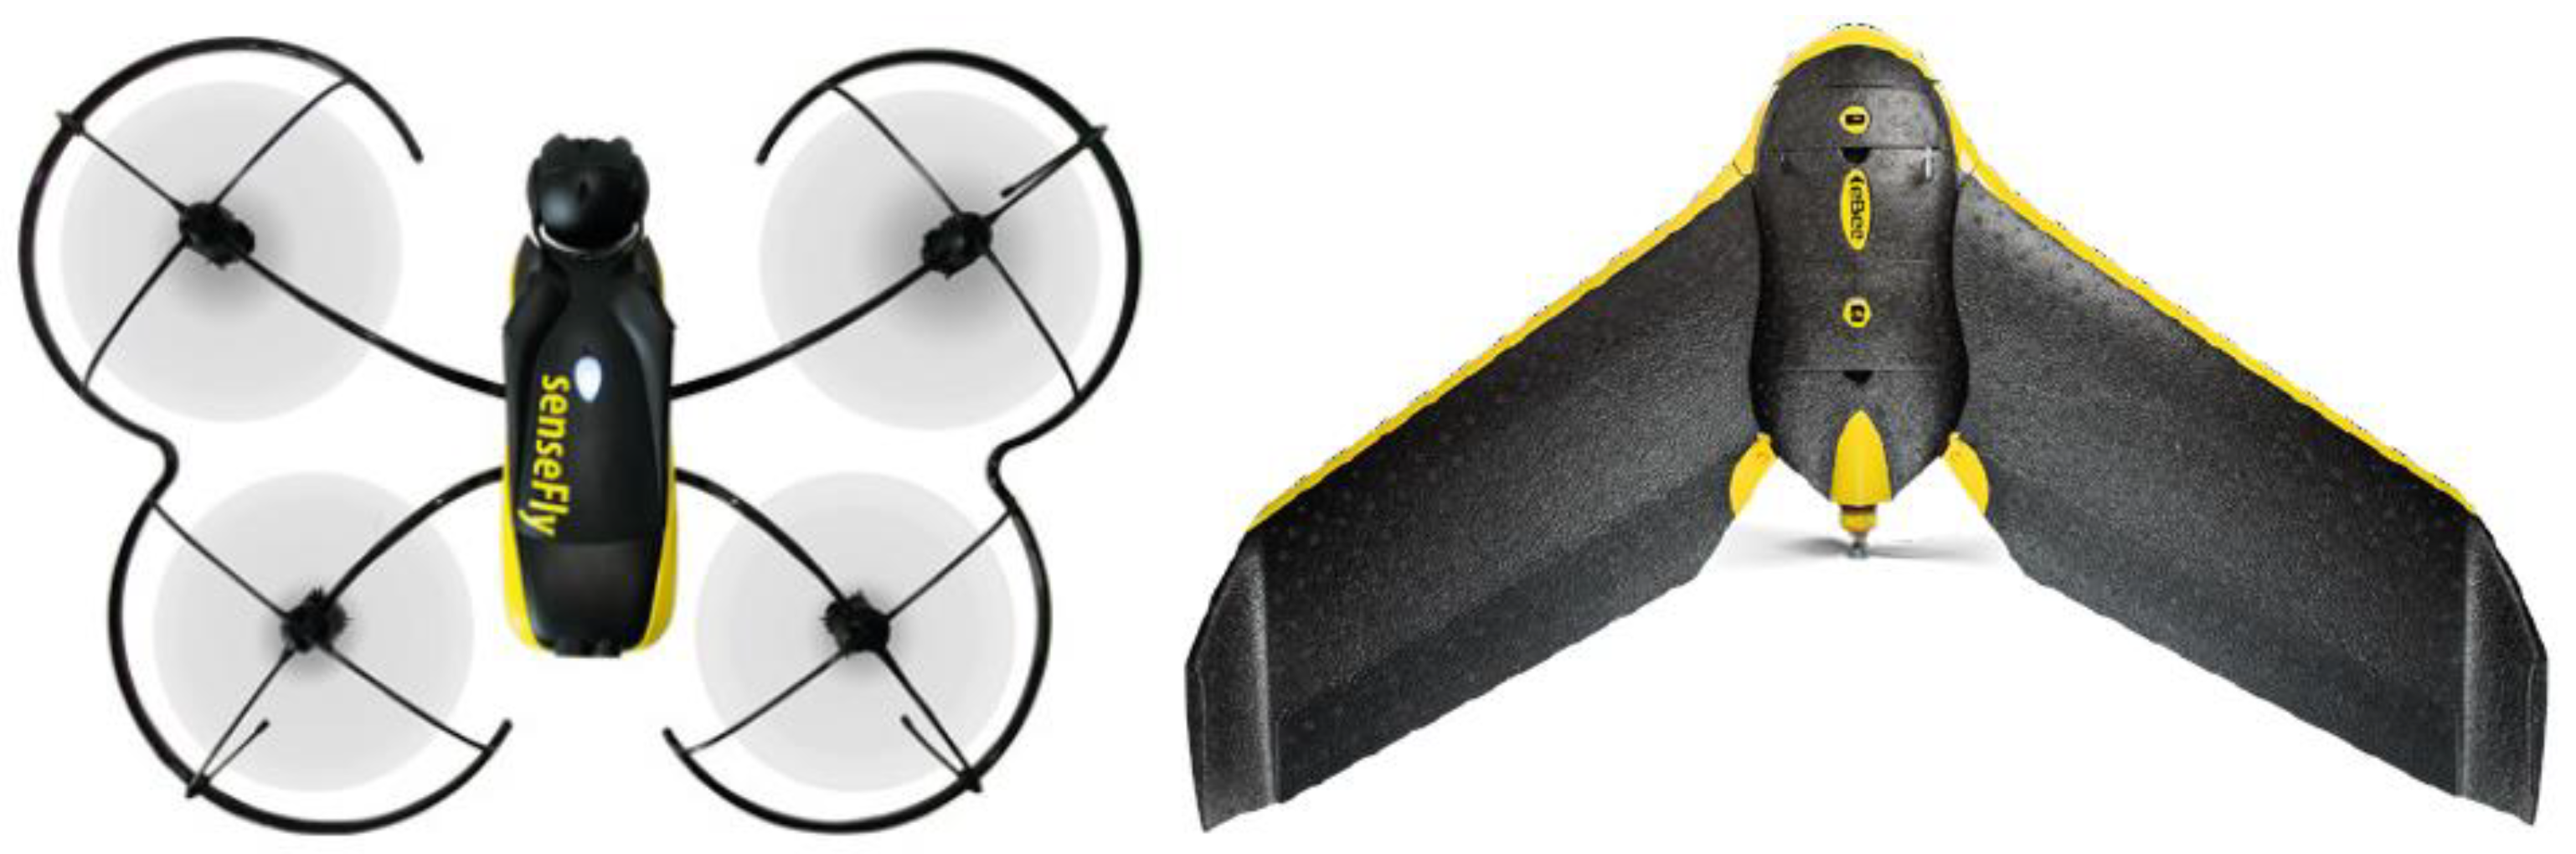
4.2. Material
4.3. Software
4.4. Data Acquisition
4.5. Data Processing and Exploitation
- Initial processing: in which, camera’s interior and exterior parameters are solved using a Structure from Motion (SfM) algorithm. This last also generates a sparse 3D point cloud.
- Point cloud generation: in which, a denser 3D point cloud is computed from previous images using a MultiView Stereo (MVS) algorithm.
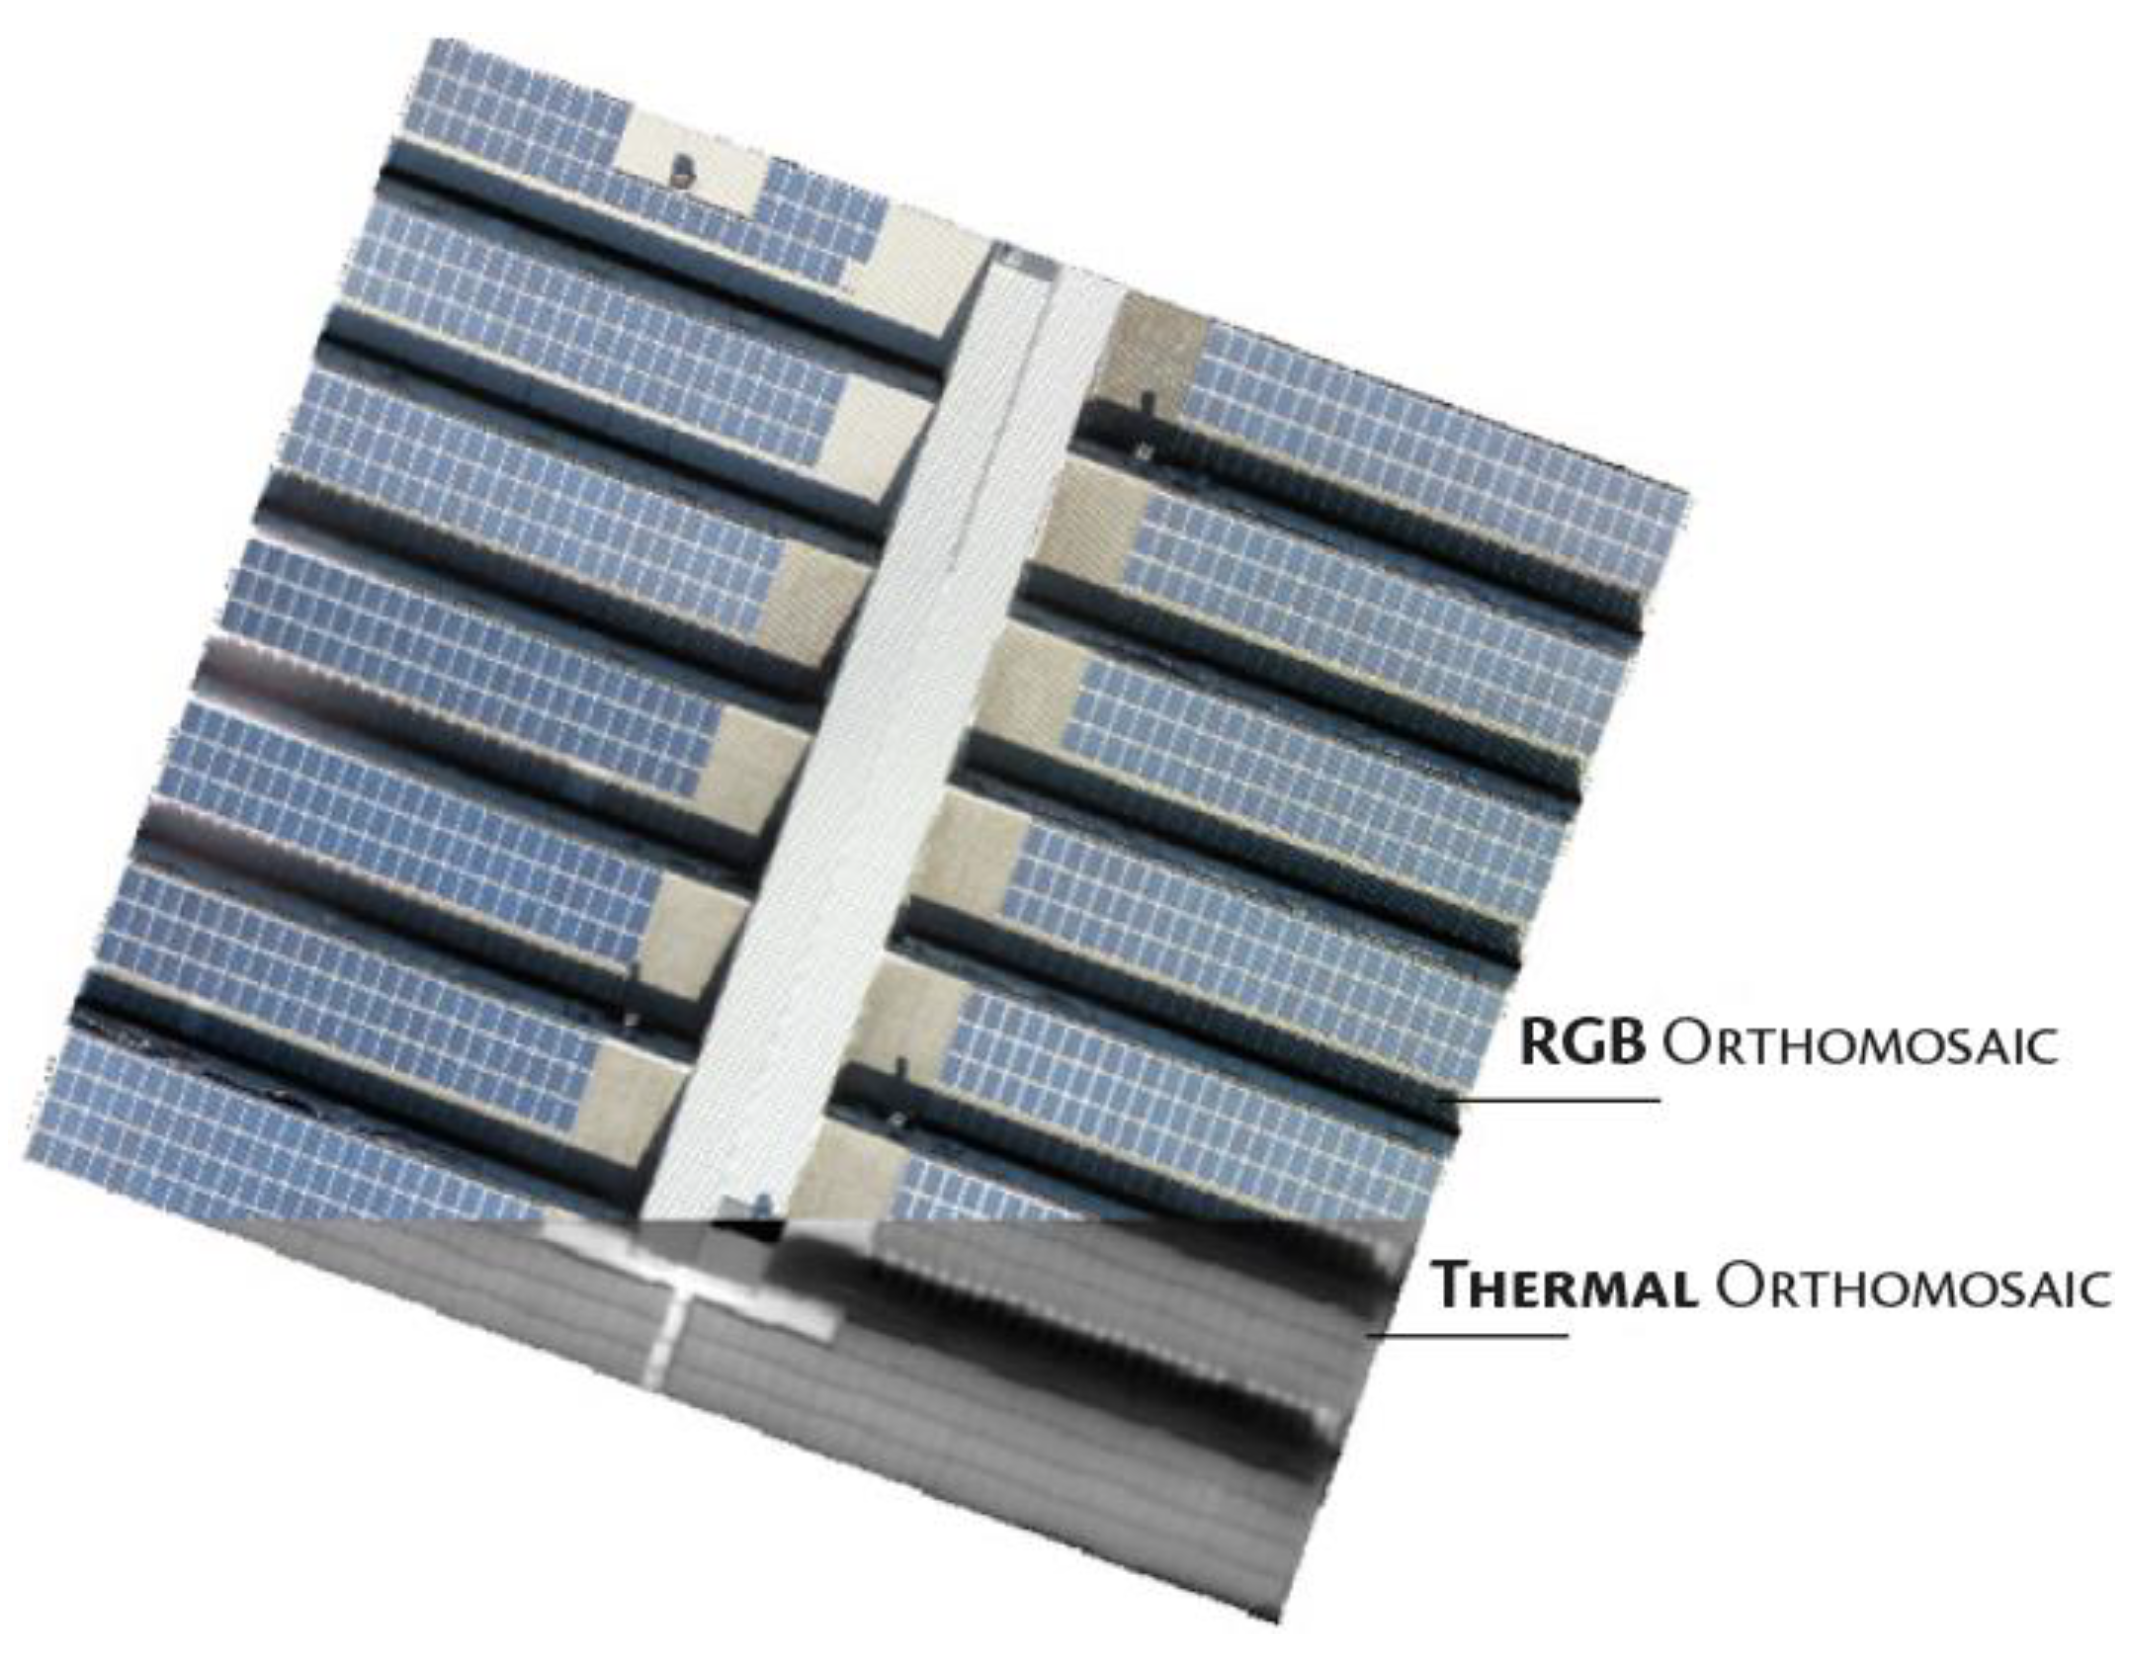
- Digital surface model and ortho: in which, visual and thermal orthomosaics are generated by orthorectifying acquired nadir images.
- Superposition of thermal and RGB orthomosaics: this is a necessary step for later ones. It is done by pointing homologous points in both orthos to make same details superimposed as much as possible.
- PV strings extraction: consists of isolating PV strings after delimiting them with polygons, so as the extraction will be performed only on the delimited area.
- Threshold specification: this step consists of specifying a threshold for hotspots characterization. Every pixel that has a superior value to this threshold will be considered as located within a hotspot. For this purpose, we have exploited Migan’s [44] formula, which determines the expected temperature of a PV cell (Tcell) on the basis of solar irradiance (S), ambient temperature (Tair), and the nominal operating cell temperature (NOCT), which is typically provided by the manufacturer in technical specifications of manufactured modules.Tcell = Tair + (NOCT − 20) × S/80,
5. Results and Discussion
5.1. Visual Inspection
- Soiling was clearly distinguishable on all generated orthomosaics. Even after washing, the smooth left layer remained visible (Figure 15).
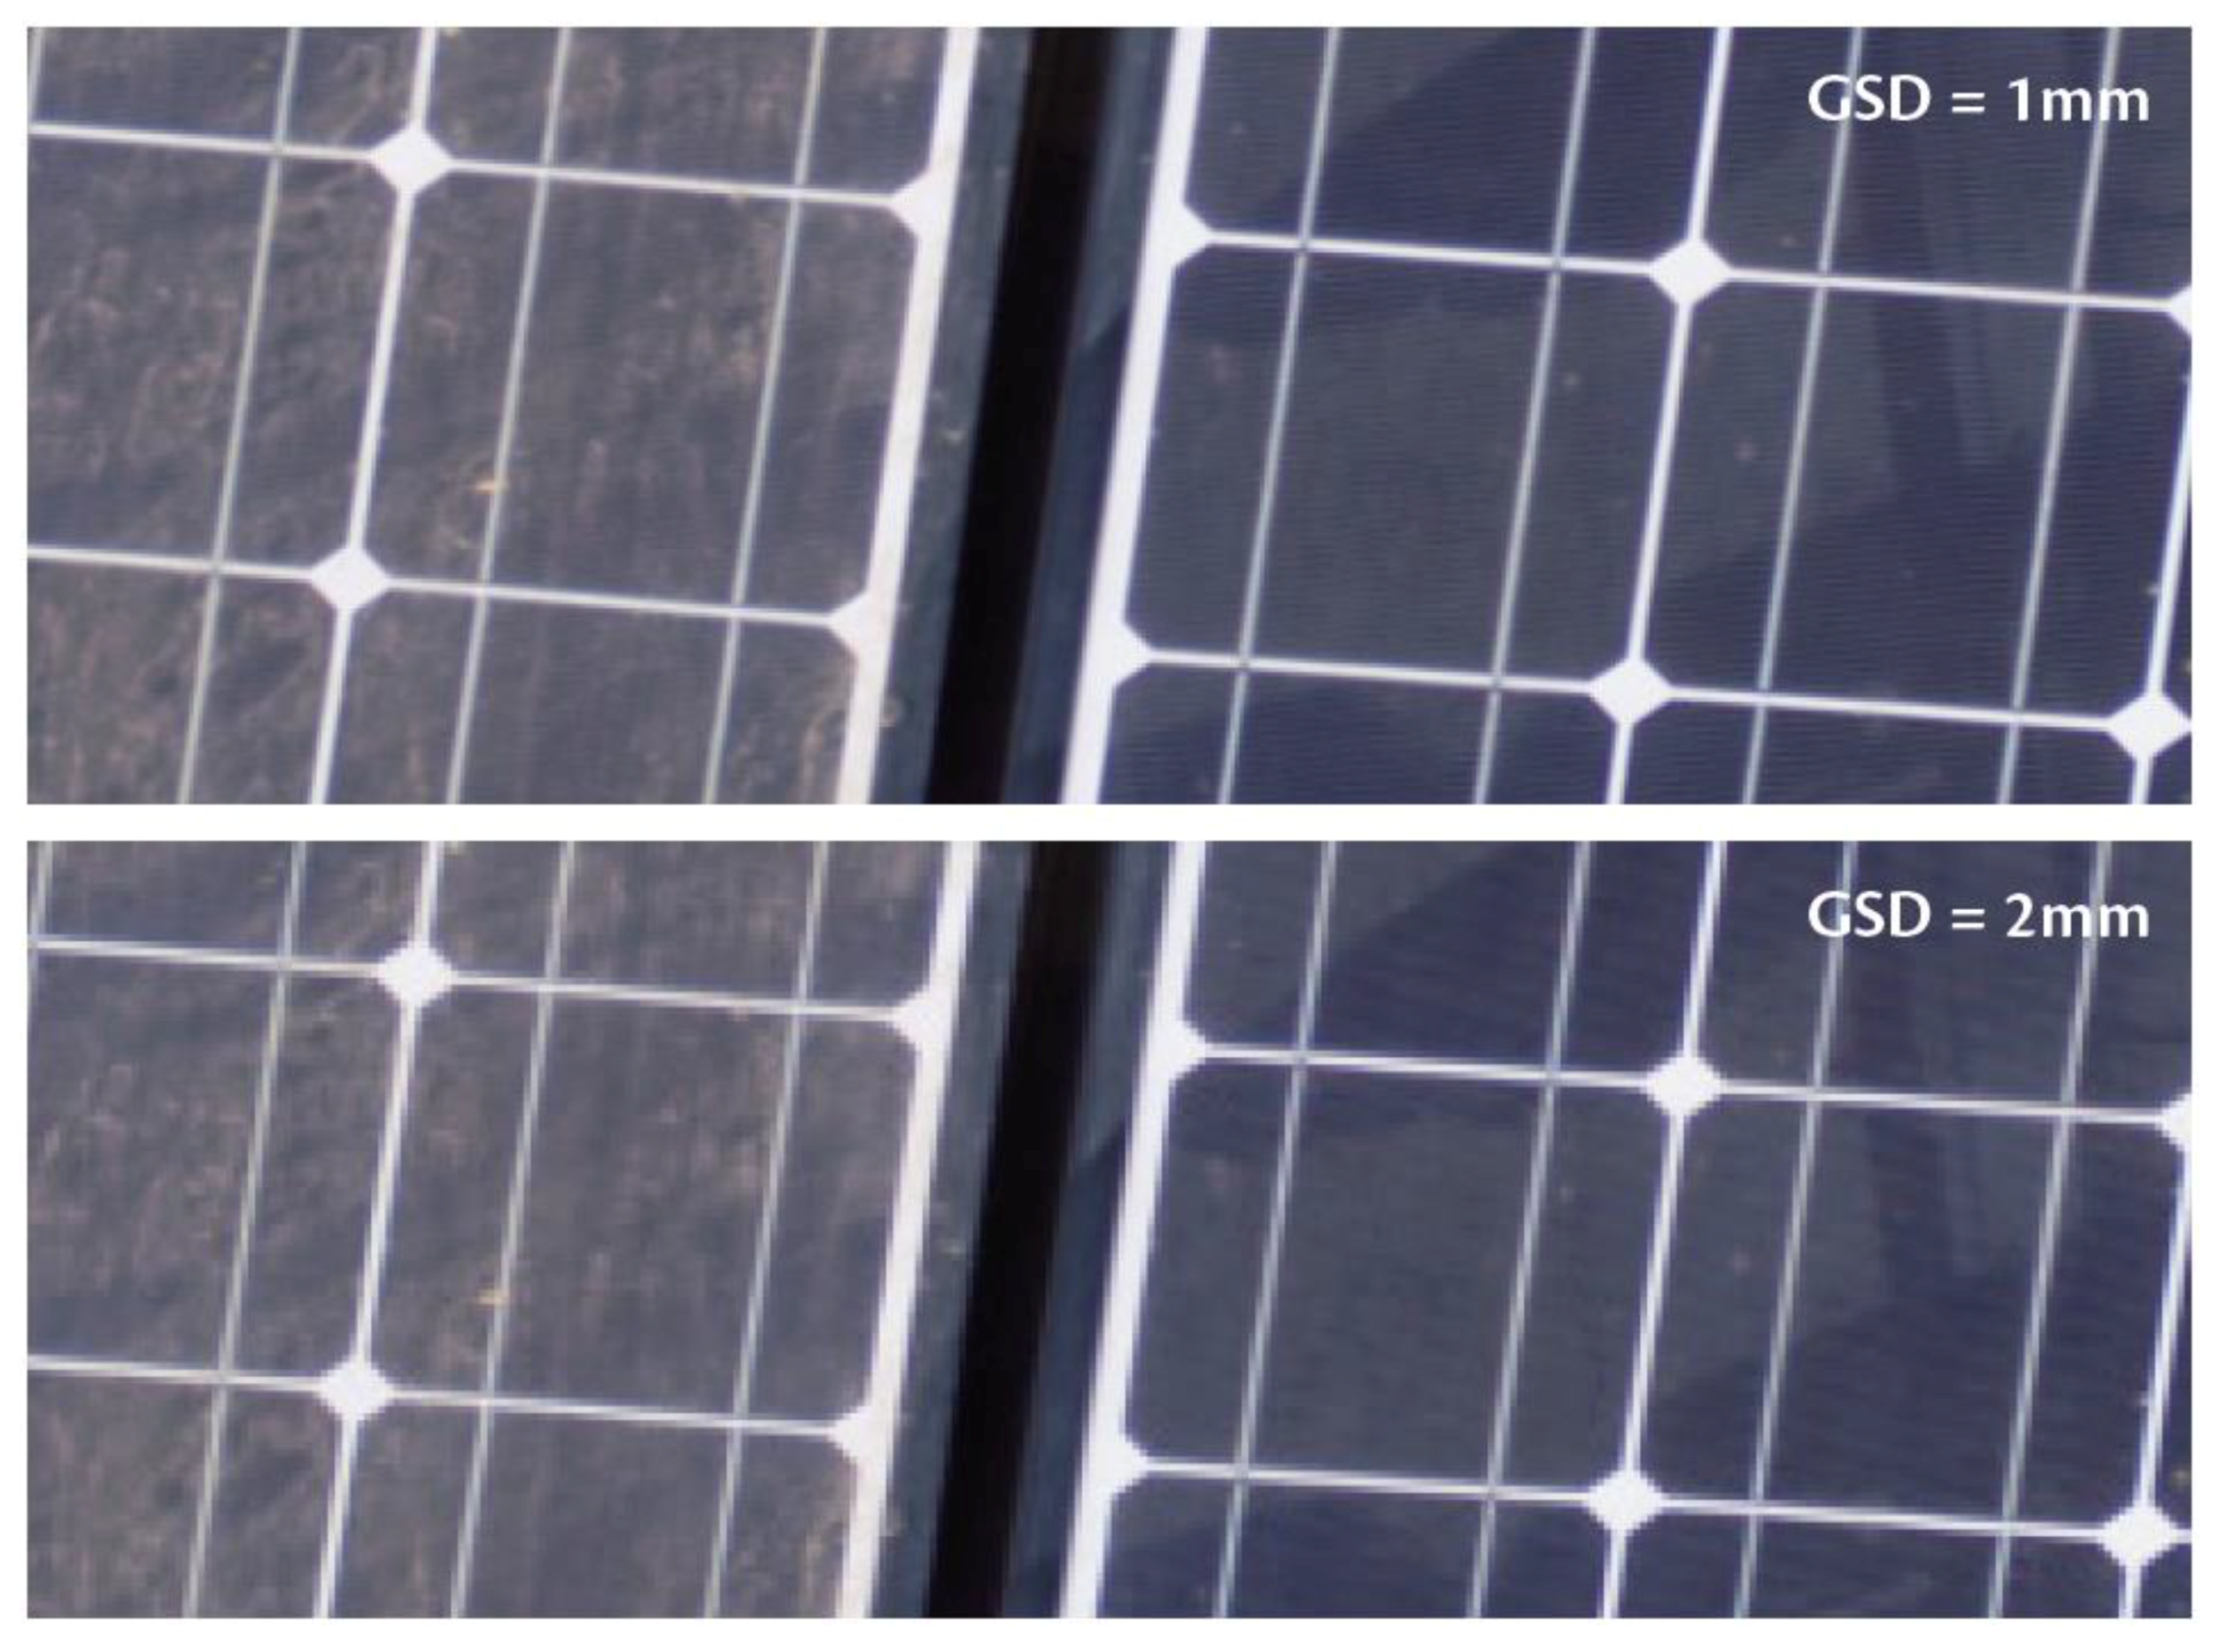
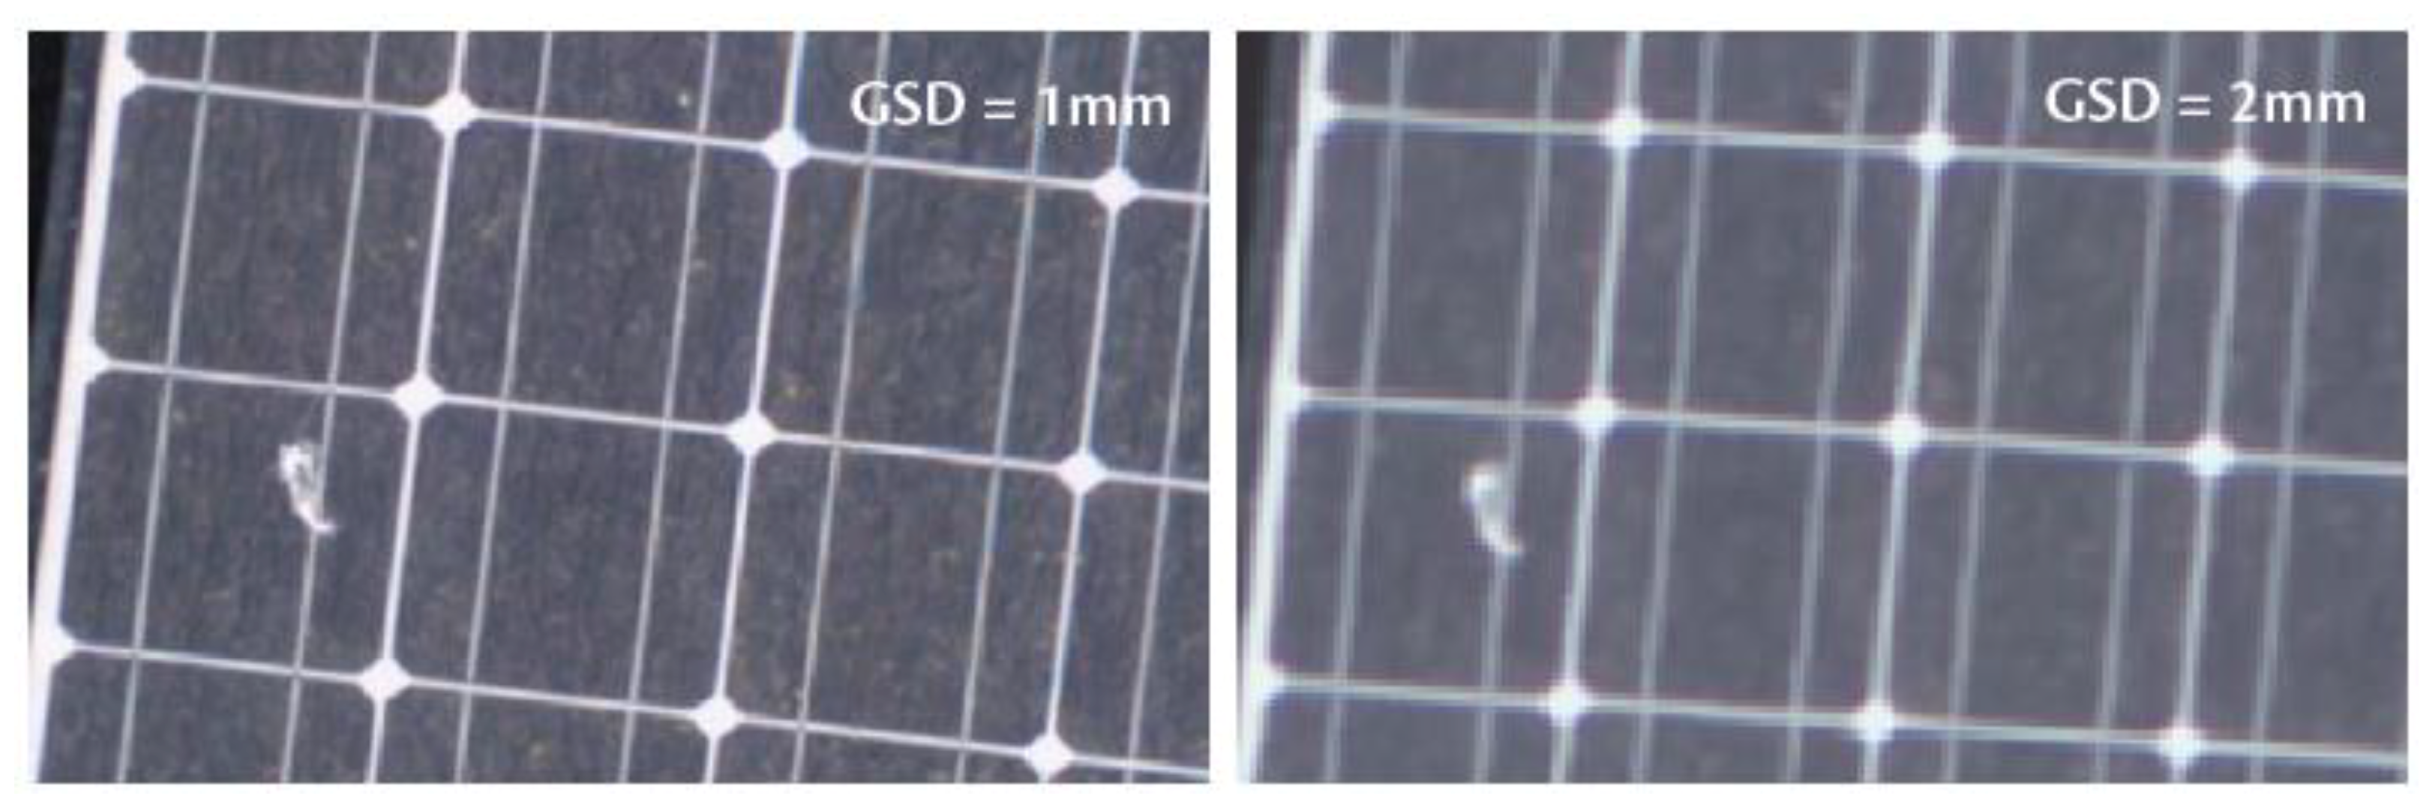
- Cracks were found on four cells in the first installation. At a 1 mm GSD, they are clearly visible whereas at a 2 mm GSD, additional effort is required from the examiner in order to detect them (Figure 16).
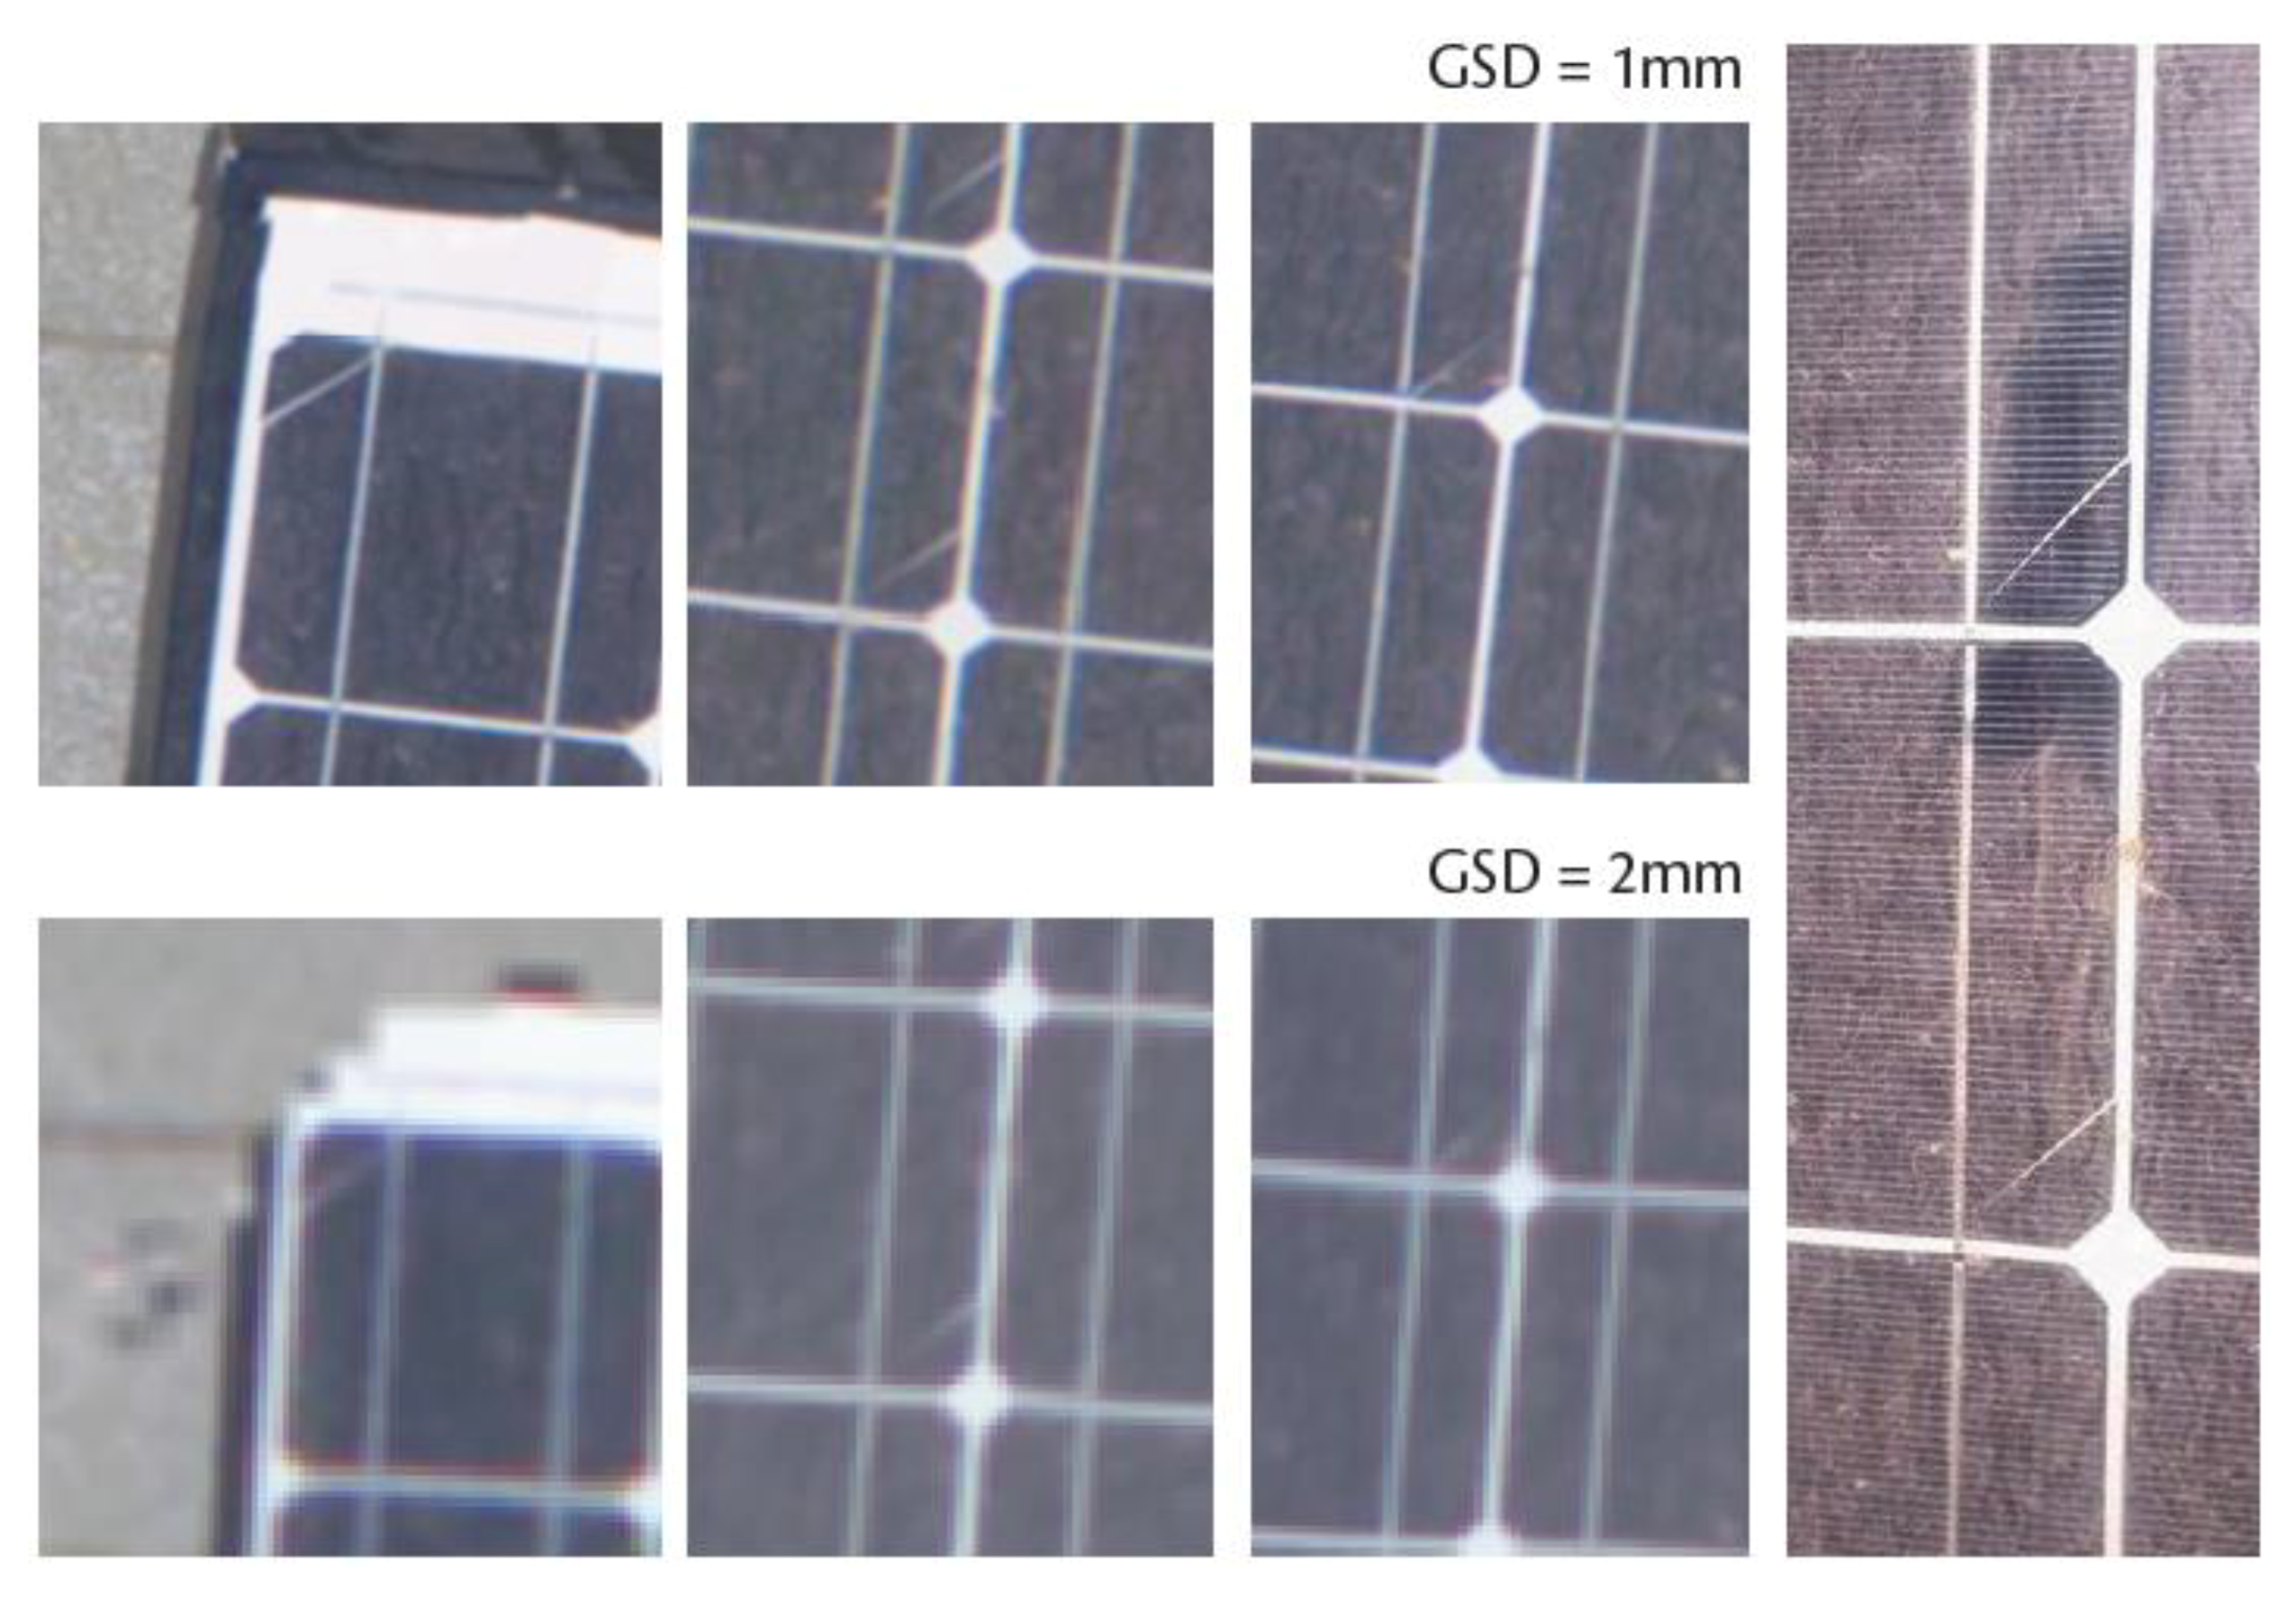
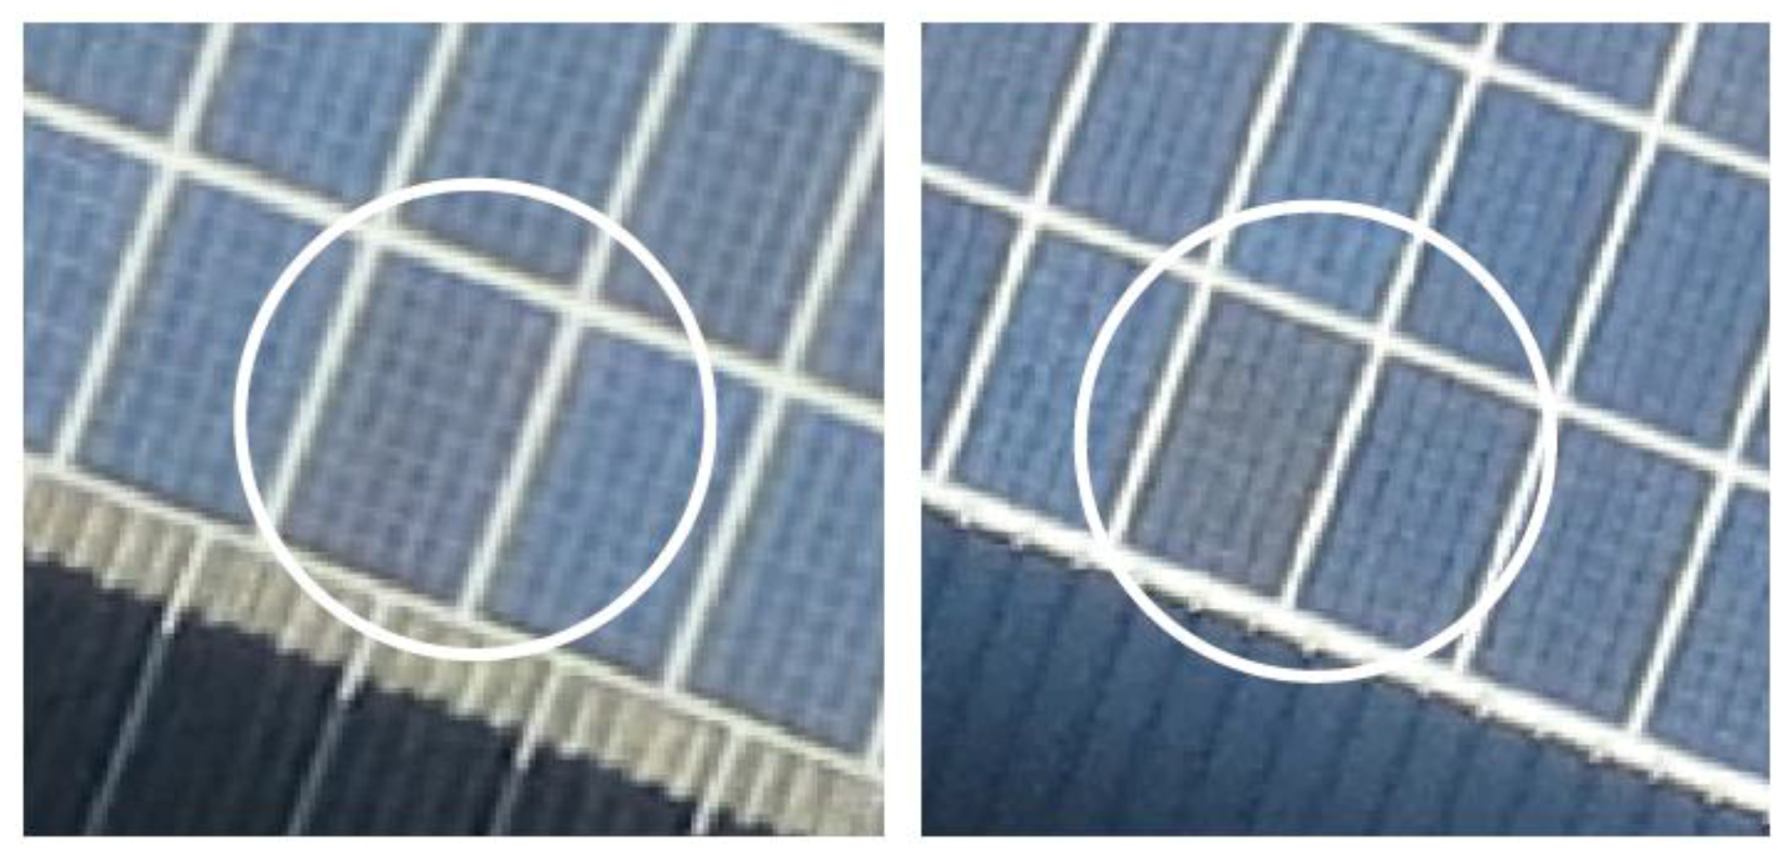
- Smears of different sizes and forms were also found in almost all modules. Big ones are easy to detect on all orthomosaics whereas small ones require an additional effort to detect them on 2 mm GSD orthomosaics (Figure 17).
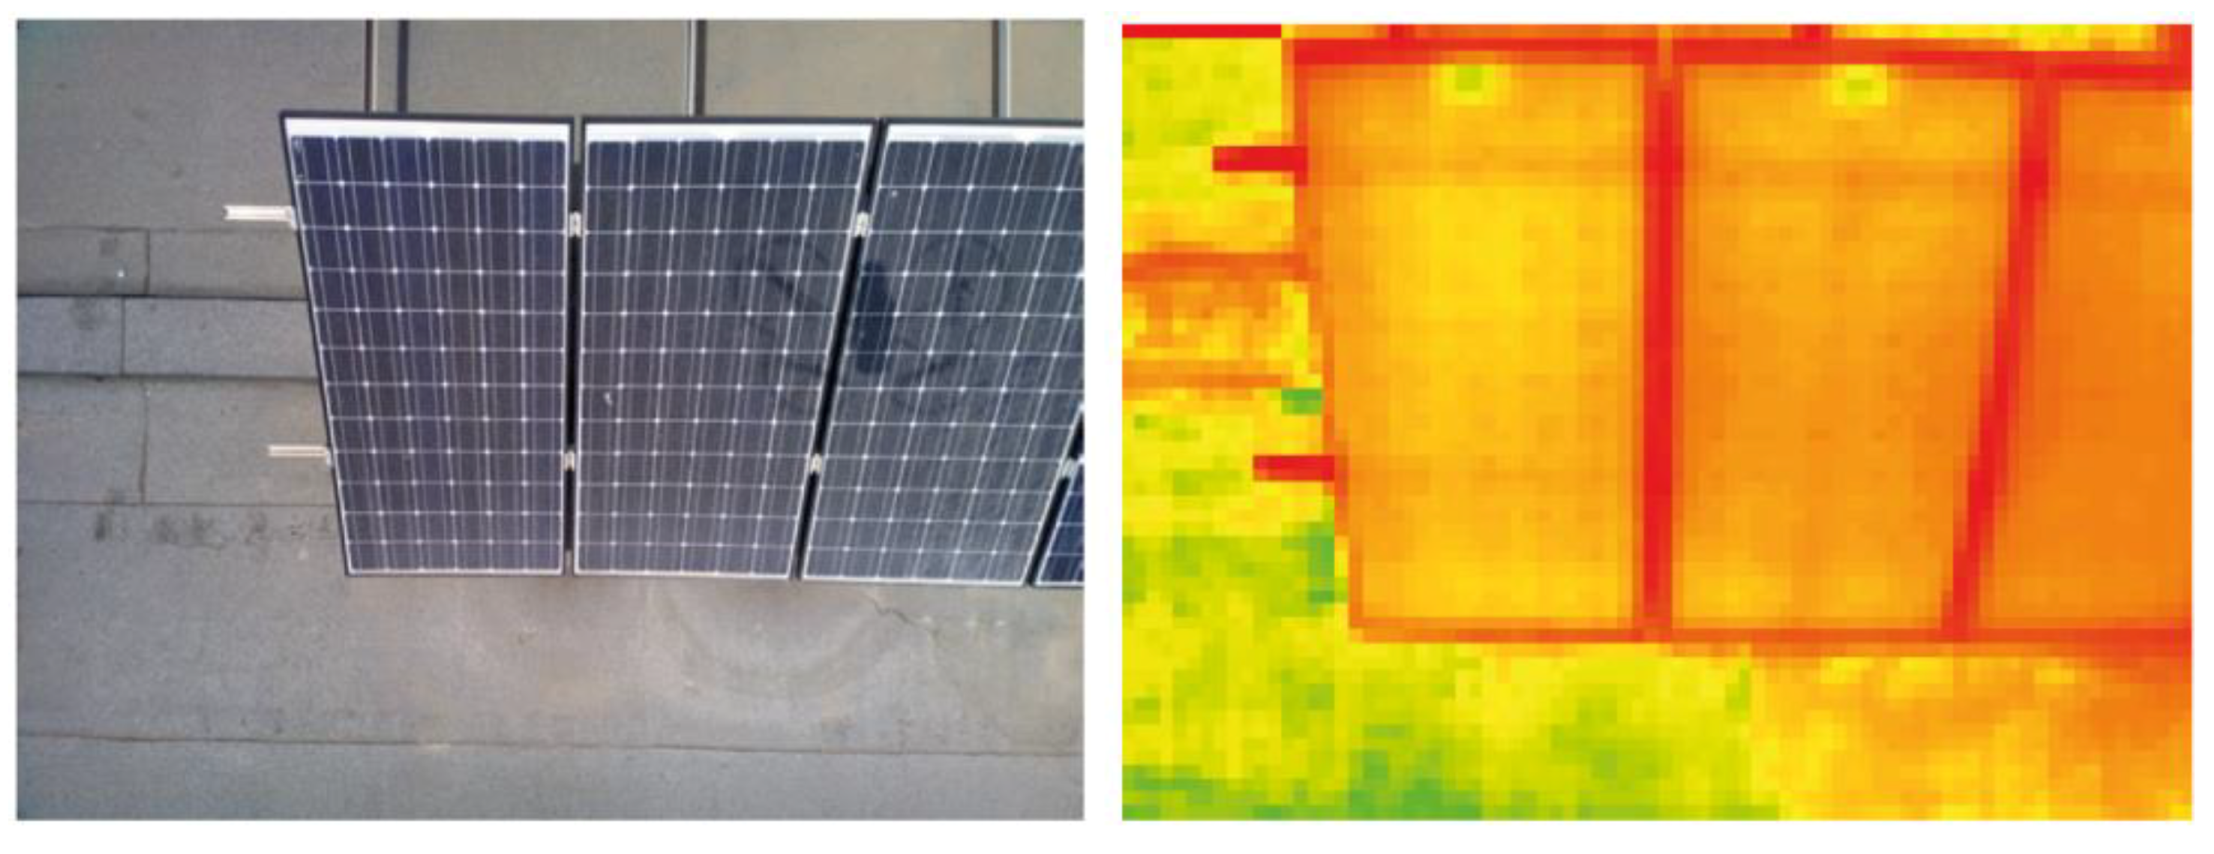
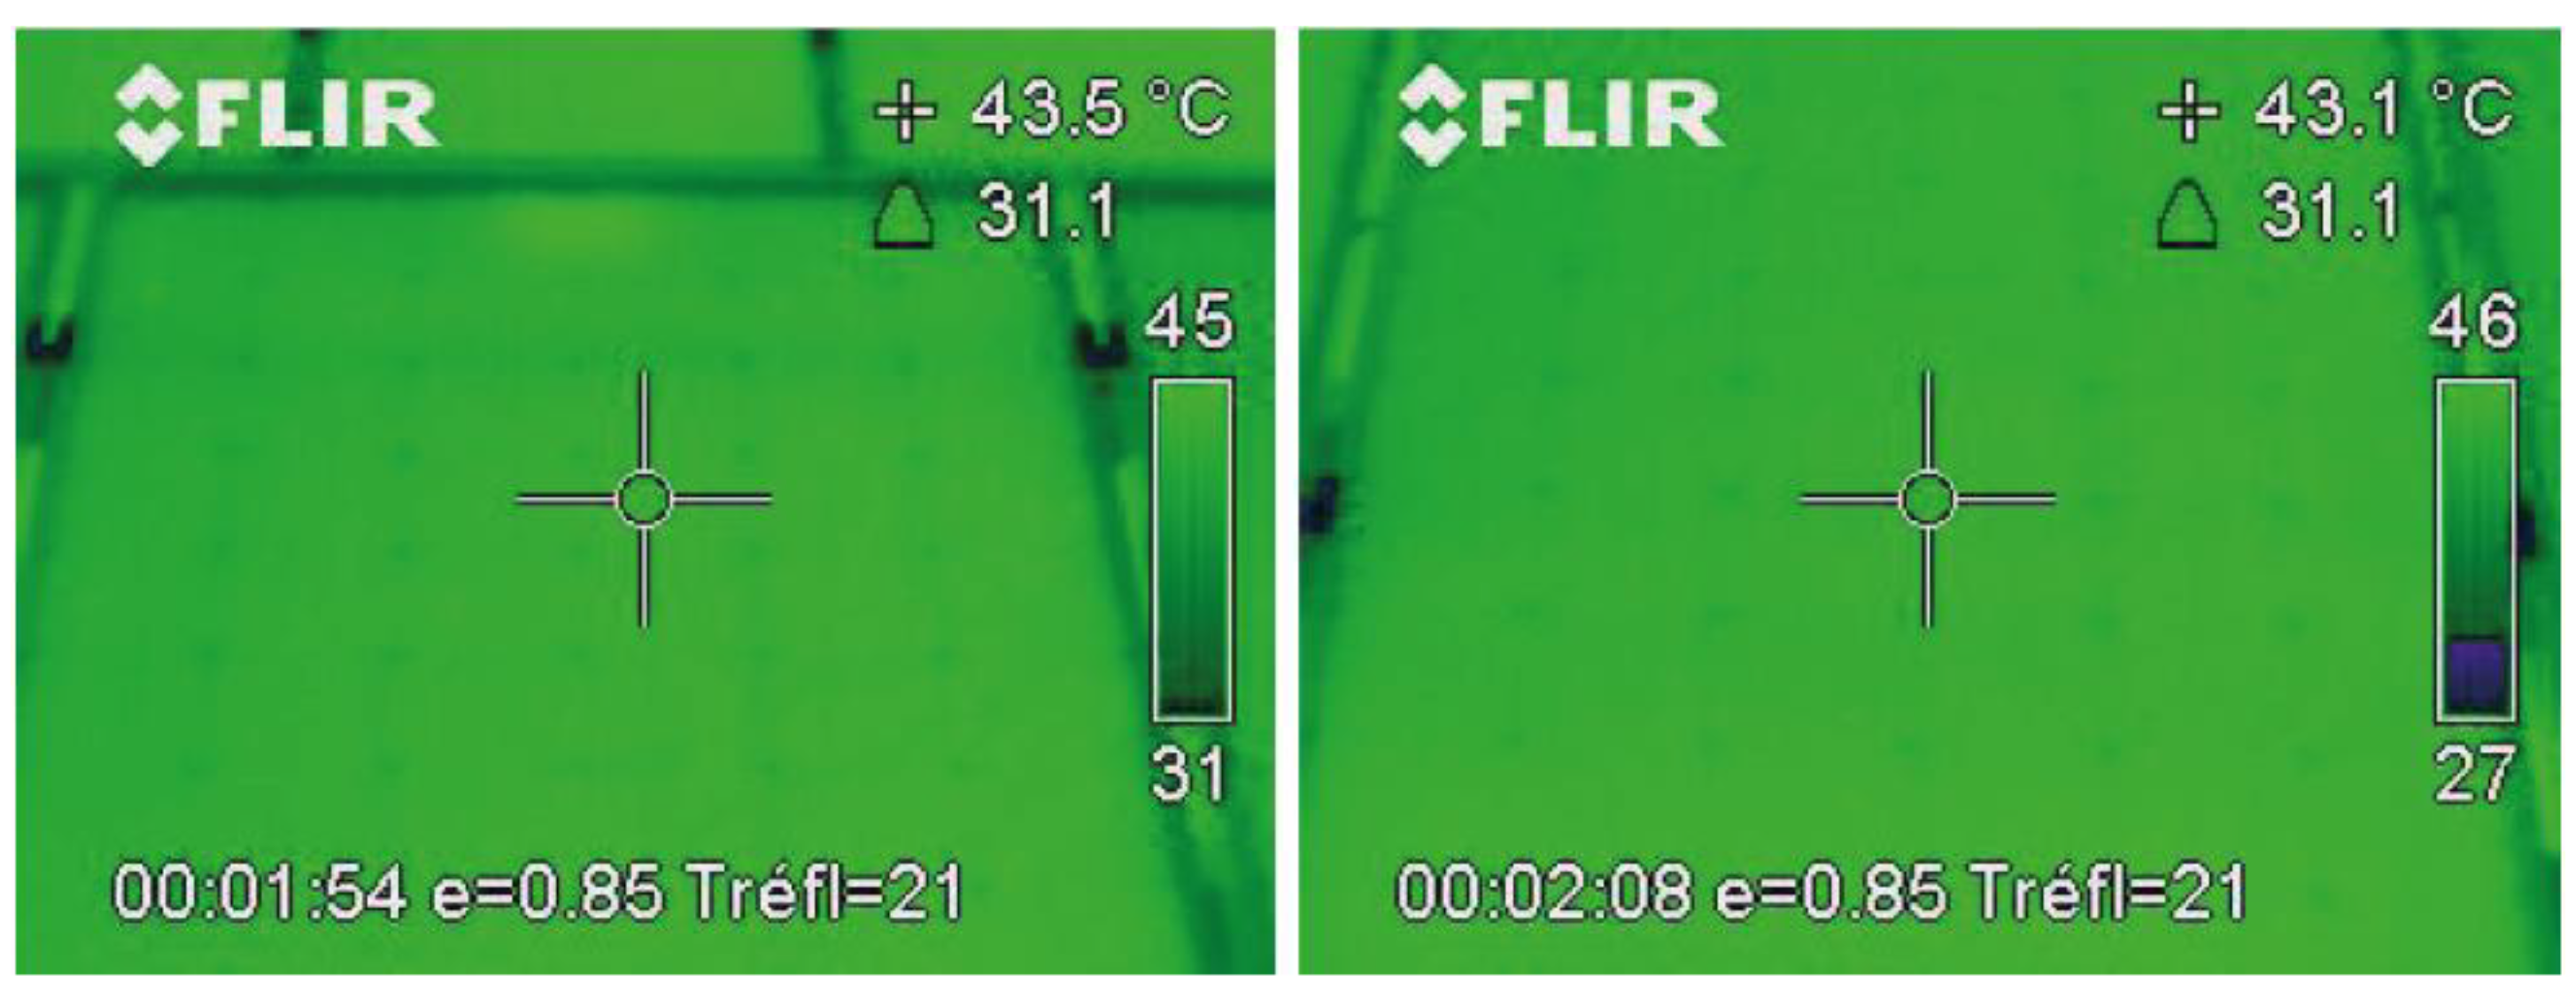
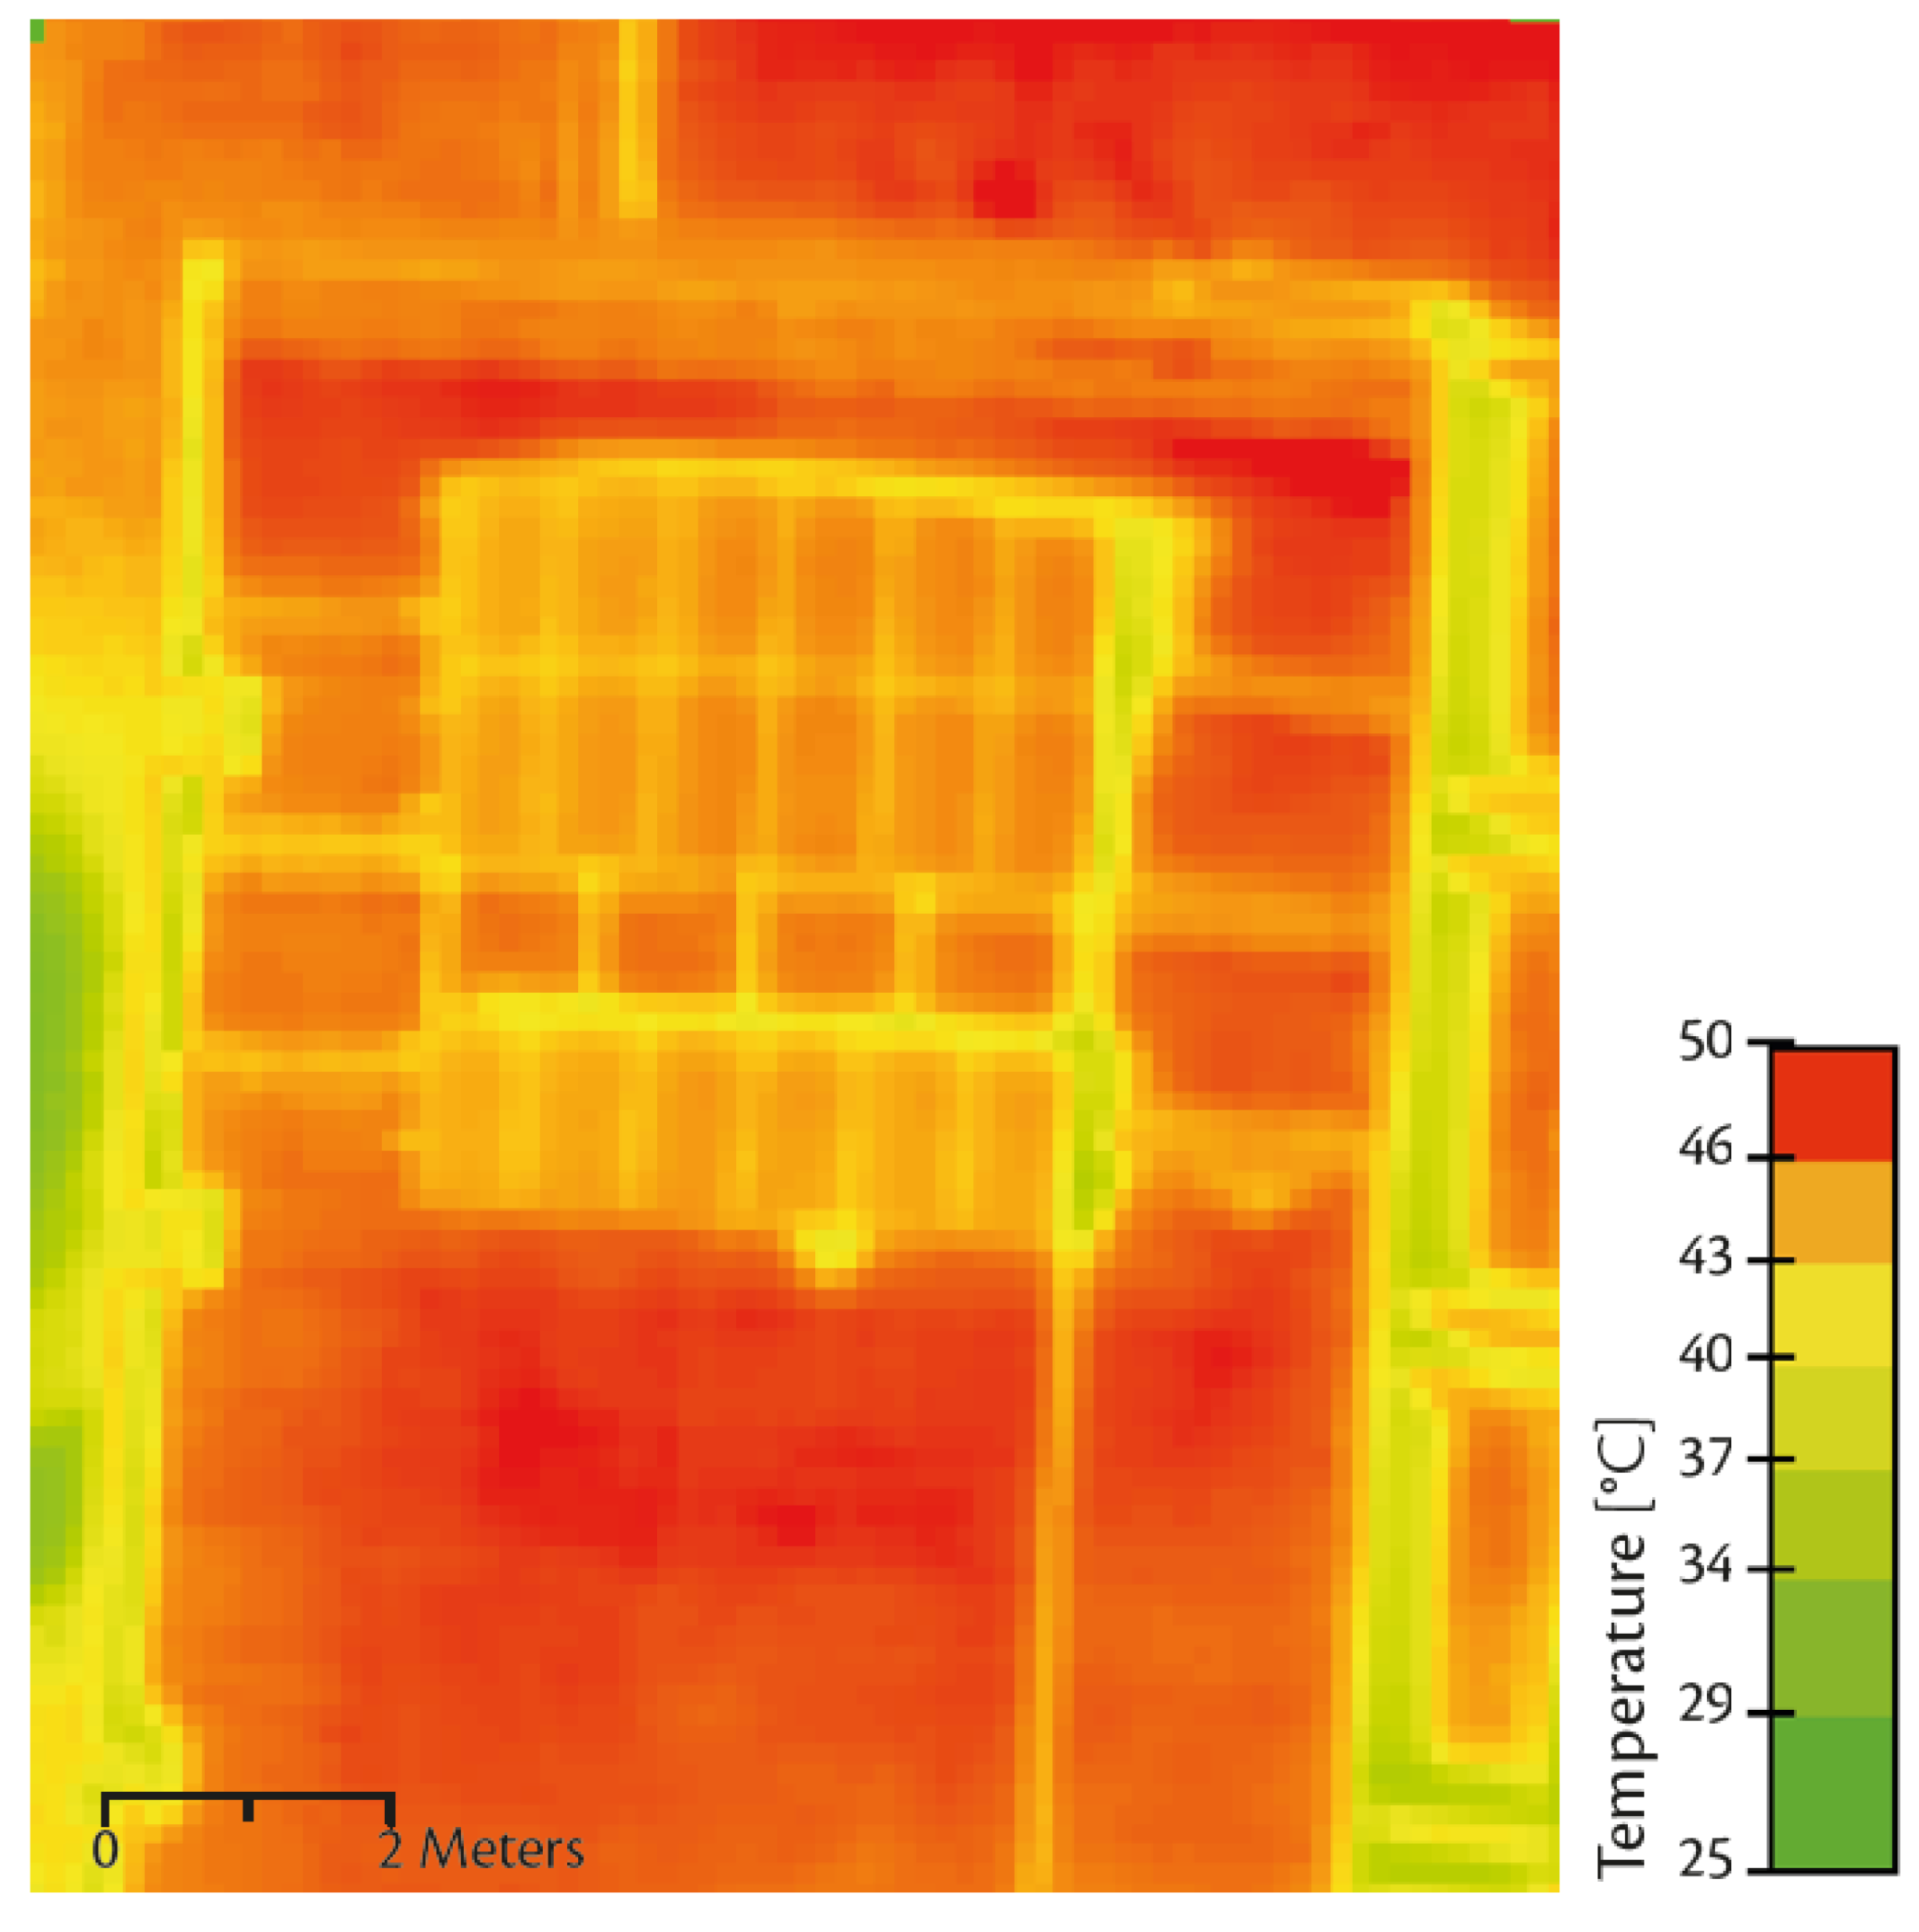
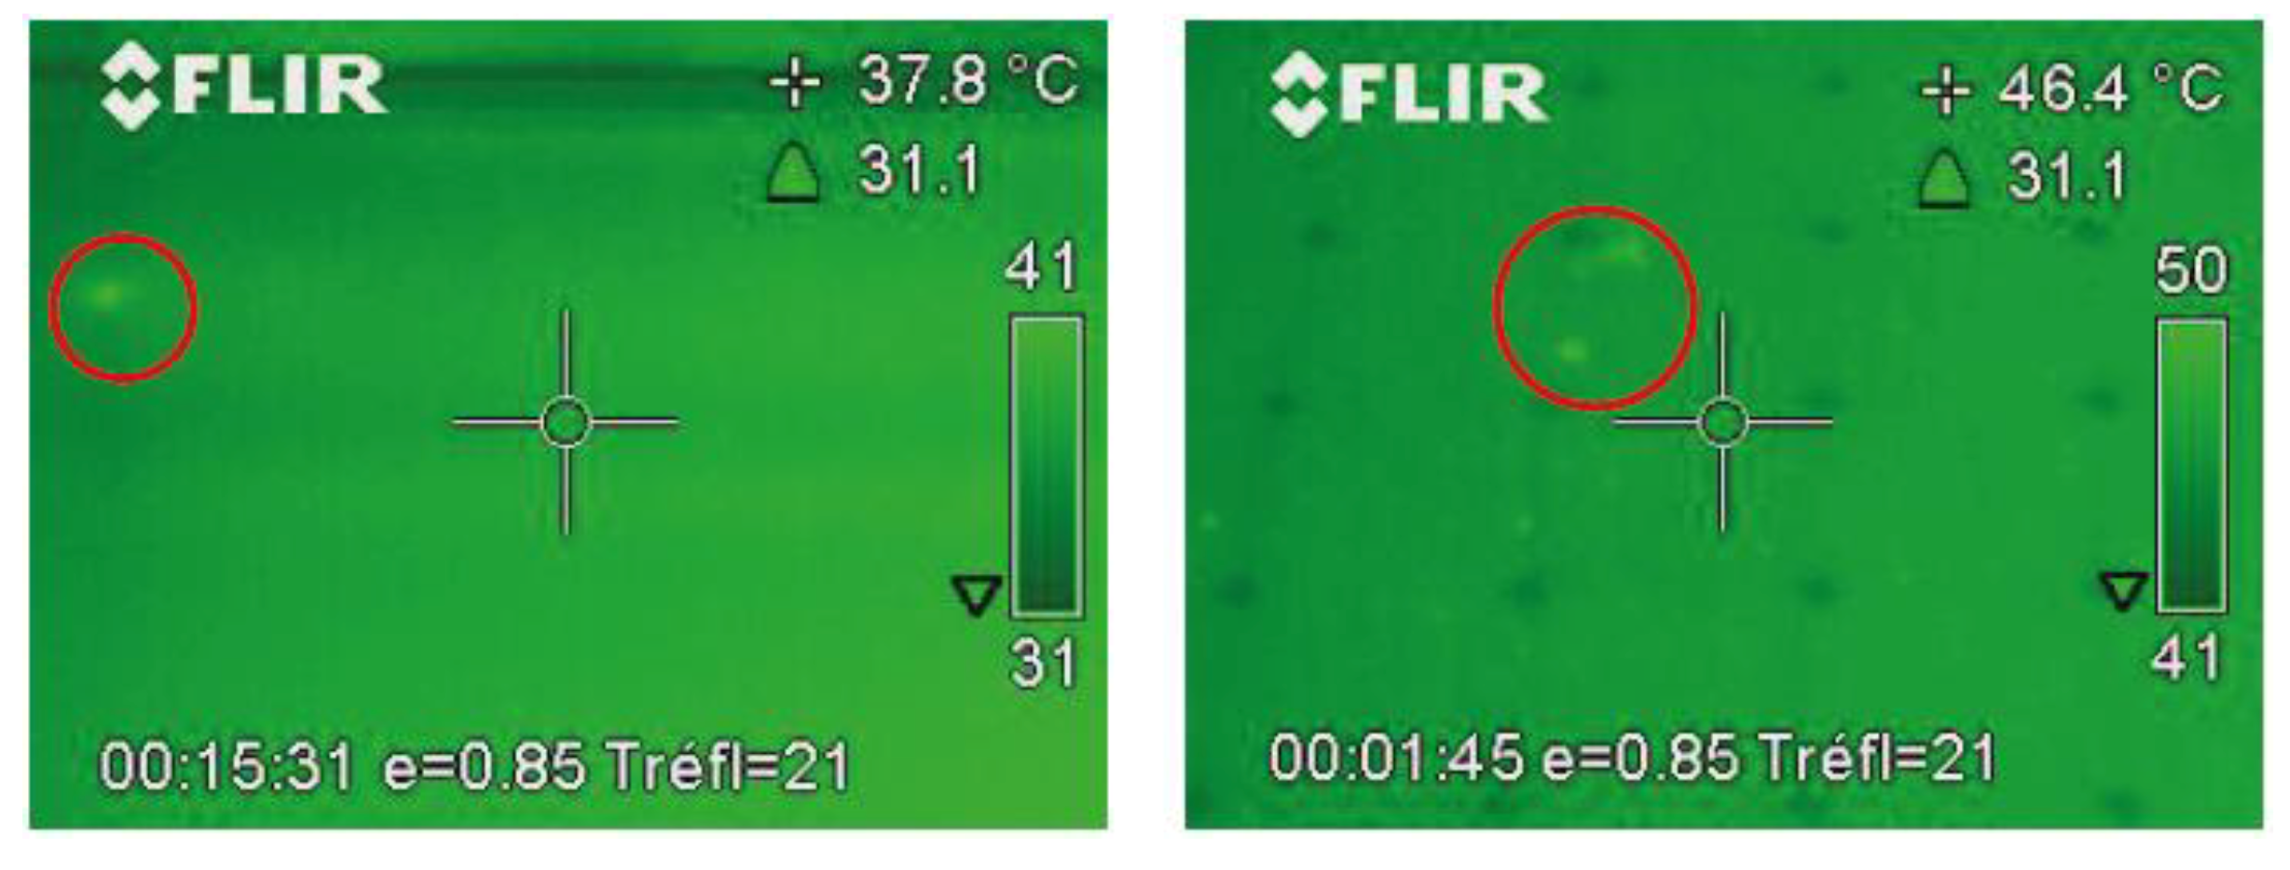
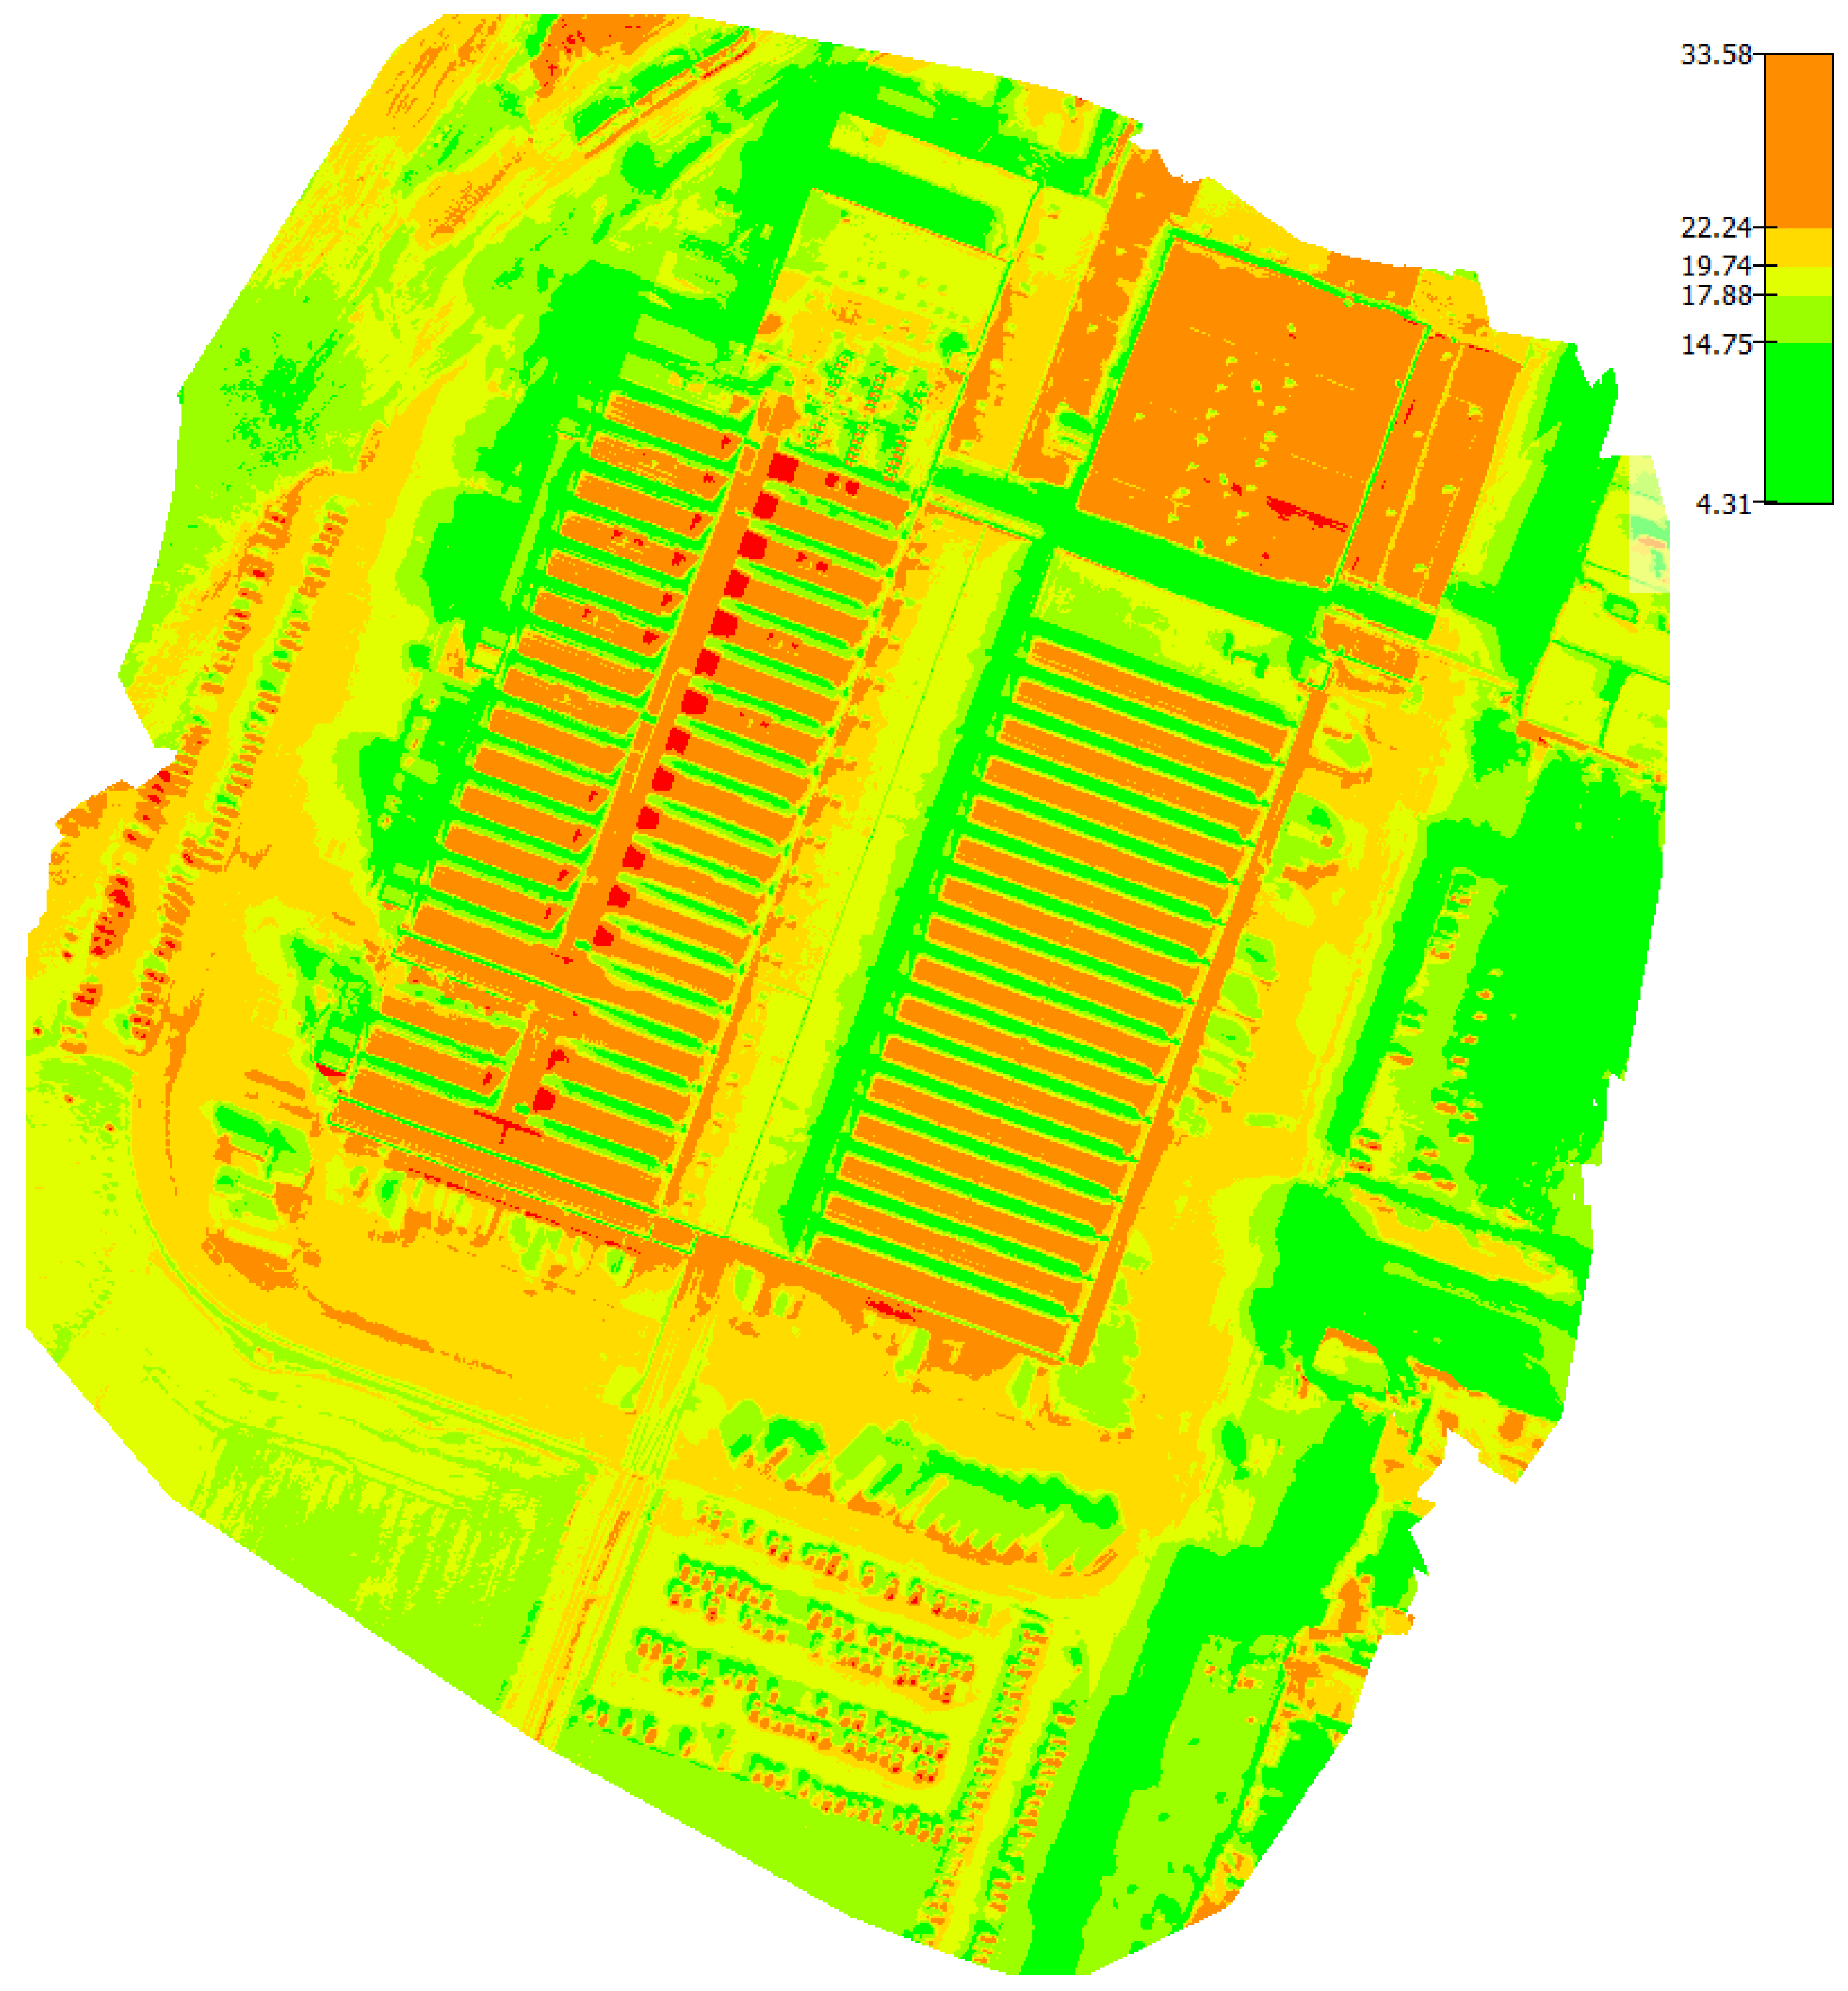
5.2. Thermal Inspection
5.2.1. Primary Results
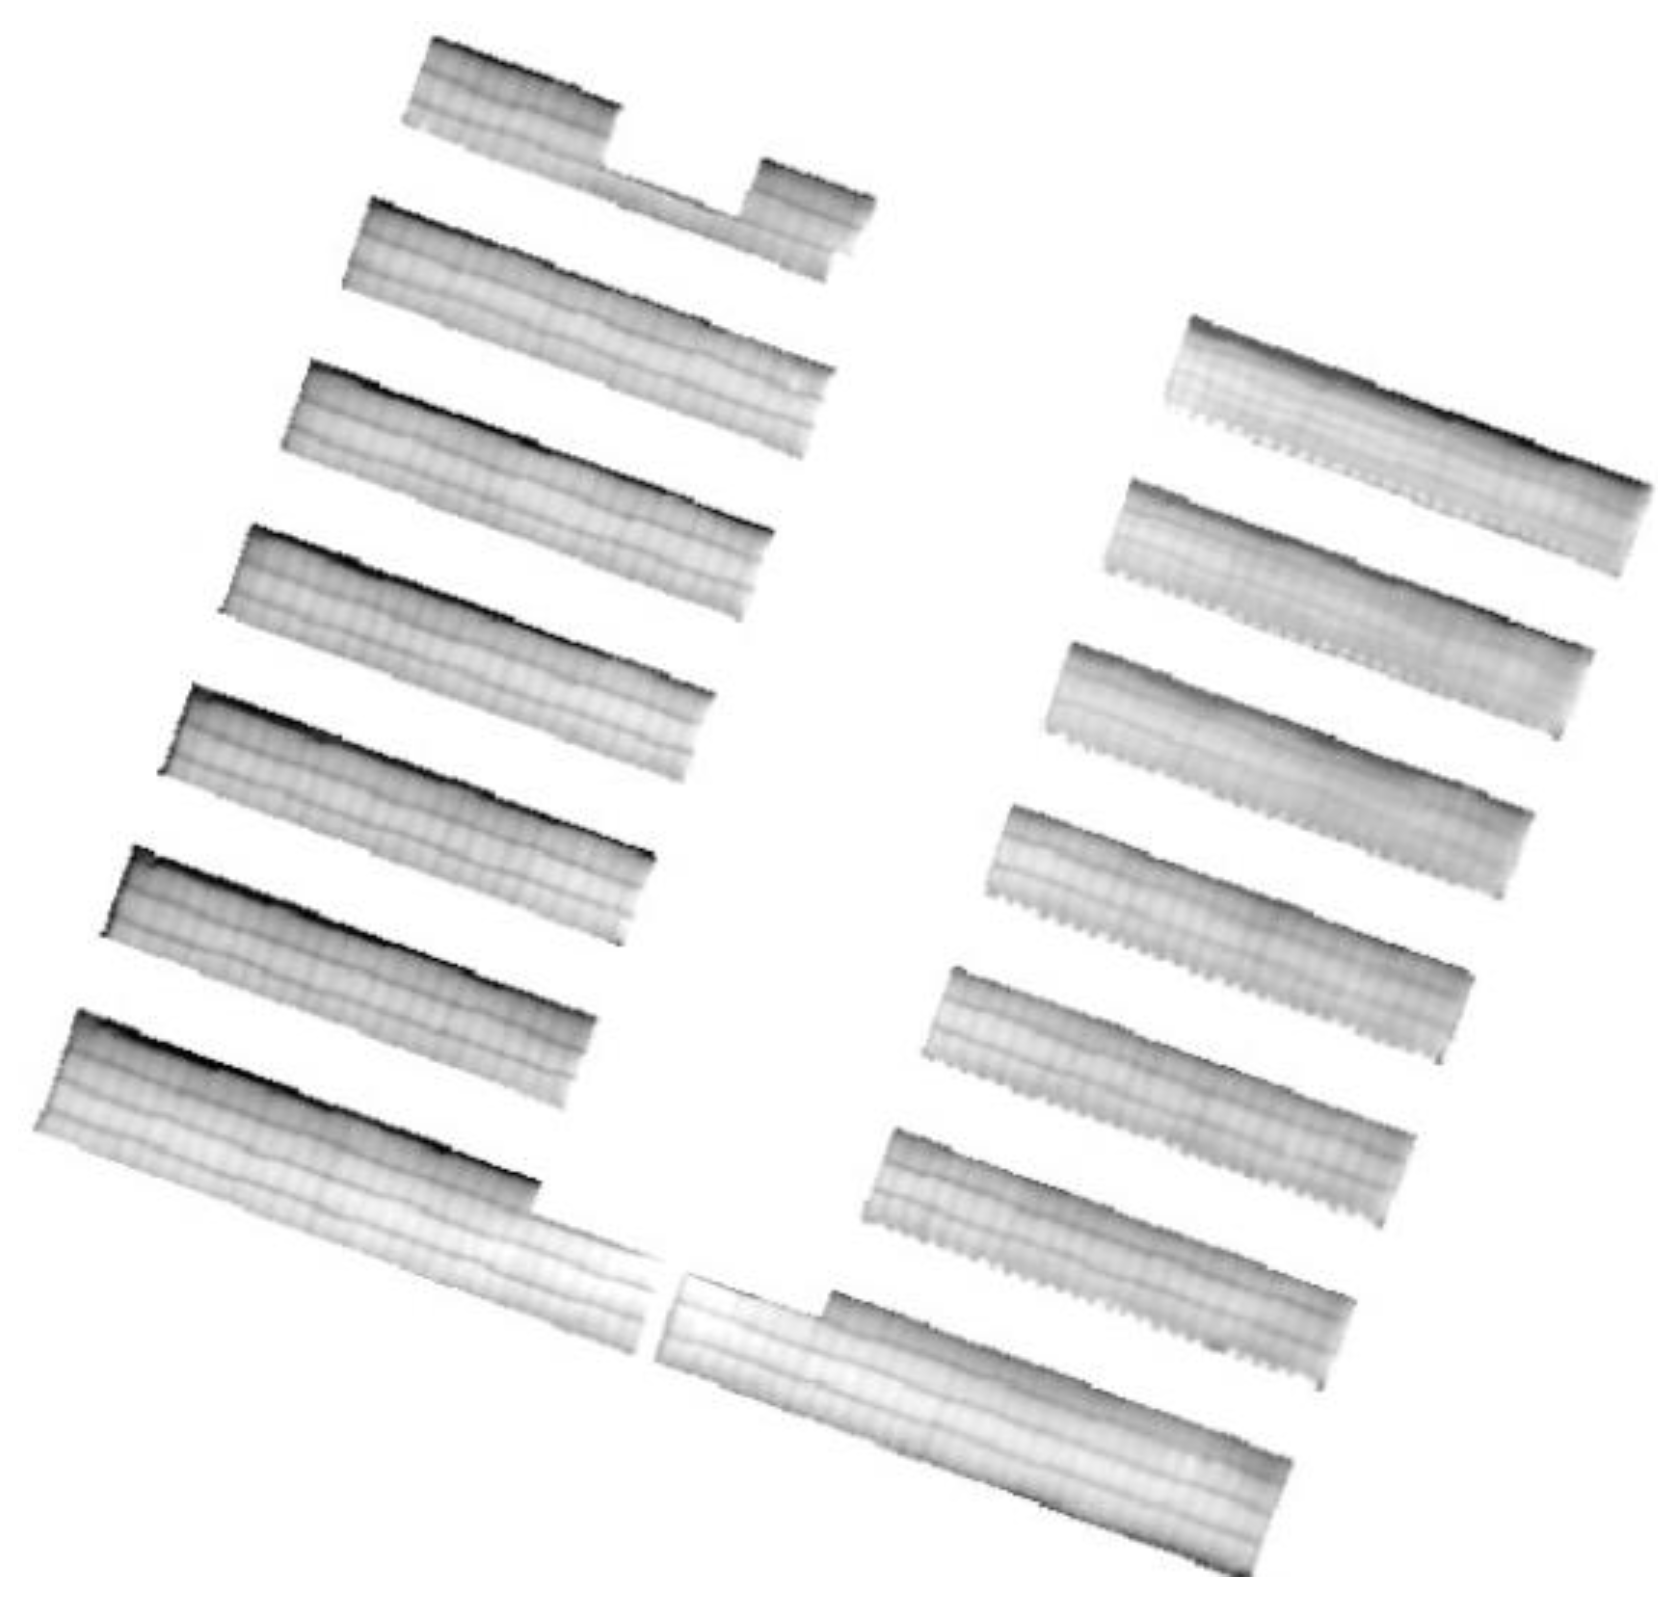
5.2.2. Investigation of Thermal Images Processing Failures
- Test 1—No used GCP: generated thermal orthomosaic with no parameters optimization was smaller than the one with parameters optimization. Moreover, this last and the RGB orthomosaic were not perfectly superimposed despite the fact that their images have been captured simultaneously and geotagged exactly two by two like each other with the same trajectory file.
- Test 2—GCP are introduced: thermal orthomosaic generated with no optimization presented heavy deformations, whereas the one with optimization was intact.
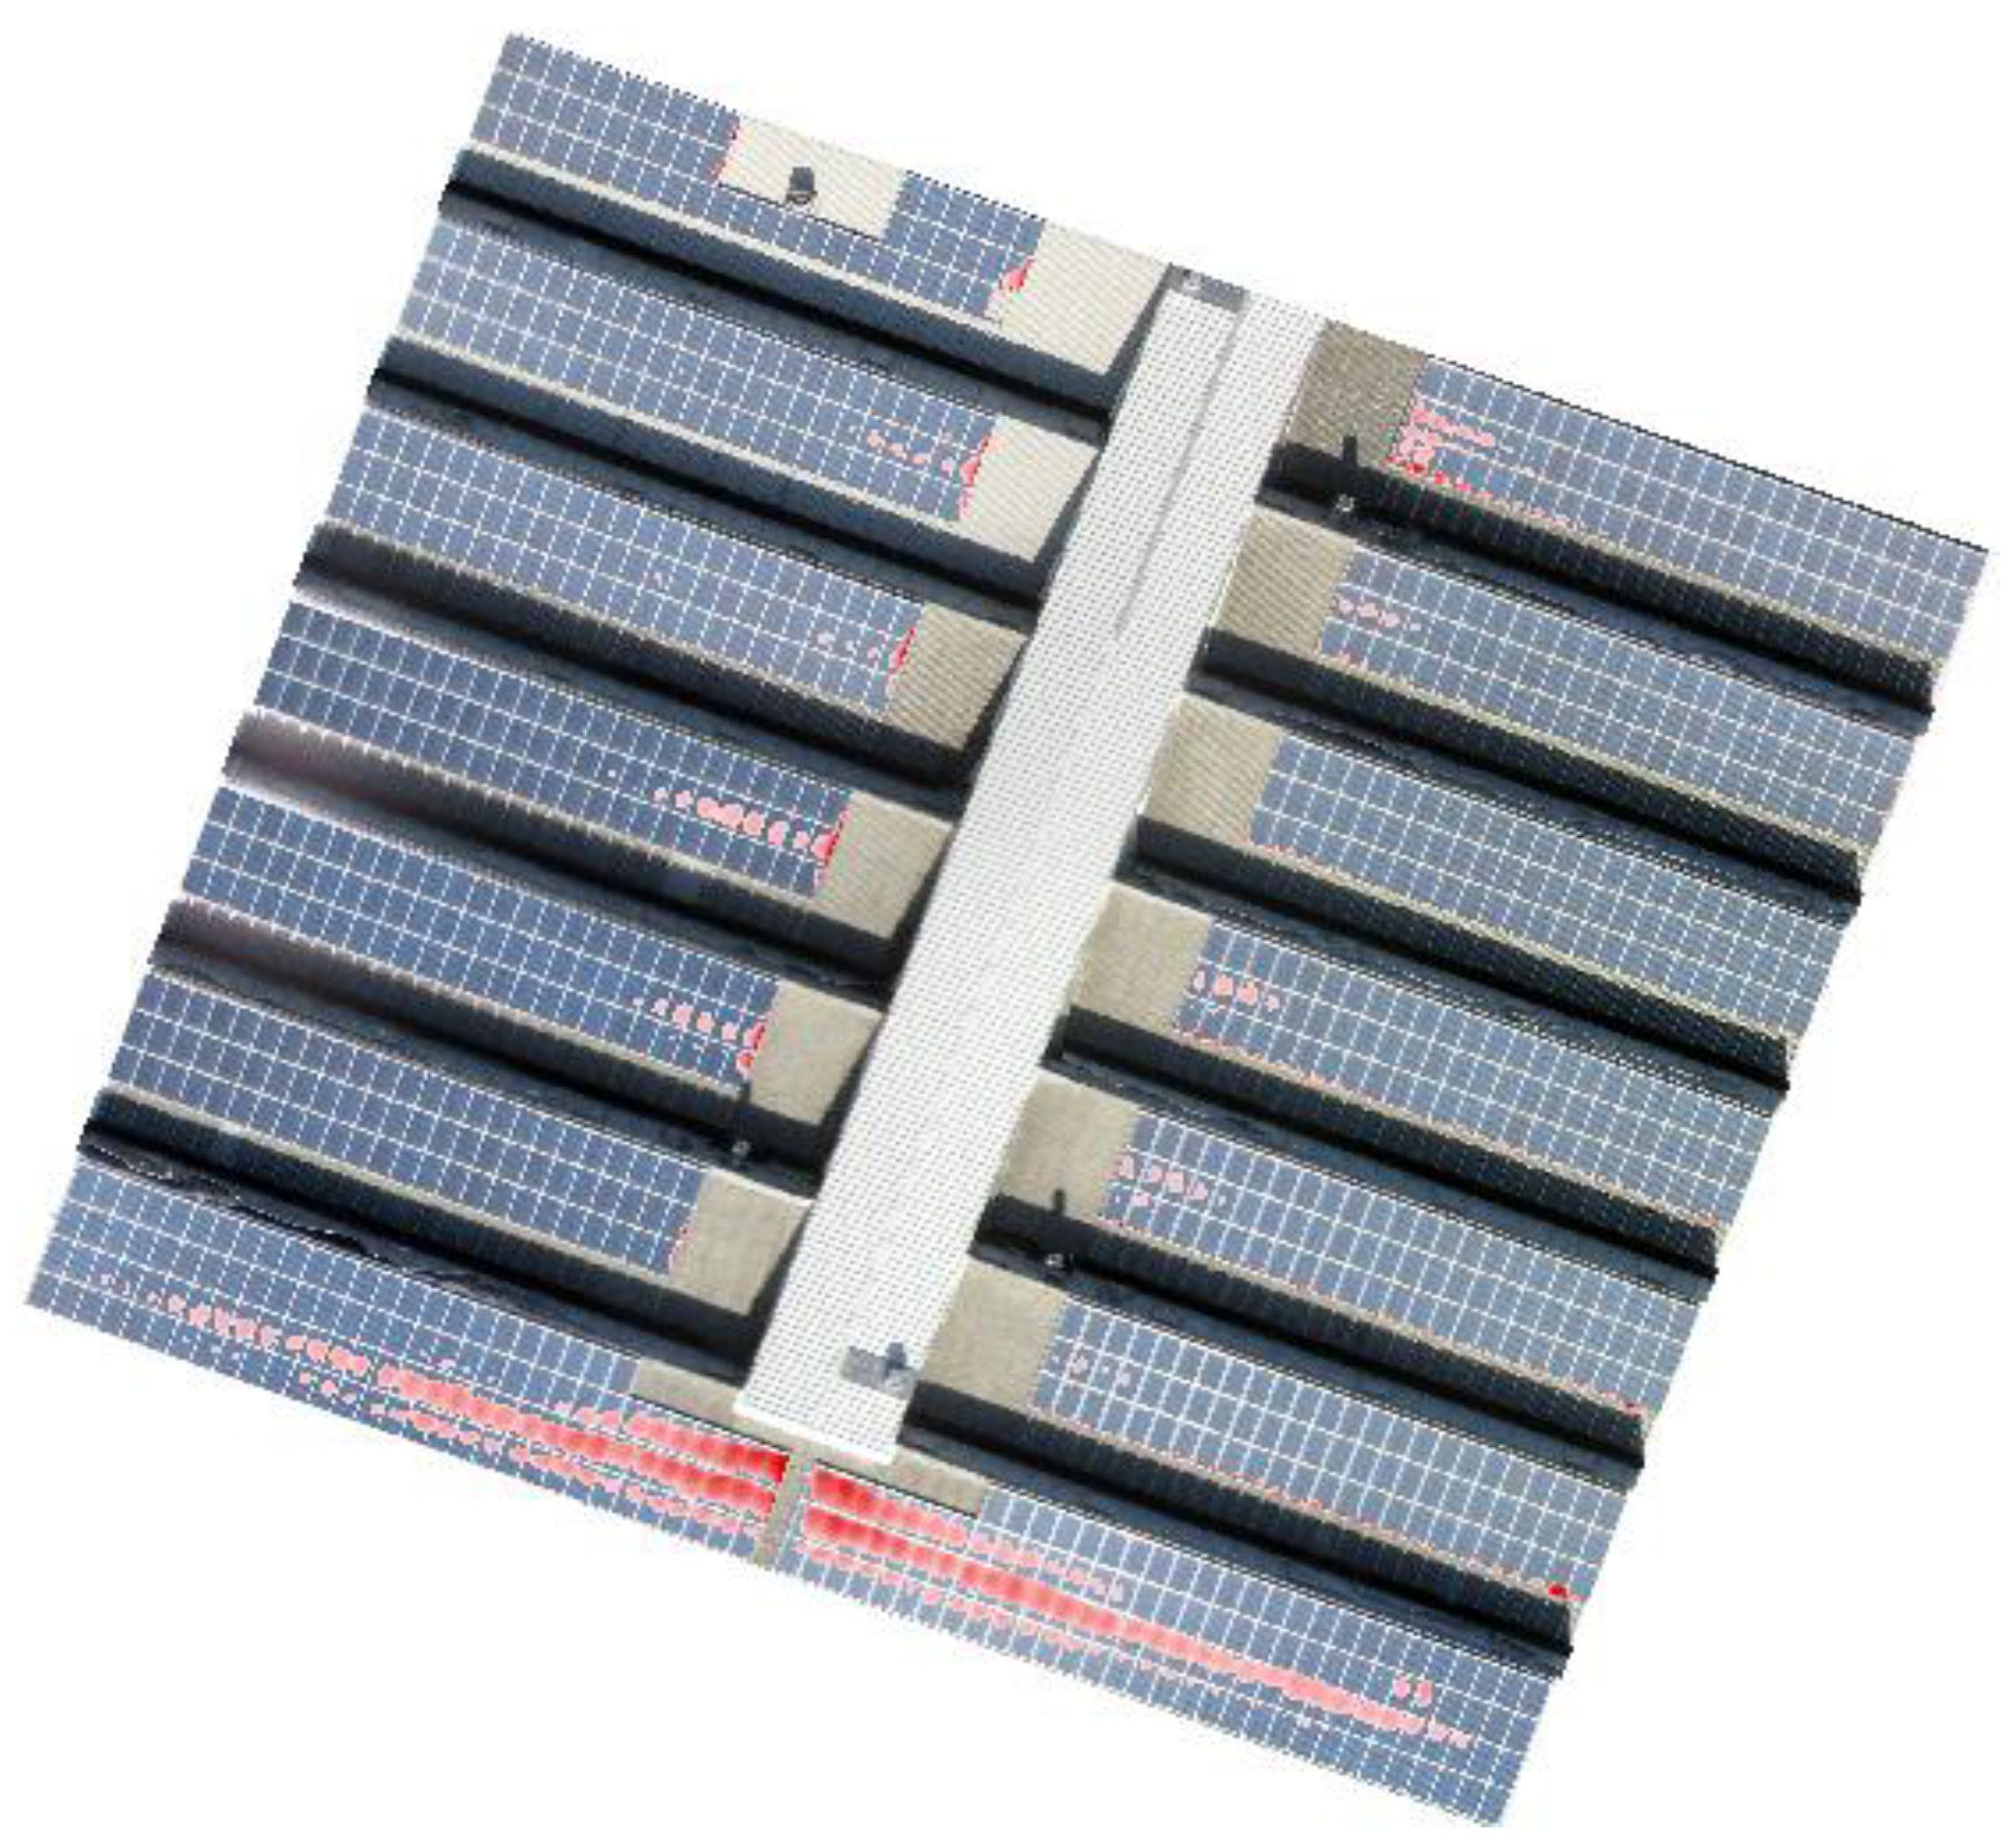
5.2.3. Hotspots Automatic Extraction
6. Further Discussion
6.1. Case of Small Installations
6.2. Case of Medium to Large Scale Plants
6.3. General Aspects
7. Final Conclusions and Recommendations
- testing other processing software platforms such as InPHO UAS Master, Bentley ContextCapture, ERDAS Imagine UAV module, as well as PhotoMOD;
- performing tests with performant RGB and thermal cameras for large scale installations;
- using RTK surveys for precise geo-localization of present defects; and,
- exploring possibilities that may offer the cooperation of pixel based and object-oriented approaches in defects extraction and classification.
Author Contributions
Funding
Acknowledgments
Conflicts of Interest
References
- Heinberg, R.; Fridley, D. Our Renewable Future: Laying the Path for One Hundred Percent Clean Energy; Island Press/Center for Resource Economics: Washington, DC, USA, 2016; pp. 1–15, ISBN-13: 978-1-61091-780-3. [Google Scholar]
- Lynn, P.A. Electricity from Sunlight: An Introduction to Photovoltaics; Wiley: Singapore, 2010; ISBN 978-0-470-74560-1. [Google Scholar]
- Sawin, J.L.; Seyboth, K.; Sverrisson, F. Renewables 2018 Global Status Report; Renew. Energy Policy Network 21th Century: Paris, France, 2016. [Google Scholar]
- Ferrara, C.; Philipp, D. Why do PV modules fail? Energy Procedia 2011, 15, 379–387. [Google Scholar] [CrossRef]
- Labouret, A.; Villoz, M. Énergie Solaire Photovoltaïque, 5th ed.; Dunod: Paris, France, 2010; ISBN 978-2-10-055598-7. [Google Scholar]
- Madeti, S.R.; Singh, S.N. Monitoring system for photovoltaic plants: A review. Renew. Sustain. Energy Rev. 2016, 67, 1180–1207. [Google Scholar] [CrossRef]
- Peled, A.; Appelbaum, J. Minimizing the current mismatch resulting from different locations of solar cells within a PV module by proposing new interconnections. Solar Energy 2016, 135, 840–847. [Google Scholar] [CrossRef]
- Köntges, M.; Kurtz, S.; Packard, C.; Jahn, U.; Berger, K.; Kato, K.; Friesen, T.; Liu, H.; Iseghem, M. Review of Failures of Photovoltaic Modules; IEA-PVPS Report; International Energy Agency: Paris, France, 2014; ISBN 978-3-906042-16-9. [Google Scholar]
- Forniés, E.; Naranjo, F.; Mazo, M.; Ruiz, F. The influence of mismatch of solar cells on relative power loss of photovoltaic modules. Solar Energy 2013, 97, 39–47. [Google Scholar] [CrossRef]
- Silvestre, S.; Boronat, A.; Chouder, A. Study of bypass diodes configuration on PV modules. Applied Energy 2009, 86, 1632–1640. [Google Scholar] [CrossRef]
- Wang, Y.; Itako, K.; Kudoh, T.; Koh, K.; Ge, Q. Voltage-based hot-spot detection method for photovoltaic string using a projector. Energies 2017, 10, 230. [Google Scholar] [CrossRef]
- Kajari-Schröder, S.; Kunzea, I.; Köntges, M. Criticality of cracks in PV modules. Energy Procedia 2012, 27, 658–663. [Google Scholar] [CrossRef]
- Djordjevic, S.; Parlevliet, D.; Jennings, P. Detectable faults on recently installed solar modules in Western Australia. Renew. Energy 2013, 67, 1–7. [Google Scholar] [CrossRef]
- Lopez-Garcia, J.; Pozza, A.; Sample, T. Long-term soiling of silicon PV modules in a moderate subtropical climate. Solar Energy 2016, 130, 174–183. [Google Scholar] [CrossRef]
- Pedersen, H.; Strauss, J.; Selj, J. Effect of soiling on photovoltaic modules in Norway. Energy Procedia 2016, 92, 585–589. [Google Scholar] [CrossRef]
- Piliougine Rocha, M.; Carretero Rubio, J.E.; Sidrach-de-Cardona, M.; Montiel, D.; Sánchez-Friera, P. Comparative analysis of the dust losses in photovoltaic modules with different cover glasses. In Proceedings of the 23rd European Photovoltaic Solar Energy Conference and Exhibition, Valencia, Spain, 1–5 September 2008; pp. 2698–2700. [Google Scholar] [CrossRef]
- Mani, M.; Pillai, R. Impact of dust on solar photovoltaic (PV) performance: Research status, challenges and recommendations. Renew. Sustain. Energy Rev. 2010, 14, 3124–3131. [Google Scholar] [CrossRef]
- Abideen Afridi, M.; Arbab, M.; Bilal, M.; Ullah, M.; Ullah, N. Determining the effect of soiling and dirt particles at various tilt angles of photovoltaic modules. Int. J. Eng. Works 2017, 4, 143–146. [Google Scholar]
- Sinha, A.; Sastry, O.S.; Gupta, R. Detection and characterization of delamination in PV modules by active infrared thermography. Nondestruct. Test. Eval. 2016, 31, 1–16. [Google Scholar] [CrossRef]
- Meyer, S.; Richter, S.; Timmel, S.; Gläser, M.; Weerner, M.; Swatek, S.; Hagendorf, C. Snail trails: Root cause analysis and test procedures. Energy Procedia 2013, 38, 498–505. [Google Scholar] [CrossRef]
- Quarter, P.B.; Grimaccia, F.; Leva, S.; Musseta, M.; Aghaei, M. Light Unmanned Aerial Vehicles (UAVs) for Cooperative Inspection of PV Plants. IEEE J. Photov. 2014, 4, 1107–1113. [Google Scholar] [CrossRef]
- Bun, L. Détection et Localisation de Défauts Dans un Système Photovoltaïque. Ph.D. Thesis, Université de Grenoble, Grenoble, France, 2011. [Google Scholar]
- Mayfield, R. Photovoltaic Design & Installation for Dummies; Wiley: Hoboken, NJ, USA, 2010; ISBN 978-0-470-59893-1. [Google Scholar]
- Tsanakas, A.; Long, D.H.; Al-Shakarchi, F. Advanced inspection of photovoltaic installations by aerial triangulation and terrestrial georeferencing of thermal/visual imagery. Renew. Energy 2016, 102, 224–233. [Google Scholar] [CrossRef]
- Mansouri, A.; Zettl, M.; Mayer, O.; Lynass, M.; Bucher, M.; Stern, O.; Burhenne, R. Defect Detection in Photovoltaic Modules Using Electroluminescence Imaging. In Proceedings of the 27th European Photovoltaic Solar Energy Conference and Exhibition, Frankfurt, Germany, 24–28 September 2012; pp. 3374–3378. [Google Scholar] [CrossRef]
- Ebner, R.; Zamini, M.; Újvári, G. Defect analysis in different photovoltaic modules using electroluminescence (EL) and infrared thermography (IR). In Proceedings of the 25th European Photovoltaic Solar Energy Conference and Exhibition/5th World Conference on Photovoltaic Energy Conversion, Valencia, Spain, 6 September 2010; pp. 333–336. [Google Scholar] [CrossRef]
- Minkina, W.; Dudzik, S. Infrared Thermography: Errors and Uncertainties; Wiley: Hoboken, NJ, USA, 2009; ISBN 978-0-470-74718-6. [Google Scholar]
- Brébec, J.; Desmarais, T.; Favier, A.; Ménétrier, M.; Noël, B.; Noël, R.; Orsini, C.; Vanhaecke, J. Thermodynamique 2ème Année MP-MP* PC-PC* PSI-PSI* PT-PT*; Hachette: Paris, France, 2012; ISBN-10: 201145641X. [Google Scholar]
- Modest, M.F. Radiative Heat Transfer; Elsevier: Amsterdam, The Netherlands, 2013; ISBN-13: 978-0123869449/ISBN-10: 0123869447. [Google Scholar]
- Williams, T.L. Thermal Imaging Cameras: Characteristics and Performance; CRC Press: Boca Raton, FL, USA, 2009; ISBN 9781420071856. [Google Scholar]
- Tošer, P.; Bača, P.; Neoral, J. The Ways How to Measure the Characteristics of a Solar Panel. ECS Trans. 2014, 48, 297–302. [Google Scholar] [CrossRef]
- Prakash, R. Infrared Thermography; InTech: Rijeka, Croatia, 2012; p. 222. [Google Scholar]
- Qingju, T.; Jingmin, D.; Junyan, D.; Chunsheng, L.; Yuanlin, L.; Chunping, R. Quantitative Detection of Defects Based on Markov-PCA-BP Algorithm Using Pulsed Infrared Thermography Technology. Infrared Phys. Technol. 2016, 77, 144–148. [Google Scholar] [CrossRef]
- Coello, J.; Perez, L.; Parral, V.; Gomez, R. Implementation of Aerial Thermography Inspection of PV Modules in the O&M Activities in Large PV Plants. In Proceedings of the 32st European Photovoltaic Solar Energy Conference and Exhibition, Munich, Germany, 20–24 June 2016; pp. 1730–1735. [Google Scholar]
- Aghaei, M.; Dolara, A.; Leva, S.; Grimaccia, F. Image Resolution and Defects Detection in PV Inspection by Unmanned Technologies. In Proceedings of the IEEE Power and Energy Society General Meeting (PESGM), Boston, MA, USA, 17–21 July 2016; pp. 1–5. [Google Scholar] [CrossRef]
- Mayekar, P.; Kotmire, N.; Wagh, M.; Shinde, N. Review on the Thermographic Analysis of PV panels/system using the infrared thermal cameras. Int. J. Sci. Eng. Appl. Sci. 2016, 2, 135–139. [Google Scholar]
- Grimaccia, F.; Leva, S.; Niccolai, A. PV Plant Digital Mapping for Modules’ Defects Detection by Unmanned Aerial Vehicles. IET Renew. Power Gen. 2017. [Google Scholar] [CrossRef]
- Daliento, S.; Chouder, A.; Guerriero, P.; Massi Pavan, A.; Mellit, A.; Moeini, R.; Tricoli, P. Monitoring, Diagnosis, and Power Forecasting for Photovoltaic Fields: A Review. Int. J. Photoenergy 2017. [Google Scholar] [CrossRef]
- Kim, D.; Youn, J.; Kim, C. Automatic fault recognition of photovoltaic modules based on statistical analysis of UAV thermography. Int. Arch. Photogr. Remote Sens. Spat. Inf. Sci. 2017, 179–182. [Google Scholar] [CrossRef]
- Dotenco, S.; Dalsass, M.; Winkler, L.; Wurzner, T.; Brabec, C.; Maier, A.K.; Gallwitz, F. Automatic detection and analysis of photovoltaic modules in aerial infrared imagery. In Proceedings of the IEEE Winter Conference on Applications of Computer Vision (WACV), Lake Placid, NY, USA, 7–10 March 2016; pp. 1–9. [Google Scholar] [CrossRef]
- Muhammad, B.; Prasad, R.; Nisi, M.; Manella, A.; Gagliarde, G.; Cianca, E.; Marenchino, D.; Angrisano, A.; Addabbo, P.; Ullo, S. Automating the Maintenance of Photovoltaic Power Plants; Global Wireless Summit (GWS): Cape Town, South Africa, 2017; pp. 6–11. [Google Scholar] [CrossRef]
- Leotta, G.; Pugliatti, P.M.; Di Stefano, A.; Aleo, F.; Bizzarri, F. Post processing technique for thermo-graphic images provided by drone inspections. In Proceedings of the 31st European Photovoltaic Solar Energy Conference and Exhibition (EU PVSEC ’15), Hamburg, Germany, 14–18 September 2015; pp. 1799–1803. [Google Scholar] [CrossRef]
- López-Fernández, L.; Lagüela, S.; Fernández, J.; González-Aguilera, D. Automatic Evaluation of Photovoltaic Power Stations from High-Density RGB-T 3D Point Clouds. Remote Sens. 2017, 9, 631. [Google Scholar] [CrossRef]
- Migan, G. Study of the Operating Temperature of a PV Module; Project Report; Lund University, Faculty of Engineering: Lund, Sweden, 2013. [Google Scholar]


| RGB Camera | Thermal Camera | |
|---|---|---|
| Resolution | 38 Mpx (7152 × 5368 px) | 80 × 60 px |
| Focal | 7.94 mm | 1.425 mm |
| Pixel Size | 1.4 μm | 17 μm |
| Field of View | 63° | 50° |
| Video | HD (1280 × 720 pixels) Recorded on board or streamed | Yes |
| Canon IXUS 127HS | ThermoMAP | |
|---|---|---|
| Resolution | 4608 × 3456 px | 640 × 512 px |
| Focal | 4.37 mm | 9.5 mm |
| Pixel Size | 1.34 μm | 17 μm |
| Installation | Flight | Percent of Calibrated Images |
|---|---|---|
| 1 | Automatic (Grid path) | 74% |
| Manual | 76% | |
| 2 | Automatic | 65% |
| Manual | Calibration failed |
| Installation | Flight | Difference between Initial and Calibrated Values |
|---|---|---|
| 1 | Automatic (Grid path) | 56% |
| Manual | 71% | |
| 2 | Automatic | 41% |
| Manual | Calibration failed |
© 2018 by the authors. Licensee MDPI, Basel, Switzerland. This article is an open access article distributed under the terms and conditions of the Creative Commons Attribution (CC BY) license (http://creativecommons.org/licenses/by/4.0/).
Share and Cite
Zefri, Y.; ElKettani, A.; Sebari, I.; Ait Lamallam, S. Thermal Infrared and Visual Inspection of Photovoltaic Installations by UAV Photogrammetry—Application Case: Morocco. Drones 2018, 2, 41. https://doi.org/10.3390/drones2040041
Zefri Y, ElKettani A, Sebari I, Ait Lamallam S. Thermal Infrared and Visual Inspection of Photovoltaic Installations by UAV Photogrammetry—Application Case: Morocco. Drones. 2018; 2(4):41. https://doi.org/10.3390/drones2040041
Chicago/Turabian StyleZefri, Yahya, Achraf ElKettani, Imane Sebari, and Sara Ait Lamallam. 2018. "Thermal Infrared and Visual Inspection of Photovoltaic Installations by UAV Photogrammetry—Application Case: Morocco" Drones 2, no. 4: 41. https://doi.org/10.3390/drones2040041
APA StyleZefri, Y., ElKettani, A., Sebari, I., & Ait Lamallam, S. (2018). Thermal Infrared and Visual Inspection of Photovoltaic Installations by UAV Photogrammetry—Application Case: Morocco. Drones, 2(4), 41. https://doi.org/10.3390/drones2040041