Article

Graph-Based Conversation Analysis in Social Media

by
Marco Brambilla
1,*,
Alireza Javadian Sabet
2,
Kalyani Kharmale
3 and
Amin Endah Sulistiawati
1
1
Politecnico di Milano, Dipartimento di Elettronica, Informazione e Bioingegneria, Via Giuseppe Ponzio, 34/5, I-20133 Milano, Italy
2
Department of Informatics and Networked Systems, University of Pittsburgh, Pittsburgh, PA 15260, USA
3
Faculty of Informatics, Università della Svizzera Italiana, Via Buffi 13, 6900 Lugano, Switzerland
*
Author to whom correspondence should be addressed.
Big Data Cogn. Comput. 2022, 6(4), 113; https://doi.org/10.3390/bdcc6040113
Submission received: 17 June 2022 / Revised: 23 September 2022 / Accepted: 30 September 2022 / Published: 12 October 2022
(This article belongs to the Special Issue Graph-Based Data Mining and Social Network Analysis)

Abstract

:
Social media platforms offer their audience the possibility to reply to posts through comments and reactions. This allows social media users to express their ideas and opinions on shared content, thus opening virtual discussions. Most studies on social networks have focused only on user relationships or on the shared content, while ignoring the valuable information hidden in the digital conversations, in terms of structure of the discussion and relation between contents, which is essential for understanding online communication behavior. This work proposes a graph-based framework to assess the shape and structure of online conversations. The analysis was composed of two main stages: intent analysis and network generation. Users’ intention was detected using keyword-based classification, followed by the implementation of machine learning-based classification algorithms for uncategorized comments. Afterwards, human-in-the-loop was involved in improving the keyword-based classification. To extract essential information on social media communication patterns among the users, we built conversation graphs using a directed multigraph network and we show our model at work in two real-life experiments. The first experiment used data from a real social media challenge and it was able to categorize 90% of comments with 98% accuracy. The second experiment focused on COVID vaccine-related discussions in online forums and investigated the stance and sentiment to understand how the comments are affected by their parent discussion. Finally, the most popular online discussion patterns were mined and interpreted. We see that the dynamics obtained from conversation graphs are similar to traditional communication activities.

1. Introduction

The rise of social media (SM) has reshaped the span, perspective, and purpose of communication, as well as the way that peoples interact with each other [1]. Such interactions include various activities such as sharing links about interesting content, public updates on the profile (e.g., location data or current activities), and commenting or liking photos, videos, posts, and updates. SM simplifies information spreading and facilitates sharing media with everybody by diminishing boundaries caused by distance.
The reasons why people use SM include, but are not limited to, interacting within the inner circle of friendship, community gathering, entertainment purposes or subscribing to news; also as presented in various works such as [2,3,4,5], evolving commonly for knowledge sharing purpose on online learning platforms and question and answering (Q&A) sites. Furthermore, as discussed in [6,7], many companies adopt SM to utilize this growing trend for gaining business values such as improving customer traffic and satisfaction, increasing sales, creating brand awareness, brand loyalty, and building reputation. Dong et al., 2015 [8] discuss typical activities supported by SM applications such as branding (marketing and content delivery), sales, customer care and support, product development and innovation.
The data driven approach of users’ behavioral analysis is based on the concept of big data paradigm [9,10]. Since the number of SM users snowballs (http://wearesocial.com/digital-2020 (accessed on 30 April 2022 )) and more and more human activities leave digital imprints, Tufekci, 2014 [11] shows that collection, storage, and aggregation of SM data can be readily automated and exploited to extract valuable hints on the population behaviour, and opinions. Works [11,12] show how this leads to a technological inflection point with online social data as key to crucial insights into human behavior and extensively analyzed by scholars, corporations, politicians, and governments.
Schreck et al. [13] discuss how leveraging massive amounts of SM datasets such as from Twitter, Instagram, etc. presents many challenges. The data are multimodal and ambiguous in its content, as well as highly context- and user-dependent. Moreover, the rapid changes in the SM platform communications patterns challenges the choice of appropriate approaches to deal with the systems’ complexity.
Various methods exist for describing and modeling complex SM system; among them Leskovec et al. [14] and its evolutions employ network analysis, neural networks, and graph mining. The implementation of network analysis on SM data has become popular since the number of networks and graph mining libraries increased. The presence of graph libraries simplifies intricacy analysis of SM, yet the generated networks are still complex.

1.1. Problem Statement and Objective

It is crucial to understand the communication behavior between SM users. For instance, when users express their idea through comment sessions on an SM post, conversations are created at least between the author and the engaged users. These formed conversations among SM users are the core of virtual communication that deputizes closely to real communication. Since most studies on SNs are focused on a user-to-user relationship, they sometimes miss the crucial information from the conversations, i.e., the user-generated content (UGC). These UGC are fundamental to conceive online communication behavior.
Considering a large dataset from SM platforms with its complex structure, the research questions that lead to this work are as follow:
  • How to build a proper graph for describing the conversational aspect of online SM?
  • How to reconstruct conversations from comments belong to an SM post/update that does not follow reply feature?
  • How to assign an appropriate category label to an SM comment that represents the author’s intention?
  • How to uncover micro topics that are discussed under one main topic.
  • How are the topics, stance, and sentiments propagate on the discussion forums?
  • What frequent patterns can be found in conversation graphs of online SM?

1.2. Method

This study proposes a new approach for analyzing online conversations from SM platforms. The approach consists of two main stages.
The first step is “intention analysis”on SM comments reflecting the thought of the authors. At first, we define a list of category names according to the popular bag-of-words model. Deterministic keyword-based classification is performed to assign a class label to each SM comment, with the aim of representing its meaning. We then employ machine learning based classification methods (namely, Naïve Bayes and SVM) to improve the categorization process on the content that remains uncategorized in consequence of the limited amount of available keywords. If also automatic classification detects the wrong class of a comment, human-in-the-loop techniques are involved in reforming the initial keywords in order to maximize the number of categorized comments.
The second stage is “graph model generation” according to the designed nodes, edges, and attributes, starting from the discussion elements and their relationships. Subsequently, conversation graphs are automatically reconstructed by identifying groups of comments connected by a replyedge in the generated network. Therefore, conversations graphs with labeled comments are produced portraying patterns of communication behavior between the comments’ authors. Finally, statistical and matrix analysis is performed on the collected conversations.
The motivation behind having a two-stage method is that, at first, we identify the intentions behind each comment, then, using a graph modeling approach, we are able to study the interactions and dependencies between the identified intentions. In this way, we could investigate if there is some kinds of patterns that combine the shapes of discussions.
The proposed approach is validated on a real long-running event [15,16] named YourExpo2015 (https://www.instagram.com/yourexpo2015/ (accessed on 25 January 2020)), a photo challenge that took place on Instagram before the Expo Milano 2015 event. It involves a large dataset of Instagram photos posted during the challenge period, together with the related users and comments.
In this work, we further extend the proposed methodology presented in [17] by expanding the analysis to unsupervised approaches covering, among others, sentiment and topic analysis, as well as stance analysis.
We validate the approach through another experiment on real data, covering the COVID Vaccine-related discussions on the Reddit platform.
In the new steps of the approach, we first analyze the sentiment of every comment on the forum. The next step is to find out micro topics related to the main topic of discussion. This topic modeling is performed by using the Latent Dirichlet Allocation (LDA) algorithm. Then, we study if starting with a particular topic affects the emergence of other topics in a single discussion thread. Going forward, we also determine the stance of each comment. For this purpose, we use a supervised machine learning approach. First, we create a training and testing dataset to label stance for some comments and evaluate different classification models. Then, using the best model, we label the entire dataset. Once performed with stance detection, we also study if starting with a particular stance affects the stance of other comments in a single discussion thread. Finally, we analyze the correlation between topic, sentiment, and stance. We also investigate if a particular topic can change comments’ stance in a single discussion thread. We construct a graph database for these discussions and then study the propagation of these attributes for single threads of discussions by building different perspectives.

1.3. Contribution

This work proposes a graph-based framework to asses the shape and structure of online conversations. Our approach can be used by companies or organizations aiming at analyzing the communication behaviors of their audiences on SM platforms. Using text classification on SM comments, the most relevant aspects pertaining themes of interest for the organization can be obtained. Thus, by mining the illustrated comment-to-comment relationships, we are able to extract patterns from conversation graphs as well as identifying the most frequent patterns. Starting from the understanding of users’ interactions, it is possible to design automatic response features that adapt to such behavior and maximize the interactivity with the users, according to the AI-based chatbot design vision [18].

1.4. Structure of the Work

The remainder of this work is organized as follows: Section 2 discusses the contribution of related works that have been conducted to other issues. This section also briefly reviews the fundamental theories underlying the work. Section 3 provides a pipeline design for text classification matters. It also provides a general structure of the graph generation and graph visualization. Section 4 presents a set of experiments on a real case dataset from an SM platform on the designed system. Section 5 discusses the outcome of the proposed approach, which comprises the results of the test applications and test results analysis applications. Finally, Section 6 provides the conclusion of the research and suggestions for improvement and development of the applications in the future.

2. Related Work and Background

This section discusses the state-of-the-art where previous related studies have presented, enclosed by presenting the novelty of the proposed methodology. Furthermore, we briefly discuss the fundamental background for familiarizing the readers with the terminologies and notations that we use in the work.

2.1. Related Work

Brief reviews about past researches related to SM in real cases are described here in order to support basic knowledge on our study. The enclosed section explains the uniqueness and novelty of our approach which presents advancement of previous works.

2.1.1. Social Media

By now, the growth of SM platforms has caused massive awareness in societies across the globe. Studies [19,20,21,22,23] show how the tremendous impact of SM has penetrated the cultures and most aspects of people’s lives. As studied in [24], these platforms proffer massive leverage on how social relationships and networks are established, mediated, and maintained, and consequently, the changes they bring to the society. According to Henderson et al. [25] SN technologies have shifted the nature of internet services from being consumption-based towards interactive and collaborative in people’s daily life. Multiform of SM introduced new ways of communication [26] for connecting with friends as well as making new ones virtually. Hudson et al. [27] discussed how many SM platforms have been broadly adopted by companies to embrace the growing trend leading to gain business benefits, such as encouraging customer trading, rising customer devotion, and retention, improving customer satisfaction, developing brand awareness, and creating a reputation. With remarkable opportunities, marketers are adapting their strategies to progressively reach networked customers, as well as, making efforts to drive customer engagement by putting more considerations on competing for SM consumers’ attention. SM users generate a massive amount of accessible content. To leverage benefits from the SM data as a key to crucial insights into human behavior, many studies have been conducted to perform analysis of SM data by scholars, corporations, politicians, journalists, and governments [28,29,30,31,32,33,34,35].

2.1.2. Graph Analysis of Social Network

There are various methods, besides content analysis to describe and model a complex SM system. Myers et al. [36] investigates the structural characteristics of Twitter’s follow graph with an intellectual objective to understand how such networks arise. Additionally, a practical perspective is discussed to better understand the user and graph behavior that helps in building better products. Zhao et al. [37] formulate a new problem of cold-start specialized finding in Community-based Question Answering SM platforms by employing Quora. The study utilizes the “following relations” between the users and topics of interest to build a graph; then, Graph Regularized Latent Model Graph is employed to infer the expertise of users based on both past question-answering activities and an inferred user-to-user graph. Backstrom et al. [38] analyzed the romantic relationship status on Facebook using a network structure representing all the connections among a person’s friends; the result offers methods to identify types of structurally significant people on SM. Buntain et al. [39] presented an identification method to find a social role, “answer-person”, based on the user interactions’ graph on Reddit platform. The approach is to study the pattern of graph driving an answer person has a star shape, and a discussion person has complex interconnected nodes. McAuley et al. [40] has developed a model for detecting circles that combine network structure as well as user profile information in a user’s ego network. Using graph techniques, Rao et al. [41] designed a new algorithm for community detection. Communities from Edge Structure and Node Attributes [42] models the statistical interaction between the network structure and the node attributes, which provides more accurate community detection as well as improved robustness in the presence of noise in the network structure. Another study on temporal networks by Paranjape et al. [43] aimed at understanding the key structural patterns in such networks. To do so, they designed a general framework for counting the the temporal motifs and an associated faster algorithm for various classes of motifs. The work concludes that motif counts accounts for identifying the structural patterns of temporal networks. Concerning the epidemic spread, Shang [44] models how social media and the raised awareness of information source can affect the spreading of information over social networks which potentially change the transmission mode of infectious diseases.

2.1.3. Conversation Graphs on Social Media

To date, some studies have been proposed that use additional features of SNs, beyond user-to-user relationships. Odiete et al. [45] investigates the connections between experts in different programming languages. The results suggest that programming languages can be recommended within organizational borders and programming domains. Ning et al. utilized graph analysis to better support Q&A systems. With initial ground knowledge given to the system, the method can extract a shared-interest group of people, whose interest is close to the initial potential respondents’ list. It also can sort the group of people according to a score of interest distance, and then recommend them to the questioner [46]. Aumayr et al. [47] explored classification methods to recover the reply structures in forum threads. They employed some basic features such as post distance and time difference. Cogan et al. [48] has proposed a new and robust method to reconstruct complete conversations around initial tweets. Their focus investigation has good results in generating conversation tweets. However, analysis of the tweets’ content is not performed, the retrieved conversations, composed of sets of connected tweet nodes, can give interesting information if the node has such class label attribute. Zayats et al. [49] has experimented with a task of predicting the popularity of comments in Reddit discussions using a graph-structured bidirectional LSTM. The popularity of comments is obtained by computing the number of connected nodes; the higher the number of linked nodes, the more popular the comment is. However, this method applies only to the ready-set reply feature of comments that are automatically recorded in Reddit. Hence, we can lose a chunk of comments in other SM platforms where users might not follow the reply feature to give their answers or opinions based on the previously posted comments. Kumar et al. [50] proposes a mathematical model for generation of basic conversation structure to explore the model that human follows during online conversation. Aragon et al. [51] investigated the impact of threading of the messages (i.e., hierarchical representation) instead of displaying them in a linear fashion. To do so, they studied a social news platform before and after transforming its interface to a hierarchical representation of the messages. The results of their work shows that the reciprocity increases as a result of message threading. As discussed in [52] the suitability of threading design of online conversation platforms, is highly dependent on the application itself. Various works such as [53,54,55] show how the contribution of individuals is increased when they feel unique and they are provided specific goals. In online conversations, reply and mention functions can be employed for this purpose. The results of another study by Budak et al. [56] on the Guardian’s commenting platform confirms the increase of the users’ commenting when the platform adapted threading. Samory et al. [57] employed quote mechanism to understand the social structure of the online communities which lack the explicit structural signals such as following-follower and friend mechanisms. The work focused on content interaction and ignoring the content itself. Moreover, the length and timing of the messages (i.e., quotes in the case of this study) have been disregarded in this study. The other work on quote mechanism by Garimella et al. [58], investigated the effects of this mechanism on Twitter political discourse. They found out that most of the users employ quote mechanism as a reply mechanism.

2.1.4. Proposed Network Analysis of Conversation Graphs

In this study, we propose a novel network analysis to learn conversation graphs on SM. These conversations are composed of interconnected comments by reply edge. The proposed method retrieves several conversations that emerge in an SM post by automatically detected reply comments. Moreover, we further analyze the users’ intentions in the comments represented by comments category. Concerning the intent analysis, it should be noted that this analysis is different from the sentiment analysis; generally, the output of sentiment analysis can be either positive, neutral, or negative [59,60,61,62]; however, the intent analysis proposed in this study explores various classes that are most relevant for the collected SM comments. Lastly, using the constructed conversations with labeled members, we are able to provide interesting information such as finding the common patterns.

2.2. Background

In this section, we undertake the necessary task of introducing some of the basic definitions in text classification using Naïve Bayes and SVM algorithms. We also discuss graph theory as well as the employed graph mining library, and graph visualization.

2.2.1. Web Scraping

Web scraping is the practice of extracting data through a program interacting with an API [63]. It is achieved by writing an automated program that performs web server queries, requests data (e.g., in HTML format), and then extracts the necessary information.

2.2.2. Text Classification

Text classification is a classical topic for NLP, in which one needs to assign predefined categories to free-text documents [64]. It plays an essential role in many applications such as information retrieval, data mining, web searching, and sentiment analysis [65,66,67,68,69].

2.2.3. Naïve Bayes

Naïve Bayes is one of the most efficient and effective inductive learning algorithms for text classification [70]. It is a linear classifier in which the probabilistic model is based on Bayes rule with the assumption that the features are mutually independent.

2.2.4. Support Vector Machines

SVM constructs one or a set of hyper-planes in a high-dimensional space for classification, regression, and other machine learning tasks [71]. SVM views a data point as a p-dimensional vector. The task is to separate points with a ( p 1 ) -dimensional hyperplane, called a linear classifier. Among the possible hyperplanes, we choose the one that has the largest distance to the nearest training data points of any class i.e., functional margin.

2.2.5. Multi Layer Perceptron (MLP)

MLP or feedforward neural network (NN) is a method of a deep artificial NN classifier. It is composed of more than one perceptron with at least three layers of nodes, an input layer, an output layer that makes predictions about the input, and an arbitrary number of hidden layers. Every node in a hidden layer operates on activations from the preceding layer and transmits activations forward to nodes of the next layer. Training involves adjusting the parameters/weights and biases of the model in order to minimize error [72].

2.2.6. Random Forest

Random Forest is an ensemble method where each of the ensemble classifiers is forming a decision tree classifier. Following a bagging procedure to generate a new group of training sets, each group will be fed to a decision tree and the summation of all output will form the final output of the model. The individual decision trees are generated using a random selection of attributes at each node to determine the split. During classification, each tree votes and the most popular class is returned [73].

2.2.7. Graph

Many real-world problems can conveniently be described using a diagram consisting of a set of points together with lines joining specific pairs of these points connecting the points [74]. A graph G consists of a finite vertex set V ( G ) , and an edge set E ( G ) ; where an edge is an unordered pair of distinct vertices of G [75]. An edge ( x , y ) is said to join the vertices x and y and is denoted by x y  [76].

2.2.8. Network

The terms graph and network model are usually referred to indistinctly in the literature. However, a more precise use of the terms would consider an alternative terminology, with the use of the term graph for the abstract mathematical concept referred to the high level model representing nodes and edges. The term network is then more suited to the specific adoption of graph models representing real-world objects in which the nodes represent entities and the edges represent the relationships among them [77,78]. As a result, networks are becoming a fundamental tool for understanding complex system in many scientific disciplines, such as neuroscience, engineering, and social science [79,80,81,82].

2.2.9. Implementation for Graph Analysis

There exist many tools such as [14,83,84] for graph analysis To analyze graphs and networks, we employ Stanford Network Analysis Platform (SNAP) [14]. In SNAP terminology, networks refer to graphs with attributes or features associated with nodes and edges. For the aim of network visualization, we utilize Gephi [85], which has widely been adopted by the research community [86,87].

3. Methodology

This section presents the methodology proposed in this work. It is composed of the following three main stages: Web Scraping, Text Processing, and Network Design. Initially, the design of data gathering from the Internet is constructed to extract data from SM platforms; afterwards, the data are stored in the database. We then perform text processing over the collected content in order to perform intent analysis and text classifications. The next step is to develop a multigraph network model (i.e., a graph with several types of ties on the same vertex set, as defined in graph theory [88]), representing the relationships between SM contents and actors, which will be used as a resource to construct conversation graphs.

3.1. Data Collection

Given a set of SM links, at first, we design a model to collect all the required data. For the sites which their contents are going to be retrieved, we designed an automated program to scrape those web pages and parse it into JSON format, which is suitable for analysis. Finally, we store the data into a database that supports JSON-like documents schemas.

3.2. Data Cleaning and Preprocessing

After removing the records with missing values, we adopt text processing to manipulate and reform the raw text particularly for the classification of SM comments. As illustrated in Figure 1, before applying text classification as proposed in this study, here we account for a pipeline used in text preprocessing. Since we collected data through API or scraping, we encountered very few incomplete data elements. Records with missing data have been removed. We applied two main processing steps. At first, we applied text cleaning by removing unwanted characters and typos, and then we applied stemming in order to produce bag-of-words out of the posted content. Finally, we computed the TF/IDF (Term Frequency-Inverse Document Frequency) scores to obtain the word/document weight matrix.

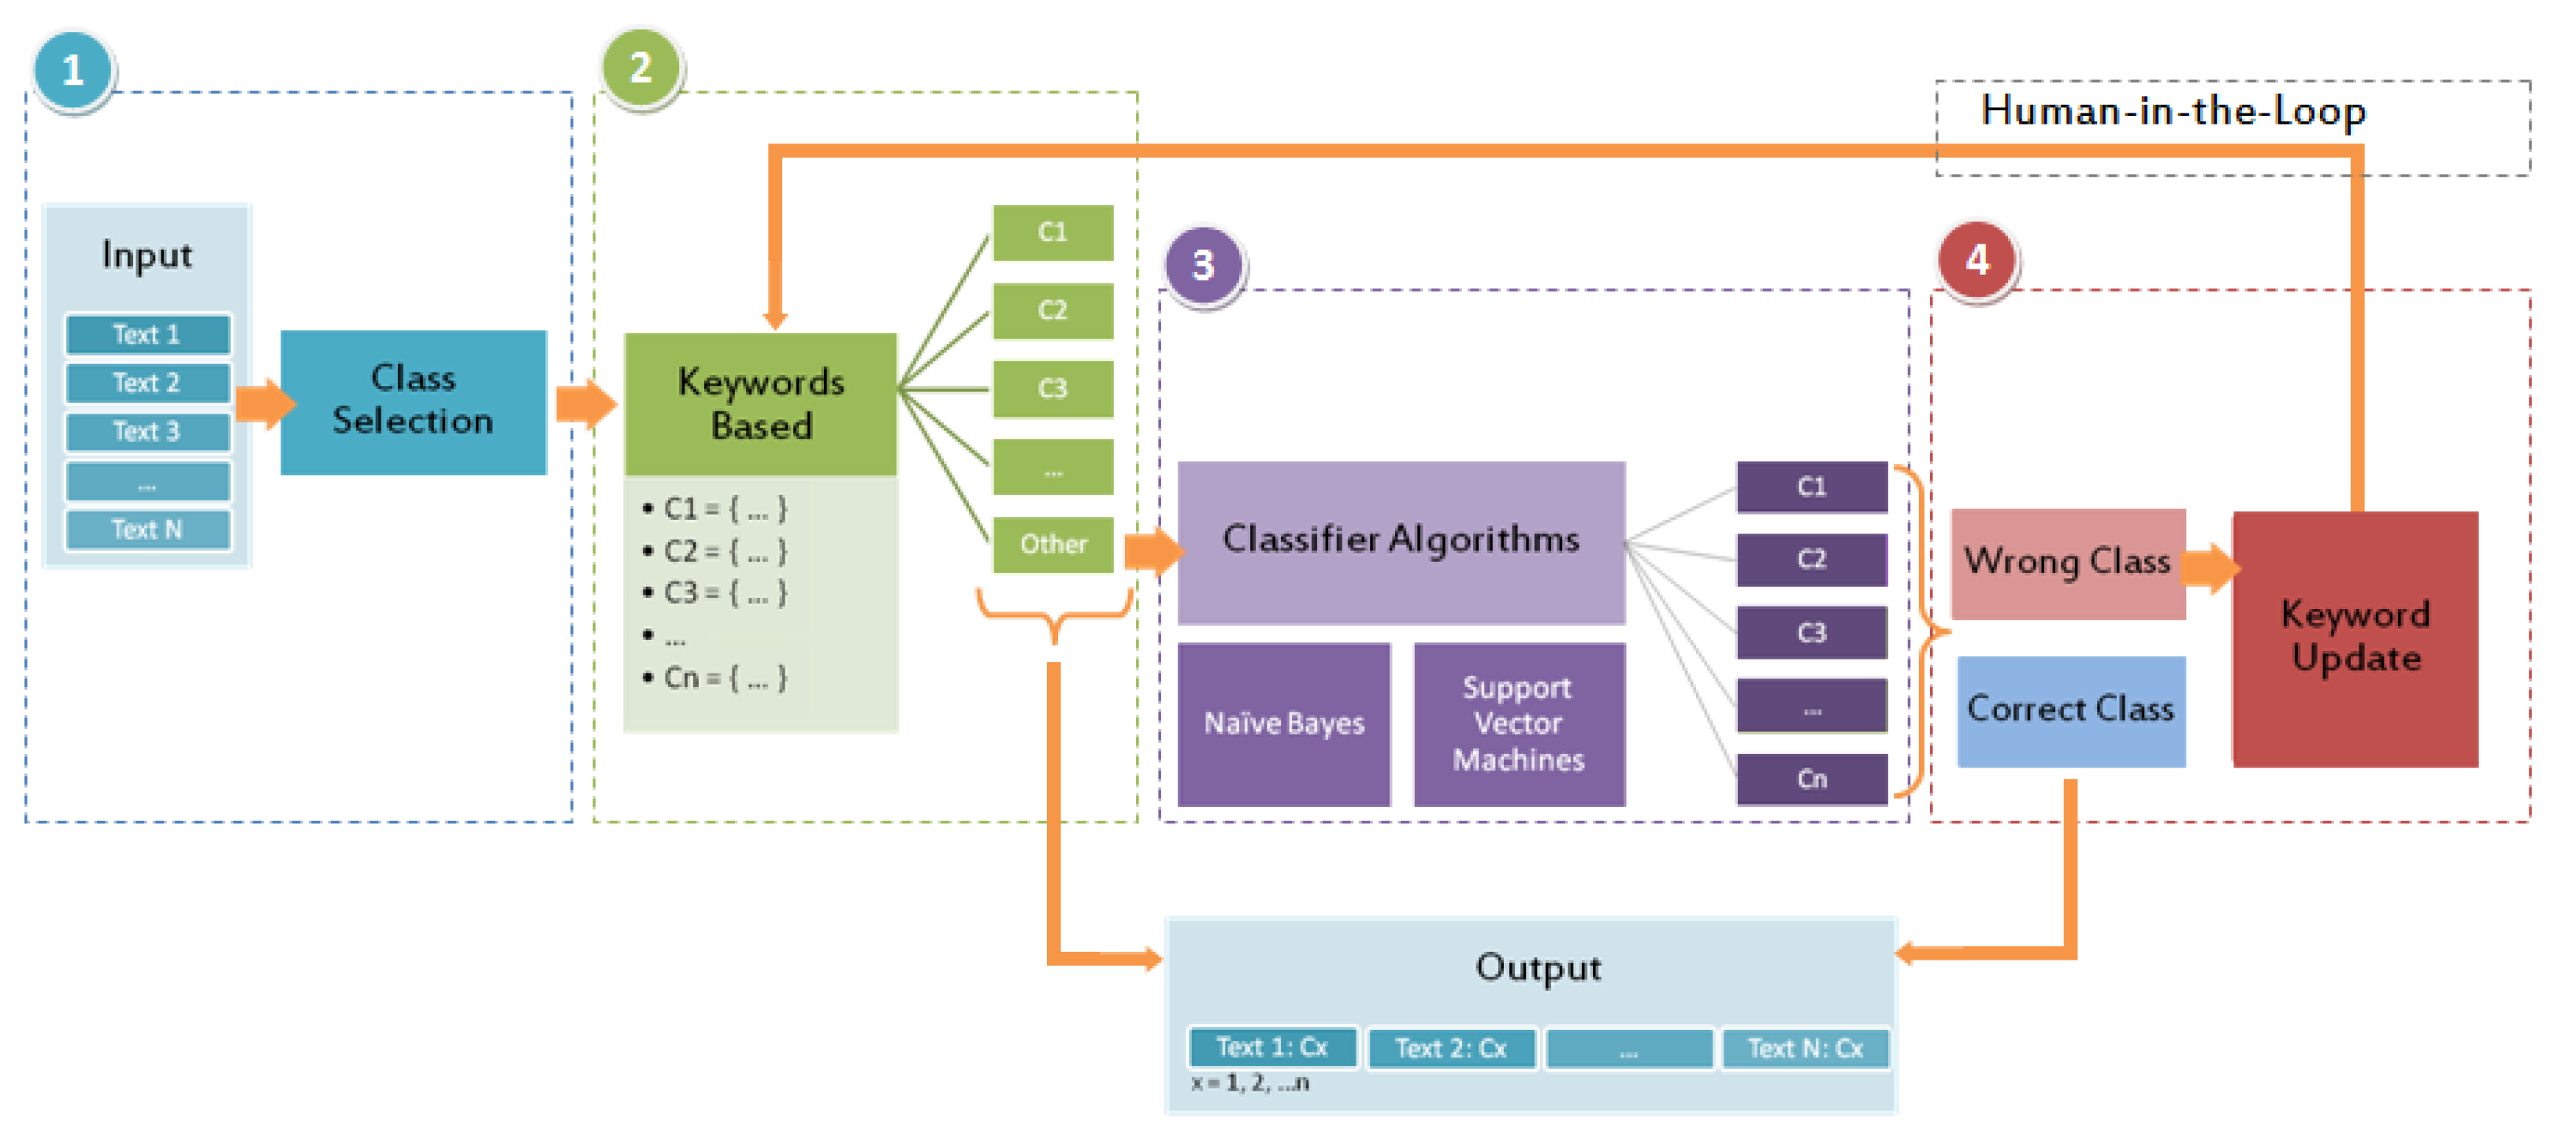
3.3. Text Classification Design

An implementation of a natural language processing and text classification pipeline is used to understand communication behavior and dynamics between SM users. We adopt a supervised domain-specific approach, and therefore the list of desired categories is initially defined by domain experts. The categories of interest (classes) are used to annotate the contents of the SN (i.e., posts and comments). After we specify the classes’ label, we use keyword-based classification to assign the name class for each media comment. To do so, each class is manually associated to a set of keywords, which are searched in the content to perform a first deterministic assignment of classes. Since a lot of content may not be assigned to any class, we then apply machine learning classification algorithms, to increase the recall of the classification. We apply and compare two techniques with the intent of increasing the accuracy in general. Finally, human-in-the-loop is involved in the validation process. The method is illustrated in Figure 2.

3.3.1. Category Specification

This study aims to understand communication behavior between SM users; whereby their notions were expressed through posted comments. To achieve our goal, an intention analysis was performed using text classification.
Starting from raw text in which necessary information about category names is not given, in this phase, our task is to define reasonable categories that well define the meaning of the comments. We obtained the classes from the domain experts involved in the process. Seeing that the analysis is applied on comments in SM, we formalized comment categories into common types such as: thank, congratulation, agreement, positive, invitation, greeting, question, and other particular topics that may appear in the online discussions. Notice that these classes may vary depending on the domain and type of application scenario. In this specific case, the categories were targeted to online challenges, where indeed people invite, congratulate, and greet other users. Defining such classes was performed first by examining the most frequent words from the bag-of-words as the output of preprocessing in the previous phase. Afterwards, with a subjective validation, we concluded a set of classes representing the most popular topics picked by SM users.

3.3.2. Keyword-Based Classification

After determining the comment classes, the second step of the text classification pipeline was assigning labels to all collected comments. Since we were not provided with training data and ground truth labels, at first, we employed keyword-based classification. It was initiated by keyword-collection for each category. The words were obtained based on the popular words in the bag-of-words from the previous steps. The idea of keyword-based classification is to assign a scoring matrix of a text comment into all categories, based on the number of keyword occurrences in the comment. When a keyword was found in the comment, the score of the corresponding class was incremented. The class with higher scores or higher number of keywords appeared into a text was chosen.

3.3.3. Classifiers Algorithms

The keyword-based method is a plain classification approach that brings a drawback to the analysis result as missing keywords do most likely exist. As a consequence, there will be several uncategorized text documents. Hence we implement two powerful text classification algorithms, Naïve Bayes and Support Vector Machine, to classify the remaining unclassified comments. Moreover, these data can be defined as new data; in which its ground truth is unknown. Therefore, the categorized comments generated from the keyword-based classification were used for training models of the algorithms. Specifically, they were used 80% for training and 20% for testing.

3.3.4. Human-in-The-Loop

Naïve Bayes and SVM models that have a good performance in training do not ensure the same performance for testing. Thus, we adopted human-in-the-loop to evaluate tests from both algorithms and decide whether a predicted class is correct. By observing many random samples, when a new keyword representing a class was found in the misclassified comment, we updated the keyword set. The process was repeated until an accuracy threshold was obtained. At the end of the process, groups of predicted comments with good performance were assigned to the predicted labels.

3.4. Sentiment Analysis

The process of detecting the positive, neutral, and negative sentiment of a given sentence is called Sentiment analysis. People express their honest opinions on websites, and ML and NLP have made it easy to analyze them. Therefore, sentiment analysis, a.k.a. as Opinion Mining, is becoming a crucial problem to study and analyze sentiments [89].
Python provides a convenient way to perform a lot of NLP tasks by leveraging the TextBlob package [90]. Sentiments are calculated based on polarity. When the polarity is less than 0, we say the sentiment of the sentence is negative, while if the polarity score is greater than 0, we say the sentiment of the sentence is positive. At the same time, neutral sentiments are identified when the polarity is 0.

3.5. Topic Modeling

This work utilizes Latent Dirichlet Allocation (LDA) [91] to detect the micro topics within a main topic. LDA is a statistical admixture model for clustering the words into topics and making inference on the distribution of the topics in the text. Moreover, it provides the distribution of the words in each topic. These distributions can be estimated by the posterior probability of the trained parameters in the joint equation in the model. The joint probability distribution of the model is computed in Equation (1).
p ( θ , β , Z , W | η , α ) = p ( β | η ) p ( θ | α ) p ( Z | θ ) p ( W | β z n j ) .
Here, we are interested in inferring the parameters θ (distribution of the topics in the posts) and β (distribution of the words in different topics) and also the frequent words that appeared in clusters (topics). Matrix Z is the topic assignments for the individual words and matrix W is the observed variable (post). N, J, and K are the number of posts, words in the post and clusters respectively, and η and α are hyper-parameters.

3.6. Stance Detection

Stance detection is the process of identifying the author’s view about a topic or target. An author can be in favor of or against any target. There are cases in which neither inference is likely; they are categorized as none. Stance Analysis is considered a sub-task of opinion mining, while it stands next to the sentiment analysis. Sentiment analysis and stance analysis are different. Sentiments deal with the words used in the text, whereas stance decides the author’s favourability towards a targeted topic. Additionally, some texts can have positive sentiments, but it does not mean that the author’s stance favors the target. Thus, sentiments and stance cannot be correlated or combined as the mechanism of determining them is not the same. For sentiments, each word is weighted a numeric value. Whereas in stance, we determine whether the author is in favor, against, or neutral about the topic.
For this purpose, we used a supervised machine learning approach to classification. First, we labeled part of our dataset to build our classification model. Then, we built models on various algorithms such as Support Vector Machine, Random Forest Classifier, and the Neural Networks MLP Classifier. Next, we picked the best model. Finally, using the best model, we classified the comments as against, in favor, or none.

3.7. Network and Conversation Graph Design

Here, we show a general SN design capturing relationships among all entities, such as posts, users, and locations. Then, we detail how to construct the conversation graphs.

3.7.1. General Network

The definition of a correct graph-based reconstruction of the shape of a conversation is strategic to understanding the purpose of the overall discussion happening on the social network and to determine the role of each component of the discussion. For instance, the connections between comments and the temporal order of publishing are fundamental features to consider. This is why a directed multigraph was designed to represent data collection from SM. In our graph structure we assumed it to have multiple types of nodes (such as, Posts, Users, Comments, and so on), and multiple types of edges between them (e.g., authoring, liking, commenting). Both nodes and edges included specific attributes to describe their features.
Figure 3 illustrates the detailed description of the graph’s structure. The graph design covers the key elements of SM contents, which can be applied to any kind of SM platforms.
The description of each node is as follows:
  • Post A post refers to an SM update that may consist of media, such as image or video, and text such as the caption of a tweet.
  • User A user can be the author of a post or comment, a liker, and a new user that is intentionally called by a writer of a comment or a photo (by means of a caption section).
  • Challenge/Topic This is an extra node that can be applied when the data used for implementation has such information about a particular topic. Here challenge node is used since we are going to apply the proposed framework on a challenge event.
  • Comment A comment node is a comment posted by a user-related to an SM post. Thus this node is linked to a post node. A category attribute in this node is the implementation of intent analysis, which is performed beforehand.
  • Hashtag A post or a comment node can contain one or more hashtags.
  • Location A post can have a location stating where the update is published.
The algorithm for generating graphs representing relationships among all SM content is detailed in Algorithm 1.
Algorithm 1 Generating the graph representation of the relationship among SM content
  • data = database.posts
  • G = newGraph()
  • forpostsdo
  •     G.addNodeAndEdge(post,author)
  •     G.addNodeAndEdge(post,challenge)
  •     G.addNodeAndEdge(post,location)
  •     G.addNodeAndEdge(post,hahstag)
  •     for mentioned_users do
  •         G.addNodeAndEdge(post,user)
  •     end for
  •     for likers do
  •         G.addNodeAndEdge(post,liker)
  •     end for
  •     for comments do
  •         G.addNodeAndEdge(comment, post)
  •         G.addNodeAndEdge(comment,author)
  •         G.addNodeAndEdge(comment,mentioned_users)
  •         G.addNodeAndEdge(comment,hashtag)
  •         G.addNodeAndEdge(comment,replied_comment)
  •     end for
  • end for
  • saveOutput(G)
Given that the algorithm must loop over every element in the conversation, and it does so only once, the complexity is linear on the number of items in the conversation and their connections. Indeed, for every post, the algorithm scans and adds to the graph its author, challenge, location, hashtags, mentions, likes, and comments. For each comment, it scans again its author, mentions, hashtags, and connects it to the associated post and/or comment.
Figure 4 illustrates a graph representation of an SM post. Lastly, we stored the generated graph into a graph file for the analysis purposes; for instance, performing queries on the nodes and edges.

3.7.2. Conversation Design and Retrieval

Most SMs allow users to reply to a post or comment by submitting an answer through the reply function, which makes the recognition of relationships between comments in a post easier. However, sometimes the users are not very careful when replying, and thus they may reply in the wrong way or to the wrong comment. For instance, they might generate a comment that replies to the main post in the conversation, or to the very last comment, instead of the specific comment they wanted to reply to. Another possibility is that users reply to comments in an aggregated way: when many similar comments are posted in a short time, (e.g., a lot of comments that say “congratulations”), the author of the main post may reply to them all together in one single post, mentioning each of the comments’ authors.
This part of our study designed a methodology to identify a comment that was intentionally linked to the prior comment. The conversation structures are possibly complicated since they can assume a hierarchical tree shape, and may include also very complicated dependencies similar to the examples cited above. Indeed, each comment can trigger further comments, each of which may trigger others, and so on, and comments may have references across the whole conversation. Thus, we proposed a method to reconstruct conversation graphs by recognizing all connected comment nodes. The method is described in the following procedure:
  • User mention recognition:
    The aim is to identify if a comment has mentioned one or more. A mentioned (tagged) user can be extracted by identifying a term beginning with “@” character in a comment or caption, which is linked to a user.
  • Search tagged users: From all the comments posted before the current comment, we build a list of authors to find a similar user from the mentioned users list.
  • Reply assignment: After finding a comment that its author is mentioned in the current comment, reply edge is assigned between the two comments.

4. Experiments

This section details two experiments carried out to test the proposed system, as described in Section 3. Section 4.1 discusses the experiment on Expo 2015 Milan on Instagram; Section 4.2 discusses the discussions about the COVID Vaccine on Reddit.

4.1. Expo Milan on Instagram

This section provides the details of our experiment on a game challenge related to Expo Milan on Instagram.

4.1.1. Case Study and Data Collection

In 2015, Milan in Italy hosted Expo 2015 i.e., a universal exhibition and part of the International Registered Exhibition. The exhibition was held between 1 May and 31 October 2015. During these six months, 145 countries participated by running their exhibitions. The exhibition successfully attracted more than 22 million visitors and attracted a number of marketing campaigns to promote the event.
Moreover, a social media game challenge—YourExpo2015 was proposed. The game was based on posted photos on Instagram, which are tagged by specific hashtags published every week by Expo 2015. It aimed to raise the brand awareness of the Expo 2015 before the event and to collect numbers of relevant SM contents associated with the event. The game accomplished its goal to draw many user interests. The challenge was organized from 7 December 2014 to 21 February (nine weeks), during which more than 15 K photos and 600 K actions (post, like, comment) were generated on Instagram.
The collection of Instagram posts resulted from the game challenge was used for one of the experiments in this study. Given the stored collection SM content, we equipped the needed information for our analysis by performing scraping activities involving fetching and extracting the content of Instagram associated with the challenge. Finally, we stored the collected media content in our database (in JSON format) to perform further analysis. The implementation of this study was applied to 15,343 Instagram photos related to the challenge. For our analysis, we collected 98,924 media comments from all posts.

4.1.2. Intent Analysis

The following discusses the text classification method’s implementation into the intent analysis, focused on the SM comments. The purpose of this approach is to understand the most discussed topics by the engaged users in the case study.

Text Preprocessing

The procedure is composed of text cleaning, word extraction, stop words removal and stemming. Text cleaning includes normalizing terms such as removing unnecessary repeated letters, removing characters and forming text into lower cases. We also eliminate the user_id as it appears in comment text when the comment’s author aims to tag another user. Then by tokenization, we split a sentence into words and extract words from a text. For the third step, we utilize the set of stop words in the form of the text’s detected language. For the last step in text processing, stemming is applied to convert each word into its root/base form. Finally, the output of these processes is stored in a bag-of-words.

Keyword-Based Classification on Social Media Comments

A document refers to a comment; thus, the preprocessing process is applied to the comment collection. The output as a bag of words, in the form of their base/root, is presented in Table 1 as well as the number of occurrences.
Observing words represented in the bold form is interesting where each of them represents a different intention. Therefore, with a subjective assumption, we conclude that the suitable categories for Instagram contents associated to the case study data are: thank, congratulation, agreement, positive, invitation, food, greeting, question, hashtag, and other. The category of hashtag denotes the type of comments that only contain words started with hash # that may intend to specific information. The other category relates to Instagram comments that cannot be labeled as any other class. The reason for selecting those 10 categories, instead of a general sentiment analysis composed of positive, negative and neutral is because we performed an analysis of the data from SM challenge that engaged a significant number of users. In this study, we want to determine their intention and opinion about the game. We expected that with more categories would come the better understanding.
Table 2 presents the initial keywords associated with each category; these keywords were extracted based on the obtained bag-of-words. Keywords were in the form of their base or root in order to optimize the analysis. The classification method simply counted scores for each category’s keywords to the comment collection. The category with the highest number of keywords appearing in the comment was chosen. This method is a simple approach with a consequence of several comments that do not have any words related to the defined keywords. These comments were assigned the other label.
Even though the keyword-based categorization is a plain method for classifying texts, it astonishingly results in 80% of all comments being labeled on the defined categories with a total number of 98,166 for all comments. Figure 5a,b report the number and percentage of comments per category.
The drawback of the keyword-based method is that more than 20K comments were not classified in any of the classes (i.e., labeled as other) described in Table 2. Additionally, more than 10K comments were labeled as the hashtag class, which is not a small number. It also possibly contains useful information, for instance about the related hashtag to specific category’s content. Thus, comments with labels hashtag and other were considered in a new dataset to be classified with a text classification algorithm in the next stage of analysis.
Using direct observation to define the ground truth of keyword-based classification, 100 random samples were chosen for each category for validated by a human. As shown in Figure 6, the average accuracy is 97.5% which implies that the utilization of keyword-based classification is reliable. The misplaced labeling of keyword-based classification is the result of the lack of consideration for keywords dependencies (contextual meaning). For instance, the word “water” can be placed into either a topic of water added into a recipe or water that refers to natural water such as sea or river related to landscape scenery or traveling topic, in which these include a deeper text analysis. However, our simple approach, assuming each word of feature in a text is independence, produces a promising result.

Classifiers Algorithms Application

The purpose of using Naïve Bayes and SVM is to predict uncategorized comments (comments labeled as other) and hashtag comments. Thus, in total, we had more than 30,000 data to be classified. As we are not provided the ground truth of these data, we decide to make use of the previous result to train Naïve Bayes and SVM models. Precisely, training data consist of comments categorized in thank, congratulation, agreement, positive, invitation, food, greeting, and question, while the testing data are comments labeled in hashtag and other.
Naïve Bayes and SVM models were trained with the proportion of 80% training and 20% testing samples from the collection. Figure 7 shows the models’ accuracy with different numbers of training samples. Starting with a small number of samples, the accuracy of the two algorithms is high, but then decreases as the number of samples increases. Nevertheless, the accuracy gradually increases from the number of samples limited in 5000 until there are no limit samples. In conclusion, we employed all samples, since, in this state, the accuracy for the algorithms reaches its highest amount. Additionally, the result states that SVM achieves an overall higher training accuracy than Naïve Bayes.
Set models were then performed with Naïve Bayes and SVM classifiers. Table 3 and Table 4 show confusion matrices for the Naïve Bayes and SVM classifiers respectively. They describe how the models classify test data in the comparison between the predicted and the actual class. Although the models were generally able to place class labels correctly, congratulation, agreement, invitation, and question categories have less accuracy than the others. Therefore, we merged some categories to minimize the prediction error. Since the actual meaning of congratulation, agreement, and greeting categories is close to positive comment, we merged them into the positive comment category to increase the model accuracy.
Figure 8 depicts the percentage of training samples for each category after the merging process. It concludes that 33% of all collections are classified in positive comments. With the updated collection, Naïve Bayes model classifies test samples into five categories with overall 79.82% of accuracy. Whereas SVM model results with accuracy 78.17%. The confusion matrices generated from the Naïve Bayes and SVM models are presented in Table 5a and Table 5b respectively. Although the number of correct predictions in positive category increases, the imbalanced number of samples, particularly in positive class, leads to miscategorization of more comments into positive class.
In conclusion, the four models produce significant results with overall high accuracy in the training process. However, since there are plenty of unseen data, a good training model does not guarantee a good performance as well as testing. Thus, we kept and used all models to classify the remaining comments with hashtag and other categories and compared the results to choose the best one.
After performing classification on test samples (hashtag and other class), we discovered that in the training stage of the pervading new data, both Naïve Bayes and SVM failed to achieve good results. This is true even for the SVM model, which gives a good prediction in the training stage. These conditions were applied for prediction with both eight and five classes. Moreover, by observing random samples, the correct prediction rate was very low. Hence, we cannot fully trust the results of the classification models.

Human–in–the-Loop

All models (Naïve Bayes and SVM with eight and five categories) feature arather poor performance on the test dataset. There are two main reasons behind the errors performed by the classifiers: the presence of unseen keywords in the initial stage of keyword-based classification and the topic of comments that do not truly belong to the defined classes.
In particular, the reader should remember that the initial classification process (performed on the data as presented in Table 2) was implemented through the empirical selection of a small set of keywords representing the different classes. To quickly build the initial training set, elements were assigned to classes simply based on the fact that they contained the respective keywords. However, this is a very coarse approach: several items will not contain any relevant keywords, and thus they will not appear in the training set for the classifier. Therefore, the classifier will not learn several combinations of tokens that would be important for the classes. As a result, the classifier after the first training step is able to categorize only content close to the keyword-based selection of training elements. A lot of content will not be classifiable, and a lot of content will be misclassified. To avoid this bias, we applied human-in-the-loop strategies to increase the number of correctly classified inputs. We defined an iterative improvement process for the keyword set to be used for the training set definition, and we repeated the process until a certain quality threshold was satisfied. In each iteration, human assessors were asked to look at the non-categorized inputs and to identify further keywords that could be used to properly assign comments to classes. In other words, the human-in-the-loop procedure was responsible for refining and enriching the initial bag of words to be used to define the training set for each label of the classifier (as shown in Table 2). After performing several iterations to update the bag of keywords, we reached a point where no more new keywords were detected and the classifier performed at the desired performance level. Figure 9a illustrates the decreasing number of uncategorized comments after performing some loops with human involvement. At this point, in particular, the Naïve Bayes algorithm classifies elements in the thank and greeting classes with 100% accuracy (while other categories have lower accuracy).
Figure 9b shows the evolution of classes in each iteration: the number of comments for hashtag and other categories decreases significantly in the beginning and stays steady as the number of iterations increases (Figure 9b), while other classes have an alternate behaviour or feature an increase in number of items (e.g., food and positive) (Figure 9b).
In general, the total data per category, except hashtag and other, incrementally increase until a certain number of iterations. In the final result, Figure 10b displays percentage for each class showing that the percentage of other category shrinks to 15%. Compared to the initial collection in Figure 5a, the final number of comments per class presented in Figure 10a shows that the human-in-loop gives new labels to more than 5800 comments from the uncategorized samples.
Figure 11 displays the percentage of ground truth observation representing correct and wrong labeled items over 100 random samples for each category. Our proposed approach for intent analysis of SM comments presents a significant performance; which is 97.67% of the accuracy. However, as displayed in Figure 10b, the remaining uncategorized comments are 15% or more than 14,000 comments and 10% or more than 9000 comments with hashtag label, which are high numbers.
There are two main reasons behind the high number of uncategorized comments or comments that are given label hashtag and other. The first reason for hashtag label is due to the data used that are related to YourExpo2015 game challenge; in which, each Instagram photo participated to the challenge had to put a hashtag associated to the challenge such as EXPO2015artfun, EXPO2015terramare, EXPO2015 cibovita, EXPO2015showcooking, EXPO2015stuporesapore, and so on. Thus, almost all photos contain some hashtags in the comment section. The other reason is that people commenting on Instagram photos talk randomly and freely to give their opinion, which is sometimes not related to the popular topics. Thus, opinions from engaged users that are different from the chosen topics for our analysis remain uncategorized.

4.1.3. Network Analysis

In the following, we detail the graph generation to draw the relationships among networking components of SM data associated with the case study. Then we discuss the conversation graphs’ reconstruction from SM comments on Instagram’s post.

Graph Generation

The graph generation was initiated by accessing the raw network data. Then, an empty directed multigraph G was defined and for each photo in the collection; we added a new node in graph G, an author node, and an edge linked to the author and photo. The same steps are presented in other information such as likers, challenge, location, hashtags, and mentioned users. In the comment nodes, we performed the same steps with additional reply relationships connecting two comments, a comment that is intended to reply to another one.
The generated graph was then stored in a graph file format producing 461,952 nodes and 1,416,751 edges. This is a large graph, representing network relationships among all the main content of Instagram’s dataset. Since the size of the graph is pretty huge, there are not any visualization libraries that can display all nodes and edges yet. Therefore, in Figure 12 we present a visualization of three photos that are related to the EXPO2015artfun challenge. All photos are connected with other photos through the challenges node. All nodes including users are unique. As we can see, a user can create and give like to more than a photo, as well as write comments (See Figure 4 for the conceptual representation). Outgoing edges draw activities of a user; the more outgoing the edges are, the more active the user is.

Conversation Graphs

As visualized in Figure 13, intent analysis is presented in different colors. Generated relationships inside comments from an Instagram photo, portray opinion exchange from the author of those comments. A reply edge connects one comment to another and links a comment to many comments. The reason for retrieving conversation graphs is to identify all connected comments node via reply link.
According to the visualization, we detect some interesting patterns. A node that targets (replies) many comment nodes most likely is a thank comment and a positive comment is usually followed either by a thank or positive comment. Therefore, using conversation graphs, we performed a pattern analysis to understand communication behavior among users participating in the challenge. This will be explained in more detail in Section 5.1.3.

4.2. COVID-19 Vaccine Discussions on Reddit

This section provides the details of our experiment on the discussions about COVID-19 Vaccines on Reddit.

4.2.1. Case Study and Data Collection

Reddit is a platform where specific discussions take place under subreddits, each containing a discussions about a particular topic such as science, technology, and food. They are more like traditional or classical discussion forums. The user must decide the subreddit he wants to publish in, and then create their post(s) in there. Users can also create subreddit for new topics if they do not already exist. Since these forums contain detailed descriptions, questions, and answers, they provide a rich corpus to study. The information is validated, and the user content is voted. Depending on the votes or score received, the post is in the trending or hotlist, and even though it is old, it can be seen in the latest list. Reddit users create a post in a particular time frame to receive more votes, views, and scores, making it interesting to analyze the time window in which more comments are received [92]. In Reddit, submissions and their comments are seen to form the tree structure. If the comments’ timestamps are available, after ordering, we annotate them. It is easy to see how a discussion unfolds into various topics, sentiments, and stances with this tree structure.
To conduct the next experiment, we collected the whole data of the COVIDVaccine subreddit from April 2020 to May 2021 using Pushshift API [93] and made it publicly available [94]. All the roots and comments were collected separately; the links between them were still preserved, and we could construct the discussion tree. The resulting dataset encompasses 12,915 posts, including 1726 root discussions and 11,189 comments.
In this setting, we opted for an unsupervised approach, as we did not have a clearly foreseeable set of categories of discussion. This also provided the opportunity to generalize our approach beyond the classification of content.

4.2.2. Topic Detection

To perform unsupervised topic analysis, we applied Latent Dirichlet Allocation (LDA) to the content dataset, by performing a recursive topic analysis process, thus obtaining a structure of topics and subtopics. Initially, we detected two major topics, namely “General about vaccines” and “General after vaccination”, from all the discussions.
Figure 14 and Figure 15 represent keywords in “General about vaccines” and “General after vaccination” topics respectively that enabled us to identify the topic titles.

Fine-graining results using repetitive modeling

After identifying the first two topics, we divided the dataset according to these topics. Then, we applied separate LDA processes on the two datasets. While a refinement of the “General about vaccines” topic did not lead to any valuable insights, by applying fine-grained topic modeling to the “General after vaccination” topic, we identified keywords that strongly relate to the vaccine’s side effects, as shown in Figure 16. Thus, we labeled this group “Vaccine side effects”. The other two groups of keywords were still not identifying any topic, so we labeled them “General discussions after receiving vaccines” and separated them to apply LDA.
After applying LDA to the second and third groups of discussions, we identified topics such as Second Dose, Thankful comments, and Vaccine side effects. Thus, after fine-grain topic modeling, we could identify five distinct topics in the complete discussion set. Figure 17 can explain the distribution of the topics.

4.2.3. Stance Detection

Stance determines the author’s view; whether they are against, in favor, or neutral regarding the discussed topic. In order to detect stance, we employed a supervised machine learning approach. First, we labeled some data from the dataset and then trained a model to predict the stance for all comments in the dataset. Table 6 provides some examples of how stance and sentiment can be different. For example, it shows how stance that is in favor of a topic might have negative sentiment. In the rest of the work, stance and sentiment are used interchangeably.

Labeling the Dataset

We manually labeled 249 records from the data with their stance, 83 from each class. After evaluating each comment, if there is an explicit verbal indication that the author’s statement favors the COVID Vaccine, we label it as favor, and if there is a clear indication that the statement is against the vaccine, we label it as against. Some comments agree with their parent comment that is in favor of the COVID Vaccine, but there is no clear indication or context; for such comments, we labeled stance as none. This can be better explained with the following example.
(1) ParentComment: “Everyone should get vaccinated, this can reduce the spread of the virus and also, lower fatalities.” (Stance = Favor)
(1.1) Reply Comment: “Yes I agree with this.” (Stance = None)
Though the reply is in favor of the COVID vaccine, it is difficult to determine the stance without the context and information of the previous comment. Additionally, for the machine to understand the context is challenging. Therefore, such comments are labeled with a stance as none.
Due to the development of the COVID vaccine, time taken for research and trials, and considering the side effects long term and short term, there are many open questions that people are facing. Not everyone is aware of all the side effects, not even the people who have developed it. Thus, there are many questions or queries that people post on the discussion forums. Such queries may have positive or negative sentiments, but the stance for comments is considered none as they are neither in favor nor against the vaccine; they want things to be clarified. These types of comments are a significant part of our dataset.
Moreover, many comments against the COVID vaccine were removed from the internet as these kinds of comments may spread rumors about the vaccines.

Classification Algorithms

We performed primary classification using SVM, NN Classifier, and Random Forest. Then, we fine-tuned the hyper-parameters to obtain the best model. The dataset in our case is highly unbalanced; most of the comments have a stance of none. In this case, evaluating a model only based on accuracy is not enough; thus, we employed the F1 score. The results from the classifiers are presented in Table 7, Table 8 and Table 9.
Looking at the accuracy and F1 score, we decided to use Random Forest algorithm for predicting the Stance of all conversations in our dataset. Using the Random Forest, 10,059 were classified as none, 795 as against, and 2061 as favor.

5. Analysis Results

This section presents a statistical and matrix analysis performed on the results of the experiments. Section 5.1 discusses the analysis results of the experiment on Expo 2015 Milan on Instagram; Section 5.2 discusses the analysis results of the experiment on the COVID Vaccine-related discussions on Reddit.

5.1. Analysis Results of the Expo Milan Experiment

In this section, we analyze the results obtained from the experiment performed on the game challenge related to the Expo Milan on Instagram as discussed in Section 4.1.

5.1.1. Statistical Analysis of Conversation

Here we detail the results of statistical analysis of the constructed graph conversations.

Statistical Analysis

The experiment was performed on the whole set of 15,343 Instagram photos of the case study. The analysis encompasses the comments count for each photo, the number of conversation retrieved per photo, and the number of comments for each conversation. The comments counts range between 0 and 328. The average number of comments is seven (excluding photos with no comment). Moreover, considering a comment without any relationships with other comments, the maximum number of conversations extracted in all posts is 177. On average, the conversation size is two nodes. From all conversations in all photos, we obtain that the most extended conversation is a conversation with the highest size (i.e., 93 nodes).
Considering the number of conversations that occurred in all posts, a single comment that does not have a relation with any comment, has the highest frequency. Conversations composed of two nodes are the most prevalent among all conversations. The frequency declines gradually as the conversation size advances. The long conversations mostly occur once.

Comment Category Distribution

Since the purpose of this work is to understand SM’s communication behaviors related to the challenge, we are interested in studying long conversations in popular photos. Thus, we first performed our analysis of the photos with at least 30 comments written in those photos. Concerning the spread of intent categories, positive and thank comments are the dominant types of conversations. Two other intent classes that appear almost in all variations of conversation size (i.e., number of nodes) are greeting and question types. Invitation and agreement intended comments are slightly expressed in most conversations, whereas congratulation statements are only mentioned in some discussions.
As expected from real life discussions, thank is not present in solo conversations. Additionally, in general, single comments contain hashtag. In longer discussions, users participating in the challenge generally talk about compliments, gratitude, and salutation. Considering such online conversations, by exploring the figure, it might be concluded that by increasing the number conversation, the portion of the most of the categories will be dominated by a fewer number of categories. Food is the third significant topic mostly carried out in discussions; however, it is barely mentioned in large conversations. Thus, the second type of conversation analysis is described using all photos that have comments between seven and 29.
The analysis of the distribution of comment categories on conversations having number of comments between seven and 29 shows that the smaller the number of comments in a photo, the shorter the conversation is. Here, posts about thank, positive, and food prevailed the overall conversations. Similar to the previous analysis, agreement, congratulation, and invitation categories appear in low frequency confirming that hashtag comments are only written in a single comment. On the contrary, gratitude expression is not mentioned in solo conversation.

5.1.2. Time Space Analysis

The diversity in the number of comments for each conversation paves the way for another analysis dimension. In particular, we would like to determine whether there is a correlation between the temporal aspects and the length of a conversation. Conversation size, period, and frequency are shown in Figure 18. The periods indicate the duration taken during the conversation. The calculation is performed by subtracting the latest posted comment time and the first comment time. Duration ranges from less than 5 min until longer than 1 week. We expected that the smaller conversation requires less time than the longer one. However, the result contradicts our expectation. It visualizes (in logarithmic scale) that generally, a variety of duration would be occupied by conversations.
According to Figure 18, it can be concluded that, in most cases, smaller discussions typically take longer periods of time. Conversations with size comments between 2 and 10 span all ranges of duration, while conversations composed of more than 10 comments usually take less time. The analysis of the long conversations shows that long discussions with conversation size greater than 10 positively do not take a duration of less than 15 min. It is clearly stated that involved users demand more time to reply. In addition, longer conversations do not need more than 1 day to finish the discussion. For example, a conversation with 93 comments requires 12 to 24 h. In conclusion, the small discussions take a longer time, while more extended conversations are finished within 24 h.

5.1.3. Conversation Patterns Retrieval

Conversation graphs represent virtual discussions that occurred within a photo on Instagram. The user’s intention in a comment is incorporated in the graphs as a category label. To understand the online communication behavior, we analyze conversation to retrieve the most frequent patterns generated from intent relationships. We also discuss pattern analysis of conversation nodes with a variety of intent analyses. The section investigates conversation patterns with 2 nodes and 3–4 nodes.

Two-Node Patterns

Conversation patterns are retrieved by analyzing all possible category combinations for the two connected nodes. Table 10 illustrates a heat matrix that details the number of occurrences for each combination. The left side on the matrix represents a subsequent comment that replies to a previous comment on the matrix’s top side.
As we expected, the results indicate that the most popular pattern created in two nodes is: thankpositive; in other words, a gratitude action is generally expressed after a compliment. Similar rational behaviors which frequently happened are: thankthank, positivepositive, positivegreeting, thankinvitation and so on. These virtual discussion represent a typical set of patterns that may happen also in real-world communication sessions. Moreover, we report that less popular combinations in the digital discussion, such as expressing agreement after a congratulation comment, or congratulating after someone sends an invitation, or even asking a question to someone who expresses a congratulation message, basically do not happen at all physical communication. Interestingly, a very infrequent pattern is an hashtag comment following any other comments types. Even though hashtags are popular in online communication, it’s probably considered too rude to reply with just an hashtag in a dialogue.
As a general conclusion, considering all the combinations of two linked comments, we can report that the digital communication behavior and patterns are quite similar to conversations in real-life in most cases.

Three- and Four-Nodes Patterns

The good results obtained in the previous analysis encourage us to extend the analysis to longer conversation paths. Thus, we extend the analysis patterns to combinations of 3 and 4 nodes. For this study, we start from the most popular 2-nodes patterns. In particular, we select patterns that represent intent combinations that have more than 1000 occurrences. With this selection criterion, we obtain the following 5 patterns: thankpositive, positivepositive, thankthank, thankfood, and thankgreeting.
In the next step, we aim at finding the patterns in the conversation graphs that start from the above 5 patterns and expand them by adding another comment category before and after the patterns. On the left side of Table 11, a list of conversations’ paths with 3 nodes are presented in descending frequency order, limited to 30 samples. The results reveals thankthankpositive as the top pattern. It replicates real-world human communication when a person expresses a positive message or compliment, and the other peer responds thanking for that. In return, the first person replies thanking again to express their gratefulness. Other popular patterns, described in Table 11, are reasonable as well in traditional communication. However, the number of occurrences decrease significantly from the most popular one.
From the retrieved patterns, we pick the top ones containing 3 and 4 nodes to perform temporal analysis and analyze the number of users involved in the discussions. In the first analysis, our idea is to find how long a user takes time to write a reply comment. We pick thankthankpositive pattern that has 1254 occurrences in the whole conversation graphs. Figure 19 displays diversity of reply times. The first part of the chart shows time needed for the last comment to reply the previous one and the second part is duration of the second comment reply the first posted comment. We detect that the required time for the second comment to reply the first comment mostly takes less than 5 min; as well as periods, needed for the third comment to answer the second one. However, some users wait more than 1 week to reply to a comment. On average, the required time for the second comment to reply to the first one varies from 12 to 24 h, and the required period of the third comment to answer the second one is 6 to 12 h.
The second analysis is performed for the top pattern with 4 nodes: thankthankthankpositive. The result indicates that the required time for the second comment to reply to the first one varies from 5 min to more than a week. However, in other cases, for the third comment to reply the second one and the fourth one to answer to the third comment, in general take less than 5 min. On average, the second comment needs 6 to 12 h to reply to the previous comment. The third one takes 30 min to 1 h to answer the second comment, and the fourth comment needs 3 to 6 h to react to the third comment.
Besides exploring the temporal aspects, we would like to investigate how many users are involved in the conversations. To do so, we design an analysis considering the top patterns, including 3 nodes and 4 nodes. For those patterns, we simply count the total number of users that participate in the discussions. Figure 20a,b show the number of users involved in conversations featuring 3 comments and 4 comments respectively. Overall, most of the times only two users participate in the conversations, and some times, 3 and 4 users participate in the discussions. One may notice that longer conversations do not necessarily entail larger number of users involved.

5.2. Analysis Results of the COVID Vaccine Discussions Experiment

In this section, we analyze the results obtained from the experiment performed on COVID Vaccine-related discussions on Reddit as discussed in Section 4.2.

5.2.1. Statistical Analysis

The discussion size is defined as the total number of comments that are present in a discussion. Figure 21 shows the distribution of number of discussions based on the discussion size. For instance, 150 discussions received only 1 comment, while 110 discussions received 4 comments. The maximum number of comments received in any discussion thread is 124, whereas there are many root discussions without any comments.
By the breadth of discussion, we mean the degree of the root node of a discussion; this explains how broad a discussion can be. Figure 22 explains the number of comments received by the main discussion root, which actually consists of the degree of that node. The maximum number of comments received directly from any root in the collected dataset is 42. However, so big discussions are rather uncommon. Most roots discussions receive no comments at all, while many receive 2, 3, or 4 comments at most. Notice that these are the comments directly applied to the root. On the other side, discussion threads can have comments posted as a reply to other comments. This is accounted for in the depth of the discussion.
Depth of discussion can be defined as the level up to which the discussion received replies (as responses to other comments). Figure 23 shows the distribution of number of discussions depending on the discussion depth. Here we see the deepest conversation covers up to 31 levels. Very deep discussions are uncommon too. Indeed, most of the discussions have no comments at all, or are a single level deep. Discussions with 1 level can mean that the root have many direct replies, but there is no reply to any comment.

5.2.2. Time Space Analysis

We counted the number of comments received in a discussion at every interval. The different intervals considered are reported in Table 12.
Using the duration presented in Table 12, we grouped and counted comments in each duration. This gives us an idea of how many comments came within which duration. From Figure 24 we see that the maximum number of received comments are between 1 to 6 h after posting the root. As we can see in Figure 25, this trend no longer holds when the discussion size increases. The discussions considered while plotting the Figure 24 are of sizes from 1–23. The number of comments plotted against the z-axis is the average number of comments in each discussion size. Figure 25 is built with all the discussions from all the discussion sizes available in our dataset.

5.2.3. Sentiment Analysis

Figure 26 is a perspective that shows some exemplary discussion. The bigger node is the root where the discussion starts, and the smaller nodes are the replies received either to the root node or to some comment in the discussion tree. Here different colors are the different sentiments. So we can see how sentiments are propagating in these discussions.
We perform sentiment analysis of these discussion trees and analyze whether the sentiment of the starting discussion affects the overall distribution of sentiments in the discussion tree. We group all discussions with positive staring sentiment and then count the number of positive, negative, and neutral sentiments in such discussion trees. Similarly, we do it with negative and neutral starting discussions. Statistics for discussions that start with positive, negative, and neutral sentiments can be view in Figure 27. We found the positive sentiment always remains higher in the dataset irrespective of the starting sentiment.
We also analyze sentiments concerning the size of the discussion. Here we determine the percentage of positive, negative, and neutral sentiments in each discussion size (discussion size is the number of comments received in the discussion). We group and count discussion with the total number of comments they received, and from that, we determine the percentage of positive, negative, and neutral sentiments. In Figure 28, we plot the percentage of sentiments in discussion size between 15 to 25, here as well we see that there is a higher number of Positive sentiments than negative and neutral sentiments. Moreover, while we plot a trend line, we notice that Positive sentiments decrease with the increase in the size of discussion, and negative sentiments increase with the discussion size.
In addition, we investigate if the starting topic and sentiment affect the distribution of sentiments in that group. Here we consider topics of “general about vaccine” and “side effects of vaccine” as they are dominant in our dataset. We group and count discussion with the combination of each topic and sentiment. In Figure 29 we can clearly observe that Positive sentiments are also higher irrespective of the topic and sentiment of the starting discussion.

5.2.4. Topics Analysis

We have determined five topics in our dataset and performed experiments on the discussions with respect to the discussion size and starting topic. We performed topic analysis of these discussion trees and try to analyze whether the starting topic of the discussion affects the overall distribution of other topics in the discussion tree. The discussions are grouped on the basis of the starting topic. We obtain a percentage of other topics in each of these groups.
Figure 30 represents distribution of topics in discussions with different starting topics. Colors represent different topics, whereas the circle size represents the percentage of the topic in that set. “General about vaccines” (Topic 1) and “Vaccine side effects” (Topic 2) are the two major topics in the dataset. When discussions start with Topic 1, on average, 80% of comments are from the same Topic (Topic 1), and the chances of comments touching other topics are minimal. Figure 30 gives a complete picture of how topics emerge into discussions depending on their starting topic.
Next, we want to understand the distribution of topics in each discussion size. We group discussions based on their size and find the percent of comments on each topic to serve this purpose. Figure 31 explains the percent of topics with respect to discussion size while Figure 32 shows a trend-line along size of discussions. We notice that with an increase in the discussion size, discussions with the general vaccine topic are reduced, while discussions with the vaccine side effects topic are increasing.

5.2.5. Stance Analysis

After applying classification algorithms to predict the stance of the conversations in our dataset, we analyze these conversation stances with respect to the size of the discussion. We want to check if the discussion size affects the distribution of stance in the discussion threads. Figure 33 explains the stance distribution in different discussion sizes.
The none stance is always high in every discussion size. Additionally, the favor stance is always higher than the against. The reason for this could be the nature of the topic for which we collected the data. The conversations in the dataset are obtained from a discussion forum. Usually, people use these forums to find answers to their questions. When an author asks a question to obtain more information, they are never in favor or against a targeted topic. Thus, his stance is none. They are asking a question to build an opinion, and this is why the none stance is higher as they are questions or queries maximum in our dataset.

5.2.6. Time Analysis for Topics, Sentiments, and Stances

Now that we have analyzed stance sentiments and topics for the discussion size and starting attribute, we further investigate if the distribution is affected by time. To perform this analysis, we remove the discussions before November 2020 as the dataset has just 2–3 conversations in this time interval. This could be because the subreddit from which we collected the information started in April 2020, but maybe it was not so popular initially. Furthermore, people started thinking about the vaccine when they began realizing the magnitude of the effect of the pandemic. The topic of the vaccine also gained greater media attention later in 2020.
In Figure 34 when we plot Topics, Sentiments, and Stance along with time, we still notice none stance, positive sentiments, and Topic of “General about vaccines” are always higher in the dataset. In Figure 34 we plot the number of comments whereas in Figure 35 we plot the percentage of comments. In Figure 35 we observe that the number of discussions happening each month is different; thus, comparing solely based on the count of the discussions makes less sense.
We still see the same trend when we plot sentiment, stance, and topics along time. Positive sentiment is always higher, the none stance prevails, and the “General about vaccine” topic has a higher concentration.

6. Conclusions and Future Work

The goal of this study was to understand communication behavior in SM discussions compared to real-life conversations. To do so, we proposed a graph-based framework to asses the shape and structure of online conversations. Intent analysis using keyword-based classification was proposed for social media comments. As the case study, we employed posts on Instagram related to a long-running live event [15,16]: YourExpo2015 challenge. At the beginning, using the proposed approach, we classified the comments into nine categories—thank, congratulation, agreement, positive, invitation, food, greeting, question, and hashtag—based on defined keywords for each class. Comments that did not contain any keywords were assigned into the other category. After that, the method applied Naïve Bayes and SVM to the uncategorized comments using training from previous results. In the final step, human-in-the-loop improved the keywords from the comments misclassified using the classification algorithms. The performance shows a significant result with an accuracy of 98%, with the dominant compliment and food categories.
We also developed a directed multigraph representing the collected SM dataset, containing intent analysis of the comments. The graph contains essential information represented in nodes and edges representing relationships among nodes, together with their attribute information. The list of nodes is composed of posts, comments, authors, locations, comments, and hashtags. The built graph has more than 450 K nodes and 1.4 M edges. All analyses were performed using this graph-based data.
A conversation from a post is constructed by identifying the relationships among all comments on an SM post. We build a virtual discussion using one comment that replies to another and investigate if other comments are linked as well. The proposed methodology is also able to recognize comment-reply that does not follow the reply feature provided on the SM platform.
To understand online discussions, we need conversation graph retrieval as well as understanding users’ intentions. Accordingly, in the final stage of the study, we mined popular conversation patterns composed of comments with labels. We report that the most popular identified patterns, resemble real-life conversation, where people tend to say thank after others say something positive to them. Another observation corresponding to YourExpo2015 challenge is that most participants are willing to write compliments in the comment section, even when they talk about food.
To validate our approach in a generalized setting, we performed another experiment on the COVID Vaccine-related discussions on the Reddit platform. Using topic modeling, we identified different micro topics in the discussions. Then, we performed repetitive topic modeling for fine-grained topic analysis. Keeping a supervised approach for stance detection, we utilized various classification methods to detect the stance of the discussions. Finally, we performed sentiment analysis to extract sentiments for the discussions. After having topics, stance, and sentiments, we further analyzed the discussions concerning the size of the discussions. We also performed an analysis based on the starting sentiment or topic of the discussion, and whether it affects their propagation in the discussion thread. Some of the conclusions that we draw from this experiment are as follows.
It is essential to understand in which time frame after posting a discussion it is possible to receive the top replies. In general, when a post gets old, its visibility is reduced due to other posts in the same group. This also points out the nature of people on the discussion forum. They start engaging in the latest post. Here we conclude that comments received in the first 6 h are more than any other time frame. Of course, there can be exceptions when there is a hot and trending topic.
Moreover, groups are created on discussion forums to address questions and queries or discuss a particular topic. Hence, it is very likely that there will be many discussions that are generally about the core topic. There can be other micro topics or micro topics discussed in these groups that revolve around the same core topic. However, these micro topics can bring in additional topics and may affect the concentration of core topics. Similar behavior is identified in the study carried out in this work. Thus, we conclude that the general topic of discussion always remains dominant in the dataset. However, when discussions start with topics that can have negative effects, this can cause other topics to penetrate the discussion thread. In our case, for instance, when discussions start with "Vaccine side effects”, the concentration of other topics increases in the discussion thread.
We noticed that the none stance dominates in the discussions. This means that most of the statements are not focused on exposing the position or stance of the user. Instead, most of the conversations on the discussion forums are queries or questions, and thus they do not have a stance; they are neutral and typically represent the attempt of the user to build a stance based on the answers received. People reply with their experience, but most try to explain the pros and cons of any choice, without a specific stance.
Finally, considering the big impact that COVID is having on our lives and on the world in general, one may wonder why the discussions feature so many positive content. One reason may be related to the fact that people discuss ways (prominently related to vaccination) to go back to normal. Thus, we can see more Positive sentiments attached to the discussions in this dataset.
In our future research, we plan to analyze the intent analysis mechanism in more depth. The intent analysis we implemented already features good accuracy in our experiments. However, our current intent classification is fairly simple; future extensions may cover more refined classification methods, such as the ones presented in [95,96,97]. In addition, the graph with communities that are generated with some perturbation could have interesting field-like core structure. Extending the proposed method using the generalized k-core percolation in networks with community structure [98] helps to identify any potential randomness. Moreover, we plan to investigate feature selection methods [99,100] that could potentially reduce the complexity and increase the performance of the classifiers. To improve accuracy we also plan to extend our analysis by considering emoji and emoticon symbols, which are pervasive in SM content, as studied in [101,102]. Finally, we plan to design conversation agents capable of participating in some discussions [103] during online conversations, based on the learned conversational patterns, to implement nudging and hinting strategies towards the users. Such conversation agents would be beneficial for the events’ organizers, to facilitate customer relationship management [104,105] and to foster behavioral changes in users.

Author Contributions

M.B.: Supervision, Funding acquisition, Conceptualization, Methodology, Validation, Investigation, Writing—Review & Editing. A.J.S.: Conceptualization, Methodology, Software, Validation, Investigation, Data Curation, Writing—Review & Editing, Visualization. K.K.: Software, Validation, Investigation, Data Curation, Writing—Original Draft, Visualization. A.E.S.: Software, Validation, Investigation, Data Curation, Writing—Original Draft, Visualization. All authors have read and agreed to the published version of the manuscript.

Funding

This work was partially funded by: the European Union’s Horizon 2020 research and Innovation program: “PERISCOPE: Pan European Response to the Impacts of COVID-19 and future Pandemics and Epidemics”, under the grant agreement N°101016233—H2020-SC1-PHE_CORON-AVIRUS-2020-2-RTD; And Regione Lombardia POR-FESR Project “FaST (Fashion Sensing Technology) —ID 187010”.

Institutional Review Board Statement

Not applicable.

Informed Consent Statement

Not applicable.

Data Availability Statement

The dataset used for the experiment on Instagram can be accessed from https://www.instagram.com/yourexpo2015/ (accessed on 25 January 2020), as well as the hashtag #YourExpo2015. We made the dataset used for the experiment on Reddit publicly available at https://doi.org/10.7910/DVN/XJTBQM (accessed on 28 August 2022).

Conflicts of Interest

The authors declare no conflict of interest.

References

  1. Qualman, E. How Social Media Transforms the Way We Live and Do Business; Business Book Summaries: Ipswich, MA, USA, 2011. [Google Scholar]
  2. Friedman, L.W.; Friedman, H. Using social media technologies to enhance online learning. J. Educ. Online 2013, 10, 1–22. [Google Scholar] [CrossRef]
  3. Al-Atabi, M.; DeBoer, J. Teaching entrepreneurship using massive open online course (MOOC). Technovation 2014, 34, 261–264. [Google Scholar] [CrossRef]
  4. Vasilescu, B.; Serebrenik, A.; Devanbu, P.; Filkov, V. How social Q&A sites are changing knowledge sharing in open source software communities. In Proceedings of the 17th ACM Conference on Computer Supported Cooperative Work & Social Computing, Baltimore, MD, USA, 15–19 February 2014; pp. 342–354. [Google Scholar]
  5. Diakopoulos, N.; Naaman, M. Towards Quality Discourse in Online News Comments. In Proceedings of the ACM 2011 Conference on Computer Supported Cooperative Work, Hangzhou, China, 19–23 March 2011; CSCW ’11. Association for Computing Machinery: New York, NY, USA; pp. 133–142. [Google Scholar] [CrossRef]
  6. He, W.; Zha, S.; Li, L. Social media competitive analysis and text mining: A case study in the pizza industry. Int. J. Inf. Manag. 2013, 33, 464–472. [Google Scholar] [CrossRef]
  7. Godey, B.; Manthiou, A.; Pederzoli, D.; Rokka, J.; Aiello, G.; Donvito, R.; Singh, R. Social media marketing efforts of luxury brands: Influence on brand equity and consumer behavior. J. Bus. Res. 2016, 69, 5833–5841. [Google Scholar] [CrossRef]
  8. Dong, J.Q.; Wu, W. Business value of social media technologies: Evidence from online user innovation communities. J. Strateg. Inf. Syst. 2015, 24, 113–127. [Google Scholar] [CrossRef]
  9. Bessis, N.; Dobre, C. Big Data and Internet of Things: A Roadmap for Smart Environments; Springer: Berlin/Heidelberg, Germany, 2014; Volume 546. [Google Scholar]
  10. Brambilla, M.; Javadian Sabet, A.; Masciadri, A. Data-driven user profiling for smart ecosystems. In Smart Living between Cultures and Practices. A Design Oriented Perspective; Mandragora: Milan, Italy, 2019; pp. 84–98. ISBN 978-88-7461-496-7. [Google Scholar]
  11. Tufekci, Z. Big questions for social media big data: Representativeness, validity and other methodological pitfalls. In Proceedings of the Eighth International AAAI Conference on Weblogs and Social Media, Ann Arbor, MI, USA, 1–4 June 2014. [Google Scholar]
  12. Ruths, D.; Pfeffer, J. Social media for large studies of behavior. Science 2014, 346, 1063–1064. [Google Scholar] [CrossRef] [PubMed]
  13. Schreck, T.; Keim, D. Visual analysis of social media data. Computer 2012, 46, 68–75. [Google Scholar] [CrossRef]
  14. Leskovec, J.; Sosič, R. Snap: A general-purpose network analysis and graph-mining library. ACM Trans. Intell. Syst. Technol. (TIST) 2016, 8, 1–20. [Google Scholar] [CrossRef] [Green Version]
  15. Brambilla, M.; Javadian Sabet, A.; Hosseini, M. The role of social media in long-running live events: The case of the Big Four fashion weeks dataset. Data Brief 2021, 35, 106840. [Google Scholar] [CrossRef]
  16. Javadian Sabet, A.; Brambilla, M.; Hosseini, M. A multi-perspective approach for analyzing long-running live events on social media. A case study on the “Big Four” international fashion weeks. Online Soc. Netw. Media 2021, 24, 100140. [Google Scholar] [CrossRef]
  17. Brambilla, M.; Javadian, A.; Sulistiawati, A.E. Conversation Graphs in Online Social Media. In Web Engineering; Brambilla, M., Chbeir, R., Frasincar, F., Manolescu, I., Eds.; Springer International Publishing: Cham, Switzerland, 2021; pp. 97–112. [Google Scholar]
  18. Planas, E.; Daniel, G.; Brambilla, M.; Cabot, J. Towards a model-driven approach for multiexperience AI-based user interfaces. Softw. Syst. Model. 2021, 20, 997–1009. [Google Scholar] [CrossRef]
  19. Arabghalizi, T.; Rahdari, B.; Brambilla, M. Analysis and Knowledge Extraction from Event-related Visual Content on Instagram. In Proceedings of the 3rd International Workshop on Knowledge Discoveryon the WEB-KD-WEB, Cagliari, Italy, 11–12 September 2017; Volume 1959, pp. 16–27. [Google Scholar]
  20. Balduini, M.; Brambilla, M.; Della Valle, E.; Marazzi, C.; Arabghalizi, T.; Rahdari, B.; Vescovi, M. Models and Practices in Urban Data Science at Scale. Big Data Res. 2019, 17, 66–84. [Google Scholar] [CrossRef] [Green Version]
  21. Boyd, D.M.; Ellison, N.B. Social network sites: Definition, history, and scholarship. J. Comput.-Mediat. Commun. 2007, 13, 210–230. [Google Scholar] [CrossRef] [Green Version]
  22. Rahdari, B.; Arabghalizi, T.; Brambilla, M. Analysis of online user behaviour for art and culture events. In International Cross-Domain Conference for Machine Learning and Knowledge Extraction; Springer: Berlin/Heidelberg, Germany, 2017; pp. 219–236. [Google Scholar]
  23. Zhan, L.; Sun, Y.; Wang, N.; Zhang, X. Understanding the influence of social media on people’s life satisfaction through two competing explanatory mechanisms. Aslib J. Inf. Manag. 2016, 68, 347–361. [Google Scholar] [CrossRef]
  24. Zhang, Y.; Leung, L. A review of social networking service (SNS) research in communication journals from 2006 to 2011. New Media Soc. 2015, 17, 1007–1024. [Google Scholar] [CrossRef]
  25. Henderson, A.; Edwards, L.; Bowley, R. Authentic dialogue? The role of “friendship” in a social media recruitment campaign. J. Commun. Manag. 2010, 14, 237–257. [Google Scholar] [CrossRef]
  26. Ellison, N.B.; Steinfield, C.; Lampe, C. The benefits of Facebook “friends”: Social capital and college students’ use of online social network sites. J. Comput.-Mediat. Commun. 2007, 12, 1143–1168. [Google Scholar] [CrossRef] [Green Version]
  27. Hudson, S.; Huang, L.; Roth, M.S.; Madden, T.J. The influence of social media interactions on consumer–brand relationships: A three-country study of brand perceptions and marketing behaviors. Int. J. Res. Mark. 2016, 33, 27–41. [Google Scholar] [CrossRef]
  28. Lai, L.S.; To, W.M. Content analysis of social media: A grounded theory approach. J. Electron. Commer. Res. 2015, 16, 138. [Google Scholar]
  29. Fono, D.; Baecker, R. Structuring and Supporting Persistent Chat Conversations. In Proceedings of the 2006 20th Anniversary Conference on Computer Supported Cooperative Work, Banff, AB, Canada, 4–8 November 2006; CSCW ’06. Association for Computing Machinery: New York, NY, USA; pp. 455–458. [Google Scholar] [CrossRef]
  30. Moro, S.; Rita, P.; Vala, B. Predicting social media performance metrics and evaluation of the impact on brand building: A data mining approach. J. Bus. Res. 2016, 69, 3341–3351. [Google Scholar] [CrossRef]
  31. Hosseini, M.; Sabet, A.J.; He, S.; Aguiar, D. Interpretable Fake News Detection with Topic and Deep Variational Models. arXiv 2022, arXiv:2209.01536. [Google Scholar] [CrossRef]
  32. Gasparini, M.; Ramponi, G.; Brambilla, M.; Ceri, S. Assigning users to domains of interest based on content and network similarity with champion instances. In Proceedings of the 2019 IEEE/ACM International Conference on Advances in Social Networks Analysis and Mining, Vancouver, BC, Canada, 27–30 August 2019; pp. 589–592. [Google Scholar]
  33. Javadian Sabet, A.; Rossi, M.; Schreiber, F.A.; Tanca, L. Towards Learning Travelers’ Preferences in a Context-Aware Fashion. In Ambient Intelligence—Software and Applications; Novais, P., Vercelli, G., Larriba-Pey, J.L., Herrera, F., Chamoso, P., Eds.; Springer International Publishing: Cham, Switzerland, 2021; pp. 203–212. [Google Scholar]
  34. Brena, G.; Brambilla, M.; Ceri, S.; Di Giovanni, M.; Pierri, F.; Ramponi, G. News Sharing User Behaviour on Twitter: A Comprehensive Data Collection of News Articles and Social Interactions. In Proceedings of the International AAAI Conference on Web and Social Media, Atlanta, GA, USA, 6–9 June 2019; Volume 13, pp. 592–597. [Google Scholar]
  35. Javadian Sabet, A. Social Media Posts Popularity Prediction during Long-Running Live Events. A Case Study on Fashion Week. Master’s Thesis, Politecnico di Milano, Milan, Italy, 2019. [Google Scholar]
  36. Myers, S.A.; Sharma, A.; Gupta, P.; Lin, J. Information network or social network? The structure of the Twitter follow graph. In Proceedings of the 23rd International Conference on World Wide Web, Seoul, Korea, 7–11 April 2014; pp. 493–498. [Google Scholar]
  37. Zhao, Z.; Wei, F.; Zhou, M.; Ng, W. Cold-start expert finding in community question answering via graph regularization. In International Conference on Database Systems for Advanced Applications; Springer: Berlin/Heidelberg, Germany, 2015; pp. 21–38. [Google Scholar]
  38. Backstrom, L.; Kleinberg, J. Romantic partnerships and the dispersion of social ties: A network analysis of relationship status on facebook. In Proceedings of the 17th ACM Conference on Computer Supported Cooperative Work & Social Computing, Baltimore, ML, USA, 15–19 February 2014; pp. 831–841. [Google Scholar]
  39. Buntain, C.; Golbeck, J. Identifying social roles in reddit using network structure. In Proceedings of the 23rd International Conference on World Wide Web, Seoul, Korea, 7–11 April 2014; pp. 615–620. [Google Scholar]
  40. Mcauley, J.; Leskovec, J. Discovering social circles in ego networks. ACM Trans. Knowl. Discov. Data (TKDD) 2014, 8, 1–28. [Google Scholar] [CrossRef] [Green Version]
  41. Rao, B.; Mitra, A. A new approach for detection of common communities in a social network using graph mining techniques. In Proceedings of the 2014 International Conference on High Performance Computing and Applications (ICHPCA), Bhubaneswar, India, 22–24 December 2014; pp. 1–6. [Google Scholar]
  42. Yang, J.; McAuley, J.; Leskovec, J. Community detection in networks with node attributes. In Proceedings of the 2013 IEEE 13th International Conference on Data Mining, Dallas, TX, USA, 7–10 December 2013; pp. 1151–1156. [Google Scholar]
  43. Paranjape, A.; Benson, A.R.; Leskovec, J. Motifs in temporal networks. In Proceedings of the Tenth ACM International Conference on Web Search and Data Mining, Cambridge, UK, 6–10 February 2017; pp. 601–610. [Google Scholar]
  44. Shang, Y. Modeling epidemic spread with awareness and heterogeneous transmission rates in networks. J. Biol. Phys. 2013, 39, 489–500. [Google Scholar] [CrossRef] [Green Version]
  45. Odiete, O.; Jain, T.; Adaji, I.; Vassileva, J.; Deters, R. Recommending programming languages by identifying skill gaps using analysis of experts. a study of stack overflow. In Proceedings of the Adjunct Publication of the 25th Conference on User Modeling, Adaptation and Personalization, Bratislava, Slovakia, 9–12 July 2017; pp. 159–164. [Google Scholar]
  46. Ning, K.; Li, N.; Zhang, L.J. Using Graph Analysis Approach to Support Question & Answer on Enterprise Social Network. In Proceedings of the 2012 IEEE Asia-Pacific Services Computing Conference, Guilin, China, 6–8 December 2012; pp. 146–153. [Google Scholar]
  47. Aumayr, E.; Chan, J.; Hayes, C. Reconstruction of Threaded Conversations in Online Discussion Forums. ICWSM 2011, 11, 26–33. [Google Scholar]
  48. Cogan, P.; Andrews, M.; Bradonjic, M.; Kennedy, W.S.; Sala, A.; Tucci, G. Reconstruction and analysis of twitter conversation graphs. In Proceedings of the First ACM International Workshop on Hot Topics on Interdisciplinary Social Networks Research, Beijing, China, 12–16 August 2012; pp. 25–31. [Google Scholar]
  49. Zayats, V.; Ostendorf, M. Conversation modeling on Reddit using a graph-structured LSTM. Trans. Assoc. Comput. Linguist. 2018, 6, 121–132. [Google Scholar] [CrossRef] [Green Version]
  50. Kumar, R.; Mahdian, M.; McGlohon, M. Dynamics of conversations. In Proceedings of the 16th ACM SIGKDD International Conference on Knowledge Discovery and Data Mining, Washington DC, USA, 25–28 July 2010; pp. 553–562. [Google Scholar]
  51. Aragón, P.; Gómez, V.; Kaltenbrunner, A. To thread or not to thread: The impact of conversation threading on online discussion. In Proceedings of the Eleventh International AAAI Conference on Web and Social Media, Montreal, QC, Canada, 15–18 May 2017; Association for the Advancement of Artificial Intelligence (AAAI): Palo Alto, CA, USA, 2017; pp. 12–21. [Google Scholar]
  52. Dave, K.; Wattenberg, M.; Muller, M. Flash Forums and ForumReader: Navigating a New Kind of Large-Scale Online Discussion. In Proceedings of the 2004 ACM Conference on Computer Supported Cooperative Work, Chicago, IL, USA, 6–10 November 2004; CSCW ’04. Association for Computing Machinery: New York, NY, USA; pp. 232–241. [Google Scholar] [CrossRef]
  53. Beenen, G.; Ling, K.; Wang, X.; Chang, K.; Frankowski, D.; Resnick, P.; Kraut, R.E. Using Social Psychology to Motivate Contributions to Online Communities. In Proceedings of the 2004 ACM Conference on Computer Supported Cooperative Work, Chicago, IL, USA, 6–10 November 2004; CSCW ’04. Association for Computing Machinery: New York, NY, USA; pp. 212–221. [Google Scholar] [CrossRef]
  54. Dillahunt, T.R.; Mankoff, J. Understanding Factors of Successful Engagement around Energy Consumption between and among Households. In Proceedings of the 17th ACM Conference on Computer Supported Cooperative Work & Social Computing, Baltimore, ML, USA, 15–19 February 2014; CSCW ’14. Association for Computing Machinery: New York, NY, USA; pp. 1246–1257. [Google Scholar] [CrossRef]
  55. Farzan, R.; Dabbish, L.A.; Kraut, R.E.; Postmes, T. Increasing Commitment to Online Communities by Designing for Social Presence. In Proceedings of the ACM 2011 Conference on Computer Supported Cooperative Work, Hangzhou, China, 19–23 March 2011; CSCW ’11. Association for Computing Machinery: New York, NY, USA; pp. 321–330. [Google Scholar] [CrossRef]
  56. Budak, C.; Garrett, R.K.; Resnick, P.; Kamin, J. Threading is sticky: How threaded conversations promote comment system user retention. Proc. ACM Hum.-Comput. Interact. 2017, 1, 1–20. [Google Scholar] [CrossRef]
  57. Samory, M.; Cappelleri, V.M.; Peserico, E. Quotes reveal community structure and interaction dynamics. In Proceedings of the 2017 ACM Conference on Computer Supported Cooperative Work and Social Computing, Portland, OR, USA, 25 February–1 March 2017; pp. 322–335. [Google Scholar]
  58. Garimella, K.; Weber, I.; De Choudhury, M. Quote RTs on Twitter: Usage of the new feature for political discourse. In Proceedings of the 8th ACM Conference on Web Science, Hannover, Germany, 22–25 May 2016; pp. 200–204. [Google Scholar]
  59. Hutto, C.J.; Gilbert, E. Vader: A parsimonious rule-based model for sentiment analysis of social media text. In Proceedings of the Eighth International AAAI Conference on Weblogs and Social Media, Ann Arbor, MI, USA, 1–4 June 2014. [Google Scholar]
  60. Zhang, L.; Ghosh, R.; Dekhil, M.; Hsu, M.; Liu, B. Combining lexicon-based and learning-based methods for Twitter sentiment analysis. HP Lab. Tech. Rep. HPL-2011 2011, 89. Available online: https://www.semanticscholar.org/paper/Combining-lexicon-based-and-learning-based-methods-Zhang-Ghosh/ab9a7687ab7c90707f863e54afe12fd99f2deb11 (accessed on 20 May 2022).
  61. Nakov, P.; Rosenthal, S.; Kiritchenko, S.; Mohammad, S.M.; Kozareva, Z.; Ritter, A.; Stoyanov, V.; Zhu, X. Developing a successful SemEval task in sentiment analysis of Twitter and other social media texts. Lang. Resour. Eval. 2016, 50, 35–65. [Google Scholar] [CrossRef]
  62. Jayasanka, R.; Madhushani, T.; Marcus, E.; Aberathne, I.; Premaratne, S. Sentiment analysis for social media. In Information Technology Research Symposium; University of Moratuwa: Moratuwa, Sri Lanka, 5 December 2013. [Google Scholar]
  63. Mitchell, R. Web Scraping with Python: Collecting More Data from the Modern Web; O’Reilly Media, Inc.: Sebastopol, CA, USA, 2018. [Google Scholar]
  64. Zhang, X.; Zhao, J.; LeCun, Y. Character-level convolutional networks for text classification. In Proceedings of the 28th International Conference on Neural Information Processing Systems, Montreal, QC, Canada, 7–12 December 2015; pp. 649–657. [Google Scholar]
  65. Aggarwal, C.C.; Zhai, C. Aggarwal, C.C.; Zhai, C. A survey of text classification algorithms. In Mining Text Data; Springer: Berlin/Heidelberg, Germany, 2012; pp. 163–222. [Google Scholar]
  66. Joachims, T.; Sebastiani, F. Guest editors’ introduction to the special issue on automated text categorization. J. Intell. Inf. Syst. 2002, 18, 103. [Google Scholar] [CrossRef]
  67. Knight, K. Mining online text. Commun. ACM 1999, 42, 58–61. [Google Scholar] [CrossRef]
  68. Sebastiani, F. Machine learning in automated text categorization. ACM Comput. Surv. (CSUR) 2002, 34, 1–47. [Google Scholar] [CrossRef] [Green Version]
  69. Lai, S.; Xu, L.; Liu, K.; Zhao, J. Recurrent convolutional neural networks for text classification. In Proceedings of the Twenty-Ninth AAAI Conference on Artificial Intelligence, Austin, TA, USA, 25–30 January 2015. [Google Scholar]
  70. Zhang, H. The optimality of naive Bayes. AA 2004, 1, 3. [Google Scholar]
  71. Vapnik, V.N. The Nature of Statistical Learning Theory; Springer: New York, NY, USA, 1995. [Google Scholar]
  72. Gardner, M.W.; Dorling, S. Artificial neural networks (the multilayer perceptron)—A review of applications in the atmospheric sciences. Atmos. Environ. 1998, 32, 2627–2636. [Google Scholar] [CrossRef]
  73. Zhang, C.; Ma, Y. Ensemble Machine Learning: Methods and Applications; Springer: Berlin/Heidelberg, Germany, 2012. [Google Scholar]
  74. Bondy, J.A.; Murty, U.S.R. Graph Theory with Applications; Macmillan: London, UK, 1976; Volume 290. [Google Scholar]
  75. Godsil, C.; Royle, G.F. Algebraic Graph Theory; Springer Science & Business Media: Berlin/Heidelberg, Germany, 2013; Volume 207. [Google Scholar]
  76. Bollobás, B. Modern Graph Theory; Springer Science & Business Media: Berlin/Heidelberg, Germany, 2013; Volume 184. [Google Scholar]
  77. Estrada, E. Graph and network theory in physics. arXiv 2013, arXiv:1302.4378. [Google Scholar]
  78. Milo, R.; Kashtan, N.; Itzkovitz, S.; Newman, M.E.; Alon, U. On the uniform generation of random graphs with prescribed degree sequences. arXiv 2003, arXiv:cond-mat/0312028. [Google Scholar]
  79. Benson, A.R.; Gleich, D.F.; Leskovec, J. Higher-order organization of complex networks. Science 2016, 353, 163–166. [Google Scholar] [CrossRef] [Green Version]
  80. Jackson, M.O. Social and Economic Networks; Princeton University Press: Oxford, UK, 2010. [Google Scholar]
  81. Newman, M. Networks; Oxford University Press: Oxford, UK, 2018. [Google Scholar]
  82. Kirkpatrick, A.; Onyeze, C.; Kartchner, D.; Allegri, S.; Nakajima An, D.; McCoy, K.; Davalbhakta, E.; Mitchell, C.S. Optimizations for Computing Relatedness in Biomedical Heterogeneous Information Networks: SemNet 2.0. Big Data Cogn. Comput. 2022, 6, 27. [Google Scholar] [CrossRef]
  83. Allegri, S.A.; McCoy, K.; Mitchell, C.S. CompositeView: A Network-Based Visualization Tool. Big Data Cogn. Comput. 2022, 6, 66. [Google Scholar] [CrossRef]
  84. Shannon, P.; Markiel, A.; Ozier, O.; Baliga, N.S.; Wang, J.T.; Ramage, D.; Amin, N.; Schwikowski, B.; Ideker, T. Cytoscape: A software environment for integrated models of biomolecular interaction networks. Genome Res. 2003, 13, 2498–2504. [Google Scholar] [CrossRef]
  85. Bastian, M.; Heymann, S.; Jacomy, M. Gephi: An open source software for exploring and manipulating networks. In Proceedings of the Third International AAAI Conference on Weblogs and Social Media, San Jose, CA, USA, 17–20 May 2009. [Google Scholar]
  86. Heymann, S.; Le Grand, B. Visual analysis of complex networks for business intelligence with gephi. In Proceedings of the 2013 17th International Conference on Information Visualisation, London, UK, 16–18 July 2013; pp. 307–312. [Google Scholar]
  87. Jacomy, M.; Venturini, T.; Heymann, S.; Bastian, M. ForceAtlas2, a continuous graph layout algorithm for handy network visualization designed for the Gephi software. PLoS ONE 2014, 9, e98679. [Google Scholar] [CrossRef]
  88. Robins, G. A tutorial on methods for the modeling and analysis of social network data. J. Math. Psychol. 2013, 57, 261–274. [Google Scholar] [CrossRef]
  89. MonkeyLearn. Sentiment Analysis: A Definitive Guide; MonkeyLearn, 2018. Available online: https://monkeylearn.com/sentiment-analysis/ (accessed on 18 May 2021).
  90. Loria, S. textblob Documentation. Release 0.15 2018, 2, 269. Available online: https://textblob.readthedocs.io/en/dev/ (accessed on 15 July 2021).
  91. Blei, D.M.; Ng, A.Y.; Jordan, M.I. Latent dirichlet allocation. J. Mach. Learn. Res. 2003, 3, 993–1022. [Google Scholar]
  92. Steinbauer, T. Information and Social Analysis of Reddit. 2011. Available online: http://snap.stanford.edu/class/cs224w-2011/proj/tbower_Finalwriteup_v1.pdf (accessed on 17 May 2021).
  93. pj. How to Scrap Reddit Using pushshift.io via Python. 2018. Available online: https://github.com/pushshift/api (accessed on 15 April 2022).
  94. Brambilla, M.; Kharmale, K. COVID-19 Vaccine Discussions on Reddit with Sentiment, Stance, Topics, and Timing. 2022. Available online: https://dataverse.harvard.edu/dataset.xhtml?persistentId=doi:10.7910/DVN/XJTBQM (accessed on 28 August 2022).
  95. Xu, B.; Guo, X.; Ye, Y.; Cheng, J. An Improved Random Forest Classifier for Text Categorization. JCP 2012, 7, 2913–2920. [Google Scholar] [CrossRef] [Green Version]
  96. Kim, Y. Convolutional neural networks for sentence classification. arXiv 2014, arXiv:1408.5882. [Google Scholar]
  97. Oliveira, L.S.; de Melo, P.O.; Amaral, M.S.; Pinho, J.A.G. When politicians talk about politics: Identifying political tweets of brazilian congressmen. arXiv 2018, arXiv:1805.01589. [Google Scholar]
  98. Shang, Y. Generalized k-core percolation in networks with community structure. SIAM J. Appl. Math. 2020, 80, 1272–1289. [Google Scholar] [CrossRef]
  99. Brankovic, A.; Hosseini, M.; Piroddi, L. A Distributed Feature Selection Algorithm Based on Distance Correlation with an Application to Microarrays. IEEE/ACM Trans. Comput. Biol. Bioinform. 2019, 16, 1802–1815. [Google Scholar] [CrossRef]
  100. Hosseini, M. Feature Selection for Microarray Classification Problems. Master’s Thesis, Politecnico di Milano, Milan, Italy, 2018. [Google Scholar]
  101. Cha, Y.; Kim, J.; Park, S.; Yi, M.Y.; Lee, U. Complex and Ambiguous: Understanding Sticker Misinterpretations in Instant Messaging. Proc. ACM Hum.-Comput. Interact. 2018, 2, 3274299. [Google Scholar] [CrossRef]
  102. Jiang, J.A.; Fiesler, C.; Brubaker, J.R. ‘The Perfect One’: Understanding Communication Practices and Challenges with Animated GIFs. Proc. ACM Hum.-Comput. Interact. 2018, 2, 3274349. [Google Scholar] [CrossRef] [Green Version]
  103. Scotti, V.; Tedesco, R.; Sbattella, L. A Modular Data-Driven Architecture for Empathetic Conversational Agents. In Proceedings of the 2021 IEEE International Conference on Big Data and Smart Computing (BigComp), Jeju Island, Korea, 17–20 January 2021; pp. 365–368. [Google Scholar] [CrossRef]
  104. Galitsky, B. Adjusting Chatbot Conversation to User Personality and Mood. In Artificial Intelligence for Customer Relationship Management; Springer: Berlin/Heidelberg, Germany, 2021; pp. 93–127. [Google Scholar]
  105. O’Brien, M.; Dyché, J. The CRM Handbook: A Business Guide to Customer Relationship Management; Addison-Wesley Professional: Boston, MA, USA, 2002. [Google Scholar]
Figure 1. The text preprocessing pipeline to manipulate and reform raw text from the SM comments.
Bdcc 06 00113 g001
Figure 2. Intent analysis procedure: class selection, ground truth design, and text classification.
Bdcc 06 00113 g002
Figure 3. Network model design for Social Media platforms.
Bdcc 06 00113 g003
Figure 4. Graph visualization of a post on Social Media.
Bdcc 06 00113 g004
Figure 5. (a) Number and (b) percentage results of keyword-based classification for each category.
Bdcc 06 00113 g005
Figure 6. Ground truth assessment for Keyword-based classification.
Bdcc 06 00113 g006
Figure 7. Comparison of accuracy for different number of training samples.
Bdcc 06 00113 g007
Figure 8. Percentage of training samples for each category after the merging process.
Bdcc 06 00113 g008
Figure 9. Number of uncategorized comments versus number of human-in-the-loop iterations.
Bdcc 06 00113 g009
Figure 10. The resulting share of the keyword-based classification for each category.
Bdcc 06 00113 g010
Figure 11. Ground truth of intent analysis at the final stage.
Bdcc 06 00113 g011
Figure 12. Graph visualization of 3 posts of the case study.
Bdcc 06 00113 g012
Figure 13. Visualization of the conversation graphs.
Bdcc 06 00113 g013
Figure 14. Keywords related to the topic: “General about vaccines”.
Bdcc 06 00113 g014
Figure 15. Keywords related to the topic: “General after vaccination”.
Bdcc 06 00113 g015
Figure 16. Represents keywords relevant to topic: “Vaccine side effects”.
Bdcc 06 00113 g016
Figure 17. Distribution of the topics in the dataset.
Bdcc 06 00113 g017
Figure 18. 3D representation of the conversation size, period, and frequency.
Bdcc 06 00113 g018
Figure 19. Reply time in thankthankpositive conversation pattern.
Bdcc 06 00113 g019
Figure 20. The number of users that join the top conversation patterns with 3 nodes (a) and 4 nodes (b).
Bdcc 06 00113 g020
Figure 21. Average count of comments with respect to the discussion size.
Bdcc 06 00113 g021
Figure 22. Average number of comments for each root discussion.
Bdcc 06 00113 g022
Figure 23. Average number of comments depending on the depth of the discussion (considering the total no. of comments received).
Bdcc 06 00113 g023
Figure 24. Average count of comments in each discussion size (1–23) according to time.
Bdcc 06 00113 g024
Figure 25. Average count of comments in all discussion size according to time.
Bdcc 06 00113 g025
Figure 26. Graph structure of some exemplary discussions with sentiments assigned to the nodes.
Bdcc 06 00113 g026
Figure 27. Distribution of sentiment in the discussion, with respect to the starting sentiment: sentiment of comments tends to be more positive when the discussion starts as positive.
Bdcc 06 00113 g027
Figure 28. Trend of sentiments along size of discussions (total no. of comments received).
Bdcc 06 00113 g028
Figure 29. Distribution of sentiments with respect to starting topic of discussions.
Bdcc 06 00113 g029
Figure 30. Distribution of topics with respect to starting topic of discussions.
Bdcc 06 00113 g030
Figure 31. Distribution of topics with respect to size of discussions (total no. of comments received).
Bdcc 06 00113 g031
Figure 32. Trend of topics along size of discussions (total no. of comments received).
Bdcc 06 00113 g032
Figure 33. Trend of stance along size of discussions (total No. of comments received).
Bdcc 06 00113 g033
Figure 34. Distribution of Topics, Sentiment, and Stance along time (absolute value).
Bdcc 06 00113 g034
Figure 35. Percentage of Topics, Sentiment, and Stance along time (percentage).
Bdcc 06 00113 g035
Table 1. Bag of words with the most frequent occurrence words. Interesting words that can represent different intentions are represented in bold.
Word#Word#Word#Word#
graz8268buongiorn1278fatt923instagood732
buon4298foodporn1262brav919like729
thank2876piac1203meravigl909far725
bell2551nice1178buonissim904dolc699
Yourexpo-20152204molt1171igersital897davver690
food1844foto1160ved865ver688
ricett1841tua1141trov840vai678
bellissim1810prov1121expo-stuporesapor789follow677
fot1686timoebasil1114mayazetac778ser666
car1523me1094son773expo-italianlife655
instafood1480giorn1078sol773tropp650
mill1479compl1076poi767foodblog649
expo20151388wow1066blog761beauti643
good1374i1041tant749dev640
love1283sempr1030expo748
Table 2. Initial keywords for comment categories.
CategoryKeywords
Thankgrac, graz, thank
Congratulationaugur, complean, felic, tanti, congrat
Agreementcert, concordi, convenir, accord, si, true, conferm, agree, certain, ok, right, sure, yes, of course, esattamente
Positiveamar, amor, bac, great, bei, bell, ben, fabulous, bravissim, buon, cool, cute, gorgeous, enjoy, dear, cellent, good, darling, bont, bacion, kind, like, love, magnif, nice, prett
Invitationcanali, invit, pagin, segui, sito, venir, vien, blog, check, click, come, follow, http, link, mail, page, site, tag, visit, invite, web
Foodacqua, carot, cavol, cena, cibo, ciocco, colazion, cottur, crem, croccant, cucchi, cucin, cuoc, delica, deliz, diet, dolc, dolci, espresso, fagiol, salad, salmon, salt, seafood
Greetingarriv, buon, sera, buongiorn, ciao, mattin, nott, salv, giorn, night, morning, afternoon, hello, good, giorn, hey
Question?
Hashtag#
Table 3. The confusion matrix describing the actual class vs. prediction by Naïve Bayes classifier. The numbers on diagonal (highlighted) present the number of correct predictions.
Predicted
Naïve Bayesthankcongratulationagreementpositiveinvitationfoodgreetingquestion
Actual thank176500271067290
congratulation610560010
agreement15007902300
positive510043202164181
invitation7001772017304
food540056153311122
greeting520041311258751
question200055462391545
Table 4. The confusion matrix describing the actual class vs. prediction by SVM classifier. The numbers on diagonal (highlighted) present the number of correct predictions.
Predicted
SVMthankcongratulationagreementpositiveinvitationfoodgreetingquestion
Actualthank2084003008100
congratulation3370220110
agreement40236002622
positive9502413671851229
invitation80112425162142
food12634517113221549
greeting350013827012193
question8510380282219173
Table 5. The confusion matrices describing the actual class vs. the predicted aggregated categories. The numbers on diagonal (highlighted) present the number of correct predictions.
a Naïve Bayesb SVM
Predicted Predicted
Naïve BayesthankpositiveinvitationfoodquestionSVMthankpositiveinvitationfoodquestion
Actualthank14915670340 thank201277030
positive40641531451 positive10764364570
invitation1215193490 invitation8226191294
food49846027460 food1261528119851
question13647513428Actualquestion64650246524
Table 6. Examples of comments showing how stance and sentiments differ.
CommentSentimentStance
Vaccine triggers a stronger immunity than the infection. They almost always do. This is not how a vaccine work. On a mild case your immune system does not fight an army it’s just a small scouting team. A vaccine is like training your immune system with a very elaborate vr system mimicking the strength of a full armyPositiveFavor
Im scared I really want to be able to trust the vaccine and see it as hope for the world but I don’t. I simply feel like it was way too quickly developed and Ive heard a lot of bad things. Theres no way to know the long term effects of this yet and I just don’t know what to do.PositiveAgainst
What will the effect of mRNA have?NeutralNone
AMA I got the first dose of the Pfizer vaccine today. I work for a small hospital and I was given dose 1 of 2 of the Pfizer vaccine today. It was my choice. No it didnt hurt any worse than a normal shot. I signed a consent form. And Ill be given dose 2 in 3 weeks.NegativeFavor
Table 7. Support Vector Machines—Classification Report.
PrecisionRecallF1-ScoreSupport
Against0.650.680.6719
Favor0.670.530.5915
None0.670.750.7116
Accuracy 0.6650
Macro Avg0.660.660.6650
Weighted Avg0.660.660.6650
Table 8. Random Forest Classifier—Classification Report.
PrecisionRecallF1-ScoreSupport
Against0.920.580.7119
Favor0.770.670.7115
None0.600.940.7316
Accuracy 0.7250
Macro Avg0.760.730.7250
Weighted Avg0.770.720.7250
Table 9. Neural networks—Classification Report.
PrecisionRecallF1-ScoreSupport
Against0.720.680.7019
Favor0.570.530.5515
None0.670.750.7116
Accuracy 0.6650
Macro Avg0.650.660.6550
Weighted Avg0.660.660.6650
Table 10. Heatmap representing the frequency of the comment-reply relationship for categories.
Previous Comment
replies to ↱thankpositivefoodgreetingquestioncongratulationagreementinvitationhashtag
Subsequent comment thank183092991783115039714988790143
positive632215899743958127739895
food2479247382035465243634
greeting1096251806441368121513
question1544092791091821144926
congratulation14371116719112
agreement2112857379211065
invitation4082541811417316
hashtag230160000
Table 11. Occurrences of conversation patterns with 3 and 4 connected nodes (with more than 10 occurrences).
3 Nodes#4 Nodes#
thank → thank → positive1254thank → thank → thank → positive386
thank → thank → thank519thank → thank → thank → thank229
thank → positive → positive416thank → positive → thank → positive138
thank → positive → thank314thank → positive → thank → positive138
positive → thank → positive305positive → positive → positive → positive81
thank → thank → food256thank → thank → positive → positive79
positive → positive → positive250thank → thank → thank → food74
thank → positive → food219thank → positive → positive → positive53
thank → thank → greeting194thank → thank → thank → greeting42
thank → food → positive129thank → thank → positive → thank39
thank → greeting → positive112positive → positive → thank → positive32
positive → positive → food107positive → thank → positive → thank30
thank → positive → question107positive → positive → positive → food26
thank → food → food106thank → thank → positive → food24
thank → greeting → greeting94thank → thank → food → thank22
thank → positive → greeting89thank → positive → positive → food22
thank → food → question85thank → positive → positive → question22
thank → food → thank79thank → positive → thank → food21
positive → positive → question79thank → thank → food → food21
food → thank → positive74positive → positive → positive → thank20
positive → positive → thank65positive → positive → positive → question20
question → thank → positive64thank → positive → positive → thank17
food → positive → positive60thank → thank → food → positive16
thank → thank → question58thank → thank → positive → question15
positive → thank → food52thank → positive → thank → greeting14
greeting → thank → positive43positive → thank → positive → positive13
question → positive → positive41positive → thank → positive → food13
thank → thank → invitation35greeting → positive → thank → positive13
positive → positive → greeting33thank → thank → thank → question13
thank → positive → hashtag33food → positive → positive → positive11
Table 12. Duration under consideration when counting comments.
DescriptionDuration
Comments received in 1 h after posting the root discussion1 h
Comments received in between 1–6 h after posting the root discussion6 h
Comments received in between 6–12 h after posting the root discussion12 h
Comments received in between 12–24 h after posting the root discussion24 h
Comments received in between 24–48 h after posting the root discussion48 h
Comments received in between 48–168 h after posting the root discussion168 h
Comments received after 1 weekAfter a Week
Publisher’s Note: MDPI stays neutral with regard to jurisdictional claims in published maps and institutional affiliations.

