Morphology-Oriented Layout Optimization for Enhancing Building-Cluster Photovoltaic Potential in Severe Cold Regions



Abstract
1. Introduction
2. Materials and Methods
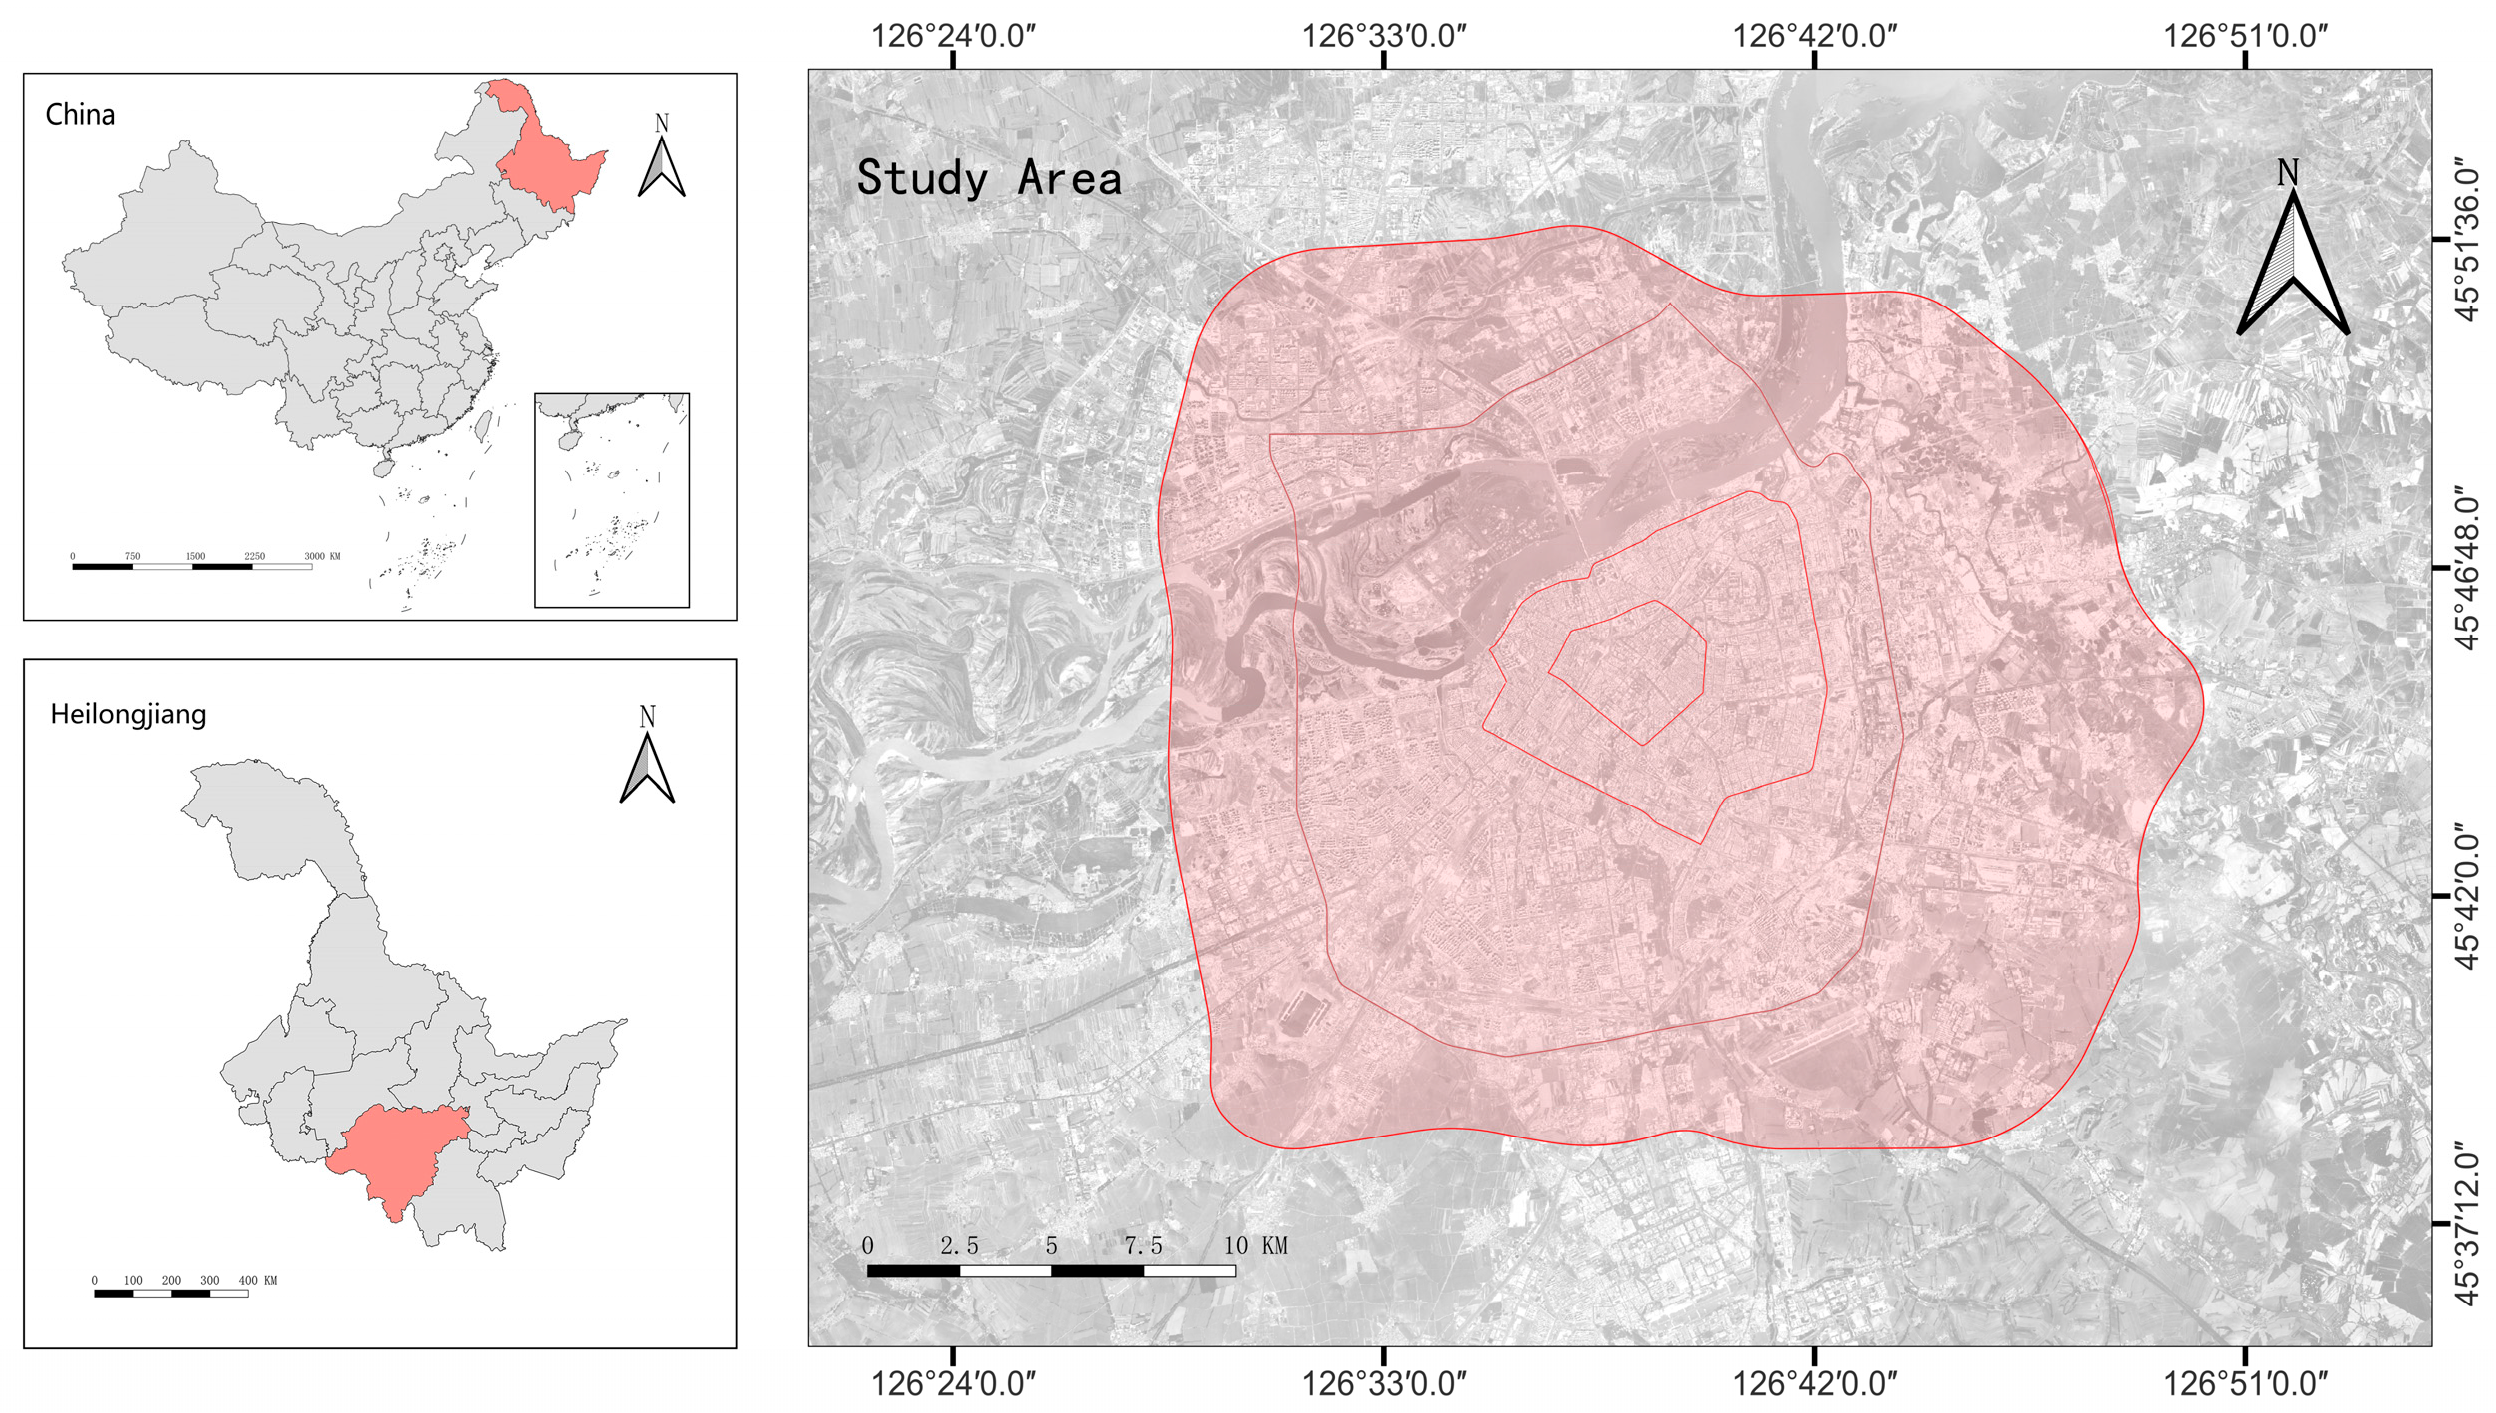
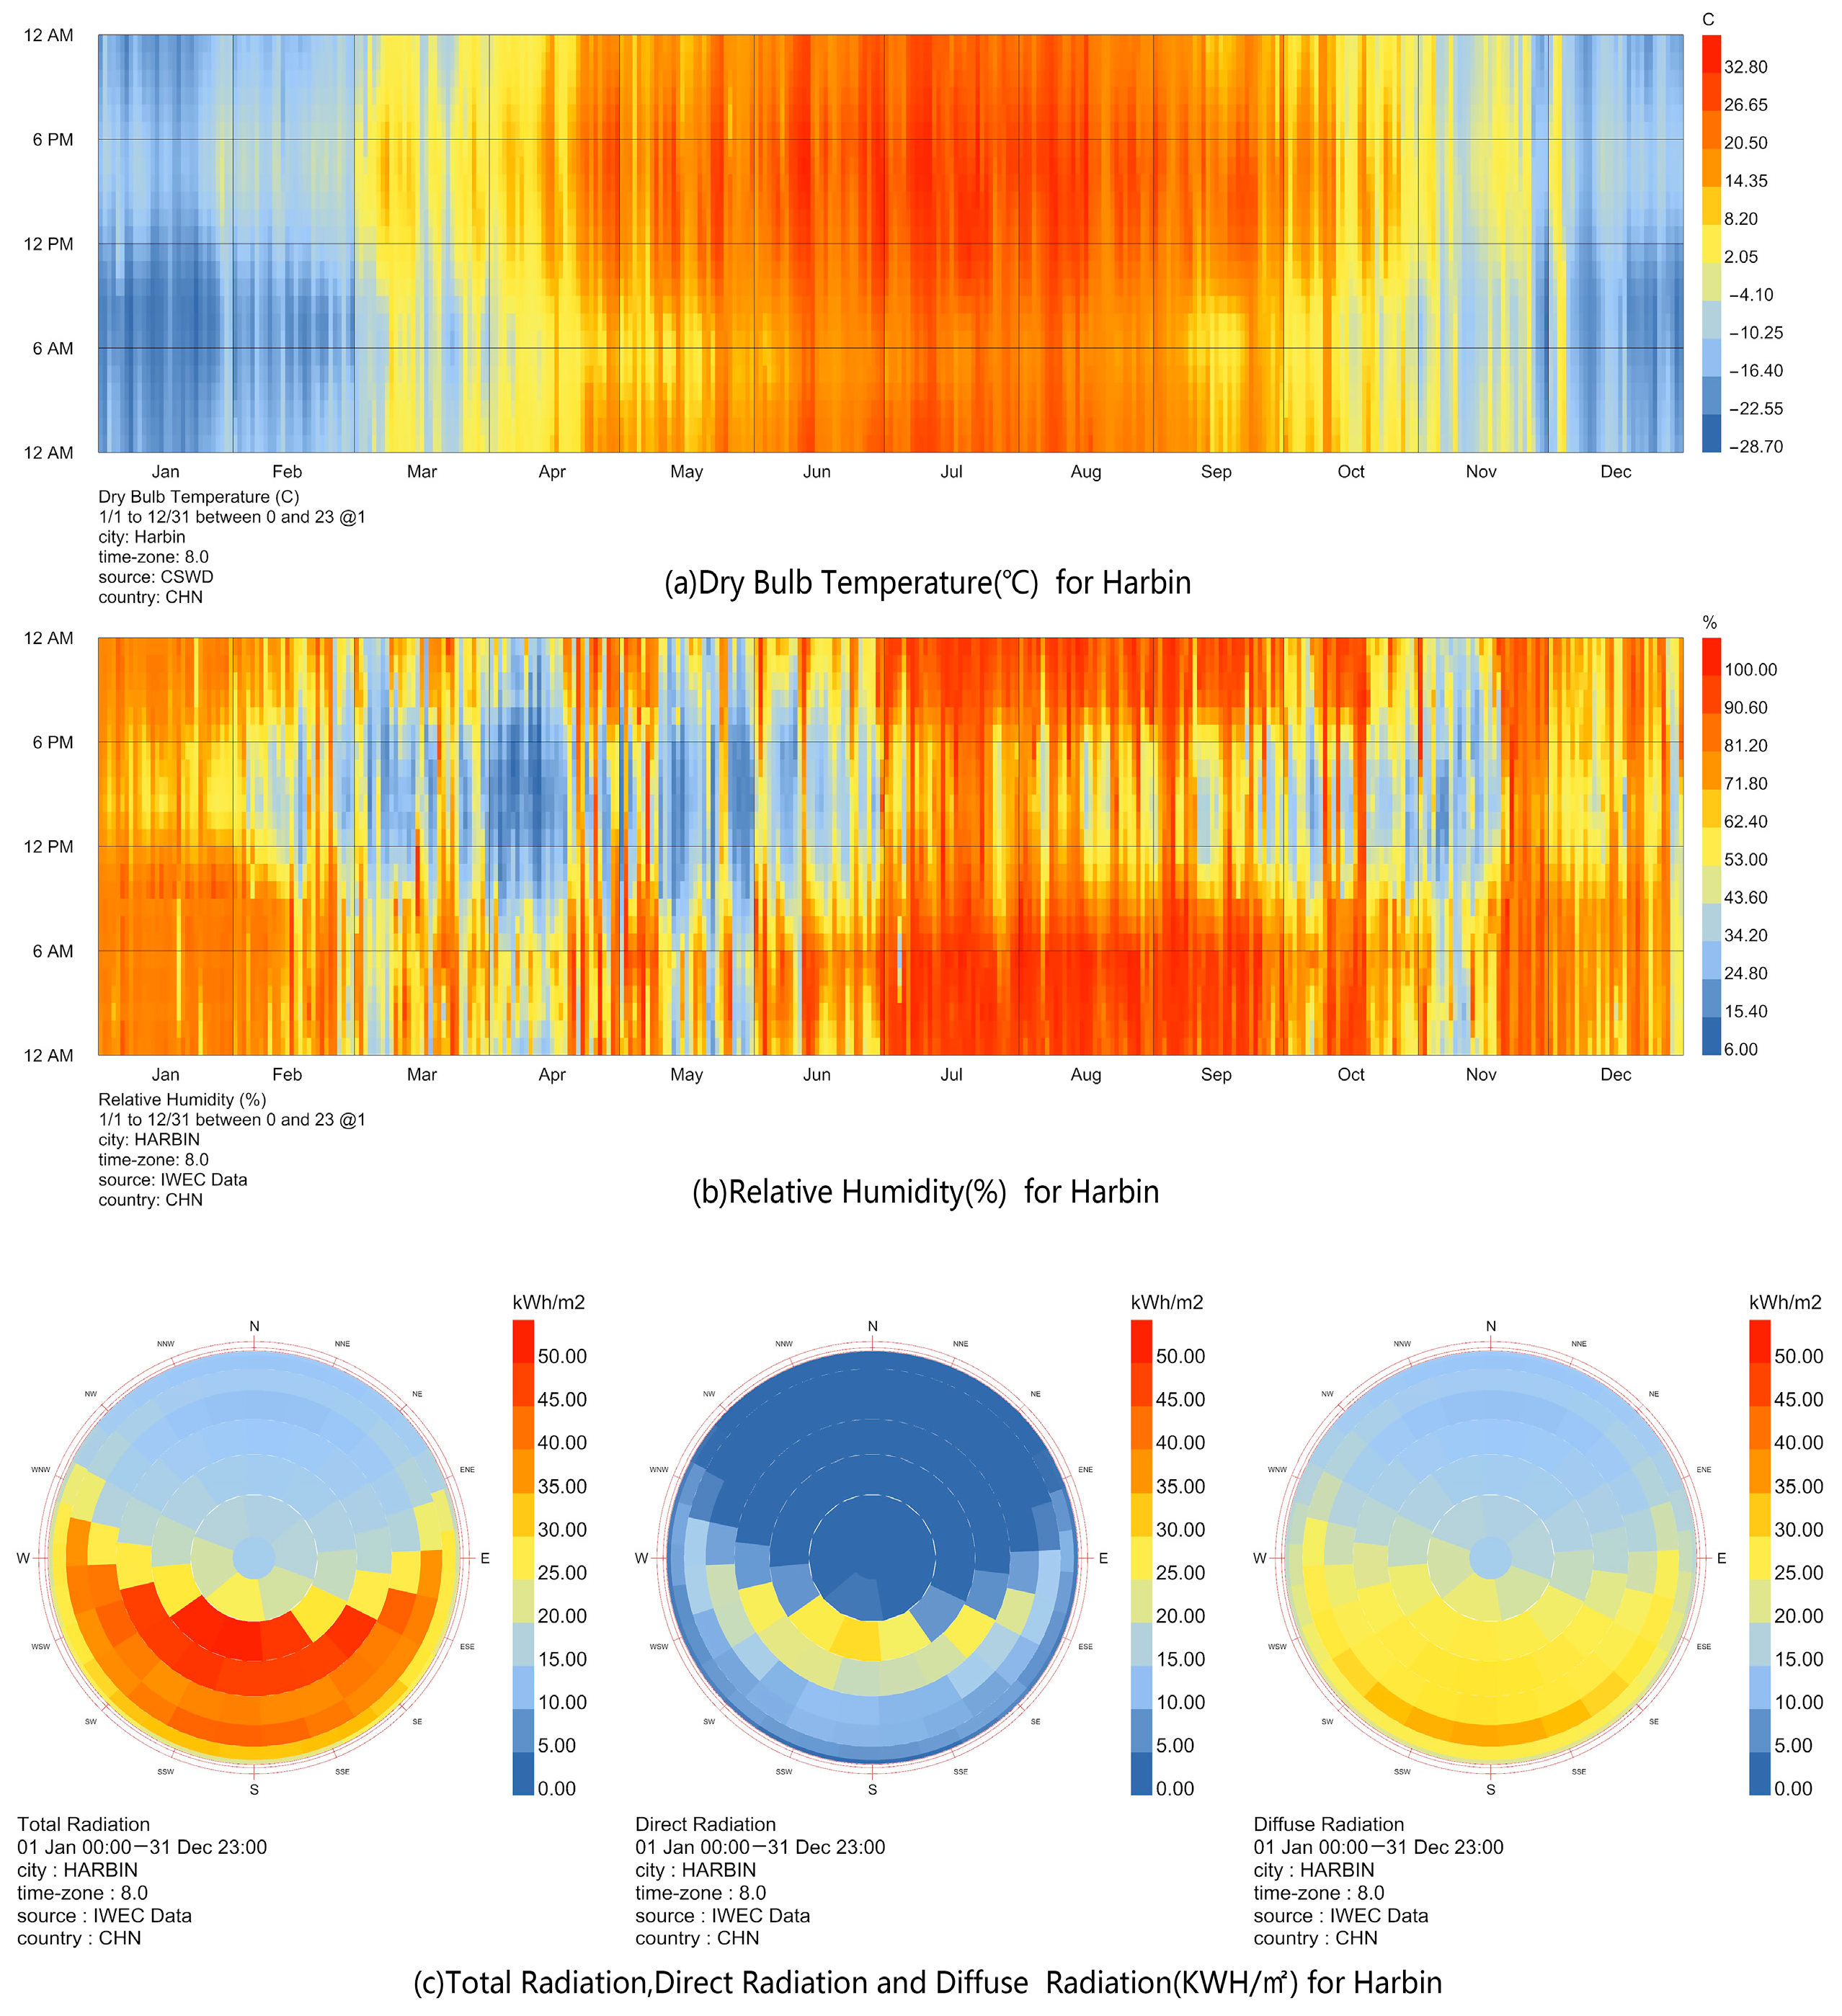
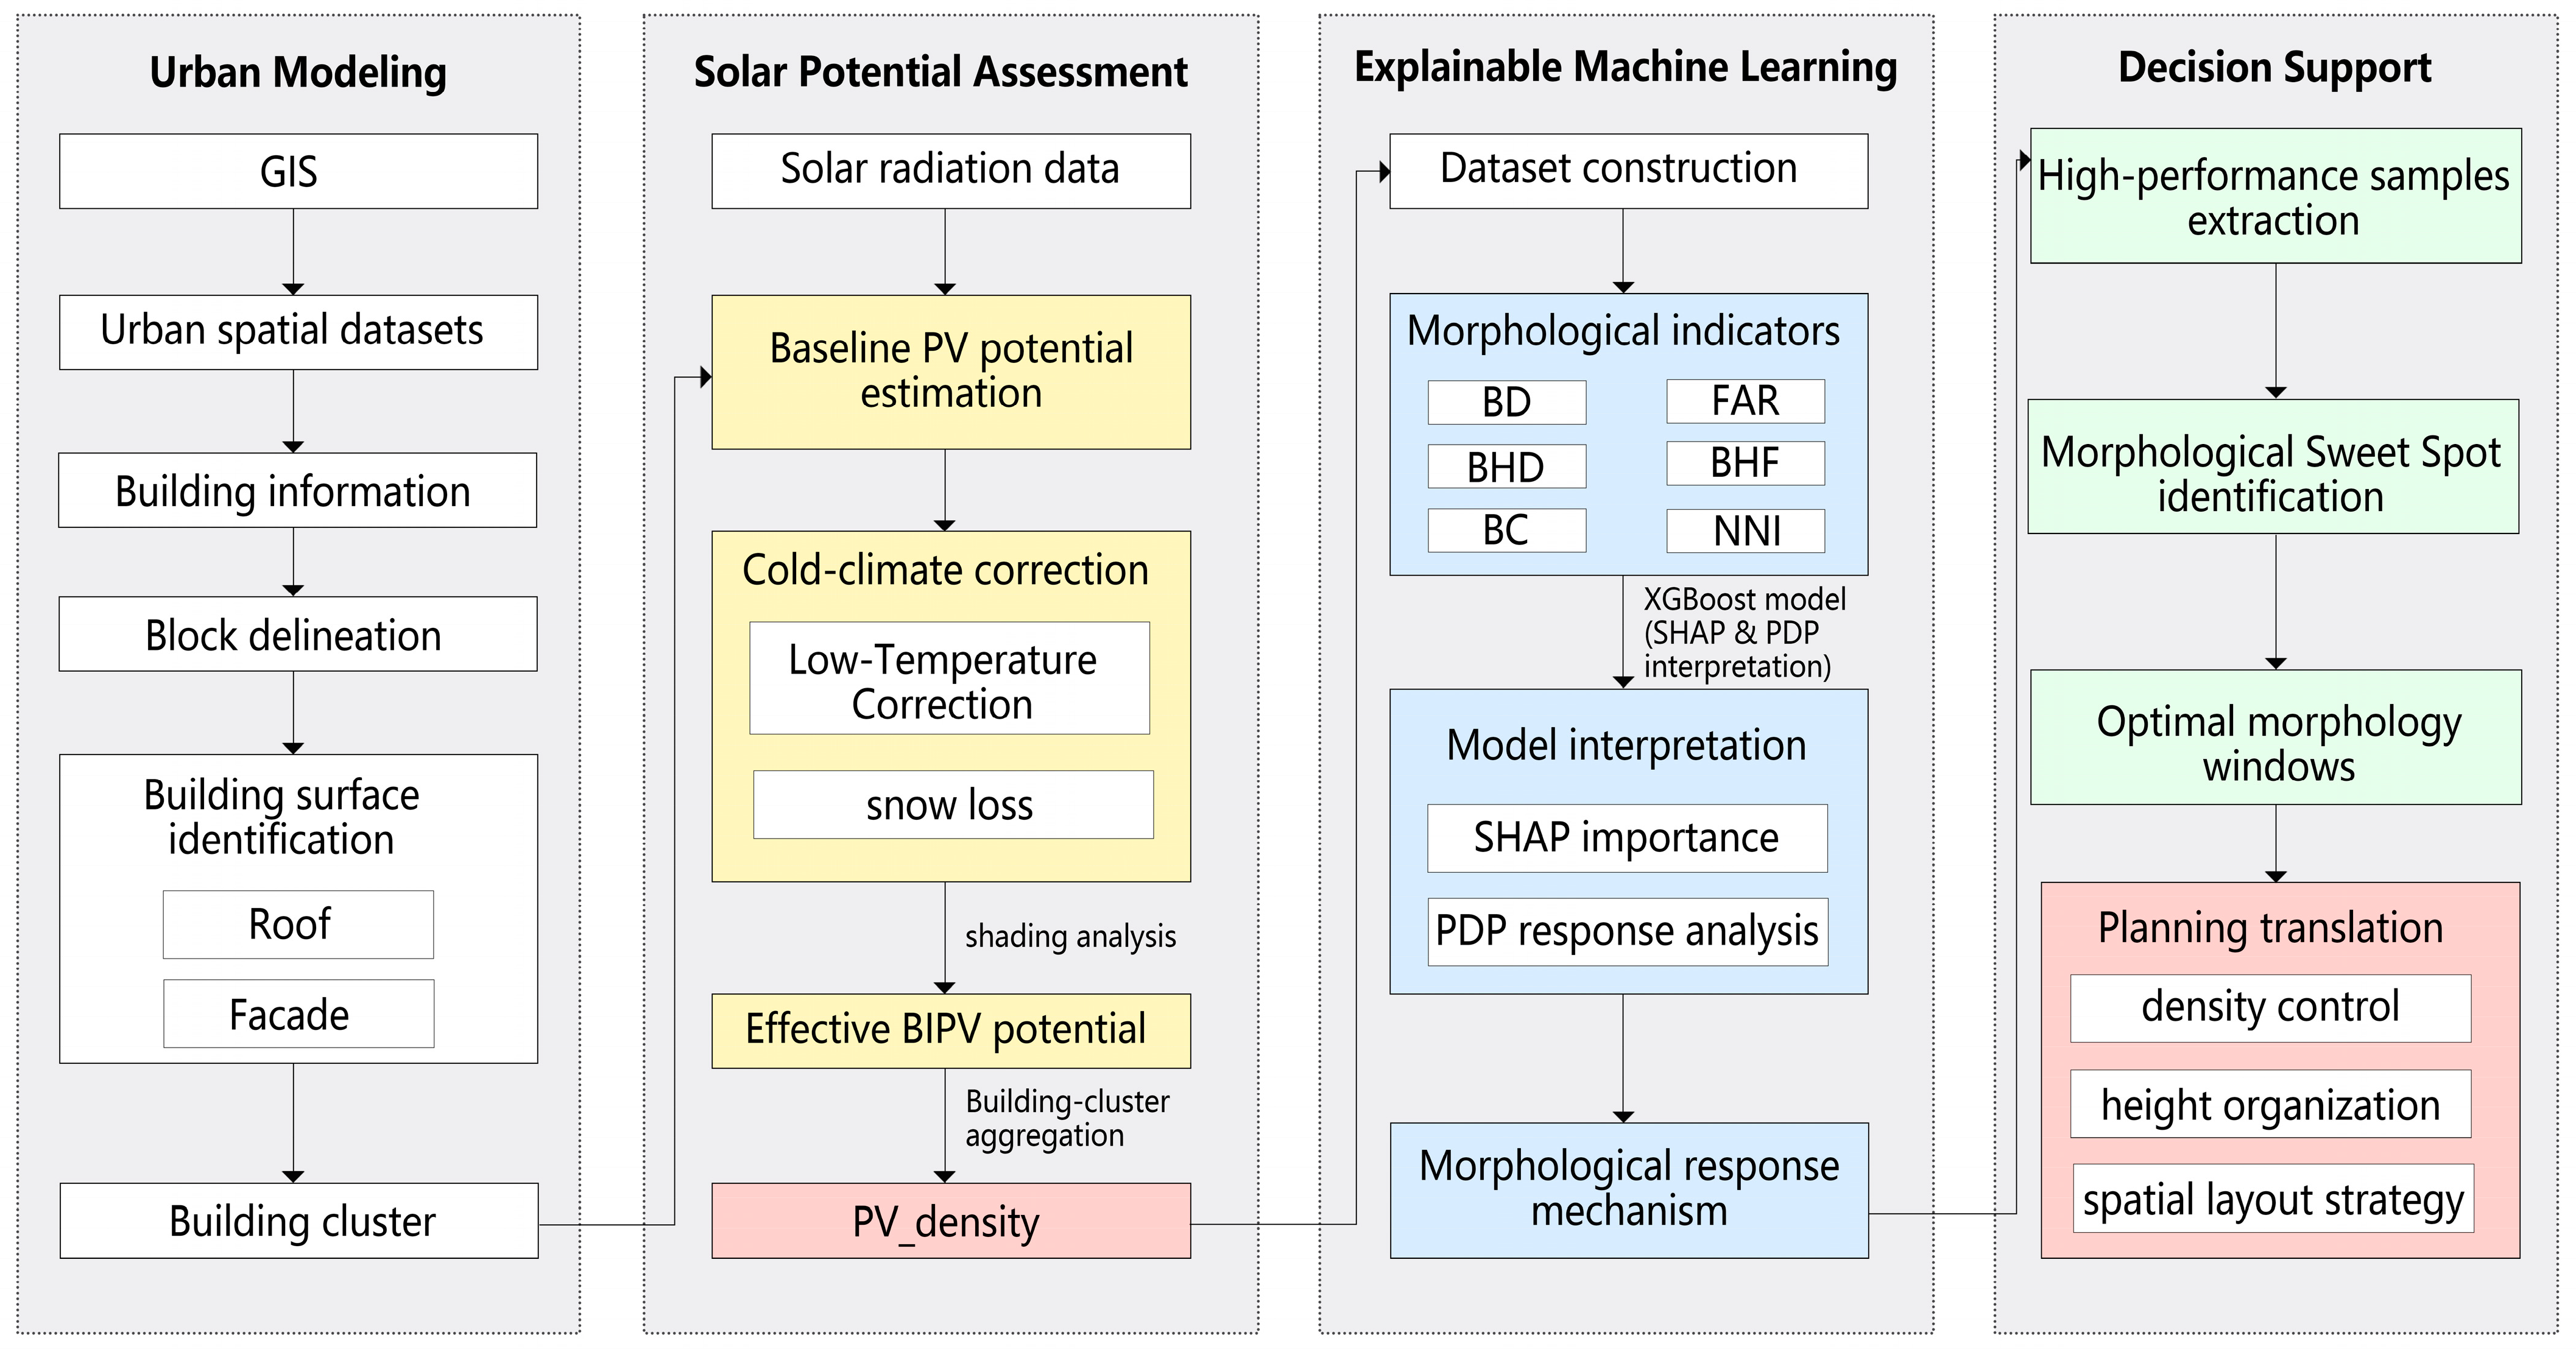
2.1. Study Area and Research Framework
2.2. Data Sources and Effective Photovoltaic Potential Assessment
2.3. Morphological Indicators at the Building-Cluster Scale
2.4. Morphology–Photovoltaic Relationship Modeling and Validation
2.5. Interpretable Analysis and Planning Translation Framework
3. Results
3.1. Descriptive Statistics and Model Validation
3.1.1. Descriptive Statistical Characteristics of Variables
3.1.2. Pearson Correlation and Multicollinearity Diagnosis
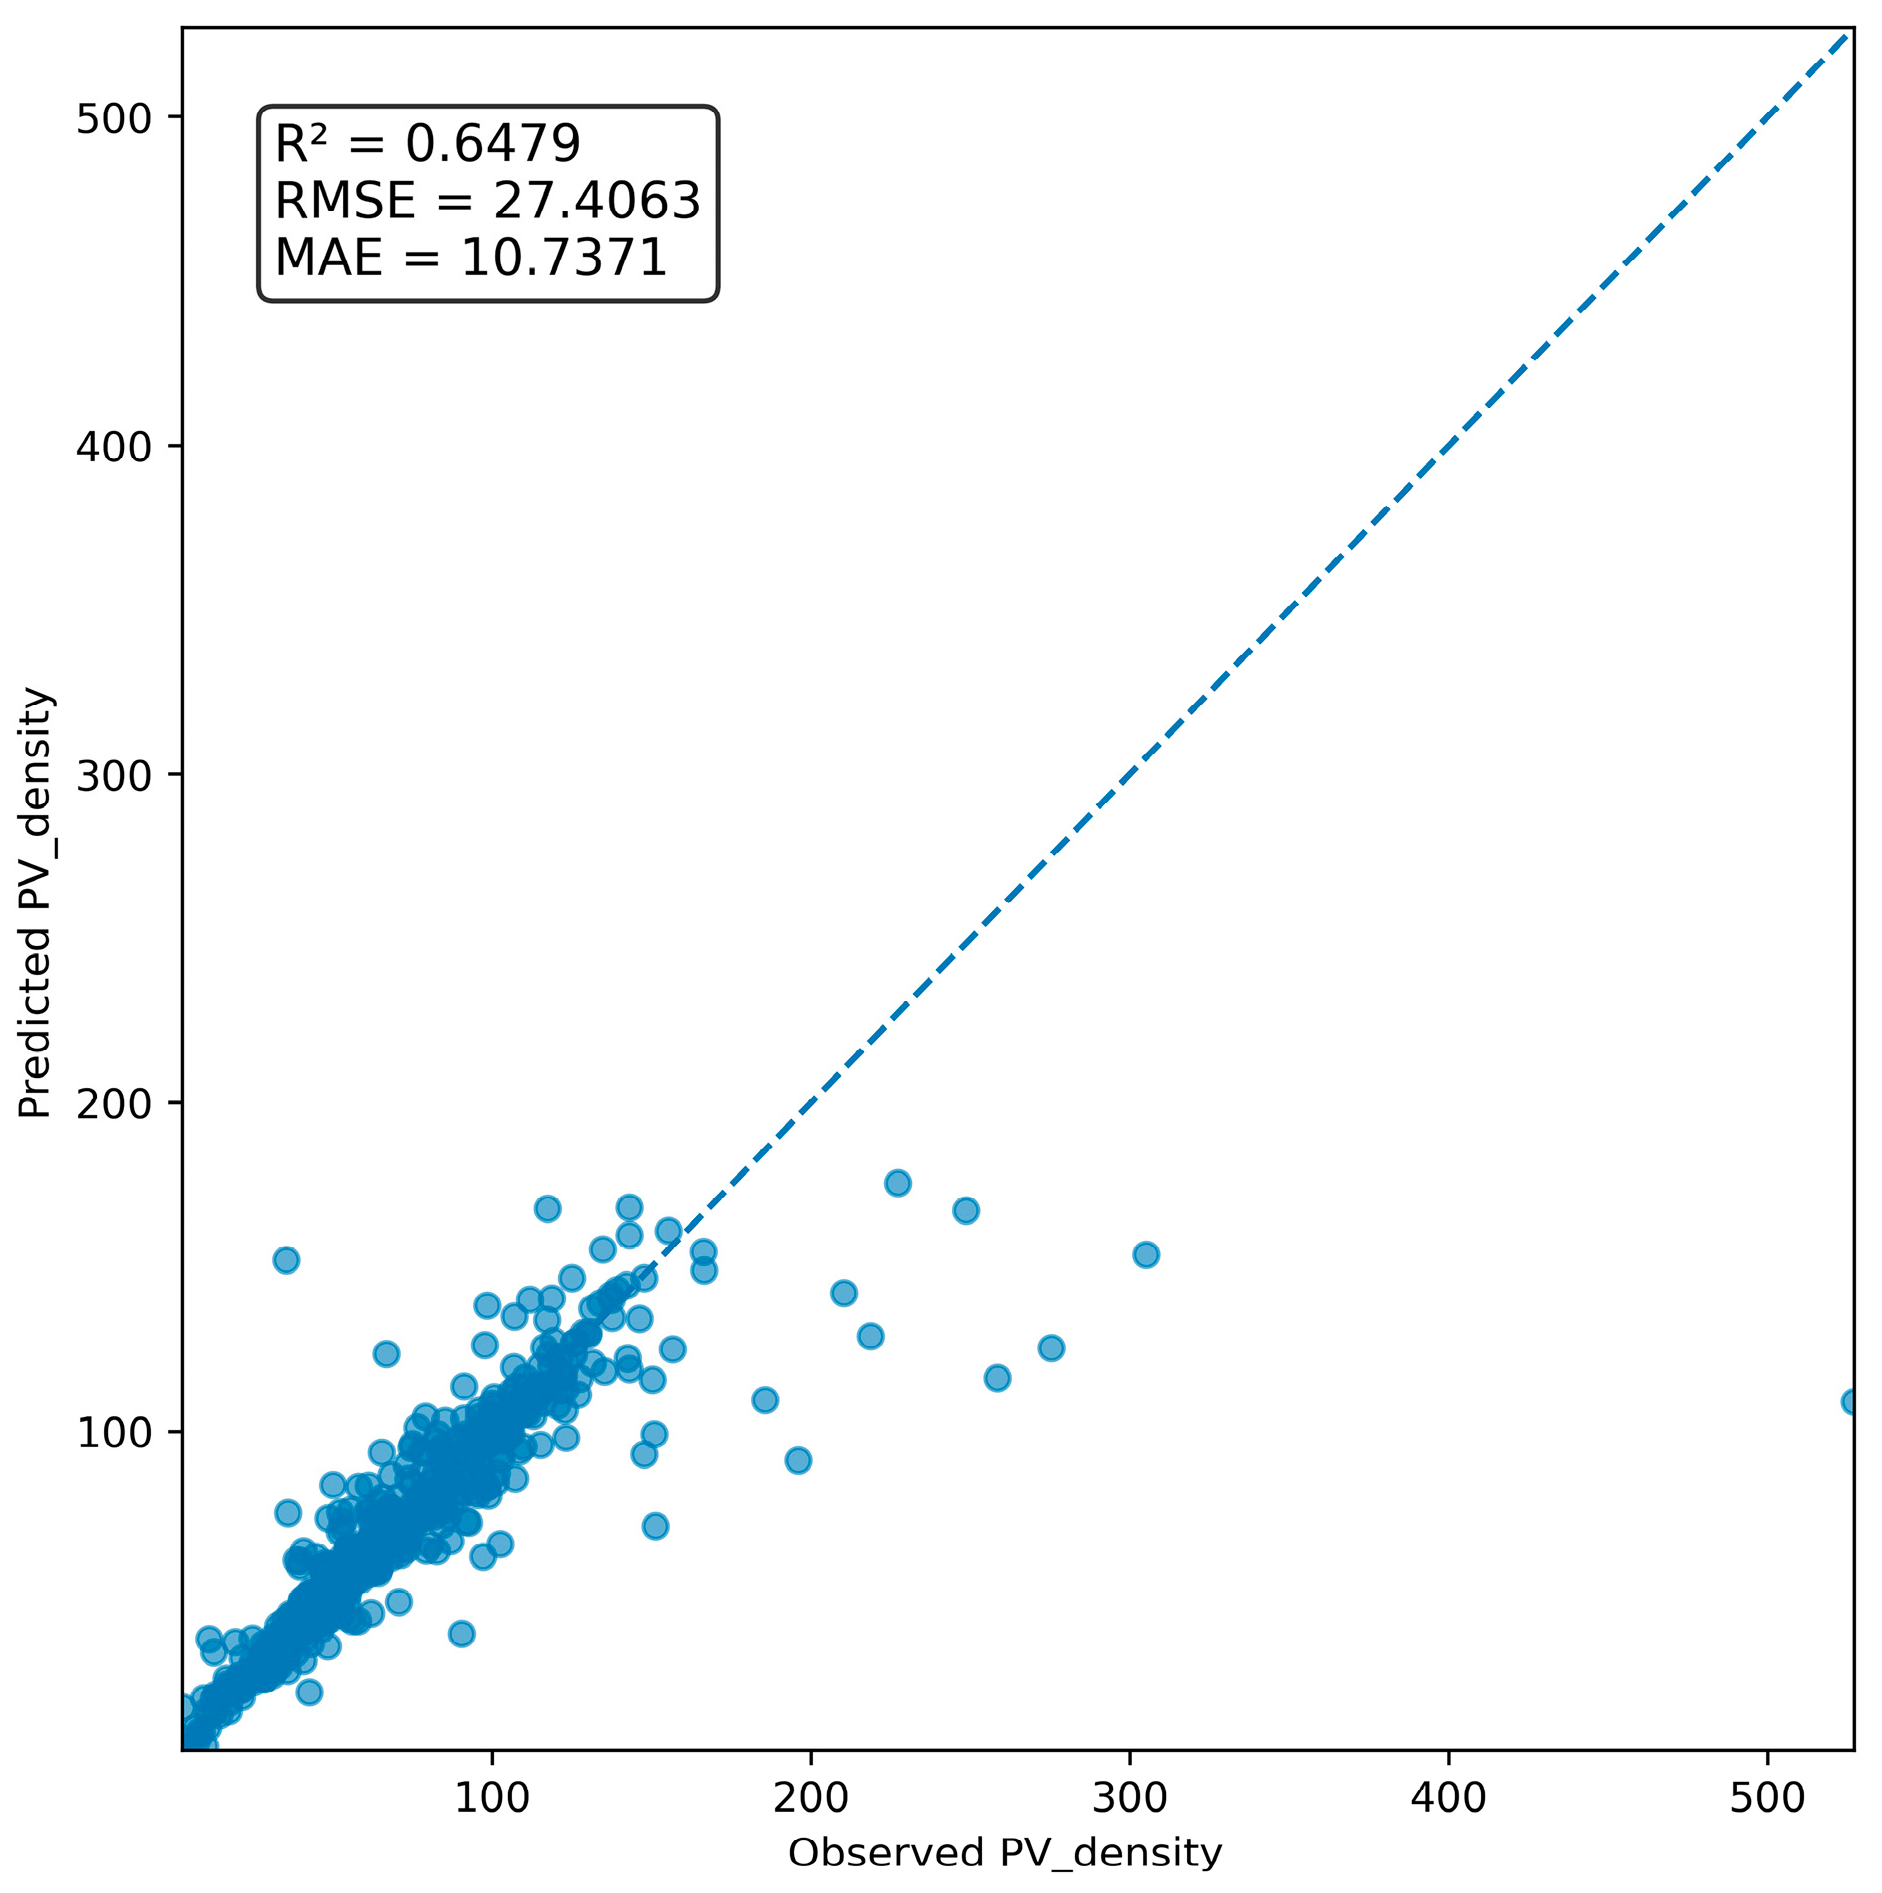
3.1.3. Baseline Model Comparison and Cross-Validation Results
3.1.4. Sensitivity and Uncertainty Analysis
3.2. Spatial Pattern of Effective PV Potential and PV Composition
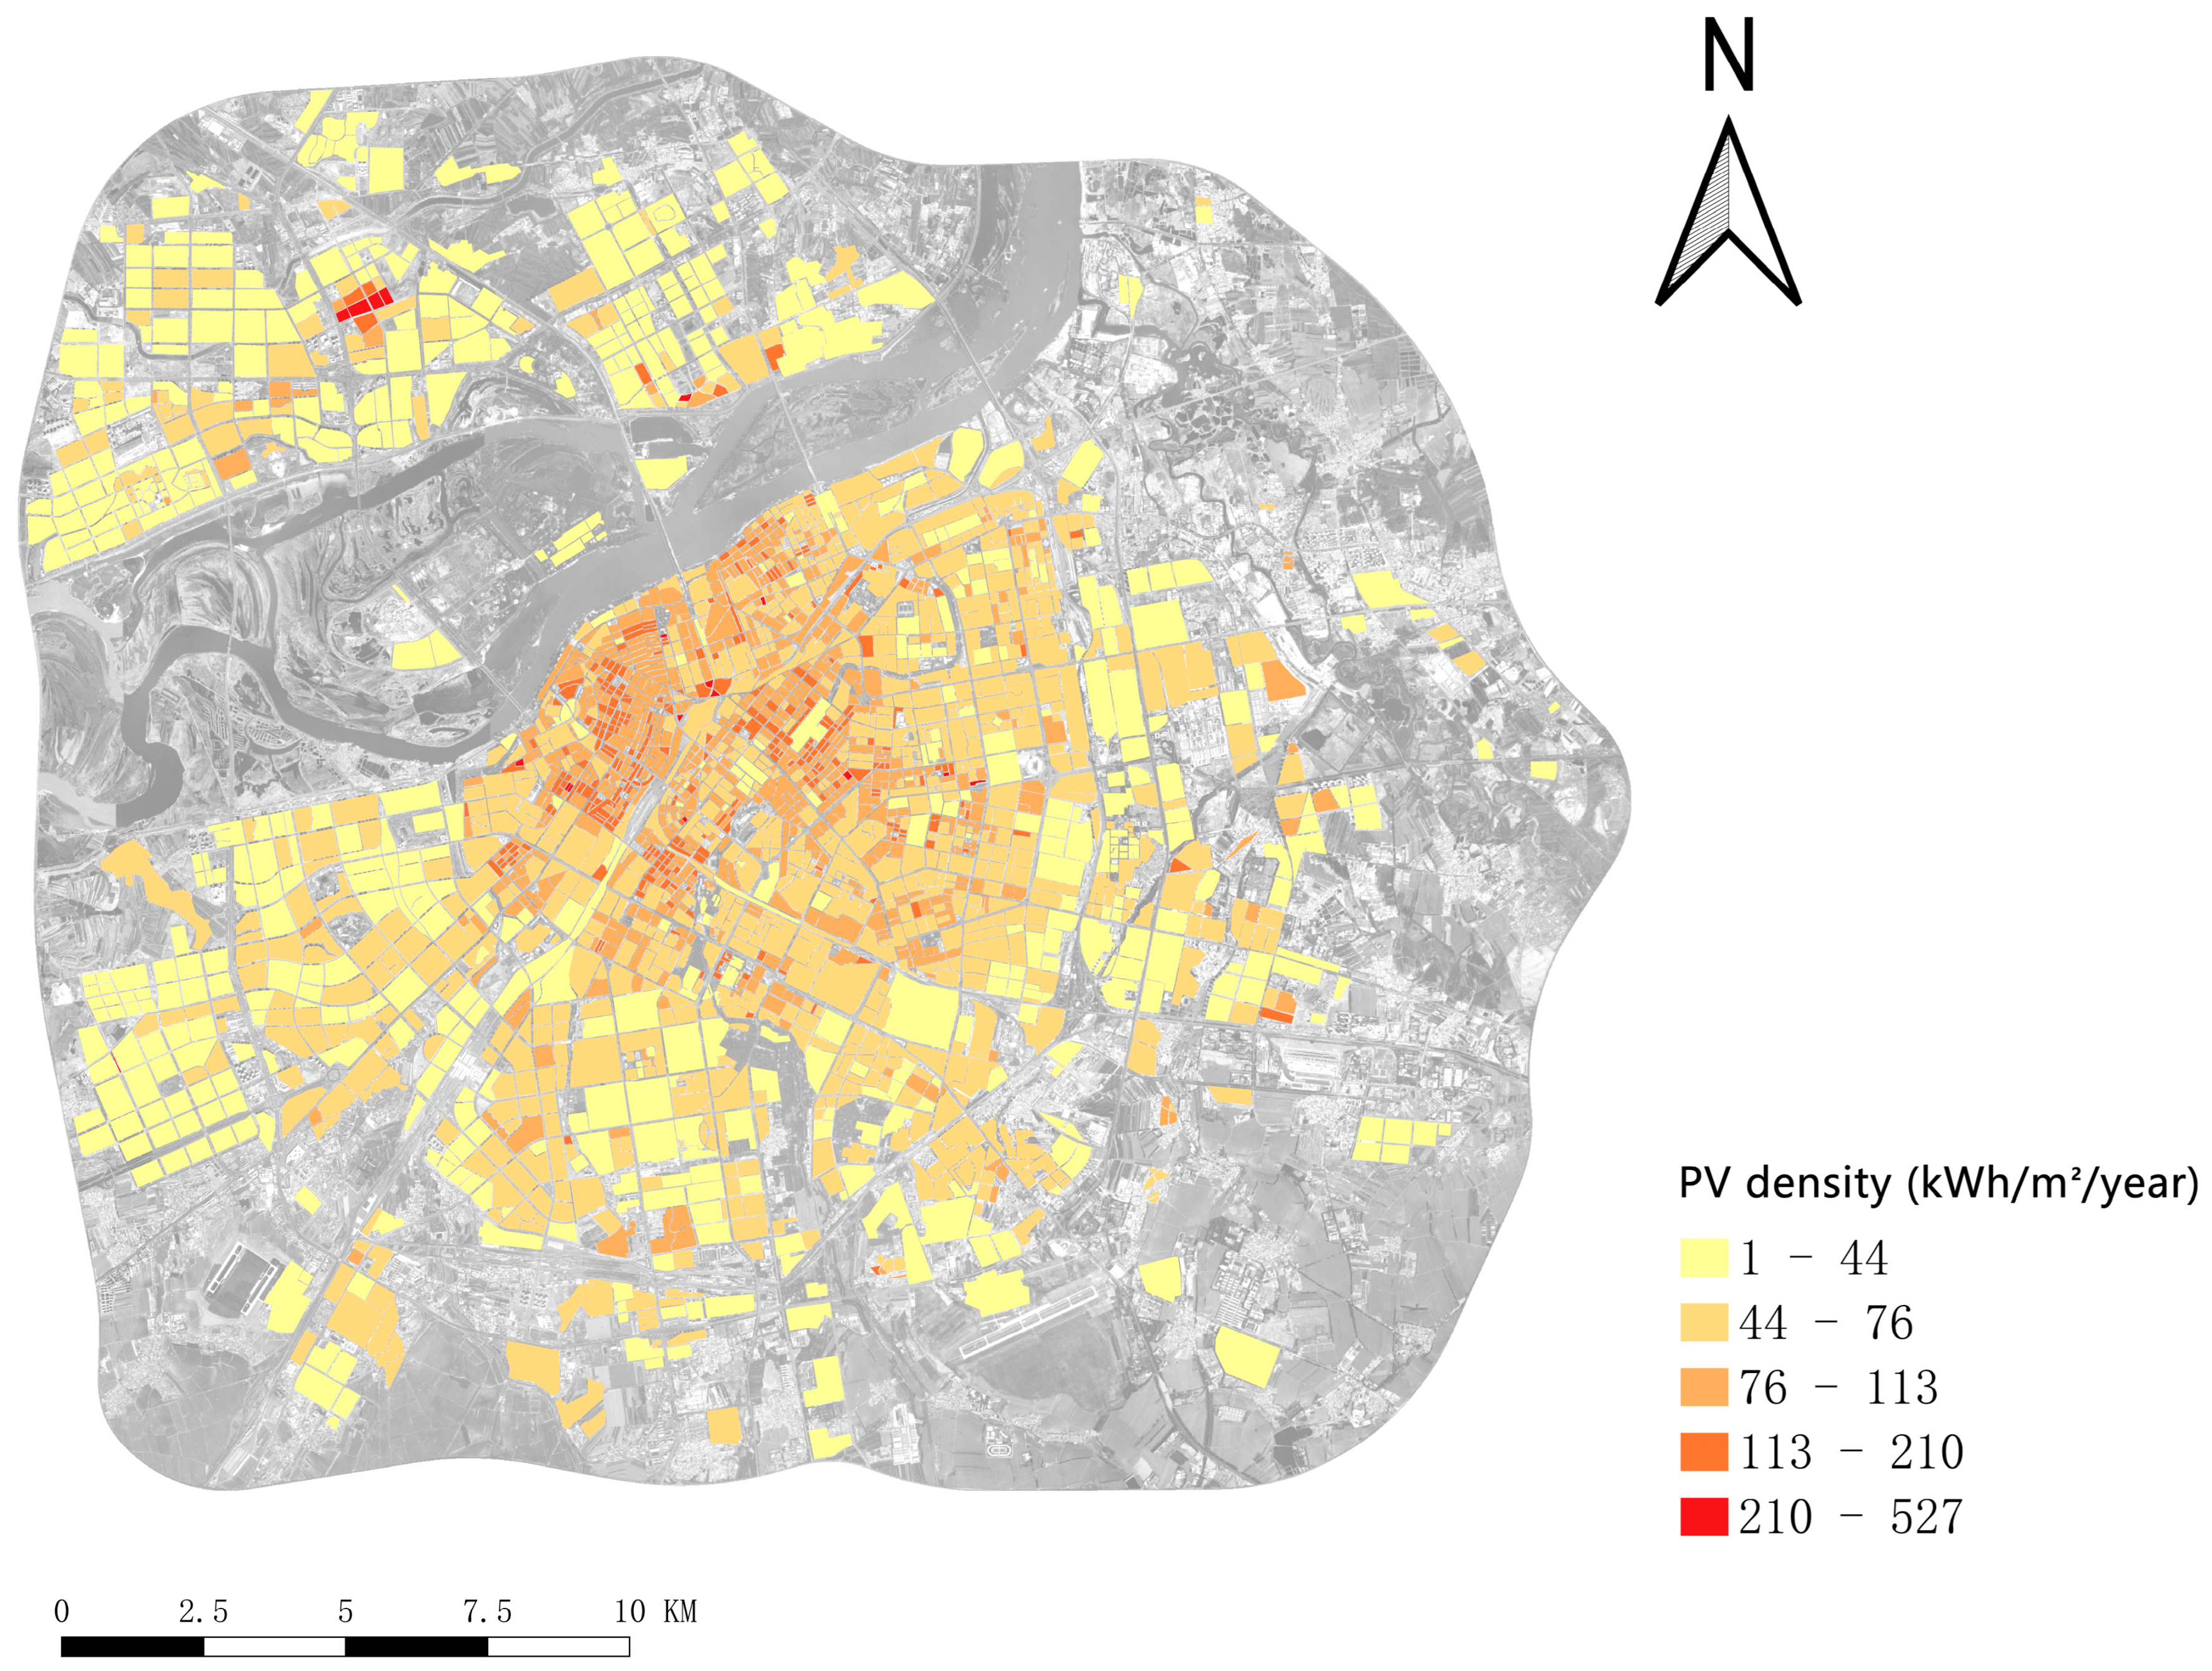
3.2.1. Spatial Distribution of Effective PV Potential
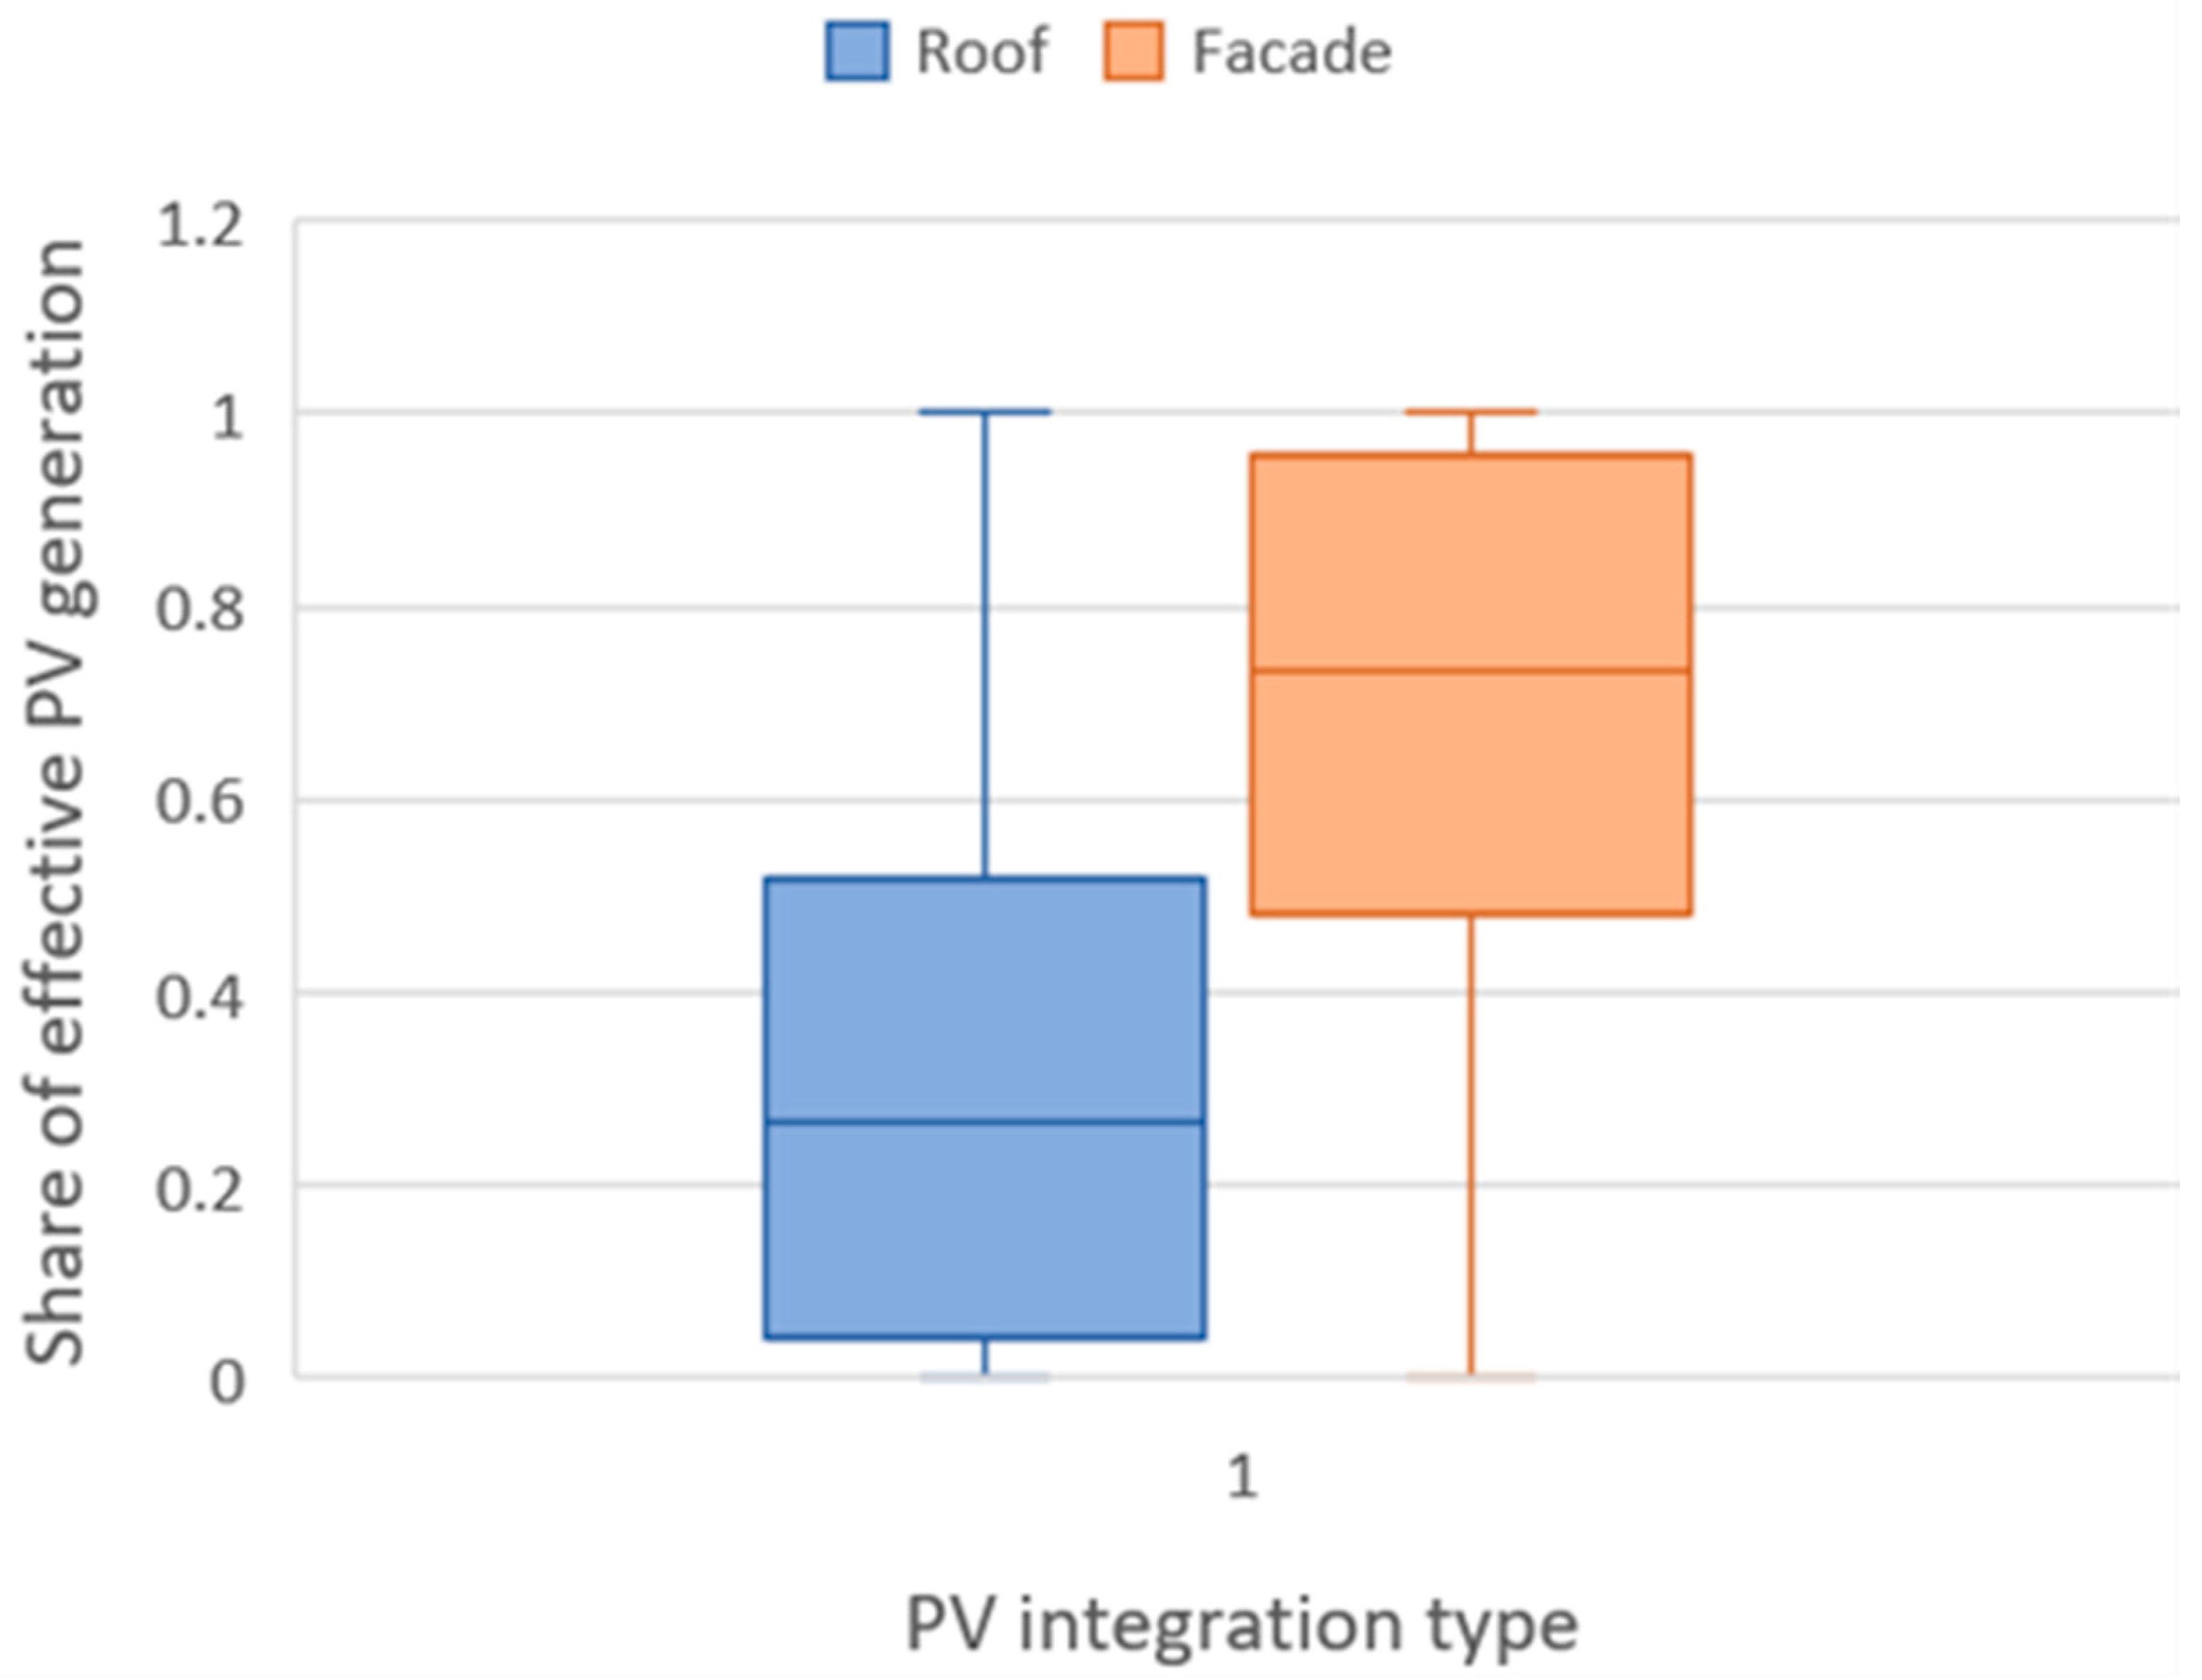
3.2.2. Relative Contributions of Rooftop and Facade PV
3.3. Effects of Building-Cluster Morphology on Effective PV Potential
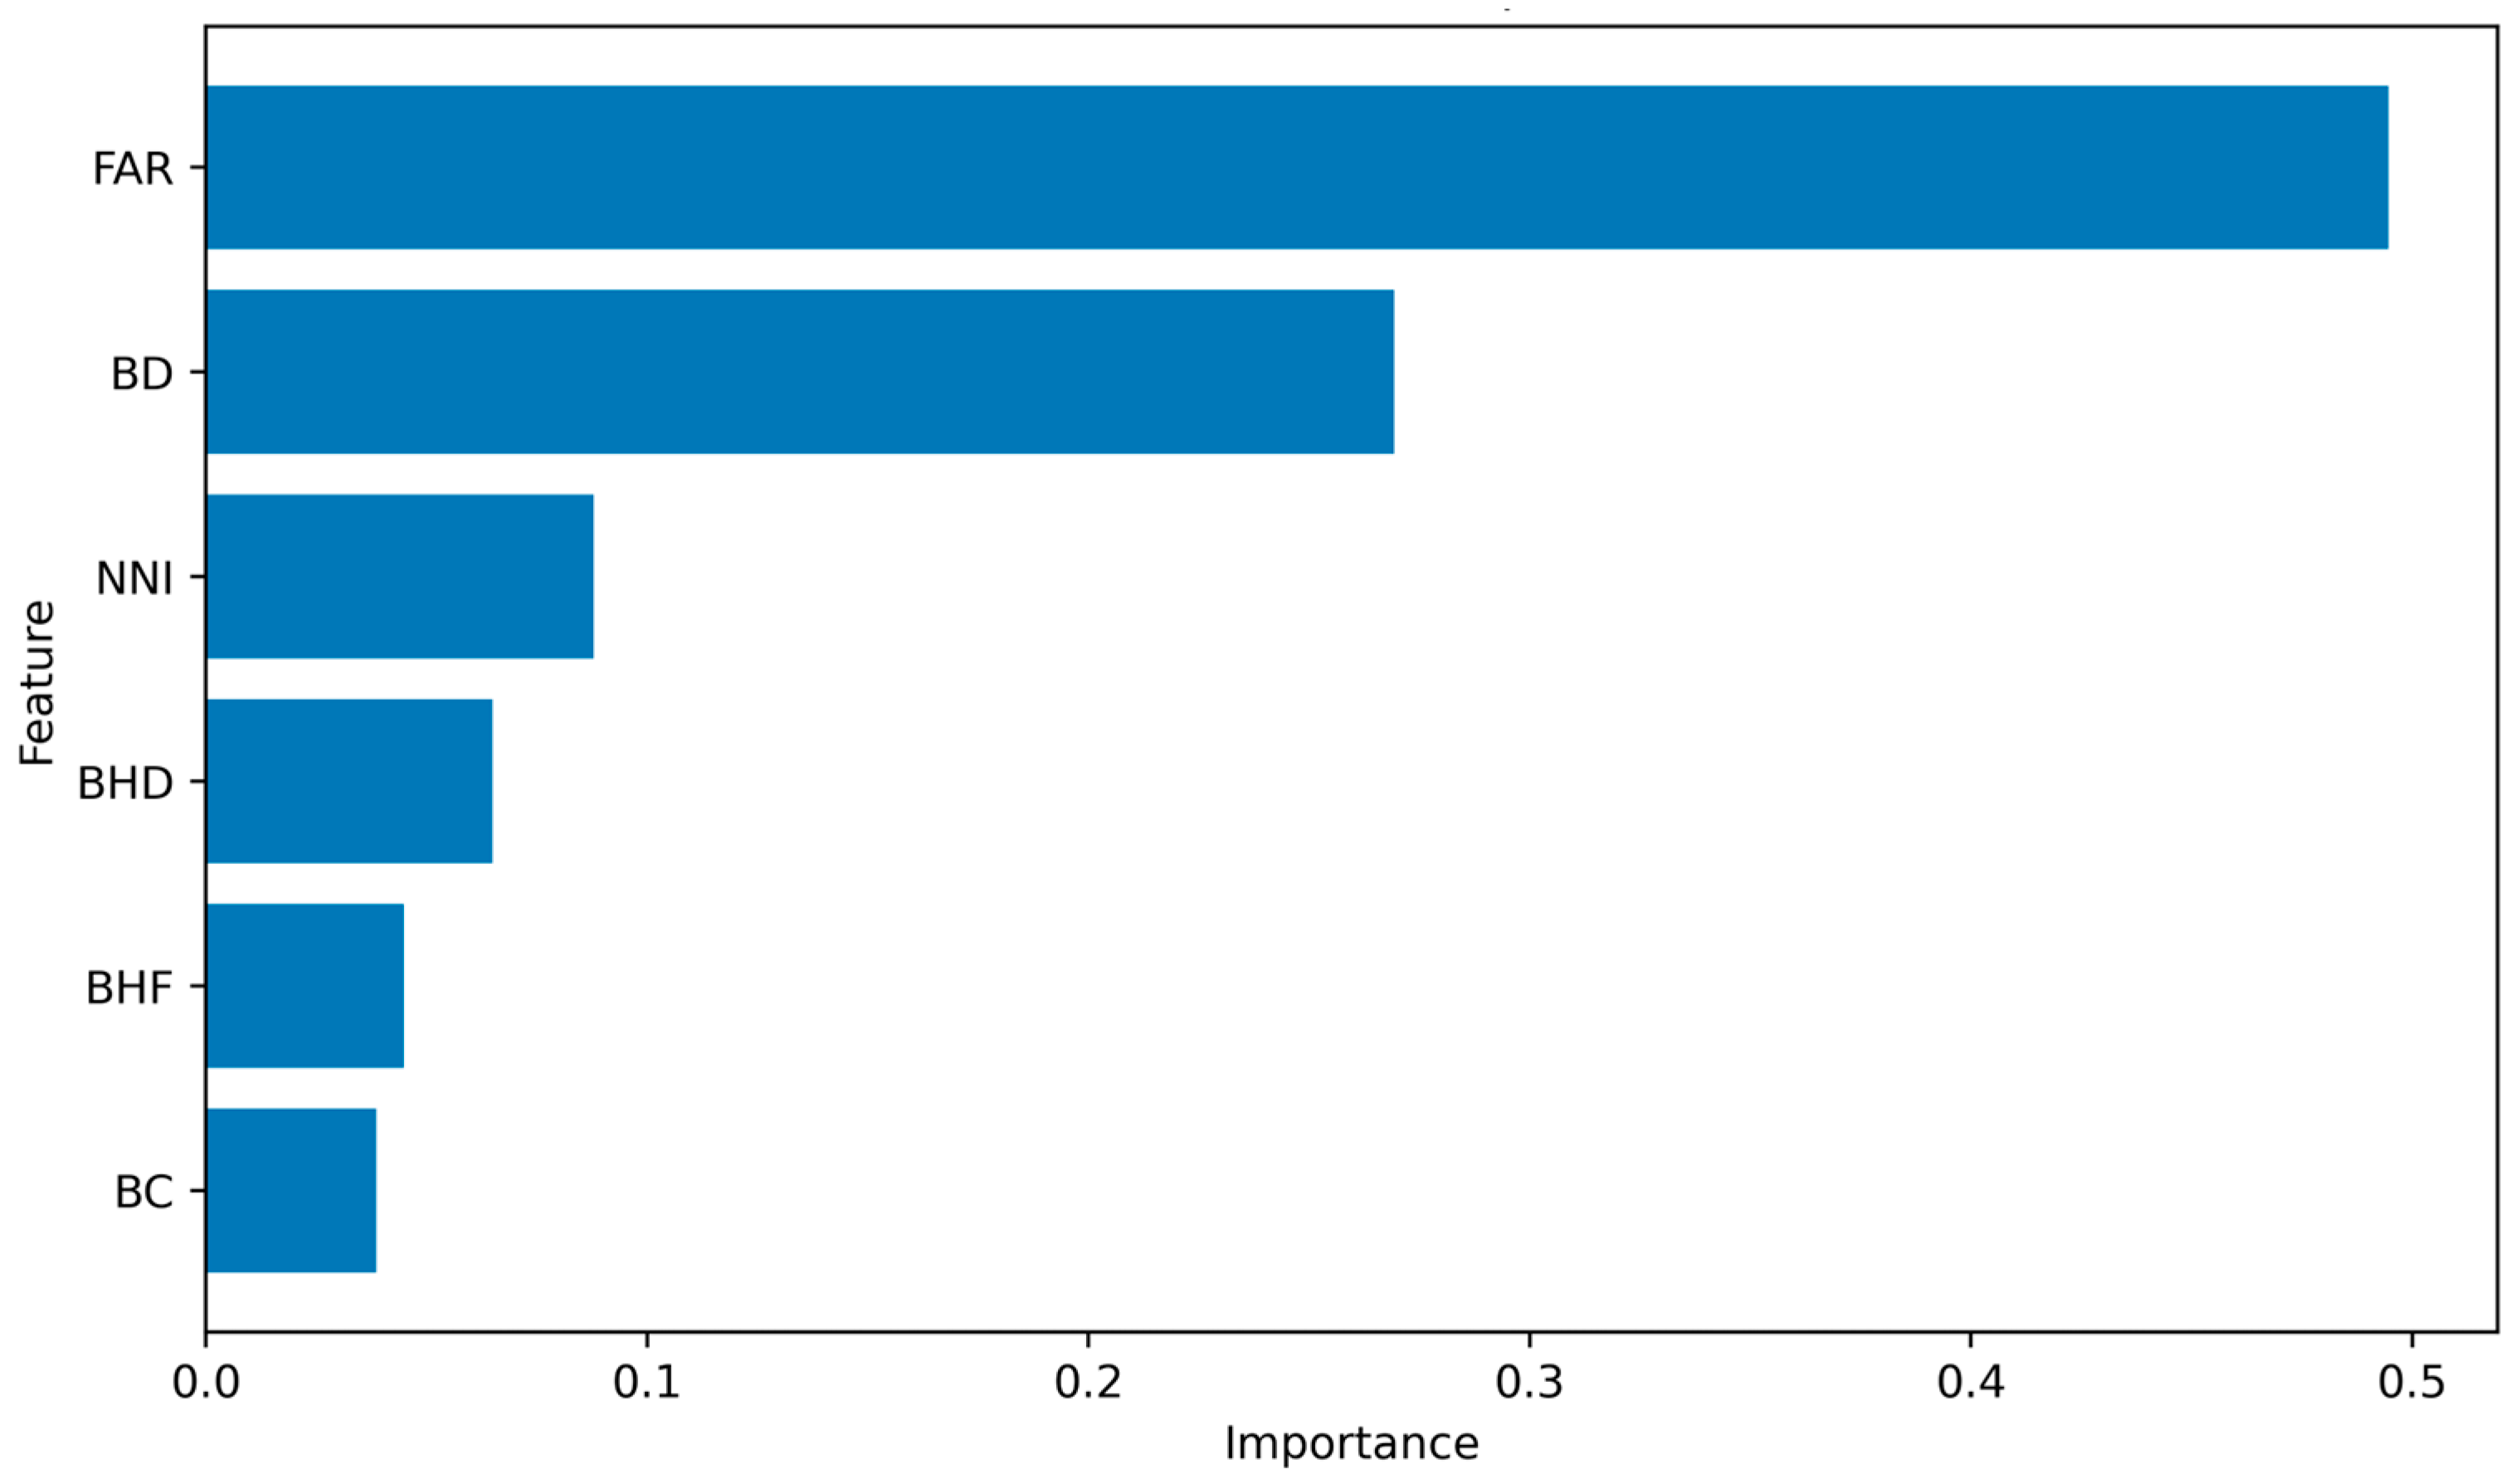
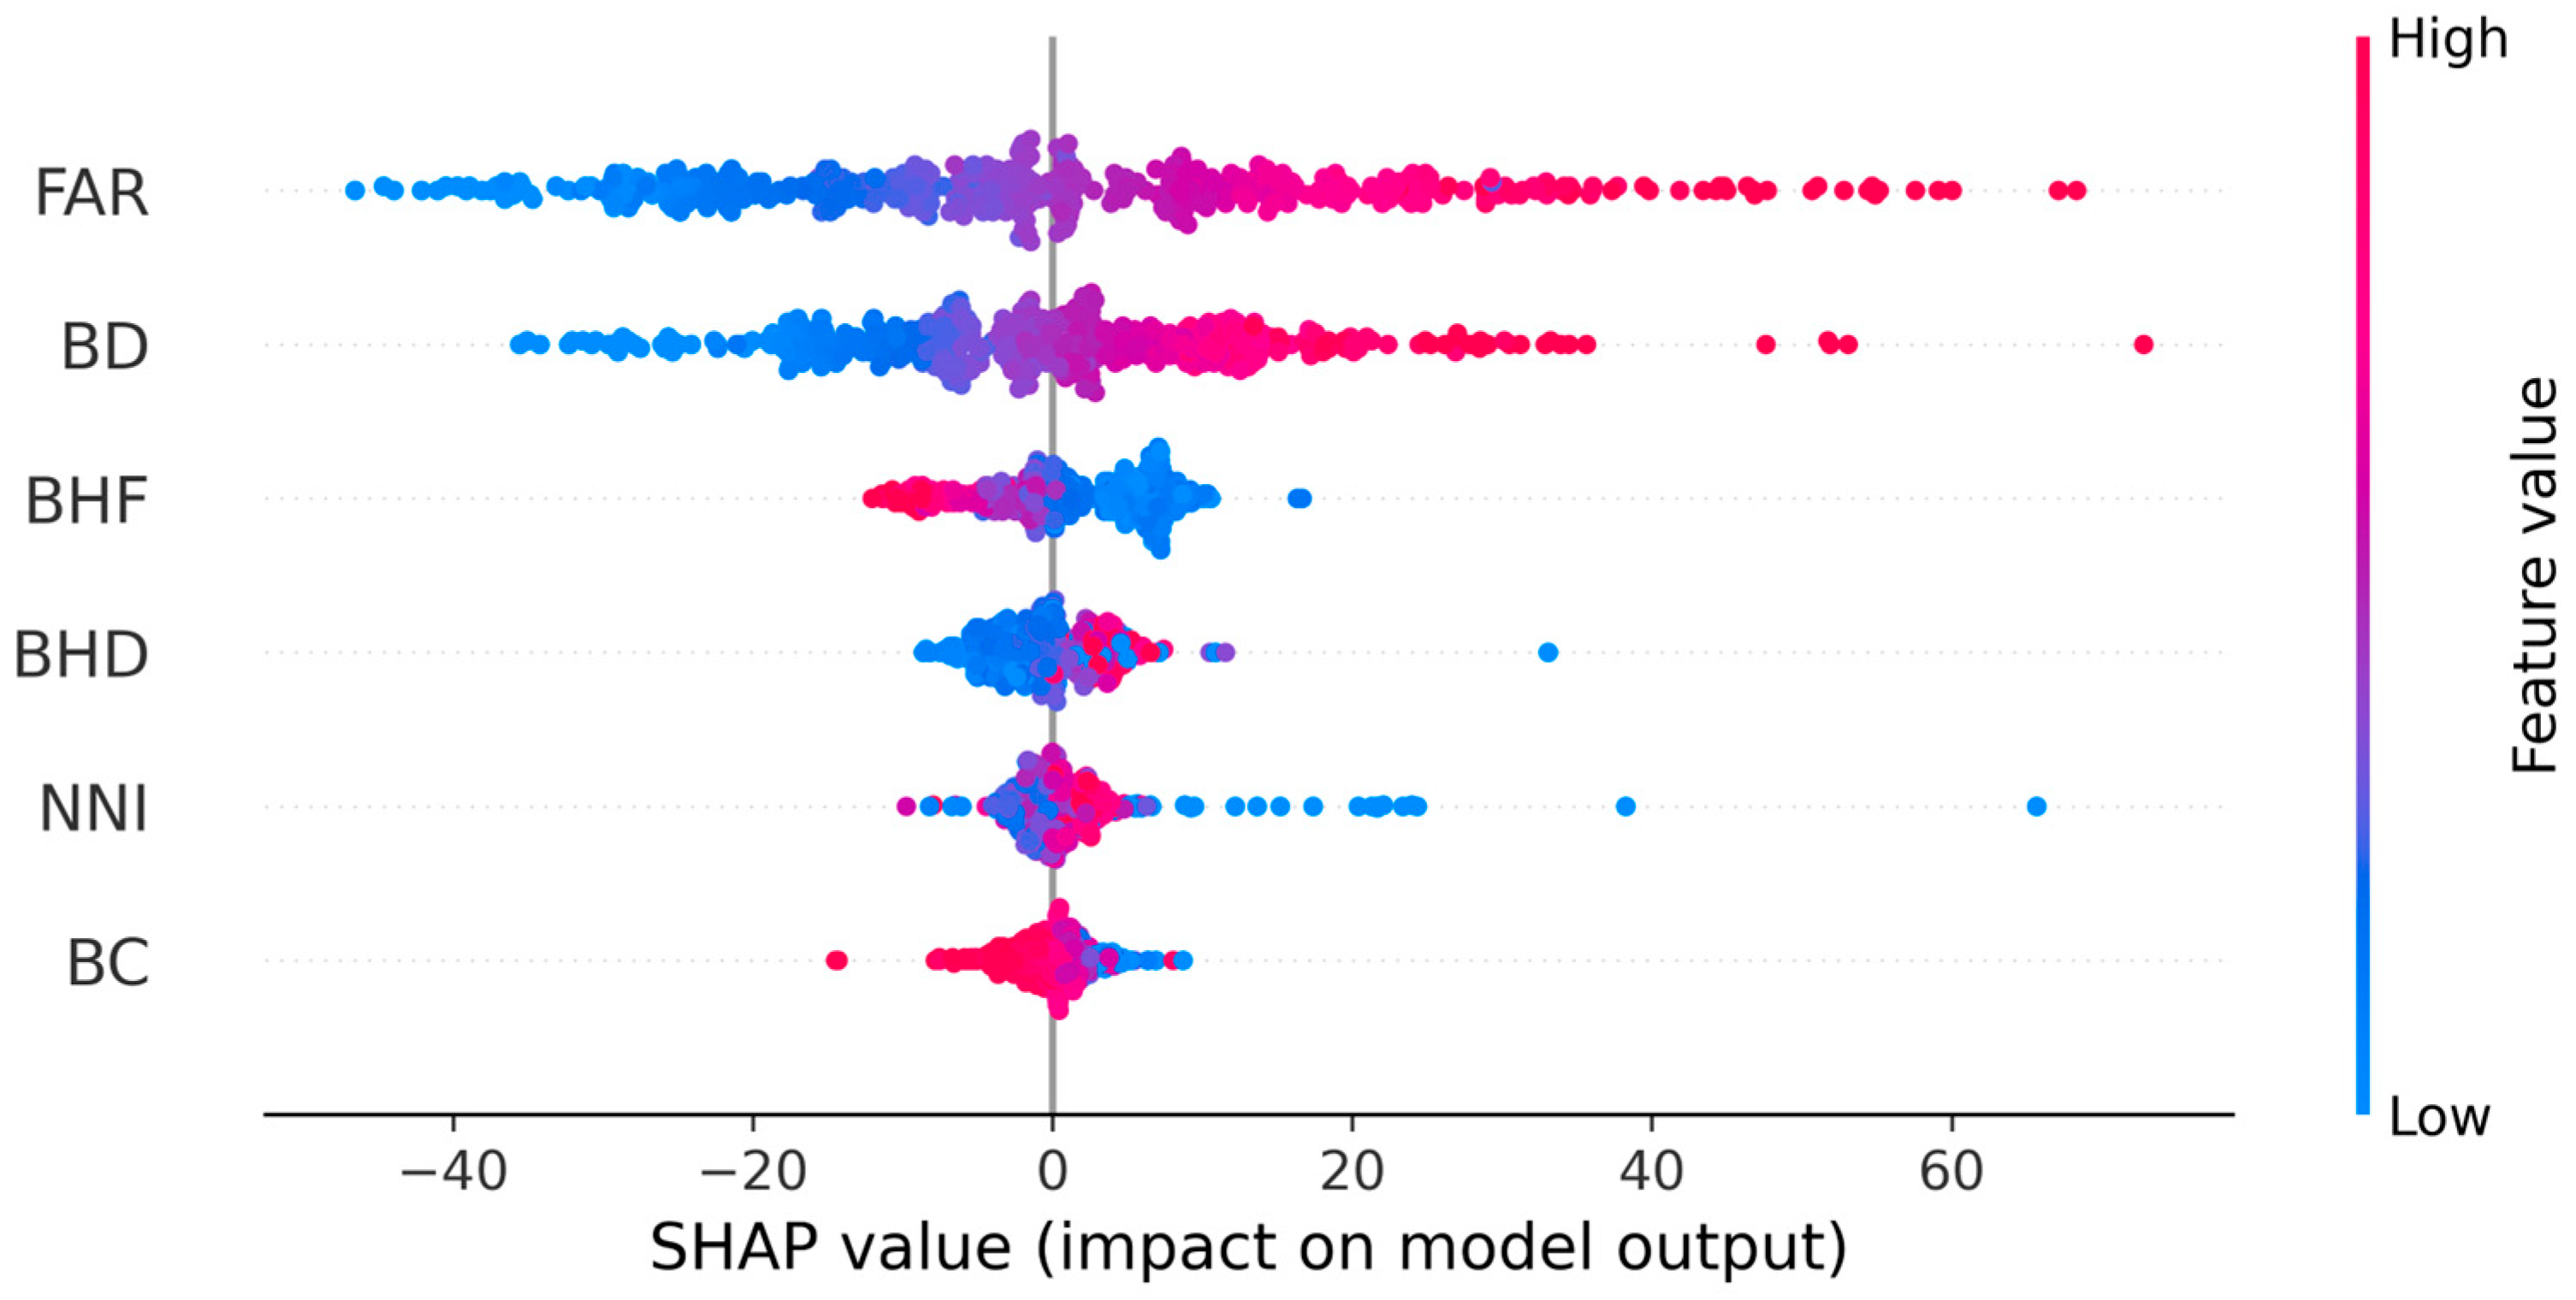
3.3.1. Identification of Key Morphological Factors
3.3.2. Single-Variable Response Characteristics
3.3.3. Coupled Morphological Effects and High-Value Response Ranges
3.4. Morphological Sweet Spot and Building-Cluster Typology
3.4.1. Identification of the Morphological Sweet Spot
3.4.2. Typology Construction and Spatial Expression
4. Discussion
4.1. Main Findings and Interpretation of Results
4.2. Comparison with Previous Studies and the Contributions of This Study
4.3. Method Reliability, Applicability, and Limitations
4.4. Planning Implications
5. Conclusions
Author Contributions
Funding
Institutional Review Board Statement
Informed Consent Statement
Data Availability Statement
Conflicts of Interest
References
- UNEP; GlobalABC. Global Status Report for Buildings and Construction 2023: Not Yet at Zero; UNEP: Nairobi, Kenya, 2023. [Google Scholar]
- GlobalABC; UNEP. Global Status Report for Buildings and Construction 2022; UNEP: Nairobi, Kenya, 2022; Available online: https://globalabc.org/resources/publications/2022-global-status-report-buildings-and-construction (accessed on 9 March 2026).
- International Energy Agency (IEA). Buildings Sector—Energy System; International Energy Agency (IEA): Paris, France; Available online: https://www.iea.org/energy-system/buildings (accessed on 9 March 2026).
- National Development and Reform Commission (NDRC). Action Plan for Carbon Dioxide Peaking Before 2030; NDRC: Beijing, China, 2021. Available online: https://en.ndrc.gov.cn/policies/202110/t20211027_1301020.html (accessed on 9 March 2026).
- State Council of the People’s Republic of China. Working Guidance for Carbon Dioxide Peaking and Carbon Neutrality in Full and Faithful Implementation of the New Development Philosophy; State Council: Beijing, China, 2021. Available online: https://english.www.gov.cn/policies/latestreleases/202110/24/content_WS6174d1c1c6d0df57f98e3c2f.html (accessed on 9 March 2026).
- Intergovernmental Panel on Climate Change (IPCC). Climate Change 2022: Mitigation of Climate Change. Contribution of Working Group III to the Sixth Assessment Report of the IPCC; Shukla, P.R., Skea, J., Slade, R., Al Khourdajie, A., van Diemen, R., Eds.; Cambridge University Press: Cambridge, UK; New York, NY, USA, 2022. [Google Scholar] [CrossRef] [Scilit]
- Martín-Chivelet, N.; Kapsis, K.; Wilson, H.R.; Delisle, V.; Yang, R.; Olivieri, L.; Polo, J.; Eisenlohr, J.; Roy, B.; Maturi, L.; et al. Building-integrated photovoltaic (BIPV) products and systems: A review of energy-related behavior. Energy Build. 2022, 262, 111998. [Google Scholar] [CrossRef] [Scilit]
- Bonomo, P.; Frontini, F.; Loonen, R.; Reinders, A.H.M.E. Comprehensive review and state of play in the use of photovoltaics in buildings. Energy Build. 2024, 323, 114737. [Google Scholar] [CrossRef] [Scilit]
- Pillai, D.S.; Shabunko, V.; Krishna, A. A comprehensive review on building integrated photovoltaic systems. Renew. Sustain. Energy Rev. 2022, 156, 111946. [Google Scholar] [CrossRef] [Scilit]
- Long, Y.; Xu, X.; Huo, Z. Urban rooftop photovoltaic potential model: A study on assessment methods and model framework. Energy Build. 2025, 345, 116138. [Google Scholar] [CrossRef] [Scilit]
- Liu, J.; Wu, Q.; Lin, Z.; Shi, H.; Wen, S.; Wu, Q.; Zhang, J.; Peng, C. A novel approach for assessing rooftop-and-facade solar photovoltaic potential in rural areas using three-dimensional (3D) building models constructed with GIS. Energy 2023, 282, 128920. [Google Scholar] [CrossRef] [Scilit]
- Yu, Q.; Dong, K.; Guo, Z.; Xu, J.; Li, J.; Tan, H.; Jin, Y.; Yuan, J.; Zhang, H.; Liu, J.; et al. Global estimation of building-integrated facade and rooftop photovoltaic potential. Nexus 2025, 2, 100060. [Google Scholar] [CrossRef] [Scilit]
- Liu, B.; Liu, Y.; Cho, S.; Chow, D.H.C. Urban morphology indicators and solar radiation acquisition: 2011–2022 review. Renew. Sustain. Energy Rev. 2024, 199, 114548. [Google Scholar] [CrossRef] [Scilit]
- Dervishi, S.; Merollari, J.; Dervishi, I. Assessing microclimate and solar potential in courtyard morphologies: A comparative study of European urban blocks. Urban Clim. 2025, 61, 102477. [Google Scholar] [CrossRef] [Scilit]
- Merollari, J.; Dervishi, S. Analyzing the impact of urban morphology on solar potential for photovoltaic panels: A comparative study across various European climates. Sustain. Cities Soc. 2024, 115, 105854. [Google Scholar] [CrossRef] [Scilit]
- Geng, X.; Xie, D.; Gou, Z. Optimizing urban block morphologies for net-zero energy cities: Exploring photovoltaic potential and urban design prototype. Build. Simul. 2024, 17, 607–624. [Google Scholar] [CrossRef] [Scilit]
- Hu, S.; Li, D.; Chang, Z.; Tong, H.; Gao, X.; Cao, Q. Impact of the 3-D structure on the photovoltaic potential in urban areas. Front. Energy Res. 2025, 13, 1534576. [Google Scholar] [CrossRef] [Scilit]
- Keddouda, A.; Ihaddadene, R.; Boukhari, A.; Atia, A.; Arıcı, M.; Lebbihiat, N.; Ihaddadene, N. Experimentally validated thermal modeling for temperature prediction of photovoltaic modules under variable environmental conditions. Renew. Energy 2024, 231, 120922. [Google Scholar] [CrossRef] [Scilit]
- Afonso, D.; Mesbahi, O.; Bouich, A.; Tlemçani, M. Influence of long-term and short-term solar radiation and temperature exposure on the material properties and performance of photovoltaic panels: A comprehensive review. Energies 2025, 18, 5072. [Google Scholar] [CrossRef] [Scilit]
- Williams, R.A.; Lizzadro-McPherson, D.J.; Pearce, J.M. The impact of snow losses on solar photovoltaic systems in North America in the future. Energy Adv. 2023, 2, 1634–1649. [Google Scholar] [CrossRef] [Scilit]
- Giostra, S.; Kamalia, A.; Masera, G. Solar Species: Energy optimization of urban form through an evolutionary design process. Sustainability 2024, 16, 9254. [Google Scholar] [CrossRef] [Scilit]
- Bai, B.; Li, T.; Wang, S.; Yan, H.; Dong, J. Optimizing urban block morphology for photovoltaic power and thermal comfort in hot and humid regions. Eng. Appl. Artif. Intell. 2025, 158, 111377. [Google Scholar] [CrossRef] [Scilit]
- Li, R.; Shari, Z.; Ab Kadir, M.Z.A. A review on multi-objective optimization of building performance: Insights from bibliometric analysis. Heliyon 2025, 11, e42480. [Google Scholar] [CrossRef] [Scilit]
- Darvishvand, L.; Kamkari, B.; Huang, M.J.; Hewitt, N.J. A systematic review of explainable artificial intelligence in urban building energy modeling: Methods, applications, and future directions. Sustain. Cities Soc. 2025, 128, 106492. [Google Scholar] [CrossRef] [Scilit]
- Gu, J.; Dogan, T. Virtual Horizon Method: Fast shading calculations for UBEM using lidar data rasterization. In Proceedings of the Building Simulation 2025: 19th Conference of IBPSA, Brisbane, Australia, 24–27 August 2025; International Building Performance Simulation Association (IBPSA): Brisbane, Australia, 2025. [Google Scholar] [CrossRef] [Scilit]
- DB23/1270-2019; Design Standard for Energy Efficiency of Residential Buildings in Heilongjiang Province. Heilongjiang Provincial Department of Housing and Urban-Rural Development: Harbin, China, 2019.
- Fang, Y.; Liu, Z.; Jia, Y.; Ke, M.; Yang, R.; Cai, Y. Impact of urban block morphology on solar availability in severe cold high-density cities: A case study of residential blocks in Harbin. Land 2025, 14, 581. [Google Scholar] [CrossRef] [Scilit]
- Shen, T.; Wu, J.; Yuan, S.; Kong, F.; Liu, Y. Analysis of urban spatial morphology in Harbin: A study based on building characteristics and driving factors. Sustainability 2024, 16, 9072. [Google Scholar] [CrossRef] [Scilit]
- Borrebæk, P.-O.A.; Jelle, B.P.; Zhang, Z. Avoiding snow and ice accretion on building integrated photovoltaics—Challenges, strategies, and opportunities. Sol. Energy Mater. Sol. Cells 2020, 206, 110306. [Google Scholar] [CrossRef] [Scilit]
- Pawluk, R.E.; Chen, Y.; She, Y. Photovoltaic electricity generation loss due to snow—A literature review on influence factors, estimation, and mitigation. Renew. Sustain. Energy Rev. 2019, 107, 171–182. [Google Scholar] [CrossRef] [Scilit]
- Ni, P.; Zheng, H.; Sun, H.; Lei, F.; Wang, Y.; Qin, J.; Wang, W.; Song, J.; Yue, Y.; Yao, S.; et al. Building integrated photovoltaics that move beyond rooftops. Cell Rep. Phys. Sci. 2025, 6, 102725. [Google Scholar] [CrossRef] [Scilit]
- Ghaleb, B.; Khan, M.I.; Asif, M. Application of PV on Commercial Building Facades: An Investigation into the Impact of Architectural and Structural Features. Sustainability 2024, 16, 9095. [Google Scholar] [CrossRef] [Scilit]
- Jin, S.; Zhang, H.; Huang, X.; Yan, J.; Yu, H.; Gao, N.; Jia, X.; Wang, Z. Solar Energy Utilization Potential in Urban Residential Blocks: A Case Study of Wuhan, China. Sustainability 2023, 15, 15988. [Google Scholar] [CrossRef] [Scilit]
- Li, G.; Chen, Y.; He, Q.; Wang, M.; Liu, H.; Xu, S. The comprehensive impact of urban morphology on the photovoltaic power generation potential of block-scale office buildings: Real blocks and design benchmarks. Sol. Energy 2025, 287, 113248. [Google Scholar] [CrossRef] [Scilit]
- Dahlioui, D.; Øgaard, M.B.; Imenes, A.G. Snow impact on PV performance: Assessing the zero-output challenge in cold areas. Renew. Sustain. Energy Rev. 2025, 213, 115468. [Google Scholar] [CrossRef] [Scilit]
- Liu, J.; Peng, C.; Zhang, J. Understanding the relationship between rural morphology and photovoltaic (PV) potential in traditional and non-traditional building clusters using shapley additive exPlanations (SHAP) values. Appl. Energy 2025, 380, 125091. [Google Scholar] [CrossRef] [Scilit]
- Castrejon-Esparza, N.M.; González-Trevizo, M.E.; Martínez-Torres, K.E.; Santamouris, M. Optimizing urban morphology: Evolutionary design and multi-objective optimization of thermal comfort and energy performance-based city forms for microclimate adaptation. Energy Build. 2025, 342, 115750. [Google Scholar] [CrossRef] [Scilit]
- Wang, M.; Jia, Z.; Xiang, C. Multi-objective optimization design of high-rise high-density urban morphology and their multidimensional assessment of PV capacity. Sustain. Cities Soc. 2025, 130, 106601. [Google Scholar] [CrossRef] [Scilit]
- Tang, H.; Chai, X.; Chen, J.; Wan, Y.; Wang, Y.; Wan, W.; Li, C. Assessment of BIPV power generation potential at the city scale based on local climate zones: Combining physical simulation, machine learning and 3D building models. Renew. Energy 2025, 244, 122688. [Google Scholar] [CrossRef] [Scilit]
- Zheng, J.; Ma, Y.; Zhang, W.; Jiao, Y.; Du, T.; Han, J.; Zhang, Y. Evidence-Based Optimization of Urban Block Morphology for Enhanced Photovoltaic Potential. Energies 2025, 18, 4946. [Google Scholar] [CrossRef] [Scilit]
- Li, G.; Wang, Z.; Xu, C.; Li, T.; Gao, J.; Mao, Q.; Chen, S. A district-scale spatial distribution evaluation method of rooftop solar energy potential based on deep learning. Sol. Energy 2024, 268, 112282. [Google Scholar] [CrossRef] [Scilit]
- Chen, Z.; Yang, B.; Zhu, R.; Dong, Z. City-scale solar PV potential estimation on 3D buildings using multi-source RS data: A case study in Wuhan, China. Appl. Energy 2024, 359, 122720. [Google Scholar] [CrossRef] [Scilit]
- Ruan, T.; Wang, F.; Topel, M.; Laumert, B.; Wang, W. A new optimal PV installation angle model in high-latitude cold regions based on historical weather big data. Appl. Energy 2024, 359, 122690. [Google Scholar] [CrossRef] [Scilit]



| Indicator | Formula | Meaning | Unit | Tool |
|---|---|---|---|---|
| BD | Building footprint area ratio within the block | _ | QGIS | |
| FAR | Total floor area-to-block area ratio | _ | QGIS | |
| BHF | Building height fluctuation within the block | m | QGIS | |
| BHD | Standard deviation of building heights | m | QGIS | |
| BC | Building compactness index representing the geometric compactness of building footprints within the cluster | _ | QGIS | |
| NNI | Nearest neighbor index reflecting the spatial distribution pattern of buildings within the cluster | _ | QGIS |
| Parameter | Name in Code | Value | Description |
|---|---|---|---|
| Objective function | objective | reg:squarederror | Squared-error loss function for regression |
| Number of trees | n_estimators | 300 | Total number of boosted trees |
| Maximum tree depth | max_depth | 4 | Controls the complexity of each tree and helps prevent overfitting |
| Learning rate | learning_rate | 0.05 | Step size of each boosting iteration |
| Row subsampling ratio | subsample | 0.8 | Randomly samples 80% of training instances in each boosting round |
| Column subsampling ratio | colsample_bytree | 0.8 | Randomly samples 80% of features for each tree to improve generalization |
| L1 regularization term | reg_alpha | 0.0 | Controls weight penalization to reduce overfitting |
| L2 regularization term | reg_lambda | 1.0 | Controls L2 regularization to reduce overfitting |
| Random seed | random_state | 42 | Ensures reproducibility of data splitting and model training |
| Number of parallel threads | n_jobs | 4 | Number of CPU threads used for model training |
| Variable | N | Mean | Std. | Min. | Q1 | Median | Q3 | Max. |
|---|---|---|---|---|---|---|---|---|
| 2406 | 71.2877 | 40.4171 | 0.5830 | 44.5893 | 65.5385 | 92.4400 | 527.1710 | |
| BD | 2406 | 0.2885 | 0.1270 | 0.0030 | 0.2020 | 0.2760 | 0.3638 | 1.0850 |
| FAR | 2406 | 2.1878 | 1.2517 | 0.0080 | 1.3113 | 2.0435 | 2.9035 | 10.6660 |
| BHF | 2406 | 28.8345 | 24.4433 | 0.2280 | 12.3825 | 19.8775 | 38.5458 | 152.3370 |
| BHD | 2406 | 7.8441 | 6.2253 | 0.1610 | 3.9723 | 5.8345 | 9.6968 | 53.0610 |
| BC | 2406 | 0.6682 | 0.1320 | 0.0490 | 0.6110 | 0.7150 | 0.7670 | 0.9260 |
| NNI | 2406 | 1.3804 | 0.2847 | 0.1753 | 1.2314 | 1.3566 | 1.5058 | 3.8348 |
| Panel (A). Pearson Correlation Matrix | |||||||
| Variable | BD | FAR | BHF | BHD | BC | NNI | |
| 1.0000 | 0.8173 | 0.8084 | −0.1209 | −0.0067 | −0.0475 | 0.3132 | |
| BD | 0.8173 | 1.0000 | 0.7631 | −0.2621 | −0.2033 | −0.0264 | 0.3245 |
| FAR | 0.8084 | 0.7631 | 1.0000 | 0.0826 | 0.2201 | −0.0028 | 0.3590 |
| BHF | −0.1209 | −0.2621 | 0.0826 | 1.0000 | 0.9164 | −0.0315 | −0.1616 |
| BHD | −0.0067 | −0.2033 | 0.2201 | 0.9164 | 1.0000 | −0.0005 | −0.0650 |
| BC | −0.0475 | −0.0264 | −0.0028 | −0.0315 | −0.0005 | 1.0000 | −0.0717 |
| NNI | 0.3132 | 0.3245 | 0.3590 | −0.1616 | −0.0650 | −0.0717 | 1.0000 |
| Panel (B). VIF diagnostics | |||||||
| Variable | VIF | ||||||
| BD | 3.7298 | ||||||
| FAR | 4.1197 | ||||||
| BHF | 7.2285 | ||||||
| BHD | 8.4160 | ||||||
| BC | 1.0166 | ||||||
| NNI | 1.2175 | ||||||
| Model | R2 | RMSE | MAE |
|---|---|---|---|
| Multiple Linear Regression | 0.6695 | 26.5538 | 10.5938 |
| XGBoost | 0.6479 | 27.4063 | 10.7371 |
| Metric | Mean_CV | Std_CV |
|---|---|---|
| R2 | 0.7673 | 0.0829 |
| RMSE | 18.5235 | 4.7341 |
| MAE | 9.1223 | 0.9231 |
| Scenario | Mean Change vs. Base (%) | Median Change vs. Base (%) | ||
|---|---|---|---|---|
| Base | 71.5482 | 65.5923 | 0.0000 | 0.0000 |
| Orientation_low | 73.2878 | 67.2296 | 2.4314 | 2.4962 |
| Orientation_high | 69.8086 | 63.9867 | −2.4314 | −2.4478 |
| Shading_low | 74.9756 | 68.9780 | 4.7903 | 5.1616 |
| Shading_high | 68.1208 | 62.1451 | −4.7903 | −5.2555 |
| Snow_low | 73.6917 | 67.5574 | 2.9959 | 2.9959 |
| Snow_high | 69.4047 | 63.6272 | −2.9959 | −2.9959 |
| Type | Typology | Classification Characteristics (Relative Rules) | PV Performance Characteristics | Spatial Pattern |
|---|---|---|---|---|
| T1 | High-potential synergy | High ; relatively high FAR; medium-to-high BD; NNI within a favorable range; both rooftop and facade contribute strongly | Highest effective with strong roof–facade synergy | Mainly clustered in localized high-value patches |
| T2 | High-potential constrained | Relatively high ; high FAR and/or BD; but one or more unfavorable conditions in NNI, BHF, or BHD; facade contribution is often prominent | High PV potential, but constrained by local spatial organization or height variation | Mainly distributed in or around high-intensity built-up areas, often as fragmented high-value patches |
| T3 | Balanced optimization | Moderate ; FAR and BD in medium ranges; relatively moderate NNI; relatively balanced rooftop and facade contributions | Stable intermediate PV performance; the most representative type in the study area | Most widely distributed and forms the dominant background type |
| T4 | Low-potential extensive | Low ; relatively low FAR; relatively low BD or insufficient surface utilization; either rooftop or facade contribution remains weak | Lowest effective and generally weak PV performance | Mostly distributed in peripheral areas or locally unfavorable built-form conditions |
| Study | Analytical Scale | PV Object | Cold-Region Correction | Method | Planning Translation | This Study’s Contribution |
|---|---|---|---|---|---|---|
| Li et al. (2024) [41] | District/sub-district scale | Rooftop PV | No systematic consideration of low-temperature or snow-related corrections | Deep learning + GIS | Limited | Extends rooftop PV to integrated rooftop–facade BIPV with cold-region and cluster-scale shading corrections |
| Chen et al. (2024) [42] | City scale | PV object: Buildings (3D building-based PV potential) | Cold-region climate correction not explicitly incorporated | Multi-source remote sensing + 3D building extraction | Limited | Advances the analysis to the building-cluster scale with interpretable morphology–PV response identification |
| Ruan et al. (2024) [43] | Module/installation optimization scale | Mainly installation angle and power-generation performance | Snowfall and snowmelt effects explicitly considered | Historical weather data + optimal tilt-angle model | Weak | Introduces cold-region correction into building-cluster-scale BIPV assessment and links it to urban morphology |
| Liu et al. (2025) [36] | Building-cluster/settlement scale | Rooftop and facade PV | Cold-region correction not emphasized | XGBoost + SHAP | Yes | Applies XGBoost + SHAP to severe-cold urban building clusters with added snow-loss and shading corrections |
| Yu et al. (2025) [12] | Multi-scale (building, block, city) | BIPV (rooftop + facade) | Comprehensive consideration of different climates and meteorological datasets | 3D building footprints + multi-source spatiotemporal datasets | Limited | Focuses on the building-cluster/block scale and strengthens morphology-based identification of effective BIPV potential in severe-cold regions |
| Tang et al. (2025) [39] | City scale | BIPV | Climate factors considered | Physical simulation + machine learning + 3D building models | Moderate | Emphasizes the building-cluster scale, severe-cold-region correction, and interpretable morphology-response analysis |
| This study | Building-cluster scale | Rooftop–facade integrated | Severe-cold correction | GIS + XGBoost + SHAP + PDP | Yes | Develops an effective BIPV potential assessment and morphology-based typology framework at the building-cluster scale in severe-cold regions |
Disclaimer/Publisher’s Note: The statements, opinions and data contained in all publications are solely those of the individual author(s) and contributor(s) and not of MDPI and/or the editor(s). MDPI and/or the editor(s) disclaim responsibility for any injury to people or property resulting from any ideas, methods, instructions or products referred to in the content. |
© 2026 by the authors. Licensee MDPI, Basel, Switzerland. This article is an open access article distributed under the terms and conditions of the Creative Commons Attribution (CC BY) license.
Share and Cite
Yin, X.; Xu, S.; Cui, P.; Shao, X.; Liu, X.; Zhang, S. Morphology-Oriented Layout Optimization for Enhancing Building-Cluster Photovoltaic Potential in Severe Cold Regions. Urban Sci. 2026, 10, 236. https://doi.org/10.3390/urbansci10050236
Yin X, Xu S, Cui P, Shao X, Liu X, Zhang S. Morphology-Oriented Layout Optimization for Enhancing Building-Cluster Photovoltaic Potential in Severe Cold Regions. Urban Science. 2026; 10(5):236. https://doi.org/10.3390/urbansci10050236
Chicago/Turabian StyleYin, Xinxian, Shengjing Xu, Peng Cui, Xingling Shao, Xuan Liu, and Siyuan Zhang. 2026. "Morphology-Oriented Layout Optimization for Enhancing Building-Cluster Photovoltaic Potential in Severe Cold Regions" Urban Science 10, no. 5: 236. https://doi.org/10.3390/urbansci10050236
APA StyleYin, X., Xu, S., Cui, P., Shao, X., Liu, X., & Zhang, S. (2026). Morphology-Oriented Layout Optimization for Enhancing Building-Cluster Photovoltaic Potential in Severe Cold Regions. Urban Science, 10(5), 236. https://doi.org/10.3390/urbansci10050236