1. Introduction
Cities worldwide are undergoing rapid digital transformation as public authorities increasingly adopt geospatial technologies, real-time data platforms, urban dashboards, and decision-support systems to enhance planning effectiveness and public service delivery. Digitalization has thus become a central pillar of contemporary urban governance, enabling evidence-based policy design, greater transparency, and more adaptive management of complex socio-technical systems. These developments are closely linked to smart city initiatives that integrate technological innovation with sustainable urban development and improved quality of life [
1,
2].
Despite significant technological investments, however, the outcomes of urban digitalization remain uneven. Many cities continue to face a persistent gap between technological capabilities and institutional governance capacity, meaning that the introduction of digital tools does not automatically lead to improved planning or administrative performance. Coordination failures, fragmented data ecosystems, institutional silos, and limited administrative capacity frequently constrain the effective use of digital infrastructure, particularly in transition economies [
3,
4].
To address this gap, this study develops and empirically operationalizes a multi-layer governance framework that aligns digital tools with the strategic, tactical, and operational functions of urban planning systems. The framework is applied to the case of Yerevan, Armenia (population 1.1 million), where digital planning reforms implemented between 2019 and 2023 involved multiple municipal departments and administrative databases [
5].
From a comparative governance perspective, Yerevan can be considered a “least-likely” case for achieving substantial performance gains through digital governance reforms. The city operates within a transition-economy institutional environment characterized by limited fiscal resources, fragmented administrative coordination, and relatively recent development of digital infrastructure. Observing measurable improvements in planning efficiency, data interoperability, and administrative coordination under such constraints therefore provides a stringent empirical test of the proposed framework.
Empirical evidence from this case indicates that structured governance alignment can generate measurable improvements, including shorter planning decision cycles, increased use of geospatial systems, enhanced inter-agency data sharing, and improved cost efficiency. These findings suggest that planning performance depends less on technological sophistication alone than on the systematic integration of digital tools within institutional processes.
By combining conceptual development with empirical validation, this paper contributes both theoretically and practically. It proposes a governance-oriented architecture for digital urban planning and offers policymakers a transferable model for implementing transparent, resilient, and data-driven city management in resource-constrained contexts.
3. A Multi-Layer Governance Framework for the Digitalization of Urban Planning
3.1. Framework Overview and Theoretical Foundation
This study proposes a three-layer governance framework designed to bridge the gap between high-level strategic vision and ground-level operational execution in digital urban planning. Unlike approaches that treat digital transformation as a purely technical upgrade, the framework conceptualizes digitalization as an institutional restructuring process that reshapes how decisions flow, how data circulate, and how accountability is distributed across municipal hierarchies.
The model synthesizes insights from multi-level governance theory [
25,
26], organizational information processing theory [
27,
28], and digital government maturity frameworks [
29,
30]. Together, these perspectives suggest that governance architecture—rather than technology adoption alone—determines whether digital investments translate into improved planning outcomes.
For conceptual clarity, several key terms used in this study are briefly defined in operational terms. Digital maturity refers to the extent to which digital tools and data systems are systematically embedded within administrative workflows and decision-making processes rather than existing as isolated technological components. Institutional alignment describes the degree of coherence between strategic policy priorities, organizational coordination mechanisms, and operational procedures within municipal governance structures. Governance integration refers to the effective interaction and feedback mechanisms between strategic, tactical, and operational layers of decision-making, enabling information flows, coordinated action, and adaptive policy implementation across administrative units.
Accordingly, the framework distinguishes three interdependent governance layers:
Strategic layer, where long-term vision, policy priorities, and resource allocation are defined;
Tactical layer, where cross-departmental coordination, data standardization, and program implementation are organized;
Operational layer, where citizen-facing services and day-to-day administrative activities are executed.
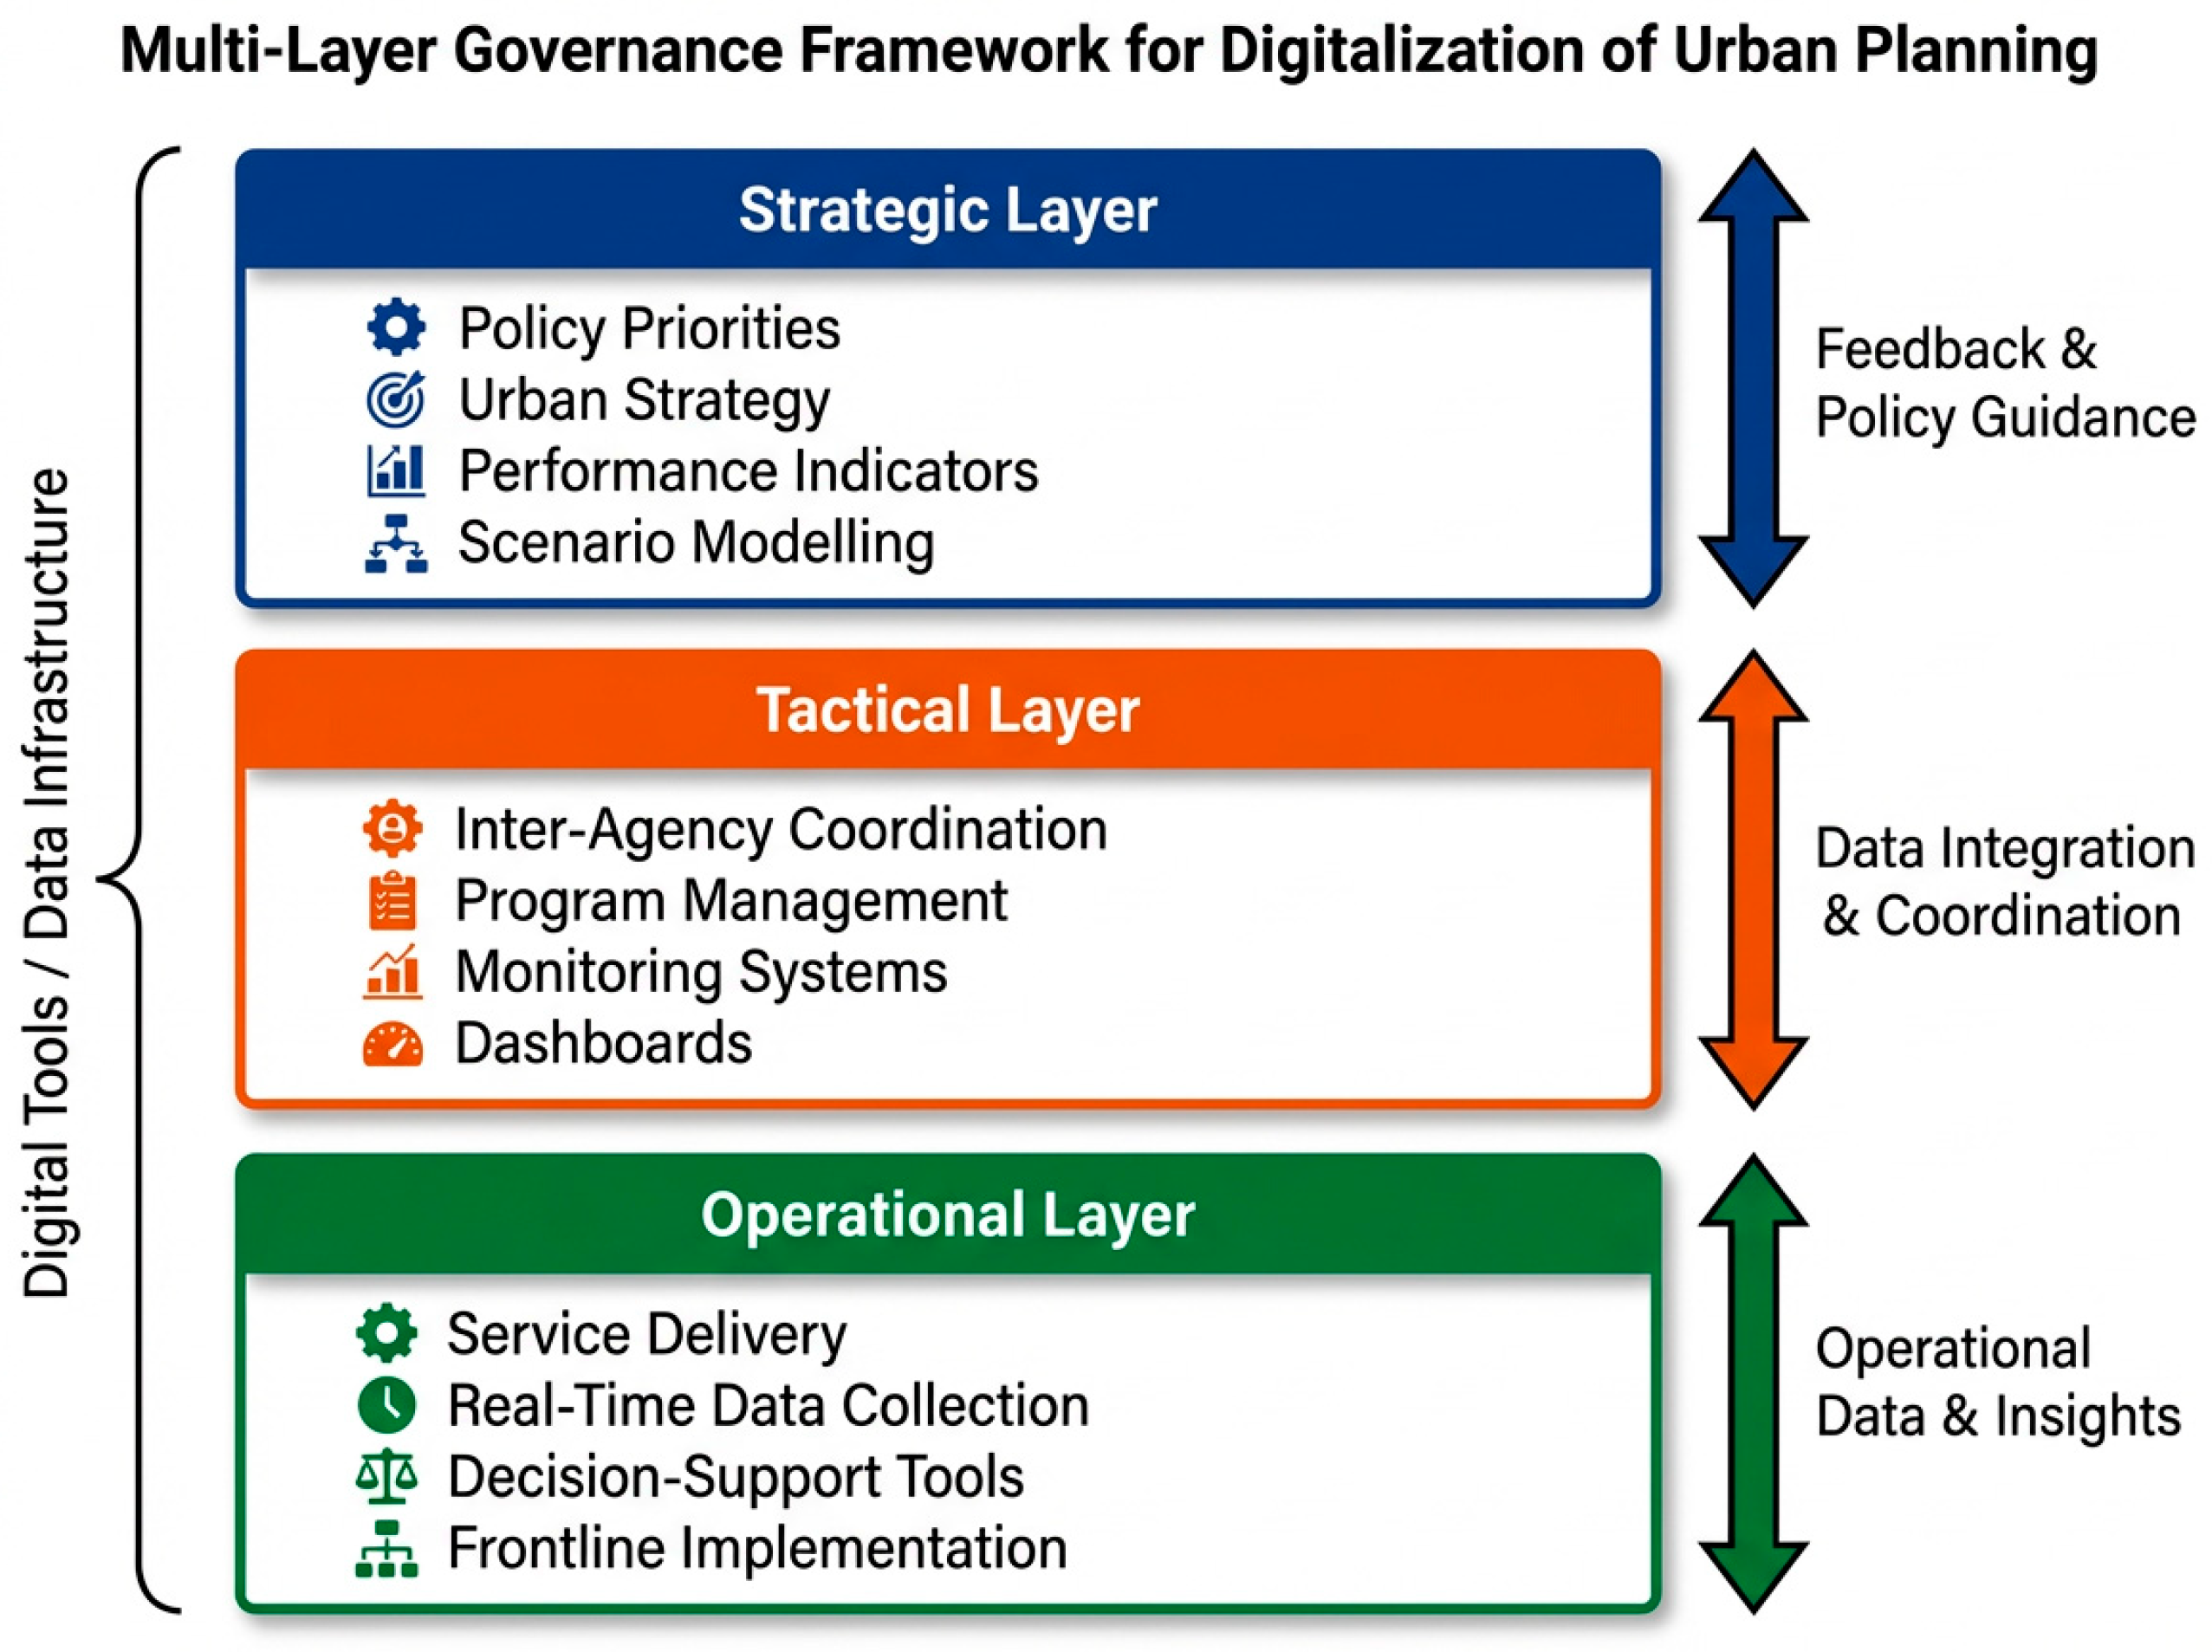
A key innovation of the framework is the reconceptualization of digitalization as a recursive and feedback-rich system rather than a simple top-down cascade. Operational data inform tactical adjustments, tactical coordination reshapes strategic priorities, and strategic mandates enable lower-level capacity building [
31]. This bidirectional structure allows digital tools to support adaptive governance rather than isolated technological deployment. The overall structure of the proposed multi-layer governance framework and the relationships between these layers are illustrated in
Figure 1.
The bidirectional feedback loops depicted in
Figure 1 highlight the integration of data and governance processes.
To enable empirical assessment, the framework specifies measurable performance dimensions across layers, which are operationalized through indicators presented in
Table 1 and evaluated in the subsequent empirical analysis.
3.2. Strategic Layer: Vision, Resource Allocation, and Policy Integration
The Strategic Layer encompasses decision-making authorities responsible for defining long-term development priorities, allocating financial and human resources, and ensuring coherence between digital initiatives and broader urban planning objectives. In municipal governance structures, this level typically includes executive leadership, chief planning offices, and budgetary authorities that determine how digital transformation aligns with citywide policy goals.
At this layer, digitalization performs three core governance functions. First, it supports vision articulation, clarifying how digital tools contribute to strategic urban priorities such as housing provision, transport efficiency, environmental sustainability, and land-use management. Second, it enables resource allocation, directing investments toward shared data infrastructures, geospatial systems, and staff capacity building. Third, it facilitates policy integration, embedding digital requirements within formal planning instruments, including master plans, zoning regulations, and investment programs.
Empirical observations from the Yerevan case illustrate how strategic commitment to digitalization can shift planning practices from ad hoc technological adoption toward institutionalized governance reform. During the study period, digital tools were increasingly incorporated into official planning documents and budgetary frameworks, strengthening the alignment between strategic objectives and implementation mechanisms.
Comparative evidence suggests that cities with mature strategic layers tend to achieve more consistent digital outcomes, whereas transition-economy municipalities often struggle to institutionalize digital mandates due to fiscal constraints, legacy hierarchies, and limited data governance capacity. These challenges highlight the importance of strategic-level coordination as a prerequisite for effective digital planning.
Together, the Strategic Layer establishes the enabling conditions under which tactical coordination and operational implementation can occur, providing the policy direction and resources necessary for system-wide digital integration.
3.3. Tactical Layer: Coordination, Standardization, and Implementation
The Tactical Layer functions as the operational backbone of digital urban governance, translating strategic mandates into coordinated workflows, shared datasets, and interdepartmental procedures. Positioned between high-level policy direction and frontline service delivery, this layer plays a critical mediating role by ensuring that digital strategies are converted into executable practices.
Three core governance functions characterize the tactical level. First, interdepartmental coordination, which establishes formal mechanisms for information exchange and joint decision-making across municipal units. Second, data standardization and interoperability, which create common formats, shared databases, and compatible systems that enable departments to work with consistent and reliable information. Third, project implementation, through which digital initiatives—such as software deployment, process redesign, and staff training—are organized and monitored in day-to-day operations.
Empirical observations from the Yerevan case indicate that improvements at the tactical level were closely associated with increased data sharing, more frequent cross-department collaboration, and the gradual reduction in technical incompatibilities between departmental systems. These changes facilitated integrated planning practices and enabled projects requiring multi-agency coordination that were previously difficult to implement.
Comparative studies similarly suggest that cities investing in tactical-layer interoperability and coordination mechanisms tend to achieve more consistent digital outcomes, whereas municipalities lacking standardized procedures often experience persistent data silos despite substantial technological investment. This evidence highlights the tactical layer as a critical institutional bottleneck in digital transformation processes.
By connecting strategic intent with operational capacity, the Tactical Layer enables horizontal integration across departments and provides the organizational infrastructure necessary for effective, system-wide digital governance.
3.4. Operational Layer: Service Delivery, Citizen Interaction, and Routine Processes
The Operational Layer represents the point at which digital governance becomes directly visible to citizens and frontline staff. It encompasses district planning offices, municipal service centers, inspectors, and digital service platforms through which routine planning activities—such as permits, inspections, and public consultations—are executed. While strategic and tactical layers shape policies and coordination mechanisms, the operational level translates these arrangements into concrete administrative actions and everyday service delivery.
This layer performs three primary governance functions. First, service delivery, ensuring efficient processing of routine planning transactions through standardized digital workflows. Second, data collection, capturing ground-level information from inspections, applications, and citizen interactions that feeds back into higher-level decision-making. Third, citizen interaction and transparency, providing accessible digital interfaces that enhance accountability, reduce procedural uncertainty, and facilitate public participation.
Evidence from the Yerevan case indicates that operational digitalization was associated with faster administrative procedures, lower documentation errors, and improved user experiences. The introduction of online tracking systems, automated validation tools, and public information portals contributed to more predictable and transparent planning processes while reducing reliance on informal or paper-based practices.
Comparative research similarly shows that operational efficiency gains depend less on technological sophistication than on usability, process redesign, and staff capacity. Without clear workflows and user-centered implementation, even advanced digital infrastructures may fail to produce meaningful service improvements. This underscores the operational layer as the critical interface between institutional reform and tangible public value.
By generating reliable administrative data and improving daily interactions, the Operational Layer provides the empirical foundation upon which tactical coordination and strategic planning decisions can adapt and evolve.
3.5. Inter-Layer Dynamics: Feedback Loops and Governance Integration
The analytical strength of the proposed framework lies not only in distinguishing governance layers but in explaining how these layers interact. Rather than functioning as independent administrative tiers, strategic, tactical, and operational levels are connected through continuous feedback processes that shape how digitalization influences decision-making and institutional performance.
Three principal interaction mechanisms structure this integration.
First, upward feedback enables operational data—such as service performance indicators, permit backlogs, and citizen requests—to inform tactical adjustments and strategic priorities. Information generated through day-to-day administrative processes provides evidence on where bottlenecks occur and where resources should be reallocated, allowing higher-level decisions to be grounded in observed operational realities rather than assumptions.
Second, downward implementation ensures that strategic commitments translate into practical capacity at lower levels. Policy mandates, budgets, and regulatory requirements must be accompanied by interoperable systems, training, and delegated authority. Without such enabling conditions, strategic digitalization initiatives risk remaining symbolic rather than actionable.
Third, horizontal coordination within the tactical layer facilitates collaboration across departments through shared standards and integrated data platforms. This interoperability allows complex, cross-cutting planning tasks to be addressed concurrently rather than sequentially, reducing delays and improving consistency in urban decision-making.
Empirical observations from the Yerevan case illustrate how this feedback mechanisms supported more adaptive governance, as operational information informed policy revisions and coordinated procedures strengthened implementation capacity. Similar patterns are reported in other cities pursuing integrated digital planning, underscoring that sustainable digital transformation depends less on isolated technological investments than on structured inter-layer alignment.
Together, these dynamics demonstrate that digitalization operates as a systemic governance process rather than a collection of discrete tools. Effective outcomes emerge when information flows bidirectionally across layers, enabling continuous learning, adjustment, and institutional integration.
3.6. Performance Indicators and Operationalization
To translate the conceptual framework into an empirically testable structure, the study operationalizes governance integration through a set of measurable performance dimensions distributed across the strategic, tactical, and operational layers. These dimensions transform abstract constructs—such as coordination, interoperability, capacity, and service efficiency—into observable indicators that allow systematic assessment of digitalization outcomes.
The indicators are designed to capture both layer-specific functions and cross-layer dynamics. Strategic indicators assess policy integration and resource commitment; tactical indicators measure interdepartmental coordination and data standardization; operational indicators evaluate service delivery effectiveness and citizen-facing performance; while inter-layer indicators reflect feedback mechanisms and institutional alignment across governance levels.
The full set of governance functions, corresponding digital instruments, and associated performance indicators is summarized in
Table 2.
As summarized in
Table 2, the framework translates governance responsibilities and digital instruments into measurable analytical dimensions. This operational alignment enables systematic evaluation of how digitalization affects planning performance, inter-agency coordination, and service delivery outcomes across decision-making layers, thereby providing the empirical basis for the subsequent analysis.
4. Methodology
4.1. Research Design and Analytical Strategy
This study employs a longitudinal empirical case study design combined with indicator-based measurement to evaluate how governance structures shape digitalization outcomes in urban planning. Rather than treating digital tools as isolated technological interventions, the research conceptualizes digitalization as an institutional process mediated by decision-making layers, coordination mechanisms, and accountability arrangements.
The analytical strategy integrates theory-informed operationalization with quantitative performance assessment. Established frameworks from multi-level governance, organizational information processing, and digital government studies inform the selection of measurable constructs, which are subsequently translated into observable indicators. This approach enables systematic, transparent, and replicable empirical evaluation of governance effectiveness.
The research proceeds through three sequential stages:
Theory-informed framework specification—synthesizing multi-level governance theory, organizational information processing perspectives, and digital government maturity models to define three governance layers (Strategic, Tactical, Operational) and their functional responsibilities.
Indicator operationalization—translating these constructs into 16 measurable performance indicators capturing institutional coordination, resource allocation, service efficiency, and feedback mechanisms.
Empirical application and longitudinal validation—applying the indicators to the case of Yerevan, Armenia (2019–2023) to assess whether changes in governance architecture are associated with observable improvements in planning efficiency, interoperability, and citizen outcomes.
This design is appropriate for complex socio-technical governance systems where experimental control is infeasible and causality emerges through recursive institutional interactions. The longitudinal structure enables temporal comparison of pre- and post-digitalization periods, strengthening internal validity through trend analysis and mechanism tracing.
By combining structured indicators, administrative performance data, and documentary evidence, the study moves beyond descriptive case analysis and provides quantifiable, comparable, and transferable results that can be applied to other urban contexts.
4.2. Case Selection: Rationale for Yerevan
The empirical analysis focuses on Yerevan, Armenia, selected through theoretical and analytical case selection rather than convenience sampling. The objective is not statistical representativeness but analytical generalization, whereby a conceptually informative case is used to test whether the proposed governance framework can explain digitalization outcomes under realistic institutional constraints.
Yerevan constitutes an information-rich and theory-relevant case for three methodological reasons.
First, the city reflects governance conditions commonly observed in transition and resource-constrained urban systems: fragmented departmental structures, legacy administrative hierarchies, heterogeneous information systems, and limited fiscal capacity for digital investment. These characteristics create coordination bottlenecks that the proposed framework explicitly seeks to diagnose. Studying such a context provides a demanding test of the model’s explanatory power.
Second, the period 2019–2023 captures a natural policy experiment characterized by incremental but observable digital reforms, including GIS platform deployment, interdepartmental data integration, and online service delivery systems. This temporal variation enables longitudinal comparison of pre- and post-implementation performance, strengthening internal validity by linking institutional changes to measurable outcomes over time.
Third, the municipality maintains structured administrative and performance records (planning project databases, permit logs, budget execution reports, and system usage data), which allow the operationalization of governance constructs into quantifiable indicators. The availability of consistent, multi-year administrative data enables systematic and replicable measurement rather than purely descriptive case narration.
Methodologically, Yerevan can therefore be considered a critical and least-likely case: if a governance-centered digitalization framework demonstrates explanatory value in a fiscally constrained and institutionally fragmented setting, its applicability should reasonably extend to better-resourced cities where coordination barriers are less severe. In this sense, the case provides strong analytical leverage for testing the transferability of the framework.
Accordingly, the purpose of the case study is not to generalize from the city itself but to evaluate the robustness and practical utility of the proposed indicator-based governance model.
4.3. Data Sources and Collection
The empirical analysis draws on multiple independent and complementary data sources, combining documentary evidence, administrative performance records, and benchmarking datasets. This multi-source design enables triangulation, reduces single-source bias, and supports systematic, replicable indicator construction.
4.3.1. Policy and Strategic Documents (n = 18)
A structured documentary corpus of formal planning and policy instruments issued by the Municipality of Yerevan between 2019 and 2023 was compiled.
The dataset includes:
Master Plans and statutory spatial plans
Annual municipal budgets and budget execution reports
Sectoral development strategies (transport, environment, housing, utilities)
Digital transformation and IT department reports
Documents were obtained through publicly accessible municipal archives and official releases. Only formally adopted and legally binding documents were included to ensure institutional relevance.
Each document was digitized and coded using a structured protocol that recorded:
- (a)
explicit digital mandates,
- (b)
budgetary allocations linked to digital initiatives,
- (c)
data-sharing or interoperability requirements,
- (d)
performance targets or monitoring provisions.
Both manifest counts (frequency of references) and binary coding (presence/absence) were applied. To enhance reliability, two independent coders assessed a 30% subsample, yielding inter-coder agreement κ = 0.83. Discrepancies were resolved through reconciliation, and the finalized codebook was applied consistently to the full corpus.
This process enables transparent replication of strategic-layer indicators, as coding rules are rule-based rather than interpretive.
4.3.2. Administrative and Performance Data
Administrative records constitute the core quantitative foundation of the study. These data originate directly from municipal management systems and therefore reflect observed operational behavior rather than self-reported perceptions.
The following datasets were assembled:
Planning Project Database (full population; n ≈ 240 projects)
Includes all officially registered planning projects during 2019–2023. Variables include project type, participating departments, approval timelines, and documented use of GIS-based analysis. No sampling was applied; the complete project population was analyzed.
Permit Processing Records (population ≈ 15,000 transactions annually)
Due to volume, stratified random sampling was used. Approximately 200 permits per year were randomly selected across months and districts to ensure temporal and spatial coverage (total n ≈ 1200). For each case, timestamps for submission, routing, and approval were extracted. Processing time was calculated as:
processing time = approval date − submission date (days)
Error rates were calculated as the proportion of cases returned for administrative correction.
GIS System Logs (full system logs)
Server-generated usage logs provided objective records of dataset access, user sessions, and shared layers. GIS utilization was operationalized as:
GIS utilization rate = decisions with documented GIS analysis ÷ total planning decisions
This definition relies on explicit evidence in decision memos or system records, avoiding subjective interpretation.
Budget Execution Reports (full population)
Annual planned vs. realized expenditures were recorded line-by-line. Digital spending indicators were derived by summing line items explicitly allocated to software, infrastructure, training, or data systems.
Citizen Satisfaction Surveys (aggregate municipal surveys; n = 612 in 2019, n = 847 in 2022–2023)
Municipal survey reports provided aggregated response distributions. Where regression analysis was conducted, only anonymized, non-identifiable tabular data were used. Survey variables were standardized to a common scale prior to analysis.
Across all administrative datasets, preprocessing included consistency checks, removal of duplicate entries, and verification of timestamp completeness. No imputation was applied; cases with missing core variables were excluded (<3%).
4.3.3. Comparative Benchmarking Data
To contextualize performance, external benchmarking data were compiled from internationally published municipal reports, peer-reviewed case studies, and multilateral institutional surveys.
These benchmarks were used interpretively rather than inferentially to position Yerevan’s outcomes relative to documented best practices and transition-economy averages. Only indicators with comparable definitions were considered to avoid misleading comparisons.
Benchmarking thus serves as contextual triangulation rather than statistical generalization.
4.3.4. Data Integration and Indicator Construction
All sources were integrated into a unified analytical matrix linking:
raw observations → standardized variables → framework indicators.
Each of the 16 indicators was computed using explicit formulas and consistent measurement rules defined prior to analysis. This pre-specification minimizes researcher discretion and reduces confirmatory bias.
The structured data architecture enables independent verification and replication, as each indicator can be reconstructed directly from documented inputs.
4.4. Analytical Methods
The analytical strategy combines structured content analysis, indicator-based performance measurement, longitudinal statistical comparison, and comparative contextual assessment. These complementary methods enable both qualitative interpretation and quantitative verification of governance change over time.
All indicators, variables, and analytical procedures were pre-specified prior to statistical analysis to minimize researcher discretion and reduce the risk of post hoc selection bias. This ensures transparency and replicability of results.
The analysis proceeds across four methodological components.
4.4.1. Structured Content Analysis of Policy Documents
Policy and strategic documents (n = 18) were analyzed using a rule-based coding framework to quantify strategic commitment to digitalization.
Two forms of coding were applied:
Manifest coding
Explicit references to digital tools, GIS mandates, interoperability requirements, and coordination mechanisms were counted. This enables quantitative measurement of policy emphasis (e.g., percentage of documents containing mandatory digital provisions).
Binary presence/absence coding
Each document was coded for the existence of specific governance provisions (e.g., formal data-sharing requirements, performance monitoring clauses). This supports construction of standardized indicators across time.
To ensure reliability, two independent coders analyzed a 30% subsample. Inter-coder agreement reached κ = 0.83, indicating substantial consistency. Disagreements were reconciled through consensus before applying the finalized codebook to the full corpus.
This structured protocol allows replication of strategic-layer indicators independent of researcher interpretation.
4.4.2. Indicator-Based Performance Tracking
The framework’s 16 indicators were operationalized as observable, rule-defined metrics derived directly from administrative records. Each indicator was calculated using explicit formulas to ensure measurement consistency across years.
Examples include:
= mean (approval date − submission date)
= returned or corrected cases ÷ total cases
= decisions with documented GIS analysis ÷ total planning decisions
= compatible systems ÷ total departmental systems
Using rule-based computation reduces subjectivity and ensures comparability across time periods.
Indicators were calculated annually for 2019–2023 to enable longitudinal trend analysis.
4.4.3. Statistical Comparison and Longitudinal Testing
To assess whether observed changes represent meaningful improvements rather than random variation, statistical tests were applied to key operational indicators.
Because administrative performance variables (e.g., processing times) exhibited non-normal distributions and skewness typical of service-delivery data, non-parametric methods were employed.
Specifically:
Mann–Whitney U tests were used to compare baseline (2019) and post-implementation (2023) distributions
Median differences were reported alongside mean values
Effect sizes (rank-biserial correlation) were calculated to assess practical significance
This approach avoids assumptions of normality and provides robust inference for administrative data.
Where annual observations were available, trend analysis across all years (2019–2023) supplemented pairwise comparisons to verify that improvements followed consistent trajectories rather than isolated fluctuations.
All statistical procedures were conducted using predefined thresholds (α = 0.05).
4.4.4. Mechanism Tracing and Process Validation
Because the study examines complex socio-technical governance systems where causality is indirect and recursive, quantitative testing was complemented by mechanism tracing.
For each major performance improvement, temporal sequencing was examined:
institutional change → tactical intervention → operational outcome
Examples include:
This structured process analysis supports plausible causal inference by linking institutional reforms to subsequent measurable effects.
While this design does not establish experimental causality, it strengthens internal validity through temporal sequencing and mechanism tracing. It should therefore be emphasized that the empirical results presented in this study primarily identify associations between governance restructuring and observed performance improvements, rather than establishing strict causal identification. Future research could strengthen causal inference by applying quasi-experimental approaches such as difference-in-differences designs, synthetic control methods, or interrupted time-series analysis using comparable cities undergoing similar digitalization reforms.
4.4.5. Comparative Contextual Assessment
To interpret the magnitude of observed performance changes, results were contextualized using international and transition-economy benchmarks.
Benchmarking was used descriptively rather than inferentially, serving to situate Yerevan’s performance within a broader spectrum of urban digital maturity rather than to conduct statistical cross-city comparison.
Only indicators with comparable definitions were considered to avoid misleading equivalence.
4.4.6. Analytical Robustness and Replicability
Several safeguards enhance methodological robustness:
pre-specified indicators and formulas
multi-source triangulation
independent coding validation
full administrative populations where feasible
transparent sampling procedures
non-parametric testing appropriate for skewed data
Together, these measures ensure that findings are systematic, reproducible, and minimally dependent on researcher judgment.
4.5. Limitations and Validity Considerations
As with any empirical case-based research, the study involves methodological trade-offs that affect generalizability, causal inference, and measurement precision. These limitations are explicitly acknowledged and addressed through multiple validity safeguards to enhance the credibility and robustness of findings.
The discussion below distinguishes external validity, internal validity, construct validity, and reliability considerations, together with mitigation strategies adopted in the research design.
4.5.1. External Validity: Single-Case Design
The empirical analysis centers on Yerevan as a single in-depth case. Consequently, the study does not aim for statistical generalization to a population of cities.
Instead, it pursues
analytical generalization [
32], whereby theoretical propositions and indicator structures are tested in a conceptually informative context. The objective is to evaluate whether the proposed governance framework can explain observable outcomes under realistic institutional constraints.
The case therefore functions as a critical and theory-testing environment rather than a representative sample. While findings should be transferred cautiously, the indicator architecture and measurement logic are explicitly designed for replication in other urban settings.
Future research should extend the framework through multi-city or cross-national comparisons to strengthen external validity.
4.5.2. Internal Validity: Causality and Confounding Factors
As an observational, non-experimental study, causal attribution is inherently constrained. Improvements in performance indicators (e.g., reduced permit processing time or higher satisfaction) may be influenced by factors beyond digitalization, including staff training, procedural reforms, leadership changes, or macroeconomic conditions.
To strengthen internal validity, three strategies were employed:
Temporal sequencing
Institutional interventions and performance changes were mapped chronologically to assess whether outcomes followed reforms in plausible order.
Mechanism tracing
Observed improvements were linked to identifiable governance processes (e.g., dashboards → budget reallocation → coordination tools → efficiency gains), supporting theoretically coherent causal pathways.
Triangulation
Consistent patterns across multiple independent indicators (policy mandates, budget allocations, interoperability, service outcomes) reduce the likelihood that results reflect isolated or spurious correlations.
While these approaches cannot establish experimental causality, they provide robust correlational and process-based evidence consistent with the proposed theoretical mechanisms.
4.5.3. Construct Validity: Measurement of Governance Concepts
Governance constructs such as coordination, interoperability, and digital maturity are abstract and not directly observable. Measurement error may arise if indicators inadequately capture these concepts.
To enhance construct validity:
all indicators are grounded in established governance and digital government literature
operational definitions rely on observable administrative records rather than subjective judgments
each governance layer is represented by multiple indicators (4–5 per layer), reducing reliance on single proxies
explicit formulas and rule-based calculations were pre-specified before analysis
This multi-indicator operationalization minimizes conceptual ambiguity and improves measurement precision.
4.5.4. Reliability and Replicability
Administrative datasets may contain inconsistencies, missing values, or recording biases typical of government systems.
Several procedures were implemented to enhance reliability:
use of official system logs and formal records rather than self-reported estimates
standardized data-cleaning protocols (duplicate removal, timestamp verification)
minimal imputation and exclusion of incomplete cases (<3%)
inter-coder reliability checks for document analysis (κ = 0.83)
transparent sampling rules and indicator formulas
These measures ensure that results are replicable and minimally dependent on researcher discretion, enabling independent verification of calculations.
4.5.5. Data Availability Constraints
Certain desirable data sources were not available.
First, systematic interviews with municipal officials were not conducted. Although qualitative interviews could deepen understanding of informal practices and perceptions, the study prioritizes objective administrative evidence to minimize response and recall bias.
Second, direct ethnographic or observational data on departmental workflows were not feasible. Instead, performance indicators serve as behavioral proxies for operational processes.
Third, complete pre-2019 digital baselines were limited for systems introduced later (e.g., centralized GIS). Where necessary, first-year system data were treated as initial benchmarks.
These constraints primarily affect explanatory depth rather than indicator accuracy and do not compromise the quantitative findings.
4.5.6. Informal Practices and Shadow Processes
A further limitation concerns the presence of informal or extra-procedural practices that may not be fully captured in digital logs. While administrative indicators measure formal workflows, some decisions may occur outside official systems.
The study addresses this risk through:
cross-checking multiple data sources
identifying discrepancies between formal records and observed outcomes
explicitly acknowledging that indicators reflect formalized processes
Accordingly, reported performance should be interpreted as institutional rather than absolute measures.
4.5.7. Summary of Validity Safeguards
Taken together, the study combines:
These safeguards enhance confidence that the results represent systematic governance patterns rather than measurement artifacts or isolated events.
While no single case study can eliminate all uncertainty, the design provides a transparent, reproducible, and theoretically grounded empirical basis for evaluating governance–digitalization relationships.
4.6. Ethical Considerations
The study relies exclusively on institutional, documentary, and aggregated administrative data and does not involve direct interaction with human subjects or the collection of personally identifiable information.
The empirical analysis focuses on publicly available policy documents and de-identified administrative records obtained from the Municipality of Yerevan. Data sources consist of planning documents, budget reports, system usage logs, project databases, and aggregate service performance statistics. These materials reflect organizational and procedural information rather than individual-level personal data.
No names, addresses, personal identifiers, or sensitive attributes were accessed or recorded at any stage of the research.
Where operational datasets (e.g., permit logs or system records) contained potentially identifiable entries, only anonymized or aggregated extracts were used. Individual cases were analyzed solely through coded or summary variables (e.g., timestamps, processing durations, error counts), ensuring that neither applicants nor municipal staff could be identified. Any project-specific references presented in the study omit identifying details.
Because the research involves secondary administrative data and institutional records only, it qualifies as minimal-risk, non-human-subject research under standard social science ethics guidelines. Consequently, formal individual consent procedures were not required. Data use complies with Armenia’s public information and transparency regulations governing access to municipal planning documents and performance reports.
The study adheres to principles of:
confidentiality and anonymization
proportional data use (only variables necessary for analysis were retained)
secure storage of datasets
reporting results exclusively in aggregate or statistical form
These safeguards ensure that the analysis poses no foreseeable risk to individuals, organizations, or public interests while enabling transparent and reproducible research.
5. Empirical Results and Framework Validation
5.1. Baseline Governance Conditions Prior to Digitalization (2019)
Before evaluating the effects of digitalization initiatives, it is necessary to establish a quantified governance baseline against which subsequent improvements can be assessed. This subsection therefore reports measurable pre-digitalization conditions in Yerevan for the reference year 2019, immediately preceding the introduction of coordinated digital reforms.
The urban planning system involved 12 municipal departments with distributed responsibilities across strategic, tactical, and operational functions. While this multi-actor structure provided sectoral expertise, administrative records reveal limited coordination and low digital integration at baseline.
Strategic-layer baseline
Documentary and budget analysis indicates weak institutional commitment to digital tools:
Only 12% of strategic planning documents contained explicit digital or GIS mandates
Digital infrastructure accounted for 2.8% of the planning budget
Only 41% of digitally stated priorities were supported by corresponding budget allocations
These figures suggest that digitalization was largely aspirational rather than operationalized through enforceable policy or financial commitment.
Tactical-layer baseline
Administrative coordination capacity was limited:
Interdepartmental meetings averaged 2.3 per year, indicating minimal structured collaboration
73% of departmental information systems were technically incompatible, preventing automated data exchange
Only three GIS layers were shared across departments, with most spatial data siloed locally
These constraints imply high transaction costs for cross-departmental projects and limited real-time information sharing.
Operational-layer baseline
Service delivery indicators further illustrate low digital maturity:
Average permit processing time: 18.2 days
Administrative error rate: 23%, requiring resubmission or correction
Average citizen office visits: 3.2 per permit
Citizen satisfaction: 48% (n = 612)
GIS utilization in formal planning decisions: 18%
Together, these metrics indicate reliance on manual workflows, fragmented documentation, and low procedural transparency.
Baseline interpretation
Taken collectively, the 2019 indicators depict a governance system characterized by:
limited strategic prioritization of digitalization
weak tactical coordination mechanisms
labor-intensive operational processes
This baseline establishes a measurable starting point for subsequent longitudinal comparison. All improvements reported in the following sections are evaluated relative to these pre-reform conditions.
5.2. Layered Changes in Governance Performance: Indicator-Based Evidence Across Decision Levels
Applying the framework’s three-layer structure to Yerevan enables a systematic, indicator-based assessment of how digitalization affected distinct governance functions. Rather than treating digital transformation as a single aggregate outcome, changes are evaluated separately at the strategic, tactical, and operational layers.
This layered comparison reveals that improvements were uneven but complementary, with the largest effects occurring at the coordination (tactical) level, followed by operational efficiency gains and subsequently by strategic institutionalization.
5.2.1. Strategic Layer: Institutionalization of Digital Commitment
Strategic indicators capture whether digitalization moved from rhetorical intent to enforceable policy and budgetary commitment.
As shown in
Table 3, the strategic-layer governance indicators illustrate changes between the baseline (2019) and the post-digitalization period (2023).
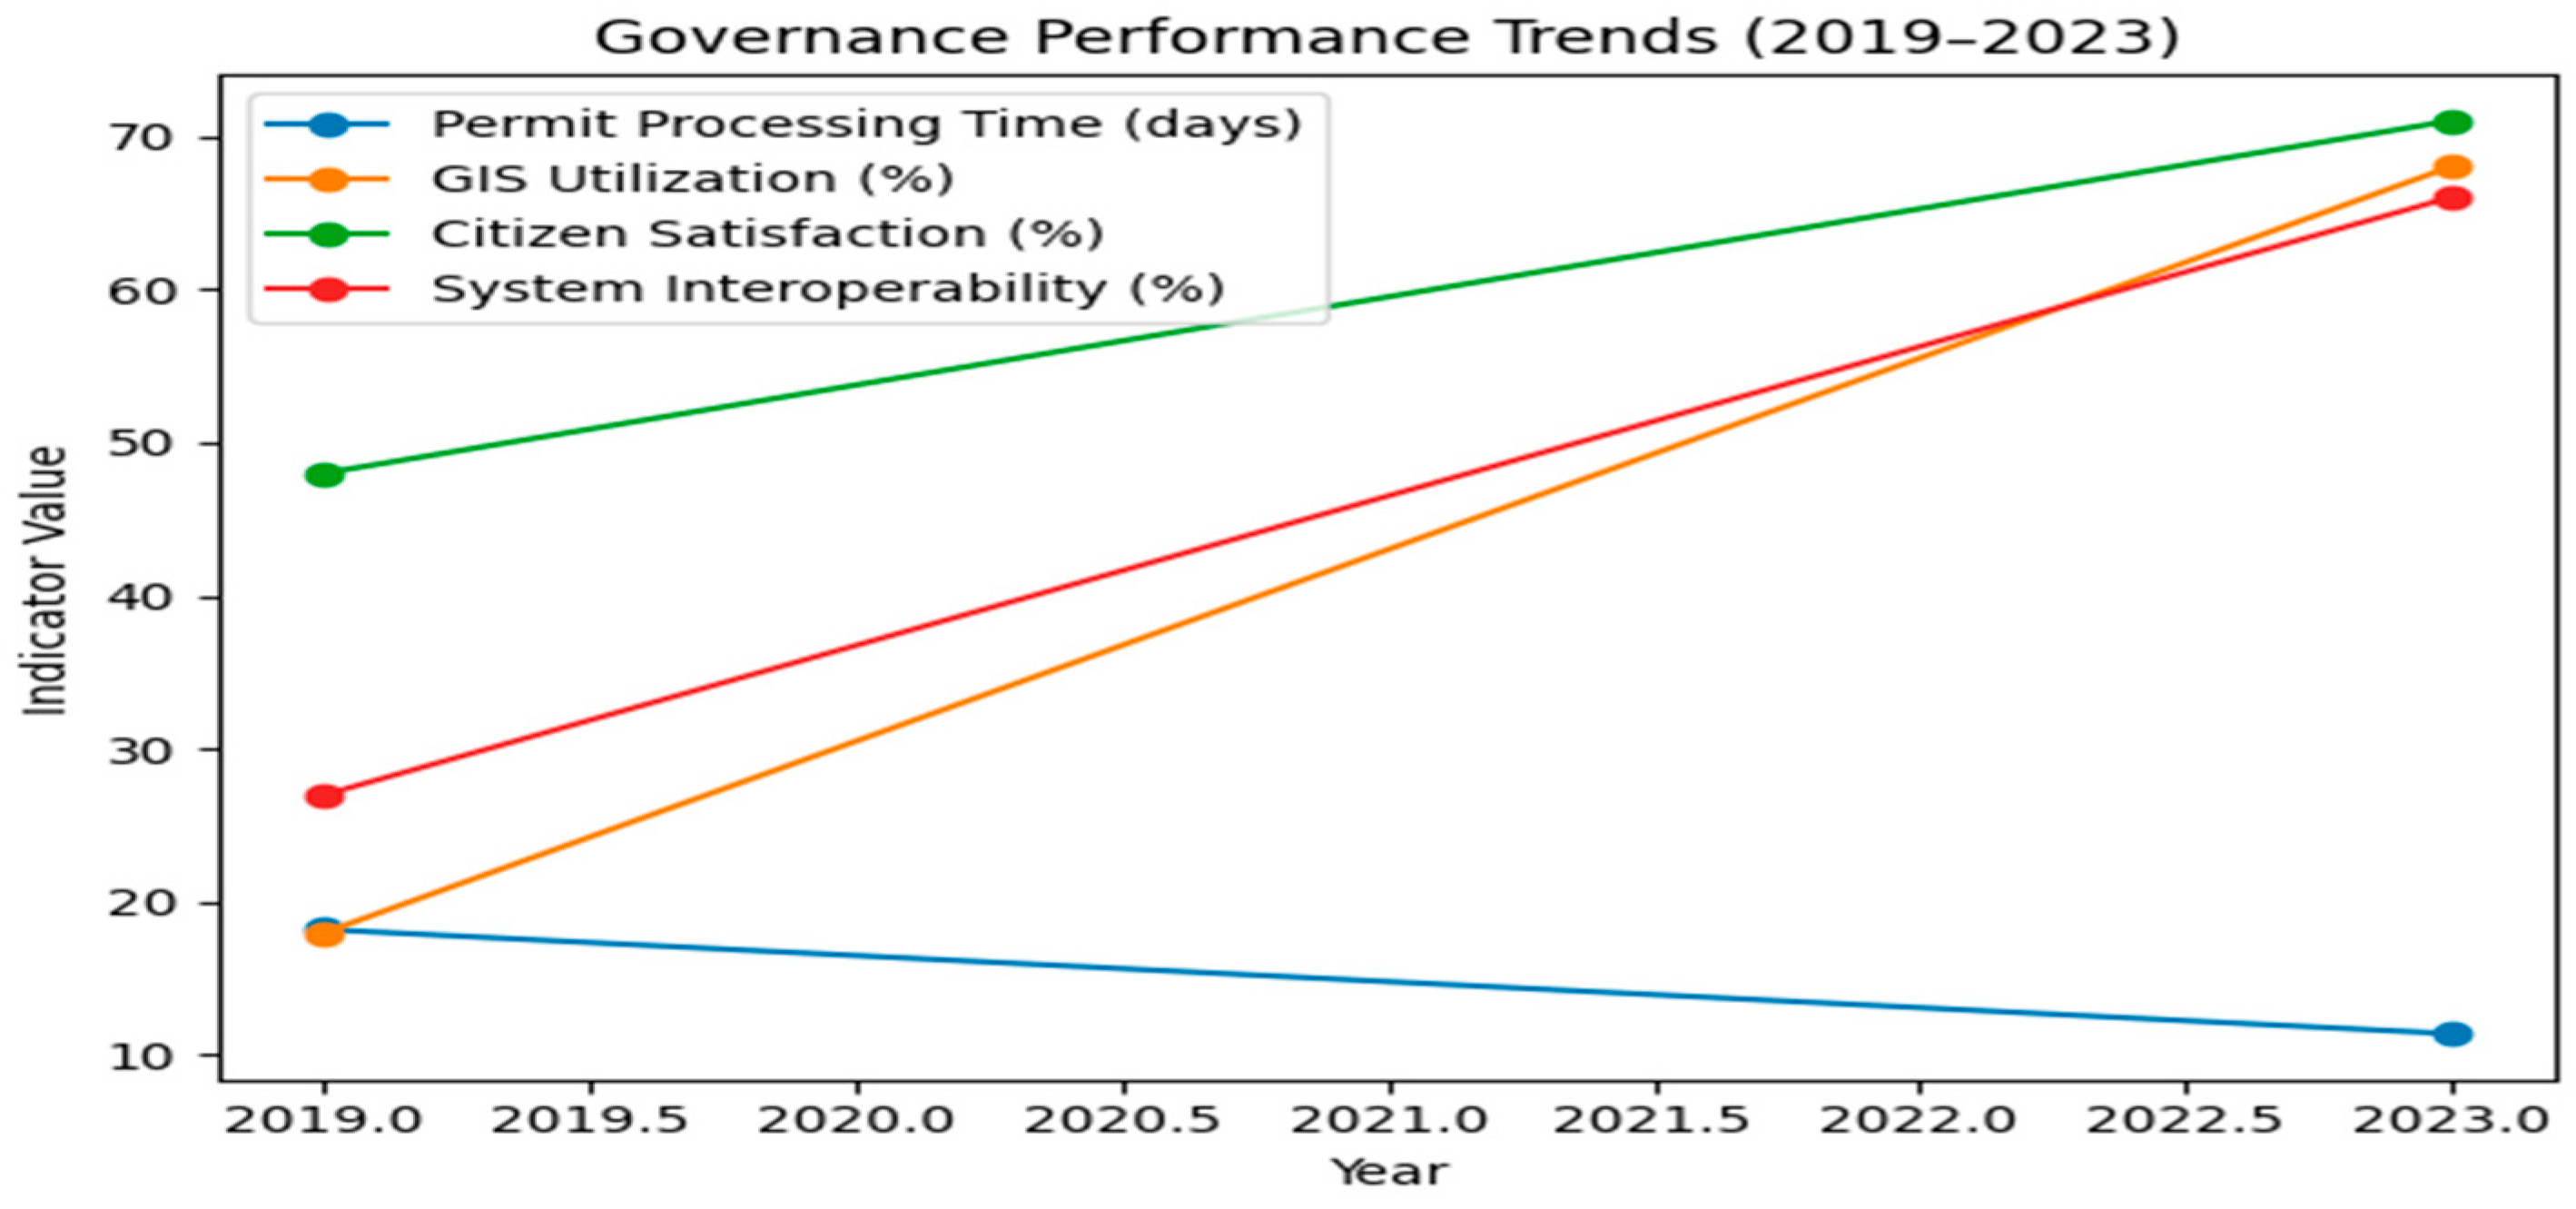
Figure 2 illustrates the evolution of selected governance performance indicators during the implementation of digital planning reforms in Yerevan between 2019 and 2023. The figure highlights four key dimensions: operational efficiency, utilization of digital tools, institutional interoperability, and citizen satisfaction.
As shown in
Figure 2, all indicators demonstrate a consistent upward trend over the observed period. Improvements in operational efficiency are reflected in shorter planning decision cycles, while increased utilization of digital tools indicates a broader integration of geospatial and data-driven systems into planning processes. At the same time, the rise in institutional interoperability suggests enhanced coordination and data exchange across municipal departments. Citizen satisfaction also shows a positive trajectory, indicating improved responsiveness and service quality.
Taken together, these trends point to a transition from symbolic digital adoption toward more operationally embedded and performance-oriented governance practices. In particular, the 2021 Master Plan introduced mandatory GIS-based analysis for zoning, environmental assessments, and infrastructure planning. Unlike earlier plans where digital tools were optional, these provisions created formal compliance requirements that compelled downstream departments to adopt digital workflows.
Budget execution data corroborate this institutional shift. Digital allocations increased more than threefold in nominal terms and were explicitly mapped to governance layers (coordination platforms, data standardization, training). This layer-specific budgeting suggests that digitalization became integrated into planning logic rather than treated as generic IT expenditure.
Interpretation:
Strategic reforms primarily strengthened institutional capacity and resource commitment, creating enabling conditions for lower-layer improvements rather than directly affecting service outcomes.
5.2.2. Tactical Layer: Coordination and Interoperability Effects
Tactical indicators measure cross-departmental coordination and information-sharing capacity—hypothesized by the framework to be the primary bottleneck in fragmented governance systems.
As shown in
Table 4, the tactical-layer governance indicators reflect coordination and interoperability performance over the period 2019–2023.
This layer exhibits the largest proportional improvements across the entire framework.
The number of shared datasets increased ninefold, while incompatible systems fell from 73% to 34%, substantially reducing information frictions. Concurrently, multi-departmental projects more than doubled, indicating that coordination constraints previously limited project complexity.
Process evidence suggests that relatively low-cost organizational interventions generated disproportionate effects. The Digital Planning Working Group and the Data Steward Network established recurring horizontal communication channels, allowing departments to resolve interoperability issues directly rather than through hierarchical escalation.
Case-level comparison further illustrates coordination gains. A multi-agency revitalization project requiring inputs from five departments recorded:
The improvement reflects concurrent rather than sequential review enabled by shared digital infrastructure.
Interpretation:
These results support the framework’s central proposition that coordination capacity, not technology availability, is the critical constraint in transition-economy digitalization. Tactical-layer reforms therefore produced the largest systemic returns.
5.2.3. Operational Layer: Service Efficiency and User Outcomes
Operational indicators evaluate whether institutional and coordination changes translated into measurable service improvements.
As shown in
Table 5, the operational-layer governance indicators capture changes in service efficiency, quality, and citizen outcomes over the period 2019–2023.
Statistical testing confirmed that reductions in processing time distributions were significant (Mann–Whitney U, p < 0.001), indicating that improvements are unlikely attributable to random variation.
Automation of routing, standardized data entry, and real-time validation rules reduced administrative rework and lowered variability in processing times. The decrease in standard deviation (8.7 → 4.2 days) suggests not only faster but more predictable service delivery.
Citizen satisfaction increased with a lag relative to efficiency gains, consistent with the adjustment of user expectations over time. Regression analysis indicates that status transparency and fewer office visits were the strongest predictors of perceived service quality.
System usage data reinforce these outcomes: portal sessions increased sevenfold, indicating behavioral adoption rather than nominal deployment.
Interpretation:
Operational improvements represent observable performance outcomes, demonstrating that institutional and coordination reforms translated into tangible benefits for both administrators and citizens.
5.2.4. Cross-Layer Comparison
Comparing magnitudes across layers highlights a clear sequence:
largest effects → tactical coordination
moderate effects → operational efficiency
enabling effects → strategic institutionalization
This ordering is theoretically consistent with the framework’s claim that governance architecture mediates digital impact.
Digital tools alone did not generate improvements; rather, strategic mandates enabled tactical integration, which subsequently produced operational efficiency gains.
5.2.5. Summary
Across all 16 indicators, every governance layer shows positive movement between 2019 and 2023. However, the distribution of effects demonstrates that gains were concentrated where coordination barriers were reduced.
The results therefore indicate that digitalization in urban planning operates primarily as an institutional and organizational transformation, with technology functioning as an enabling instrument rather than an independent driver of performance.
5.3. Governance Barriers and Persistent Constraints
While the preceding results demonstrate measurable improvements across all governance layers, digital transformation in Yerevan remained constrained by several persistent structural frictions. Identifying these residual barriers is analytically important, as they reveal where institutional limitations continue to moderate the effectiveness of digital tools.
Accordingly, the framework is applied diagnostically to assess not only performance gains but also remaining governance bottlenecks.
5.3.1. Strategic Layer: Political Cycles vs. Investment Horizons
Strategic commitment to digitalization increased substantially; however, implementation continuity remained vulnerable to political turnover.
Armenia’s municipal election cycle (five-year terms with mid-term leadership changes) creates temporal misalignment between the maturation period of digital investments (typically 3–5 years) and political accountability horizons (2–3 years). During 2019–2023, the mayor changed twice, and each transition was associated with delays of approximately 6–12 months as incoming leadership reassessed priorities.
This discontinuity is reflected quantitatively in incomplete policy execution. Although the Strategic Layer indicator policy–budget alignment reached 78% in 2023, approximately 22% of stated digital priorities remained unfunded, indicating partial institutional follow-through.
Framework implication:
Strategic mandates alone do not guarantee sustained implementation; governance stability and institutional safeguards are necessary to protect long-term digital investments from short-term political cycles.
5.3.2. Tactical Layer: Legacy Systems and Technical Debt
Despite substantial improvements in interoperability (27% → 66%), technical fragmentation persisted.
In 2023, 34% of departmental systems remained incompatible, largely concentrated in three units (Housing, Utilities, Land Cadastre) operating legacy databases without modern interfaces. Migrating these systems would require AMD 80–120 million and 12–18 months, exceeding available short-term resources.
Consequently, these departments relied on manual data exchange (PDF or spreadsheet exports) rather than live integration, reducing the effectiveness of shared digital infrastructure. Although the Data Steward Network mitigated some frictions through manual coordination, this approach increased labor intensity and introduced additional error risks.
Importantly, interoperability improvements were uneven: nine departments achieved compatibility above 85%, whereas three remained below 30%, producing a bimodal distribution.
Framework implication:
System-wide averages mask localized bottlenecks. Targeted modernization of lagging departments would likely generate higher marginal benefits than uniform investments.
5.3.3. Operational Layer: Informal Practices and Digital Workarounds
Operational indicators primarily capture formalized processes; however, informal administrative behavior persisted alongside digital workflows.
Despite mandatory digital routing introduced in 2022, approximately 12% of permit cases in 2023 bypassed standard procedures, reduced from 37% in 2020 but not eliminated. Evidence from expedited cases indicates that personal networks and verbal approvals occasionally preceded formal digital registration, with system entries completed retrospectively to generate audit trails.
These deviations reflect long-standing relationship-based governance norms and the need for discretionary judgment in complex or exceptional cases.
This dynamic also affects measurement. The recorded 8% administrative error rate may underestimate true irregularities when informal approvals occur outside validation protocols.
Framework implication:
Digital systems formalize procedures but do not automatically eliminate informal practices. Cultural and organizational norms remain critical determinants of compliance.
5.3.4. Inter-Layer Dynamics: Feedback Loop Delays
The framework emphasizes upward information flows from operational data to strategic decision-making; however, empirical timing analysis reveals substantial latency.
Permit system analytics identified that 67% of delays occurred during interdepartmental review, yet the institutional response unfolded gradually:
detection (Q3 2021)
escalation to strategic level (Q1 2022)
budget reallocation approval (Q4 2022)
deployment of coordination tools (Q2 2023)
The full cycle therefore spanned approximately 18 months.
Although relatively rapid by public-sector standards, this delay indicates that annual budgeting and reporting cycles structurally constrain responsiveness even when digital data are available in real time.
Consistent with this, citations of operational evidence in strategic decisions increased from 4 (2019) to 19 (2023), indicating improvement but not yet continuous feedback.
Framework implication:
Digital visibility improves problem detection but does not eliminate bureaucratic temporal constraints.
5.3.5. Capacity Constraints: Human Capital as a Limiting Factor
Technical infrastructure expansion outpaced human adoption capacity.
Following initial GIS training (64 staff), only 41% reported weekly usage, suggesting limited behavioral change. After workflow-integrated training and mandatory use policies, adoption increased to 68%.
This pattern indicates that technical skills alone were insufficient; institutional incentives and procedural requirements were also necessary.
Despite progress, 32% of planning decisions in 2023 still bypassed GIS tools, indicating remaining organizational or cultural barriers beyond technical capability.
Framework implication:
Digital maturity depends jointly on technology, skills, and institutional enforcement. Weakness in any dimension constrains realized benefits.
5.3.6. Diagnostic Synthesis
Across all layers, residual constraints arise predominantly from institutional rather than technological limitations:
strategic discontinuity due to political cycles
tactical fragmentation from legacy technical debt
operational informality
delayed cross-layer responsiveness
uneven human capacity
These findings reinforce the central theoretical claim that digitalization is fundamentally a governance transformation problem. Technology provides enabling infrastructure, but institutional design determines realized performance.
By systematically identifying these bottlenecks, the framework functions not only as an evaluative instrument but also as a practical diagnostic tool for prioritizing future reforms.
5.4. Framework-Validated Improvements and Measured Outcomes
Synthesizing the indicator analysis across all governance layers reveals a
system-wide transformation in institutional performance between 2019 and 2023. To facilitate direct comparison of effect magnitudes,
Table 6 consolidates the complete set of 16 indicators, reporting baseline values, post-digitalization outcomes, and proportional changes.
Yerevan thus exhibits consistent positive movement across strategic commitment, coordination capacity, and operational service delivery.
5.4.1. Quantified Governance Outcomes (2019–2023)
As summarized in
Table 6, improvements are observable at every governance layer, though their magnitude varies.
The consolidated indicators reported in
Table 6 illustrate a consistent upward trend across all governance layers between 2019 and 2023. In particular, the most pronounced improvements occur in tactical coordination indicators and operational service performance, highlighting the central role of institutional integration in driving digitalization outcomes.
At the strategic layer, digitalization became institutionalized rather than symbolic.
Policy integration increased by +383%, digital budget allocation by +164%, and policy–budget alignment by +90%. Annual digital investment rose from AMD 143M to AMD 487M, reflecting both nominal (+240%) and real (+340%) growth. These changes indicate strengthened institutional commitment and resource backing.
At the tactical layer, the largest proportional gains were recorded.
Interdepartmental coordination frequency rose +539%, shared GIS infrastructure expanded +800%, interoperability improved +144%, and multi-departmental projects increased +189%. These shifts suggest that coordination barriers—rather than technological scarcity—were the primary pre-digitalization constraint.
At the operational layer, these institutional changes translated into measurable service improvements.
Permit processing times fell 37%, administrative errors declined 65%, citizen satisfaction rose 48%, and public portal usage increased 606%, demonstrating both efficiency gains and behavioral adoption.
Inter-layer indicators confirm strengthening systemic integration.
Strategic decisions citing operational evidence increased +375%, implementation rates of mandates rose +115%, and complex multi-departmental projects were completed 40% faster.
Finally, GIS utilization in planning decisions increased from 18% to 68% (+280%), serving as a composite measure of overall digital maturity.
Collectively, these results indicate that digitalization effects were not isolated but structural and cross-layer, consistent with the framework’s multi-level governance logic.
5.4.2. Cost–Benefit Analysis
Beyond institutional indicators, the economic implications of digitalization were assessed through conservative cost–benefit estimation.
Total cumulative digital investment for 2019–2023 amounted to AMD 1.47 billion (~$3.67M USD).
Measured annual efficiency gains include:
Permit processing time savings: ≈ AMD 867M/year
Error reduction savings: ≈ AMD 270M/year
Coordination efficiency savings: ≈ AMD 30.4M/year
Total direct annual savings therefore equal approximately AMD 1.167 billion (~$2.91M USD).
These savings exceed the annual digital budget (AMD 487M) by roughly 140%, implying break-even within approximately 1.5 years and sustained positive returns thereafter.
Importantly, these calculations include only directly quantifiable administrative efficiencies. Intangible benefits—improved transparency, citizen trust, and reduced corruption risk—are not monetized, suggesting that the reported ROI likely understates total societal gains.
5.4.3. Governance Mechanisms Driving Outcomes
Indicator improvements alone do not explain causality. Mechanism tracing reveals three institutional pathways through which governance restructuring amplified digital impact.
Mechanism 1: Data visibility triggering strategic reallocation
Operational dashboards exposed interdepartmental bottlenecks, prompting targeted budget shifts toward coordination tools, which subsequently reduced project delays.
Mechanism 2: Horizontal peer networks reducing transaction costs
The Data Steward Network enabled direct cross-departmental problem-solving, accelerating interoperability and expanding shared datasets sixfold.
Mechanism 3: Mandatory digital workflows institutionalizing accountability
Digital-only processing reduced informal bypasses (37% → 12%), strengthened auditability, and corresponded with significant declines in administrative errors.
Together, these mechanisms demonstrate that technology functioned as an enabler, while institutional design determined realized performance gains. Improvements emerged from governance restructuring rather than from technological deployment alone.
5.4.4. Synthesis
Taken together, the results confirm that digitalization in urban planning operates primarily as an organizational and governance transformation process. The most substantial gains occurred where coordination frictions were reduced, and measurable operational improvements followed institutional alignment.
The convergence of indicator trends, economic returns, and mechanism evidence therefore provides strong empirical support for the framework’s central proposition: governance architecture mediates digital effectiveness.
5.5. Framework Validation and Transferability
5.5.1. Framework Validity: Explanatory and Predictive Capacity
The empirical findings provide multiple forms of validation for the proposed governance framework, demonstrating both explanatory and predictive capacity.
First, the framework proved diagnostically effective in identifying coordination as the primary bottleneck in Yerevan’s digitalization trajectory. The most substantial improvements occurred precisely at the tactical layer, where interdepartmental meeting frequency increased by 539% and shared GIS infrastructure expanded eightfold, subsequently enabling system-wide operational gains. This alignment between theoretical expectations and observed outcomes supports the framework’s explanatory logic.
Second, the framework demonstrated predictive validity. It anticipated that strategic mandates would not translate into performance improvements without corresponding tactical capacity. This prediction was empirically confirmed: early GIS training initiatives in 2021 produced limited operational adoption until additional coordination mechanisms and workflow integration were introduced in 2022–2023.
Third, comparative consistency further strengthens validity. Similar coordination failures have been documented in Songdo, where advanced technological infrastructure did not yield proportional governance improvements due to departmental fragmentation. The framework correctly explains this pattern by emphasizing institutional alignment rather than technological sophistication alone.
Finally, mechanism tracing confirms the presence of the framework’s hypothesized feedback loops. Upward information flows (operational dashboards informing strategic decisions), downward implementation (budget allocations supporting mandates), and horizontal coordination (peer networks across departments) were all empirically observed.
Taken together, these results indicate that the framework not only describes governance dynamics but also reliably anticipates where digitalization efforts are likely to succeed or stall.
5.5.2. Transferability: Implications for Other Urban Contexts
Beyond the Yerevan case, the framework offers actionable insights for broader application.
For transition economy cities, the evidence suggests that tactical-layer capacity building should precede large-scale technological deployment. Yerevan’s low-cost Data Steward Network and phased coordination mechanisms delivered disproportionate benefits relative to financial investment, indicating that organizational integration may yield higher returns than immediate infrastructure expansion. Sequencing reforms—strategic mandates followed by tactical coordination and only then operational rollout—appears more effective than simultaneous “big bang” digitalization.
For better-resourced cities, the findings caution against overreliance on technological sophistication. The comparison with Songdo illustrates that high spending does not automatically translate into governance effectiveness. Investments in coordination structures, interoperability standards, and institutional accountability mechanisms may be more consequential than additional sensors or platforms.
At the framework level, transferability requires contextual adaptation. While the indicator architecture provides a structured template, specific metrics and thresholds should reflect local administrative realities. Moreover, quantitative indicators may benefit from complementary qualitative methods to capture informal practices that are not fully observable in administrative datasets.
5.5.3. Framework Limitations Revealed by Application
Applying the framework to Yerevan also exposed areas for refinement.
First, temporal dynamics are insufficiently modeled. Although digital systems enable real-time data collection, institutional responses remain constrained by annual budgeting and reporting cycles, producing observed delays of up to 18 months between problem detection and intervention. Future iterations should therefore incorporate explicit dynamic or longitudinal components.
Second, informal governance practices are only partially captured. Indicators primarily measure formal procedures, yet persistent informal behaviors—observed in approximately 12% of permit cases—suggest the need for additional measures addressing “shadow” administrative processes.
Third, political economy factors remain underrepresented. Leadership transitions and shifting priorities significantly influenced investment continuity, indicating that governance stability is a critical determinant of digitalization success beyond purely technocratic considerations.
Finally, causal inference remains limited by the observational single-case design. While converging indicators and mechanism tracing strengthen plausibility, future research should employ multi-city comparisons or quasi-experimental designs to isolate governance effects more rigorously.
Recognizing these limitations enhances, rather than weakens, the framework’s credibility by clarifying its scope and boundary conditions.
5.5.4. Comparative Positioning in the Global Context
To contextualize performance, Yerevan’s outcomes were benchmarked against selected international cases (
Table 7).
As shown in
Table 7, the comparative urban digital governance indicators position Yerevan relative to international benchmarks in 2023.
Across most indicators, Yerevan substantially outperforms transition-economy averages and approaches mid-tier European benchmarks. In several dimensions, including citizen satisfaction and interoperability, performance is comparable to Barcelona. Although still below best-practice leaders such as Singapore, Yerevan achieved these outcomes with significantly lower fiscal expenditure.
Notably, Yerevan surpassed Songdo despite approximately half the digital budget share, reinforcing the framework’s central thesis that governance efficiency matters more than absolute spending levels.
This trajectory suggests that transition cities can approach OECD-level performance within a relatively short timeframe when governance restructuring accompanies digital investment, challenging assumptions that successful digital transformation necessarily requires large-scale or long-duration programs.
5.6. Synthesis: Empirical Validation of Framework Propositions
Taken together, the Yerevan case provides convergent empirical evidence supporting the framework’s core theoretical propositions. Rather than functioning solely as a descriptive classification scheme, the framework demonstrates explanatory, predictive, and evaluative utility across governance layers.
First, the findings confirm that digital tool effectiveness depends fundamentally on governance architecture alignment. The most pronounced gains in digital utilization did not follow increases in technological sophistication alone, but coincided with institutional restructuring. GIS-supported planning decisions increased by 280% (18% → 68%) during the same period in which coordination frequency rose by 539% and shared datasets expanded eightfold. This temporal co-movement suggests that organizational integration—rather than technology deployment per se—was the primary driver of digital adoption.
Second, the evidence substantiates the proposition that the tactical layer constitutes the critical bottleneck in transition economies. Among all indicators, tactical metrics exhibited the largest proportional improvements, and relatively modest investments—such as the data steward network and coordination platforms—produced disproportionate system-wide effects. This pattern indicates that resolving interdepartmental fragmentation yields higher marginal returns than additional infrastructure spending, highlighting coordination capacity as the leverage point for reform.
Third, the case demonstrates that feedback loops between governance layers shape systemic outcomes through recursive causality. Operational analytics identifying permit bottlenecks informed strategic budget reallocations (AMD 180 million), which enabled tactical coordination tools that subsequently reduced processing times (18.2 → 11.4 days). This sequence illustrates how information flows upward while resources and mandates flow downward, creating mutually reinforcing adjustments across levels. Such dynamics align closely with the framework’s hypothesized inter-layer interactions.
Fourth, the framework’s indicator architecture proved diagnostically useful. The same metrics that captured performance improvements also identified persistent weaknesses, including 34% residual system incompatibility and 12% informal workflow deviations. This dual evaluative–diagnostic capacity demonstrates that the indicators function not merely as outcome measures but as instruments for guiding policy prioritization.
Finally, the cost–benefit assessment supports the proposition that governance restructuring can yield cost-effective outcomes. Annual efficiency savings (AMD 1.167 billion) exceeded annual digital expenditures (AMD 487 million) by approximately 140%, while per capita spending remained substantially below OECD benchmarks. These results suggest that institutional alignment enhances not only effectiveness but also fiscal efficiency, challenging assumptions that digital transformation necessarily requires large-scale financial outlays.
Collectively, these findings provide robust empirical support for the framework’s central thesis: digitalization in urban planning is primarily a governance transformation process in which technology acts as an enabling mechanism, while institutional design determines realized performance gains. The convergence of quantitative indicators, mechanism tracing, and economic evaluation therefore validates the framework as both an explanatory model and a practical tool for reform design.
6. Discussion
The Yerevan case offers evidence that the effectiveness of digital tools in urban planning depends less on technology sophistication or investment scale and more on governance alignment. Importantly, the results also demonstrate that governance alignment can generate measurable economic returns: the cost–benefit assessment indicates that annual administrative efficiency gains exceeded annual digital expenditures, suggesting that institutional coordination reforms may deliver high fiscal returns even in resource-constrained municipal systems. With comparatively modest per capita spending, the city achieved large improvements in GIS utilization, service efficiency, and citizen satisfaction, while technology-intensive smart-city efforts elsewhere have documented weaker outcomes when departmental fragmentation and interoperability failures persist. This divergence supports the study’s central claim: the evidence suggests that digitalization tends to become performance-relevant when embedded within coordinated institutional architectures.
6.1. Theoretical Contributions
This study contributes to the intersection of digital government and multi-level urban governance in three ways. First, it advances a governance-primacy interpretation of digital transformation. The Yerevan trajectory indicates that the same digital infrastructure can remain weakly utilized until governance barriers are removed: adoption accelerated once coordination mechanisms, standardization routines, and strategic-to-tactical alignment were strengthened. This reframes digitalization from a technology-adoption ladder to an organizational transformation process in which institutional design conditions realized outcomes.
Second, the results substantiate the tactical layer as a binding constraint in transition contexts. Across indicators, the largest proportional changes occurred in coordination intensity and shared data infrastructure, and these tactical shifts preceded or enabled operational gains. The evidence is consistent with a sequencing logic in which strategic mandates require tactical capacity to become executable, and tactical integration reduces the transaction costs that otherwise prevent operational tools from scaling (A marginal-returns allocation table is reported in
Supplementary Material S2).
Third, the study operationalizes multi-level governance as a measurable diagnostic instrument. By translating governance functions into 16 indicators distributed across strategic, tactical, operational, and inter-layer linkages, the framework enables longitudinal tracking and cross-city benchmarking while retaining interpretability (i.e., identifying where governance fails, not just whether it is “mature”). This addresses a recurring limitation in smart-city maturity indices and composite rankings, which often obscure layer-specific bottlenecks.
Despite the significant performance improvements observed, digital governance reforms may also generate unintended institutional consequences. Platform standardisation can sometimes introduce new forms of bureaucratic rigidity, as standardized digital workflows may reduce procedural flexibility and slow adaptation to exceptional cases. Similarly, heavy reliance on specific software architectures may create technological lock-in, limiting future system interoperability or increasing long-term dependency on particular vendors. Digital platforms may also concentrate informational power within units responsible for data management and system administration, potentially reshaping internal power dynamics within municipal organizations. Finally, the increasing use of standardized digital procedures and decision-support systems may partially constrain professional discretion, particularly when automated validation rules or algorithmic recommendations substitute for expert judgement. Recognizing these potential risks does not negate the benefits of digital governance, but it highlights the importance of designing digital systems that maintain institutional flexibility, transparency, and professional accountability.
6.2. Policy and Managerial Implications
The findings imply that resource-constrained cities can achieve substantial digitalization outcomes when they prioritize low-cost coordination and standardization before costly technology upgrades. Interdepartmental data stewardship, shared protocols, and structured working groups are particularly high-leverage mechanisms because they unlock cross-departmental data reuse and reduce coordination delays that would otherwise neutralize technology benefits. For implementation guidance and a stepwise template, see
Supplementary Material S1.
For better-resourced cities, the case cautions that advanced technology portfolios do not compensate for fragmented governance. Procurement strategies should therefore be preceded by governance interoperability requirements (shared standards, integration mandates, and accountability routines) to avoid costly retrofitting and persistent data silos. A practical implication is that cities should assess governance readiness—interoperability, coordination frequency, and policy-budget alignment—before scaling large-platform or vendor-led solutions. While the indicator framework provides a structured way to evaluate governance dynamics, individual metrics should be interpreted as operational proxies rather than definitive measures of governance quality. For example, an increase in interdepartmental meetings may signal improved coordination opportunities but does not necessarily guarantee effective decision-making outcomes. Similarly, the presence of shared GIS layers indicates progress in technical interoperability but does not automatically imply deep institutional integration. Measures such as portal activity or citizen satisfaction surveys may also reflect compliance or administrative visibility rather than substantive improvements in public value. For this reason, the indicators are interpreted in combination with institutional context and qualitative evidence rather than as standalone measures of governance effectiveness.
While the framework is validated in a transition-economy context, governance mechanisms may operate differently in cities with mature administrative systems or in federal governance environments. In highly institutionalized municipal systems, digitalization may evolve through incremental optimization of existing administrative routines rather than through structural coordination reforms. Conversely, in federal governance systems where authority is distributed across multiple government levels, digital planning initiatives may face additional coordination challenges between municipal, regional, and national institutions. In such contexts, interoperability standards, intergovernmental data-sharing agreements, and regulatory harmonization may become more critical than intra-municipal coordination mechanisms observed in Yerevan.
6.3. Limitations and Future Research
This study remains limited by its single-case design and observational inference. While temporal sequencing, triangulation, and mechanism tracing strengthen plausibility, causal attribution may still be confounded by leadership changes, external shocks, and learning effects. Future research should apply the framework to multiple cities and incorporate quasi-experimental approaches where phased rollouts or budget thresholds create identification opportunities (
Supplementary Material S3). Additionally, formal indicators may under-capture informal governance practices, suggesting value in combining the indicator framework with interviews or ethnographic observation to better represent shadow coordination and workarounds. The findings should therefore be interpreted as analytical rather than statistical generalization, highlighting governance mechanisms that may operate under comparable institutional conditions.
An additional avenue for future research concerns the use of disaggregated administrative data. While the present study focuses on system-level indicators and aggregate governance outcomes, the underlying datasets contain detailed information that could support more granular analysis. Future studies could examine variation across municipal departments, differences in digitalization outcomes by project type, or distributional effects within administrative processes rather than relying solely on average indicators. Such analyses could provide deeper insights into how digital governance reforms affect different organizational units and service categories within municipal systems.
Overall, the evidence supports a governance-centered understanding of urban digitalization: technology enables new capabilities, but institutional alignment determines whether those capabilities translate into sustained improvements in planning performance.
Another important methodological limitation concerns the correlational nature of the empirical evidence. Although the longitudinal indicator analysis and mechanism tracing provide strong suggestive evidence linking governance reforms to performance improvements, the study does not employ quasi-experimental identification strategies. Future research could strengthen causal inference by exploiting natural policy variation across cities, applying synthetic control methods, difference-in-differences designs, or agent-based simulation models to examine inter-layer governance dynamics.
While the empirical evaluation in this study focuses primarily on measurable administrative efficiency outcomes—such as processing time reductions, error rate declines, and increased digital tool utilization—digital governance reforms may also have broader institutional and societal implications. In particular, digital transformation initiatives can influence patterns of access to public services, potentially reinforcing or mitigating digital divide effects across different population groups. In addition, the introduction of centralized data platforms and digital coordination systems may reshape internal power relations within administrative organizations by concentrating informational authority in specific units responsible for data management and system governance. Finally, digital planning systems raise important questions regarding political accountability, transparency, and democratic oversight, especially when algorithmic or platform-based decision-support tools influence public policy processes. These broader governance dimensions highlight the importance of complementing efficiency-oriented indicators with future research examining equity, institutional power dynamics, and democratic governance implications.
While the present study is based on a single-case analysis of Yerevan, the proposed multi-layer governance framework is not intended to be context-specific. Rather, it is designed as an analytically transferable model that can be adapted to diverse urban environments.
In developed cities, where digital infrastructures and institutional capacities are more advanced, the framework may serve as a tool for optimization and integration of existing systems. In contrast, in developing and transition contexts, it can support capacity-building, institutional alignment, and the gradual digital transformation of urban governance processes.
Future research could apply and empirically validate the framework across different cities and regions, enabling comparative analysis and refinement of its components under varying socio-economic and institutional conditions.
7. Conclusions
This study developed and validated a multi-layer governance framework for understanding digitalization in urban planning, emphasizing the interaction between strategic direction, tactical coordination, and operational delivery. Applying the framework to Yerevan (2019–2023) showed that measurable improvements in digital tool utilization, service efficiency, transparency, and citizen satisfaction coincided primarily with changes in governance alignment—coordination mechanisms, data standardization, and strengthened inter-layer feedback—rather than with technology sophistication alone.
The study contributes a governance-primacy perspective that reframes digital transformation as institutional redesign. It further demonstrates that the tactical layer can function as the key leverage point in transition contexts: when coordination infrastructure and interoperability improve, strategic mandates become executable and operational tools scale more effectively. By translating multi-level governance into a replicable set of indicators, the framework also provides a practical diagnostic instrument for benchmarking and reform design.
For policymakers, the central implication is that effective digitalization should begin with governance readiness and coordination capacity, not procurement. Resource-constrained cities can therefore pursue high-impact reforms through low-cost institutional mechanisms that unlock cross-departmental integration and reduce coordination frictions. Future studies should extend the framework across multiple cities, strengthen causal inference through quasi-experimental designs, and incorporate methods that capture informal governance dynamics.