Article

Sex Differentials in Eating Disorder Risk—Interaction with Adherence to International Physical Activity Guidelines: A Cross-Sectional Study


1
Section of Anatomy, Histology and Movement Science, Department of Biomedical and Biotechnological Sciences, School of Medicine, University of Catania, Via S. Sofia n°97, 95123 Catania, Italy
2
Research Center on Motor Activities (CRAM), University of Catania, Via S. Sofia n°97, 95123 Catania, Italy
*
Authors to whom correspondence should be addressed.
Submission received: 10 February 2026 / Revised: 25 March 2026 / Accepted: 31 March 2026 / Published: 2 April 2026

Abstract

Background: This study investigated the relationship between weekly structured physical exercise (PE) volume and type and the risk of eating disorders (EDs), with particular attention to age and sex differences. Methods: A total of 417 healthy adults (mean weekly PE: 256.19 ± 133.03 min) completed a self-report questionnaire covering personal information, weekly PE characteristics, and the Eating Attitudes Test-26 (EAT-26). Binary logistic regression was performed with the EAT-26 score as the dependent variable and PE volume, exercise type, age, and sex set as predictors. Results: The results of the binary logistic regression model were statistically significant (χ2 = 16.784, p = 0.003). Sex emerged as the strongest independent predictor of ED risk (p = 0.003). Cross-tabulation confirmed a significant sex disparity, with females showing a threefold higher prevalence of at-risk EAT-26 scores (17.6%) compared to males (5.2%). No significant correlation was found between EAT-26 score and PE volume, nor were significant differences in ED risk observed across different types of structured exercise. Conclusions: When controlling for age, neither exercise volume nor type serves as a direct linear predictor of ED risk. Sex remains the strongest demographic predictor.

1. Introduction

The World Health Organization and the American College of Sports Medicine (ACSM) recommend that adults aged 18–64 engage in 150 to 300 min of moderate-intensity aerobic activity per week or 75 to 150 min of vigorous-intensity aerobic activity per week [1,2]. These guidelines, like many others related to exercise prescription, are derived from a solid foundation of original studies demonstrating that these volumes of physical exercise (PE) with these characteristics are necessary to achieve well-documented benefits, including reduced mortality and morbidity risks [2,3].
PE is defined as a planned, structured, repetitive, and purposive activity that has the aim to improve physical fitness and biomarkers related to chronic diseases when it meets the appropriate frequency, intensity, time, and type (FITT) characteristics. While the effects of a sedentary lifestyle on health are well-supported by scientific evidence [4,5,6], there is limited scientific consensus investigating what happens when adults engage in PE exceeding these guidelines’ recommendations and become a dependent.
Exercise dependence, which can be described as compulsive involvement in physical activity or exercise [7], can involve exercising excessively to the point of damaging personal, social, and professional well-being and causing several health problems, such as eating disorders (EDs) [7,8]. Exercise dependence is not classified as a behavioral addiction in the Diagnostic and Statistical Manual of Mental Disorders, 5th edition, because debate on its definition, characterization, and assessment is still ongoing.
A core feature of most eating disorders is body image distortion, which significantly impacts self-perception and behaviors relating to food and weight. This distortion extends beyond eating habits to also influence attitudes toward PE [9]. Indeed, exercise can become compulsive and dysfunctional, representing both a risk factor and a symptom of the disorder [10]. Athletes in disciplines that emphasize leanness or weight categories, such as artistic gymnastics, figure skating, synchronized swimming, or competitive bodybuilding, often observe performance enhancements following weight loss [11]. In weight-category sports, rules for weigh-ins often impose rapid weight-loss regimens in the weeks before competition. In esthetic sports, athletes are judged on both technical skill and physical appearance, creating distinct “body paradigms” that increase pressure to achieve specific physical ideals [12]. When combined with other factors, these behaviors increase the risk of developing EDs and unsustainable training practices, leading to a condition known as low energy availability [13].
In highly esthetics-focused environments like dance, rhythmic gymnastics, synchronized swimming, or certain fitness disciplines, athletes may exhibit greater body dissatisfaction, lower self-esteem, and a heightened vulnerability to eating disorders. The socio-cultural context, including dominant esthetic ideals and pressure for physical results, significantly shapes body image, creating a complex relationship between exercise and body perception [14]. Conversely, when performed regularly, moderately, and as part of a balanced lifestyle, exercise plays a protective role: it promotes psychophysical well-being, contributes to a more realistic body perception, reduces anxiety and depression, and improves quality of life [15,16].
Other moderating factors include the type of discipline, competitive level, and age. Team sports, for instance, generally foster a healthier body image than esthetic sports, while individually practiced or organized activities, such as gym classes, can boost self-confidence but also increase focus on physical appearance, with potential negative consequences for body image. Furthermore, a significant data point out the role of exercise in body image management: exercise aimed at weight loss ranked in the top three of the ACSM’s Worldwide Fitness Trends 2026 among amateur and professional athletes [17]. Although the association between exercise dependence and ED is well-established in athletes [18], no observational study has examined the impact of “excessive physical exercise” on the risk of developing eating disorders in amateur adult athletes, investigating possible sex differences and differences between activities practiced at a higher volume than that suggested by the ACSM guidelines [19]. While more frequently diagnosed in women, these disorders are also present in men, albeit with notable sex differences [20]. Therefore, the relationship between physical exercise, body perception, and EDs appears complex, dynamic, and bidirectional, necessitating an approach that considers both physical and psychological aspects.
For these reasons, it is crucial to investigate exercise’s potential role in both the prevention and treatment of EDs. Current research has explored the inclusion of structured exercise protocols in multidisciplinary treatments for EDs, highlighting benefits for mood, therapeutic adherence, body image perception, and interoception while also acknowledging the potential risks linked to its compulsive or improper use. However, PE is not yet a standard component of official treatment guidelines, partly due to its dual and contrasting nature. Furthermore, the available literature has not yet clearly defined the specific characteristics of exercise interventions, and most studies have involved almost exclusively female athletic populations, neglecting males and amateur athletes.
Given these premises, this observational study aimed to investigate the relationship between weekly PE volume and ED risk in healthy, active adults, with particular attention to age, sex differences, volume of PE, and type of PE [17].

2. Materials and Methods

2.1. Study Design

This study employed a cross-sectional design using a self-administered online questionnaire, created and distributed via Google Forms, including two standardized tools to evaluate physical activity and ED predisposition. Participants were provided with detailed information about the research aims, and they provided informed consent for the anonymous use of their data before starting to complete the questionnaire. Participation was voluntary, anonymous, and uncompensated. Participants retained the right to withdraw at any point without penalty. The study followed the Declaration of Helsinki and was approved by the Scientific Committee of the ‘Research Center on Motor Activities’ at the University of Catania (Catania, Italy), protocol CRAM-61-2024, date of approval 17 July 2024.

2.2. Participants

A convenience sampling method was used to recruit participants, targeting gym members, fitness instructors, and athletes. The invitation to participate was disseminated through social media platforms, mailing lists, and direct contact within sports centers.
The inclusion criteria were age between 18 and 64 years, engagement in at least one weekly session of moderate to vigorous structured PE (individual sports, team sports, group fitness classes, weightlifting, and high-intensity functional training), not having any chronic illnesses or known eating disorder diagnoses, willingness to complete the online questionnaire, and provision of informed consent. Inconsistency between two or more answers was considered grounds for exclusion (e.g., reporting a team sport as the primary exercise context but indicating 0 min of training per week). Incomplete questionnaires or those from individuals not meeting the inclusion criteria were excluded from the analysis.

2.3. Self-Administered Questionnaire

The questionnaire was developed in Italian and structured into distinct sections. An introductory page detailed the study objectives, provided contact information for the principal researcher, and outlined data handling procedures to ensure confidentiality and anonymity were maintained.
The first section included questions about anthropometric data, the FITT information of the structured PE practiced by the participants, and the participants’ relationships to exercise and nutrition (Table 1).
The last two parts of the questionnaire included the International Physical Activity Questionnaire (IPAQ) and the Eating Attitudes Test-26 (EAT-26), two standardized tools for evaluating physical activity levels and eating behaviors, respectively.

2.4. IPAQ

The IPAQ is an international instrument developed to measure weekly physical activity across different domains of daily life, including light, moderate-, and vigorous-intensity activities, as well as time spent walking and sedentary [21]. The collected data enables the calculation of weekly MET-minutes, providing a quantitative estimate of participants’ physical activity levels. This tool allowed for the classification of subjects into activity categories (low, moderate, high). The IPAQ was administered in Italian following its validation and assessment in an Italian sample [22].
The long version was used and comprises 27 items regarding physical activity, structured to evaluate five distinct behavioral domains:
  • Occupational physical activity;
  • Transportation-related physical activity;
  • Domestic and gardening activities, alongside caring for family members;
  • Recreational, sporting, and leisure-time physical activity;
  • Sedentary behavior, quantified as time spent sitting.
Within the questionnaire, data concerning physical activity are quantified in terms of minutes per day and/or days per week. MET-minutes per week were calculated according to the official IPAQ scoring protocol [21]. Table 2 shows the details of the 27 items and answer options. The IPAQ was administered to obtain a descriptive picture of the sample.

2.5. EAT-26

The EAT-26 is an internationally validated screening tool for identifying dysfunctional eating attitudes and behaviors. It consists of 26 items rated on a Likert scale and is used to identify individuals at risk for eating disorders [23]. The generally accepted cut-off score is 20, above which the presence of disordered eating attitudes is suspected. The EAT-26 assesses various dimensions, including dieting, bulimia, food preoccupation, and oral control sections. For our study, the validated Italian version was used [24]. For each question, there were 6 response options: 0—never; 1—sometimes, rarely; 2—seldom; 3—sometimes; 4—often; 5—usually; 6—always. The expected score was 0 for the responses never, sometimes, rarely; 1 for often; 2 for usually, and 3 for always. The final score is given by the sum of all scores. Table 3 shows the details of the 26 items.

2.6. Statistical Analysis

Statistical Analysis was performed using the SPSS® (IBM®, Chicago, IL, USA) version 29.0.2.0 software and Jamovi (jamovi project, 2022, Version 2.3, Sydney, Australia). Preliminary data screening included checks for missing values, outliers, and violations of statistical assumptions. Continuous variables were assessed for normality using Shapiro–Wilk tests.
The EAT-26 total score was computed along with its three subscales: dieting, bulimia, food preoccupation, and oral control. Participants scoring ≥20 on the EAT-26 were considered at risk for eating disorders. Physical activity levels from the IPAQ were calculated as MET-minutes per week. Specifically, for each domain (work, transportation, domestic, and leisure time), the duration (minutes) and frequency (days) of vigorous-intensity (8.0 METs), moderate-intensity (4.0 METs), and walking (3.3 METs) activities were multiplied by their respective MET coefficients. These values were summed to obtain the total weekly physical activity volume (MET-min/week). The MET values were derived from the Guidelines for Data Processing and Analysis of the IPAQ as follows [25]:
Walking MET-minutes/week = 3.3 ∗ walking minutes ∗ walking days;
Moderate MET-minutes/week = 4.0 ∗ moderate-intensity activity minutes ∗ moderate days;
Vigorous MET-minutes/week = 8.0 ∗ vigorous-intensity activity minutes ∗ vigorous-intensity days;
Total MET-min/week = (Walk METs ∗ min ∗ days) + (Mod METs ∗ min ∗ days) + Vig METs ∗ min ∗ days).
The weekly average MET-minutes derived from the IPAQ results were considered a descriptive variable for the sample.
The inferential analysis focused on weekly PE minutes as the main outcome of interest. Weekly PE minutes were calculated by multiplying the training frequency (days/week), the answer to the sixth question, “ how many days per week do you train?”, by the session duration (minutes/session), the answer to the seventh question, “what is the duration of each training session?”.
PE= day/week ∗ minute/session
PE sessions were recorded separately for each activity type: individual sports, team sports, group fitness classes, weightlifting, and high-intensity functional training.
Descriptive statistics included means and standard deviations (SDs) or median and interquartile ranges (IQRs) for continuous variables and frequencies and percentages for categorical variables. Group differences were analyzed using independent t-tests or Mann–Whitney U tests for continuous variables and chi-square tests for categorical variables.
Bivariate relationships between EAT-26 scores and PE, BMI, and age were examined using Pearson or Spearman correlations based on data distribution.
Differences in eating disorder risk across exercise modalities were analyzed using one-way ANOVA or Kruskal–Wallis tests, followed by post hoc comparisons with Bonferroni correction. Binary logistic regression was used to identify predictors of EAT-26 ≥ 20, reporting odds ratios (ORs) with 95% confidence intervals (CIs). PE (>300 vs. <300) (minutes/week), type of exercise (categorical predictor), age (continuous, as a covariate), and sex were set as predictors.
To test the interaction between sex and adherence to the international guidelines [1,2], a product term (sex_x_exacsmguideline) was computed and included in the model. The EAT-26 total score was computed, and participants scoring ≥20 were classified as at risk for an ED, generating a dichotomous outcome variable (EATrisk: 0 = no risk, 1 = at risk). Based on the international guideline [1,2] threshold of 300 min per week of moderate-to-vigorous physical activity, a dichotomous variable was created to identify participants exceeding this recommendation (ex_acsmguideline: 0 = ≤300 min/week, 1 = >300 min/week). Sex was coded as a dummy variable (sex_dummy: 0 = male, 1 = female).
Model fit was assessed using the “Omnibus Test of Model Coefficients” and the “Hosmer-Lemeshow goodness-of-fit” test.
Effect sizes were reported using Cohen’s d for group comparisons, eta-squared for ANOVA, and R2 for regression models. Statistical significance was set at p < 0.05 (two-tailed) for all analyses. To determine a statistically significant association between EAT-26 scores and characteristics of physical activity practitioners and athletes, a sample size of 264 subjects was calculated based on an expected odds ratio of 2.0 with 80% power at a 0.05 significance level [26,27].

3. Results

In total, 420 people completed the questionnaire; however, 2 people did not provide their consent and were therefore excluded from the study. Thus, 417 participants (age 30.90 ± 12.02 years) were included in the data analyses (n = 244 (58.5%) female; n = 173 (41.5%) male). The sample had an average BMI of 23.38 ± 3.29 and reported 256.19 ± 133.03 min a week of structured exercise with a frequency of 3.35 ± 1.31 days a week. Given the considerable variability (no continuous variables were normally distributed; Shapiro–Wilk tests p < 0.005), Table 4 summarizes the descriptive statistics of sample characteristics divided by sex, by reporting both means with SDs and medians with IQRs.
Given the non-normal distribution of the considered continuous variables (Shapiro–Wilk test, p < 0.05), Spearman’s rank correlation coefficient (ρ) was used. Correlational analysis revealed no significant correlation between EAT-26 scores (mean = 9.67 ± 11.64) and weekly PE (ρ = −0.042, p = 0.392), or BMI (ρ = −0.058, p = 0.238), or age (ρ = −0.015, p = 0.760).
Cross-tabulation with Chi-square tests identified a significant (χ2 = 14.307, p < 0.001) sex difference in eating disorder risk. While 12.5% (n = 52) of the total sample scored above the EAT-26 clinical cut-off, this risk was higher among females (17.6%, n = 43) compared to males (5.2%, n = 9). These results were confirmed by the independent t-test between the two sex groups in the EAT-26 score (male: 7.04 ± 6.64, female: 11.54 ± 13.87; t(415) = 3.96, p < 0.001, partial η2 = 0.6). Table 5 shows the distribution of eating disorder risk based on EAT-26 scores across participants, highlighting sex differences and weekly PE.
Table S1 (Supplementary Materials) presents the mean scores for each EAT-26 item stratified by sex and by eating disorder risk status, along with inferential statistics and effect sizes. Significant sex differences were observed for 12 items. Females scored higher than males on items related to weight preoccupation (Item 1: t = 4.28, p < 0.001, η2 = 0.042), guilt after eating (Item 10: t = 4.64, p < 0.001, η2 = 0.049), desire for thinness (Item 11: t = 3.75, p < 0.001, η2 = 0.033), compensatory exercise (Item 12: t = 2.99, p = 0.003, η2 = 0.021), and dieting behaviors (Item 23: U = 18,212, p = 0.012, η2 = 0.015), among others. Effect sizes for these comparisons ranged from small to moderate (η2 between 0.010 and 0.049).
When comparing at-risk (EAT-26 ≥ 20) versus not-at-risk participants, all 25 items (1–25) showed significantly higher scores in the at-risk group (all p < 0.001). The largest effect sizes were observed for items assessing guilt after eating (Item 10: t = 10.29, p < 0.001, η2 = 0.203), desire for thinness (Item 11: t = 9.98, p < 0.001, η2 = 0.193), compensatory exercise (Item 12: t = 9.54, p < 0.001, η2 = 0.180), preoccupation with body fat (Item 14: t = 9.37, p < 0.001, η2 = 0.175), fear of weight gain (Item 1: t = 8.82, p < 0.001, η2 = 0.158), and dieting behavior (Item 23: U = 3562, p < 0.001, η2 = 0.098) (Table S1).
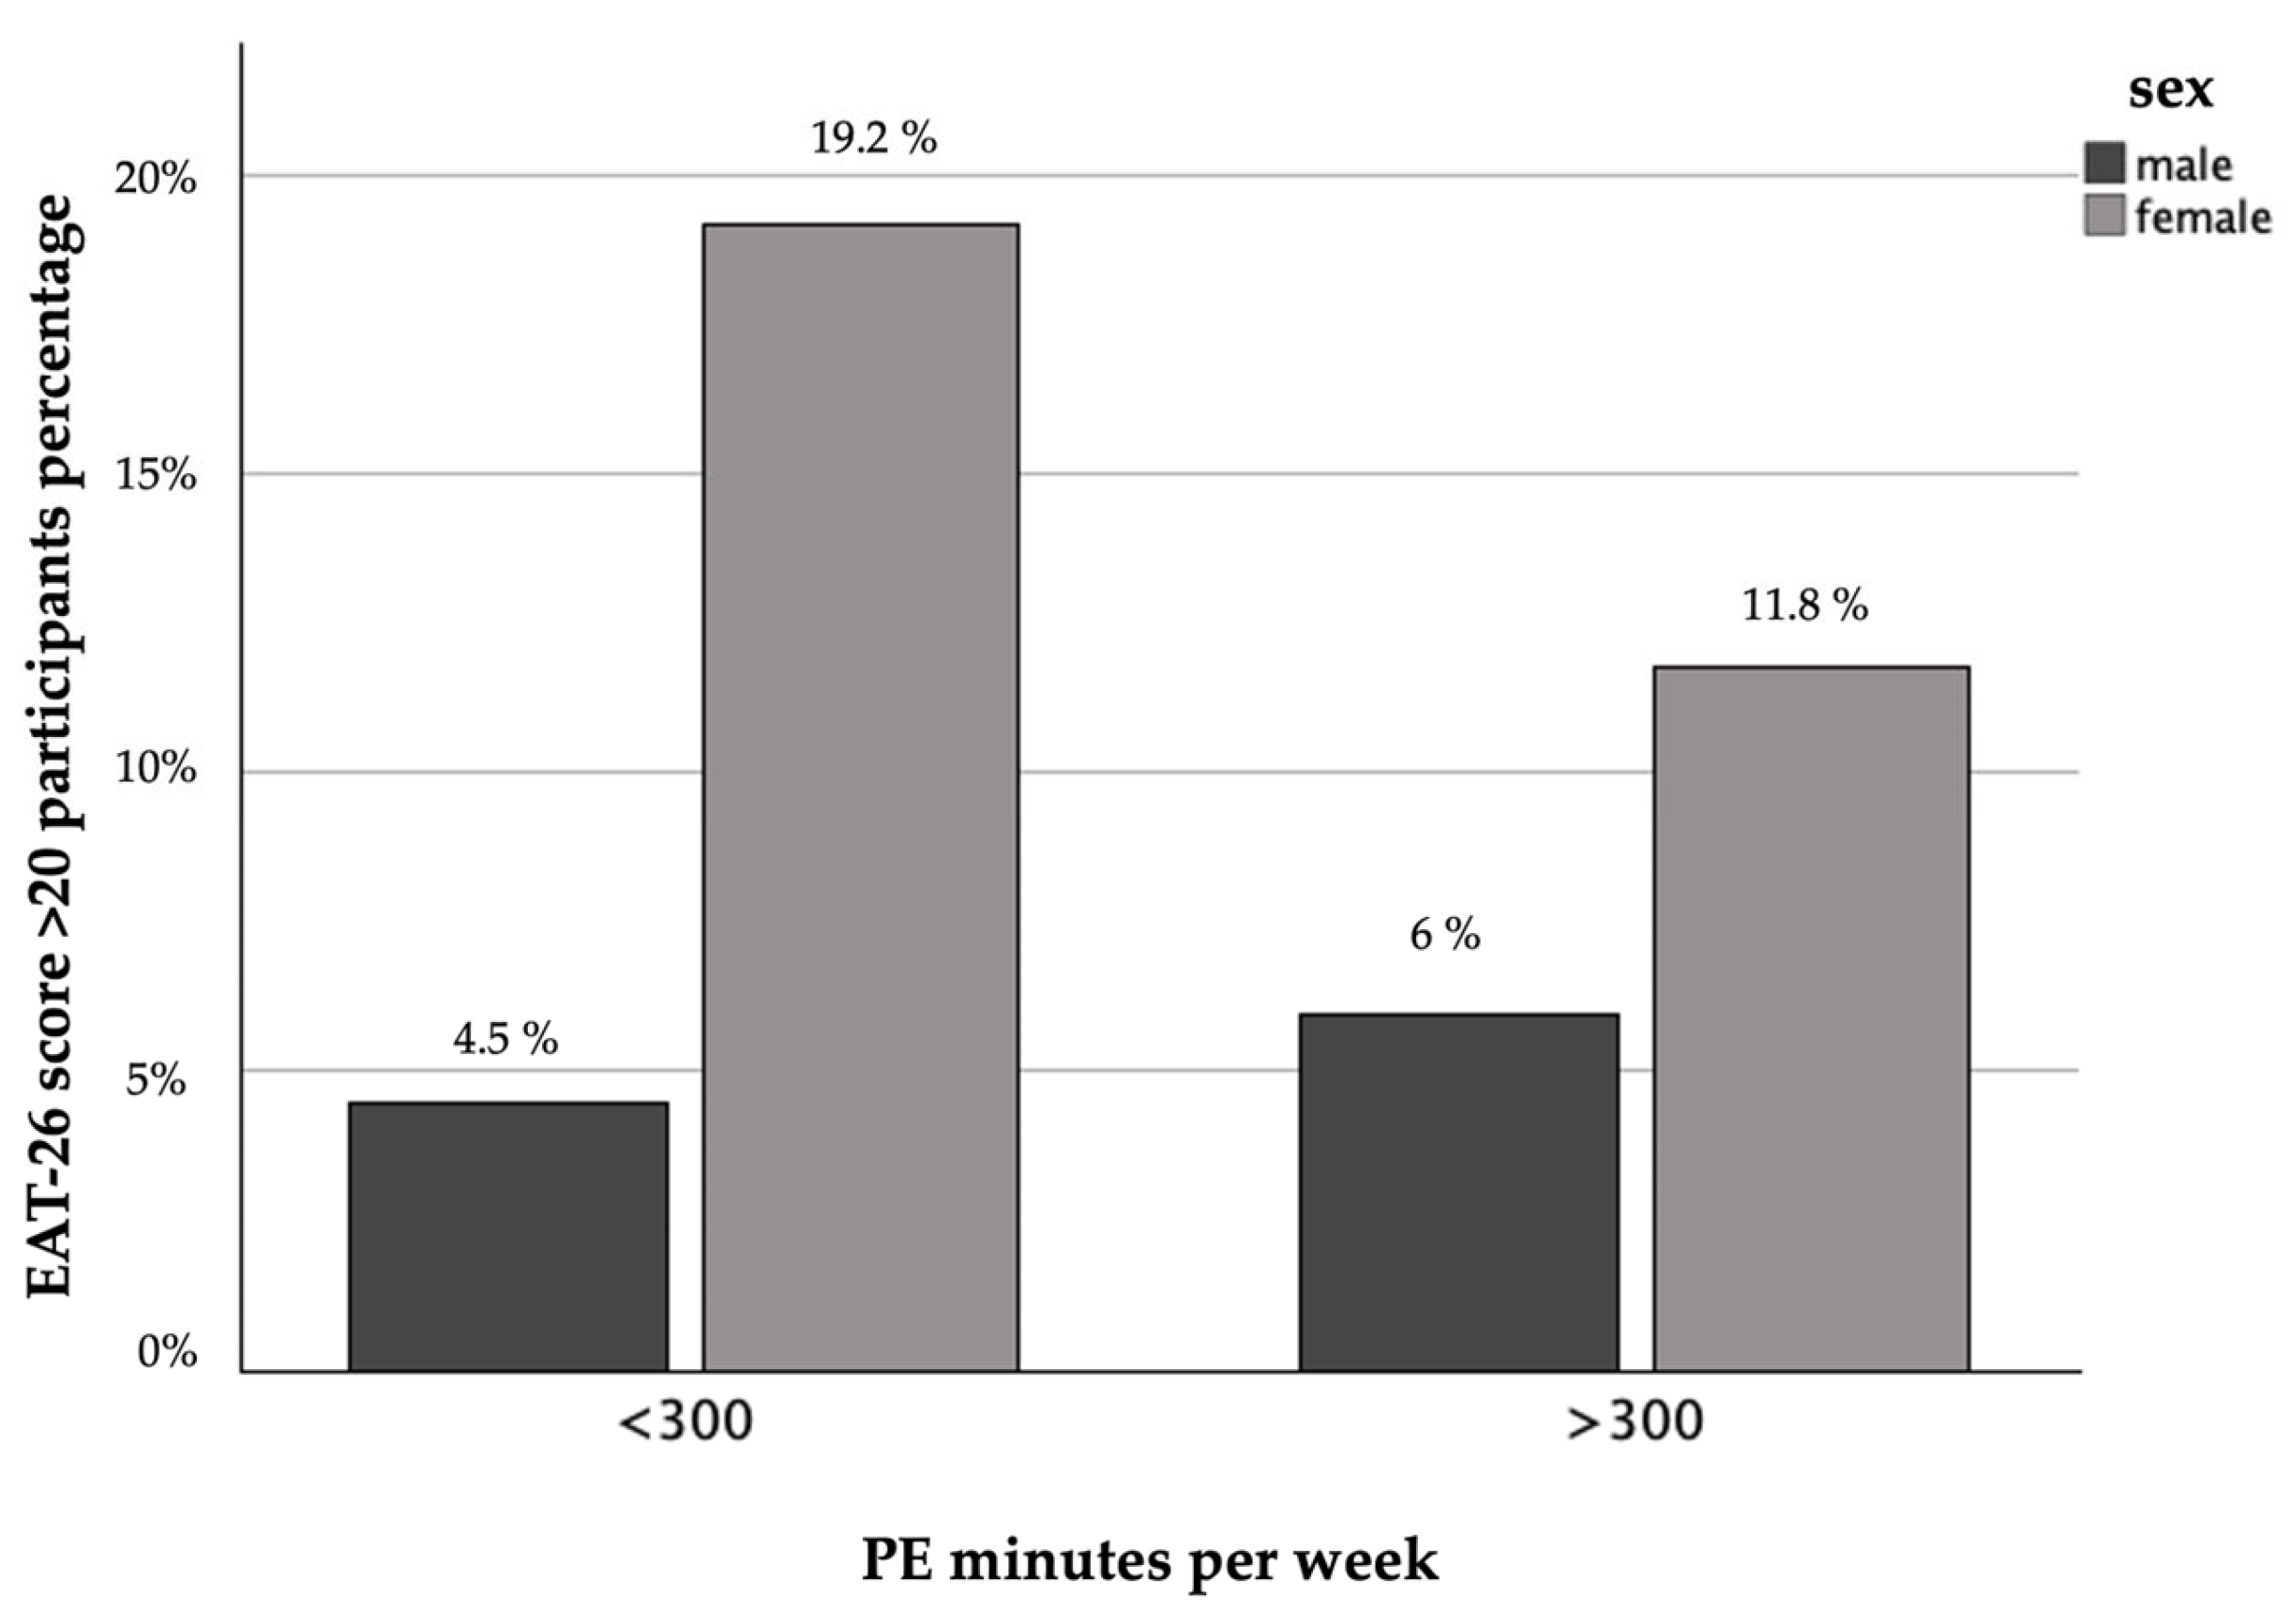
Further analysis examined the potential role of meeting or exceeding the ACSM guidelines. Exceeding to ACSM recommendations (>300 min/week) was not significantly associated with a higher likelihood of eating disorder risk at the whole-sample level (χ2 = 3.416, p = 0.065). However, a stratified analysis by sex showed a significant interaction. Among participants not exceeding the guidelines (<300 min/week, n = 282), the sex gap in terms of risk was significant (χ2 = 10.560, p = 0.001), with 19.2% of females at risk versus 4.5% of males. Conversely, among those exceeding the guidelines (>300 min/week, n = 135), the sex difference in risk was non-significant (χ2 = 1.432, p = 0.231), with 11.8% of females and 6.0% of males at risk. Figure 1 represents a cluster bar by minute per week of PE, stratified by sex under risk and no-risk conditions.
A binary logistic regression model was used to analyze eating disorder risk (EAT-26 ≥ 20) predictors, with a specific focus on the interaction between sex and adherence to the ACSM exercise guideline (>300 min/week), resulting in statistical significance (Omnibus χ2 = 16.784, p = 0.003, df = 5). The Hosmer–Lemeshow test indicated good model fit (χ2 = 7.297, df = 8, p = 0.505).
As shown in Table 6, sex emerged as the strongest independent predictor of ED risk. Female sex was associated with a higher risk than male sex (OR = 5.097, 95% CI [1.741, 14.920], p = 0.003) after controlling for age, exercise volume, and exercise type. Neither adherence to the ACSM guideline (OR = 1.340, 95% CI [0.347, 5.172], p = 0.671) nor exercise type (OR = 0.952, 95% CI [0.711, 1.274], p = 0.740) was a significant predictor of ED risk. Age was also not significantly associated with ED risk (OR = 1.000, 95% CI [0.977, 1.024], p = 0.987). The interaction term between sex and adherence to the ACSM guideline did not reach statistical significance (OR = 0.418, 95% CI [0.081, 2.149], p = 0.297). This indicates that, in the multivariate model, the effect of sex on ED risk was not significantly moderated by exceeding the 300 min/week threshold.
The independent samples t-test conducted to compare EAT-26 scores between participants who exceeded or did not exceed 300 min/week of structured exercise did not show a statistically significant difference between the two groups (t(380.07) = −0.902, p = 0.368). The mean EAT-26 score was 9.03 ± 8.33 for the >300 min group and 9.98 ± 12.93 for the <300 min group, with a mean difference of –0.95 (95% CI [−3.02, 1.12]). Effect sizes were small and non-significant (Cohen’s d = −0.082, 95% CI [−0.287, 0.124]). Levene’s test indicated unequal variances (F = 11.842, p < 0.001), so the results were interpreted using the Welch correction.
Finally, one-way between-subject ANOVA was performed to assess differences in EAT-26 scores across five exercise types. High-intensity functional training (M = 8.19 ± 9.19), group fitness classes (M = 10.34 ± 14.49), weightlifting (M = 9.30 ± 10.06), team sports (M = 9.71 ± 14.78), and individual sports (M = 10.55 ±11.87) showed no statistically significant differences among exercise types (F(4, 412) = 0.379, p = 0.823, partial η2 = 0.004). Levene’s test indicated homogeneity of variances (p = 0.066).

4. Discussion

This study investigated the complex relationship between weekly PE volume and EDs by focusing on sex differences in a sample of healthy adults. The key finding is that sex is the strongest predictor of ED risk regardless of the intensity or type of exercise or age.
Our sample demonstrated substantial heterogeneity in EAT-26 scores, with a median of 6.0 (IQR = 11.0). While most participants reported healthy eating attitudes, a significant minority, 52 individuals (12.5%), scored above the clinical cut-off (≥20). This variability provides the necessary statistical power and clinical relevance to investigate the factors that differentiate at-risk individuals from their peers within an active population.
No significant correlation was found between EAT-26 scores and the volume of weekly structured exercise, BMI, or age. This suggests that, within a population of active adults without a diagnosed ED, merely quantifying exercise volume (even at levels exceeding 300 min/week) is insufficient to predict pathological eating attitudes.
This finding underscores that the quality (e.g., compulsion, rigidity, affect regulation function) and context of exercise may be more critical risk indicators than the quantity alone. Our findings are consistent with several studies [28,29,30], which agree that maladaptive and abusive exercise is a multidimensional phenomenon involving unique qualitative characteristics rather than exclusively quantitative characteristics of excessive volume (e.g., type, duration, and frequency taken into account in our study). To our knowledge, this is the first study to associate exercise volume with international guidelines’ recommendations using standardized questionnaires to assess the risk of eating disorders.
Cross tabulation confirmed a significant sex disparity, with females exhibiting a threefold higher prevalence of at-risk EAT-26 scores (17.6%) compared to males (5.2%). This finding is consistent with the established epidemiology of EDs, which are more prevalent in the female population [31].
The significance (p = 0.003) of the full binary logistic regression model indicates that the set of predictors (age, sex, adherence to the ACSM guideline, exercise type, and the sex × adherence interaction) reliably distinguished between participants at risk and those not at risk for an ED. The binary logistic regression further identified male sex as a strong protective factor against EDs (OR = 5.10). This disparity is deeply rooted in sociocultural pressures, differing body ideals (emphasis on thinness for women versus muscularity for men), and likely biological vulnerabilities. The higher mean EAT-26 score in females also reflects a greater prevalence of dieting behaviors, body dissatisfaction, and weight preoccupation, as measured by the EAT-26 subscales, which are more culturally sanctioned and prevalent among females. Several studies agree with this finding: Barakat and colleagues [32], in a recent review, analyzed studies on ED risk factors up to 2023, confirming that female sex is among the strongest risk factors for eating disorders. Several mechanisms of action were hypothesized to explain this association. First, the literature agrees on the role of age at puberty onset: early puberty is strongly linked to a higher risk of EDs, and an earlier age of menarche is associated with a younger average age of ED onset. It has been proposed that when an individual experiences the physical changes associated with menarche sooner than their peers, it may result in greater body dissatisfaction, potentially contributing to the earlier development of an ED [33]. The changes in body shape caused by puberty distance women from the ideal of thinness, while those in men bring them closer to the ideal of muscularity. In fact, bulimic symptoms and body dissatisfaction have been associated with early puberty in women and late puberty in men [34]. During menarche, there is increased estrogen production, and certain genetic variations in an estrogen receptor gene have been shown to increase the risk of restrictive eating significantly and, consequently, the development of certain EDs, such as anorexia nervosa in women [35]. Finally, having a higher BMI than peers was associated with the risk of eating disorders among girls but not boys [33].
While the cut-off of 300 min/week of high-intensity exercise was not a significant risk predictor for the whole sample, a stratified analysis revealed that the sex gap in ED risk was wide and significant (19.2% of females vs. 4.5% of males at risk) only in the group that did not exceed guidelines (<300 min/week). Despite studies showing how excessive exercise may lead to physiological and psychological symptoms that could hurt mental health in athletes [8], young non-athletes engaging in PE tend to have a more positive body image than those who do not [36], which is a protective factor for ED development, especially in the female population [37].
A negative association has been demonstrated between symptoms of EDs and physical activity levels, moderated by BMI scores [38]. Thus, women with high ED risk driven by body dissatisfaction might avoid extremely high volumes due to physical limitations such as low energy availability and BMI. This interaction highlights the danger of generalizing the effects of “excessive exercise” without considering sex and context (athletes/non-athletes). The attenuated sex gap in ED risk among participants exceeding the ACSM threshold raises a fundamental question regarding the direction of this association. Cross-sectional data cannot establish whether high-volume exercise confers psychological resilience against EDs in women or whether women with pre-existing protective factors (e.g., stronger athletic identity, lower body dissatisfaction) self-select into high-volume training. The former would imply a potential causal pathway whereby exercise engagement fosters resilience; the latter would indicate selection bias, wherein baseline characteristics determine exercise volume rather than vice versa. Longitudinal studies are needed to disentangle these competing hypotheses, alongside qualitative investigations exploring the motivations and psychological profiles of high-volume female exercisers. Such research is essential to determine whether high-volume exercise represents a genuine protective factor or merely reflects pre-existing individual differences.
The considerable variability in the IPAQ average results (9037.919 ± 10,304.89) highlights an important aspect to note, which is that although the IPAQ is a validated tool for quantifying physical in a healthy adult population, it provided conflicting results. This should encourage reflection on how crucial it is to draw conclusions using appropriate methodologies and emphasize the importance of studying structured PE independently of standardized indices for quantifying physical activities. Such an approach is essential for accurately assessing whether structured PE acts as a positive or negative predictor of EDs.
The analysis revealed no statistically significant differences in EAT-26 scores across the five exercise types. This contradicts findings that esthetic or lean sports [39] intrinsically involve greater risk. The discrepancy with our results suggests that for adult recreational exercisers, the specific type of structured PE may be less predictive of global eating pathology than the individual’s psychological profile and motivations. However, this null finding should be interpreted with caution because of the recreational nature of the sample and the potential limitation of statistical power due to the high variability (large SDs) within the five exercise-type groups. Future research should investigate the pathogenic environment that links the ED with elite esthetic sports [40], sports that emphasize leanness and may be considered lean sports by Mancine et al. [39]. There should be differences at the recreational level where individuals self-select into activities in line with their pre-existing body image concerns, potentially diluting between-group differences.
These findings have several implications. Clinical screening for ED risk in active populations should prioritize psychological factors (exercise motivation, body image distortion, dietary rigidity) over simple metrics like PE volume. The persistent sex gap confirms that prevention programs must continue to target sociocultural pressures on women while expanding to address the unique body image concerns of men.
The restricted sex gap in the high-volume group requires cautious interpretation.
Due to the cross-sectional design, the direction of this association remains unclear. It is possible that intense exercise, when practiced for reasons unrelated to physical appearance, may be associated with a healthier body image and athletic identity in women [41]. Alternatively, women with a lower baseline risk for eating disorders may be more prone to engaging in high volumes of exercise [42]. Longitudinal studies are needed to clarify the temporal relationship between exercise volume, sex, and risk for eating disorders. Therefore, although our findings suggest that exercise is not a risk behavior per se, they do not justify clinical recommendations without further prospective research. This study highlights the need for longitudinal research to clarify causal pathways. Specifically, it remains unclear whether intense PE exerts a direct moderating effect on the risk of EDs or whether individuals with pre-existing risk profiles autonomously choose distinct patterns of exercise volume and mode. Qualitative studies are needed to understand the subjective experience and motivations of high-volume exercisers of both sexes. Furthermore, research must explore further into male experiences and explore biomarkers like low energy availability across these groups. In addition to the volume of PE, an analysis of the individual items of the EAT-26 provides insights into the psychological function of physical activity in relation to the risk of eating disorders. Items 10 (guilt after eating), 12 (exercising to burn calories), and 23 (weight-loss behaviors) revealed significant differences between genders and between at-risk and non-at-risk participants (Table S1). In the at-risk group (EAT-26 ≥ 20), 73.1% reported often feeling guilty after eating, 67.3% exercised specifically to burn calories, and 69.2% followed diet programs. These percentages were substantially lower in the non-at-risk group (4.9%, 13.2%, and 12.9%, respectively). This pattern suggests that, for individuals at risk of eating disorders, exercise is not primarily motivated by health or pleasure but rather serves a compensatory function aimed at managing the guilt associated with food intake and imposing dietary restrictions. The convergence of guilt-driven eating attitudes, compensatory exercise, and dietary restriction aligns with the concept of “compulsive exercise” described by Bratland-Sanda et al. [10], in which physical activity becomes a rigid, affect-regulating behavior rather than a flexible, intrinsically motivated one. In particular, the co-occurrence of these three factors—guilt, compensation, and dieting—may represent a specific behavioral phenotype that distinguishes maladaptive exercise from healthy physical activity, a distinction not captured by exercise volume alone. The effect sizes observed for these factors (η2 = 0.203 for guilt, 0.180 for compensatory exercise, and 0.098 for dieting) underscore their potential relevance as targets for screening and intervention. These findings may support the need to investigate, in addition to exercise volume, the underlying motivation for physical exercise in greater depth as a more critical determinant of the risk of eating disorders.
This study has limitations: The cross-sectional design prevents causal inference. Reliance on self-reporting (IPAQ, EAT-26, weekly PE characteristics) introduces potential bias. Specifically, participants may have overestimated the time and intensity of their physical activity when completing the IPAQ, leading to inflated MET-minute values. This overestimation is a well-documented limitation of self-report physical activity questionnaires and may have contributed to the high variability in the values. The sample, though adequate, was one of convenience, limiting generalizability to the sedentary population or clinical ED groups. The EAT-26 is a screening tool, not a diagnostic instrument; therefore, scores above the cut-off indicate risk for eating disorders rather than clinical diagnosis. While participants reported the weekly volume of their PE, we did not independently verify the intensity of these sessions. In calculating adherence to the ACSM guideline, we assumed that the self-reported PE was performed at least at a moderate intensity, an assumption consistent with the typical training practices of a population recruited from individual sports, team sports, group fitness classes, weightlifting, and high intensity functional training. Finally, another limitation was the absence of data on key psychological confounders such as perfectionism, anxiety, depression, and exercise motivation, which are likely important variables in the relationship between exercise and ED risk. Our analysis focused on the quantitative aspects of PE in relation to EAT-26 scores using the established clinical cut-off (≥20). However, the function and motivation underlying exercise engagement may be equally, if not more, relevant than volume alone in understanding ED risk. Future research should therefore extend beyond volume-based assessments to incorporate the role of exercise-related guilt, compensatory motivations, and dietary rigidity warrant systematic investigation. These factors, may help distinguish adaptive exercise patterns from maladaptive ones associated with eating pathology.

5. Conclusions

This study contributes to understanding the relationship between PE volume and EDs. In contrast to the notion that high exercise volume per se is a direct correlate of eating disorder risk in a healthy adult population, it reaffirms sex as the most powerful demographic predictor. The absence of risk differences across sport types in this community sample suggests that pathological attitudes transcend the activity itself, residing more in the individual’s psychological relationship with their body and exercise.
In conclusion, performing more than 300 min/week of structured exercise is not predictor of ED and is not correlated with the EAT-26 score. Future longitudinal studies should therefore adopt a multidimensional perspective, focusing on the why and how of PE alongside the how much.

Supplementary Materials

The following supporting information can be downloaded at: https://www.mdpi.com/article/10.3390/sci8040079/s1, Table S1: EAT-26 item scores by sex and eating disorder risk status with inferential statistics.

Author Contributions

Conceptualization, G.M., A.A. and L.P.; methodology, A.A. and L.P.; review and editing, G.M., A.A. and L.P.; investigation, A.A. and F.F.; writing, A.A., F.F. and L.P.; supervision, G.M.; project administration, A.A. and L.P. All authors have read and agreed to the published version of the manuscript.

Funding

This study was supported by the “PreRoF4 OA” project, founded by PIACERI 2024–2026, BIOMETEC, University of Catania, Italy.

Institutional Review Board Statement

The study was conducted in accordance with the Declaration of Helsinki and approved by the Research Center on Motor Activities (CRAM) Scientific Committee (Protocol no.: CRAM-61-2024, date of approval 17 July 2024).

Informed Consent Statement

Informed consent was obtained from all participants involved in the study. Written informed consent has been obtained from the patients to publish this paper.

Data Availability Statement

The data presented in this study are available on request from the corresponding author due to privacy or ethical restrictions.

Conflicts of Interest

The authors declare no conflicts of interest.

Abbreviations

The following abbreviations are used in this manuscript:
ACSMAmerican College of Sports Medicine
BMIBody mass index
EDEating disorders
EAT-26Eating Attitudes Test-26
IPAQInternational Physical Activity Questionnaire
PEPhysical exercise

References

  1. Bull, F.C.; Al-Ansari, S.S.; Biddle, S.; Borodulin, K.; Buman, M.P.; Cardon, G.; Carty, C.; Chaput, J.P.; Chastin, S.; Chou, R.; et al. World Health Organization 2020 guidelines on physical activity and sedentary behaviour. Br. J. Sports Med. 2020, 54, 1451–1462. [Google Scholar] [CrossRef] [Scilit]
  2. U.S. Department of Health and Human Service. 2018 Physical Activity Guidelines Advisory Committee Scientific Report; U.S. Department of Health and Human Service: Washington, DC, USA, 2018.
  3. Schroeder, E.C.; Franke, W.D.; Sharp, R.L.; Lee, D.C. Comparative effectiveness of aerobic, resistance, and combined training on cardiovascular disease risk factors: A randomized controlled trial. PLoS ONE 2019, 14, e0210292. [Google Scholar] [CrossRef] [Scilit] [PubMed]
  4. Baradaran Mahdavi, S.; Riahi, R.; Vahdatpour, B.; Kelishadi, R. Association between sedentary behavior and low back pain; A systematic review and meta-analysis. Health Promot. Perspect. 2021, 11, 393–410. [Google Scholar] [CrossRef] [Scilit] [PubMed]
  5. Chen, J.; Ruan, X.; Fu, T.; Lu, S.; Gill, D.; He, Z.; Burgess, S.; Giovannucci, E.L.; Larsson, S.C.; Deng, M.; et al. Sedentary lifestyle, physical activity, and gastrointestinal diseases: Evidence from mendelian randomization analysis. eBioMedicine 2024, 103, 105110. [Google Scholar] [CrossRef] [Scilit] [PubMed]
  6. Park, J.H.; Moon, J.H.; Kim, H.J.; Kong, M.H.; Oh, Y.H. Sedentary Lifestyle: Overview of Updated Evidence of Potential Health Risks. Korean J. Fam. Med. 2020, 41, 365–373. [Google Scholar] [CrossRef] [Scilit]
  7. Freimuth, M.; Moniz, S.; Kim, S.R. Clarifying exercise addiction: Differential diagnosis, co-occurring disorders, and phases of addiction. Int. J. Environ. Res. Public Health 2011, 8, 4069–4081. [Google Scholar] [CrossRef] [Scilit]
  8. Marques, A.; Peralta, M.; Sarmento, H.; Loureiro, V.; Gouveia, É.R.; Gaspar de Matos, M. Prevalence of Risk for Exercise Dependence: A Systematic Review. Sports Med. 2019, 49, 319–330. [Google Scholar] [CrossRef] [Scilit]
  9. Cornelissen, P.L.; Tovée, M.J. Targeting body image in eating disorders. Curr. Opin. Psychol. 2021, 41, 71–77. [Google Scholar] [CrossRef] [Scilit]
  10. Bratland-Sanda, S.; Mathisen, T.F.; Sundgot-Borgen, J.; Rosenvinge, J.H. Defining compulsive exercise in eating disorders: Acknowledging the exercise paradox and exercise obsessions. J. Eat. Disord. 2019, 7, 8. [Google Scholar] [CrossRef] [Scilit]
  11. Delany, L.V.; Costello, N.; Jones, B.; Backhouse, S.H. Dietary Recommendations for Body Mass and Composition Manipulation in Male and Female Athletes: A Scoping Review of Consensus Statements, Position Stands and Practice Guidelines from International Expert Groups. Sports Med. 2025, 55, 2445–2487. [Google Scholar] [CrossRef] [Scilit]
  12. Bratland-Sanda, S.; Sundgot-Borgen, J. Eating disorders in athletes: Overview of prevalence, risk factors and recommendations for prevention and treatment. Eur. J. Sport Sci. 2013, 13, 499–508. [Google Scholar] [CrossRef] [Scilit]
  13. Jeppesen, J.S.; Hellsten, Y.; Melin, A.K.; Hansen, M. Short-Term Severe Low Energy Availability in Athletes: Molecular Mechanisms, Endocrine Responses, and Performance Outcomes—A Narrative Review. Scand. J. Med. Sci. Sports 2025, 35, e70089. [Google Scholar] [CrossRef] [Scilit] [PubMed]
  14. Mosur-Kaluza, S.; Guszkowska, M. Physical activity and body image of women: Literature review. Balt. J. Health Phys. Act. 2015, 7, 29–37. [Google Scholar] [CrossRef] [Scilit]
  15. Toutain, M.; Gauthier, A.; Leconte, P. Exercise therapy in the treatment of anorexia nervosa: Its effects depending on the type of physical exercise-A systematic review. Front. Psychiatry 2022, 13, 939856. [Google Scholar] [CrossRef] [Scilit] [PubMed]
  16. Amato, A.; Proia, P.; Caldara, G.F.; Alongi, A.; Ferrantelli, V.; Baldassano, S. Analysis of Body Perception, Preworkout Meal Habits and Bone Resorption in Child Gymnasts. Int. J. Environ. Res. Public. Health 2021, 18, 2184. [Google Scholar] [CrossRef] [Scilit]
  17. McAvoy, C.R.; Batrakoulis, A.; Camhi, S.M.; Sansone, J.; Stanfield, J.T.; Reed, R.; Contributors, I. 2026 ACSM Worldwide Fitness Trends: Future Directions of the Health and Fitness Industry. ACSM’s Health Fit. J. 2025, 29, 16–33. [Google Scholar] [CrossRef] [Scilit]
  18. Levit, M.; Weinstein, A.; Weinstein, Y.; Tzur-Bitan, D.; Weinstein, A. A study on the relationship between exercise addiction, abnormal eating attitudes, anxiety and depression among athletes in Israel. J. Behav. Addict. 2018, 7, 800–805. [Google Scholar] [CrossRef] [Scilit]
  19. Attia, E.; Becker, A.E.; Bryant-Waugh, R.; Hoek, H.W.; Kreipe, R.E.; Marcus, M.D.; Mitchell, J.E.; Striegel, R.H.; Walsh, B.T.; Wilson, G.T.; et al. Feeding and eating disorders in DSM-5. Am. J. Psychiatry 2013, 170, 1237–1239. [Google Scholar] [CrossRef] [Scilit]
  20. Suarez-Albor, C.L.; Galletta, M.; Gómez-Bustamante, E.M. Factors associated with eating disorders in adolescents: A systematic review. Acta Biomed. 2022, 93, e2022253. [Google Scholar] [CrossRef] [Scilit]
  21. Craig, C.L.; Marshall, A.L.; Sjöström, M.; Bauman, A.E.; Booth, M.L.; Ainsworth, B.E.; Pratt, M.; Ekelund, U.; Yngve, A.; Sallis, J.F.; et al. International physical activity questionnaire: 12-country reliability and validity. Med. Sci. Sports Exerc. 2003, 35, 1381–1395. [Google Scholar] [CrossRef] [Scilit]
  22. Mannocci, A.; Di Thiene, D.; Del Cimmuto, A.; Masala, D.; Boccia, A.; De Vito, E. International Physical Activity Questionnaire: Validation and assessment in an Italian sample. Ital. J. Public Health 2010, 22 7, 369–376. [Google Scholar] [CrossRef] [Scilit] [PubMed]
  23. Garner, D.M.; Garfinkel, P.E. The Eating Attitudes Test: An index of the symptoms of anorexia nervosa. Psychol. Med. 1979, 9, 273–279. [Google Scholar] [CrossRef] [Scilit] [PubMed]
  24. Giannini, M.; Pannocchia, L.; Dalle Grave, R.; Muratori, F. Adattamento italiano dell’EDI-3. [Eating Disorder Inventory-3]. In Firenze: Giunti OS Organizzazioni Speciali; Giunti Psychometrics Italia: Firenze, Italy, 2008. [Google Scholar]
  25. Sjostrom, M.; Ainsworth, B.E.; Bauman, A.; Bull, F.C.; Hamilton-Craig, C.R.; Sallis, J.F. Guidelines for Data Processing Analysis of the International Physical Activity Questionnaire (IPAQ)—Short and Long Forms; IPAQ Research Committee: Stockholm, Sweden, 2005. [Google Scholar]
  26. Pourhoseingholi, M.A.; Vahedi, M.; Rahimzadeh, M. Sample size calculation in medical studies. Gastroenterol. Hepatol. Bed Bench 2013, 6, 14–17. [Google Scholar] [PubMed]
  27. Albassam, R.S.; Alahmadi, A.K.; Alfawaz, W.A. Eating Attitudes and Characteristics of Physical Activity Practitioners and Athletes in Riyadh, Saudi Arabia. Healthcare 2024, 12, 2439. [Google Scholar] [CrossRef] [Scilit]
  28. Gonçalves Baptista, J.; Costa Filho, P.N.; Faria Porretti, M.; do Espírito-Santo, G.; Assis, M.; Palma, A. Exercise Dependence: An Updated Systematic Review. J. Exerc. Physiol. Online 2019, 22, 105–125. [Google Scholar]
  29. Szabo, A.; Demetrovics, Z.; Griffiths, M.D. Morbid exercise behavior: Addiction or psychological escape? In The Exercise Effect on Mental Health; CRC Press: Boca Raton, FL, USA, 2018; pp. 277–311. [Google Scholar]
  30. Godoy-Izquierdo, D.; Ramírez, M.J.; Díaz, I.; López-Mora, C. A systematic review on exercise addiction and the disordered eating-eating disorders continuum in the competitive sport context. Int. J. Ment. Health Addict. 2023, 21, 529–561. [Google Scholar] [CrossRef] [Scilit]
  31. Hay, P.; Aouad, P.; Le, A.; Marks, P.; Maloney, D.; Barakat, S.; Boakes, R.; Brennan, L.; Bryant, E.; Byrne, S.; et al. Epidemiology of eating disorders: Population, prevalence, disease burden and quality of life informing public policy in Australia—A rapid review. J. Eat. Disord. 2023, 11, 23. [Google Scholar] [CrossRef] [Scilit]
  32. Barakat, S.; McLean, S.A.; Bryant, E.; Le, A.; Marks, P.; Aouad, P.; Barakat, S.; Boakes, R.; Brennan, L.; Bryant, E.; et al. Risk factors for eating disorders: Findings from a rapid review. J. Eat. Disord. 2023, 11, 8. [Google Scholar] [CrossRef] [Scilit]
  33. Arduini, T.; Iorio, D.; Patacchini, E. Weight, reference points, and the onset of eating disorders. J. Health Econ. 2019, 65, 170–188. [Google Scholar] [CrossRef] [Scilit]
  34. Klump, K.L. Puberty as a critical risk period for eating disorders: A review of human and animal studies. Horm. Behav. 2013, 64, 399–410. [Google Scholar] [CrossRef] [Scilit]
  35. Versini, A.; Ramoz, N.; Le Strat, Y.; Scherag, S.; Ehrlich, S.; Boni, C.; Hinney, A.; Hebebrand, J.; Romo, L.; Guelfi, J.D.; et al. Estrogen receptor 1 gene (ESR1) is associated with restrictive anorexia nervosa. Neuropsychopharmacology 2010, 35, 1818–1825. [Google Scholar] [CrossRef] [Scilit]
  36. Festino, E.; Papale, O.; Di Rocco, F.; De Maio, M.; Cortis, C.; Fusco, A. Effect of physical activity behaviors, team sports, and sitting time on body image and exercise dependence. Sports 2024, 12, 260. [Google Scholar] [CrossRef] [Scilit]
  37. Zhang, Y.; Wen, Z.; Zhu, Y.; Guan, G. Effects of physical exercise on body esteem among females: A meta-analysis. BMC Public Health 2024, 24, 3387. [Google Scholar] [CrossRef] [Scilit]
  38. Heradstveit, O.; Holmelid, E.; Klundby, H.; Søreide, B.; Sivertsen, B.; Sand, L. Associations between symptoms of eating disturbance and frequency of physical activity in a non-clinical, population-based sample of adolescents. J. Eat. Disord. 2019, 7, 9. [Google Scholar] [CrossRef] [Scilit]
  39. Mancine, R.P.; Gusfa, D.W.; Moshrefi, A.; Kennedy, S.F. Prevalence of disordered eating in athletes categorized by emphasis on leanness and activity type—A systematic review. J. Eat. Disord. 2020, 8, 47. [Google Scholar] [CrossRef] [Scilit] [PubMed]
  40. Kantanista, A.; Glapa, A.; Banio, A.; Firek, W.; Ingarden, A.; Malchrowicz-Mośko, E.; Markiewicz, P.; Płoszaj, K.; Ingarden, M.; Maćkowiak, Z. Body image of highly trained female athletes engaged in different types of sport. BioMed Res. Int. 2018, 2018, 6835751. [Google Scholar] [CrossRef] [Scilit] [PubMed]
  41. Chapa, D.A.N.; Johnson, S.N.; Richson, B.N.; Bjorlie, K.; Won, Y.Q.; Nelson, S.V.; Ayres, J.; Jun, D.; Forbush, K.T.; Christensen, K.A.; et al. Eating-disorder psychopathology in female athletes and non-athletes: A meta-analysis. Int. J. Eat. Disord. 2022, 55, 861–885. [Google Scholar] [CrossRef] [Scilit]
  42. Li, Q.; Li, H.; Zhang, G.; Cao, Y.; Li, Y. Athlete Body Image and Eating Disorders: A Systematic Review of Their Association and Influencing Factors. Nutrients 2024, 16, 2686. [Google Scholar] [CrossRef] [Scilit] [PubMed]
Figure 1. Clustered bar of percentage of participants at ED risk by PE minutes/week and by sex. The percentage refers to male or female participants in a risk condition among the entire sample of the same sex. ED = eating disorder; PE = physical exercise.
Sci 08 00079 g001
Table 1. Survey questions administered to the study participants.
SectionItem NumberQuestion
Demographics and Anthropometrics1Sex
2Age (in years)
3Body weight (in kg)
4Height (in cm)
Physical exercise Profile5How long have you been practicing physical exercise regularly?
6On average, how many days per week do you train?
7On average, what is the duration of each training session?
8In which context do you primarily practice physical exercise?
9Do you also train outside of classes or the gym (e.g., outdoor activities, independent workouts at home)?
10Have you ever had periods of prolonged suspension from physical activity (longer than 2 months)?
10aIf yes, please specify the reason.
11What is your main goal in practicing physical activity?
12How do you monitor your progress?
Nutritional Habits and Diet13Have you followed a specific dietary regime or diet in the last 12 months?
14Do you modify your nutrition on days when you train?
15Do you ever skip meals before or after physical activity?
16Do you ever train on an empty stomach?
Psycho-Behavioral Aspects17Do you believe that physical activity has influenced your relationship with food?
18Do you set weight or body composition control goals in relation to physical activity?
19Do you ever train to “compensate” for excessive food intake?
20Do you believe you have a balance between physical activity and nutrition?
21Do you ever feel guilty if you skip a workout or eat more than planned?
22For you, physical activity is primarily:
23How would you generally define your relationship with food?
Health and Well-being24Do you currently suffer, or have you suffered in the past from diagnosed eating disorders?
25Since you started practicing regular physical activity, have you noticed improvements in the following aspects: [List of aspects would be provided]
26Which aspect do you feel has improved the most?
27How would you rate your current general state of well-being compared to before you started exercising?
28Do you ever train even when you feel very tired or sore?
Table 2. Item stems of the Long International Physical Activity Questionnaire (IPAQ).
Behavioral DomainsQuestions
Job-Related Physical Activity Domain
1.
Do you currently have a job or do any unpaid work outside your home? (yes or no)
2.
During the last 7 days, on how many days did you do vigorous physical activities as part of your work? (D/W)
3.
How much time did you usually spend on one of those days doing vigorous physical activities as part of your work? (m/d)
4.
During the last 7 days, on how many days did you do moderate physical activities as part of your work? (D/W)
5.
How much time did you usually spend on one of those days doing moderate physical activities as part of your work? (m/d)
6.
During the last 7 days, on how many days did you walk as part of your work? (D/W)
7.
How much time did you usually spend on one of those days walking as part of your work? (m/d)
Transportation Physical Activity
8.
During the last 7 days, on how many days did you travel in a motor vehicle like a train, bus, car, or tram? (D/W)
9.
How much time did you usually spend on one of those days traveling in a car, bus, train, or other kind of motor vehicle? (m/d)
10.
During the last 7 days, on how many days did you bicycle to go from place to place? (D/W)
11.
How much time did you usually spend on one of those days to bicycle from place to place? (m/d)
12.
During the last 7 days, on how many days did you walk to go from place to place? (D/W)
13.
How much time did you usually spend on one of those days walking from place to place? (m/d)
Housework, house maintenance and caring for family
14.
During the last 7 days, on how many days did you do vigorous physical activities in the garden or yard? (D/W)
15.
How much time did you usually spend on one of those days doing vigorous physical activities in the garden or yard? (m/d)
16.
During the last 7 days, on how many days did you do moderate activities in the garden or yard? (D/W)
17.
How much time did you usually spend on one of those days doing moderate physical activities in the garden or yard? (m/d)
18.
During the last 7 days, on how many days did you do moderate activities inside your home? (D/W)
19.
How much time did you usually spend on one of those days doing moderate physical activities inside your home? (m/d)
Recreation, Sport, and Leisure-Time physical activity
20.
Not counting any walking you have already mentioned, during the last 7 days, on how many days did you walk for at least 10 min at a time in your leisure time? (d/W)
21.
How much time did you usually spend on one of those days walking in your leisure time? (m/d)
22.
During the last 7 days, on how many days did you do vigorous physical activities in your leisure time? (D/W)
23.
How much time did you usually spend on one of those days doing vigorous physical activities in your leisure time? (m/d)
24.
During the last 7 days, on how many days did you do moderate physical activities in your leisure time? (D/W)
25.
How much time did you usually spend on one of those days doing moderate physical activities in your leisure time? (m/d)
Time spent sitting
26.
During the last 7 days, how much time did you usually spend sitting on a weekday? (m/d)
27.
During the last 7 days, how much time did you usually spend sitting on a weekend day? (m/d)
m/d = minutes per day; D/W = days per week.
Table 3. Item stems of the Eating Attitudes Test (EAT-26).
Item NumberItem Stem
1I am terrified about being overweight.
2I avoid eating when I am hungry.
3I find myself preoccupied with food.
4I have gone on eating binges where I feel that I may not be able to stop.
5I cut my food into small pieces.
6I am aware of the calorie content of foods that I eat.
7I particularly avoid food with a high carbohydrate content (e.g., bread, rice, potatoes).
8I feel that others would prefer if I ate more.
9I vomit after I have eaten.
10I feel extremely guilty after eating.
11I am preoccupied with a desire to be thinner.
12I think about burning up calories when I exercise.
13Other people think that I am too thin.
14I am preoccupied with the thought of having fat on my body.
15I take longer than others to eat my meals.
16I avoid foods with sugar in them.
17I eat diet foods.
18I feel that food controls my life.
19I display self-control around food.
20I feel that others pressure me to eat.
21I give too much time and thought to food.
22I feel uncomfortable after eating sweets.
23I engage in dieting behavior.
24I like my stomach to be empty.
25I have the impulse to vomit after meals.
26I enjoy trying new rich foods.
Table 4. Sample characteristics divided by sex. Data are expressed as mean and standard deviation and median and interquartile range.
VariableSex
(Female n = 244; Male n = 173; Total n = 417)
Mean (SD)Median (IQR)
Age (years)Female33.27 (13.58)26.00 (21.00)
Male27.56 (8.33)25.00 (6.00)
Total30.90 (12.02)26.00 (15.00)
Weight (kg)Female60.41 (10.12)59.50 (11.00)
Male77.63 (11.17)76.00 (14.25)
Total67.55 (13.55)65.00 (20.00)
Height (cm)Female163.82 (6.59)164.00 (8.00)
Male177.21 (6.93)177.00 (10.00)
Total169.38 (9.42)169.00 (14.00)
BMI (kg/m2)Female22.48 (3.37)21.88 (3.86)
Male24.66 (2.72)24.28 (3.20)
Total23.38 (3.29)22.96 (4.13)
EAT-26 ScoreFemale11.54 (13.87)6.50 (13.00)
Male7.04 (6.64)5.00 (9.00)
Total9.67 (11.64)6.00 (11.00)
Structured Exercise (min/week)Female222.42 (119.74)180.00 (150.00)
Male303.82 (136.55)270.00 (180.00)
Total256.19 (133.03)240.00 (180.00)
Total IPAQ (MET-min/week)Female9071.03 (10,965.89)5926.50 (10,508.25)
Male8991.22 (9324.20)5928.00 (9114.00)
Total9037.92 (10,304.89)5927.00 (9779.50)
SD = Standard Deviation; IQR = Interquartile Range; BMI = Body Mass Index; EAT-26 = Eating Attitudes Test-26; IPAQ = International Physical Activity Questionnaire; MET = Metabolic Equivalent of Task.
Table 5. Distribution of eating disorder risk (EAT-26 ≥ 20) by sex and adherence to ACSM guidelines (>300 min/week of structured exercise).
ED RiskWeekly PEMales (n = 173)Females (n = 244)Total (N = 417)
No Risk (n = 365)<300 min/week85 (51.8%)156 (77.6%)241 (66.0%)
>300 min/week79 (48.2%)45 (22.4%)124 (34.0%)
Total164 (100%)201 (100%)365 (100%)
At Risk (n = 52)<300 min/week4 (44.4%)37 (86.0%)41 (78.8%)
>300 min/week5 (55.6%)6 (14.0%)11 (21.2%)
Total9 (100%)43 (100%)52 (100%)
Total Sample (N = 417)<300 min/week89 (51.4%)193 (79.1%)282 (67.6%)
>300 min/week84 (48.2%)51 (20.9%)135 (32.4%)
Total173 (100%)244 (100%)417 (100%)
ED = eating disorder; PE = physical exercise.
Table 6. Logistic regression predicting ED risk (risk vs. no risk).
VariableB (SE)WalddfSig.Odds Ratio (OR)95% CI for OR
Age0.000 (0.012)0.00010.9871.000[0.977, 1.024]
Sex (female vs. male)1.629 (0.548)8.83210.0035.097[1.741, 14.920]
ACSM adherence (>300 vs. ≤300 min/week)0.293 (0.689)0.18110.6711.340[0.347, 5.172]
Sex × ACSM adherence−0.871 (0.835)1.08910.2970.418[0.081, 2.149]
Exercise type−0.049 (0.149)0.11010.7400.952[0.711, 1.274]
Constant−2.920 (0.709)16.9511<0.0010.054
* significance at p < 0.05.
Disclaimer/Publisher’s Note: The statements, opinions and data contained in all publications are solely those of the individual author(s) and contributor(s) and not of MDPI and/or the editor(s). MDPI and/or the editor(s) disclaim responsibility for any injury to people or property resulting from any ideas, methods, instructions or products referred to in the content.