Article

Non-Uniform Shear Deformation and Its Influence Factor Sensitivity of Colluvial Coarse-Grained Soil

1
School of Civil and Architecture Engineering, Xi’an Technological University, Xi’an 710021, China
2
School of Architecture and Civil Engineering, Xi’an University of Science and Technology, Xi’an 710054, China
3
Northwest Institute of Eco-Environment and Resources, Chinese Academy of Sciences, Lanzhou 730000, China
4
School of Architecture and Surveying, Shaanxi Energy Institute, Xianyang 712000, China
*
Author to whom correspondence should be addressed.
Infrastructures 2026, 11(8), 267; https://doi.org/10.3390/infrastructures11080267
Submission received: 26 May 2026 / Revised: 14 July 2026 / Accepted: 29 July 2026 / Published: 1 August 2026

Abstract

To investigate the mechanical properties of coarse-grained soil in high-altitude mountainous areas, experimental research was conducted to explore the shear process, shear modulus, shear dilation, and stress axis rotation of coarse-grained soil under varying conditions. The sensitivity and mechanisms of these factors were also analyzed. The results indicate that increasing water content and fine particle content significantly diminish the strain-hardening characteristic, whereas dry density and normal stress augment this effect. Under shear stress, the samples exhibit pronounced non-uniform shear dilatancy. Elevated water content, fine particle content, and normal stress enhance shear contraction at the rear of the sample while suppressing shear dilation at the front. In contrast, dry density produces the opposite effect. The rotation of the stress axis initially follows a nonlinear growth pattern before transitioning to linear growth. The growth rate and ultimate rotation angle increase monotonically with water content, fine particle content, and normal stress but decrease with increasing dry density. Additionally, the shear modulus decreases exponentially with increasing water content and increases exponentially with dry density, fine particle content, and normal stress. Ultimately, normal stress is identified as the most sensitive factor, followed by dry density and fine particle content, with water content being the least sensitive. These findings can provide geotechnical parameters and a theoretical basis for the scientific prevention of high-altitude geological hazards. These findings can provide indoor mechanical parameters and deformation laws of coarse-grained soils for engineering.

1. Introduction

The Sichuan-Xizang mountains, located on the margin of the southeastern Qinghai-Xizang Plateau, host a dense concentration of major transportation projects in China, notably the Sichuan-Xizang Railway and Highway. The regions along the route are distinguished by a variable climate, rugged topography, complex geological conditions, and frequent occurrences of natural disasters [1,2]. Owing to intense weathering processes, coarse-grained soils derived from accumulation layers are extensively distributed across high-altitude mountainous areas. These soils are characterized by significant variations in particle size, comprising a heterogeneous mixture of coarse and fine particles, a loose structural framework, and poor stability [3,4]. Determining the shear deformation characteristics of coarse-grained soils and the sensitivity of their influencing factors constitutes an essential component for investigating the mechanical behaviors of coarse-grained soils and can further supply theoretical parameters to assess the stability of slope deposits.
For deformation characteristics of coarse-grained soil, extensive studies have been conducted on the stress–strain relationship and shear dilation deformation under different factor conditions through various shear tests [5]. Through conventional direct shear tests, a distinct shear dilation deformation was observed in coarse-grained soils during the shearing process, with varying shear dilation evolution patterns noted before and after reaching the peak [6]. Subsequently, it was proposed that shear band deformations in large-scale tests exhibit stronger heterogeneity, which in turn influences the overall stress–strain response of the soil. With respect to the effects of different gradients, water content, density, and mineral composition, these direct shear tests revealed that the shear stress-displacement curve of calcareous gravel soils under varying conditions exhibited a strain-hardening type, accompanied by significant shear dilation deformation [7]. Regarding the influence of particle gradation and soil structure, it was found that well-graded coarse-grained soils demonstrated more pronounced shear dilation behavior and more notable stress-displacement nonlinearity, whereas poorly graded soils exhibited relatively weaker shear dilation [8]. Zhang et al. [9] proposed that the shear characteristics of gravel soils under different filling conditions exhibit significant differences, noting that the stress–strain curve of the sample displayed strain-hardening characteristics, with a certain degree of shear dilation deformation occurring during shearing. In fact, the influence of particle gradation is realized through the arrangement structure formed by varying contents of coarse and fine particles. Existing studies generally concur that the internal skeleton structure formed by coarse particles and the filling effect of fine particles are key factors controlling the deformation characteristics of coarse-fine mixed soils [10]. In this context, several scholars have conducted experimental investigations on factors such as coarse particle content and fine particle content. Concerning the influence of coarse particle content, experiments under identical confining pressure conditions revealed that as the coarse particle content increases, the soil exhibits more significant shear dilation behavior [11]. Based on medium-scale shear tests, Li et al. [12] indicated that the coarse particle content significantly affects the shear deformation characteristics of the shear zone soil, with samples often displaying more pronounced shear dilation behavior when the coarse particle content is high. Regarding the effect of fine particle content, Demir and Cabalar [13] conducted shear tests on sand-low-plasticity silt mixtures and examined its influence on the shear behavior of coarse-grained soils. Meanwhile, due to the scale discrepancies between the test equipment and the original particles of coarse-grained soils, methods are frequently employed to handle oversized particles during the research process to meet the particle gradation requirements for the experimental scale. In this regard, a method was proposed to adjust the gradation of coarse-grained soils to facilitate shear testing in small-scale direct shear tests [14]. It was further noted that the shear strength obtained by using the equivalent substitution method to handle oversized particles in coarse-grained soils is typically higher than that obtained by using the similar gradation method, and with an increase in water content, the size effect becomes significantly more pronounced [15].
Additionally, stress conditions and water content are also pivotal factors determining the shear deformation characteristics of coarse-grained soils, which have attracted considerable attention from scholars [16,17]. Regarding the effect of stress conditions, the stress–strain characteristics of coarse-grained materials under varying water contents, particle gradations, and normal stresses were systematically analyzed through experiments [18]. Shi et al. [19] investigated the effect of the intermediate principal stress ratio on the deformation behavior of coarse-grained soils through shear tests. As the principal stress ratio increased, the intermediate principal strain gradually transitioned from compression to dilation, and the soil’s stress–strain relationship and volumetric deformation characteristics exhibited significant deformation anisotropy. Regarding the impact of water content, it was found that water immersion conditions can alter the stress-displacement relationship and shear deformation characteristics of soil-rock mixtures [20]. In evaluating the shear deformation characteristics of coarse- grained soils, the shear modulus is also one of the most commonly utilized indicators. Liu et al. [21] experimentally studied the effect of particle size distribution on the shear modulus G of coarse-grained soils. The results demonstrate that Cu and D50 have pronounced but opposite effects on G. Based on experimental studies on the small-strain shear modulus of sand, a unified characterization model was employed to describe the variation in shear modulus under different stress states [22]. In summary, it can be seen that researchers, through a series of experiments, have gained a relatively comprehensive understanding of the mechanical properties of coarse-grained soil under the influence of various factors. However, these studies primarily focuses on the coarse-grained fill materials applied in embankments and dams engineering, with limited studies on coarse-grained soils in high-altitude mountainous accumulation layers, especially those examining the influence of multiple factors and their sensitivities, which limits the stability evaluation of accumulation bodies and the landslide control technologies in high-altitude mountainous areas.
In this study, laboratory-scale mechanical tests through an improved test equipment and a revised calculation formula were conducted to investigated the shear properties of coarse-grained soils under different conditions. Based on the modified calculation method, the real shear stress corrected by the dynamic change in the shear surface, the non-uniform shear dilation deformation, and the rotational characteristics of the normal stress axis during the shear process were quantitatively analyzed. Then, the effect of different factors on the shear modulus of specimens was investigated, a exponential mathematical model was proposed, and the sensitivity of its influencing factors were ascertained by using the grey relational theory. These study results will enrich the mechanical properties of coarse-grained soil and provide necessary mechanical parameters for the stability evaluation of loose accumulations in high-altitude mountainous areas.

2. Test Materials and Methods

2.1. Physical Properties of Specimens

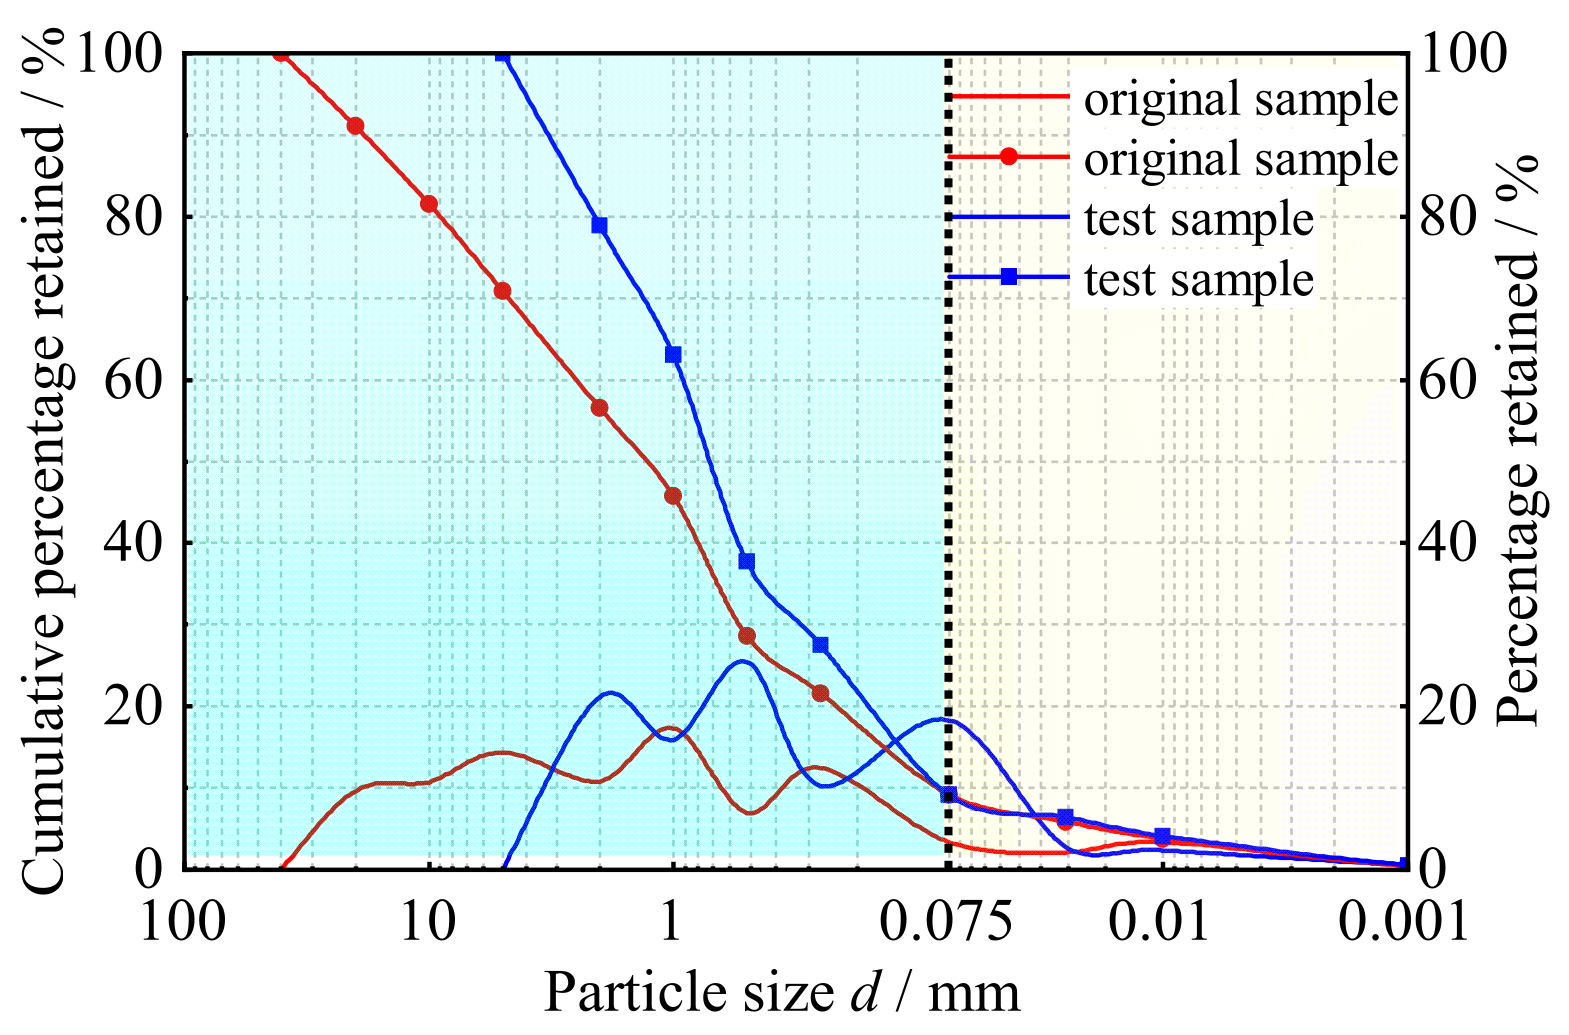
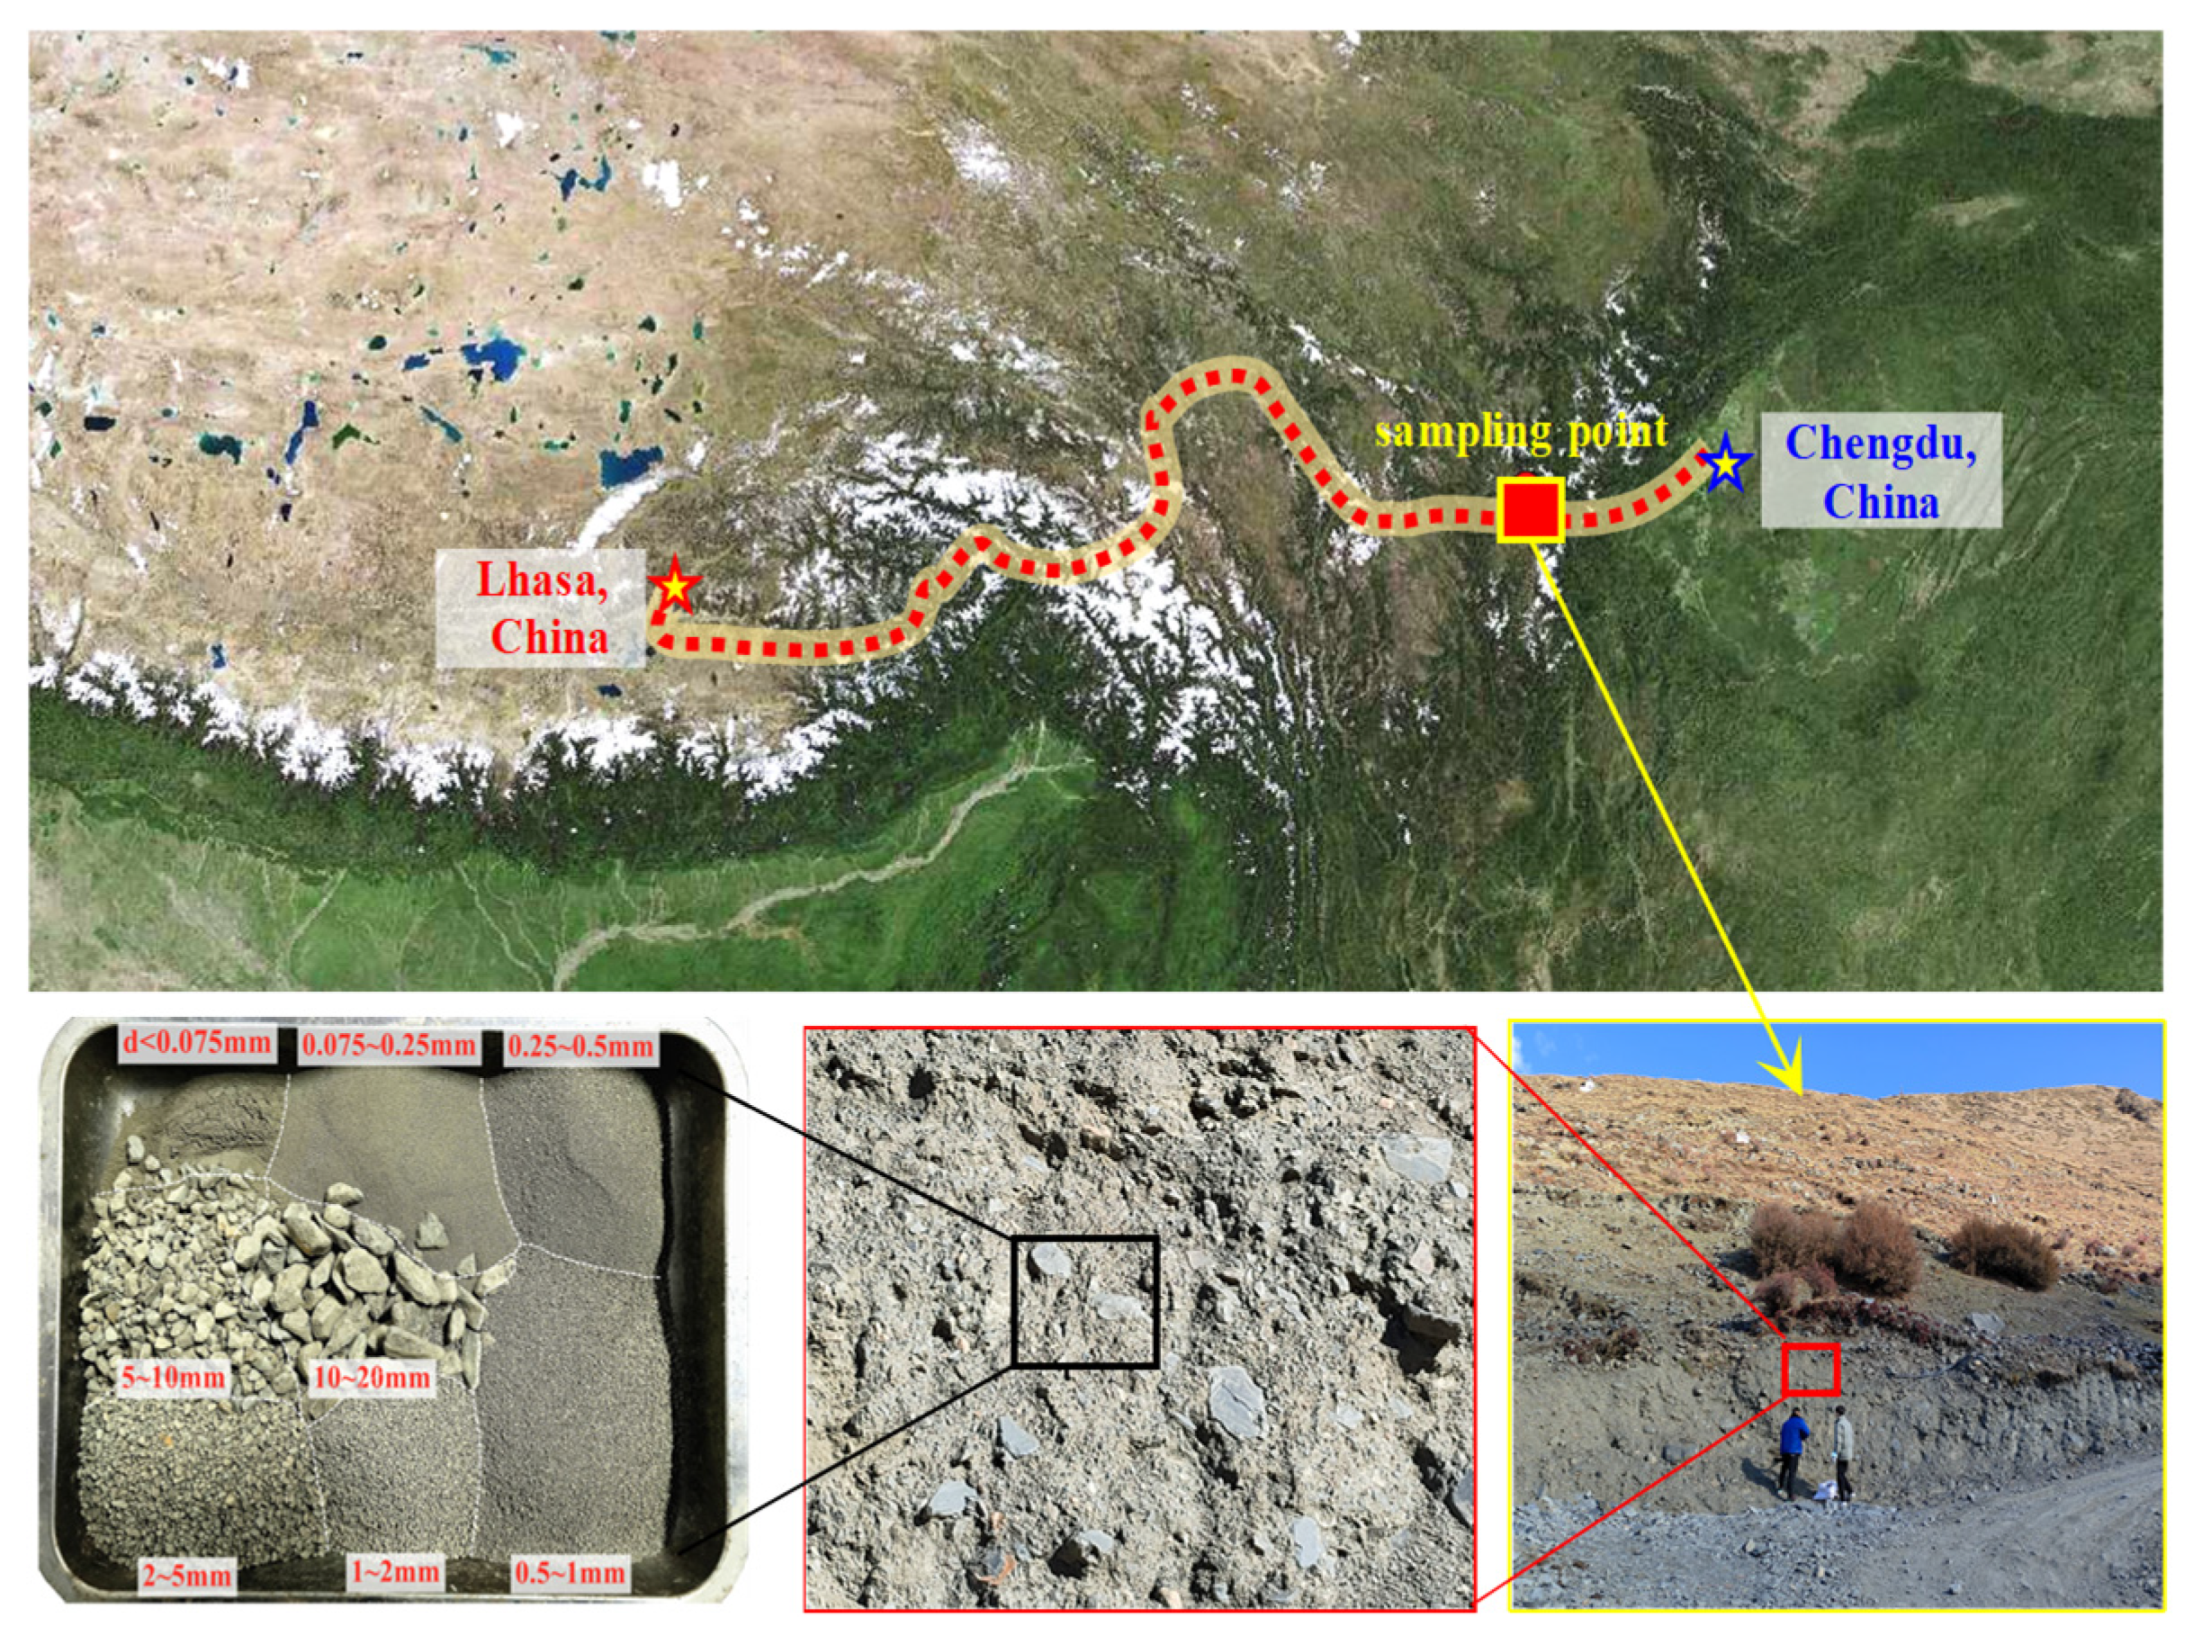
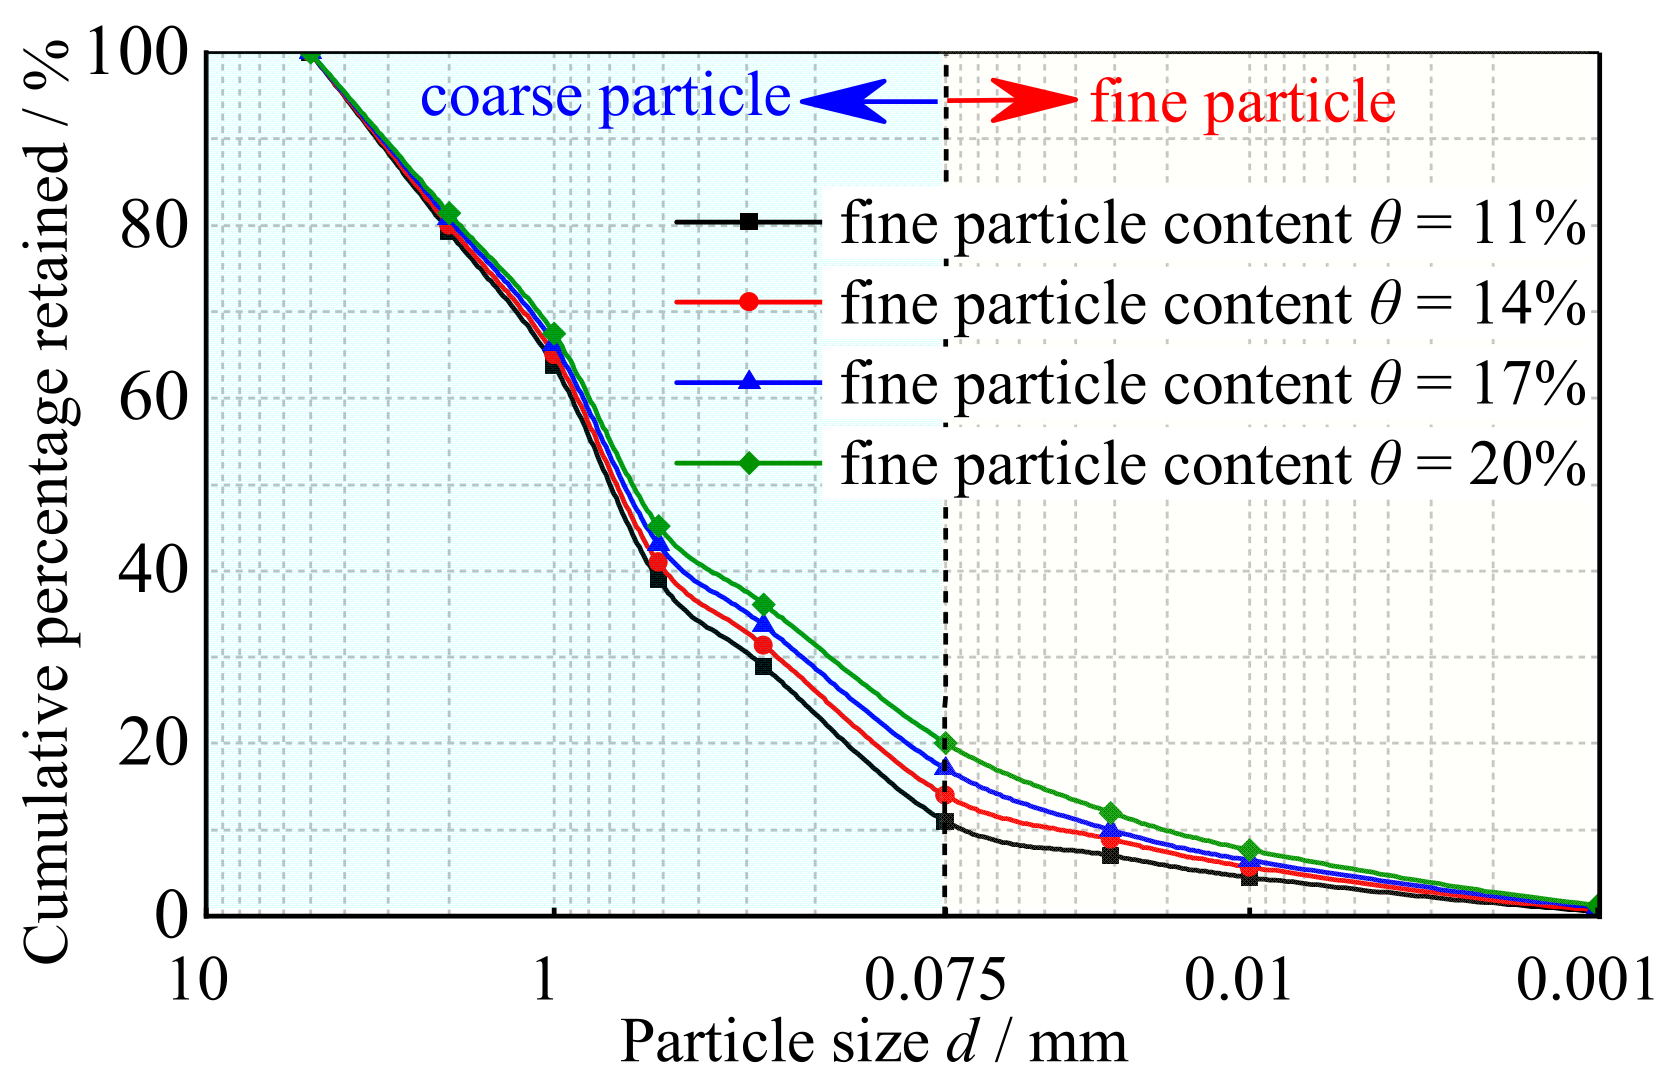
The specimens were collected from the slope of the residual accumulation layer in the Xinduqiao region along the Sichuan-Xizang Railway (elevation: H = 3640 m), which is a site-specific case study rather than a multi-regional survey, as depicted in Figure 1. These specimens comprise a heterogeneous mixture of coarse and fine particles, characterized by poor particle roundness, predominantly exhibiting angular to sub-angular shapes. The soil structure is notably loose, indicating low stability. Utilizing oven-drying and natural water immersion techniques, the natural water content (w0) of the specimens was measured at 10.1%, while the saturated water content (wsat) reached 14.6%. Employing the compaction method, funnel method, and graduated cylinder method, the optimal water content (w0) was determined to be 11.27%, accompanied by a maximum dry density (ρdmax) of 2.1 g/cm3 and a minimum dry density (ρdmin) of 1.4 g/cm3. Through sieve analysis and laser particle size analysis, it was revealed that the specimens consisted of 90.82% coarse particles and 9.18% fine particles, with a maximum particle size of 40 mm. Specifically, the gravel fraction (40 mm ≥ d > 2 mm) constituted 21.12%, the sand fraction (2 mm ≥ d > 0.075 mm) accounted for 69.70%, the silt fraction (0.075 mm ≥ d > 0.005 mm) made up 7.0%, and the clay fraction (0.005 mm ≥ d) comprised 2.18%. Due to the constraints of experimental equipment size, the maximum permissible particle size for the specimens was set at 5 mm. Consequently, based on the Standard for Geotechnical Testing Method (GB/T 50123-2019) of China’s national standard, the equal-mass-ratio substitution method was employed to handle oversized particles in the original specimens. The grain-size distribution curves for both the original specimens and the processed test specimens are illustrated in Figure 2.

2.2. Test Scheme and Methods

The orthogonal laboratory experiment was designed to investigate the shear deformation characteristics and sensitivity of the coarse-grained soil under the influence of various pivotal factors such as initial water content, dry density, fine particle content, and normal stress. To simulate the water content conditions of the soil across different seasons and slope depths, four water content levels (w = 10%, 12%, 14%, and 18%) were chosen based on the hydrological properties of the specimens. To explore the compaction state of the soil at varying burial depths, four dry densities (ρd = 1.35, 1.50, 1.65, and 1.80 g/cm3) were established, aligning with the density characteristics of the specimens. Considering the particle size distribution characteristics of the soil at different elevations and layers of the high-altitude slope, the fine particle content (θ) was set at 11%, 14%, 17%, and 20%, as depicted in Figure 3. To reflect the stress state characteristics of the deep slope sections, four levels of normal stress (σ = 50, 100, 200, and 300 kPa) were selected for the experiment. Given rapid instability characteristics of high-altitude accumulation layer slopes, a shear rate of 0.8 mm/min was chosen for the strain-controlled direct shear tests under multi-factor conditions. During the experiment, to address the issue of non-uniform shear dilation deformation caused by uneven stress distribution on the shear surface in direct shear tests, the DSJ-4 direct shear apparatus was modified. Deformation sensors were installed at both the front and rear ends of the specimens in the shear direction, enabling the observation of normal deformation at various positions throughout the entire shear process. Three different specimens were used to represent one case, and their average was considered to represent the result of one specimen to ensure reliability. There are a total of 48 groups and 144 test specimens.

2.3. Revised Calculation Formula of Shear Stress

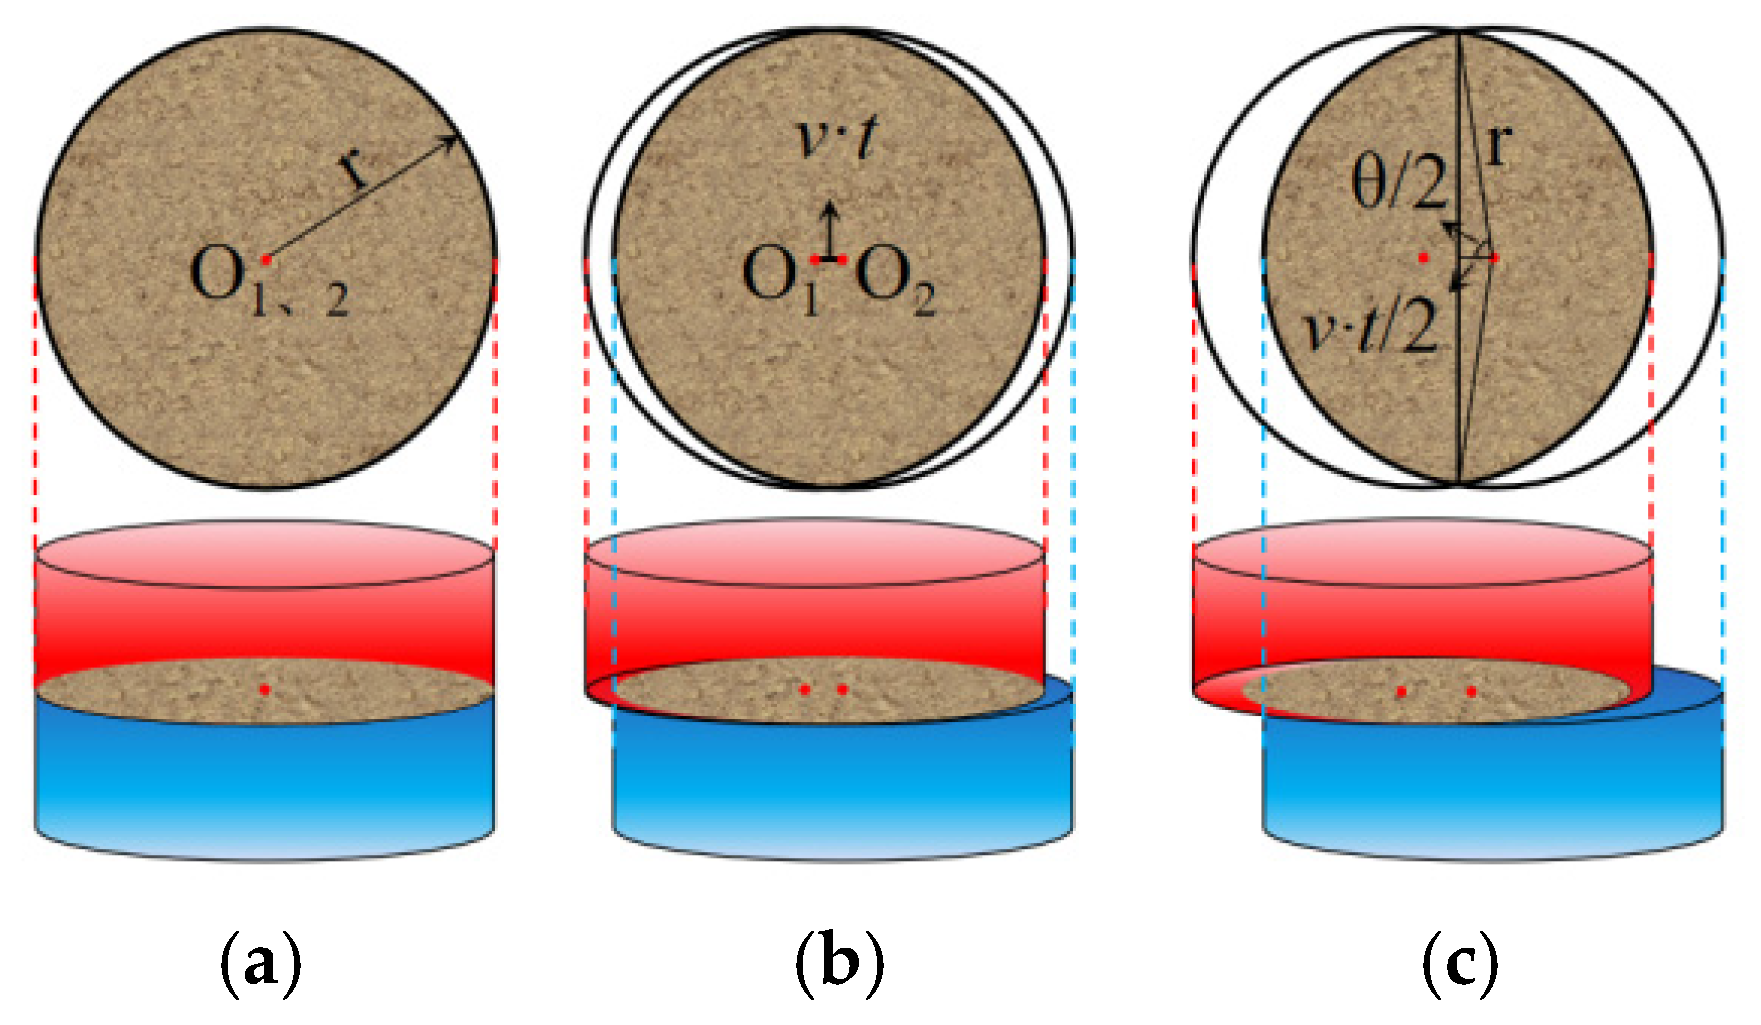
In direct shear tests, the actual shear surface undergoes a continuous dynamic reduction process. However, the traditional shear stress calculation formula assumes a constant shear surface area, leading to calculated shear stress values that are frequently lower than the actual values, thereby failing to accurately reflect the true shear resistance capacity of specimens, as shown in Figure 4.
To tackle this issue, leveraging the characteristics of strain-controlled direct shear tests, wherein shear displacement increases at a constant rate, the relationship between the actual shear surface area (Si) and shear time (t) can be formulated as follows:
S i = r 2 θ π 180 sin θ       = S 0 π π 90 cos 1 v t 2 S 0 / π sin cos 1 v t 2 S 0 / π
where Si represents the actual shear plane area of the specimen, mm2; S0 denotes the initial shear plane area of the specimen, mm2; r is the radius of the initial shear plane, mm; θ signifies the angle of the maximum chord length on the actual shear surface; v is the shear rate, mm/s; and t represents the shear time, s.
By substituting Equation (1) into the shear stress calculation formula, the corrected actual shear stress τi of the sample can be expressed as:
τ i = 10 C R π S 0 ( π 90 cos 1 v t 2 S 0 π sin ( 2 cos 1 v t 2 S 0 π ) )
where τi represents the actual shear stress of the sample, kPa; C denotes the calibration coefficient of the load cell, N/0.01 mm; and R is the reading of the load cell, 0.01 mm.

3. Test Results and Analysis

3.1. Stress–Strain Relationships Under Multiple Factors

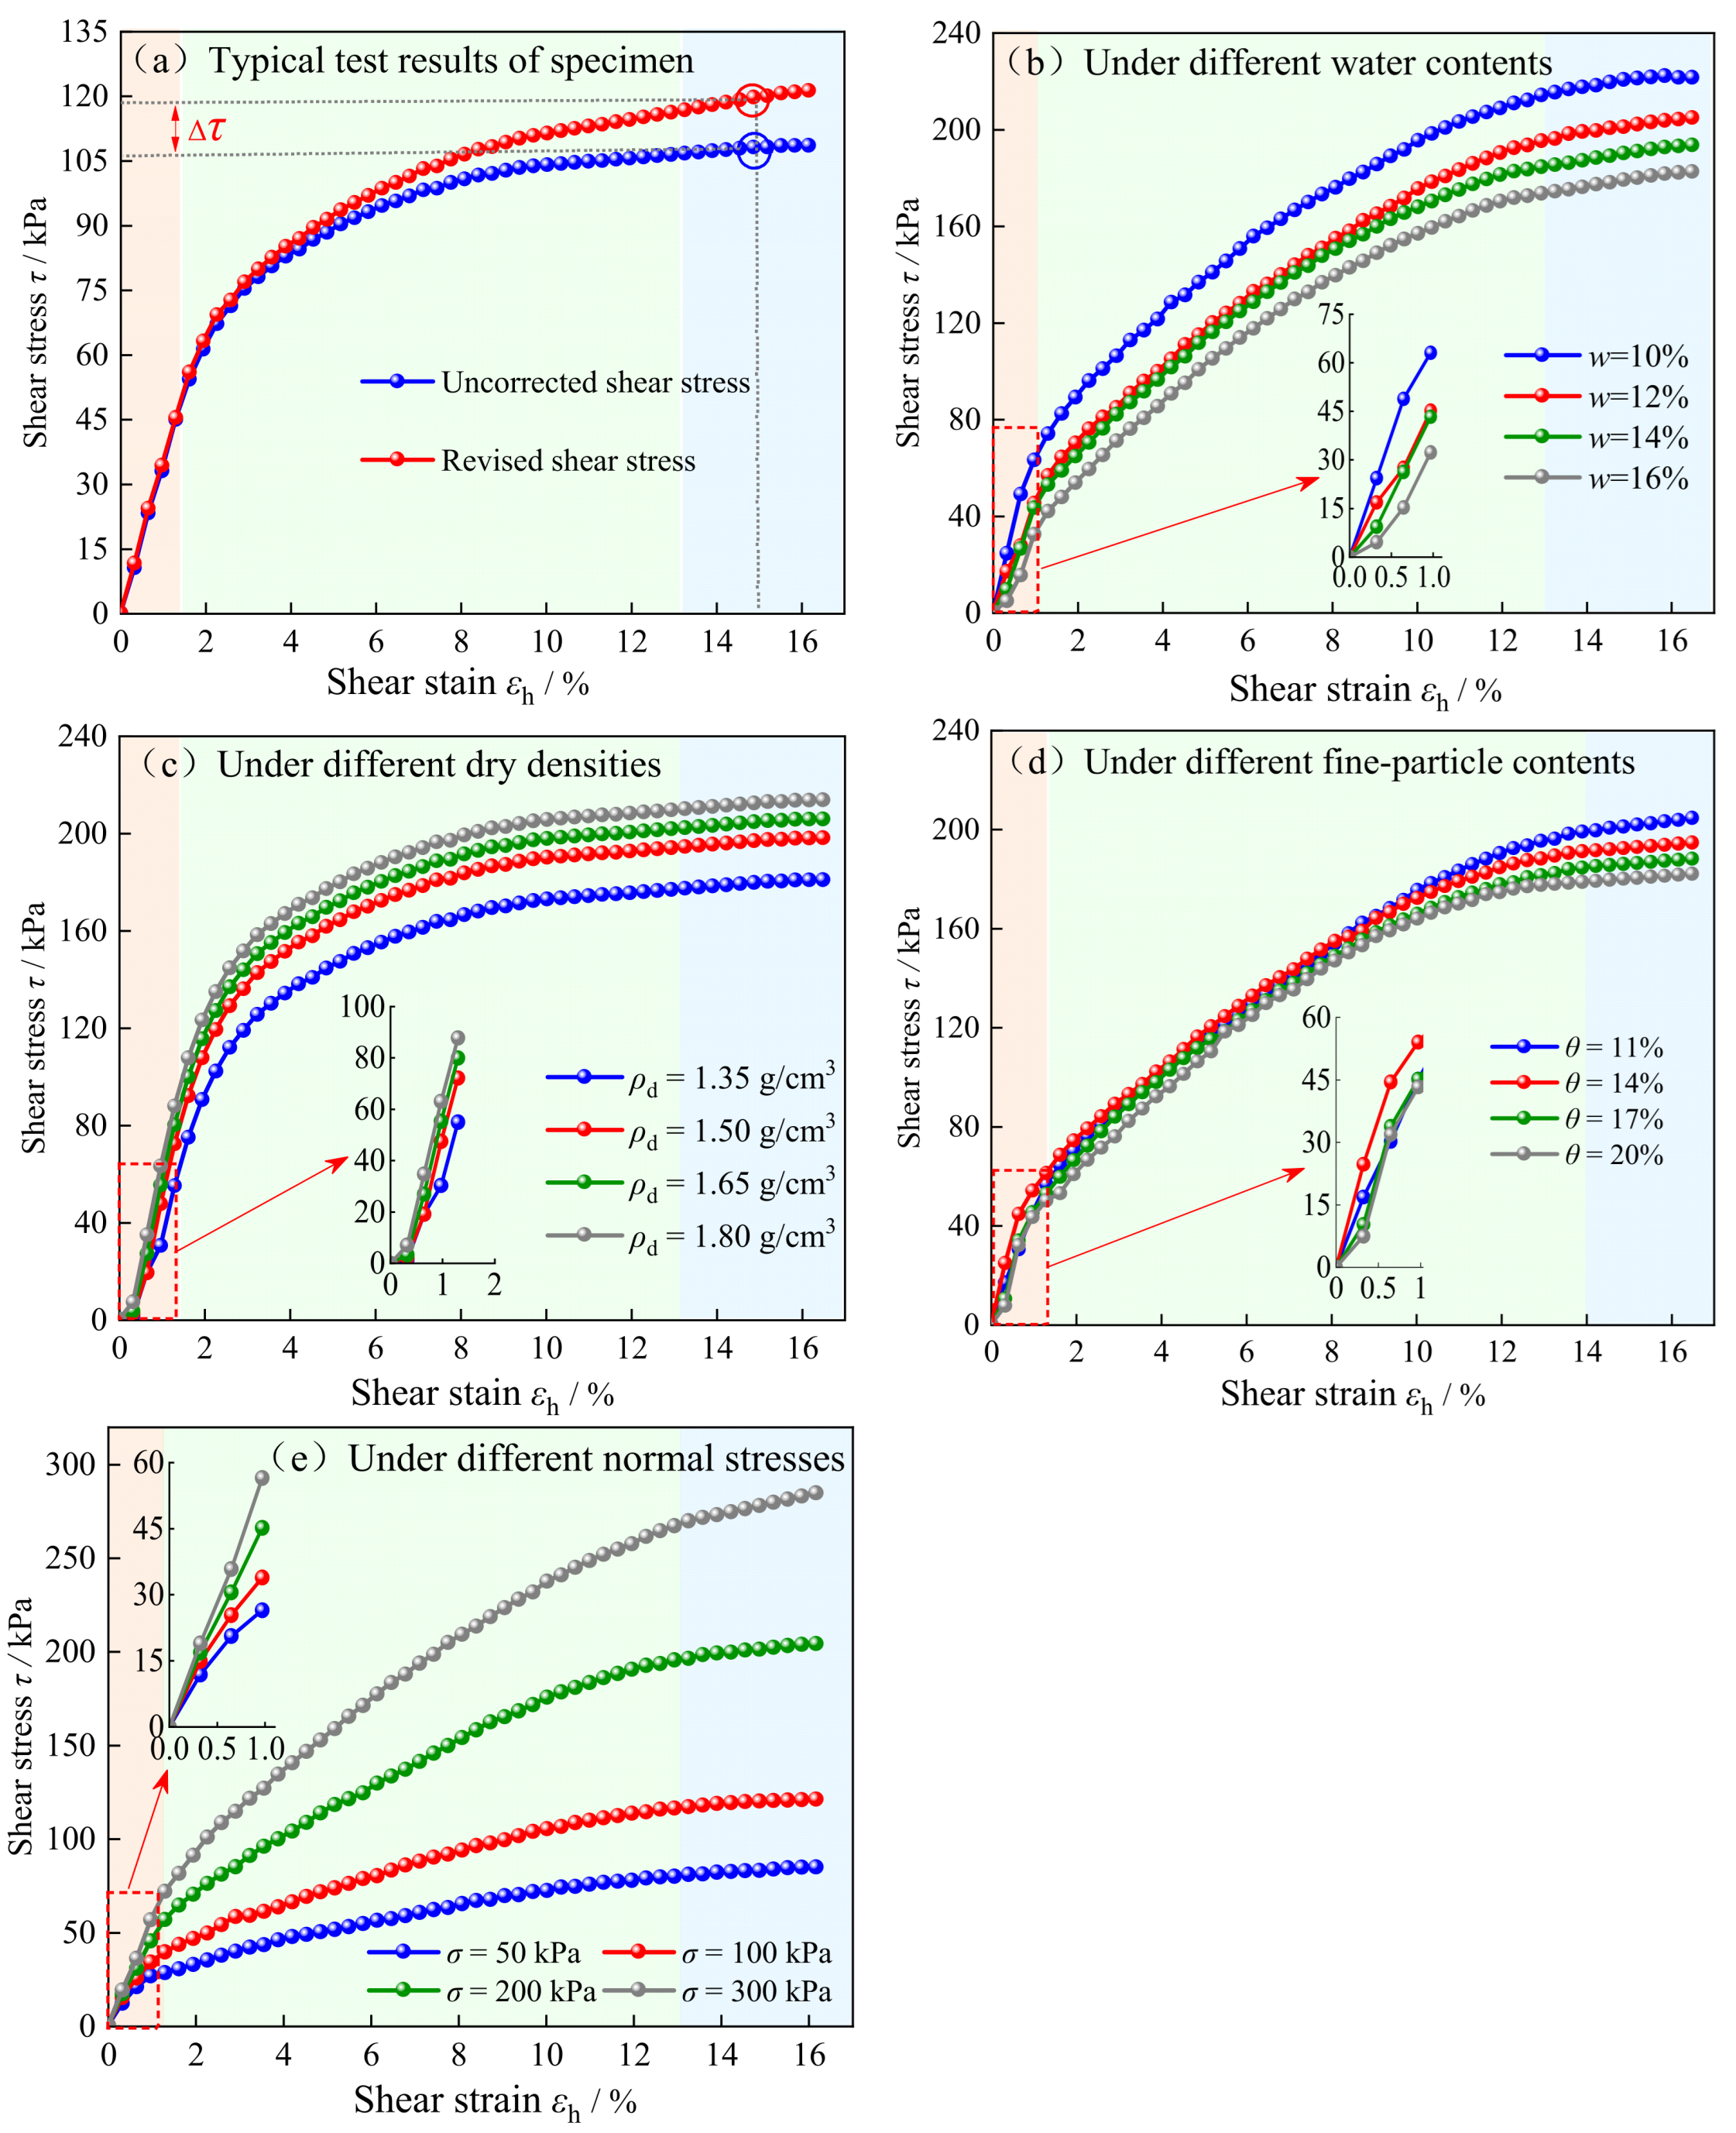
The revised shear stress-shear strain (τ-εh) relationship curves for the coarse-grained soil samples under different initial water content (w), dry density (ρd), fine particle content (θ), and normal stress (σ) conditions are presented in Figure 5. As illustrated in Figure 5a, at identical shear strain levels, the revised shear stress of the specimens consistently exceeds the uncorrected shear stress. Furthermore, the shear stress-shear strain relationship curves for all specimens under the experimental conditions exhibit strain-hardening behavior. The entire shear deformation process can be segmented into three stages: ① When the shear strain (ε) increases from 0% to 1.0–2.0%, the shear stress of the specimens demonstrates a rapid linear increase. ② Subsequently, the shear stress increases non-linearly with the shear strain. ③ When the shear strain reaches 13–15%, the shear stress of the specimens gradually stabilizes. Nevertheless, there are notable disparities in the influence patterns of different factors on the shear stress-shear strain relationship curves of the specimens.
Regarding the influence of initial water content (Figure 5b), it is observed that under a lower water content condition (w = 10%), the revised shear stress required for the sample to attain 15% shear strain is 221.04 kPa. Conversely, at a higher water content (w = 16%), only 179.56 kPa is necessary, representing an reduction of 18.8% reduction. As depicted, with an increase in water content, the revised shear stress corresponding to the same shear strain diminishes, indicating that elevated water content reduces the sample’s resistance to shear deformation. This suggests that the initial water content exerts a monotonically weakening effect on the strain-hardening stress–strain relationship of the sample. This phenomenon occurs because, as pore water increases, the water film on particle surfaces thickens, the clay effect of fine particles becomes more pronounced, and matrix suction decreases significantly, thereby requiring less external force for shear deformation. From Figure 5c, it is evident that the higher the dry density (ρd), the steeper the slope of the stress–strain relationship curve and the higher the shear stress values. For instance, the stable shear stress of the sample is 180.0 kPa at a lower dry density (ρd = 1.35 g/cm3), but it increases by 18.2% when the dry density reaches 1.80 g/cm3. This indicates that dry density has a monotonically strengthening effect on the shear deformation hardening of the sample. This is attributed to the fact that, as dry density increases, particle arrangement becomes more compact, pores become smaller, and inter-particle interlocking forces strengthen, thereby increasing resistance to shear deformation.
The influence of fine particle content (θ) on the shear stress–strain relationship of the sample exhibits a pattern similar to that of initial water content (w), demonstrating a weakening effect on the sample’s strain-hardening deformation (Figure 5d). Specifically, as the fine particle content increases, both the slope of the curve and the stable shear stress decrease, albeit the reduction is less pronounced than that caused by water content. When the fine particle content (θ) is 11%, the stable shear stress (τf) of the sample is 201.53 kPa. However, when θ = 20%, the stable shear stress decreases to 180.27 kPa, a reduction of 10.5%. This is because, as fine particles (such as silt and clay) increase, they gradually envelop coarse particles and fill larger pores, diminishing the interlocking effect of coarse particles, weakening the skeletal structure of the sample, and thereby decreasing resistance to shear deformation under the same external shear stress [10,23]. For the effect of normal stress (Figure 5e), the shear stress-shear strain relationship curve of the sample follows a trend similar to that observed with dry density, but the reinforcing effect of normal stress is more pronounced. For example, when the normal stress increases from 50 kPa to 300 kPa, the stable shear stress of the sample increases from 83.14 kPa to 278.74 kPa, an increase of 235.3%. This is because the increased normal stress enhances the shear stress state of the sample, making particle arrangement more compact, and thus the sample needs to overcome additional external stress when undergoing shear deformation [18].

3.2. Shear Modulus Under Multiple Factors

The shear modulus (G) serves as a pivotal indicator of a material’s capacity to withstand shear deformation [13]. Here, it is defined as the gradient of the initial linear segment of the specimen’s shear stress-shear strain relationship curve (Figure 5).
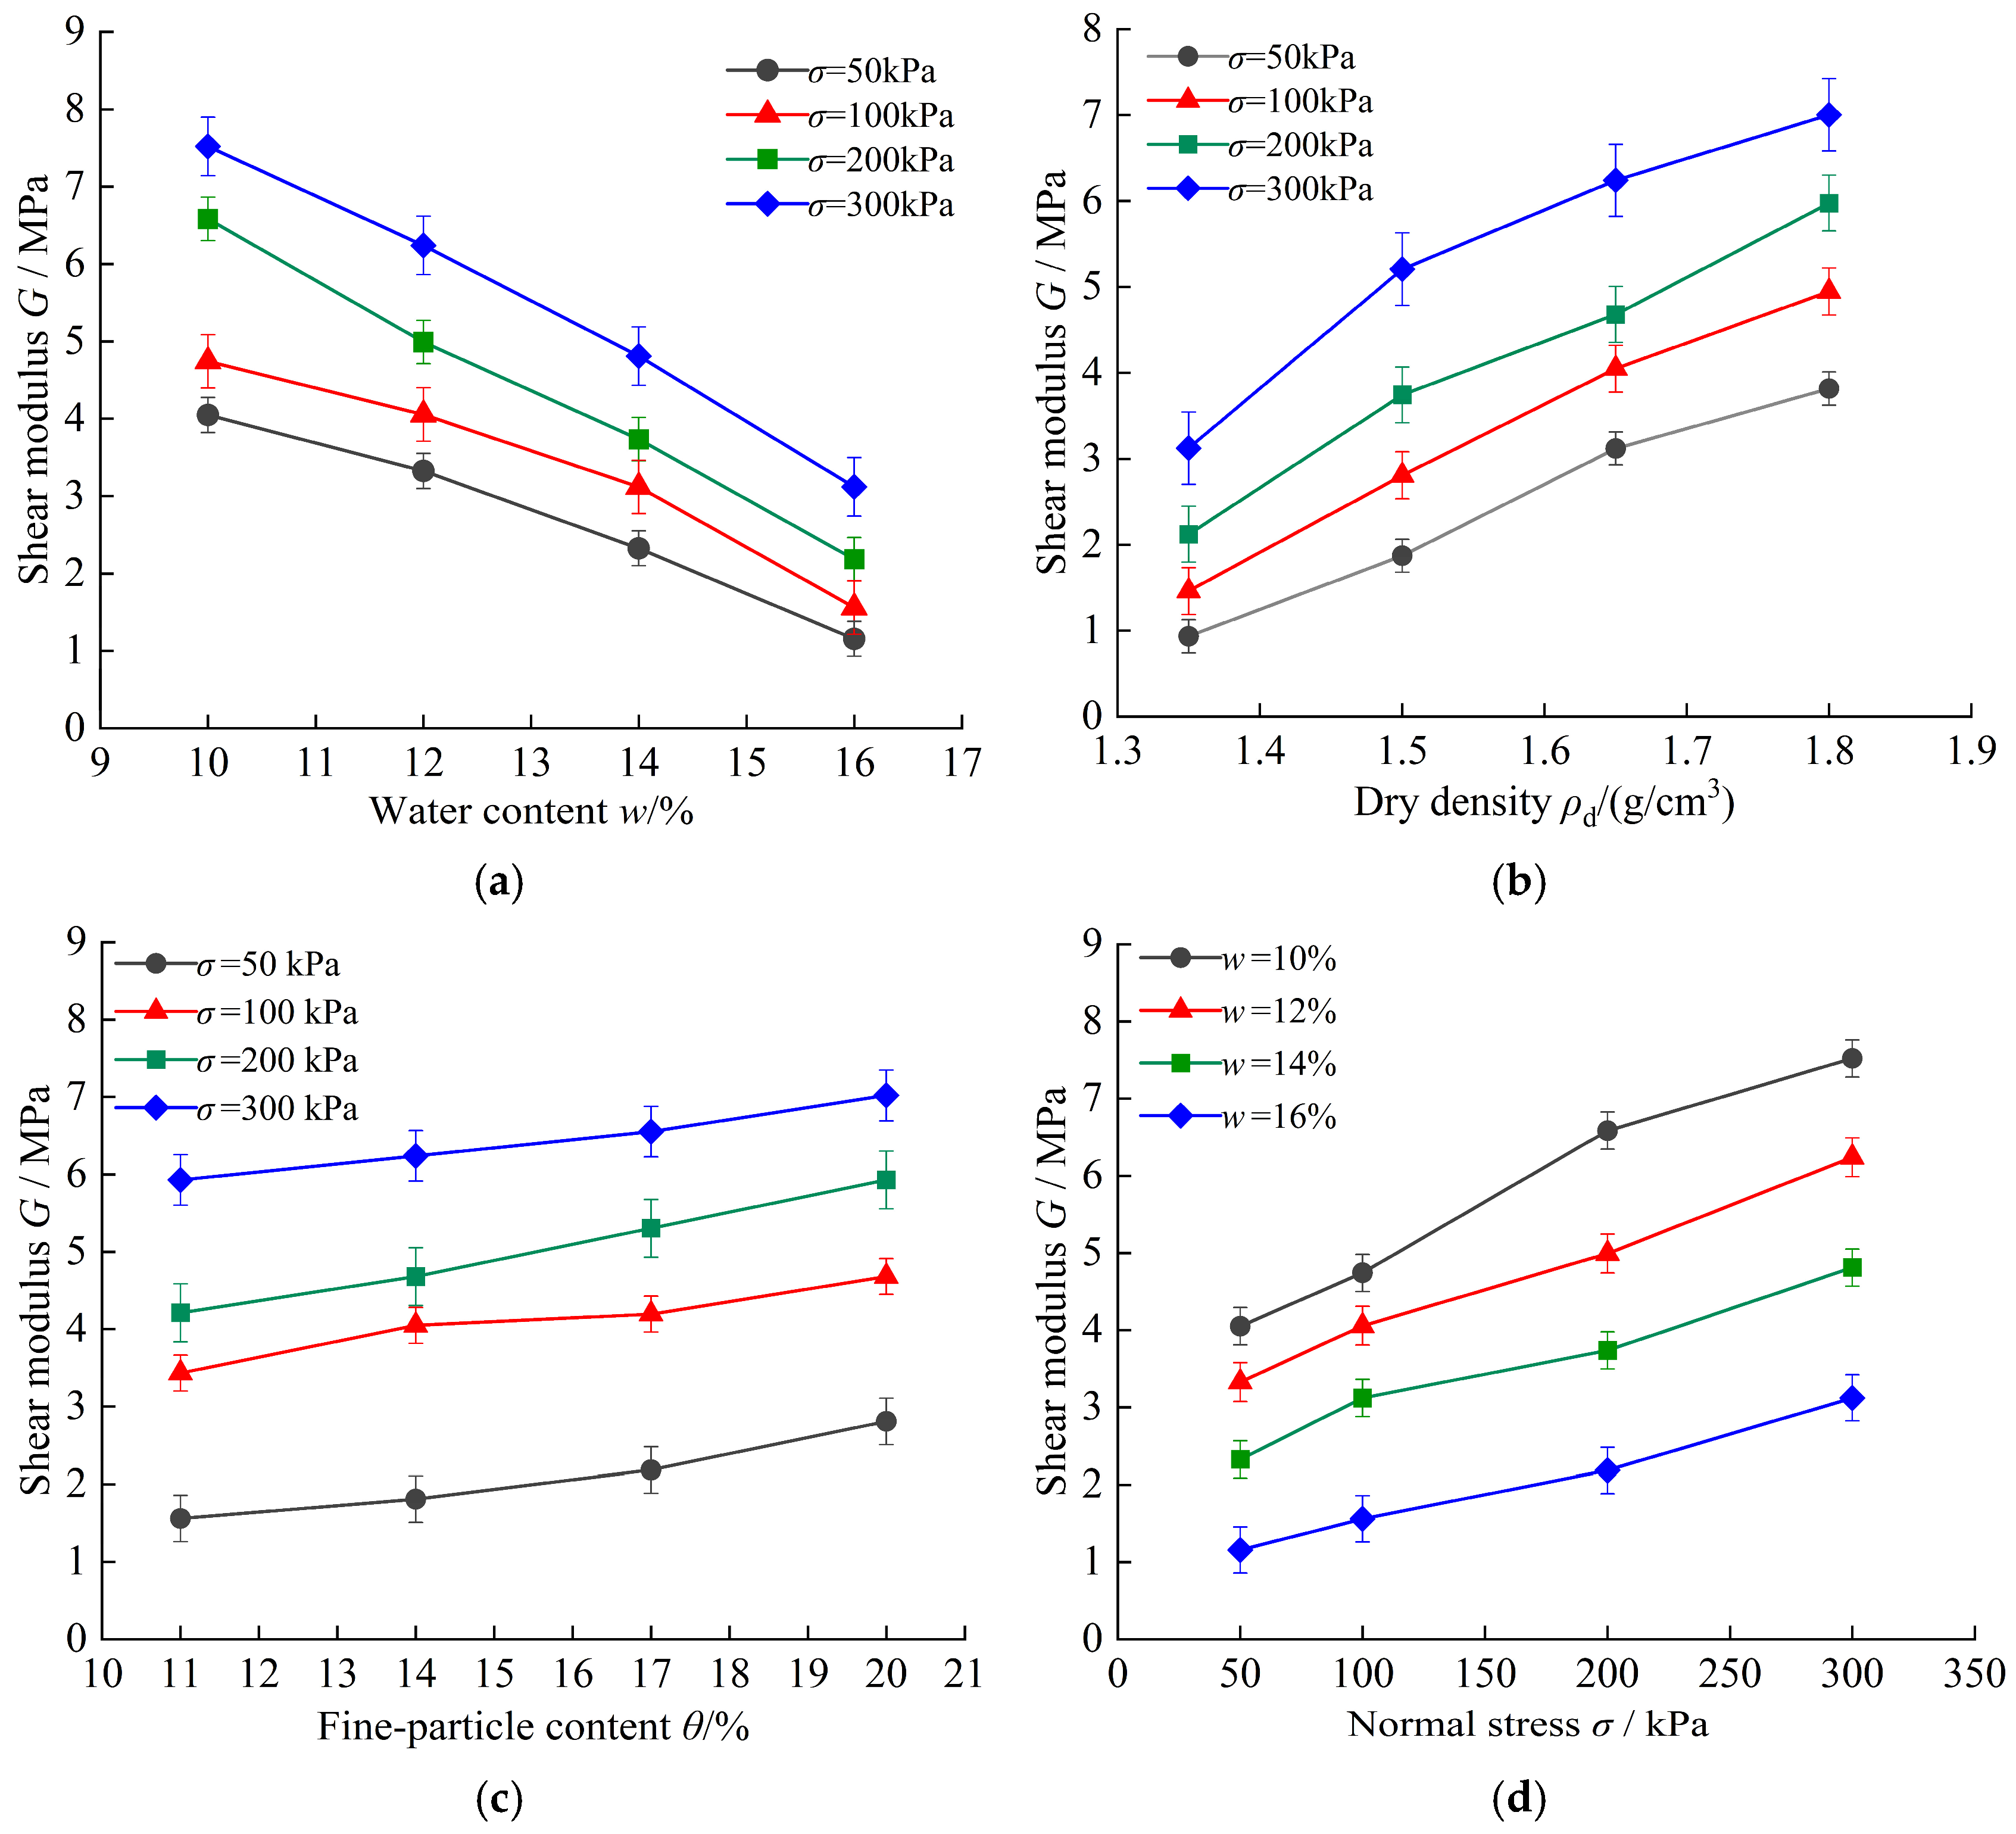
The variation in the shear modulus of the coarse-grained soil specimen under disparate experimental factors is exhibited in Figure 6. Regarding the impact of water content, taking the scenario of normal stress σ = 50 kPa in Figure 6a as an example, it is observed that the shear modulus of the specimen is 4.05 MPa at a low water content (w = 10%), and it declines to 1.15 MPa as the water content rises to 16%, representing a 71.6% reduction. It is apparent that the shear modulus of the specimen diminishes significantly with an augmentation in initial water content (w), attributable to the increased water content thickening the water film on the specimen particles, diminishing the capillary suction between fine particles, and reducing the resistance to particle movement, thereby swiftly weakening the specimen’s capacity to resist shear deformation [24]. Furthermore, as the normal stress intensifies, the reduction in shear modulus with increasing water content becomes less pronounced, indicating that normal stress attenuates the effect of water content.
As illustrated in Figure 6b, dry density exerts a monotonically reinforcing effect on the shear modulus of the specimen, with the shear modulus ranging from 0.94 to 3.12 MPa at a low dry density (ρd = 1.35 g/cm3), and escalating to 3.82 to 7 MPa at a higher dry density (ρd = 1.80 g/cm3), representing a 1.24 to 3.08 fold increase. This is because as dry density rises, the number of particles per unit volume increases, the particles are more densely packed, and the inter-particle interlocking of coarse particles becomes more robust, resulting in greater resistance to shear deformation and a heightened capacity to withstand deformation. Moreover, as normal stress intensifies, the increase in shear modulus with dry density becomes less significant, indicating that normal stress weakens the reinforcing effect of dry density.
Concerning the effect of fine particle content (Figure 6c), it is observed that the shear modulus of the specimen consistently increases non-linearly with an augmentation in fine particle content, initially at a sluggish pace and subsequently more rapidly. When the fine particle content is low (θ = 11%), the shear modulus of the specimen ranges between 1.56 and 5.93 MPa. In contrast, when the fine particle content is high (θ = 20%), the shear modulus increases by 18.4% to 80%. Additionally, the higher the normal stress, the lower the rate of increase in shear modulus. This is attributed to the fact that the increased fine particles enhance particle gradation, resulting in a more compact arrangement and thereby improving the pore structure of the coarse particle skeleton. Concurrently, the augmented cohesion between particles due to the fine particles strengthens the bond between coarse and fine particles, forming a dense structure with enhanced resistance to shear deformation [21,22]. As depicted in Figure 6d, compared to the scenario under lower normal stress (σ = 50 kPa), the shear modulus of the sample under higher normal stress (σ = 300 kPa) increased by 85.7% to 169.7%. It is evident that the impact of normal stress on the shear modulus of the sample is analogous to that of dry density and fine particle content, both exhibiting a monotonically reinforcing effect. Nevertheless, the underlying of these effects are markedly different. In this context, normal stress elevates the stress state of the particles, thereby increasing resistance to particle movement during shear deformation.

3.3. Shear Dilation Under Multiple Factors

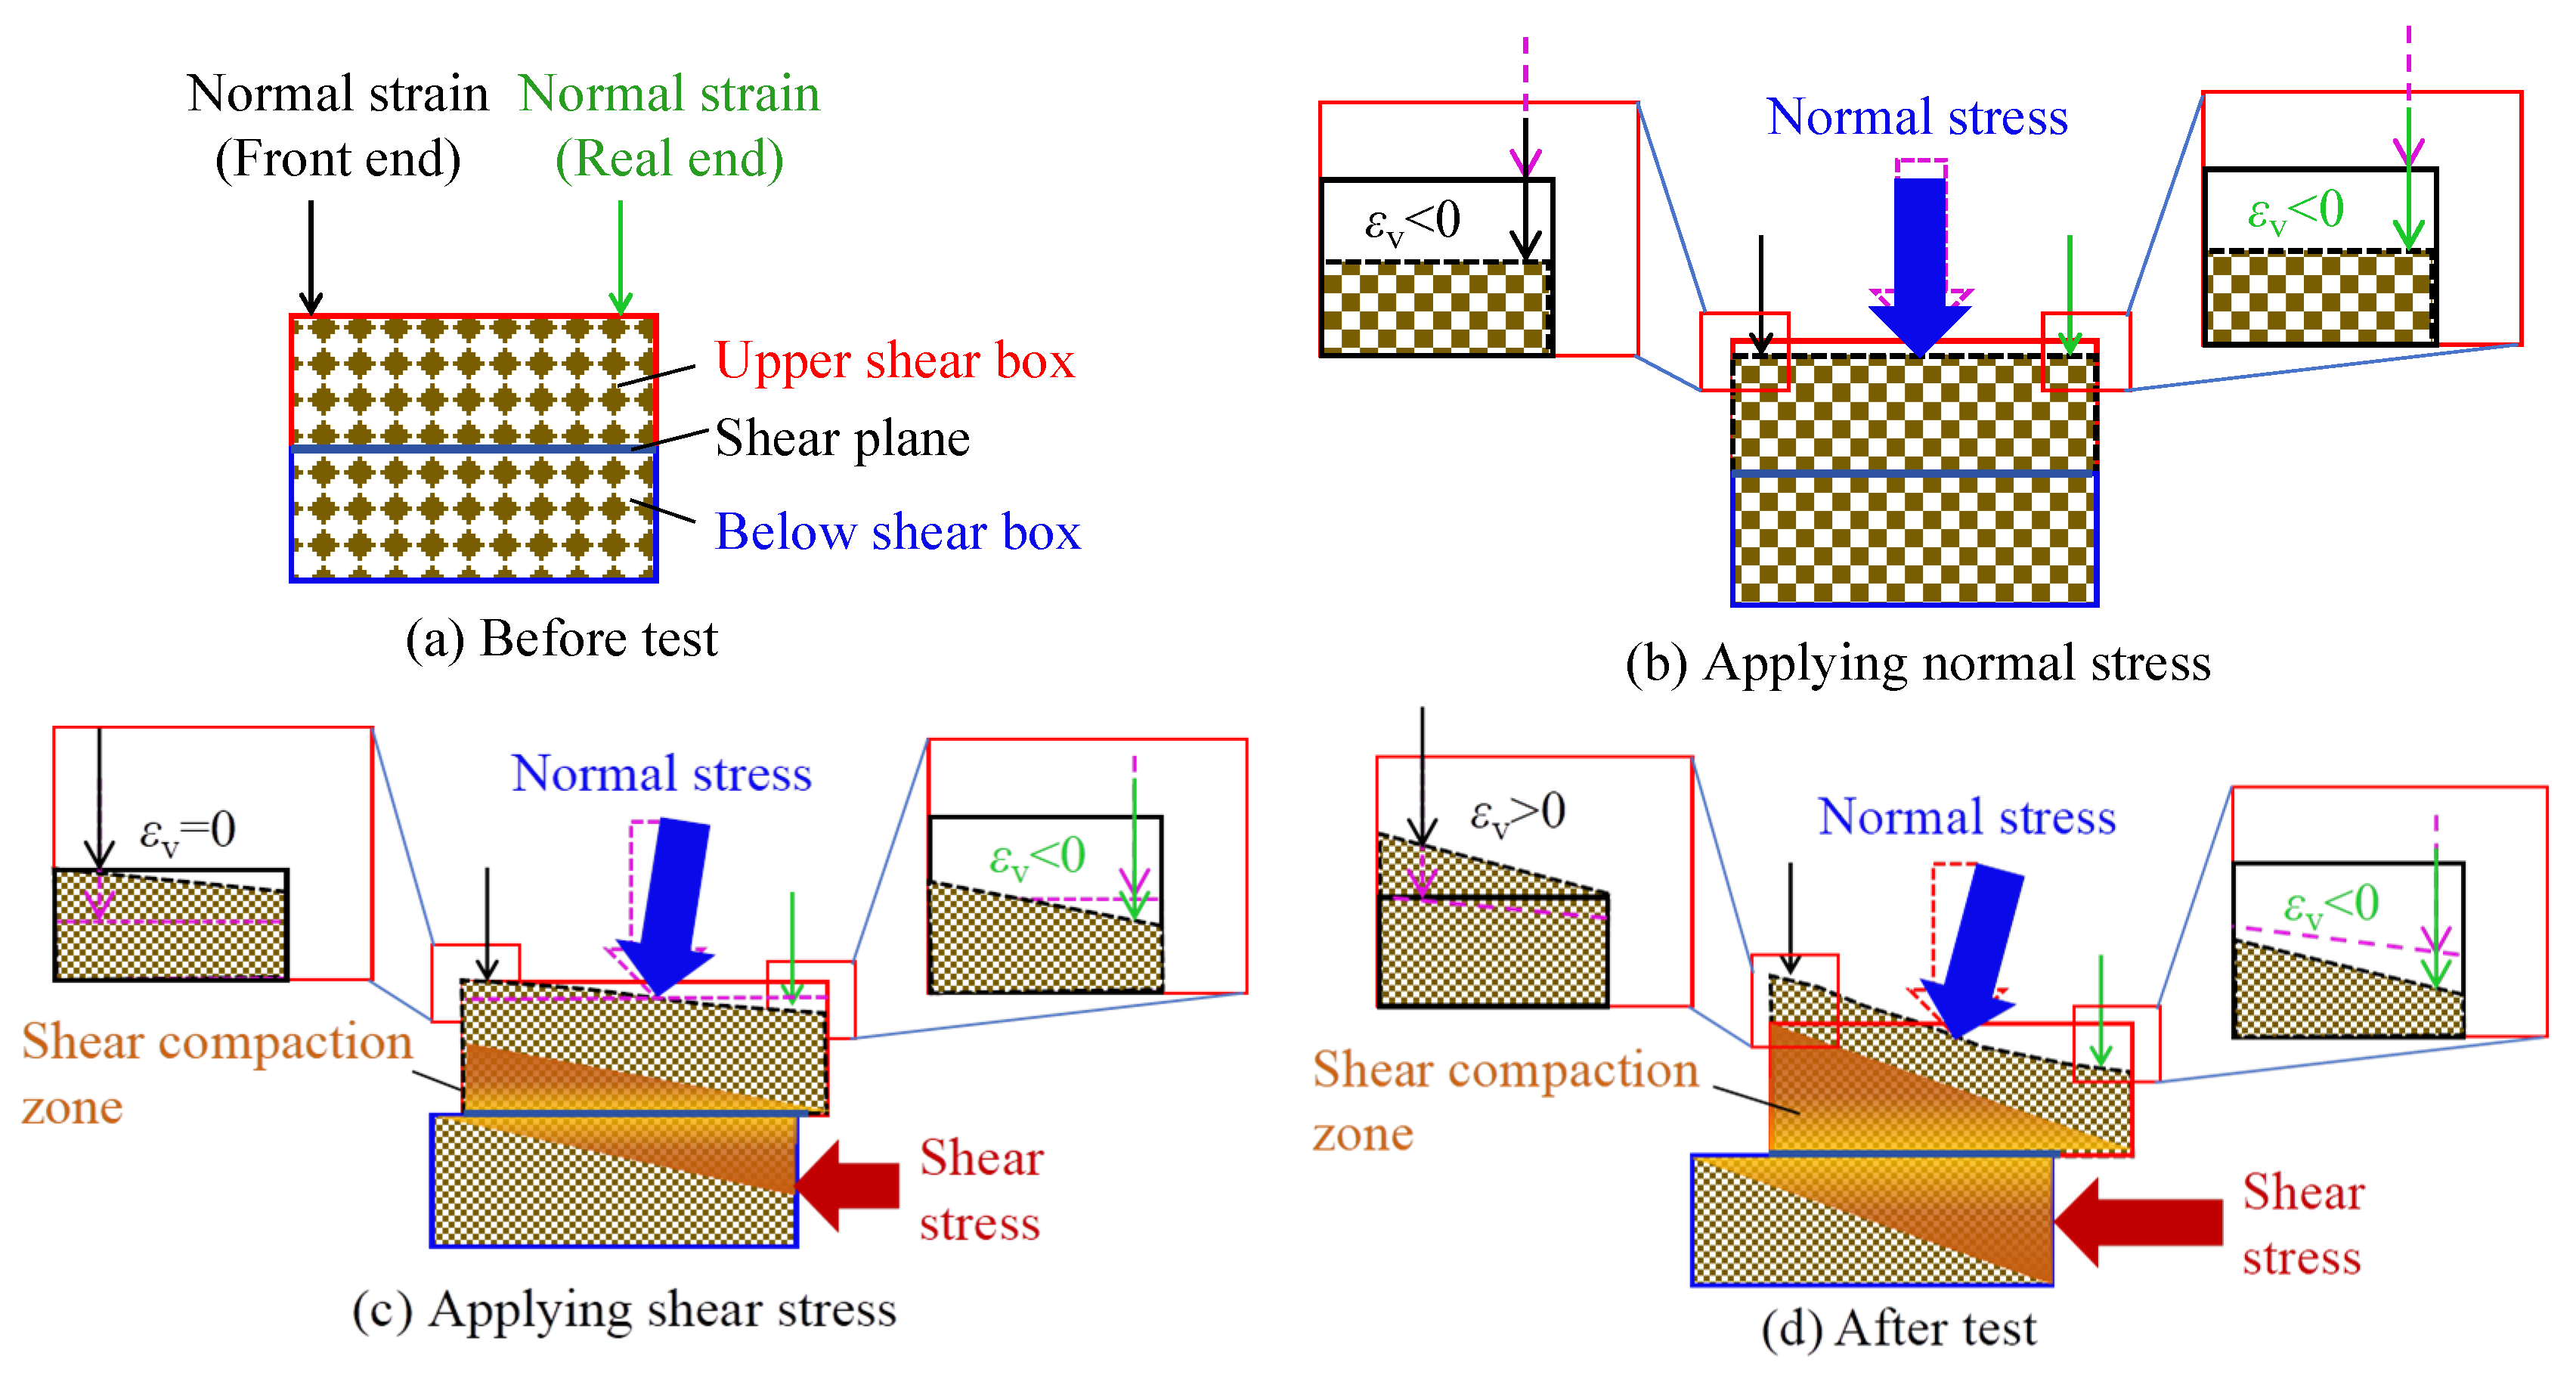
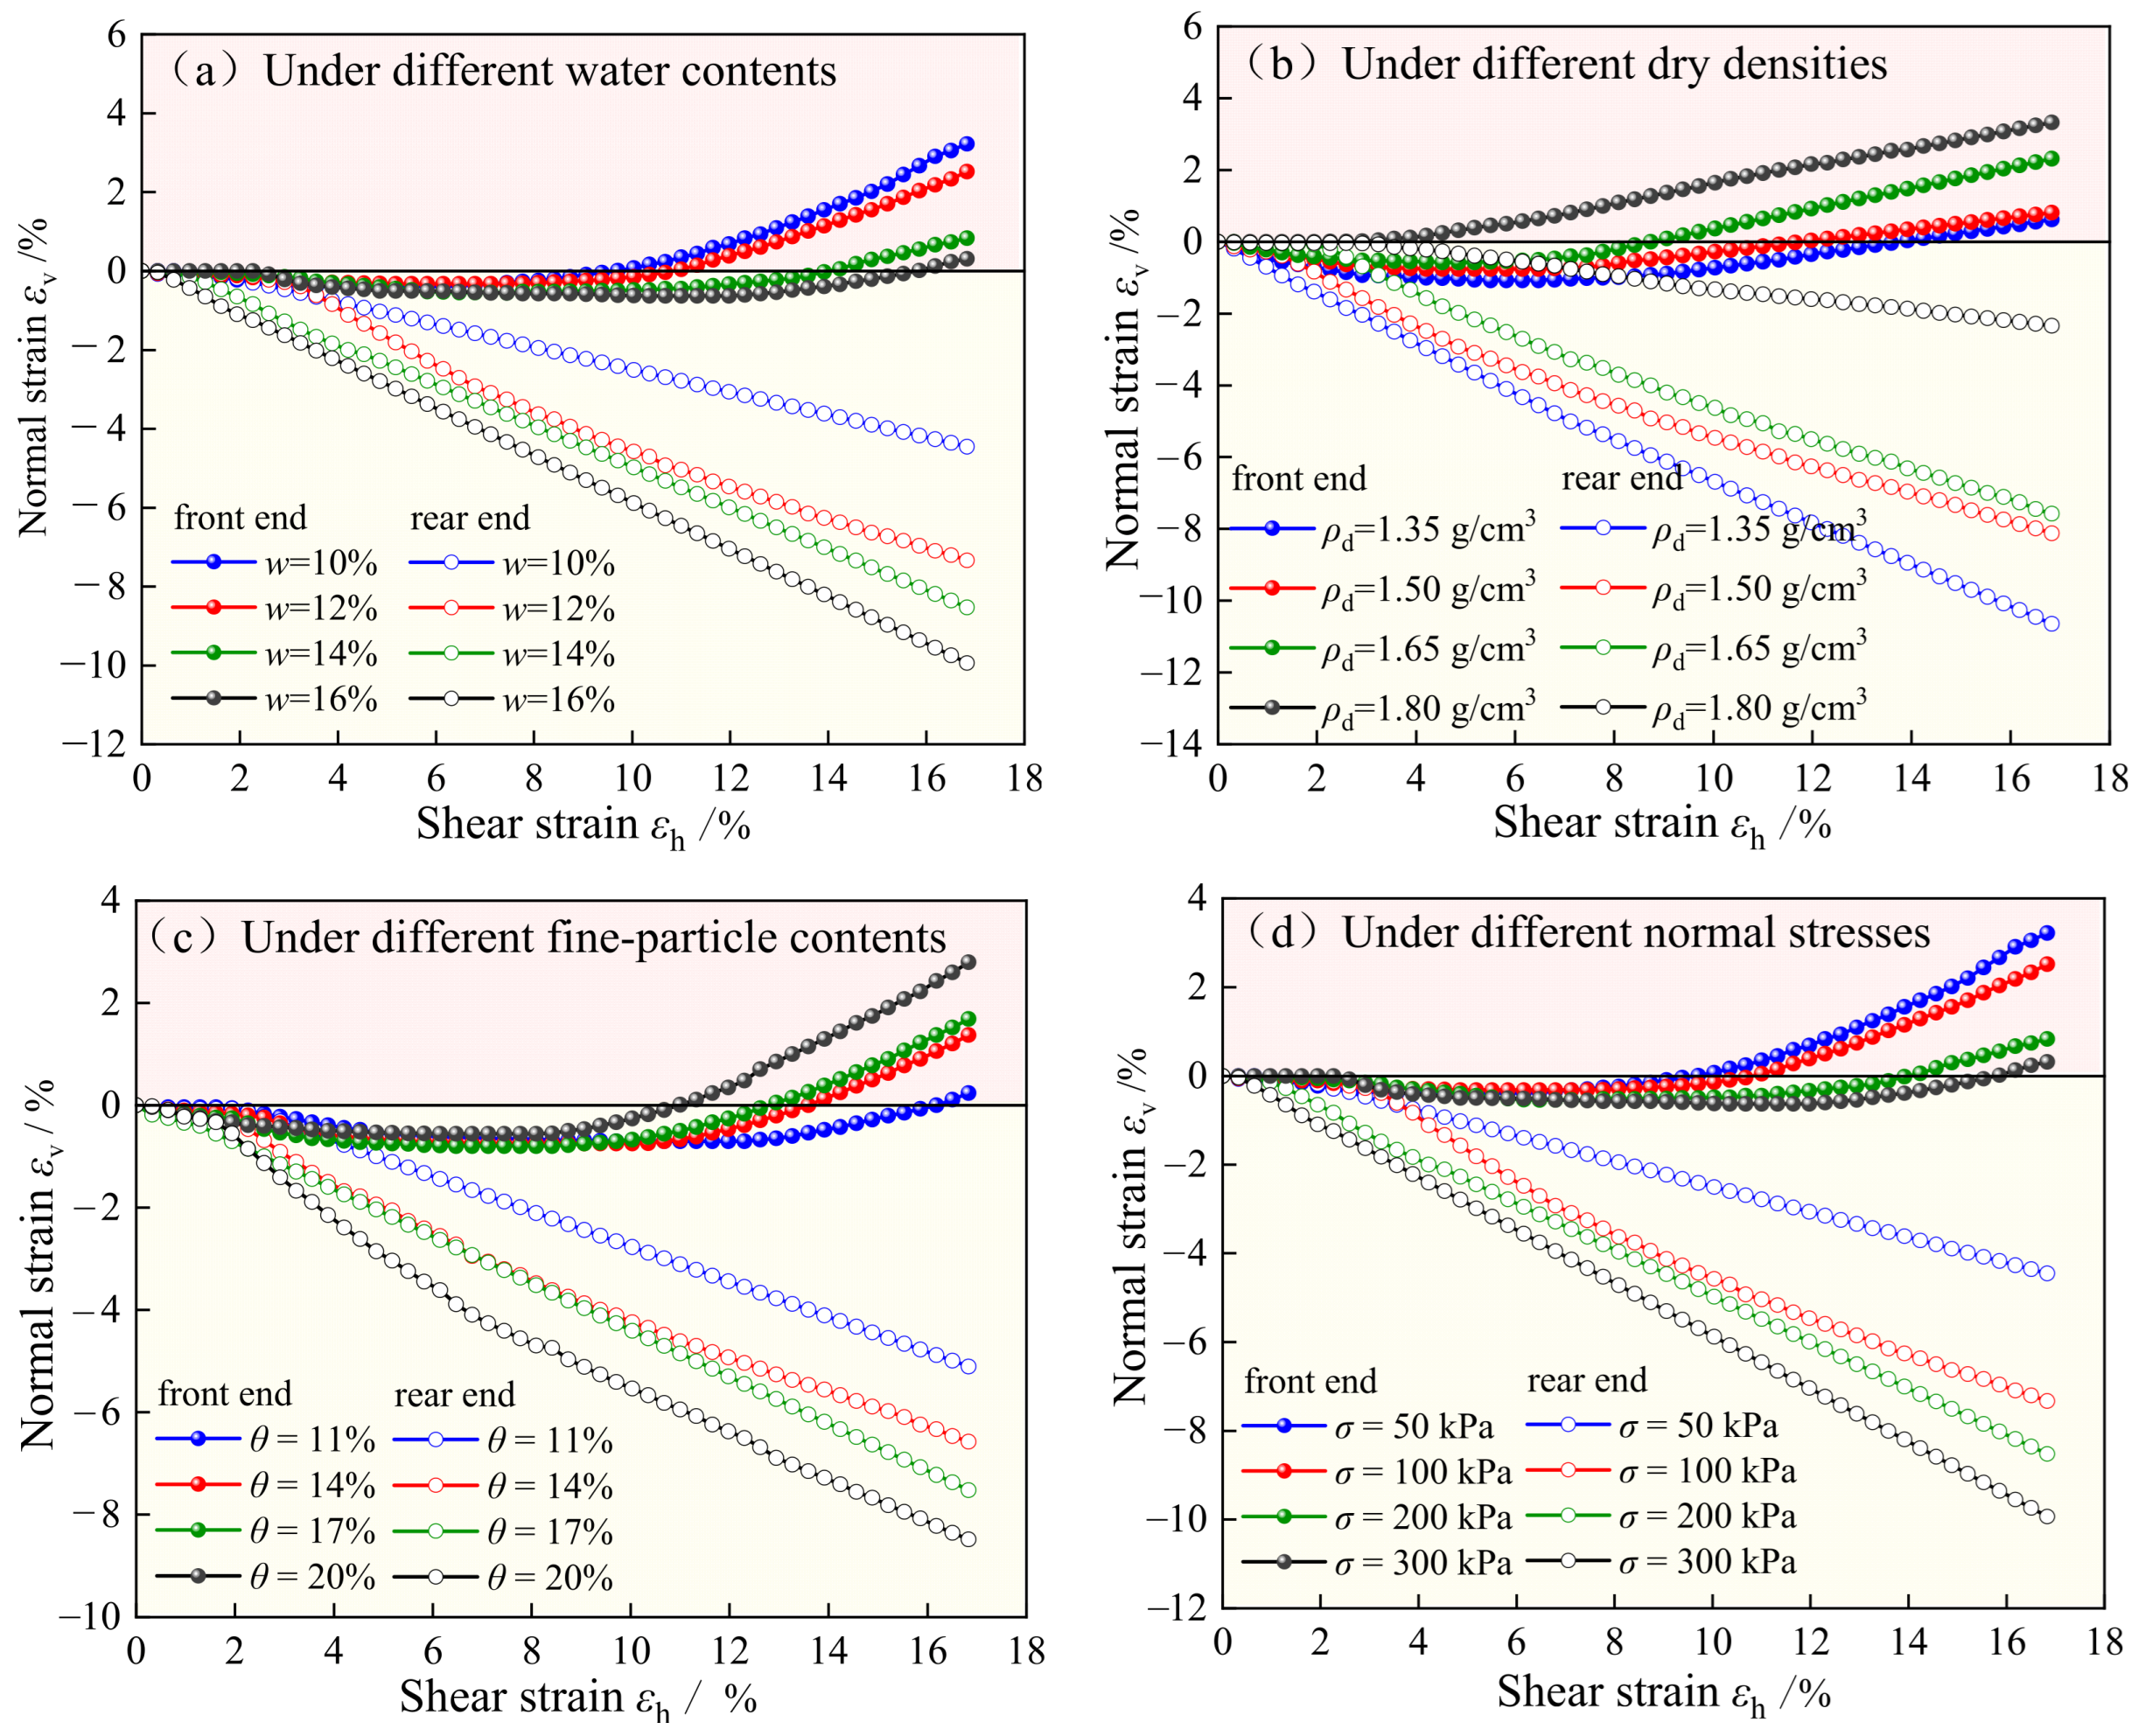
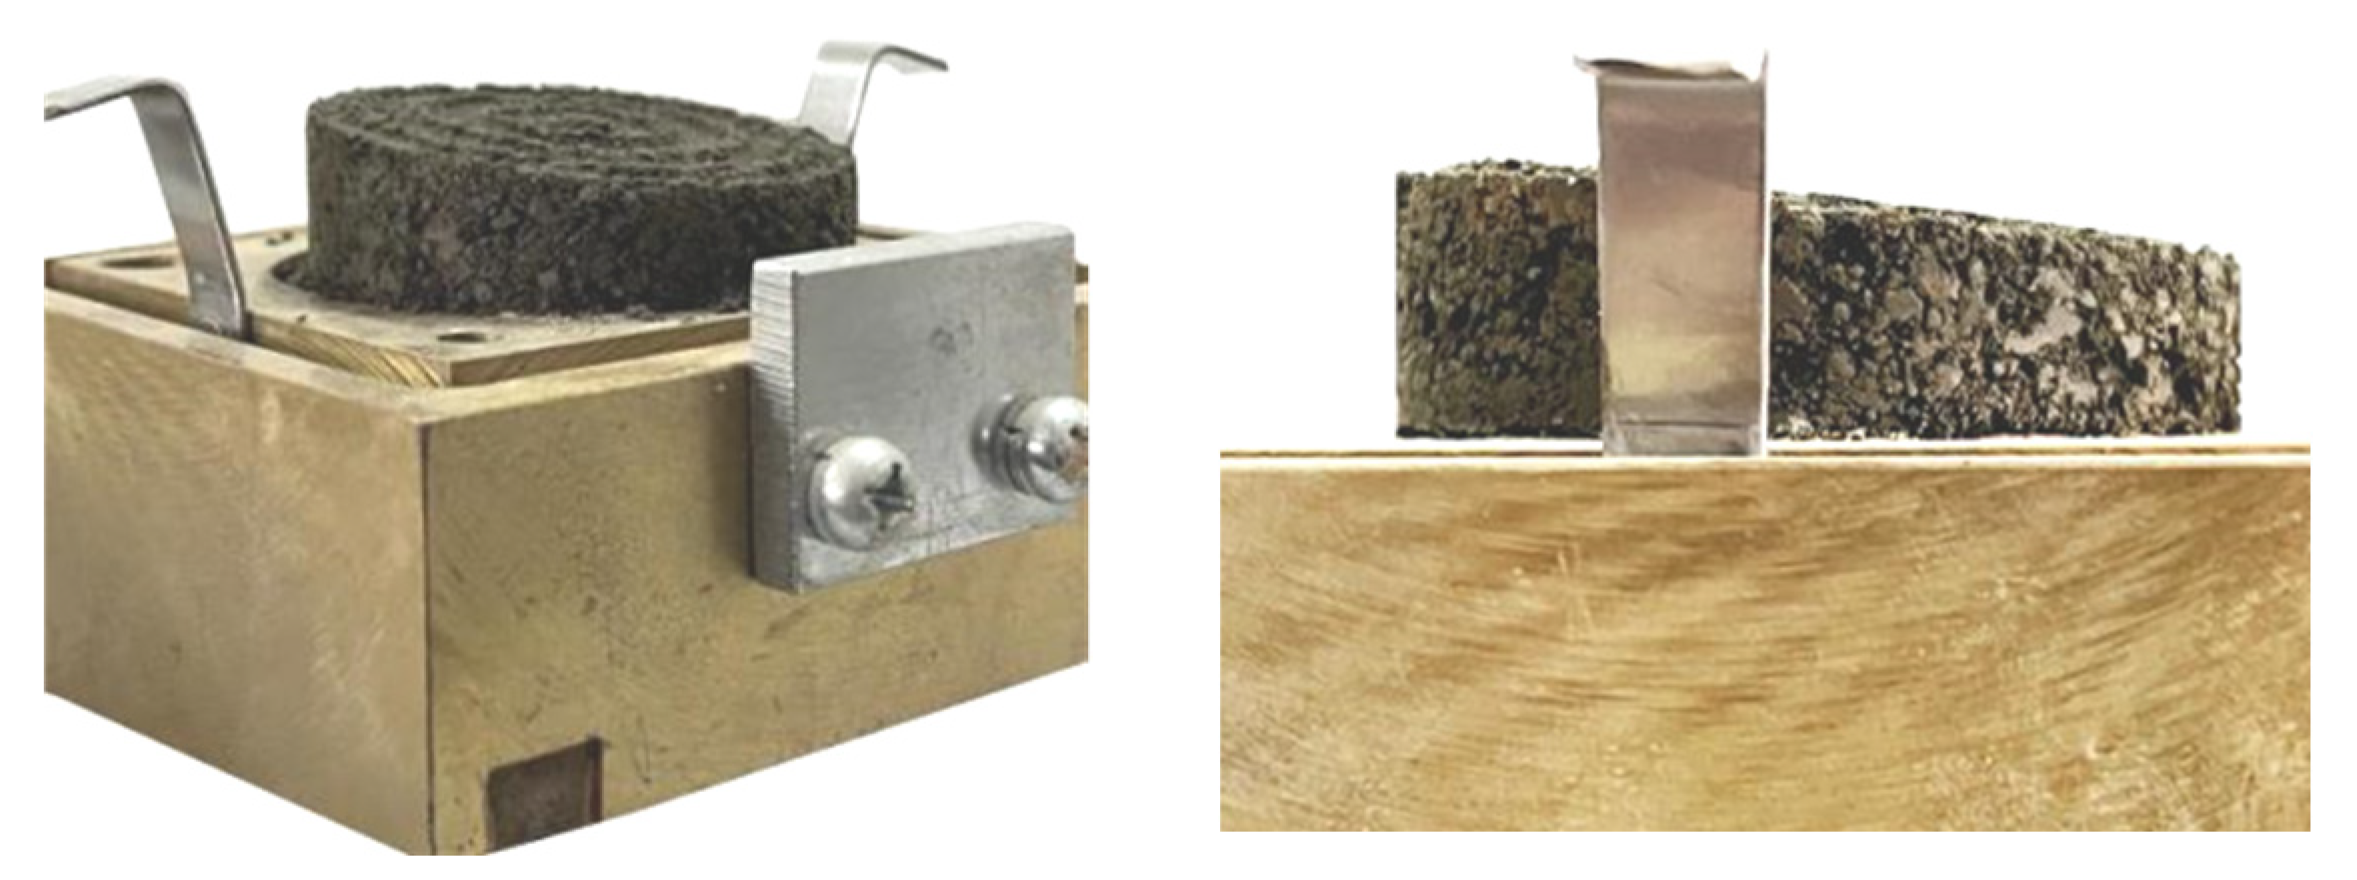
The non-uniform shear dilation behavior of coarse-grained soil under various conditions can be reflected from the normal strain-shear strain (εv-εh) relationship curves of specimens in Figure 7. It is evident that as the shear strain increases, the normal strain at the front end of the shear surface initially decreases gradually to a negative value, subsequently rising linearly to a positive value. This indicates that the deformation at the front end of the sample commences with slight shear contraction followed by significant shear dilation. Conversely, the normal strain at the rear end of the shear surface remains negative and decreases linearly, suggesting continuous shear contraction at the rear end of the sample. This demonstrates that the coarse-grained soil exhibits pronounced heterogeneous shear dilation deformation characteristics overall (Figure 8). The underlying reason for this behavior can be attributed to the following: prior to the experiment, the applied normal stress significantly reduced the particle voids within the sample, establishing a certain compact arrangement structure [25]. During the initial stage of the experiment, under the combined effects of normal stress and shear stress, the particles within the sample undergo movement, rotation, and adjustment to form a denser structure, with the entire sample exhibiting shear contraction deformation. Subsequently, as the lower shear box advances, the actual shear surface continuously diminishes, and the particles in the lower part of the upper shear box are propelled to the front of the upper shear box. This results in volumetric expansion deformation at the front end due to an increase in soil particles, while the rear end experiences volumetric contraction deformation due to the decrease in particles (Figure 9).
Regarding the influence of water content (Figure 7a), it is observed that when the water content increases from 10% to 16%, the minimum normal strain (εv) at the front end of the sample in the negative region decreases from −0.39% to −0.63%. The shear strain corresponding to the point where the normal strain equals zero increases from 9.71% to 15.86%, and subsequently, the normal strain in the positive region gradually decreases. However, the normal strain at the rear end of the sample accelerates its reduction in the negative region with an increase in water content, as evidenced by the slope of the curve decreasing from −0.264 to −0.59. It can be inferred that the increased water content enhances the shear contraction deformation at the front end of the sample during the early stage of the experiment and shortens its duration, while weakening the shear dilation deformation in the later stage and slowing its growth. This is because, when the water content is low, the sample does not achieve a compact structure. The increase in pore water reduces the resistance to particle movement, facilitating a denser particle arrangement, which macroscopically results in increased shear contraction deformation [24]. From Figure 7b, it is evident that the effect of dry density on the sample’s heterogeneous shear deformation is opposite to that of water content. As the dry density increases, it weakens the shear contraction deformation at the front end of the sample during the early stage of the experiment and enhances the shear dilation deformation in the later stage. Simultaneously, the greater the dry density, the steeper the slope of the normal strain-shear strain relationship curve at the rear end of the sample, increasing from −0.632 to −0.139. This indicates that dry density exerts an inhibitory effect on shear contraction deformation at the rear end of the sample. This is because, with an increase in dry density, the particle arrangement becomes more compact, and the pore size decreases, leading to a reduction in the volume compression of the sample during shear. Subsequently, under the action of shear stress, particle movement, rolling, and other motions alter the original dense structure, enhancing the shear dilation deformation of the sample. This is because, with an increase in dry density, the particle arrangement becomes more compact, and the pore size decreases, leading to a reduction in the volume compression of the sample during shear. Subsequently, under the action of shear stress, particle movement, rolling, and other motions alter the original dense structure, enhancing the shear dilation deformation of the sample.
However, the influence of fine particle content (θ) on the heterogeneous shear deformation of the sample (as shown in Figure 7c) exhibits distinct characteristics compared to other influencing factors. As the fine particle content increases, the shear contraction deformation at the front end of the sample during the initial experimental stage progressively diminishes, whereas the shear dilation deformation at the rear end during the later stage gradually intensifies. This phenomenon arises because the augmented fine particles occupy the larger pores within the sample, thereby reducing its compressible volume. Nevertheless, with a higher concentration of fine particles, the normal strain at the rear end of the sample decreases more markedly with increasing shear strain. This is attributed to the enhanced bonding between particles induced by the increased fine particles, which results in more particles being extruded from the rear end of the shear band to the front, manifesting as an augmented shear contraction deformation at the rear end of the sample [13]. From Figure 7d, it is evident that the impact of normal stress (σ) on the shear deformation of the sample follows a pattern analogous to that of water content. Both actors demonstrate that an elevation in normal stress enhances the shear contraction deformation at the front end of the sample during the early experimental stage and the shear contraction deformation at the rear end throughout the experiment, while concurrently diminishing the shear dilation deformation at the front end during the later experimental stage. However, the underlying mechanism governing the influence of normal stress is fundamentally distinct from that of water content. Normal stress affects the sample by modifying the stress environment, prompting particles to rearrange into a denser configuration, which subsequently leads to a reduction in pore volume and an increase in shear contraction deformation.

3.4. Stress Axis Rotation Under Multiple Factors

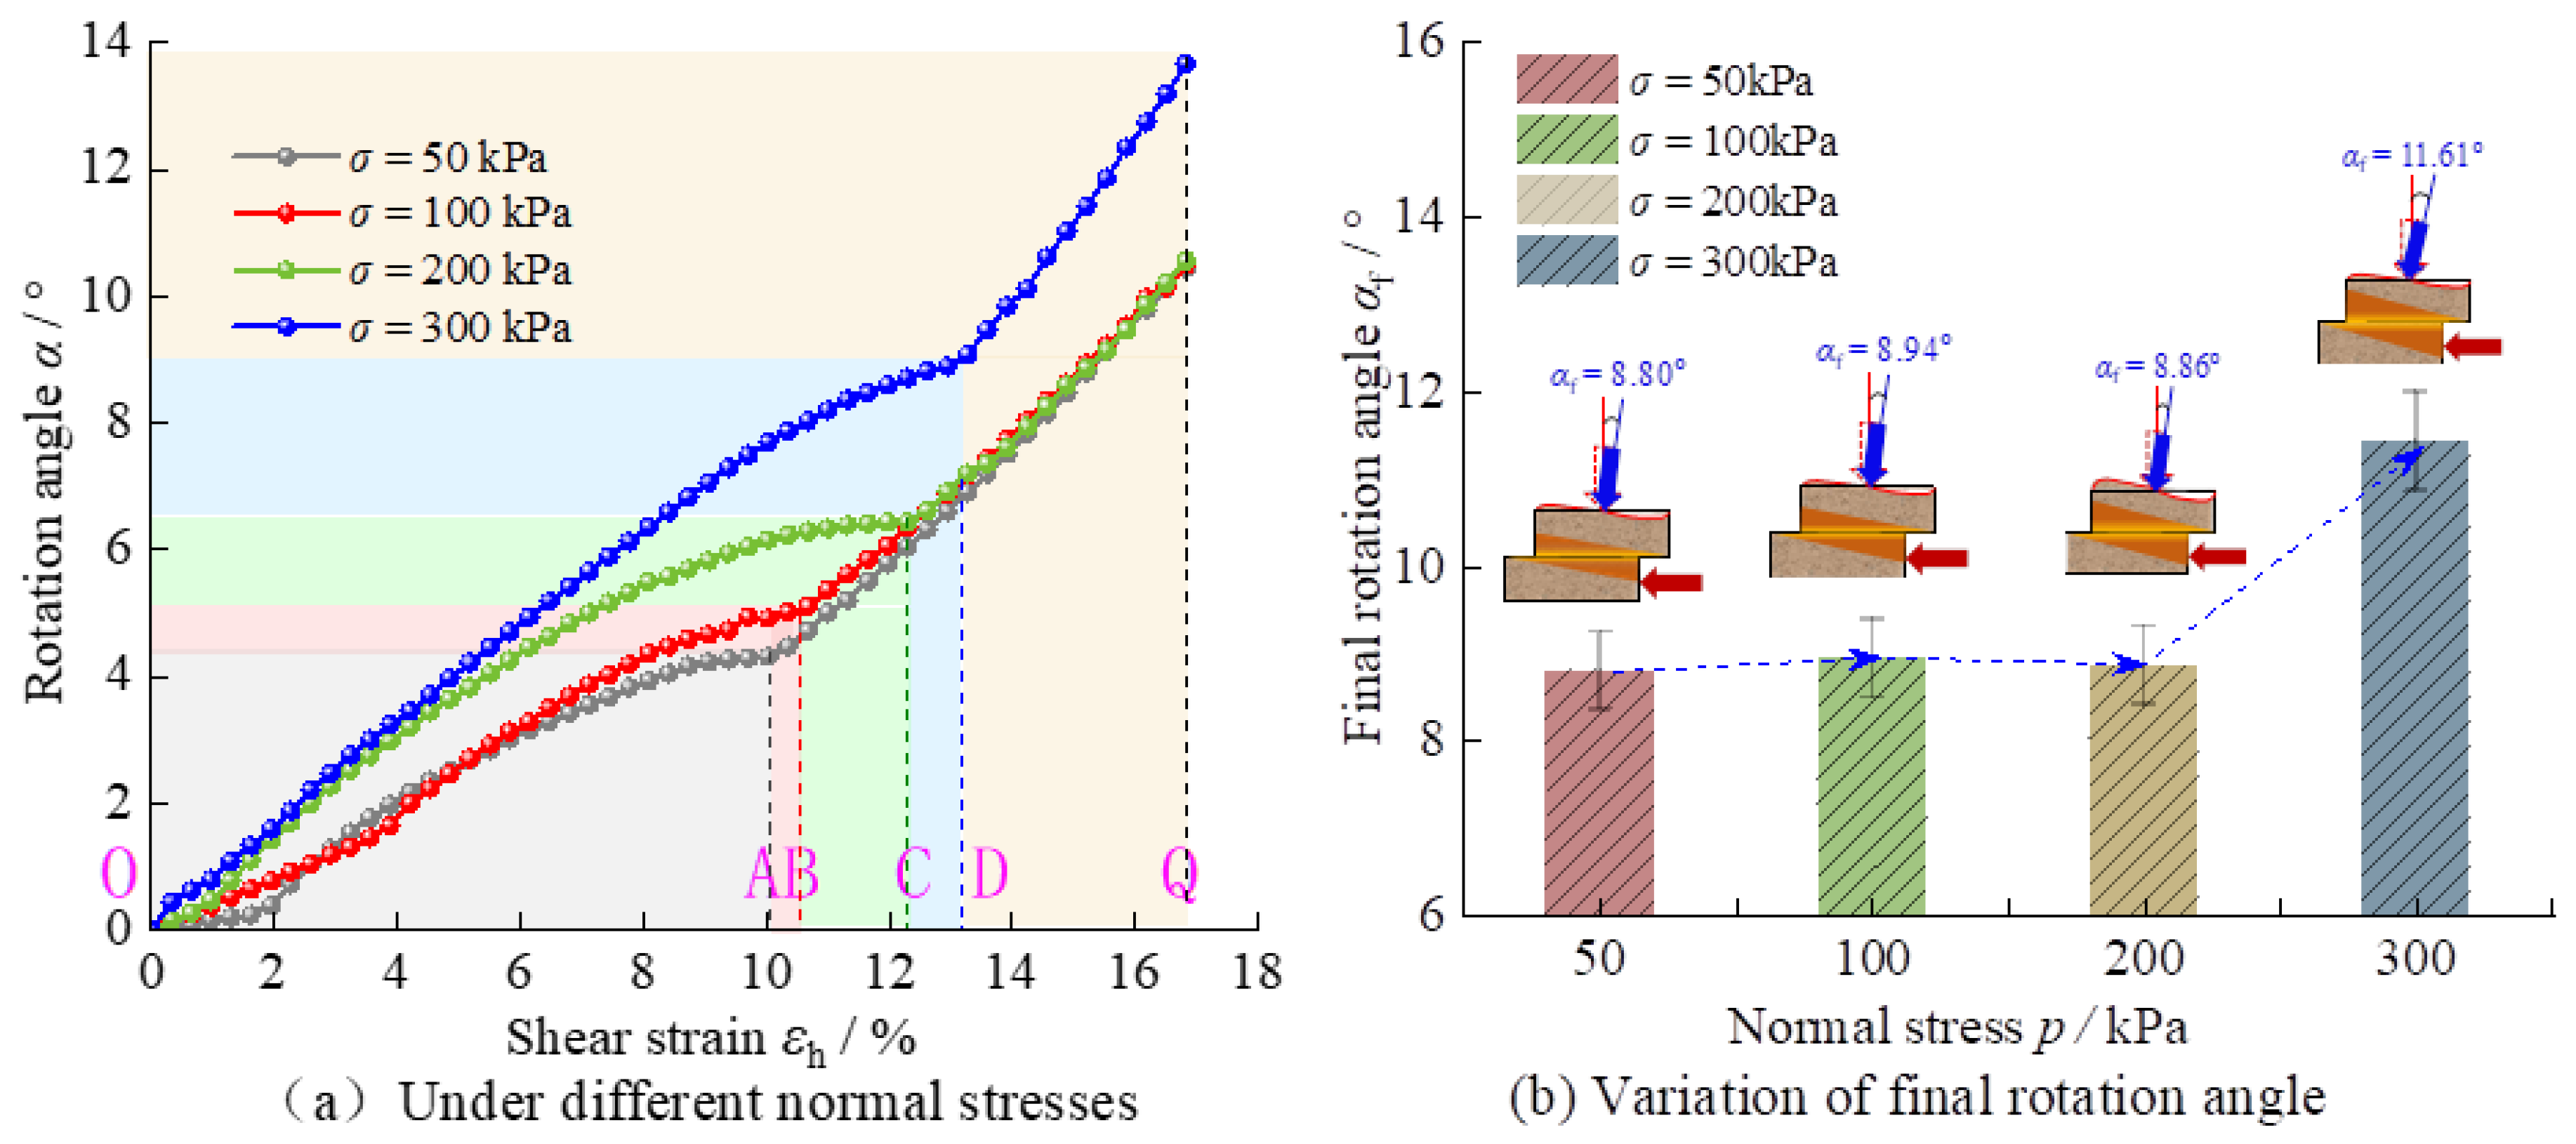
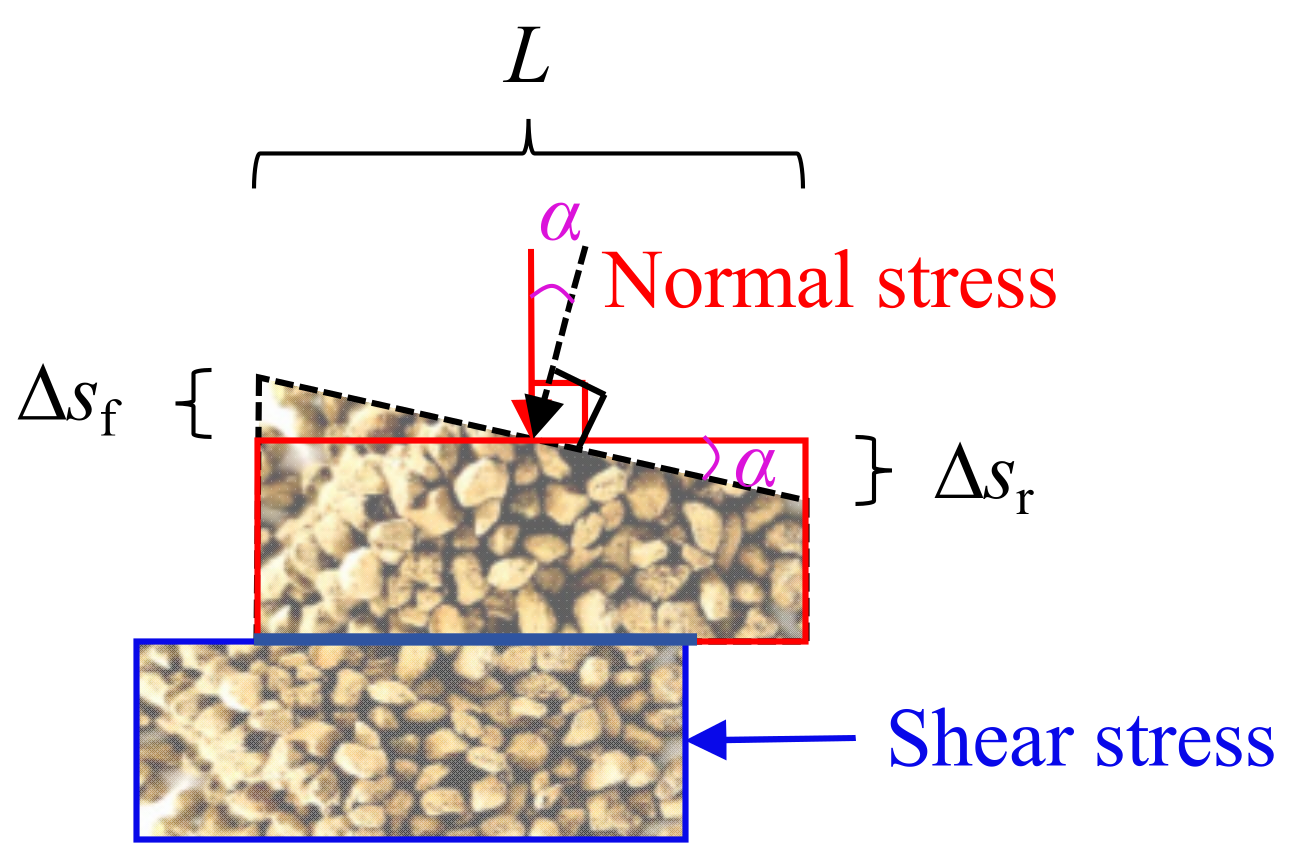
Based on the normal strain-shear strain relationship characteristics of coarse-grained soil (Figure 7), it is observed that under shear stress, the coarse-grained soil exhibits significant heterogeneous shear dilation deformation (Figure 8), which causes the normal stress axis to rotate (Figure 9), influenced by various factors. To evaluate the normal stress axis rotation characteristics under the experimental conditions, the normal stress axis rotation angle (α) is introduced (Figure 10), with the rotation angle corresponding to 15% shear strain (when strain-hardening deformation occurs) being considered as the final normal stress axis rotation angle. This rotation angle can be calculated using the following formula:
tan α   = ( s f     s r ) / L
where α denotes the rotation angle of the normal stress axis; ∆sf represents the normal deformation at the front end of the sample in the shear direction; ∆sr is the normal deformation at the rear end of the sample in the shear direction; and L represents the distance between the normal deformation measurement points at the front and rear ends of the sample in the shear direction.

3.4.1. Influence of Water Content

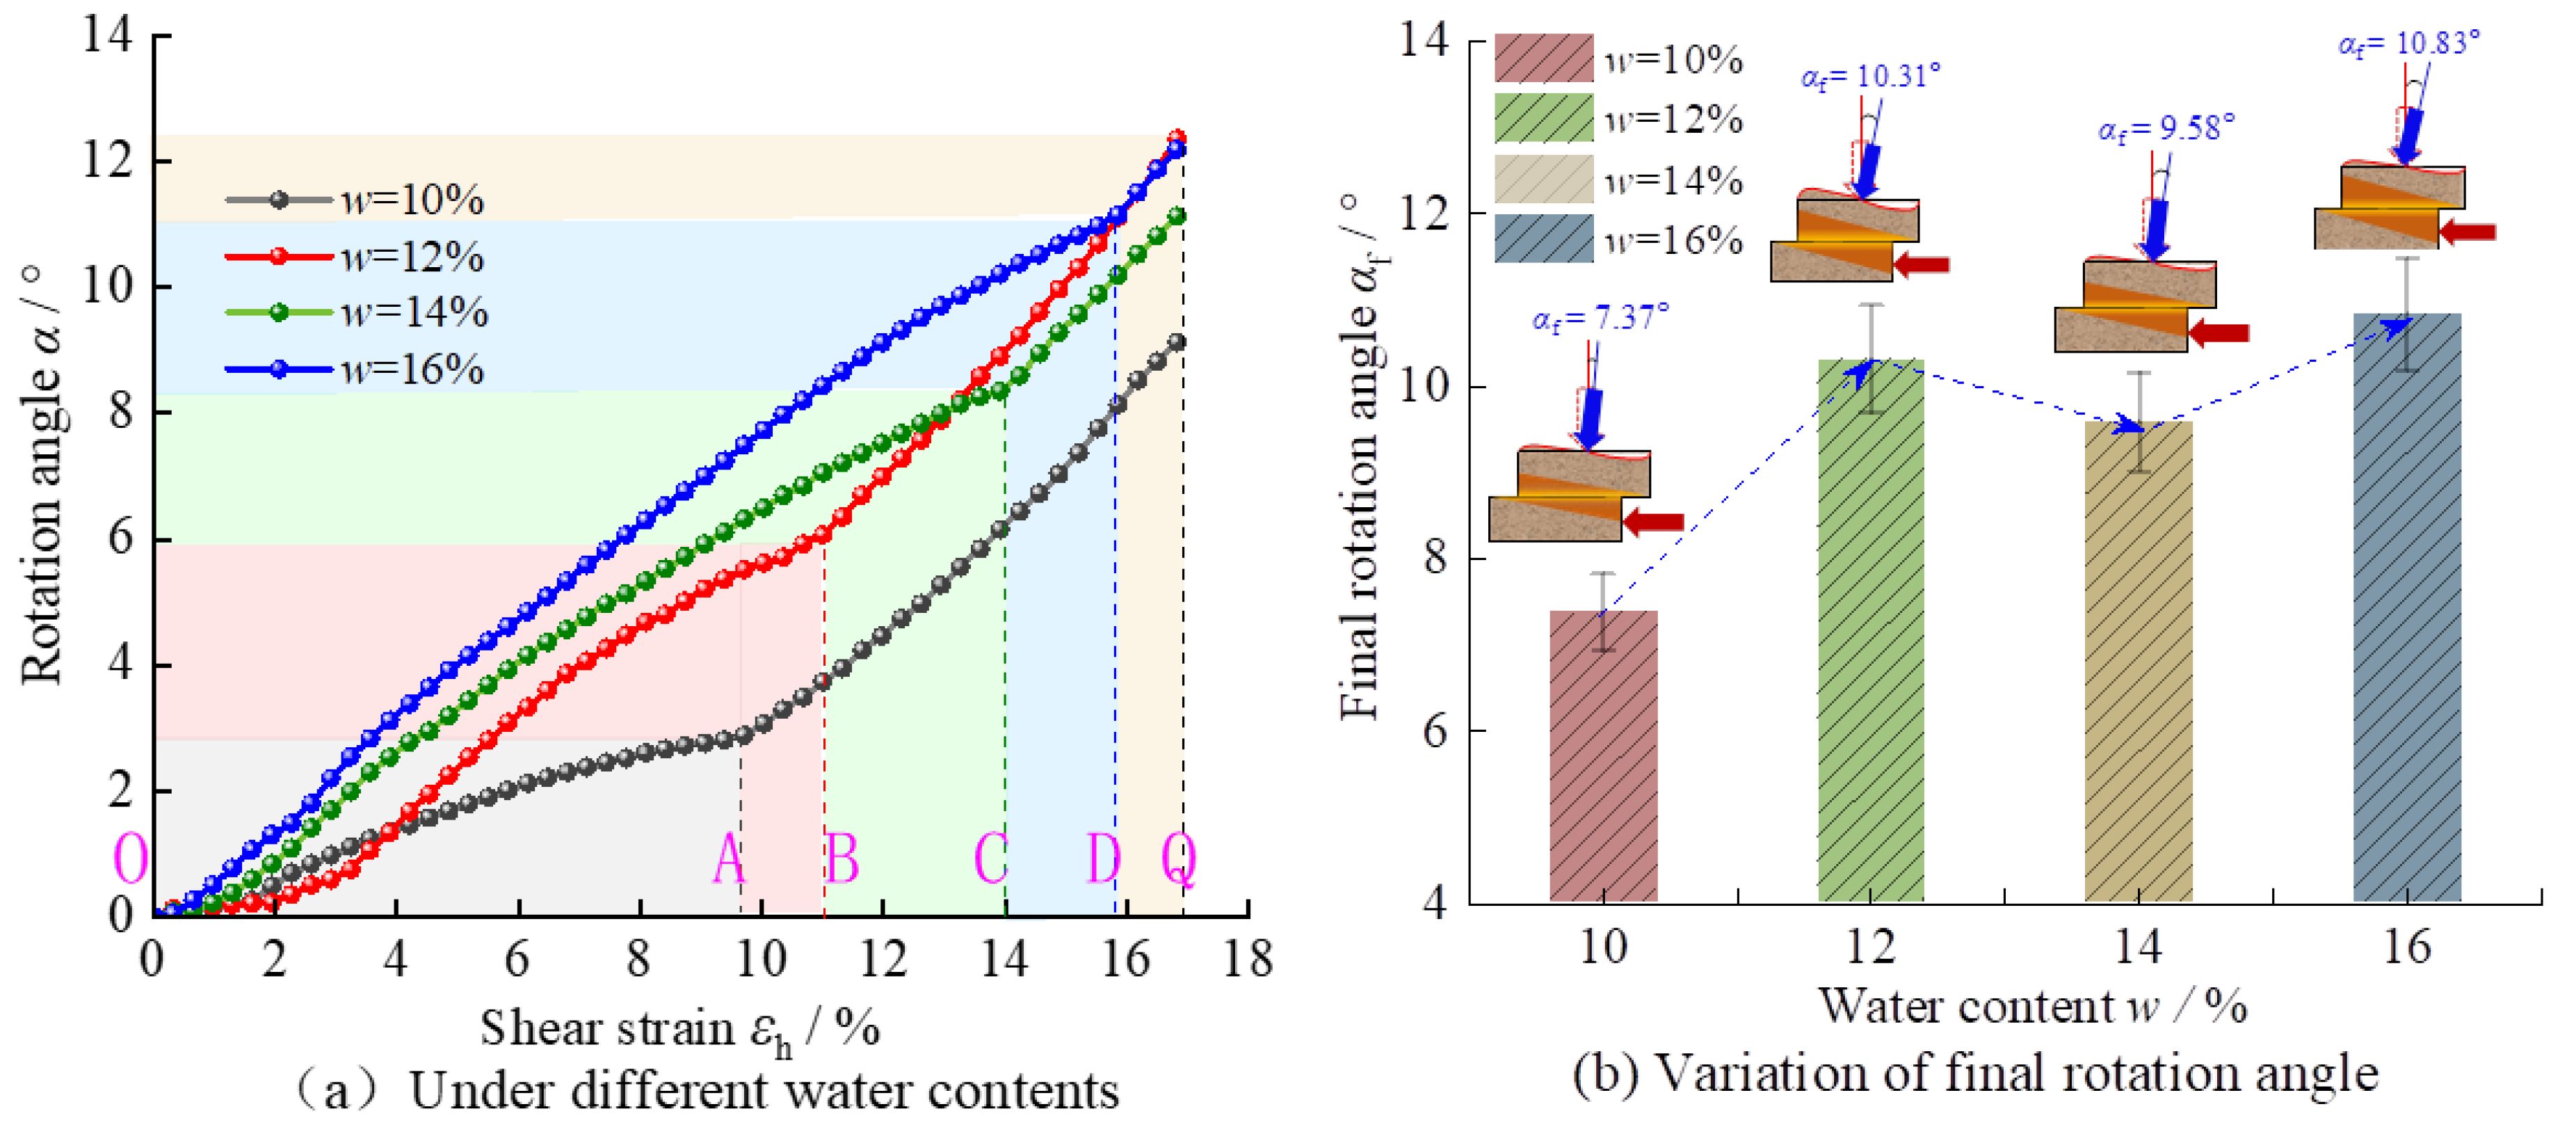
The relationship curves between the normal stress axis rotation angle and shear strain (α-εh) for the sample under different water content conditions, along with the final stress axis rotation angle (αf), are shown in Figure 11.
As illustrated in Figure 11a, throughout the entire shear process, the rotation angle of the normal stress axis (α) exhibits a monotonic increase with shear strain (εh). Nevertheless, a critical point invariably exists, based on which the α-εh relationship curve can be demarcated into two stages: in the initial stage, α increases non-linearly, whereas in the subsequent stage, α increases linearly and accelerates. Taking the sample with a water content of 10% in Figure 11a as an example, the critical point for the rotation angle of the normal stress axis occurs at point A, where the corresponding rotation angle α is 2.88° and the shear strain is 9.7%, coinciding with the shear strain at the juncture where the normal strain at the anterior end of the sample transitions from negative to zero. This characteristic is also discernible in other samples depicted in Figure 11a. In essence, the growth pattern of the normal stress axis rotation angle during the initial stage (OA) is primarily attributable to the non-linear shear contraction deformation at the front end of the sample during the early shear phase (represented by the blue curve in Figure 6a). Concurrently, the linear variation in the rotation angle during the subsequent stage (AQ) stems from the coupled effect of the linear shear dilation at the front end of the sample during the late shear phase and the continuous linear shear contraction deformation at the rear end.
Furthermore, with an augmentation in water content, both the normal stress axis rotation angle corresponding to the critical point of the α-εh relationship curve (as shown in Figure 11a) and the ultimate rotation angle (as depicted in Figure 11b) exhibit a continuous increase. Specifically, the former escalates from 2.88° to 11.16°, and the latter increases from 7.37° to 10.83°, indicating that the increased water content significantly amplifies the degree of rotation of the normal stress axis during the direct shear process.

3.4.2. Influence of Dry Density

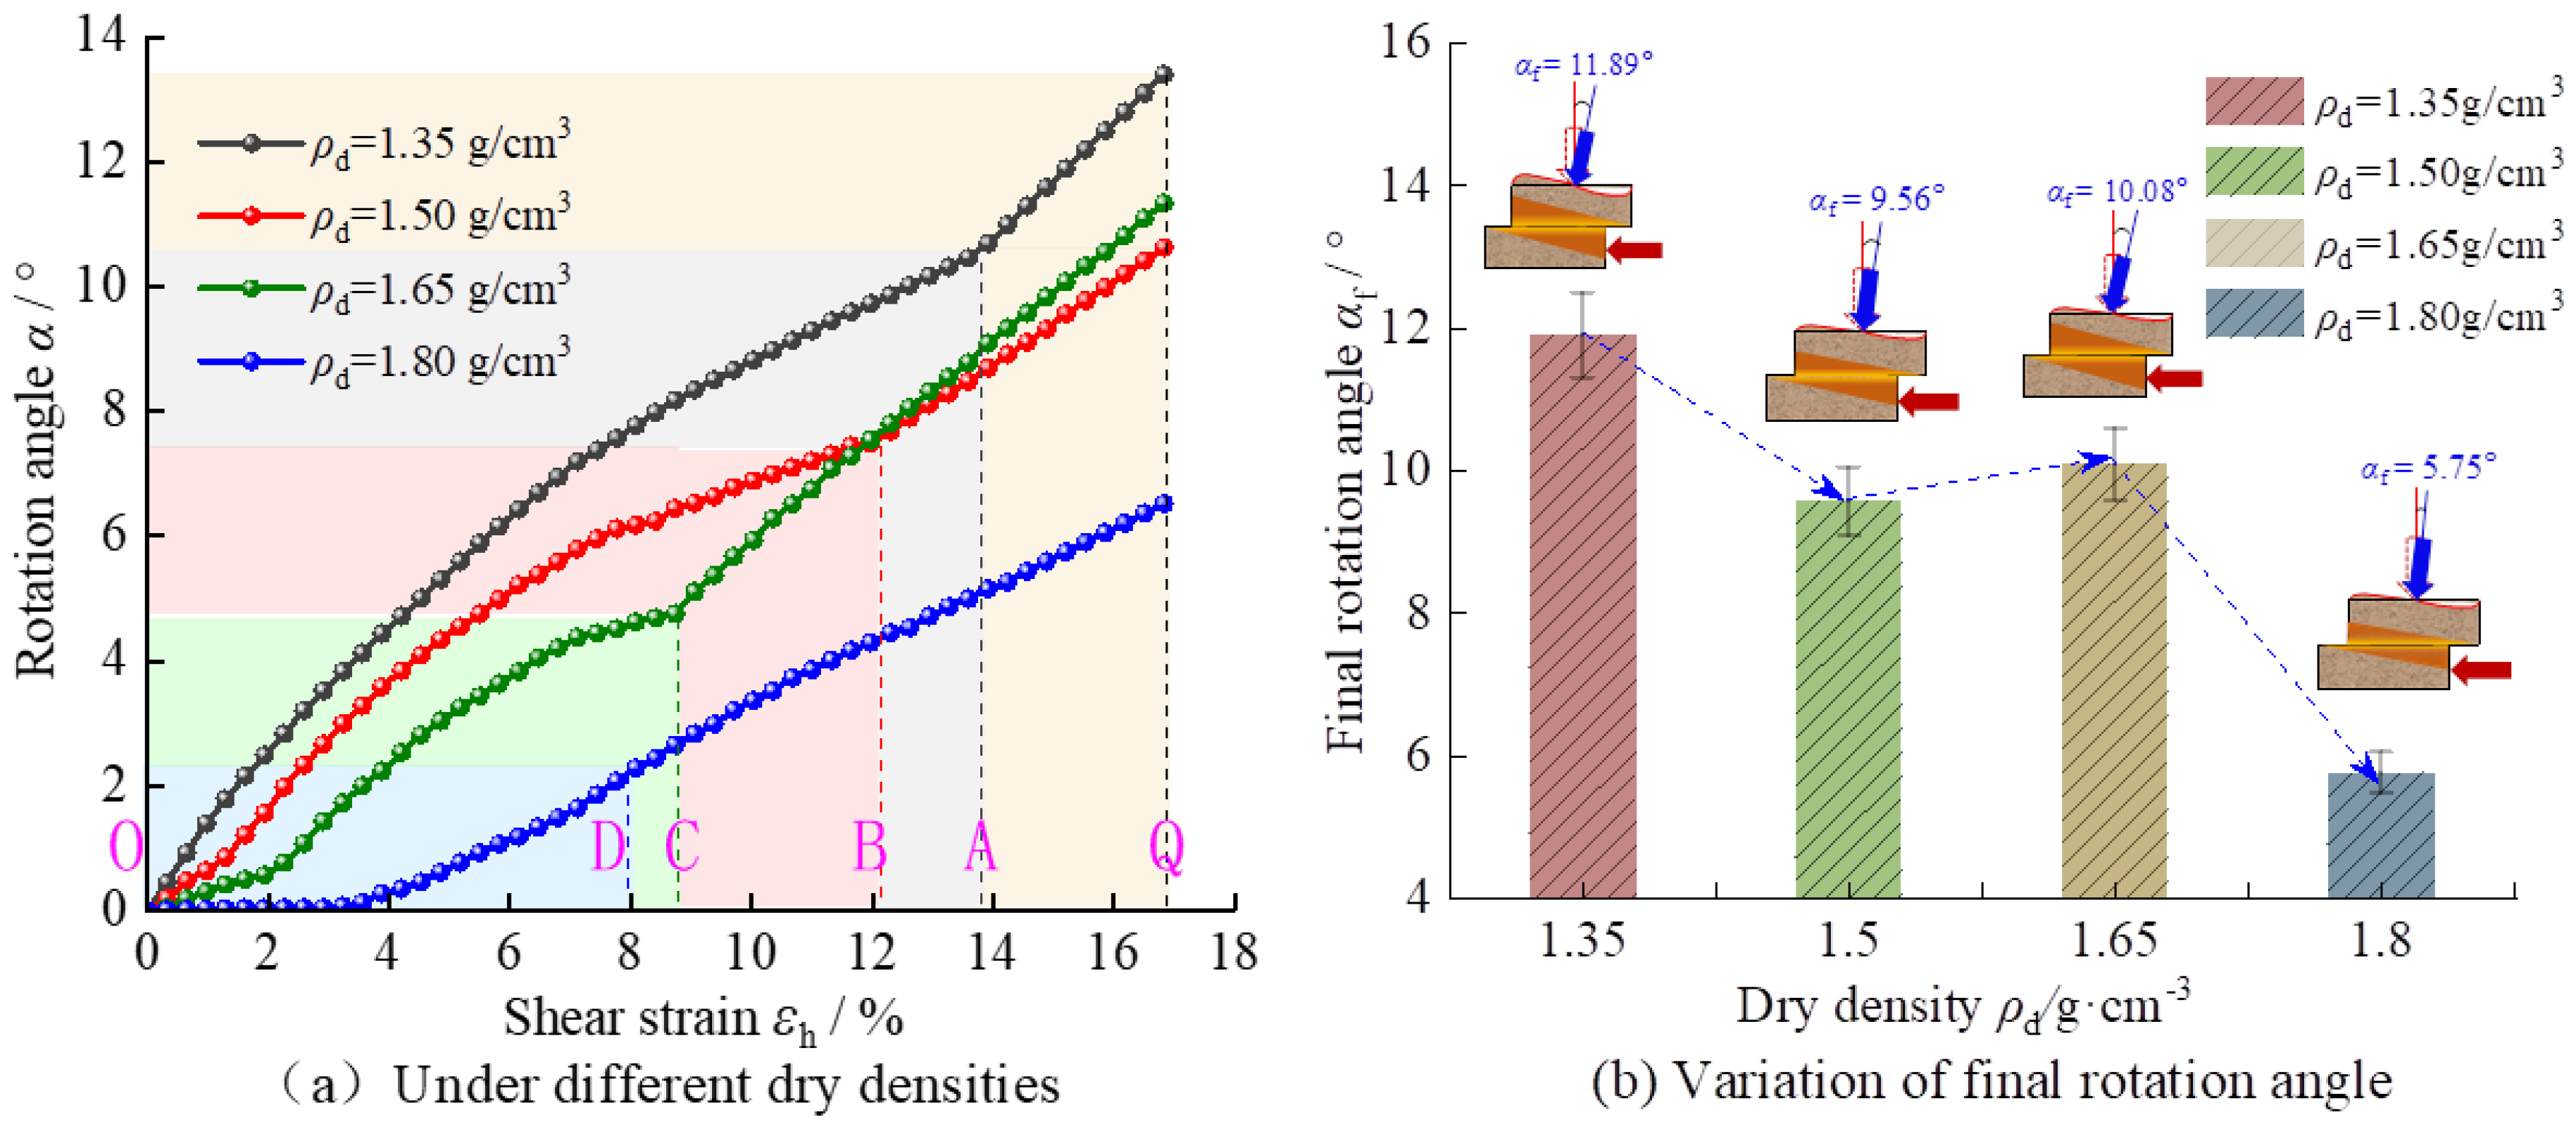
The relationship curves between the normal stress axis rotation angle and shear strain (α-εh) and the variation in the final stress axis rotation angle (αf) with dry density (ρd) are shown in Figure 12.
As demonstrated in Figure 12a, with an elevation in dry density (ρd), the slope of the normal stress axis rotation angle-shear strain (α-εh) curve for the sample becomes less steep. Moreover, when the dry density is low (ρd = 1.35 g/cm3), the rotation angle (α) corresponding to the critical point in the initial stage is 10.46°, with the corresponding shear strain (εh) being 13.59% (point A in Figure 12a). However, as the dry density increases to 1.65 g/cm3, the rotation angle (α) at the critical point decreases to 5.11°, with the corresponding shear strain diminishing to 9.06% (point C in Figure 12a). The ultimate normal stress axis rotation angle of the sample also decreases from 11.89° to 5.75° as the dry density increases, representing a reduction of 51.64%, as shown in Figure 12b. It is evident that dry density attenuates both the rotation speed and the rotation magnitude of the normal stress axis during the direct shear test, which is contrary to the effect of water content. The mechanism by which dry density influences the rotation of the normal stress axis is consistent with its impact on shear dilation deformation.

3.4.3. Influence of Fine-Particle Content

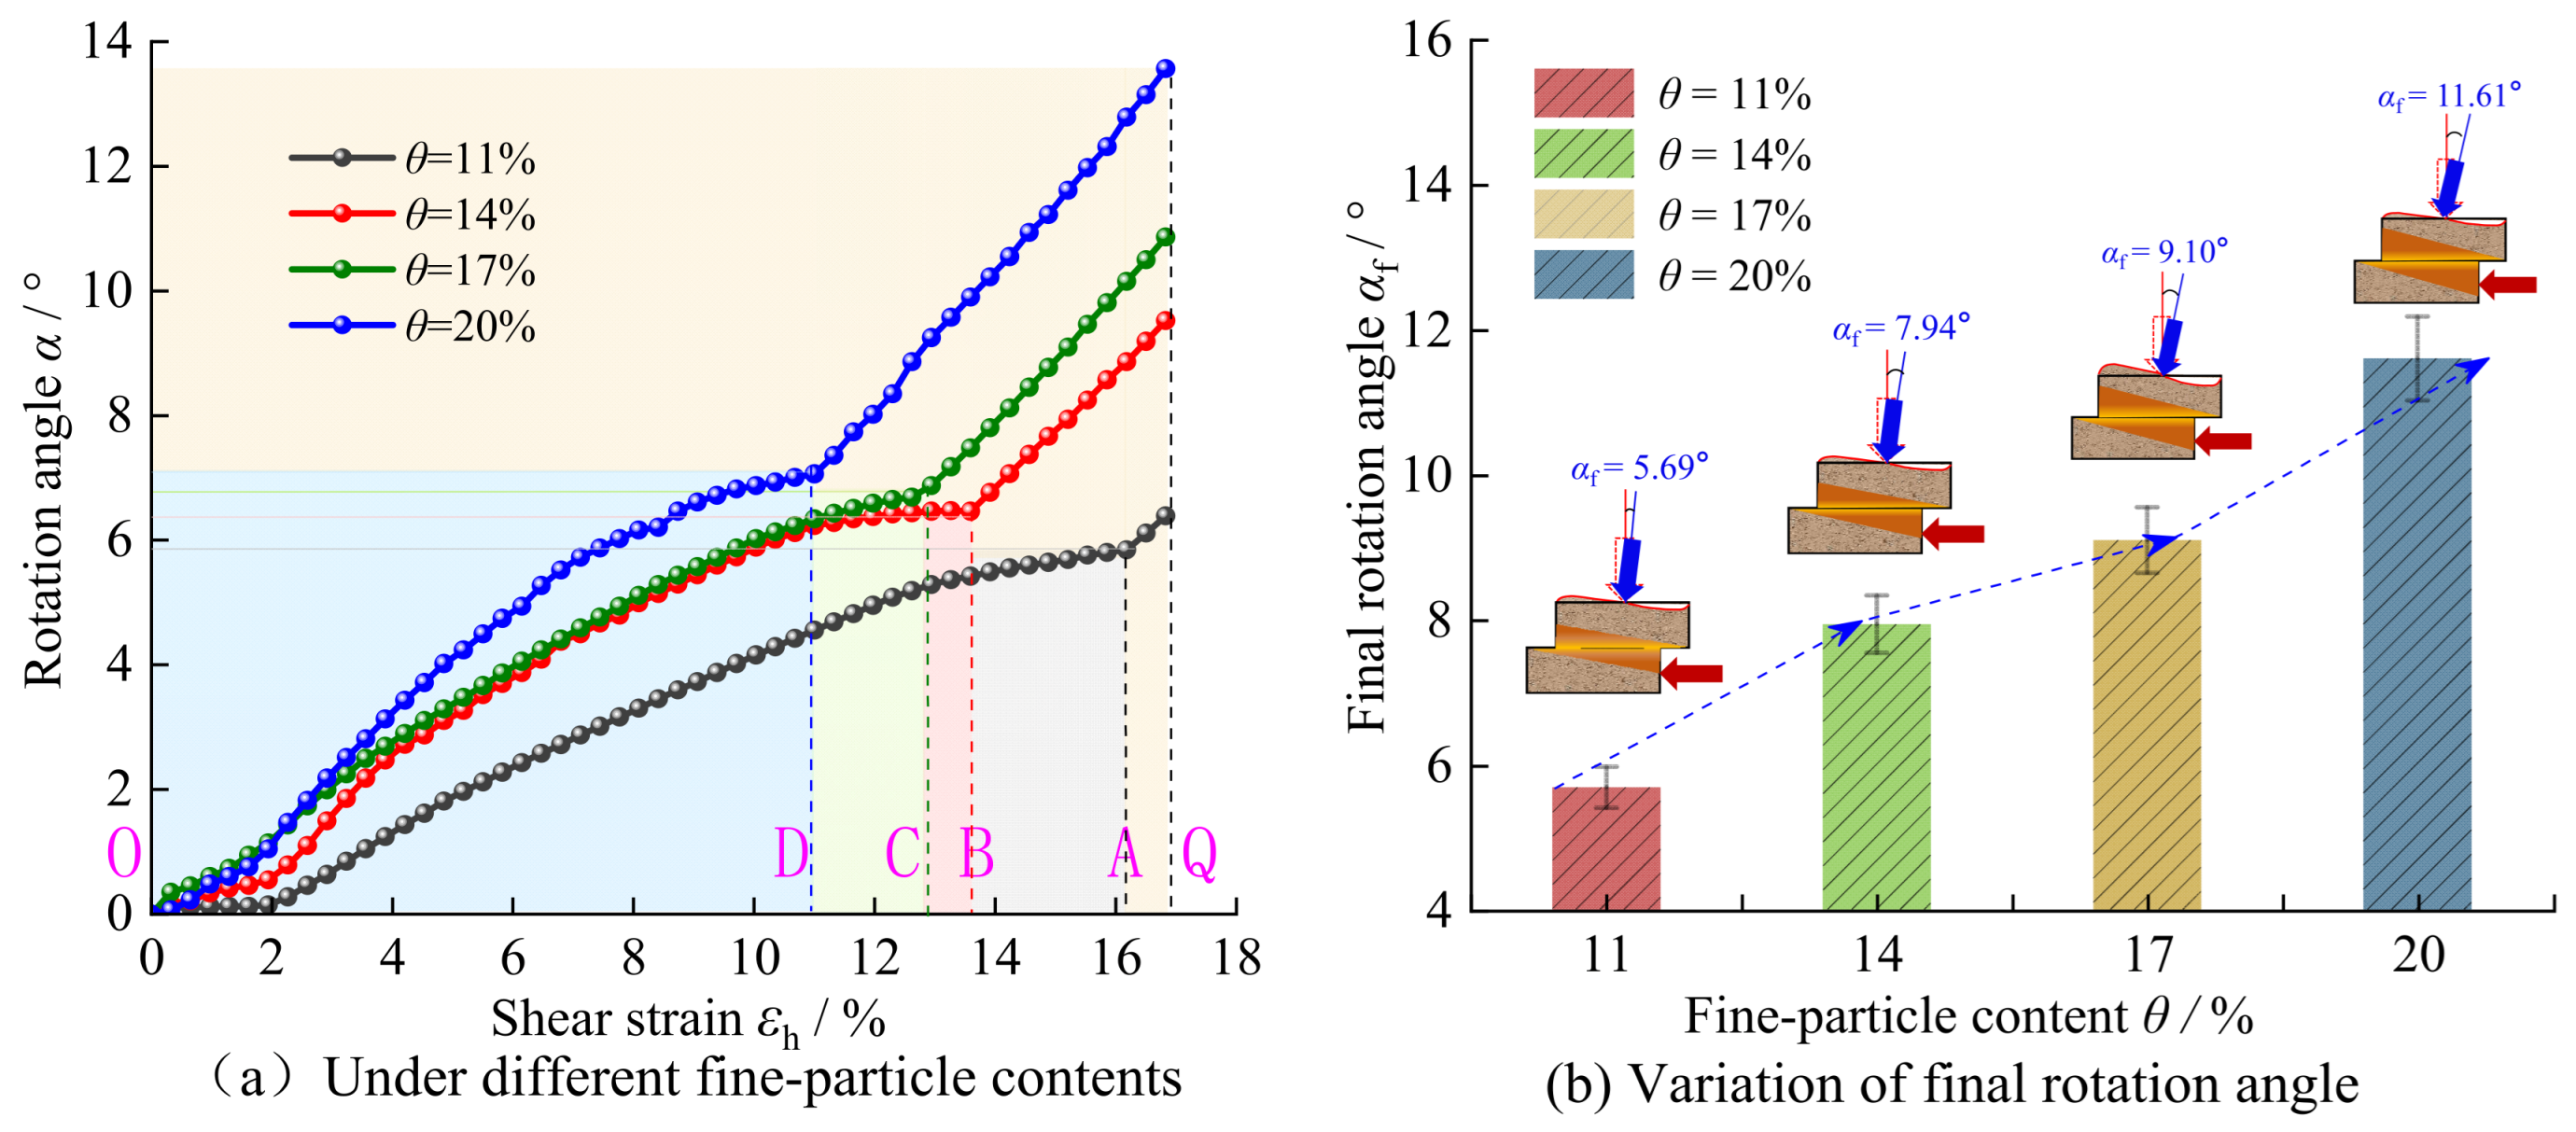
The relationship curves between the normal stress axis rotation angle and shear strain (α-εh) for the sample under different fine particle contents (θ) and the variation in the final stress axis rotation angle (αf) are shown in Figure 13.
The effect of fine particle content (θ) on the rotation angle of the normal stress axis differs from that of water content and dry density. As shown in Figure 13a, with an augmentation in fine particle content, the gradients of both the initial and subsequent stages of the normal stress axis rotation angle-shear strain (α-εh) relationship curve become more pronounced. When the fine particle content is relatively low (θ = 11%), the rotation angle (α) at the critical juncture is 5.85°, with a corresponding shear strain (εh) of 16.18% (point A in Figure 13a). As the dry density escalates, the rotation angle at the critical point rises, while the corresponding shear strain decreases continuously (from point A to point D in Figure 13a). Furthermore, the ultimate normal stress axis rotation angle ascends from 5.69° to 11.61° with an increase in dry density, demonstrating a 104.14% surge, as illustrated in Figure 13b. It is evident that an elevation in fine particle content substantially enhances both the magnitude and velocity of the normal stress axis rotation.

3.4.4. Influence of Normal Stress

The variation in the normal stress axis rotation angle (α) and the final stress axis rotation angle (αf) of the specimen under diverse normal stress conditions is delineated in Figure 14. As delineated in Figure 14a, the influence of normal stress on the normal stress axis rotation angle-shear strain (α-εh) relationship curve mirrors that of water content. Both the rotation angle and shear strain at the curve’s critical point augment with an increase in normal stress, indicating that the gradient and range of the curve in the initial stage also expand. Concurrently, when the normal stress intensifies from 50 kPa to 200 kPa, the second stage of the α-εh relationship curve in Figure 14a tends to converge, and the alteration in the stable rotation angle in Figure 14b is minimal, rising solely from 8.80° to 8.86°. Only when the normal stress escalates from 200 kPa to 300 kPa does the stable rotation angle markedly increase, with a 32% elevation. Overall, normal stress exerts a reinforcing effect on both the rotation velocity and magnitude of the normal stress axis during the direct shear test, particularly under elevated normal stress conditions. The mechanism underlying this effect is fundamentally congruent with the mechanism influencing the shear contraction deformation of the specimen.

4. Discussion

4.1. Influence Laws of Factors on Shear Deformation

This study investigates the non-uniform shear deformation characteristics of coarse-grained soils collected from a high-altitude slope along the Sichuan-Xizang Railway under varying influencing factors through a modified laboratory direct shear apparatus and a revised calculation method. The shear stress–strain curves of specimens in this study exhibited a strain-hardening response, and the normal strain at the front and rear ends of the samples has significant non-uniform deformation characteristics. Increasing the water content and fine-particle content weakened the strain-hardening behavior, whereas increasing the dry density and normal stress enhanced it. These findings are somewhat similar to previous research results, while some are different [6,20].
Direct shear tests were conducted by Dołżyk on railway embankment fills and reported that specimens prepared at a compaction degree of 87% and an air-dry water content of 0.95% exhibited a typical strain-hardening response [6]. Moreover, increasing the normal stress enhanced the shear modulus and ultimate shear stress, indicating that a higher normal stress promoted strain-hardening deformation. Similar observations were also reported in Ref. [15], which investigated the shear behavior of coarse-grained soil samples collected from the Jilangtan Platform, Qinghai Province. These findings are in good agreement with the effect of normal stress observed in this study. However, the increase in the characteristic parameters of the stress–strain curves induced by normal stress reported in Ref. [6] was considerably smaller than that observed in the present study. This difference can be attributed to the different compaction conditions of the tested specimens. In Ref. [6], the specimens were prepared at a compaction degree of 87%, corresponding to a relatively dense state. Consequently, the additional normal stress exerted only a limited influence on the internal soil structure. In contrast, the specimens used to investigate the effect of normal stress in this study (Figure 5e) had a compaction degree of only 71.4%, which resulted in a much more pronounced influence of normal stress due to their relatively large pore space. With respect to the effect of density, Ref. [6] reported that increasing the compaction degree from 87% to 90% and 93% transformed the stress–strain response of coarse-grained soil from strain hardening to strain softening, while the shear modulus continuously increased. Unlike this, the shear stress–strain curves obtained in this study consistently exhibited strain-hardening behavior throughout the investigated density range. This discrepancy is mainly attributed to the relatively low maximum dry density adopted in the present study (1.80 g/cm3), corresponding to a compaction degree of approximately 85.7%, which remained below the threshold required for the development of strain-softening behavior. Regarding the effect of water content, the present study demonstrates that increasing the initial water content monotonically weakens both the strain-hardening characteristics of the stress–strain response and the shear modulus. Similar trends have also been reported in Refs. [6,15,20] based on large-scale direct-shear tests on soil–rock mixtures with different water contents. Nevertheless, Ref. [6] further reported that, compared with air-dried specimens, wet specimens exhibited a transition in the stress–strain response from pronounced strain-softening to weak strain-hardening, which differs from the observations of this study. With respect to the influence of fine-particle content, this results indicate that increasing the fine-particle content weakens the strain-hardening behavior of the specimens. Reference [13] also reported similar results in undrained triaxial compression tests on sand low plasticity silt (ML) mixtures.
Previous studies have demonstrated that coarse-grained soils undergo non-uniform deformation during shearing. However, most existing investigations have focused on either volumetric deformation under triaxial compression or the normal deformation measured at the center of specimens during direct shear tests. In this study, the conventional direct shear apparatus was modified to enable simultaneous measurements of the normal deformation at both the leading and trailing edges of coarse-grained soil specimens along the horizontal shear direction. This experimental configuration made it possible to investigate the effects of different influencing factors on non-uniform shear deformation and the rotation characteristics of the normal stress axis. To the best of the authors’ knowledge, these aspects have not been reported in previous studies and therefore represent a novel contribution of the present work. Ref. [6] reported, based on large-scale direct shear tests, that the central region of air-dried coarse-grained soil specimens with a compaction degree of 87% initially exhibited shear contraction followed by shear dilation during shearing. As the compaction degree increased to 93%, the contraction stage became negligible and was replaced by more pronounced shear dilation. This deformation pattern is generally consistent with the shear dilation observed at the leading edge of the specimens in the present study, thereby providing independent support for the validity of the proposed experimental methodology. Furthermore, three specimens were used to represent one case in this study, and their average was considered to represent the result of one specimen to ensure reliability, such as the shear stress-shear strain relationship curves of samples (Figure 5), and the normal strain-shear strain relationship curves of samples (Figure 7). These results indicate that the influence patterns of different factors under experimental conditions are clear, demonstrating the reliability of the research plan and methods proposed in this study, and the credibility of the experimental results. Nevertheless, some scatter was observed among the test results obtained at different levels of the same influencing factor, reflecting the inevitable experimental uncertainties associated with specimen preparation, test execution, and measurement procedures. To quantitatively evaluate the variability and accuracy of the experimental data, the standard errors of the three replicate specimens for each testing condition were statistically calculated and are presented in the analyses of the shear modulus (Figure 6) and the final principal stress axis rotation angle (Figure 11, Figure 12, Figure 13 and Figure 14). The calculated standard errors are consistently small and fall within an acceptable range, indicating good repeatability and reliability of the experimental results.
In addition, the level values of initial water content, dry density, fine-particle content, and normal stress considered in this study were selected based on the physical parameters of the tested soil. Specifically, the initial water contents (w = 10%, 12%, 14%, and 18%) in this study were intended to simulate the moisture conditions of the accumulation layer under different rainfall seasons and burial depths. The dry densities (ρd = 1.35, 1.50, 1.65, and 1.80 g/cm3) were chosen to consider different degrees of soil compaction at various burial depths. The fine-particle contents (θ = 11%, 14%, 17%, and 20%) were designed to reproduce the particle gradation characteristics of the accumulation-layer slope from the slope crest to the slope toe and from shallow to deep deposits. Meanwhile, the applied normal stresses (σ = 50, 100, 200, and 300 kPa) were selected to simulate the stress states of soils at different burial depths. These deformation parameters are the theoretical basis for evaluating the stability of the slope, and to some extent reflect the deformation characteristics of the accumulation layer slope under different conditions.
Nevertheless, due to limitations in terms of time and energy, this study can only select a limited number of influencing factors. In fact, there are other important environmental variables, such as freeze–thaw action and dry-wet cycles, which are not considered in this study [3,26]. This restricts the scope of application of the research results to a certain extent. These other factors will be fully considered in future research. Moreover, the results were obtained from indoor mechanical experiments, and it should be acknowledged that there are several limitations compared with in-site testing and actual engineering should be acknowledged. Such as, the results does not involve representative field geological hazard conditions [4], the in situ investigation techniques, such as piezocone penetration test data (CPTu) [27], visualized hybrid intelligent model to delineate fine-grained soil layers using clay sensitivity [28], 3Dl geological modeling and spatial analysis from data with surface and marching tetrahedra algorithm [29], were not incorporated into this study. The results have not been validated by actual high-altitude landslide cases [1]. Consequently, the applicability of the present findings is constrained by the adopted testing conditions and the type of tested material, there is still a certain distance between these results and the application of landslides at the field scale, and further in-depth research is needed in future studies. Moreover, the tested colluvial soil characteristics are location-specific and these results should be cautiously applied outside the Sichuan-Xizang areas.

4.2. Sensitivity Analysis of Factors on Shear Deformation

Based on the test results of coarse-grained soil samples under different conditions, we also found that there is a certain degree of mutual influence among different factors, and the influence degree is different. To determine the extent of influence of different factors, the grey relational analysis can be applied to analyze the sensitivity of factors influencing the shear deformation characteristics of coarse-grained soils [30]. In the factor sensitivity analysis, the individual factors were considered and hoped to eliminate this interference to prevent it from affecting the accuracy of the sensitivity analysis results [31]. The grey relational analysis has significant advantages in capturing the nonlinear and complex relationships between these variables [30]. Its fundamental concept is to analyze and determine the degree of influence between factors (sequences) or the contribution of several sub-factors (sub-sequences) to the main factor (parent sequence) based on the similarity in the geometric shape of the curves of each factor (sequence). The analytical process for the degree of association between factors is as follows:
Assuming there is a reference sequence X0 = {x0(k), k = 1, 2, …, n} and a comparison sequence Xi = {xi(k), k = 1,2, …, n}. The degree of association ξi(k) between X0 and Xi at the k-th point can be expressed by Equation (1):
ξ   i ( k )   =   min i min k i ( k ) + ρ · max i max k i ( k ) i ( k ) + ρ · max i max k i ( k )
where ∆i(k) represents the absolute difference between X0 and Xi at the k-th time point, denoted as i ( k ) = |X0(k) − Xi(k)|; ρ signifies the resolution coefficient; miniminki(k) denotes the minimum difference observed at the k-th point; and maximaxki(k) indicates the maximum difference at the k-th point.
The degree of association, γi, between the comparison sequence and the reference sequence is calculated using the following formula, and the sensitivity of each factor is determined based on the ranking of the degree of association:
γ i   = 1 n i = 1 n ξ i ( k )
where γi represents the degree of association between the comparison sequence and the reference sequence.
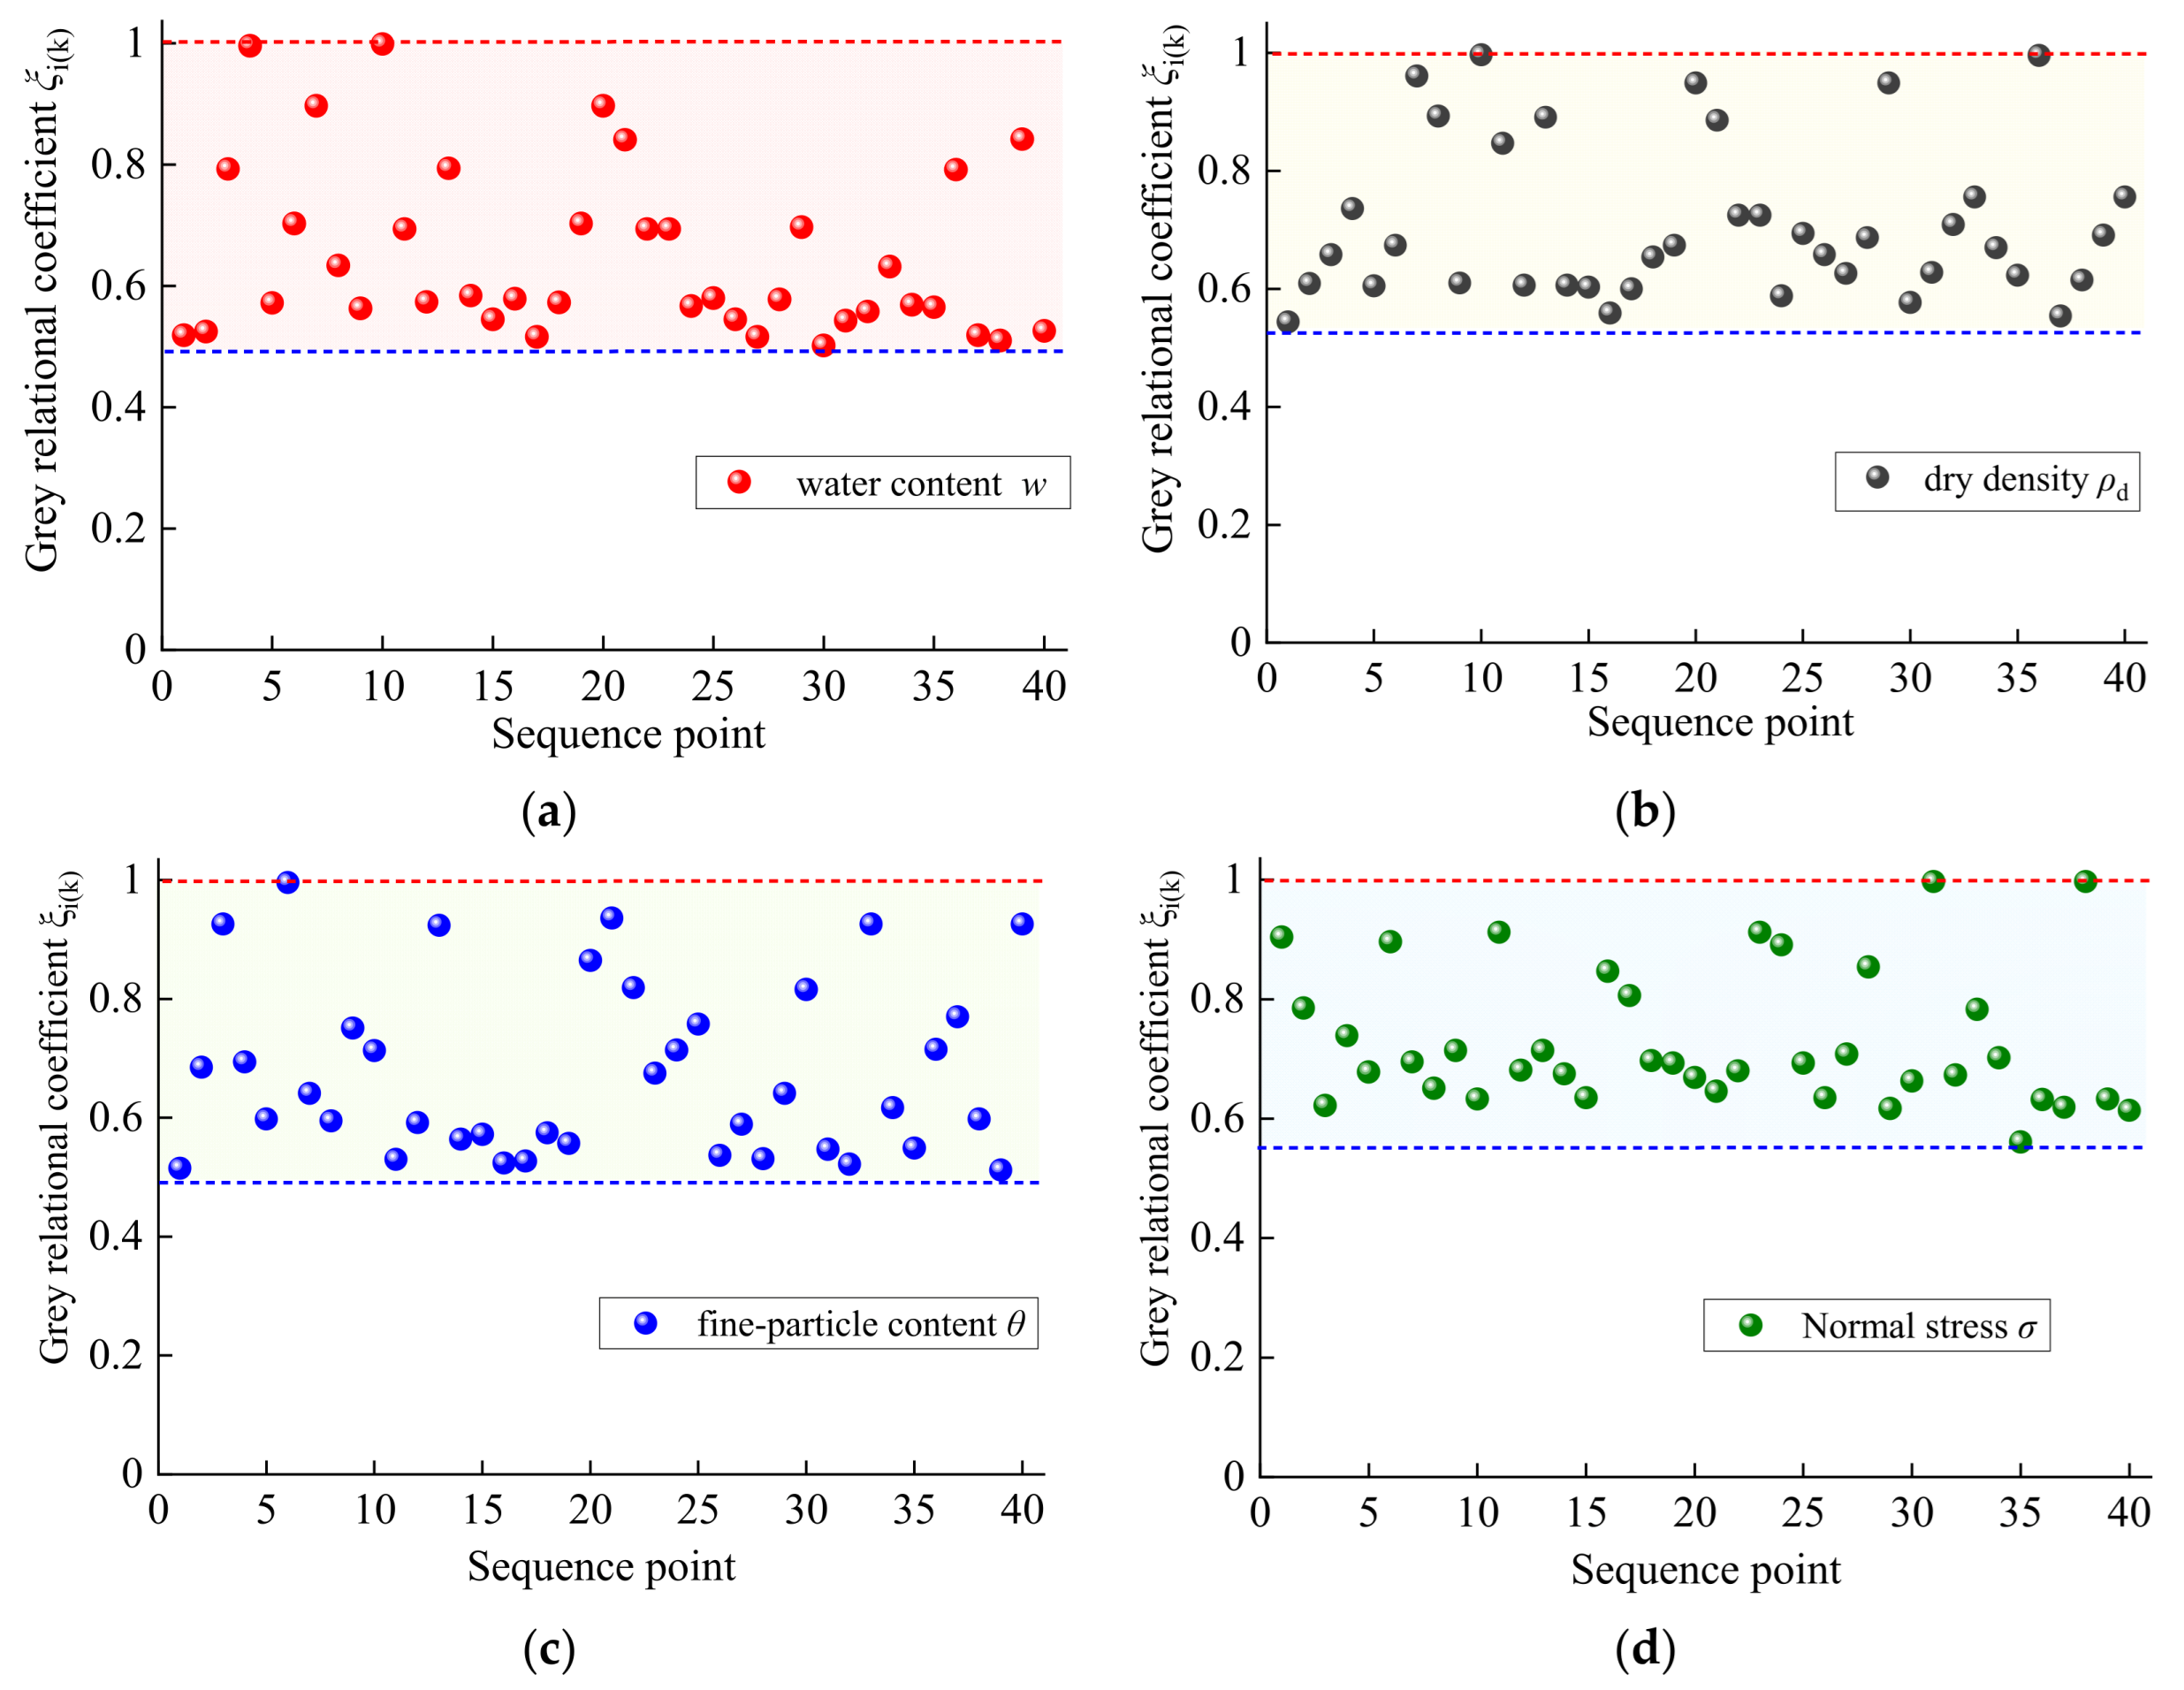
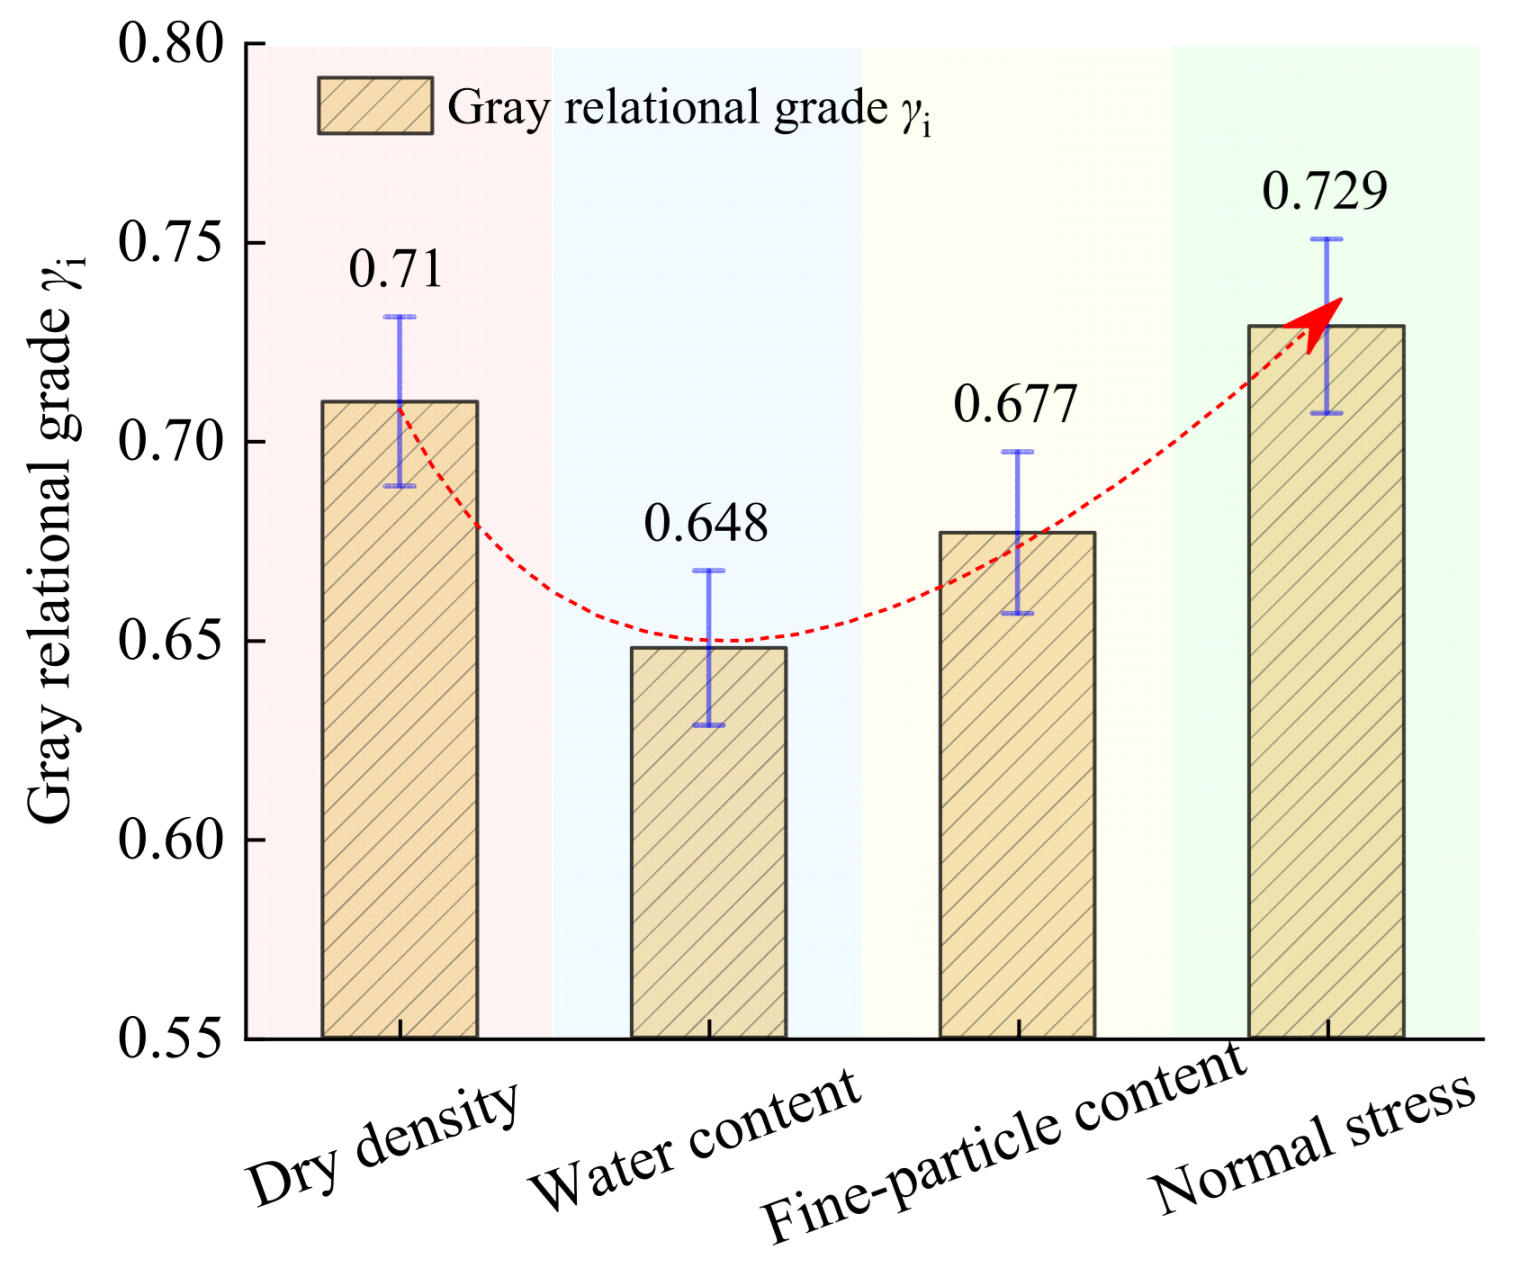
Based on Equations (4) and (5), the variations in the correlation coefficient ξi(k) and the degree of association γi between the shear modulus of the sample under varying normal stress conditions and factors such as water content, dry density, and fine particle content are illustrated in Figure 15 and Figure 16. As depicted in Figure 15, the correlation coefficients ξi(k) between the shear modulus of the sample and dry density (ρd), water content (w), fine particle content (θ), and normal stress (σ) range from 0.544 to 0.997, 0.502 to 0.999, 0.512 to 0.999, and 0.561 to 0.998, respectively. The corresponding degrees of association γi are 0.710, 0.648, 0.677, and 0.729, respectively. It is evident that the degrees of association γi between the shear modulus of the sample and each factor exceed 0.60, indicating that these experimental factors exert a significant influence on the shear modulus of coarse-grained soil.
Based on the values of the degree of association, normal stress emerges as the most sensitive factor affecting the shear modulus of the sample followed by dry density, fine particle content, and water content, which is the least sensitive. This ranking is attributed to the combined effects of the structural characteristics of the coarse-grained soil and the influence mechanisms of each factor. Normal stress directly governs the particle stress state throughout the shear process. As increase in normal stress enhances the inter-particle contact force and increases the stiffness of the contact points, thereby exerting the most substantial effect on the shear modulus [18]. Dry density determines the quantity and arrangement of particles within the sample. An increase in dry density results in tighter particle packing and more contact points, which increases resistance to shear deformation due to stronger inter-particle interlocking, thus having a notable impact on the shear modulus. Fine particle content dictates the particle gradation of the sample, influencing pore filling and particle arrangement patterns, which in turn affect the ability to resist shear deformation. However, the influence of fine particle content typically becomes significant only after reaching a certain threshold and is less direct than the effects of normal stress and dry density [10]. In contrast, the shear modulus of the sample exhibits relatively low sensitivity to water content. This is because coarse-grained soils possess high permeability, allowing pore water to drain easily. Under drained conditions, the effect of water content on effective stress is minimal. Unless the soil contains a substantial amount of fine particles and is in an unsaturated state, changes in water content may slightly affect the modulus through capillary action or lubrication effects, but overall, the impact remains weak. Although the samples in this study consist of a mixture of coarse and fine particles, the maximum fine particle content is 20%, which is still relatively low compared to the coarse particles. Consequently, the sensitivity of the shear modulus to water content is the weakest.

5. Conclusions

This study systematically investigates the non-uniform shear deformation characteristics of coarse-grained soils under varying influencing factors through a modified laboratory direct shear apparatus and a revised calculation method. The following conclusions were drawn:
(1)
Increasing the initial water content and fine particle content significantly weaken the hardening deformation characteristics, but the influence of both dry density and normal stress are opposite. The shear modulus of specimens exhibits a nonlinear decay with increasing water content, whereas it shows an upward trend with rising dry density, fine particle content, and normal stress. The quantitative relationship between the shear modulus and these influencing factors can be effectively captured by an exponential function.
(2)
Under the coupled effects of normal and shear stress, the specimens show significant heterogeneous shear deformation. The front end undergoes slight shear contraction followed by substantial shear dilation, while the rear end consistently experiences continuous shear contraction. Increasing water content, fine particle content, and normal stress markedly intensifies the shear contraction at the rear part and suppresses the shear dilation at the front part. Dry density, however, exhibits the opposite influence.
(3)
The evolution of the rotation angle of the normal stress axis under shear loading can be divided into two distinct stages: nonlinear growth followed by linear growth. This phenomenon originates from the heterogeneous shear dilation of the specimen. Increases in water content, fine-particle content, and normal stress all lead to a monotonic increase in both the growth rate and the ultimate rotation angle of the normal stress axis. Conversely, dry density weakens the rotation behavior of the normal stress axis.
(4)
Based on grey relational theory, the sensitivity of these factors to the shear deformation characteristics of the sample was determined. Normal stress emerges as the most sensitive factor, followed by dry density and fine particle content, with water content displaying the least sensitivity. Nevertheless, the applicability of the present findings is constrained by the adopted testing conditions and the type of tested material; there is still a certain distance between these results and the application of landslides at the field scale. Moreover, the tested colluvial soil characteristics are location-specific and these results should be cautiously applied outside the Sichuan-Xizang areas.

Author Contributions

Conceptualization, Y.Q.; methodology, G.Y.; validation, Y.Q. and X.W.; formal analysis, Y.M.; investigation, Y.Q.; data curation, X.W.; writing—original draft preparation, X.W.; writing—review and editing, Y.Q.; supervision, T.H. and M.Z.; project administration, Y.Q. and L.W.; funding acquisition, Y.Q. All authors have read and agreed to the published version of the manuscript.

Funding

This research was funded by the National Natural Science Foundation of China, grant number 42301155; and the Key Research and Development Project of the Science and Technology Department of Shaanxi Province, grant number 2025SF-YBXM-151, 2025SF-YBXM-163. No external funding from private entities was received.

Data Availability Statement

Data is available upon request from the corresponding author.

Conflicts of Interest

The authors declare no conflicts of interest.

References

  1. Cui, P.; Ge, Y.; Li, S.; Li, Z.; Xu, X.; Zhou, G.G.D.; Chen, H.; Wang, H.; Lei, Y.; Zhou, L.; et al. Scientific challenges in disaster risk reduction for the Sichuan–Tibet Railway. Eng. Geol. 2022, 309, 106837. [Google Scholar] [CrossRef] [Scilit]
  2. Li, W.-W.; Chen, Y.; Zhan, X.-J.; Lv, G.-D.; Huang, X.-W. An experimental study on the densification mechanism of coarse-grained landslide deposits from Southeastern Tibet under dynamic compaction. Soil Dyn. Earthq. Eng. 2026, 202, 110023. [Google Scholar] [CrossRef] [Scilit]
  3. Qu, Y.-L.; Ni, W.-K.; Niu, F.-J.; Mu, Y.-H.; Chen, G.-L.; Luo, J. Mechanical and electrical properties of coarse-grained soil affected by cyclic freeze-thaw in high cold regions. J. Cent. South Univ. 2020, 27, 853–866. [Google Scholar] [CrossRef] [Scilit]
  4. Li, Z.; Zhou, P. Research progress of coarse-grained slip zone soil in China. Nat. Hazards 2023, 118, 1–29. [Google Scholar] [CrossRef] [Scilit]
  5. Chen, Y.-H.; Zhang, L.; Chen, Z.-F.; Liu, Z.-S.; Luo, B.; Ding, X.-H.; Xu, L.-R.; Deng, Z.-X.; Lu, Z.-Q. Analysis of triaxial shear properties of mudstone coarse-grained soils considering penetrating erosion effects. Transp. Geotech. 2025, 50, 101469. [Google Scholar] [CrossRef] [Scilit]
  6. Dołżyk-Szypcio, K. Direct shear test for coarse granular soil. Int. J. Civ. Eng. 2019, 17, 1871–1878. [Google Scholar] [CrossRef] [Scilit]
  7. Wang, X.-Z.; Wang, X.; Jin, Z.-C.; Meng, Q.-S.; Zhu, C.-Q.; Wang, R. Shear characteristics of calcareous gravelly soil. Bull. Eng. Geol. Environ. 2017, 76, 561–573. [Google Scholar] [CrossRef] [Scilit]
  8. Chen, X.; Jia, Y.; Zhang, J. Stress-strain response and dilation of geogrid-reinforced coarse-grained soils in large-scale direct shear tests. Geotech. Test. J. 2018, 41, 601–610. [Google Scholar] [CrossRef] [Scilit]
  9. Zhang, H.; Luo, Y.; Yuan, S.; Zhou, Y.; Zhou, Q.; Zeng, F.; Feng, W. Shear characteristics of gravel soil with different fillers. Front. Mater. 2022, 9, 962372. [Google Scholar] [CrossRef] [Scilit]
  10. Li, Y. Effects of particle shape and size distribution on the shear strength behavior of composite soils. Bull. Eng. Geol. Environ. 2013, 72, 371–381. [Google Scholar] [CrossRef] [Scilit]
  11. Du, J.; Xiong, Z.; Shen, X.; Li, C. Experimental Study on the Effect of Coarse Grain Content on the Dilatancy and Particle Breakage Characteristics of Coarse-Grained Soils. Geofluids 2023, 2023, 2307881. [Google Scholar] [CrossRef] [Scilit]
  12. Li, Z.; Liu, Z.; Zhou, P.; Zheng, J. Meso-level and macro-level mechanical properties of slip zone soil with varying coarse grain contents. Bull. Eng. Geol. Environ. 2023, 82, 149. [Google Scholar] [CrossRef] [Scilit]
  13. Demir, S.; Cabalar, A.F. Undrained triaxial compression testing of sand-low plastic silt mixtures. Transp. Geotech. 2025, 50, 101482. [Google Scholar] [CrossRef] [Scilit]
  14. Motahari-Tabari, S.; Shooshpasha, I. Evaluation of coarse-grained mechanical properties using small direct shear test. Int. J. Geotech. Eng. 2021, 15, 667–679. [Google Scholar] [CrossRef] [Scilit]
  15. Feng, M.; Song, Y.; Xue, H.; Cui, J. Shear Strength of Coarse-Grained Soil: Effects of Scaling Methods and Moisture Content with In Situ Comparison. Appl. Sci. 2025, 15, 5101. [Google Scholar] [CrossRef] [Scilit]
  16. Meng, M.; Ji, Y.; Wang, G.; Guo, Y.; Wan, K.; Duan, X.; Sun, Z.; He, X. Strength-deformation and critical state of coarse-grained soil considering particle shape and particle breakage. Transp. Geotech. 2026, 62, 102162. [Google Scholar] [CrossRef] [Scilit]
  17. Wang, Y.; Pan, J.; Zhang, H.; Zhou, S.; Xu, H. Study on the strength and deformation characteristics of coarse-grained soil under end-restraint and end-free (microfriction) conditions. Appl. Sci. 2023, 13, 11521. [Google Scholar] [CrossRef] [Scilit]
  18. Sadeghian, M.H.; Sadeghi, M.; Fakhimi, A. Particle breakage, deformation and shear strength of conglomerate rock fill material: A case study of Masjed Soleyman Dam cracking and settlement. Bull. Eng. Geol. Environ. 2024, 83, 506. [Google Scholar] [CrossRef] [Scilit]
  19. Shi, W.C.; Zhu, J.G.; Chiu, C.F.; Liu, H.L. Strength and deformation behaviour of coarse-grained soil by true triaxial tests. J. Cent. South Univ. Technol. 2010, 17, 1095–1102. [Google Scholar] [CrossRef] [Scilit]
  20. Liang, S.; Xiao, X.; Feng, D. Study on large-scale direct shear test on soil–rock mixture in an immersion state under water. Int. J. Geomech. 2023, 23, 04022294. [Google Scholar] [CrossRef] [Scilit]
  21. Liu, X.; Zou, D.; Liu, J.; Zheng, B. Predicting the small strain shear modulus of coarse-grained soils. Soil Dyn. Earthq. Eng. 2021, 141, 106468. [Google Scholar] [CrossRef] [Scilit]
  22. Chen, Y.; Yang, J. Small-strain shear modulus of quartz sands under anisotropic stress conditions. J. Geotech. Geoenviron. Eng. 2024, 150, 04024033. [Google Scholar] [CrossRef] [Scilit]
  23. Dai, B.; Yang, J.; Luo, X. A numerical analysis of the shear behavior of granular soil with fines. Particuology 2015, 21, 160–172. [Google Scholar] [CrossRef] [Scilit]
  24. Wang, Z.; Qi, C.; Zhang, Z.; Huang, R.; Guo, C.; Dong, L.; Zheng, R. Improved in-situ direct shear test of rock mass structural plane and its application to stability analysis of bedding slope. Case Stud. Constr. Mater. 2025, 23, e04976. [Google Scholar] [CrossRef] [Scilit]
  25. Wen, T.; Jia, W.; Quan, Z.; Guo, W.; Wang, Y.; Chen, N. Shear behavior of gravel-block soil of the Qinghai-Tibet plateau based on large-scale direct shear test and numerical simulation. Bull. Eng. Geol. Environ. 2025, 84, 294. [Google Scholar] [CrossRef] [Scilit]
  26. Aldaood, A.; Bouasker, M.; Al-Mukhtar, M. Impact of wetting-drying cycles on the microstructure and mechanical properties of lime-stabilized gypseous soils. Eng. Geol. 2014, 174, 11–21. [Google Scholar] [CrossRef] [Scilit]
  27. Ghaderi, A.; Abbaszadeh Shahri, A.; Larsson, S. An artificial neural network based model to predict spatial soil type distribution using piezocone penetration test data (CPTu). Bull. Eng. Geol. Environ. 2019, 78, 4579–4588. [Google Scholar] [CrossRef] [Scilit]
  28. Ghaderi, A.; Abbaszadeh, S.A.; Larsson, S. A visualized hybrid intelligent model to delineate Swedish fine-grained soil layers using clay sensitivity. CATENA 2022, 214, 106289. [Google Scholar] [CrossRef] [Scilit]
  29. Guo, J.-T.; Wang, X.-L.; Wang, J.-M.; Dai, X.-W.; Wu, L.-X.; Li, C.-L.; Li, F.-D.; Liu, S.-J.; Jessell, M.W. Three-dimensional geological modeling and spatial analysis from geotechnical borehole data using an implicit surface and marching tetrahedra algorithm. Eng. Geol. 2021, 284, 106047. [Google Scholar] [CrossRef] [Scilit]
  30. Wu, H.; Wu, Y.; Liao, H.; Zhu, J. Stability of 3D Tunnel Faces in Inclined Layered Soils Under Steady-State Unsaturated Seepage Based on Grey Relational Analysis. Appl. Sci. 2025, 15, 2453. [Google Scholar] [CrossRef] [Scilit]
  31. Fang, Y.; Zhang, J.; Su, Y.; Pan, J.; Feng, K.; He, C. Efficient reliability assessment of slope stability with insightful sensitivity analysis concerning the safety factor. Structures 2024, 64, 106523. [Google Scholar] [CrossRef] [Scilit]
Figure 1. Study Area and Sample Collection.
Infrastructures 11 00267 g001
Figure 2. Grain-size Distribution Curves of Samples Before and After Treatment of Oversized Particles.
Infrastructures 11 00267 g002
Figure 3. Particle Gradation Curves of Samples at Different Fine Particle Contents.
Infrastructures 11 00267 g003
Figure 4. Variation in Real Shear Surface Area in Direct Shear Test. (a) Before the test. (b) During the test. (c) After the test.
Infrastructures 11 00267 g004
Figure 5. Shear Stress-Shear Strain Relationship Curves of the Sample under Different Factors. The colored bands distinguish distinct deformation stages: red for elastic deformation, green for plastic deformation, and blue for the stress stabilization stage.
Infrastructures 11 00267 g005
Figure 6. Relationship between Shear Modulus of Samples and Experimental Factors. (a) Effect of water content; (b) Effect of dry density; (c) Effect of fine-particle content; (d) Effect of normal stress.
Infrastructures 11 00267 g006
Figure 7. Normal Strain-Shear Strain Relationship Curve of the Sample.
Infrastructures 11 00267 g007
Figure 8. Experimental Results of Heterogeneous Shear Dilation Deformation of the Sample.
Infrastructures 11 00267 g008
Figure 9. Schematic of the Heterogeneous Shear Dilation Deformation of the Sample.
Infrastructures 11 00267 g009
Figure 10. Schematic Diagram of Normal Stress Axis Rotation Angle.
Infrastructures 11 00267 g010
Figure 11. Normal Stress Axis Rotation of the Sample under Different Initial Water Contents. Points O and Q are the starting and ending points of all curves, respectively. Points A, B, C, and D correspond to the critical points of the nonlinear and linear segments of the curve under various water contents. The dashed line and colored band in Figure 11a are used to clearly indicate the position of the critical point.
Infrastructures 11 00267 g011
Figure 12. Normal Stress Axis Rotation of the Sample under Different Dry Densities. Points O and Q are the starting and ending points of all curves, respectively. Points A, B, C, and D correspond to the critical points of the nonlinear and linear segments of the curve under various water contents. The dashed line and colored band in Figure 11a are used to clearly indicate the position of the critical point.
Infrastructures 11 00267 g012
Figure 13. Normal Stress Axis Rotation of the Sample under Different Fine Particle Contents. Points O and Q are the starting and ending points of all curves, respectively. Points A, B, C, and D correspond to the critical points of the nonlinear and linear segments of the curve under various water contents. The dashed line and colored band in Figure 11a are used to clearly indicate the position of the critical point.
Infrastructures 11 00267 g013
Figure 14. Normal Stress Axis Rotation of the Sample under Different Normal Stresses. Points O and Q are the starting and ending points of all curves, respectively. Points A, B, C, and D correspond to the critical points of the nonlinear and linear segments of the curve under various water contents. The dashed line and colored band in Figure 11a are used to clearly indicate the position of the critical point.
Infrastructures 11 00267 g014
Figure 15. Grey Relational Coefficients between Shear Modulus of the Sample and Various Factors. The width of the colored band in the figure represents the distribution range of the calculated correlation coefficient values, the lowest calculated value can be divided by the blue dashed line and the highest calculated value by the red dashed line. (a) Effect of water content; (b) Effect of dry density; (c) Effect of fine-particle content; (d) Effect of normal stress.
Infrastructures 11 00267 g015
Figure 16. Grey Relational Degree between Shear Modulus of the Sample and Various Factors.
Infrastructures 11 00267 g016
Disclaimer/Publisher’s Note: The statements, opinions and data contained in all publications are solely those of the individual author(s) and contributor(s) and not of MDPI and/or the editor(s). MDPI and/or the editor(s) disclaim responsibility for any injury to people or property resulting from any ideas, methods, instructions or products referred to in the content.