Article

Study of Structural Response and Safety of an Existing Double-Curvature Concrete Thin Arch Dam Under Extreme Temperature Loads


by
Jiji Panicker Koshy Panicker
*,
Praveen Nagarajan
and
Santosh Gopalakrishnan Thampi
Department of Civil Engineering, National Institute of Technology Calicut, Kozhikode 673601, Kerala, India
*
Author to whom correspondence should be addressed.
Infrastructures 2026, 11(3), 86; https://doi.org/10.3390/infrastructures11030086
Submission received: 28 January 2026 / Revised: 19 February 2026 / Accepted: 22 February 2026 / Published: 6 March 2026

Abstract

Concrete arch dams, which account for about 4% of large dams worldwide, are distinguished by their efficient geometry, economy, effective load distribution, and high storage capacity. Under thermal loads, they are susceptible to unusual behavior in terms of deflection and stresses due to geometrical peculiarities, construction methodology, and restraints, which in turn may cause potential failure. This paper analyzes the behavior of a 50-year-old double-curvature, high, thin concrete arch dam under extreme thermal loading and fluctuating water levels, using 3D linear elastic FEM analyses and monitoring data. It rigorously evaluates structural response—deflections and stresses—at salient locations and interaction zones under large temperature fluctuations, a key yet underexplored risk for thin concrete arch dams in tropical and equatorial regions. Using real monitoring data, the research also examines the effectiveness of rehabilitation measures designed to mitigate thermal impacts. Results indicate that the dam deflection reverses at extreme temperature drops and rises when the reservoir is at higher or lower levels, respectively, which is not unusual for thin concrete double-curvature arch dams. Long-term exposure to high extreme temperatures with low reservoir water levels may become a concern, as it can cause higher tensile stresses at salient points and significant dam deflections towards upstream.

1. Introduction

Dams are indispensable for water storage and river regulation. The International Commission on Large Dams (ICOLD) [1] registry lists 62,362 large dams [2]. With global water demand for 8.2 billion people [3] rising by 2–3% annually [1], dams that impound, divert, and regulate river flows remain vital. Ensuring safe, robust design, adherence to standards, sound construction, and proper operation and maintenance is crucial to minimize risks and failures. Although concrete arch dams constitute only about 4% of large dams worldwide, they are distinguished by their great height, thin and economical form, efficient load distribution, and large storage; despite the rarity of failures, periodic safety reviews are essential for both existing and new dams.
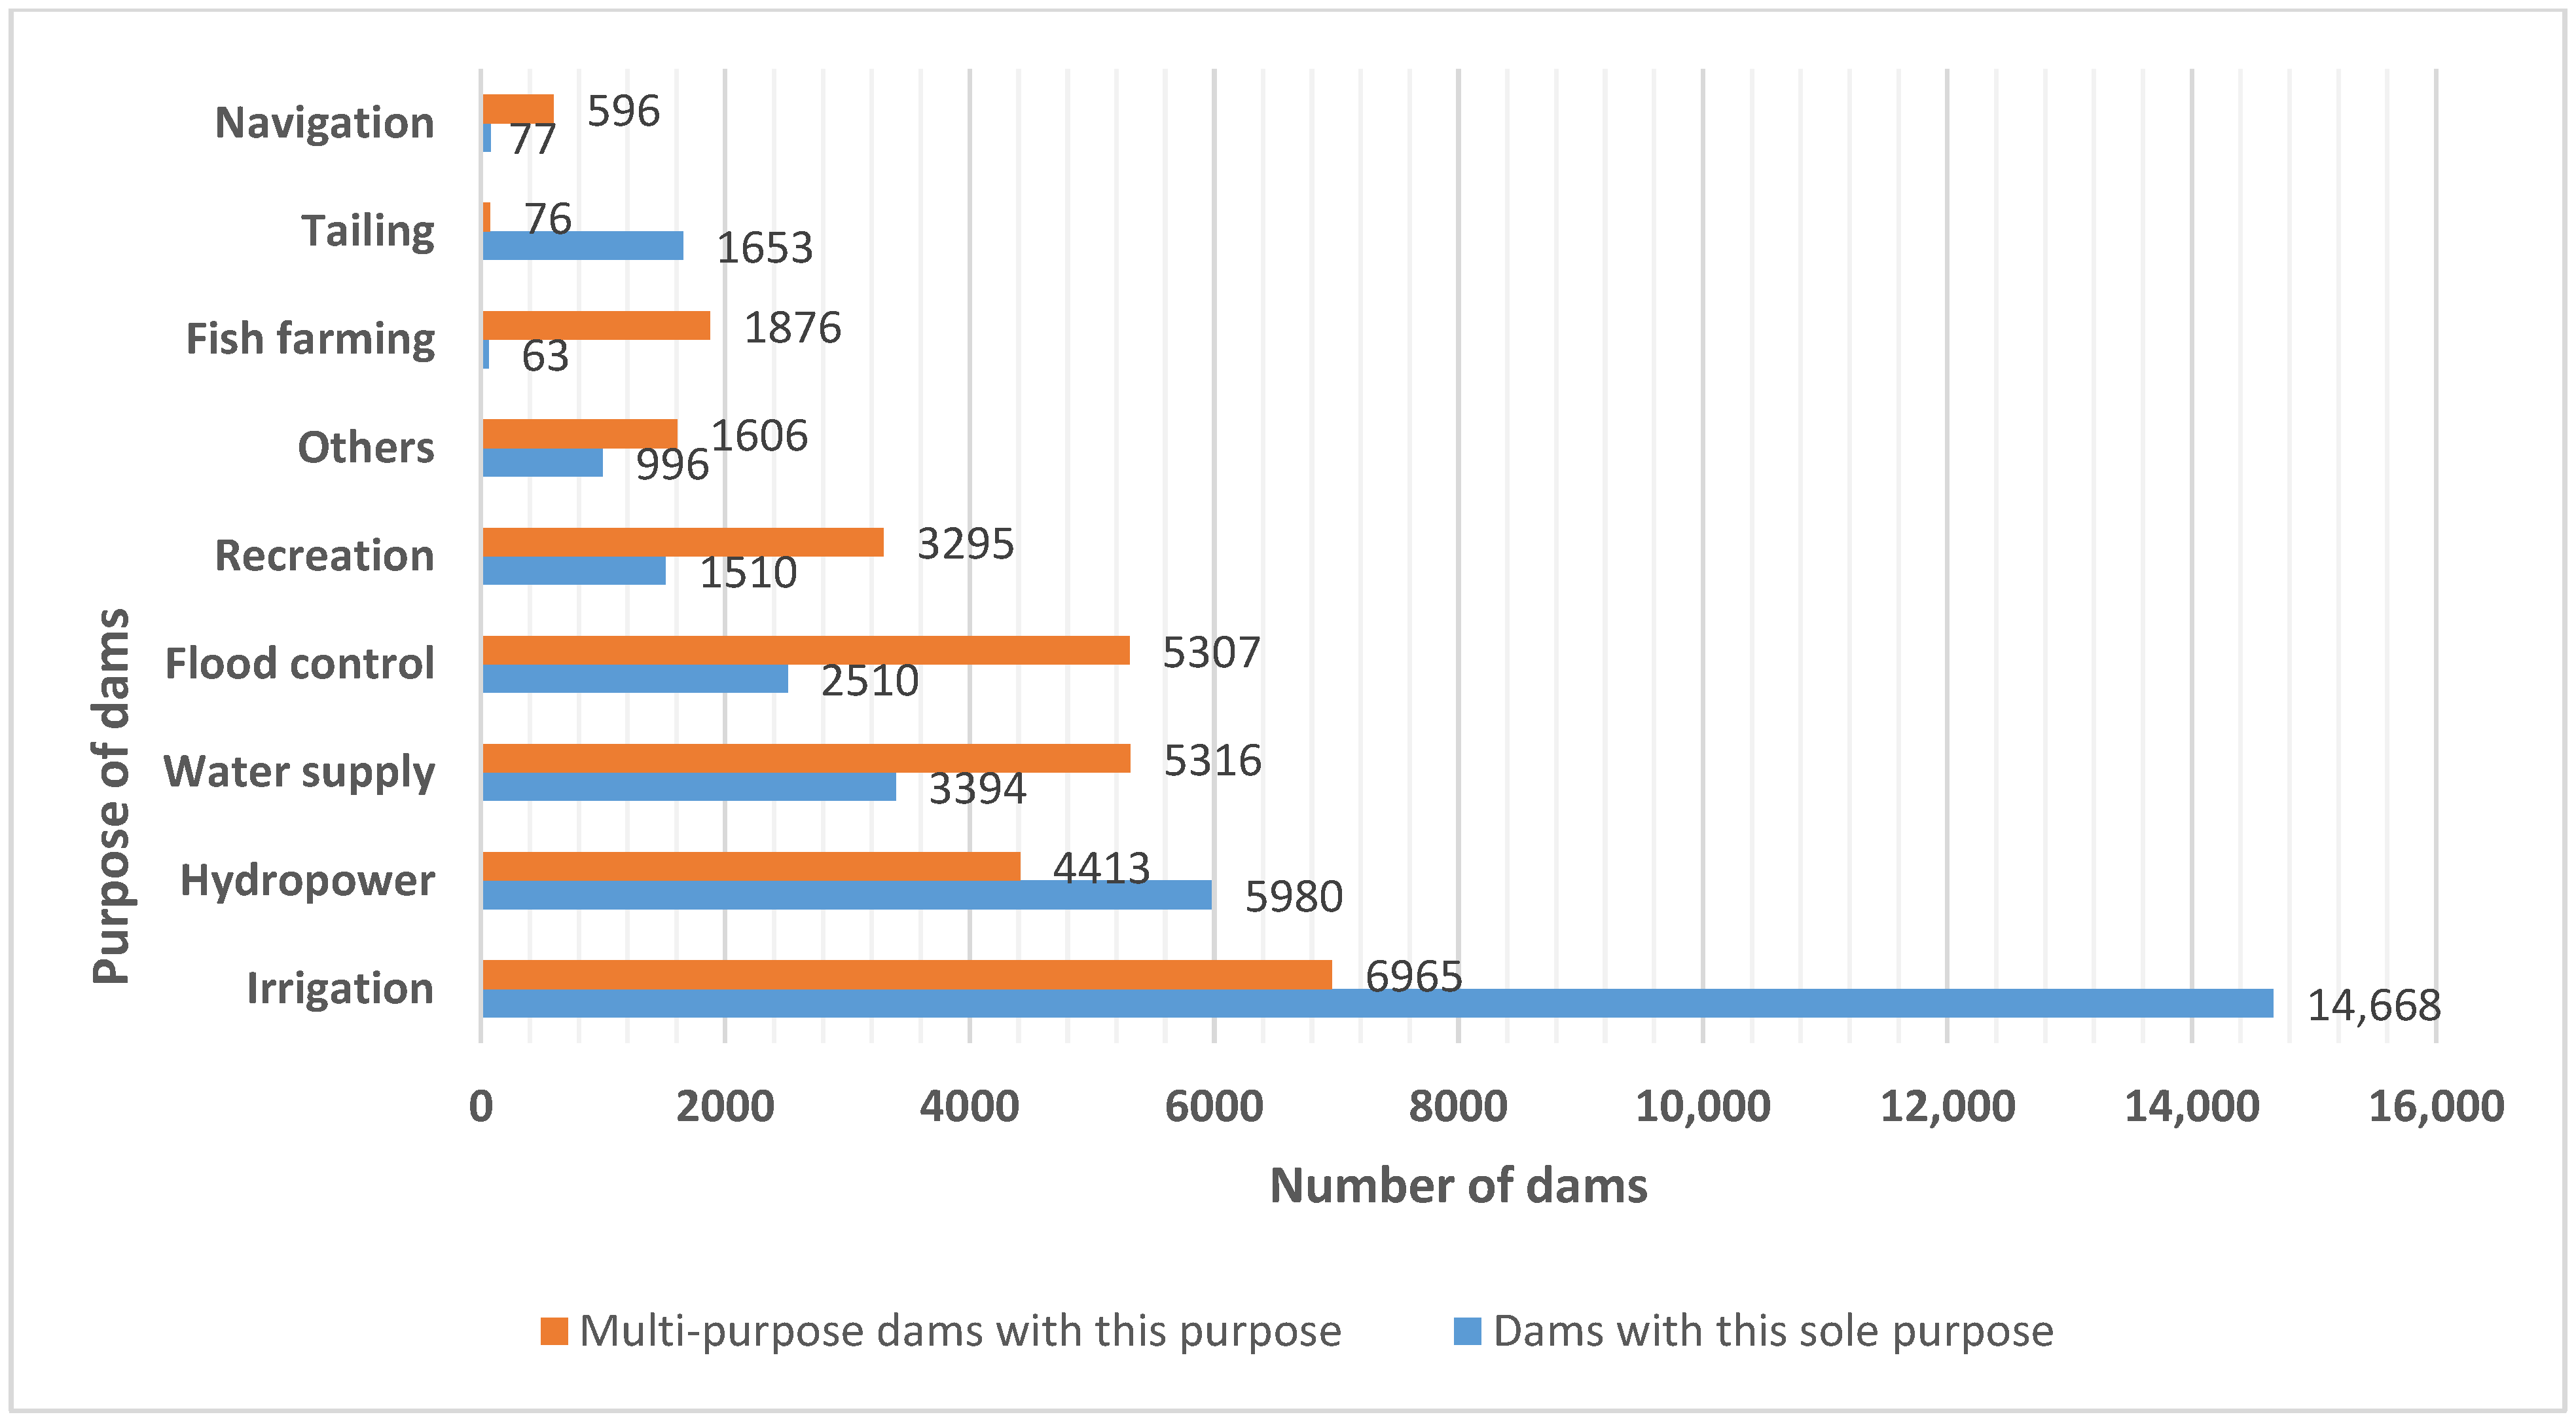
Properly planned, designed, constructed, and maintained dams are vital multi-purpose structures serving water supply, power generation, and other national needs, while sustaining required flows for riverine ecosystems under effective operation (Figure 1). By balancing economic benefits with environmental impacts through stakeholder participation and suitable mitigation measures, a nation’s water-resources potential harnessed through dams can be efficiently managed for sustainable development [4].
Global environmental change and projected climate change are major concerns for civil society, with the impacts of dams on these issues being widely studied [5,6,7]. Equally important are the effects of these challenges on dam safety and the potential of dams to help address them, as summarized in the ICOLD position paper on dams and the environment [8,9,10].
Arch dams can be classified according to the material, thickness, height, number of centers (single-centered, two-, three- or poly-centered, etc.), curvature, whether they are constant- or variable-centered, etc. [11,12,13]. A single curvature dam is curved in plan only, whereas the double-curvature dam is curved both in plan and elevation, and usually has an undercut at the heel and an overhang on the downstream side towards the crest. Based on the crest length/height ratio (CL/H), they are classified as Narrow-V (CL/H = 2), Wide-V (CL/H = 5 to 10), Narrow-U, and Wide-U. Design considerations will differ based on the type. The classification based on thickness is given in Table 1 [14,15]. There is remarkable economy in concrete volume for arch dams compared to gravity dams of the same height; the savings are pronounced as the height of the dam increases [16].
The behavior of arch dams is inherently complex, particularly for double-curvature thin arch dams, largely depending on geometry, thickness, height, dam–rock interaction, foundation quality, and loading; structural asymmetry further intensifies this complexity. In the construction and operational phase, they are influenced by physical, environmental, and chemical actions, while climate change adds to the uncertainty and severity of extreme events during service life. In tropical regions, prolonged solar radiation and rising temperatures impose significant thermal loads on exposed dam surfaces, which can severely affect high arch dams, causing cracks at salient locations, including in galleries [17,18]. This paper investigates the effects of such extreme thermal conditions on an existing concrete double-curvature thin arch dam.
Arch dams safely withstand the reservoir water loads and their seasonal variations by effectively transmitting the loads to canyon rock. These dams also have to withstand various load combinations involving the reservoir water loads. Thermal and seismic loads are prominent among them, whereas other loads, such as silt loads, wind loads, ice loads and uplift loads, as the case may be, will also act. Often, the influence of thermal loads is not duly underscored as a potential threat to the structural safety of thin concrete arch dams. This paper aims to study in detail how the temperature extremes, occurring in tropical and equatorial regions, influence the structural behavior in the form of deflection and stresses of double-curvature, concrete thin arch dams. The considerable differential in ambient temperature, highly receding water levels and prolonged exposure during hotter summers make the thermal loading due to solar radiation a possible vulnerability for these dams.
The dam in this study, a main component of a major hydroelectric power project in India, has been in operation since 1975; depletion of the reservoir during the high peak power demand in summer leaves the upstream face of the dam continuously exposed to hotter ambient temperature. The resulting differentials with respect to arch closure temperature cause thermal expansion, generating tensile stresses, cracking, excessive thrust at abutments, which are potential threats to dam safety. The ambient temperature data since 1975 were analyzed, and it was found that the variation over those years ranged from a minimum of 20 °C to a maximum of 35 °C, approximately. The temperature extremes at various levels were also obtained from field data for the present steady state thermo-structural analyses. The study is distinct for not only analyzing the behavior of the thin concrete double-curvature dam for the sensitive thermal effects but also for evaluating its behavior through the field monitoring data for the effectiveness of mitigation measures.

2. Need for Continuous Evaluation and Review of Arch Dams for Safety

2.1. Need for Analyses

Continuous review of design criteria and behavior against prevailing guidelines is essential to ensure the safety of existing dams, along with implementation of remedial measures for discrepancies, if any, as needed in line with current engineering practice; this will shed light on the design of such new dams. Since 1977, sustained efforts have advanced guidelines for the design, safety, and evaluation of both existing and new concrete arch dams, covering extreme flood assessment, hazard potential, dam-break and earthquake analyses, and risk-based safety evaluation, all of which continue to be periodically revised. Modern safety assessments employ deterministic–statistical, semi-probabilistic, and probabilistic approaches, while arch dam geometry has evolved from the independent circular arches of the mid-1920s to today’s thin double-curvature forms [19].
Arch dam analysis has evolved significantly since the early 20th century, progressing from cylindrical theory to trial-load methods [20], and later to linear elastic design principles formalized by the USBR [15]. Subsequent advances incorporated nonlinear static, linear dynamic, and nonlinear dynamic analyses to better represent real loading, material behavior, and site-specific conditions. In place of simple linear-elastic approaches that neglected contraction joints and nonlinear responses, methods accounting for vertical contraction joints and joint opening that reduce tensile stresses from arch contraction were developed [21]. This is significant in the case of temperature variations occurring seasonally. It has been reported that the behavior of arch dams is sensitive to temperature variations by way of deflection as well as stresses on the dam body [22,23,24]. During summer, the ambient temperature may rise above the arch closure temperature, that is, the temperature at which the contraction joints are grouted, whereas in winter, the ambient temperature may fall below this temperature. These fluctuations in ambient temperature cause the dam to move towards and away from the water in the reservoir. The behavior of the arch dam subjected to temperature load with varying water levels is investigated in this work.

2.2. Temperature Control

Temperature load will have adverse effect on arch dams during its construction and operational life. An exhaustive arrangement for cooling is essential for arch dams to meet the requirement of different phases of cooling during its construction.
Temperature effects constitute a major complexity in arch dam construction. By 2014, China had completed seven high arch dams exceeding 200 m, including the 305 m Jinping I, built under complex geological conditions, where advanced practices in foundation treatment, abutment stability, temperature control, seismic design, and updated guidelines were critical. Effective thermal management during construction, essential for crack control, was achieved through measures such as embedded pipe water-cooling systems, temperature sensors, control algorithms, and specialized equipments [25]. In the Idukki double curvature arch dam in Kerala, India, completed in 1974, the behavior of which is studied in this work, a network of cooling water pipes has been employed for the control of temperature of concrete during construction, effectively utilizing the galleries [26]. During service life, any variation of temperature from arch-closure temperature would act as thermal loads. A higher temperature differential may cause undesirable behavior. Hence, it is important to monitor and evaluate the effect of temperature—the thermal loads caused due to seasonal variation in temperature—on arch dams in operation, as thermal loads cause expansion and contraction, which are concerns for an arch structure restrained at the abutments.

3. Arch Dam Failures

3.1. Dam Failures—General

Dam failures are categorized as structural failures due to foundation problems, strength and stability issues caused by loads, mechanical failures caused by malfunctioning gates, hydraulic failures from overtopping, inaccurate design criteria, operations failures such as malfunctioning of components, and failures due to uncontrolled seepage [27]. However, in arch dams, as the abutments play the key role in transmitting the loads, the effects of various loads—mainly thermal loads and seismic loads—which can cause concerns to dam safety and a consequent failure, need to be investigated.
Failure of concrete arch dams is quicker than in concrete gravity dams. Also, a large segment of it may breach. Rock quality issues causing structural instability of the foundation and weak abutments are often major concerns for arch dams. Identification of failure modes and the causes that may lead to failure modes and its development into a total failure is vital [28].
Potential failure modes require a triggering event such as flood, a seismic event, adverse thermal loading or human operating error. These would result in a sequence of interrelated events that would lead to failure. The structural response at any node of an event tree in the failure mode development is obtained through appropriate structural analysis. The accuracy of material properties, loading and methods of analyses such as 2D, 3D, linear elastic and nonlinear would play a decisive role in assessing the effects of the event [29].
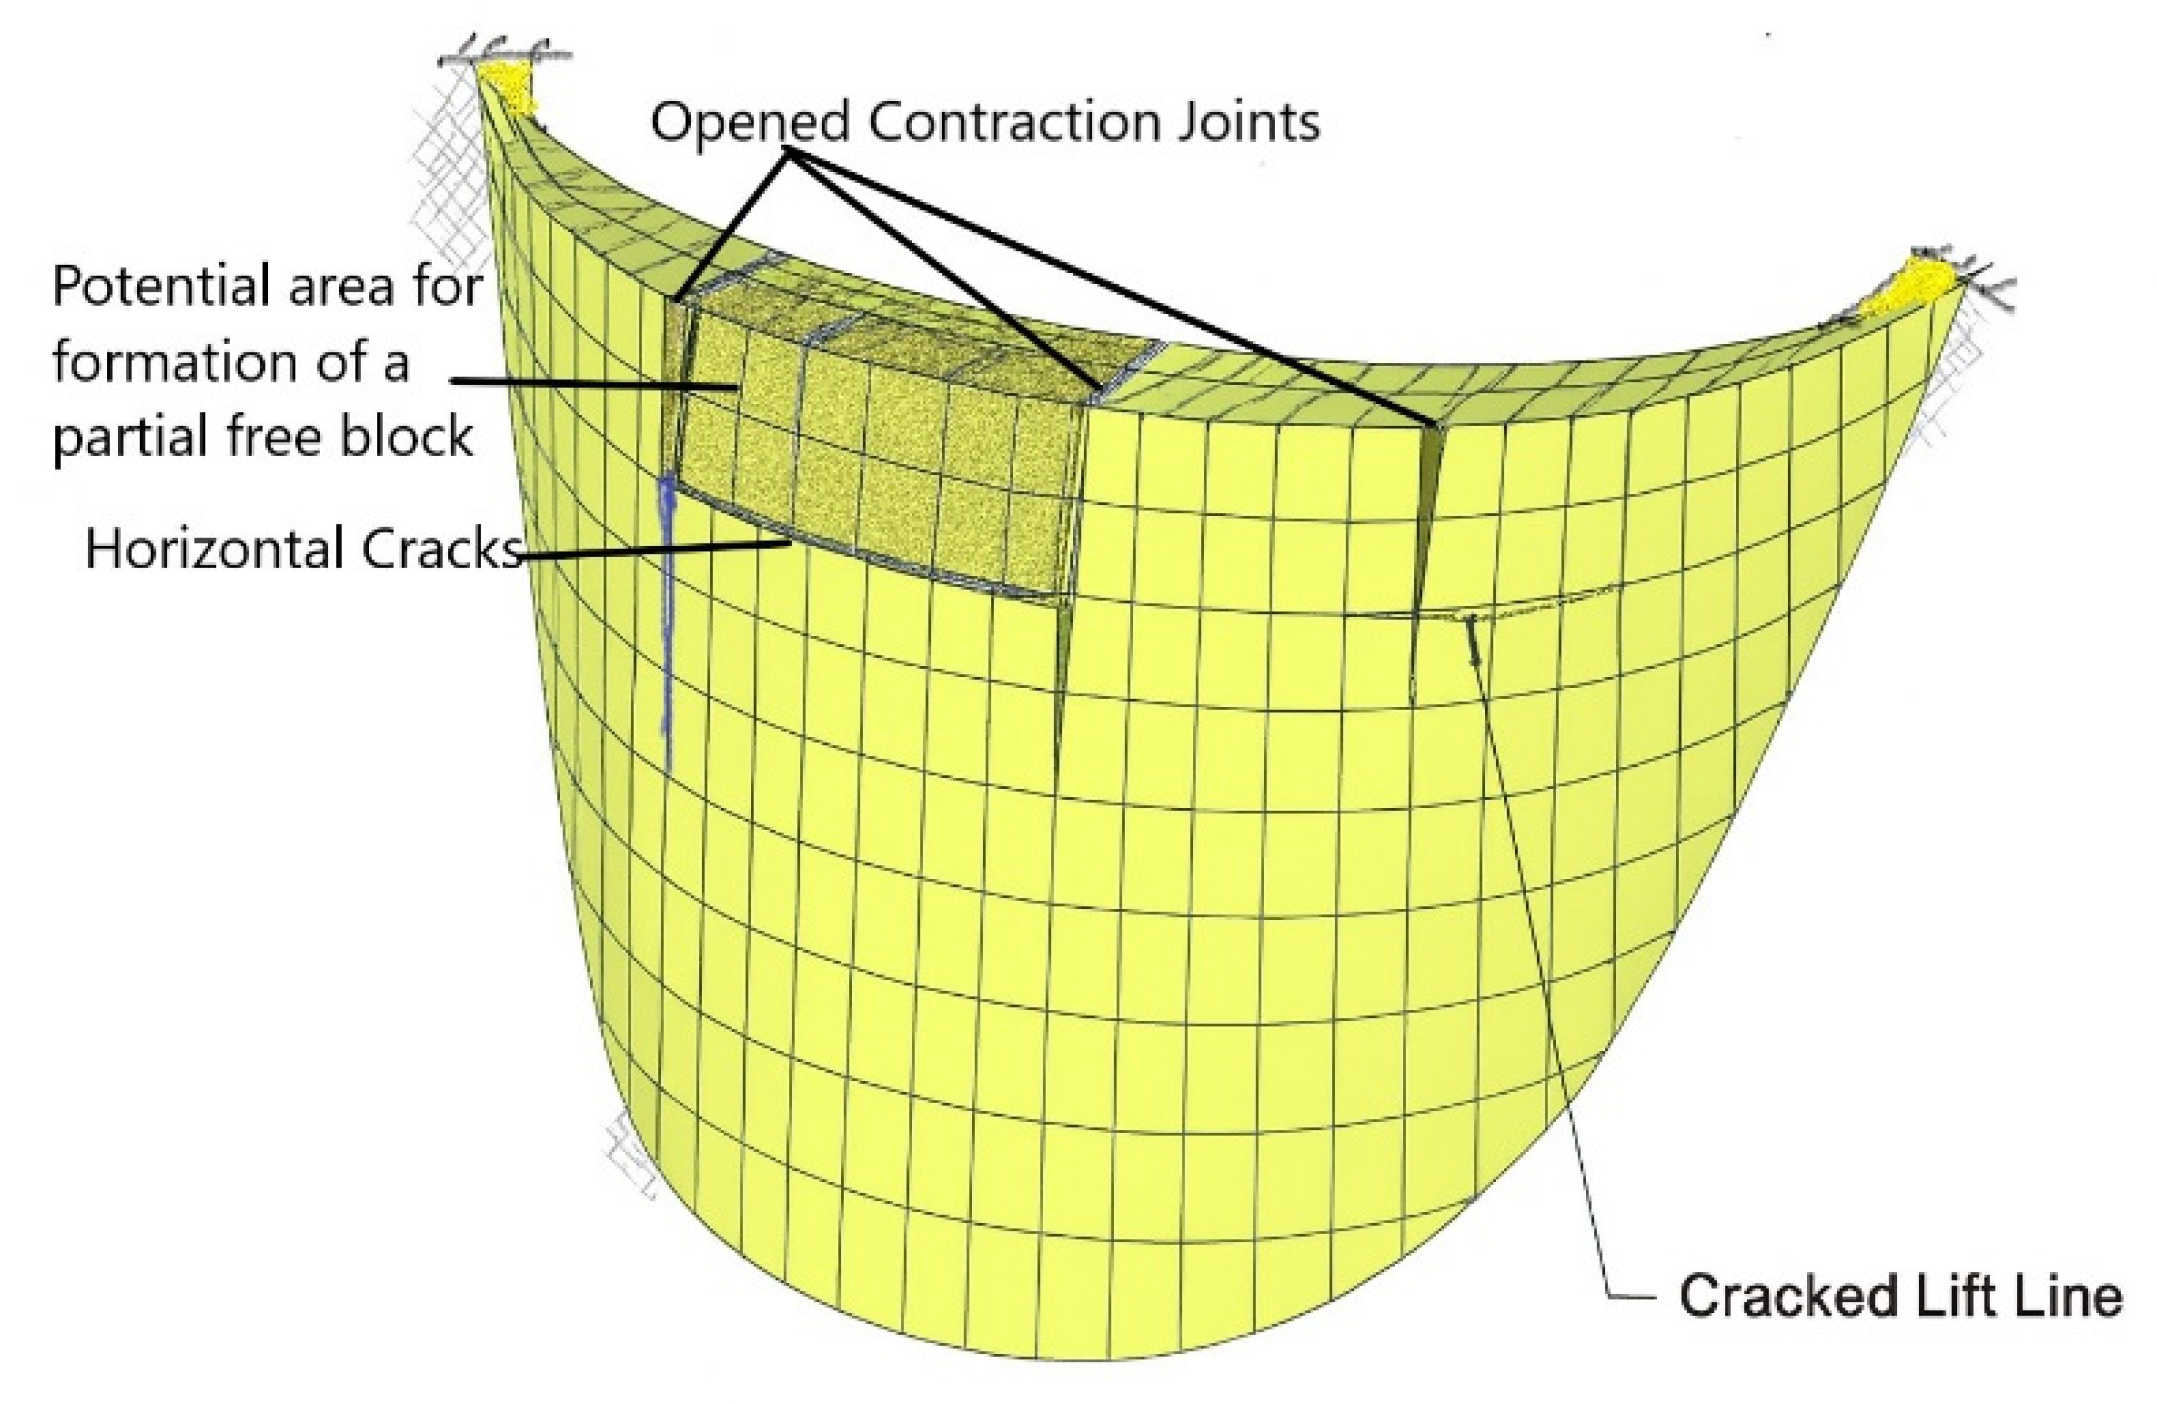
Potential failure scenarios can arise due to causes such as (1) large opening of the contraction joints; (2) excessive tensile stresses and development of cracks resulting from adverse and extreme load combinations; (3) movements such as wedge movement and sliding at the rock–abutment interface (at the abutting rock, resulting from discontinuities or weak rock); and (4) instabilities occurring at the rock–foundation interface. Excessive tensile stresses in the dam body may result in horizontal cracks and opening of the contraction joints, which may result in failure [30]. When the consequences of opening of contraction joints and horizontal cracks due to large tensile stresses tend to combine, it may lead to the formation of partial free blocks and would initiate a failure mode (Figure 2). Abutment rock movement can also occur due to severe earthquake and weak abutment, as in the case of the Pacoima arch dam, seriously affected by the two earthquakes in 1971 and 1994 [30].
There are many studies on developing a failure scenario by overloading, though the possibility of the occurrence of such an extreme event is very remote, as there are sound monitoring and operational protocols attached to such large dams of high hazard potential. The study and failure analysis based on a geo-mechanical model test conducted for the 200 m high Mengdigou double-curvature dam, China, having complex geological conditions, suggested that the main cause of nonlinear deformation and failure of the arch dam is the damage to the toe during overloading [31]. The analysis for failure and stability used criteria such as overloading factor (K), the safety factors of cracking, K1, of initial nonlinear deformation, K2, and of the ultimate bearing capacity, K3, for different overloading water pressure. The increase in displacement in river direction, its non-linearity, crack initiation and failure at ultimate capacity, etc., were studied. Similar model tests conducted on certain prominent arch dams like Baihetan [32], Xiluodu [33], Jinping-I [34] and conclusions drawn on cracks and failure patterns [35] emphasized the reinforcement of the dam toe. However, such model studies were done with water loading and overloading.

3.2. Abutment Rock Failure in Arch Dams—Lessons from Historical Case

Study of potential failure modes and scenarios that caused failure often serve as guidelines to designers and dam owners. The failure of the Malpasset dam, France, a double-curvature concrete arch dam of 66.5 m height and 222 m length at crest, constructed in 1959, is the first incident of a concrete arch dam collapse in the modern era. This failure caused concern that any type of dam is vulnerable to failure. This failure also paved the way for various researchers to analyze the potential failure causes, modes and mechanisms in arch dams, based on pre-failure and post-failure observations, thereby helping in the design of new arch dams and in the safety evaluation of existing dams. There were different hypotheses, viz., Bellier and Londe [36] and Wittke and Leonards [37] explaining the failure at the left abutment.
Based on 2D and 3D Finite Element Analyses, Bellier and Londe [36] hypothesized that stress concentration parallel to the foliation, schistosity, below the dam resulted in reduced permeability. Wittke and Leonards [37] concluded that the cause of the failure might be the soft zone below the dam at the left abutment and hypothesized that the formation of a crack due to tensile stresses perpendicular to the schistosity might have led to the failure [38]. They proposed measures for increased dam safety against a similar adverse foundation scenario, reducing tensile stress along rock foliation and avoiding opening of a crack at the base by widening the base, introducing a peripheral joint, and a concrete slab to the upstream toe of the dam [39]. The above failure scenario underscores the actions to check the development of such scenarios at critical locations of the dam body and interfaces.

4. Materials and Methods

4.1. Dam Structure

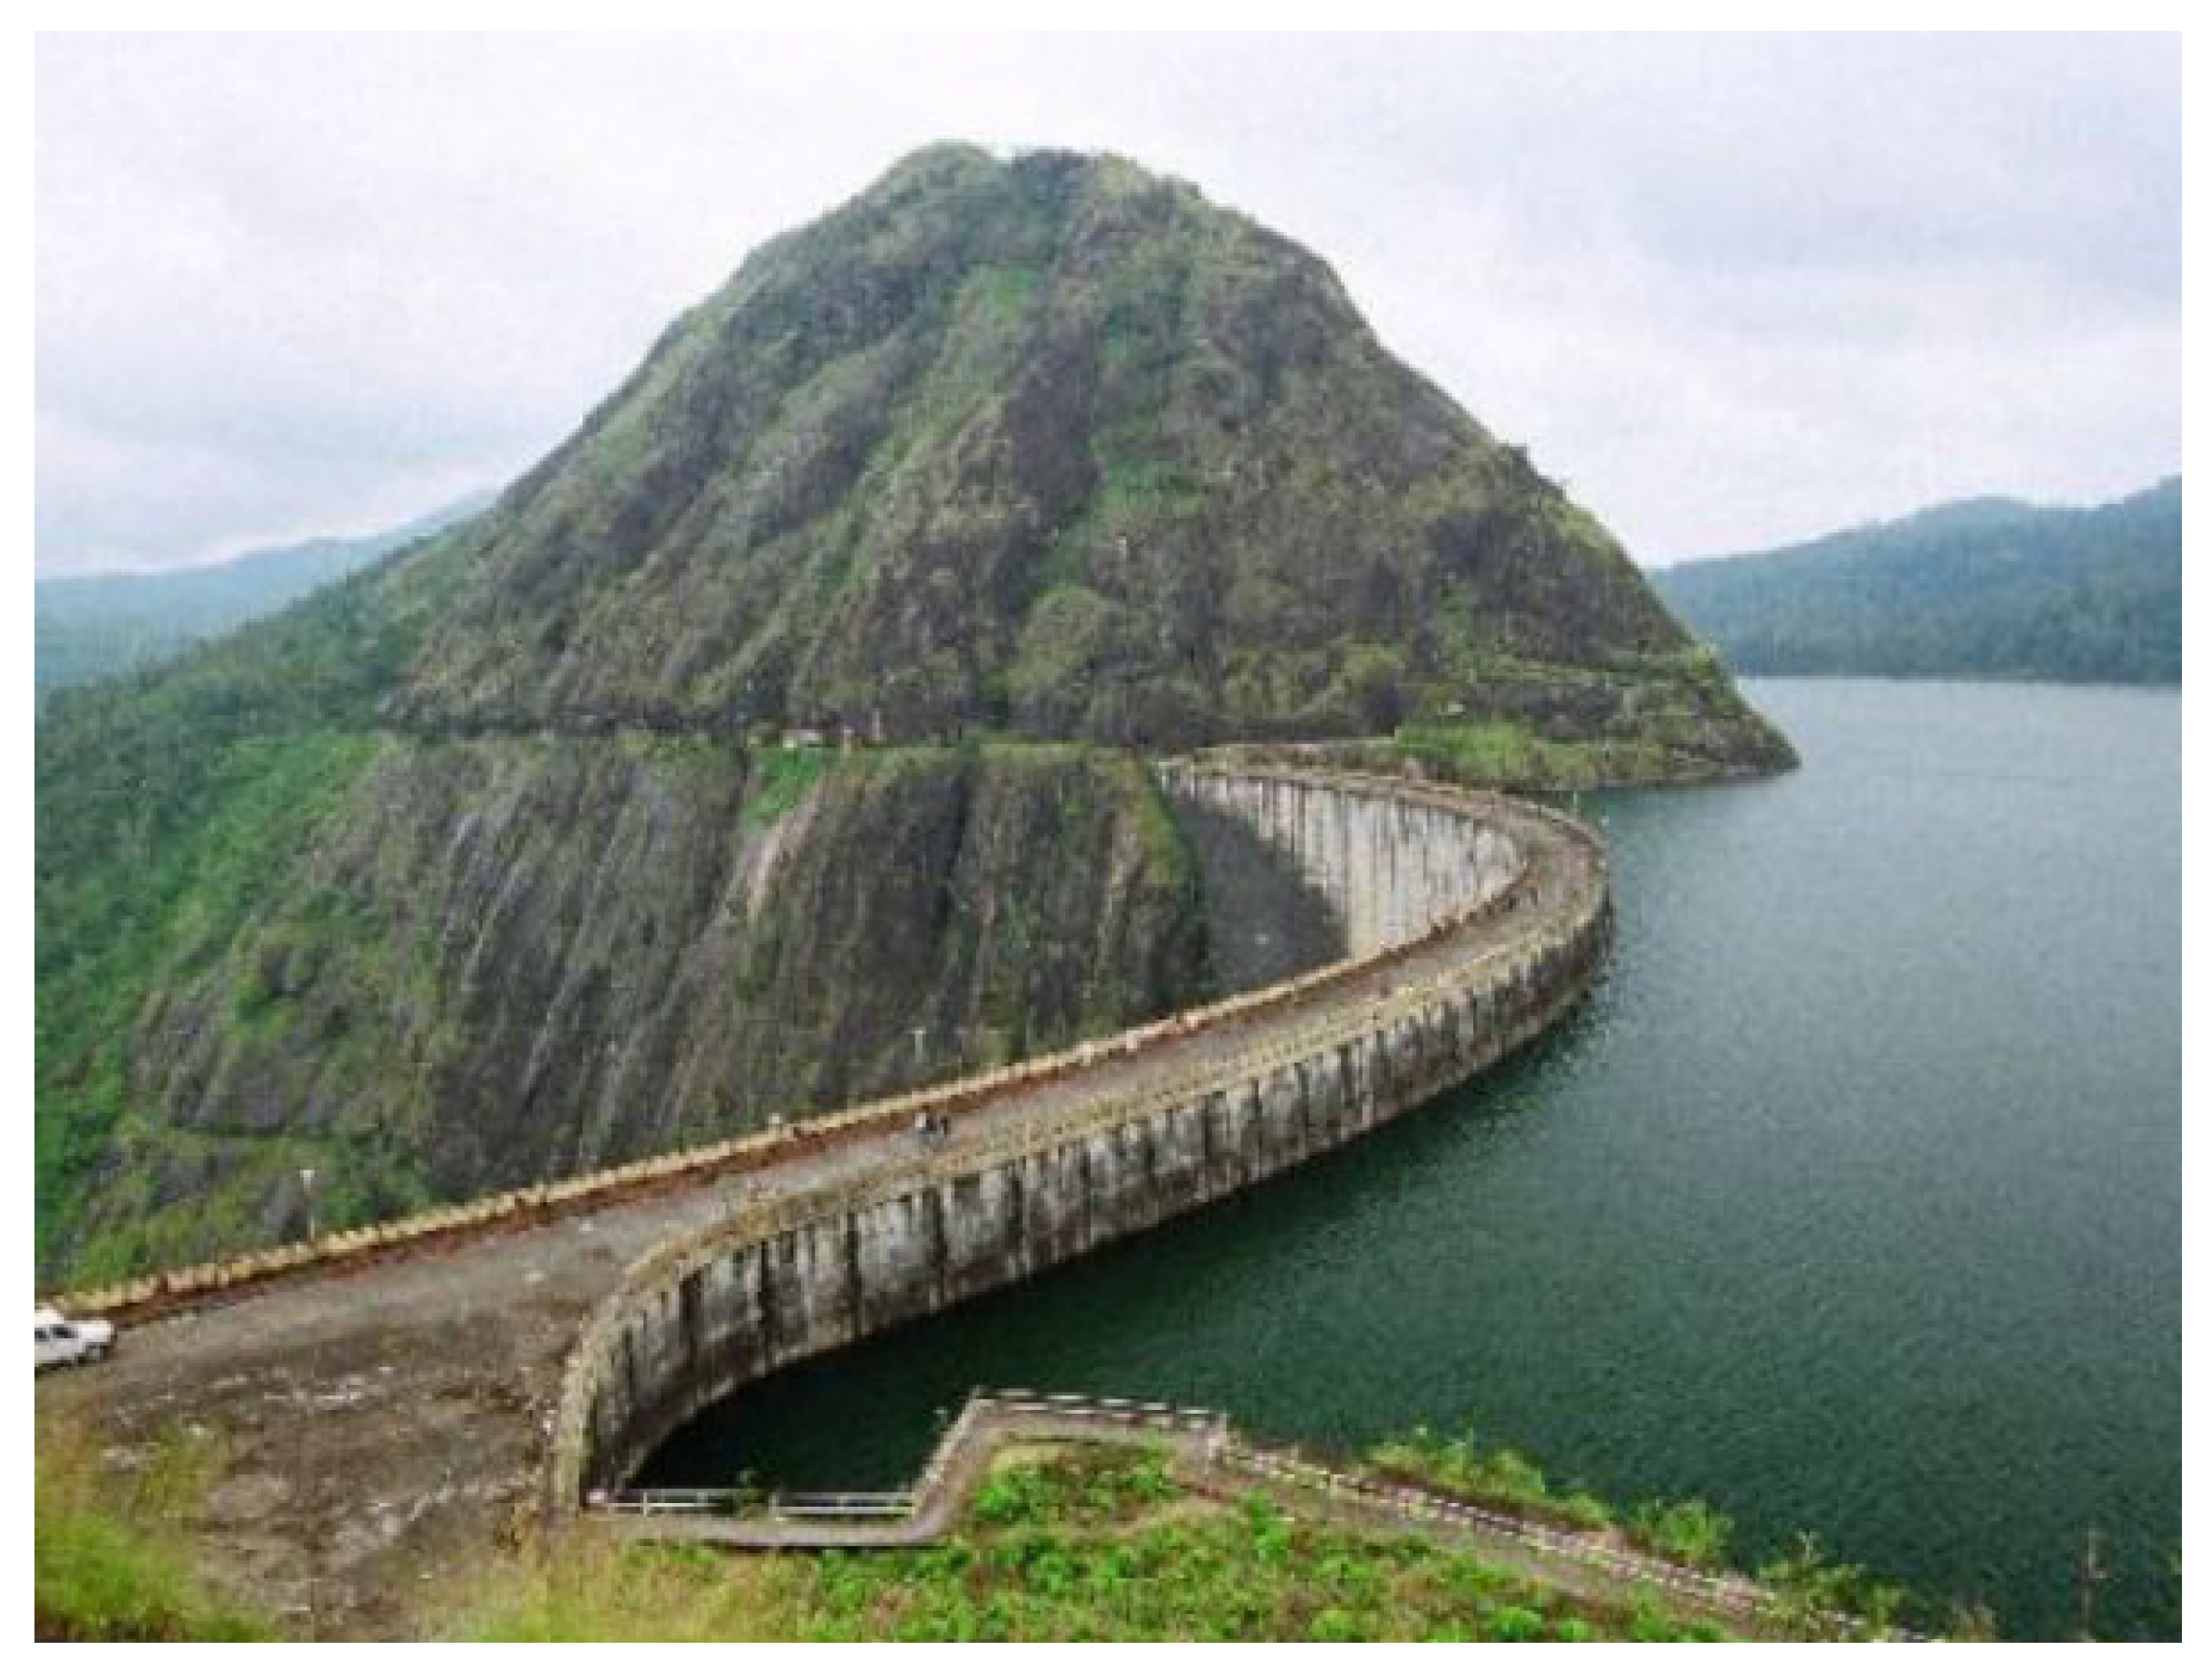
The effect of thermal loads on an arch dam was studied on a 50-year-old double-curvature, thin, asymmetrical, concrete arch dam in India. The 169 m high double-curvature thin concrete arch dam, constructed across a narrow V-shaped gorge in the Periyar River, is 381 m long at the crest and has a width of 7.6 m at the top and 24.4.m at the bottom. The asymmetrical arch dam (Figure 3), constructed in blocks (24 monoliths), has vertical contraction joints between the blocks, which were effectively grouted before impoundment. The dam impounds water from the monsoon inflows. The water level fluctuates between Minimum Drawdown Level (MDDL) and Full Reservoir Level (FRL). However, effective water management through scrupulous reservoir operation and planning by the dam owner, KSEBL, averts the reservoir storage touching both the levels, though it came very close to it in a few seasons. This arch dam does not have spillways in its body; a separate concrete gravity dam in the same reservoir effectively manages spilling as per properly designed controls.

Material and Rock Properties

The in situ properties of concrete used for the studied double-curvature arch dam were ascertained through extensive laboratory tests conducted by the project authorities on the core samples taken from salient locations. The properties of concrete are as per the test reports and are listed in Table 2.
The foundation of the dam is massive and crystalline charnockite. Geological exploration revealed excellent rock conditions. The material properties of rock foundation and the abutments supporting the cantilevers and arches adopted for the numerical study are as per Table 3. The rock foundation was systematically grouted (both contact grouting and consolidation grouting) based on exhaustive geological exploration to ensure strength and stability of the rock–concrete interface. Deep curtain grouted barriers were established before and after impounding.

4.2. Thermal Load

The paper analyses the influence of temperature differentials on the behavior of the double-curvature arch dam structure. In addition the gravity load of the dam and varying load due to varying water level, thermal loads due to temperature effect were also included, to study the movement of the dam structure by its deflection and the stress pattern at various salient points in the dam structure and dam–rock interface region, due to these temperature loads. The thermal load acting at various points in the surfaces of the arch dam is influenced by factors such as solar radiation, air temperature, wind, rainfall and spatial variation. However, in this paper the study is conducted using the in situ temperature measurements. Based on the temperature measurements, temperature loads are applied at pre-defined elevations and the temperature below water level at the upstream is assumed to vary linearly. The sensitivity due to spatial variation over the surface due to exposure, cloudiness, and shade of the mountain is not decisive for the extreme scenarios and hence not considered in this study.
The temperature data were sourced from the project office beginning in the year 1975. It is found that the ambient temperature variation over these years ranged from a minimum temperature close to 20 °C and a maximum temperature close to 35 °C.
Steady state thermal analyses were conducted to study the effects of thermal load along with the varying water load.
As per the Fourier law of heat transfer [40], the heat transfer rate (q) is given by:
q = k T x
where k is thermal conductivity (W/m °C).
The heat conduction equation for a general 3-dimensional scenario in Cartesian coordinates is given by [35]
x k T x + y k T y + z k T z + q ˙ = ρ c T t
where k, ρ, q ˙ , and c are thermal conductivity (W/m °C), density (kg/m3), energy generated per unit volume (W/m3) and specific heat of material (J/kg °C), respectively.
When the thermal conductivity is constant for all directions, Equation (1) becomes:
2 T x 2 + 2 T y 2 + 2 T z 2 + q ˙ k = 1 α T t
where α = k ρ c = thermal diffusivity of the material.
For an old dam, or a dam in operation for a number of years, the source of heat generation—heat of hydration of cement would be almost dissipated, q ˙ = 0 , and for the steady state, there is no temperature variation with respect to time.
Accordingly, for the 3D case, the heat transfer equation becomes
x k T x + y k T y + z k T z = 0
2 T x 2 + 2 T y 2 + 2 T z 2 = 0
In the numerical analyses using Finite Element Method (FEM), this equation is discretized and results in a system of linear equations which can be solved for the temperature distribution in the dam domain. Accordingly, the governing equation for steady state in the FEM analysis becomes
K T . T = Q T
where K T is the conductivity matrix. The steady state analyses solve for the temperature at various points, T , when the temperature load, Q T , is applied as per the boundary conditions.

4.3. Method of Analysis

Selection of an appropriate method of structural analysis of a concrete dam depends on the potential failure modes and the events resulting from that mode which would lead to dam failure. The analyses help to quantify the response of the dam against those specific events to determine the probability of failure, quantify the uncertainty in behavior, or to prove that the event would not progress and lead to failure. Field investigations, instrumentation, and testing can then be focused on the requirements of the analyses.
The analysis was carried out using a simplified approach with reasonable assumptions, and the results were validated against field monitoring data. The model analyzed with hydrostatic loads alone produced outcomes consistent with earlier analyses by consultant, physical model studies, and field observations, as discussed in Section 5 (“Results and Discussion”). The United States Federal Energy Regulatory Commission (FERC) recommended that arch dam safety assessment begin with simple analytical methods using conservative assumptions, followed by more rigorous analyses if concerns arise. In line with this, Linear Elastic Analysis was adopted to obtain reliable safety insights, while detailed failure-mode evaluation would require consideration of material and geometric nonlinearity, joint opening, and cracking.
The revised FERC guidelines indicate that linear elastic finite element analysis can help determine whether thermal loading is likely to induce cracking. Since this study focused on evaluating stress and deflection responses under thermal loads and the effects of mitigation measures, linear elastic modelling was considered adequate for identifying potential vulnerable or failure-prone zones, after which more detailed investigations, including nonlinear analyses, would be required.
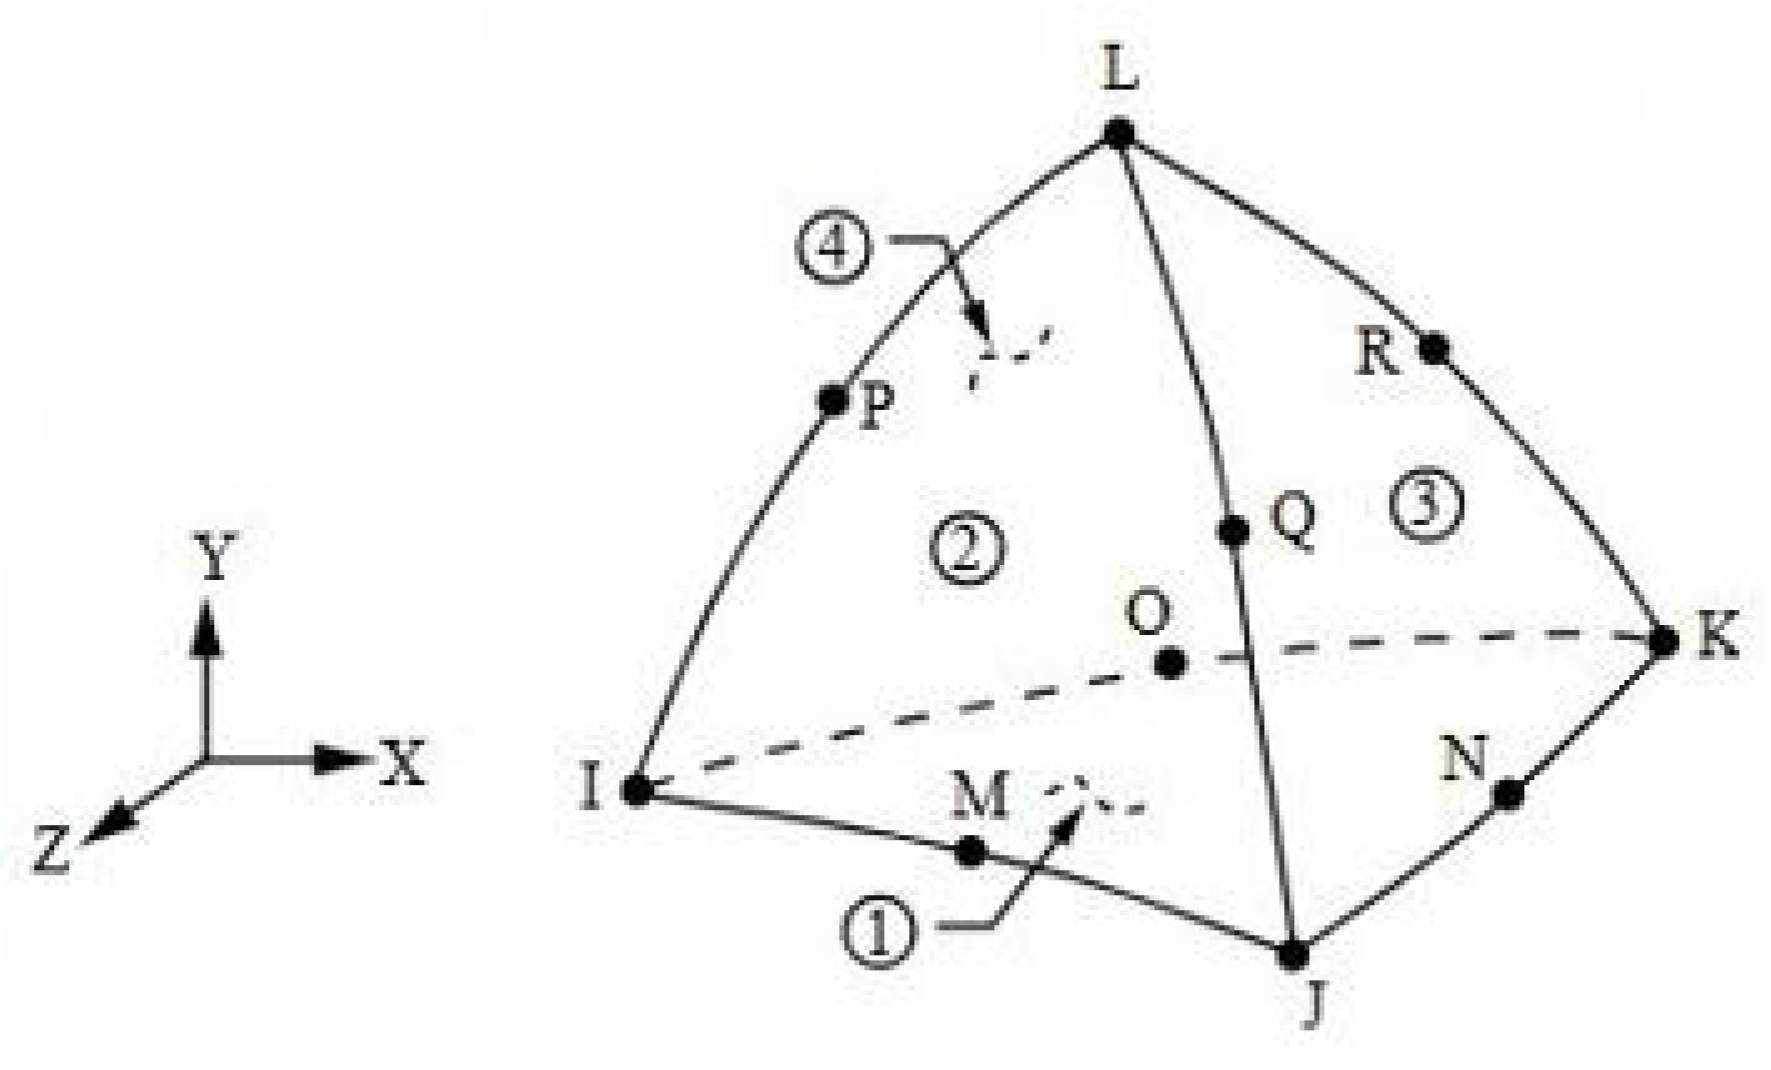
In this study, the arch dam was modelled with the contraction joints and abutment rocks and subjected to 3D FEM analyses using ANSYS 2022 R1. The maximum size of an element is 3.00 m for the dam body with defeature size of 0.05 m, whereas the size for gallery elements is 0.50 m. The maximum element size for rock and defeature size are 40.00 m and 0.50 m, respectively. In the analyses, the element sizes at the rock interface were fixed as 3.00 m with a defeature size of 0.20 m. A total of 10 nodal tetrahedron elements were used to model the complex geometry facilitating a good balance between computational time and accuracy. SOLID291 and SOLID187 (Figure 4) were the element types used for the steady state thermal analyses and static structural analyses, respectively. A total of 649,468 elements were used in the analyses. The dataset for material properties of the dam and the canyon rock comprised actual data sourced from the dam owner.
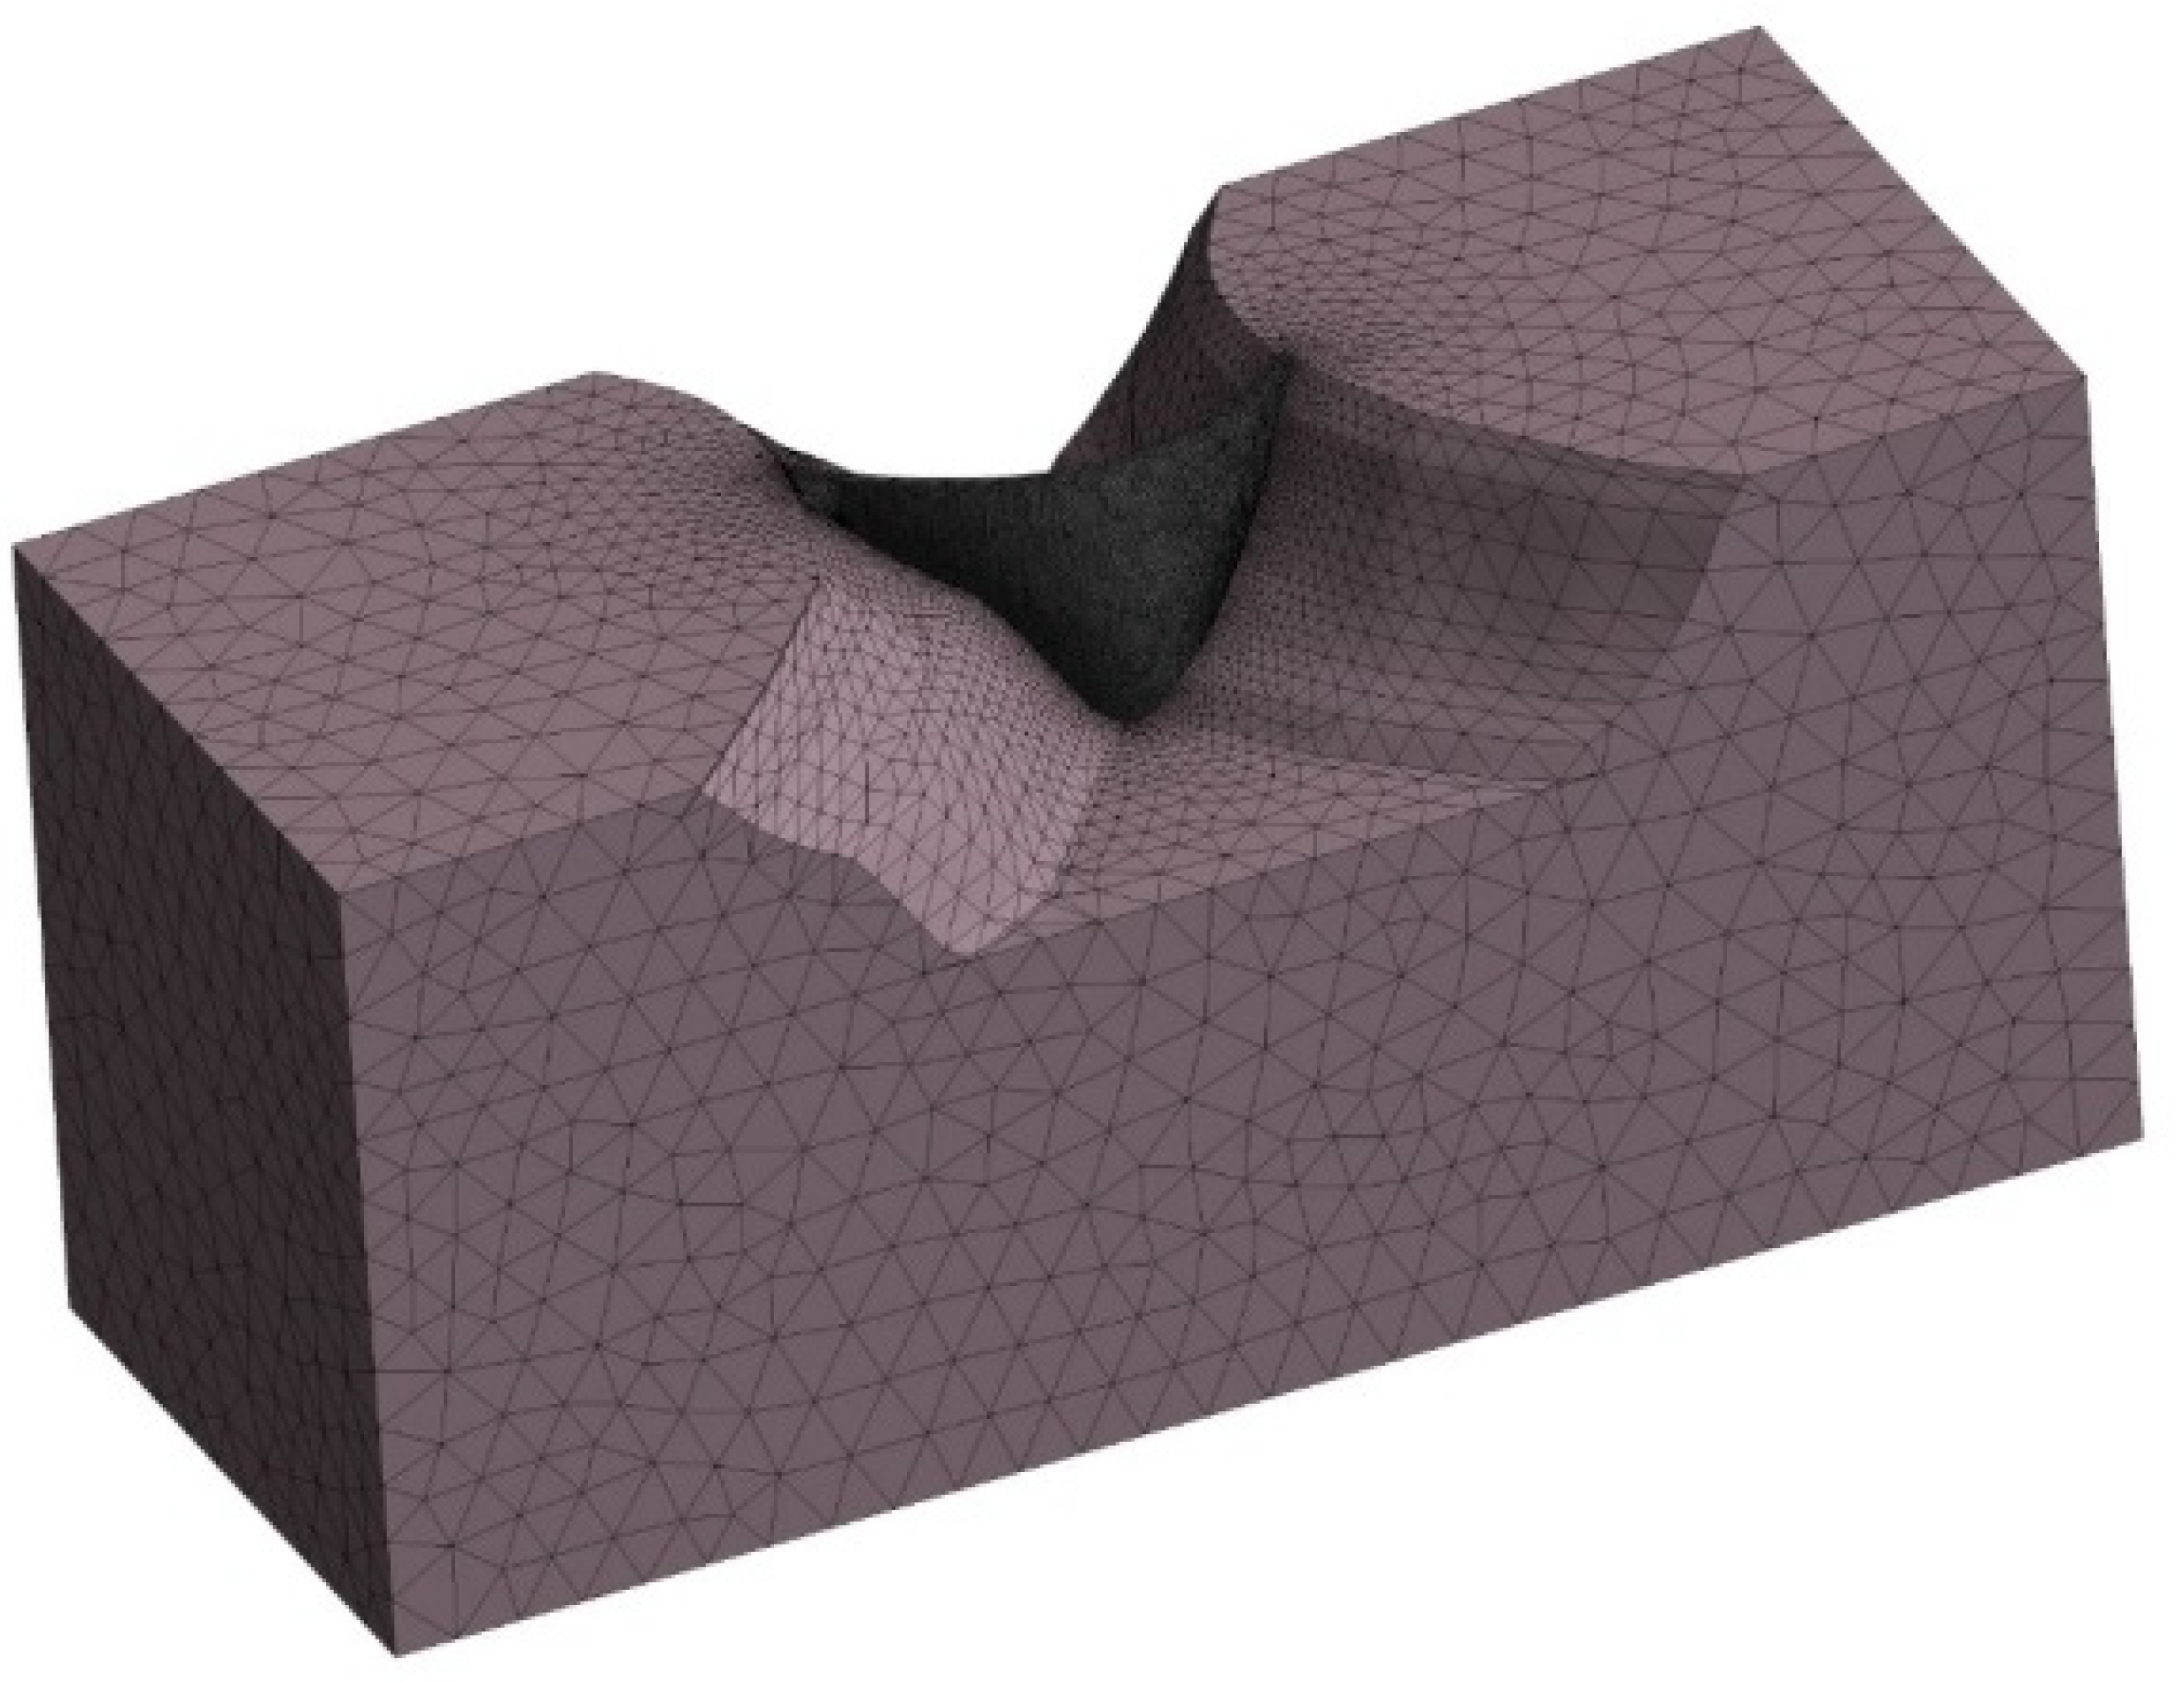
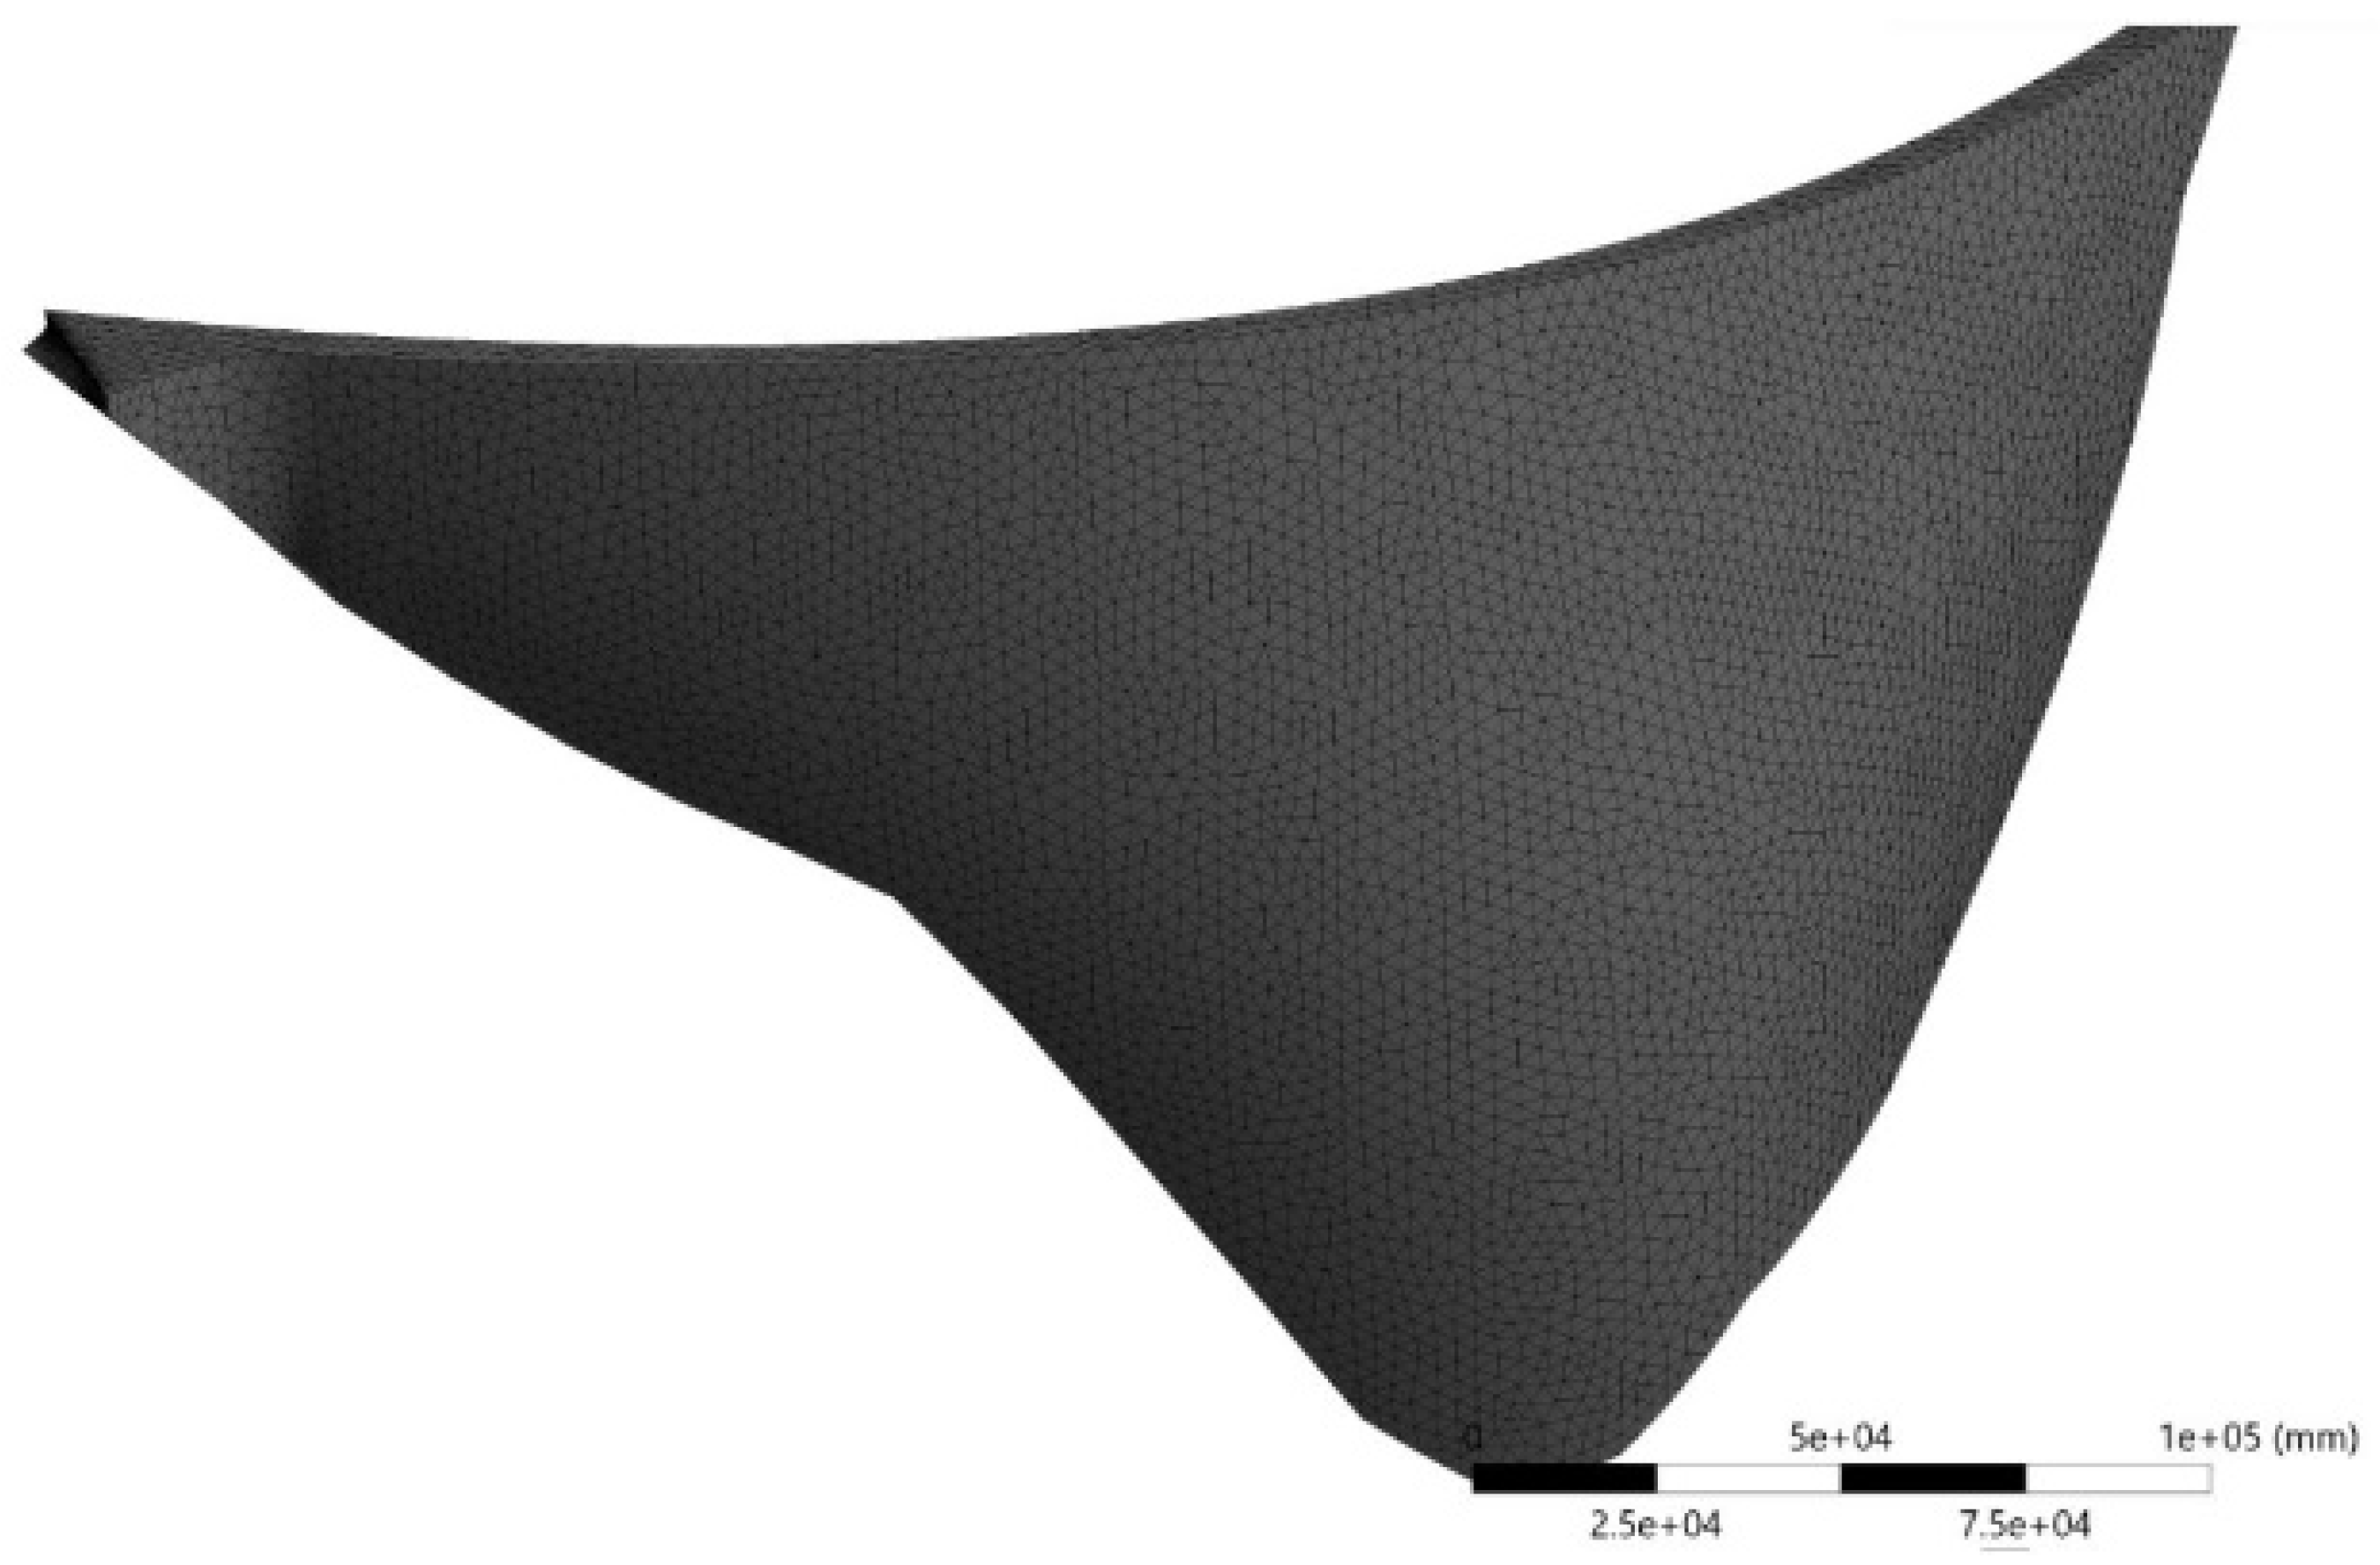
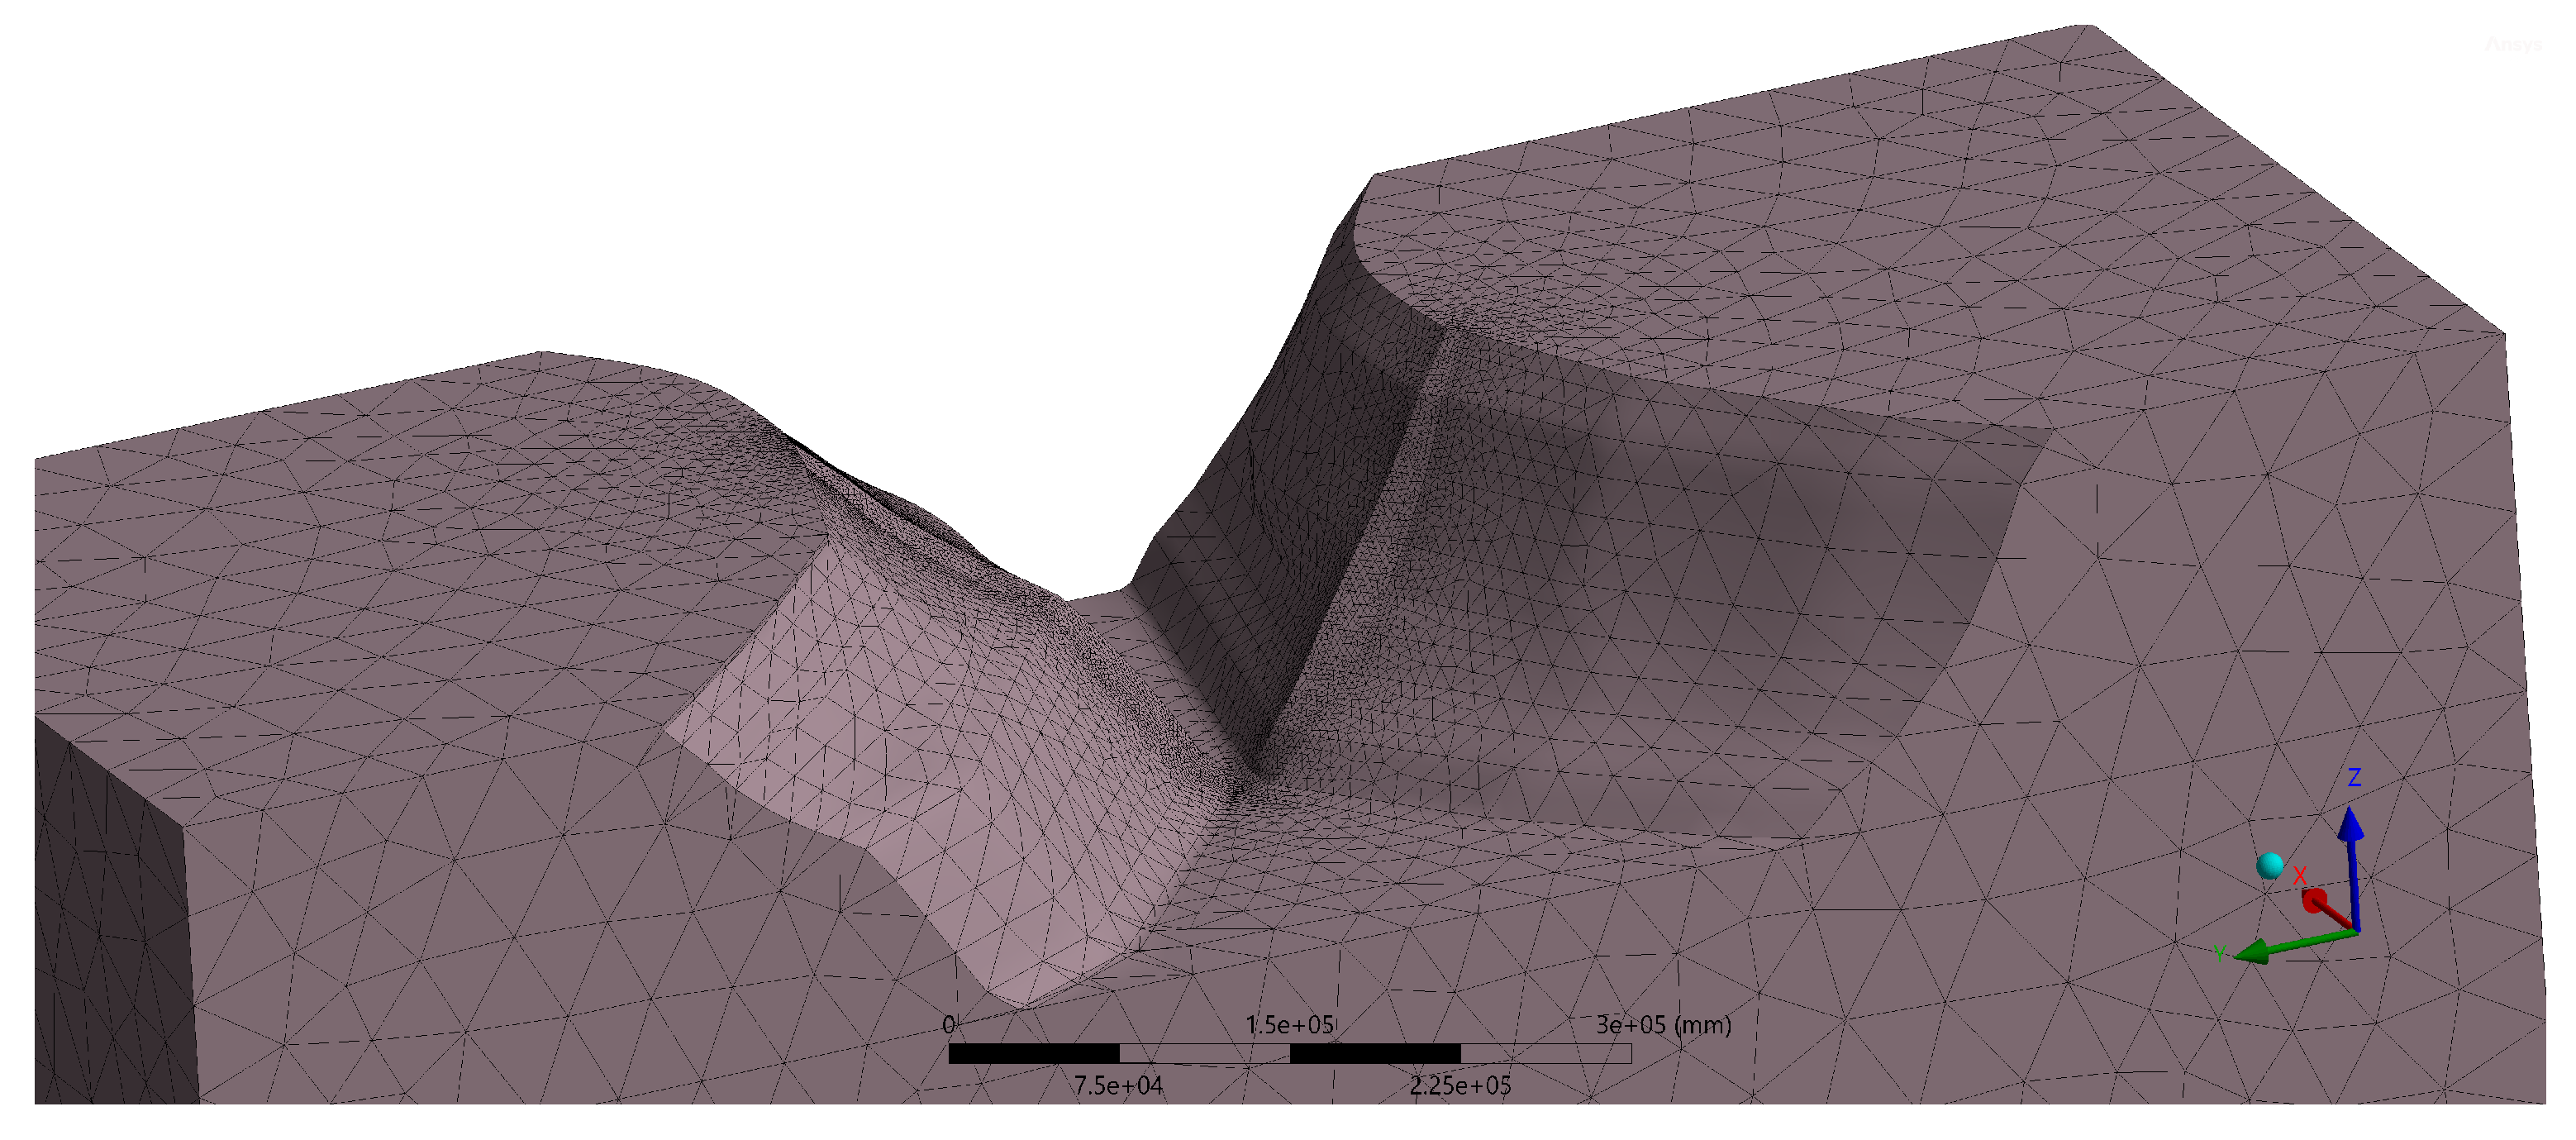
The meshing for the arch dam monoliths along with the rock foundations and abutments are shown in Figure 5. The meshing for the dam alone and rock portions are shown in Figure 6 and Figure 7, respectively. Areas close to the dam–foundation interfaces were analyzed with more refined meshing.
The contraction joints between adjacent cantilever blocks and the interface between the dam body and rock surface were included in the analysis. The connections were simulated as bonded, which would facilitate contacts at all points between the joint surfaces for a reasonable temperature distribution and thermal loading within the dam body and canyon rock. Under sustained thermal conditions, the dam tends to reach a state of quasi-equilibrium where compressive arch action, hydrostatic load, and self-weight keep the joints closed, allowing the structure to maintain the monolithic nature of the structure. Modeling the joints as bonded therefore provides a stable and conservative representation of heat-induced stress redistribution, avoiding numerical instability associated with contact/nonlinear joint behavior. Joint opening is primarily a transient or seasonal phenomenon rather than a steady-state one. In the case of a drastic temperature drop scenario and long-term seasonal cooling, there can be joint opening. The dam modeled in the study had not experienced such a rapid drop in ambient temperature from the closure temperature or long-term cooling where joint opening due to large tensile stresses may occur.
The rock foundation is included directly in the numerical analysis and modeling performed accordingly. The dam (concrete)–rock (foundation) interaction can be modeled in different ways depending upon the specific problem. A commonly adopted assumption is that there is perfect bonding between the dam and the rock foundation. This is fairly accurate because concrete exhibits reasonable bond strength with the rock, when the surface is irregular, clean and free of dirt and loose materials [41]. In this analysis, the joint between the dam body and rock foundation was modeled as a bonded contact to facilitate heat transfer between these two bodies [42]. As the silt load due to sedimentation and the uplift under the concrete thin arch dam are not considered to impart any effect on the arch dam, those loads are not considered in the analyses for this paper [43].
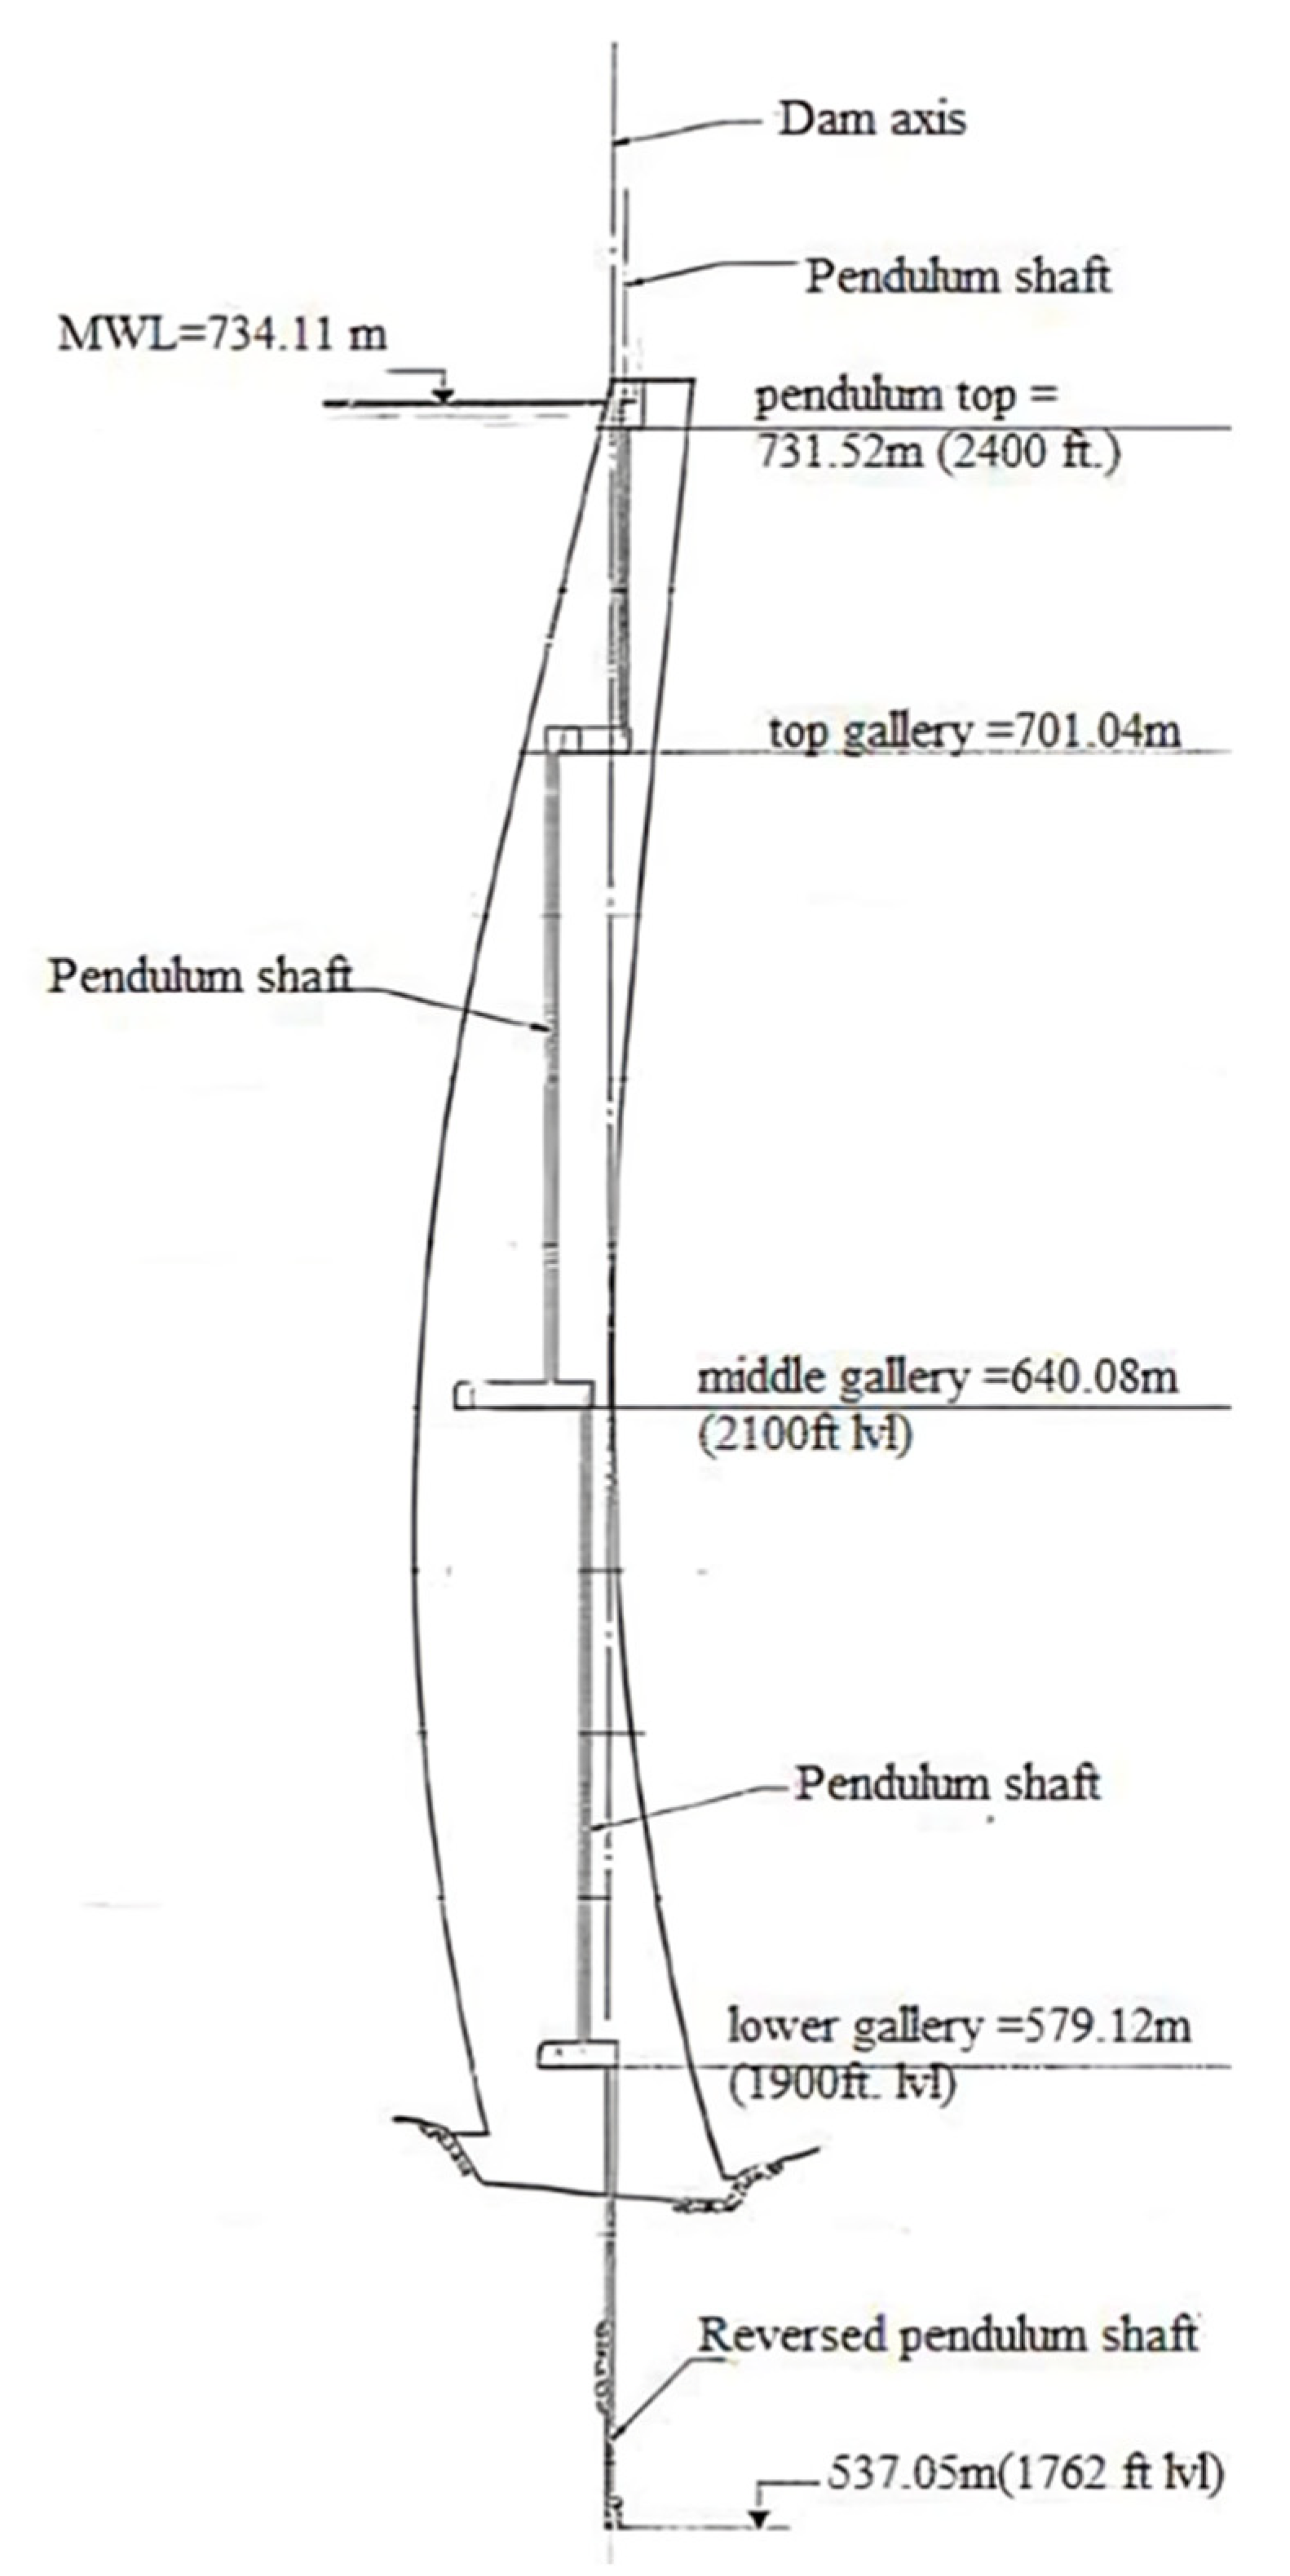
The analyses started with the dam body comprising the jointed monoliths alone. Subsequently, the combined model of the dam monoliths with the canyon rock was analyzed. Mesh convergence was studied for the convergence of deflection by reducing mesh size for the dam section alone with no movement at the rock interface, to limit computation storage, memory and time. The model for this study and conclusions were based on the combined structure of jointed monoliths with the canyon rock. The dimensions of the dam–rock model considered are 1200 m in the length direction, 450 m in the width direction and 350 m in the depth direction below the lowest point of the dam, whereas the dam is 169 m in height, assuming no movements at these boundaries. The model included three horizontal inspection galleries running parallel at +579.12m, +640.08m and +701.04m above m.s.l.
As part of the investigation of the influence of ambient temperature on the behavior of the dam, a series of steady-state thermal analyses were performed to establish the temperatures and thermal gradients on the dam body and the foundation-abutment rock. This simulation can calculate the effects of steady thermal loads acting on the dam–rock system. The coupled effect of thermal gradients on the arch dam–reservoir system with fluctuating hydrostatic loads vis-à-vis seasonal water levels was obtained through a series of simulations. The gravity loads, thermal loads and hydrostatic loads are applied in steps in the analysis. The steady state thermal analysis is coupled to the hydrostatic structural loading to get the final response.
The behavior with respect to movement of the dam and stresses was investigated by varying the ambient temperatures. In order to investigate the effect of solar radiation on the dam, the project authorities were consulted and interpretation reports of instrumentation were accessed. The thermal boundary conditions for the steady state analysis were decided accordingly. The exposure to solar radiation and consequent effect of increased ambient temperature at the water contact surface of the dam is attributable to the receding water levels due to utilization of stored water for power generation. The water level in the reservoir reaches its maximum after receiving the inflow from the North-East Monsoon rains until the end of November. The dam experiences solar radiation at the exposed upstream face and downstream face during the warm months of February to the end of May each year, after which the South-West Monsoon rains will contribute to an increase in water levels in the reservoir. Accordingly a behavior change during these warmer months can occur due to the increase in the ambient temperature. Among the various scenarios studied, the two boundary conditions, viz., with a minimum and maximum temperature, were emphasized in this paper. One case is the water level at its maximum (maximum hydrostatic load) and the effect of ambient temperature resulting from solar radiation at its minimum. In the other extreme case, the water level recedes to a minimum, resulting in minimum hydrostatic load, but the ambient temperature is at a maximum from the solar radiation.
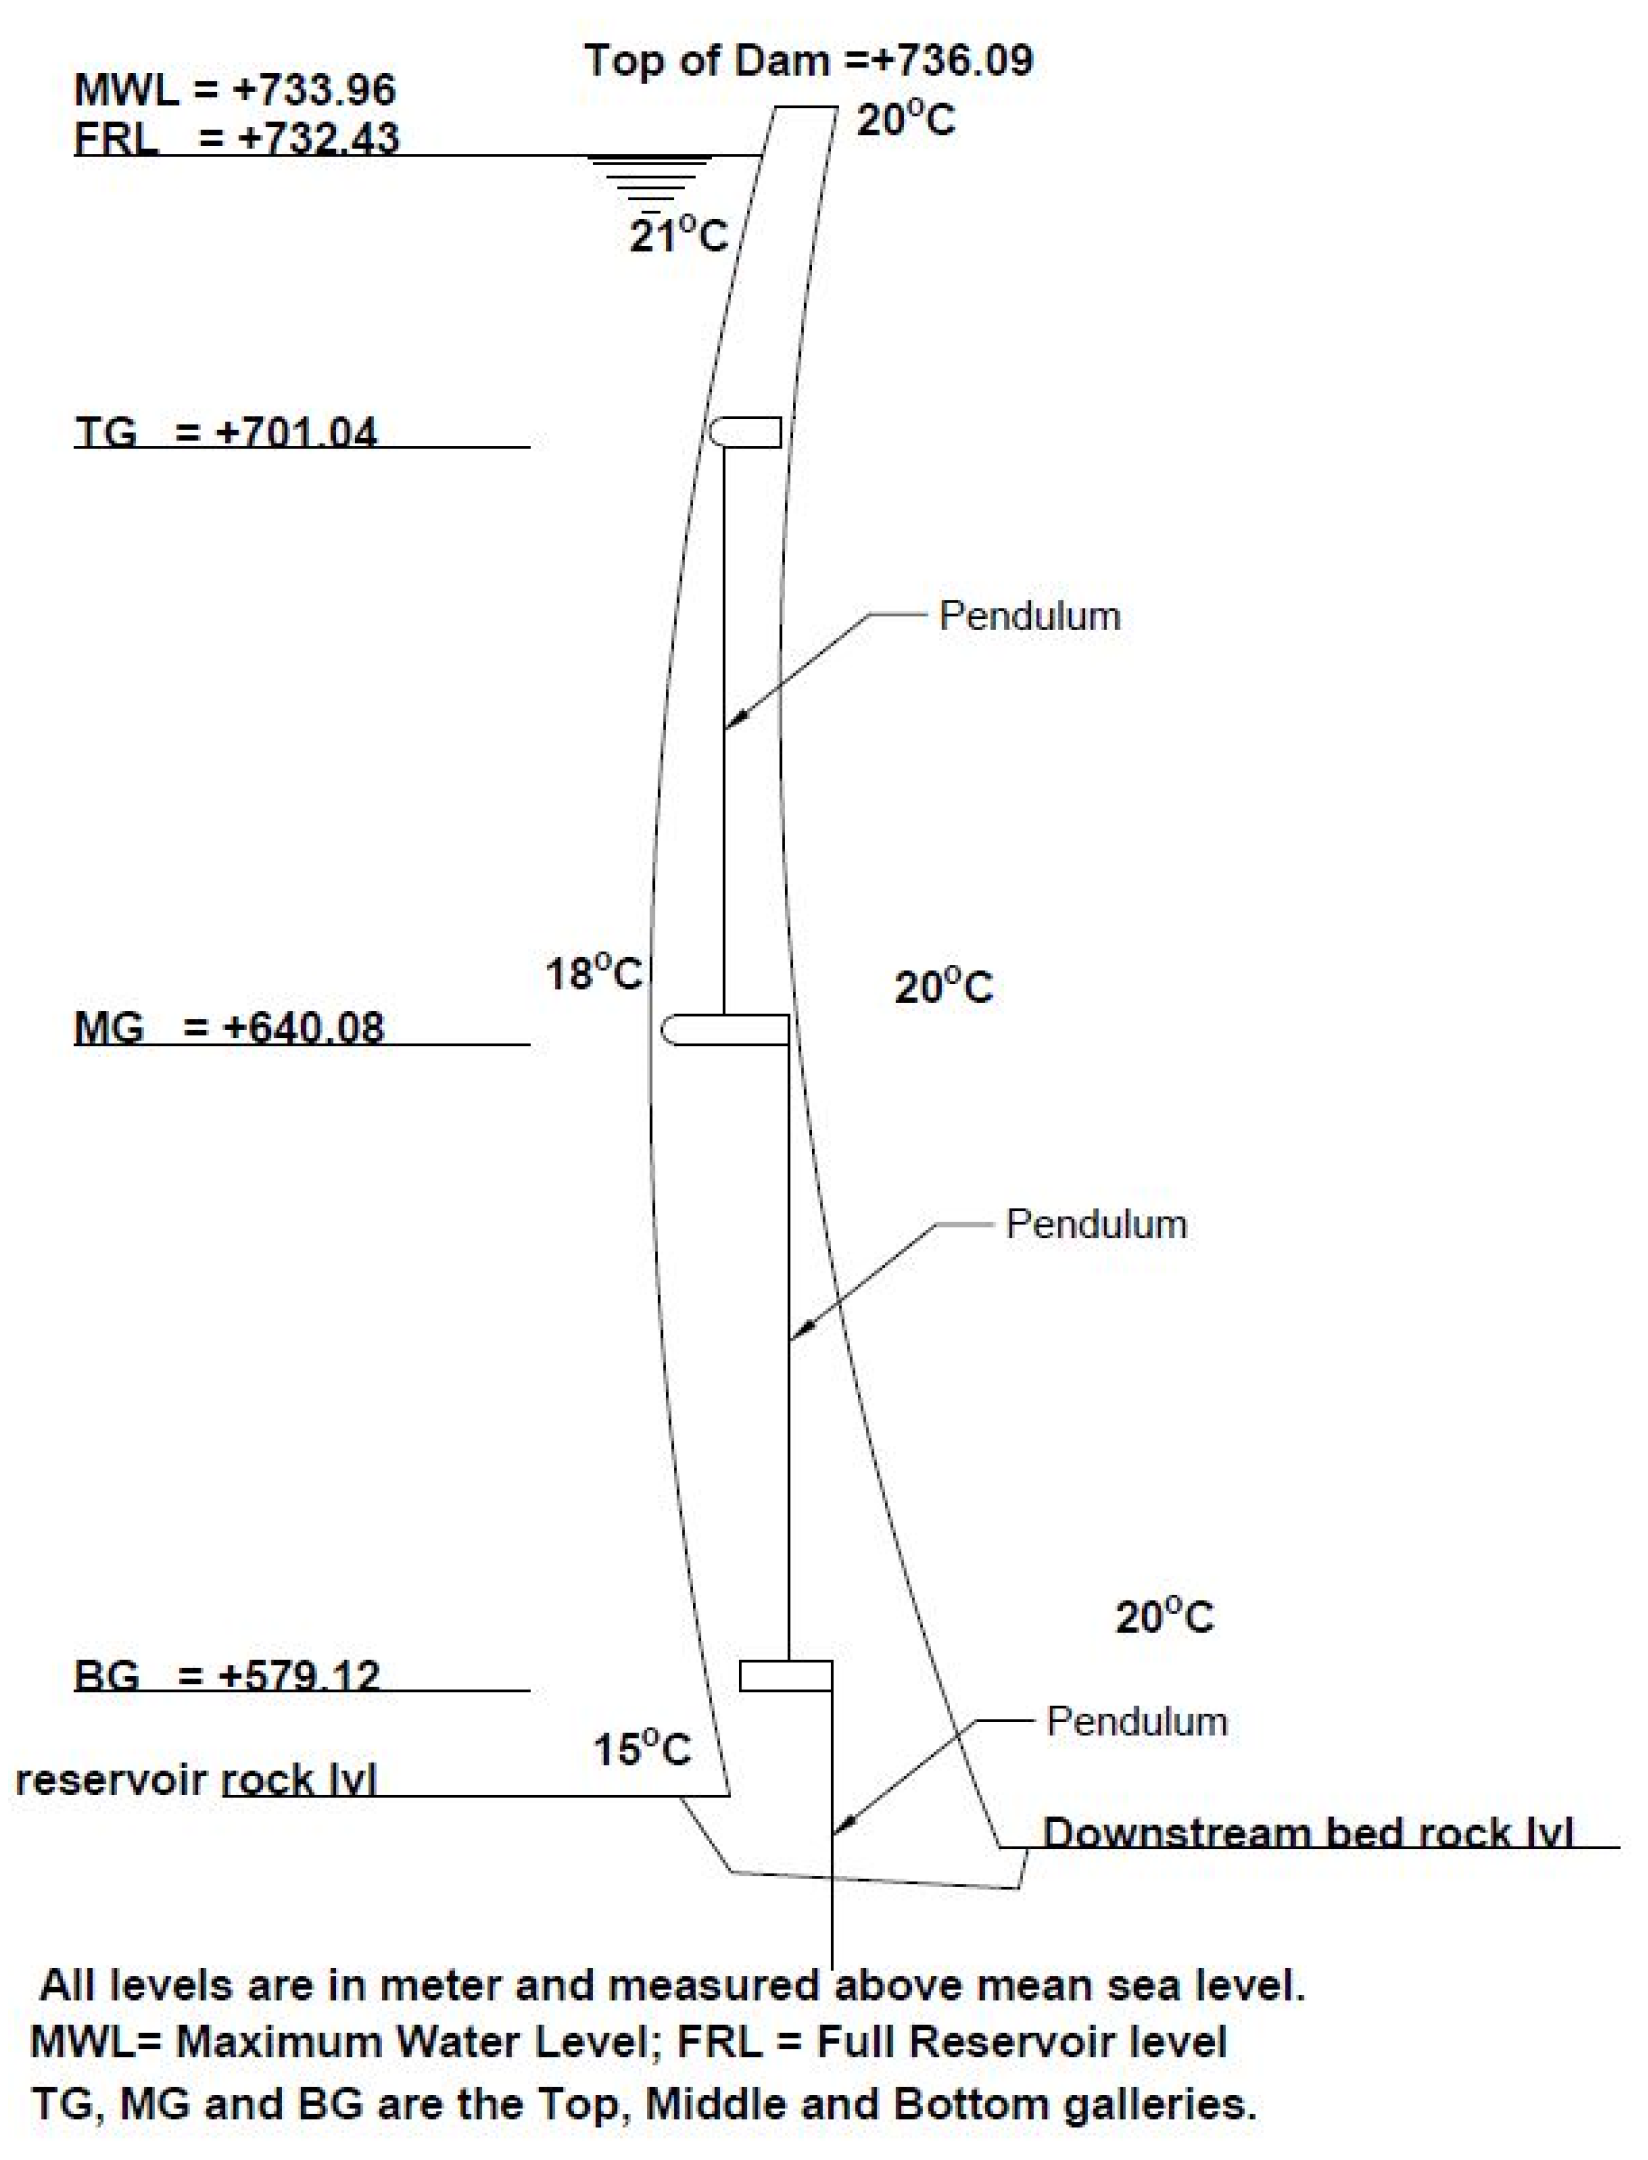
The seasonal temperature data sets for the years from 1975 to 2014, available from the dam authorities, were used for the thermal load analyses. As per this long-term instrumentation data of maximum and minimum average monthly temperature data, the minimum and maximum ambient temperatures were found to vary between 20 °C and 35 °C, almost cyclically. The temperature recorded in the automatic weather station for the period from 2020 to 2024 shows the environment temperature touching the maximum and minimum temperatures of 35 °C and 10 °C. In the simulation, for the minimum temperature case, the water temperature variation considered is from 21 °C at the top (at the full reservoir level, FRL) to 15 °C at the bottom of the dam (Figure 8). The steady state thermal analyses were done by simplifying the scenario. The time varying solar radiation of the dam is the source of the thermal load, and to simplify the steady state thermal simulations, the dam is subjected to a pre-defined temperature, resulting from solar radiation at known elevations upstream and over the downstream face. The variation of reservoir water temperature is assumed to be linear.
The continuous monitoring and evalauation of operation and behavior is to establish that the safety of the structure is not jeopardized at any stage of its service life. Ascertaining the performance of the dam in its movements and stresses developing at salient locations is vital in this process. Apart from the relevant standards in the respective country, international standards and publications by the US Bureau of Reclamation (USBR), the US Army Corps of Engineers (USACE) [14] and Federal Energy Regulatory Commission (FERC) [43] also stipulate valuable guidelines on various criteria for design, analyses, monitoring and also for inferring the results, such as compressive and tensile stresses at different parts of the arch dams.
The study investigated the influence of temperature extremes on the behavior of a thin double-curvature concrete arch dam using a representative large dam model, with simplified assumptions to obtain meaningful dam-safety insights under tropical, near-equatorial conditions. Although solar radiation can produce spatial temperature variations, the analysis focused on extreme ambient scenarios where most exposed surfaces may experience nearly uniform thermal states. To avoid excessive computational complexity, the scope was limited to evaluating structural response and identifying potential safety concerns under extreme thermal loading.
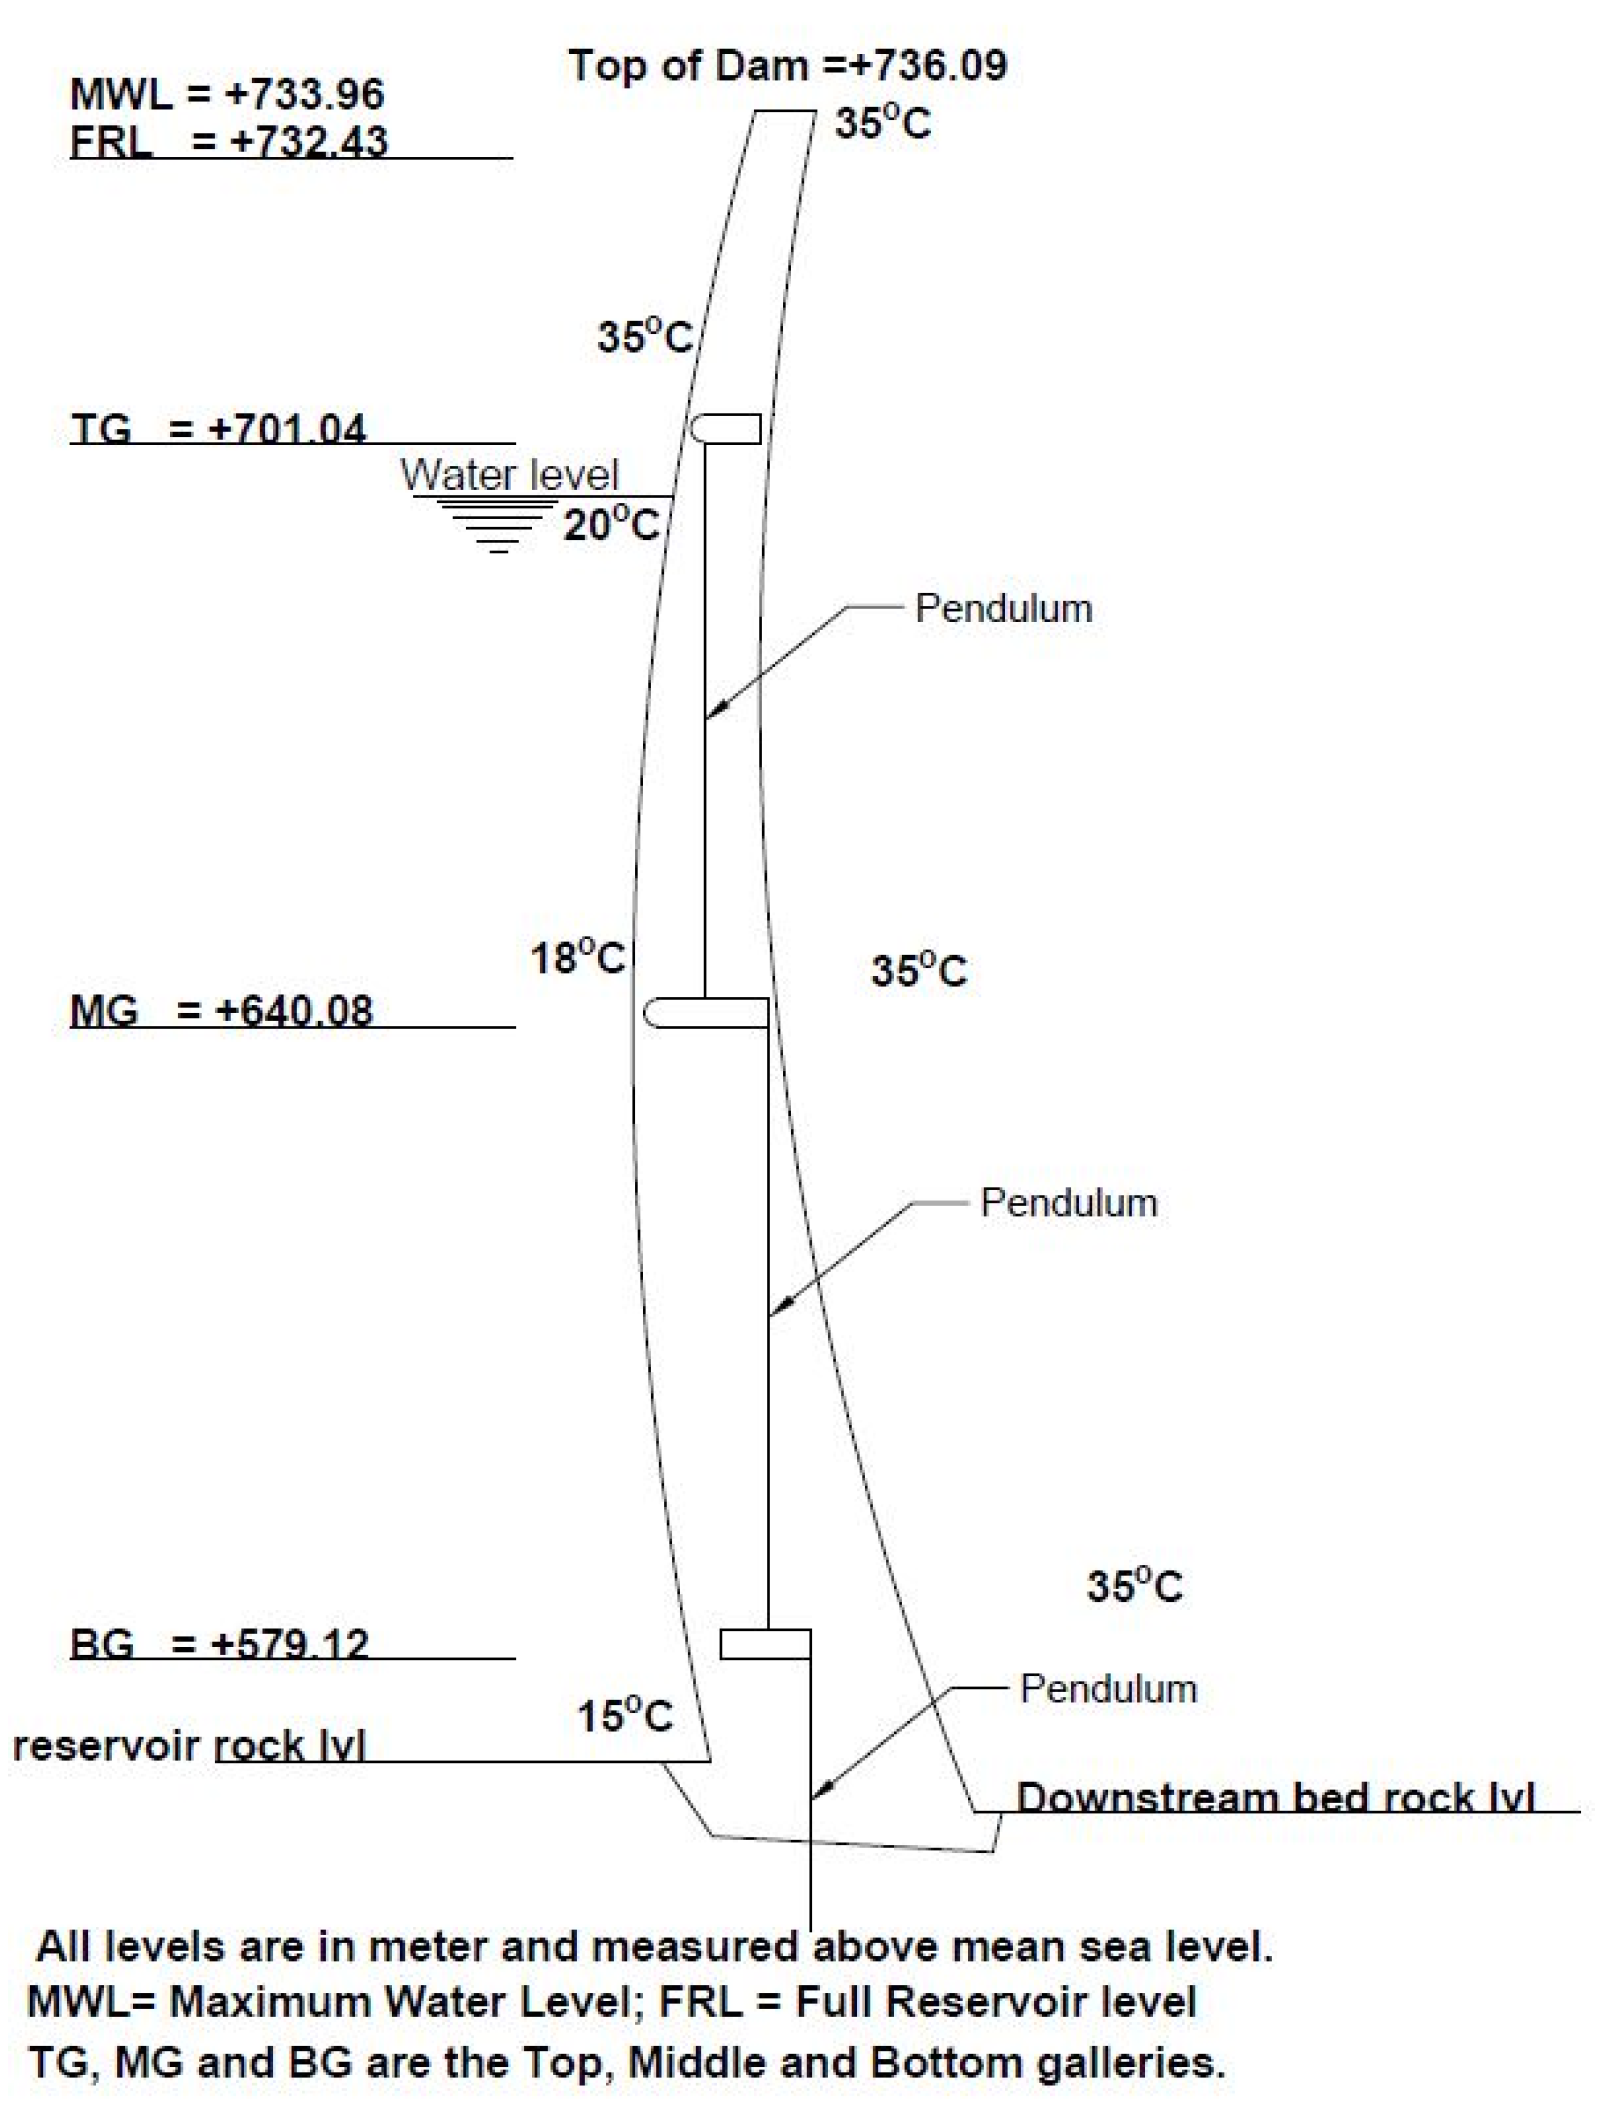
In the maximum temperature scenario, the downstream temperature is 35 °C and the upstream temperature varies from 20 °C at the water surface to 15 °C at the bottom, the water surface being at 41.15 m from the dam top (Figure 9).

5. Results and Discussion

5.1. Behavior of the Dam—Deformation and Stresses

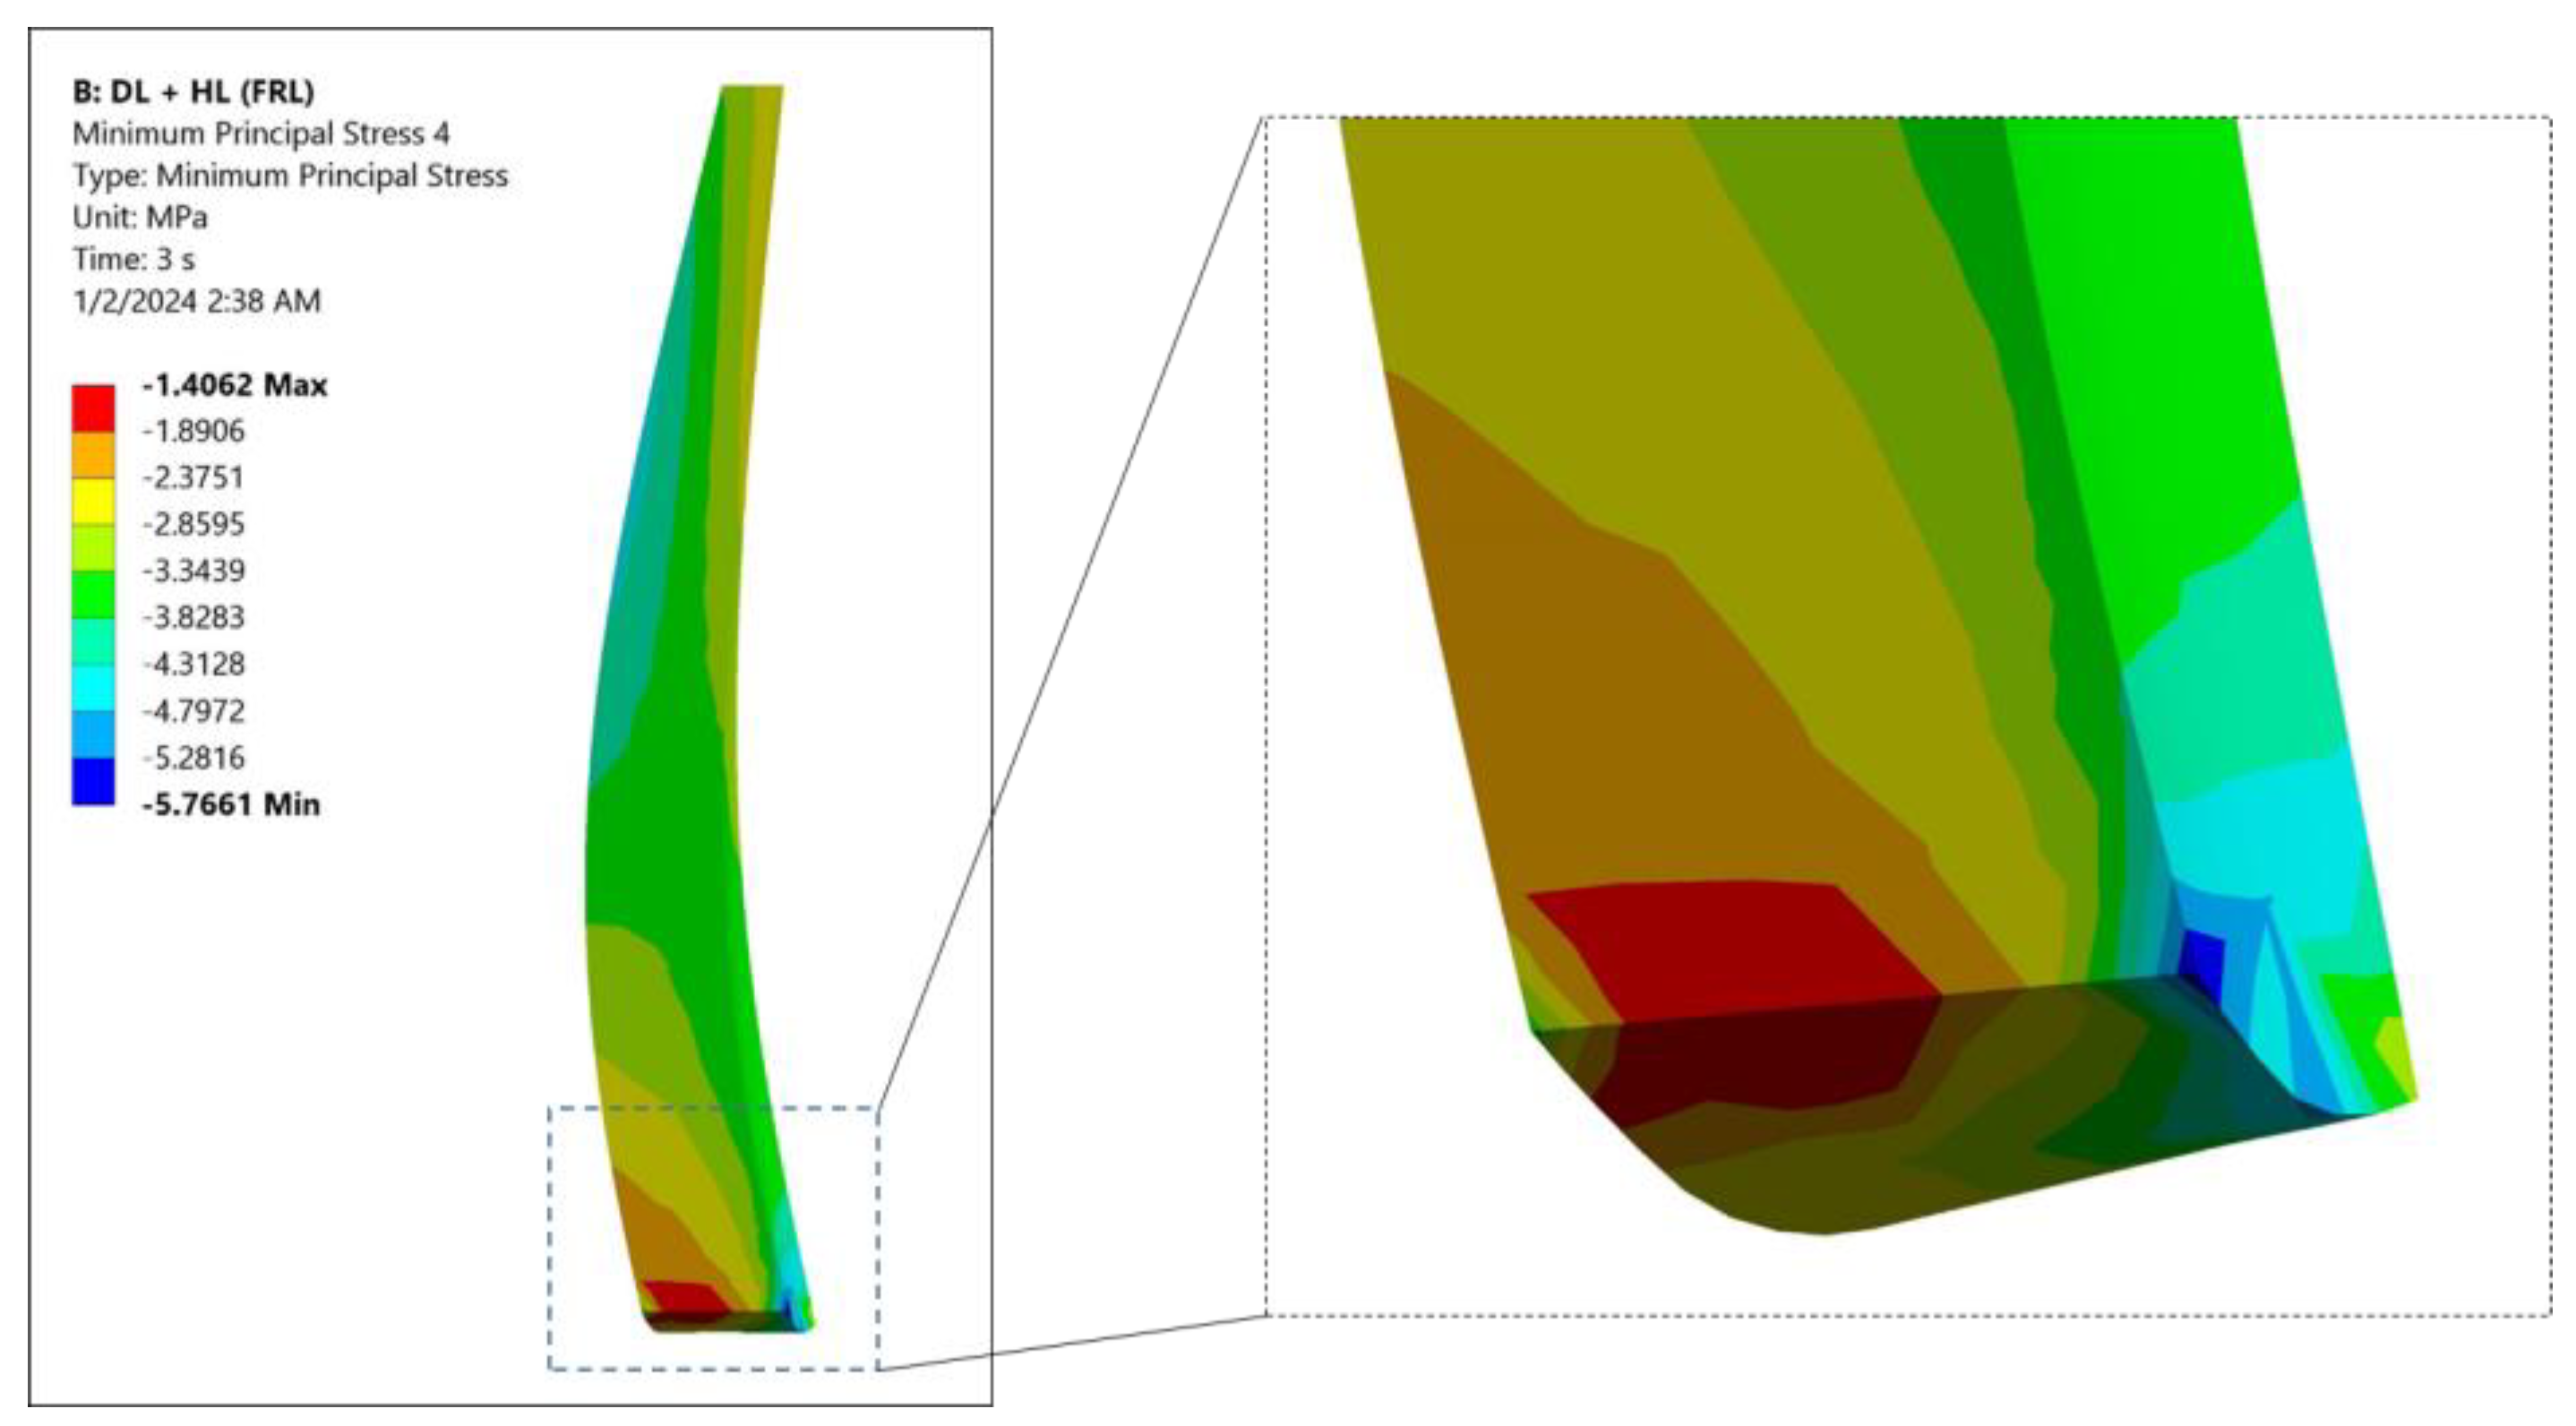
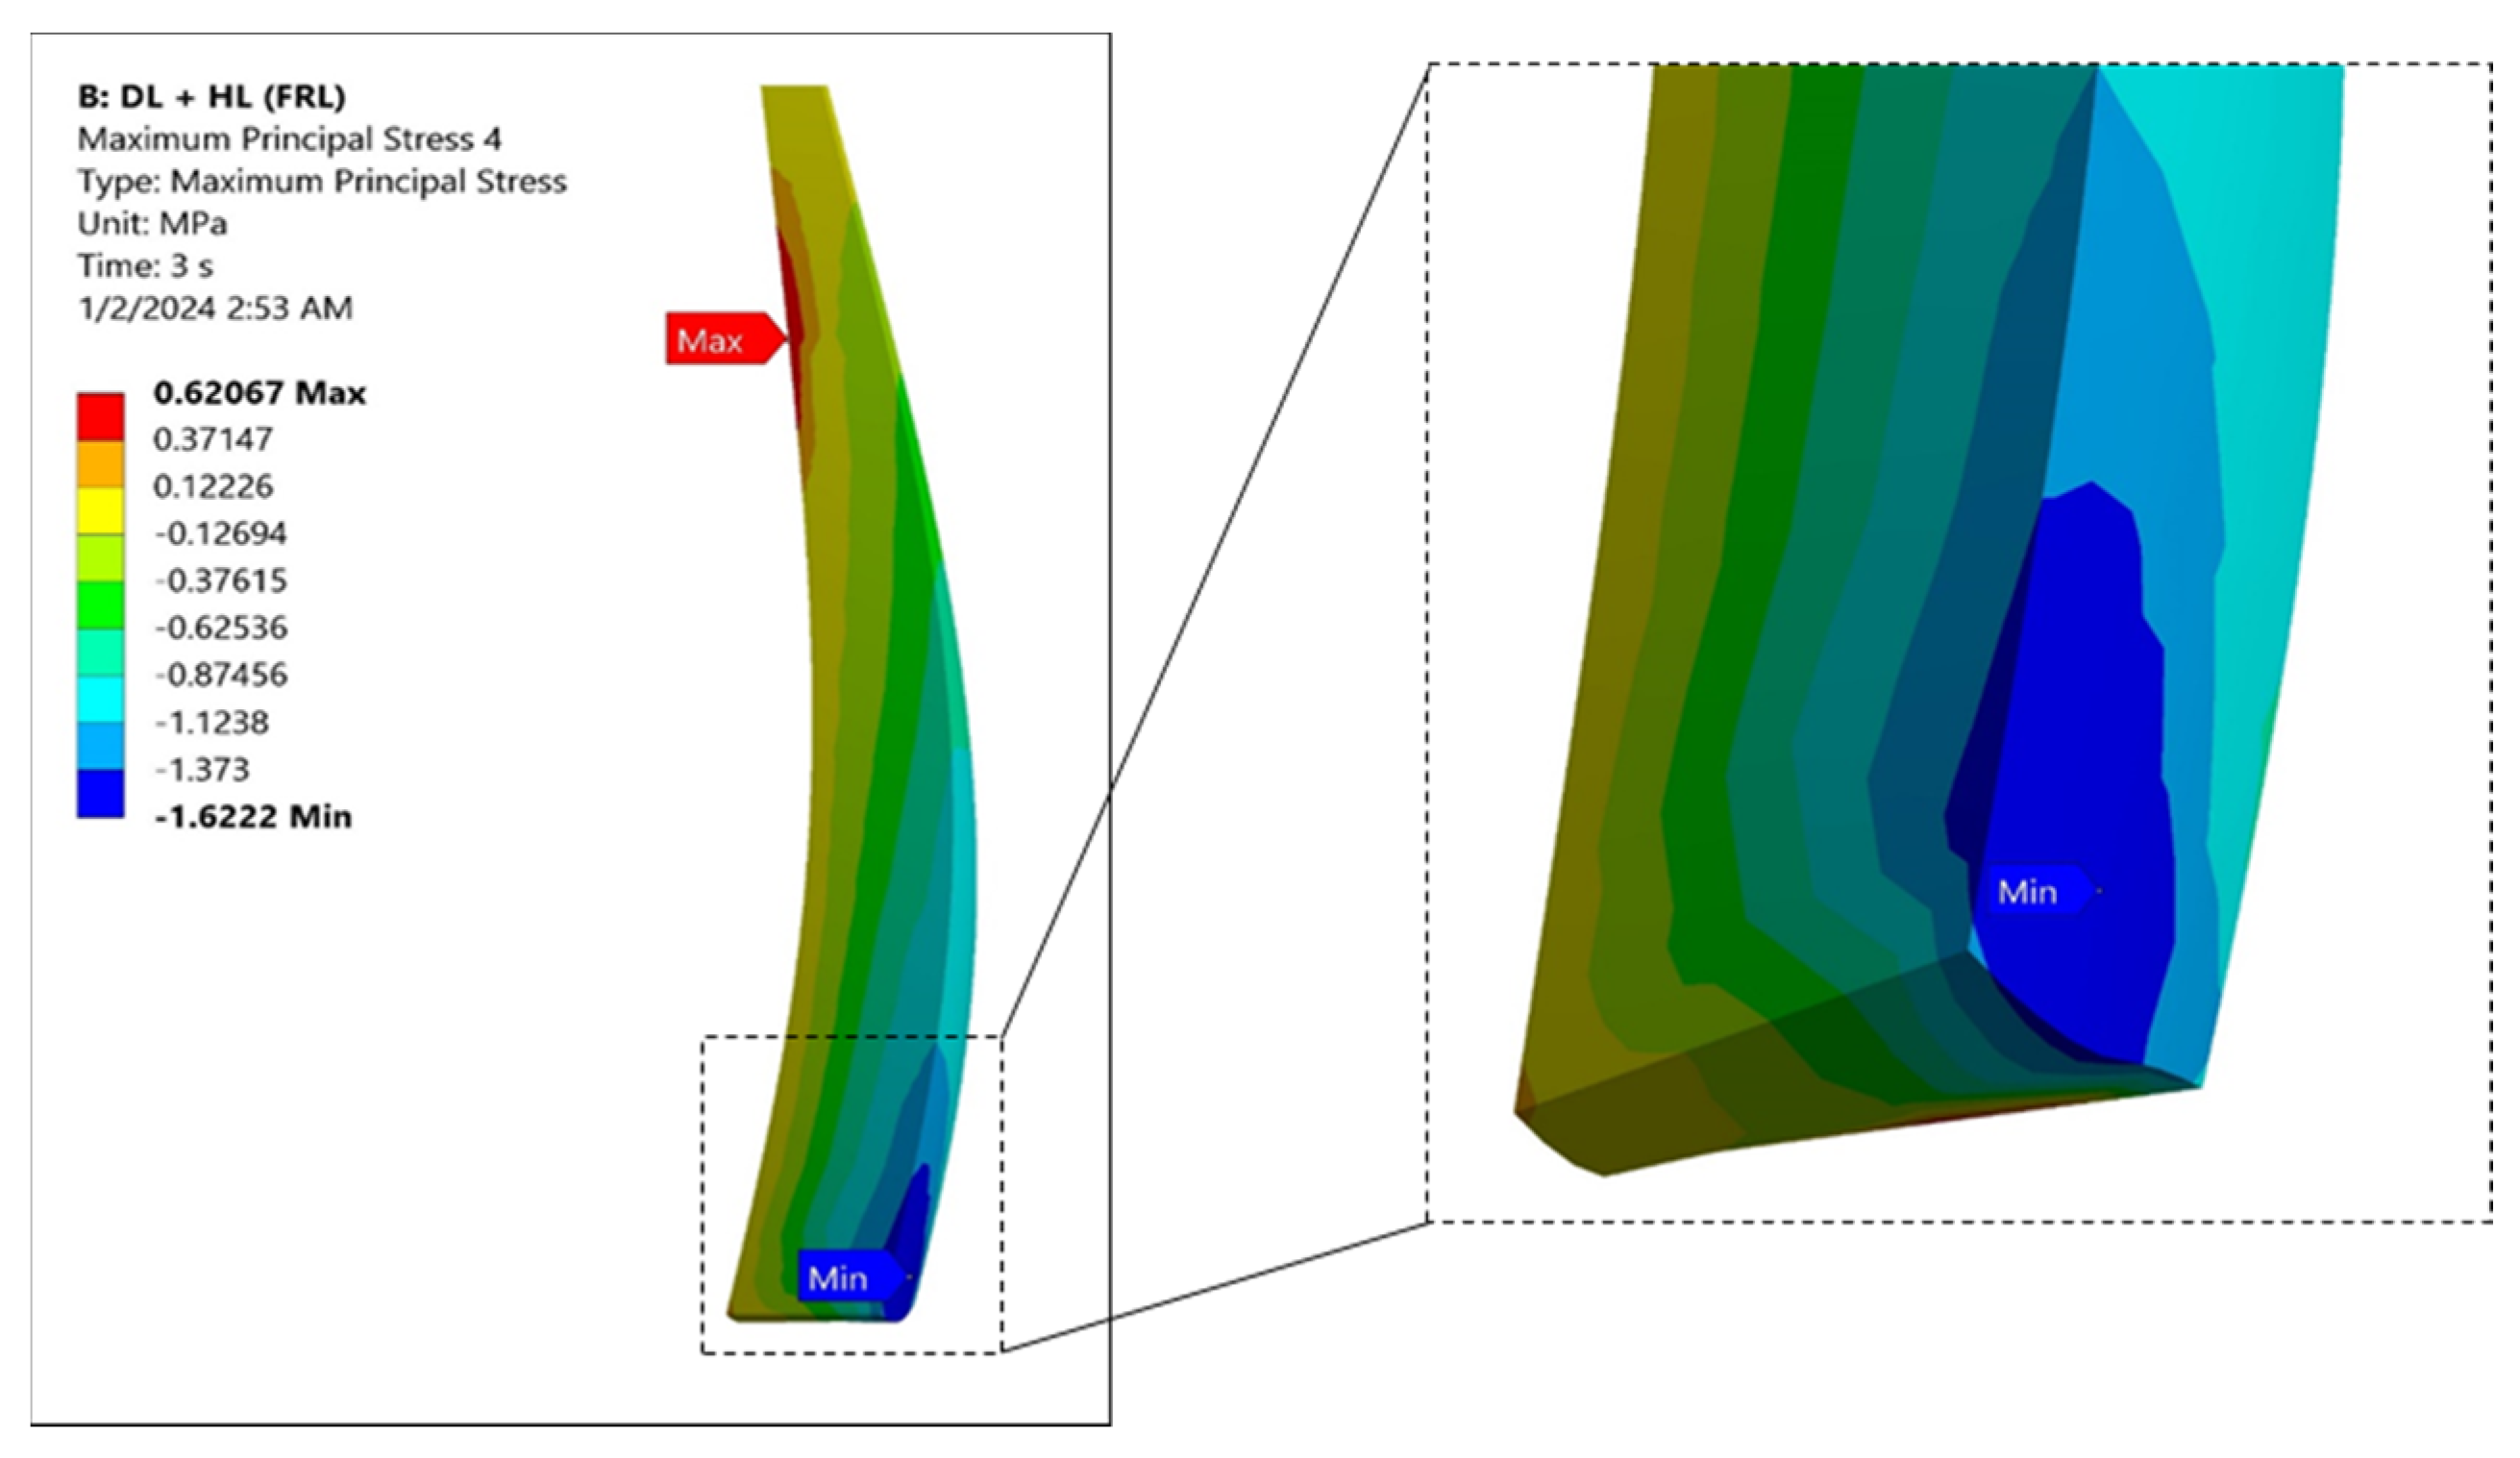
The behavior of the dam in terms of its deformation and stresses when the dam monoliths were loaded for gravity loads and varying water loads without the influence of temperature loads was analyzed first. The maximum deformations are presented in Table 4. In this case, the dam is deflecting downstream as the water level goes up, while at lower water levels, the tendency is to move towards the reservoir, as indicated by the negative values. The principal stresses are well within the design values. Figure 10 and Figure 11 show the maximum and minimum principal stresses for water level at full reservoir level (FRL).

5.2. Dam–Foundation Interaction and Behavior Against Temperature Variation

The dam with the foundation and abutment rock when subjected to the effect of ambient temperature showed a different behavior with regard to its movement. Among the various analyses conducted, simulations with the two extreme scenarios of ambient temperature (as shown in Figure 8 and Figure 9) for assessment of the influence of low and high temperature on the behaviour of the dam in its movement and stresses are discussed in detail. Both cases were analyzed with the modular ratio Er/Ec = 1.
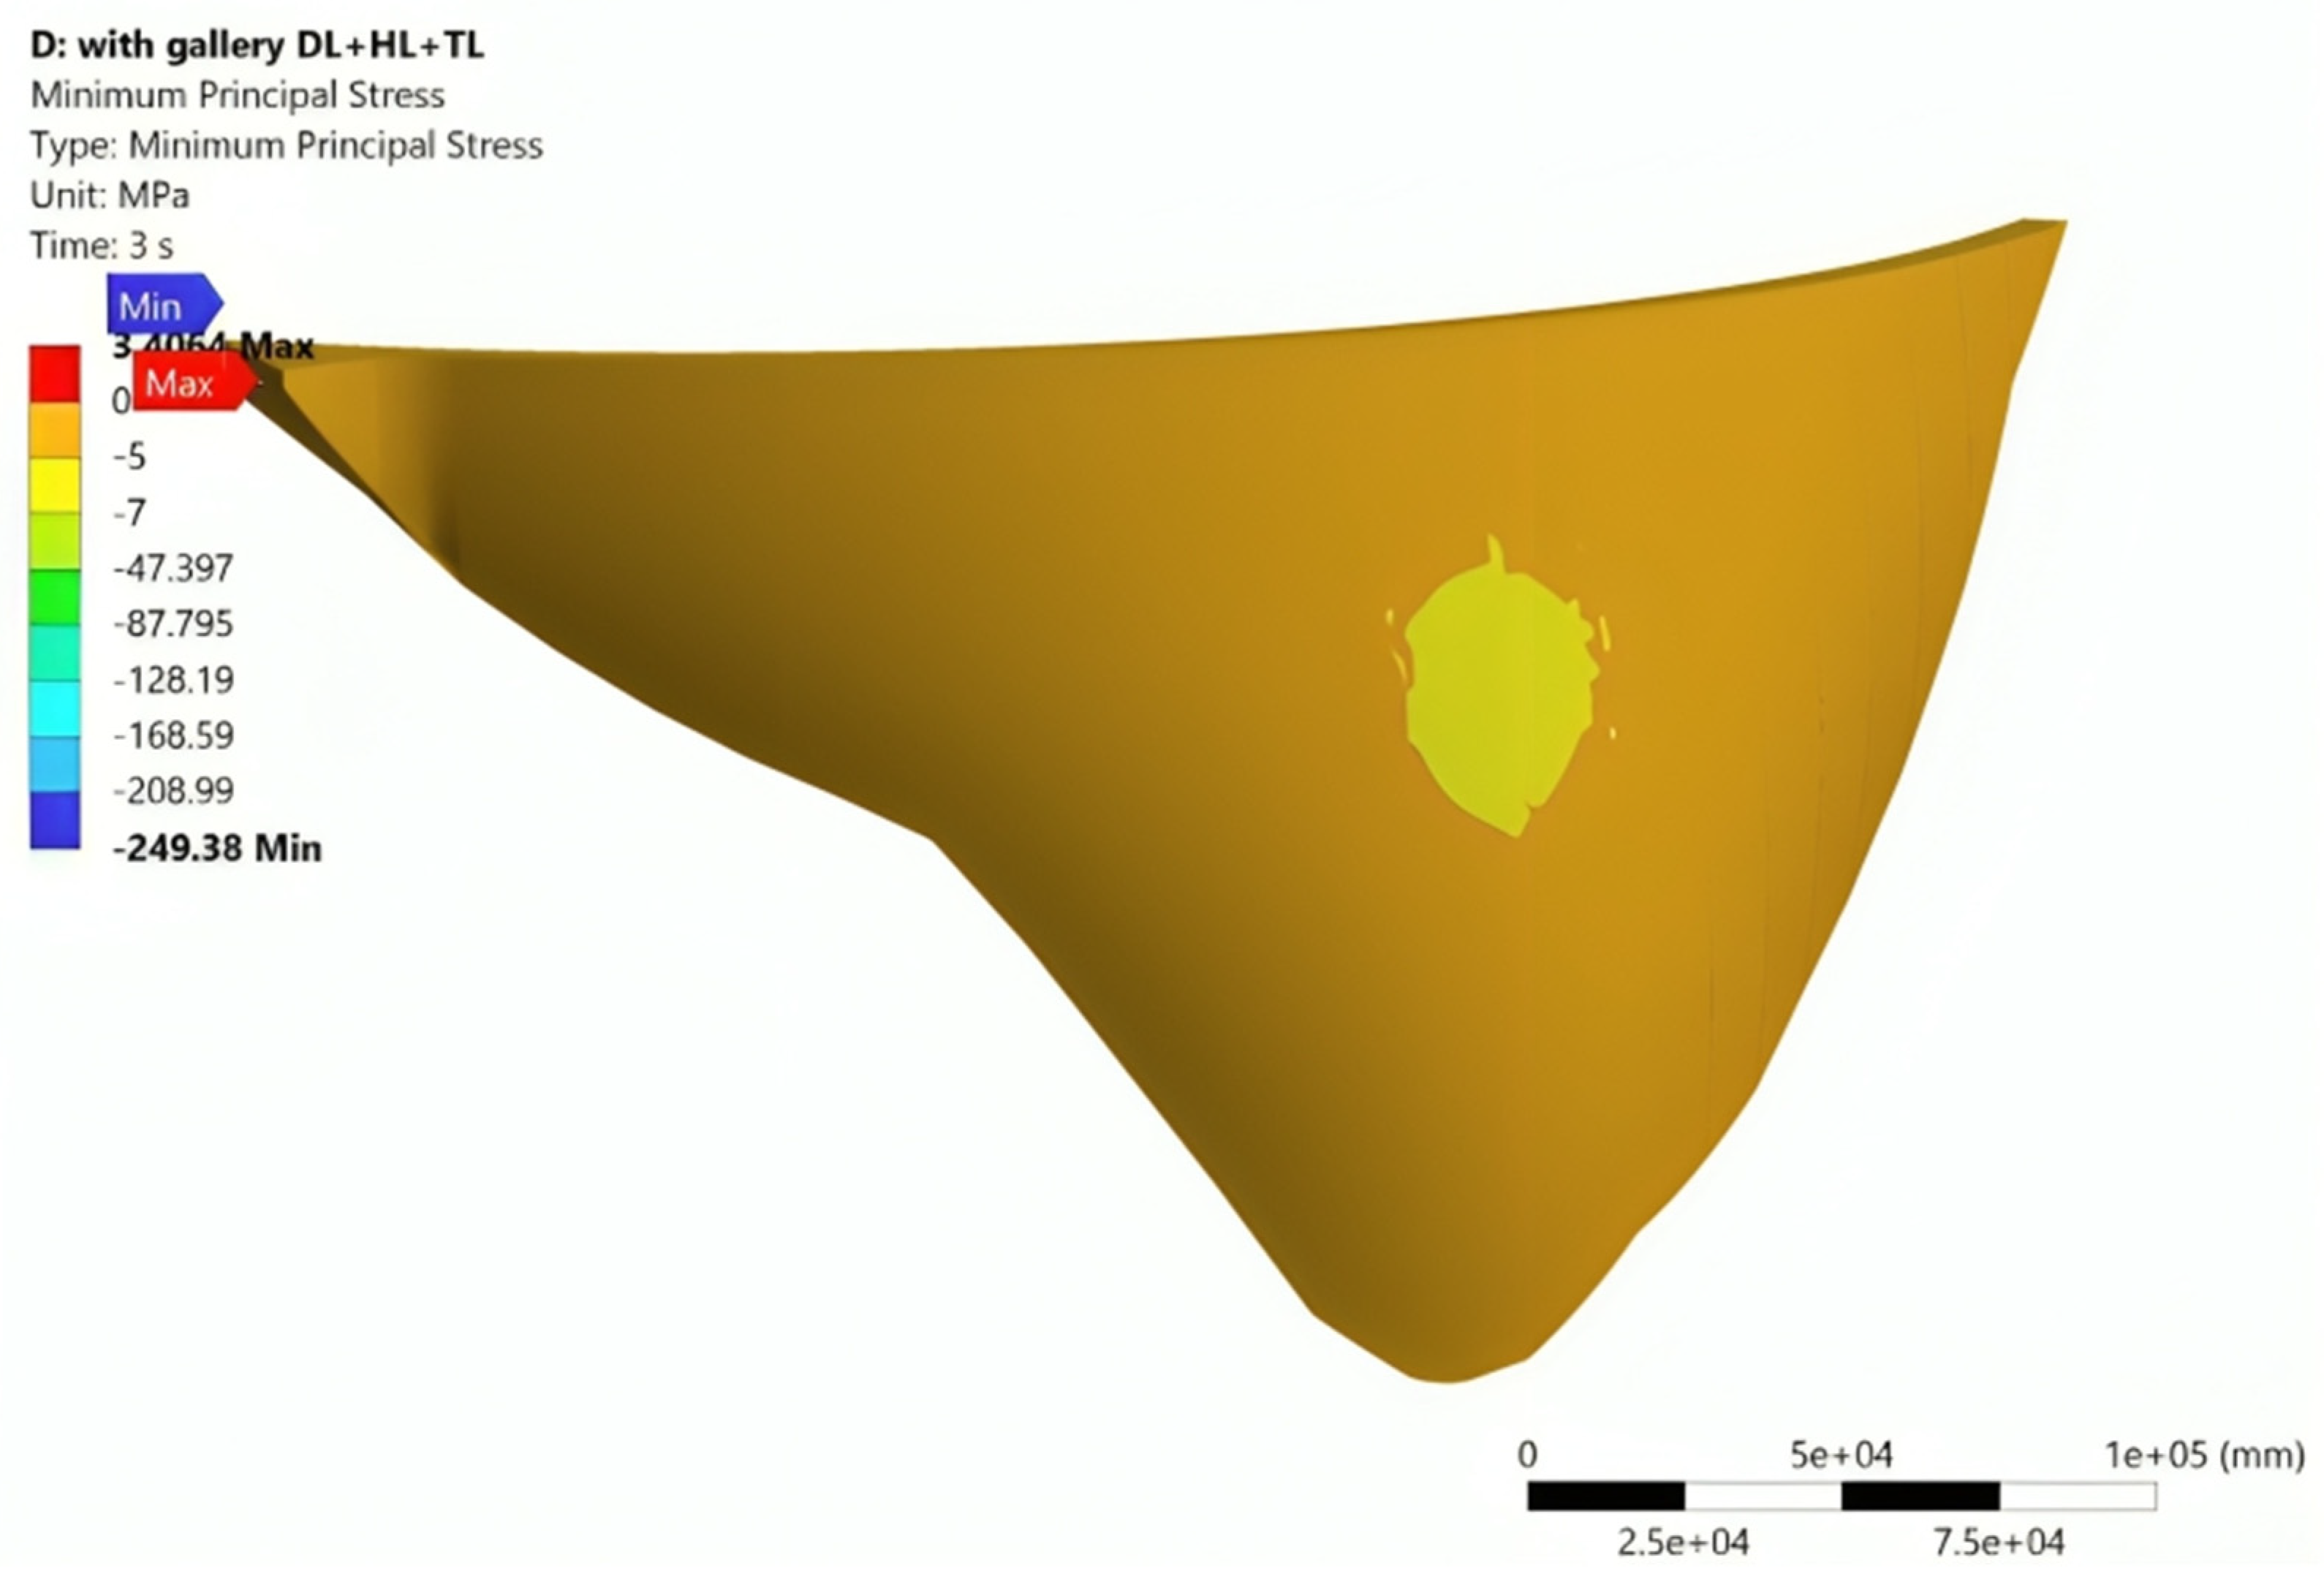
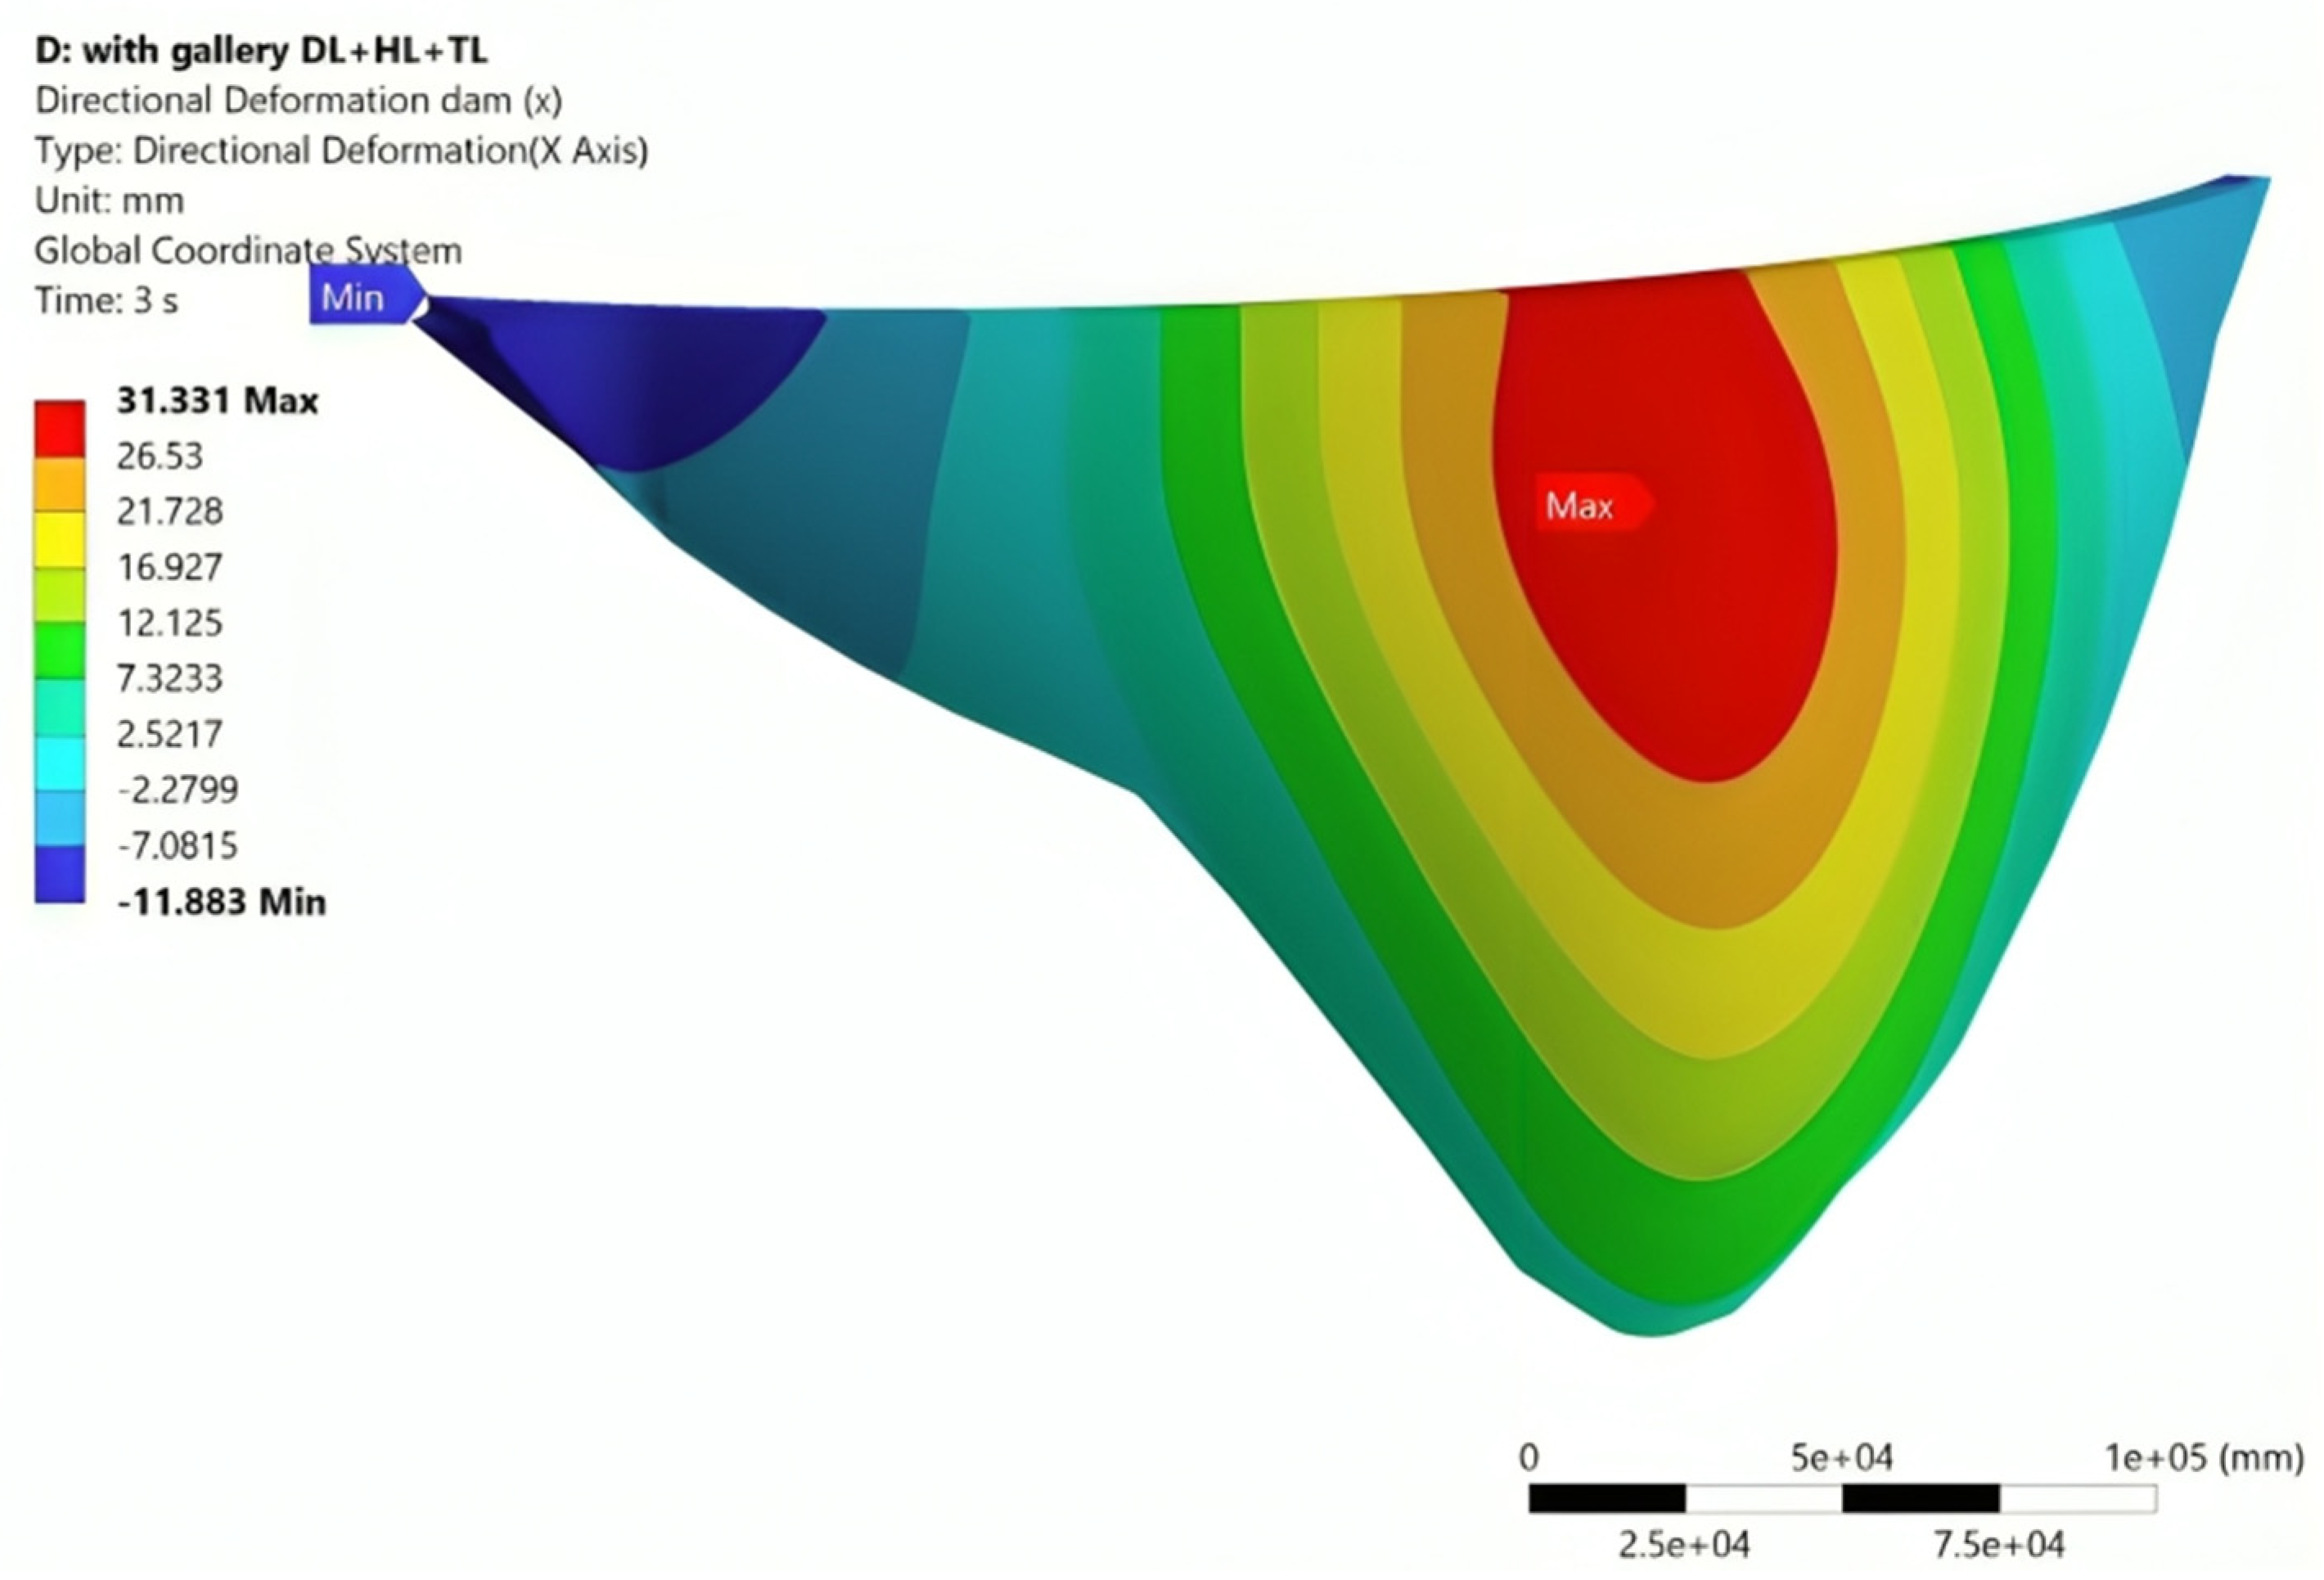
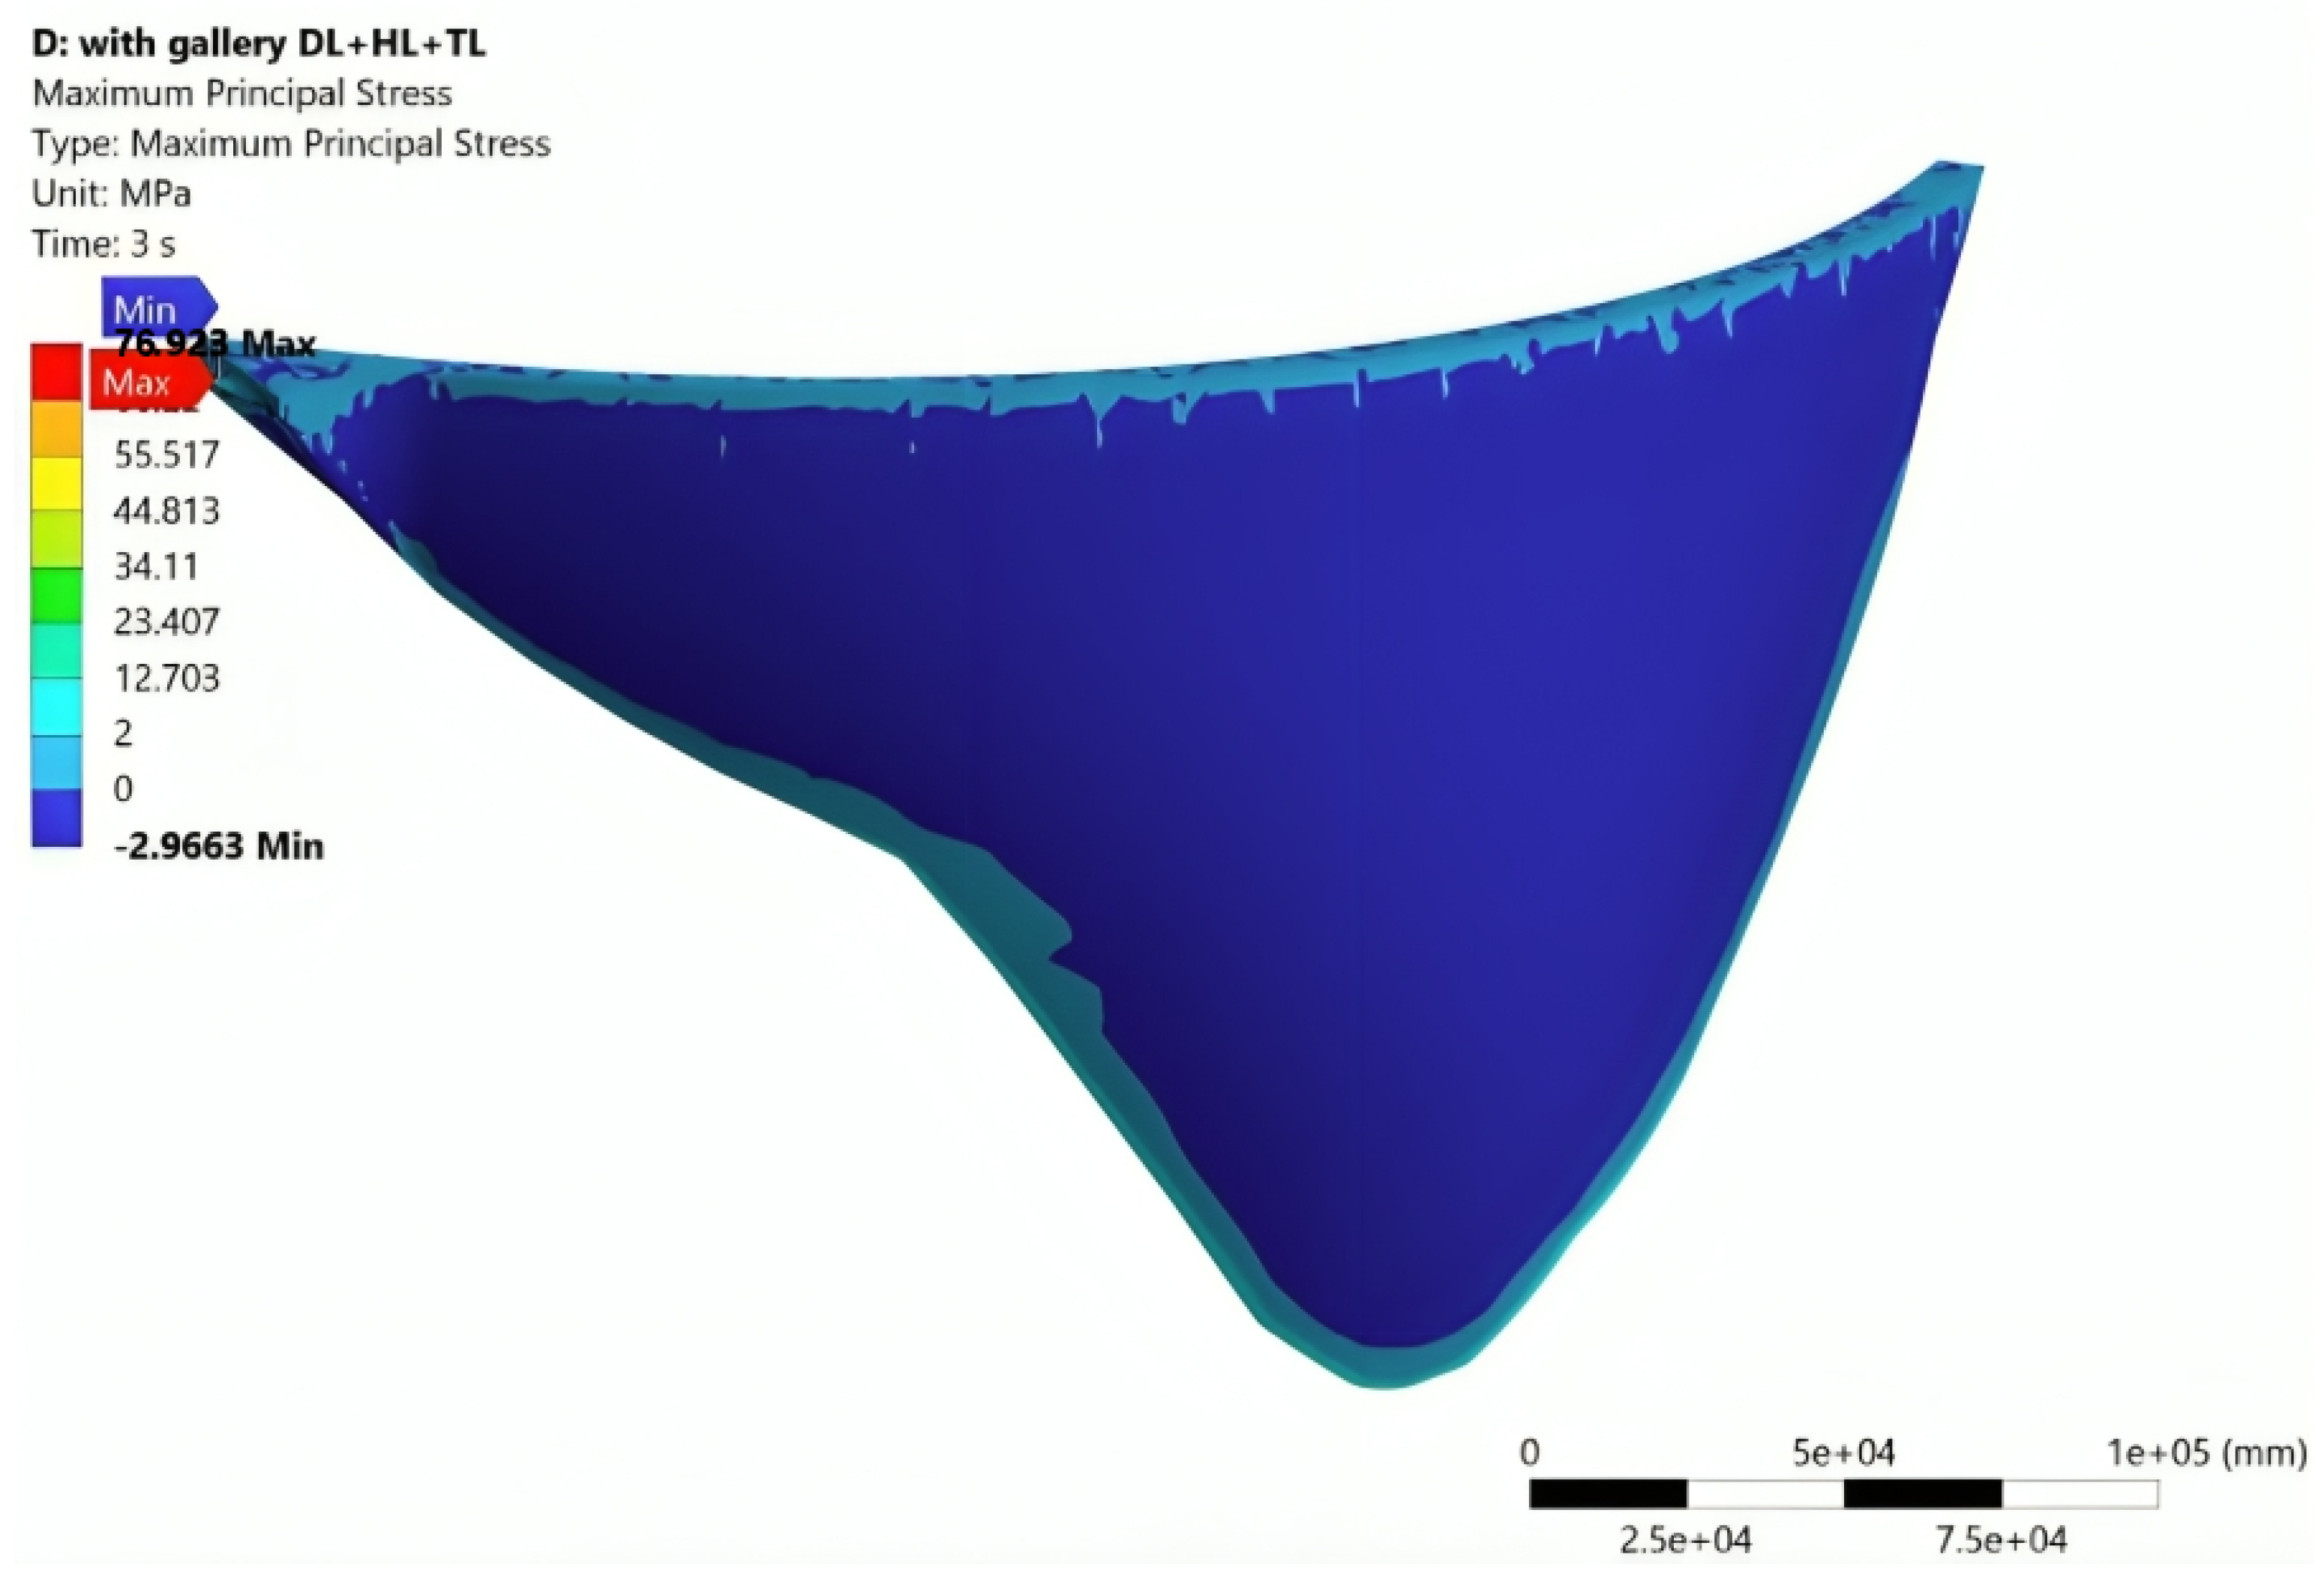
When the ambient temperature is low (Case 1), as per the loading shown, the dam deflects in the flow direction. The maximum value of deflection, 31.331 mm, occurs at an elevation near the top gallery, whereas at the abutments near the crest, the dam is moving towards the reservoir (Figure 12). The values of stresses, both the maximum principal stresses (Figure 13) and the minimum principal stresses (Figure 14), show that the tensile stresses occur only at the dam–foundation interface and crest area, whereas other parts of the dam body are experiencing compression. The extreme tensile stresses are well within 2.0 MPa. The compressive stresses are in the vicinity of 7.0 MPa. These stresses are well within the allowable stresses of 2.7 MPa and 40 MPa, respectively.
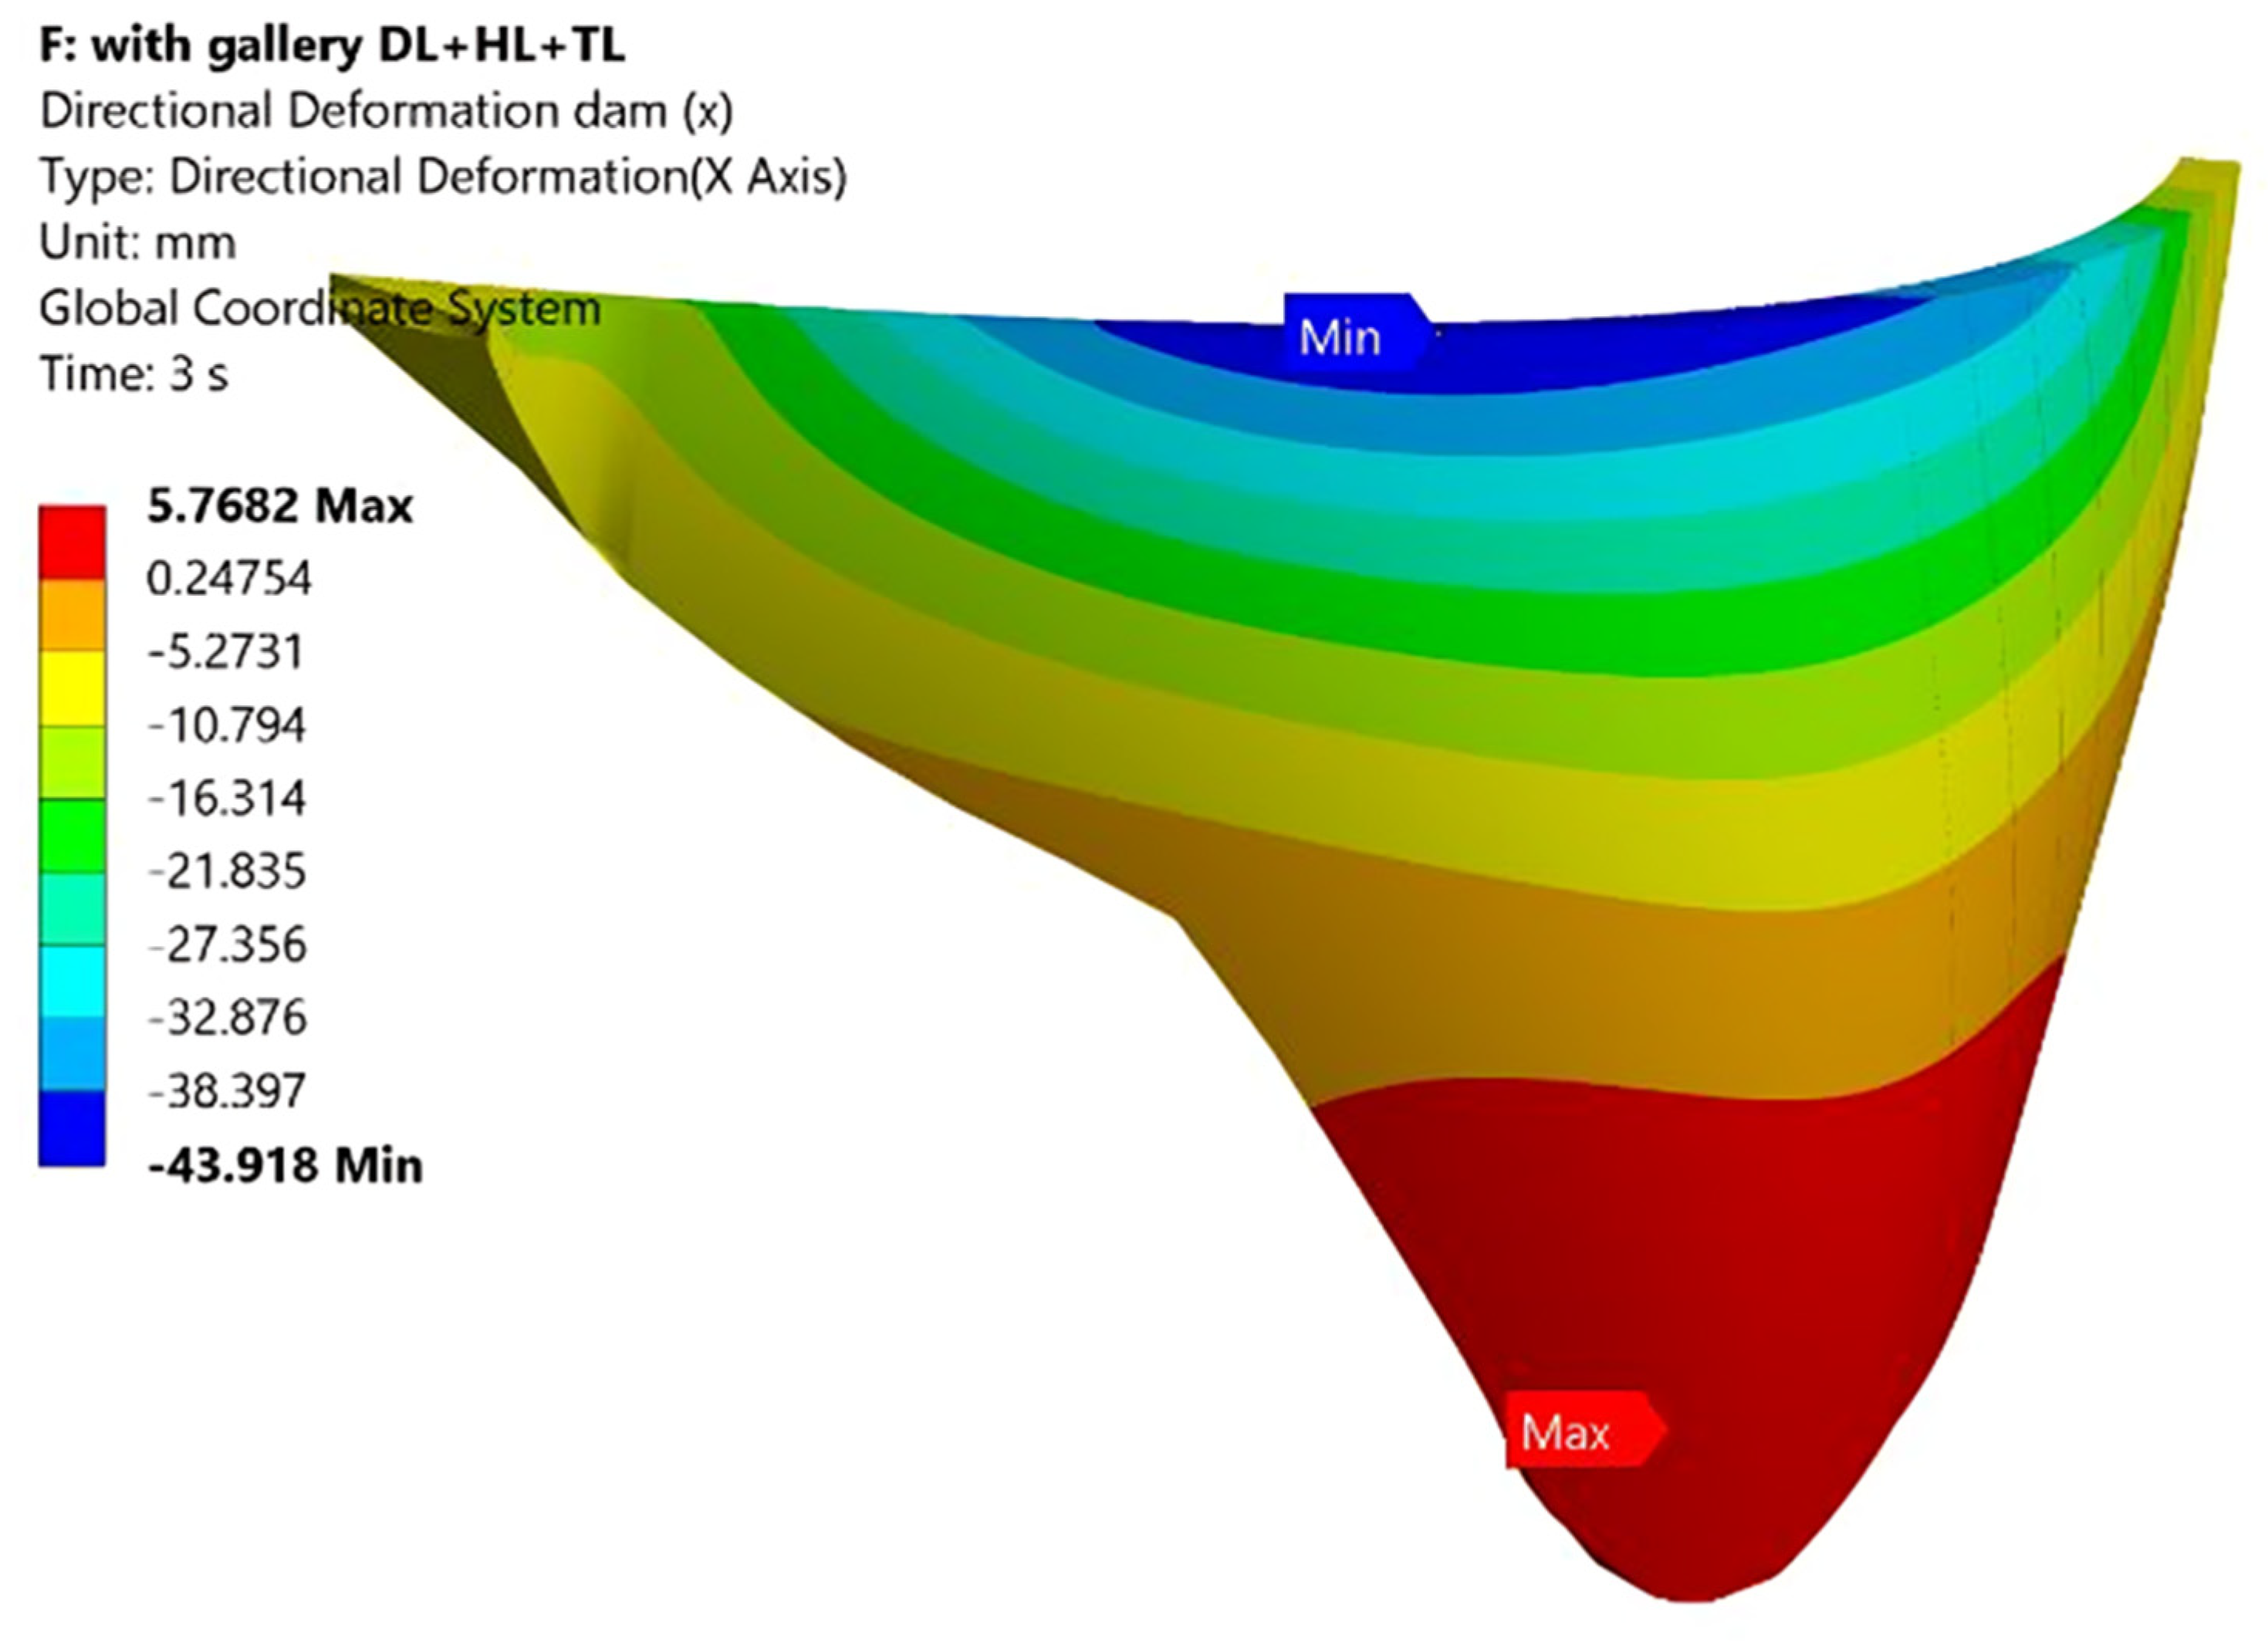
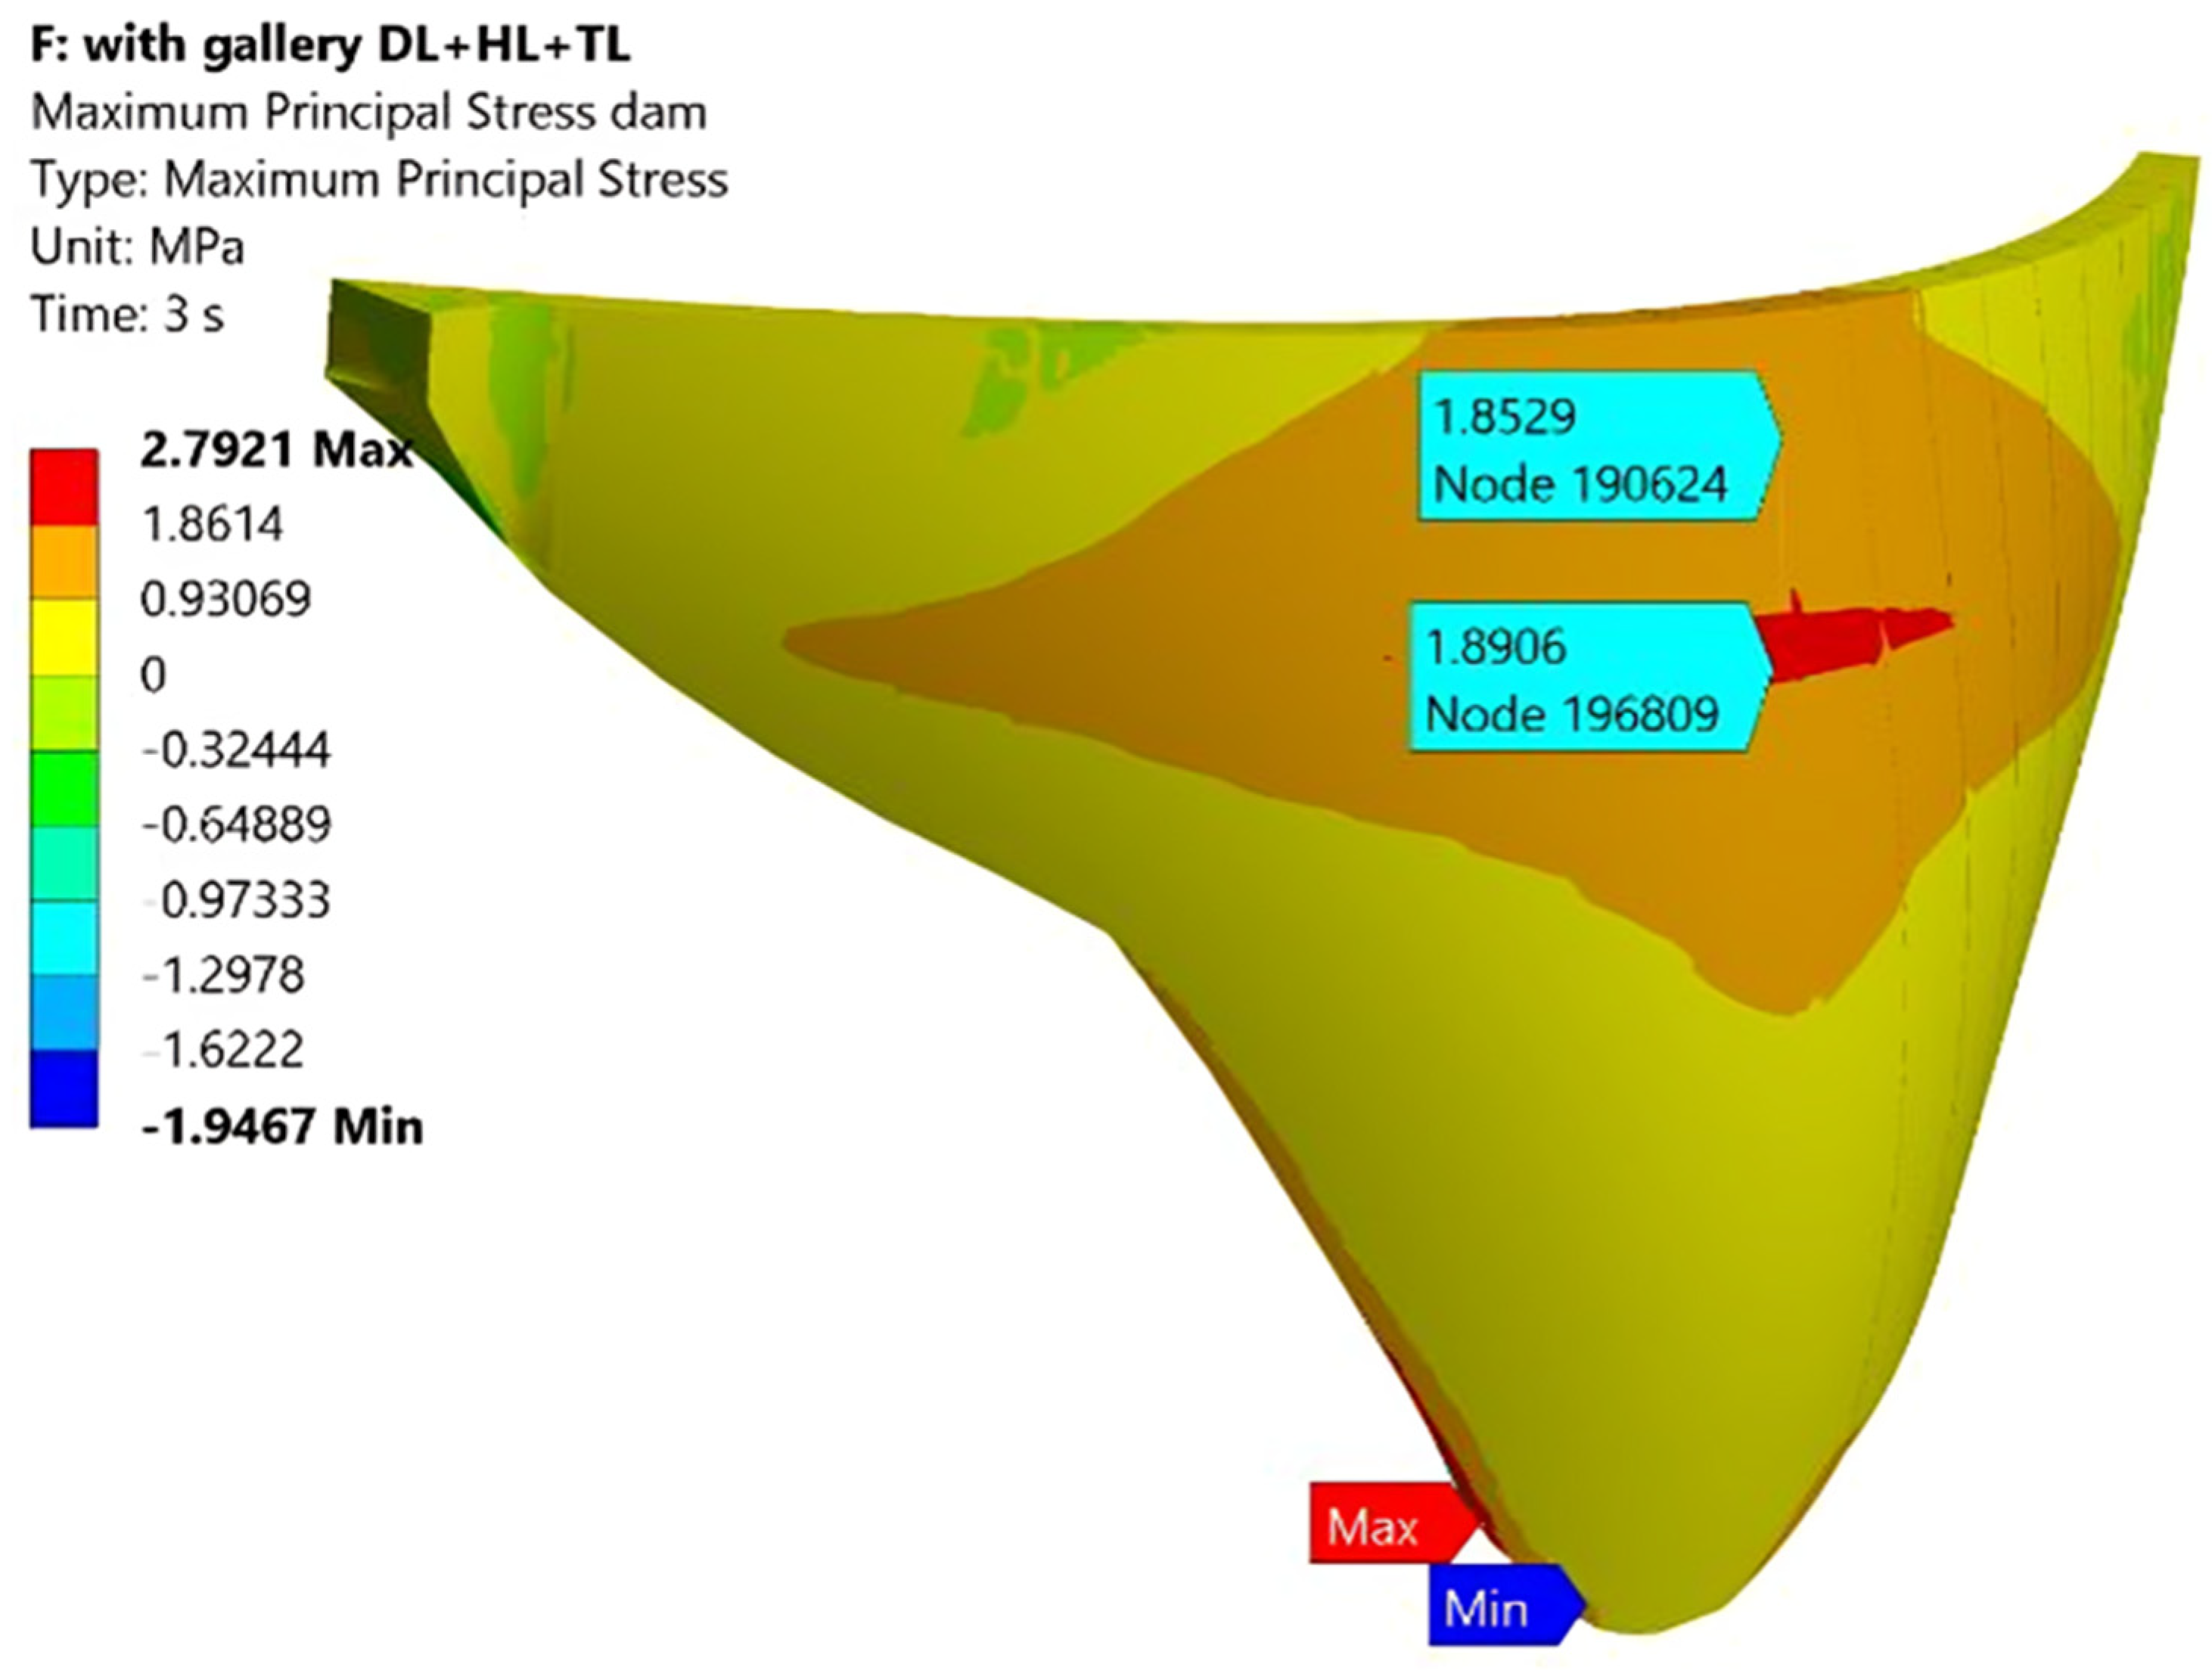
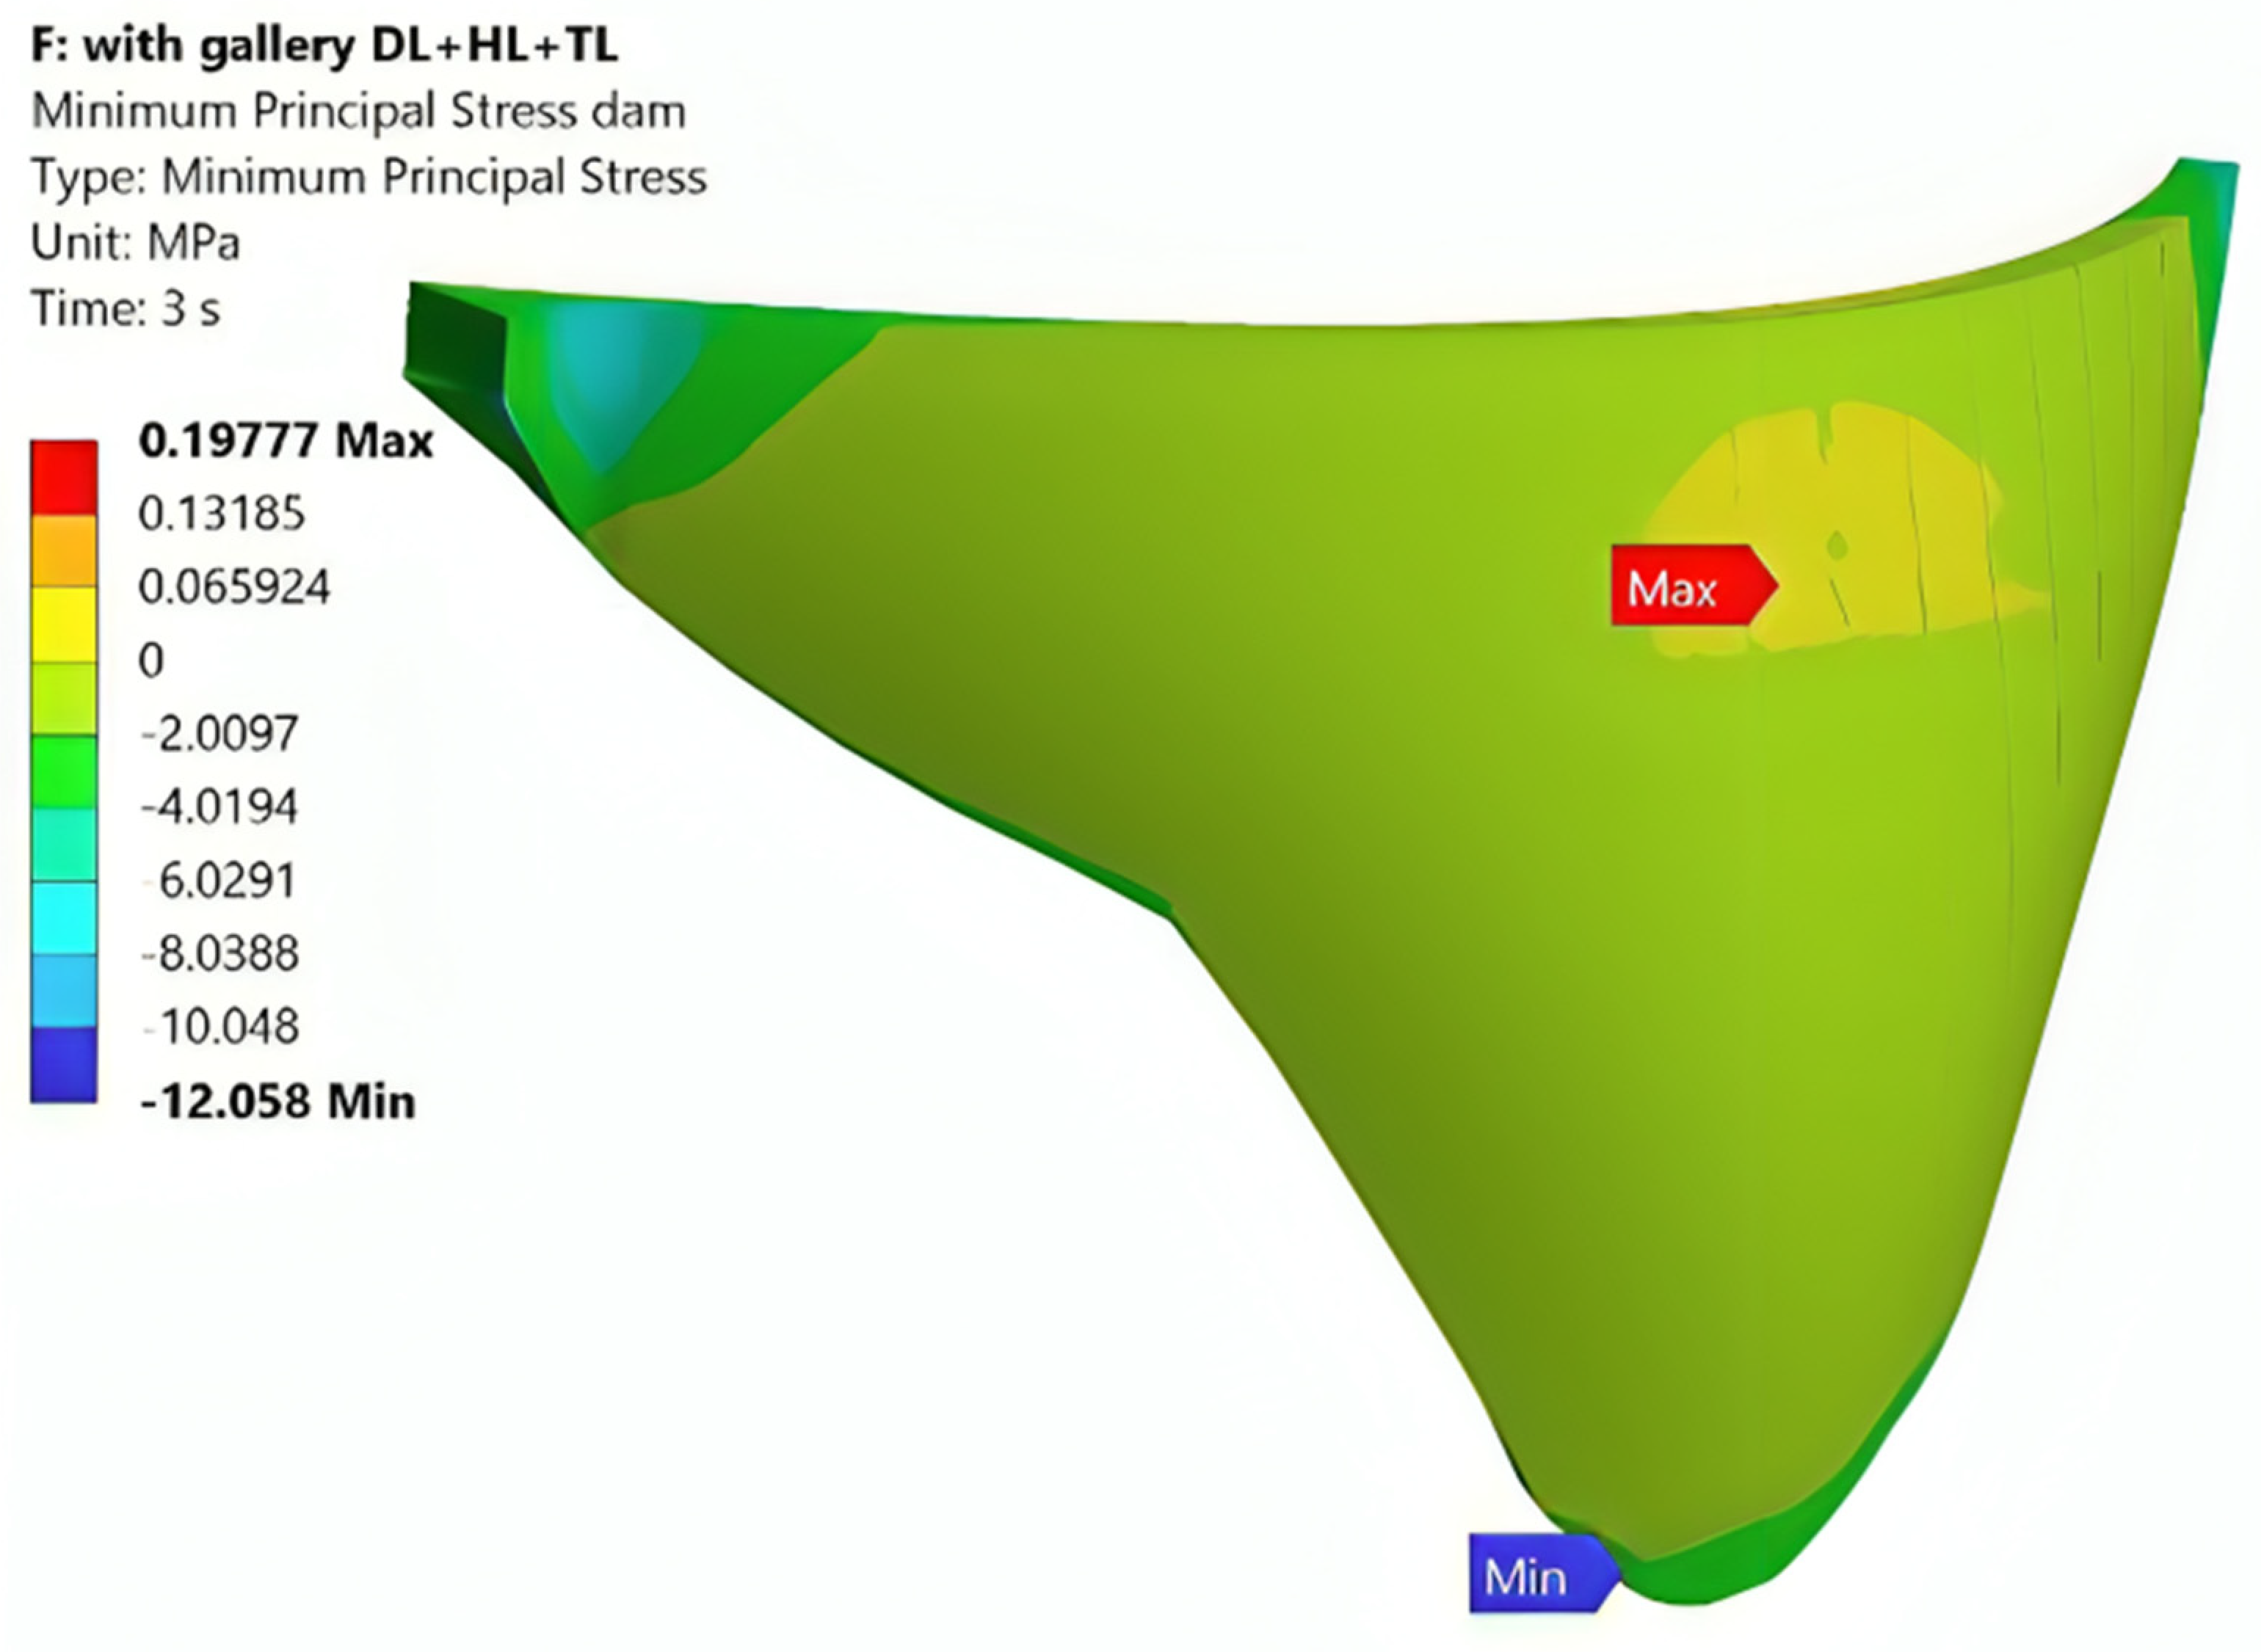
Meanwhile, in the second case, when the ambient temperature varies to the higher value and upon simulation of temperature loads as in Figure 9, it was observed that the dam exhibits a deformation towards the reservoir and the maximum is 43.92 mm (Figure 15). The maximum principal stresses and minimum principal stresses are presented in Figure 16 and Figure 17, respectively. Maximum tension is experienced in the dam body near the top gallery area. The tensile stresses are found not to exceed 1.90 MPa and are within the allowable limit of 2.7 MPa.
The evaluation of maximum principal stress showed that both the maximum and minimum stresses occur at the interface with the rock foundation, towards the central monolith. A small portion near the top gallery experiences a tensile stress of 1.89 N/mm2 as a horizontal band (Figure 16).
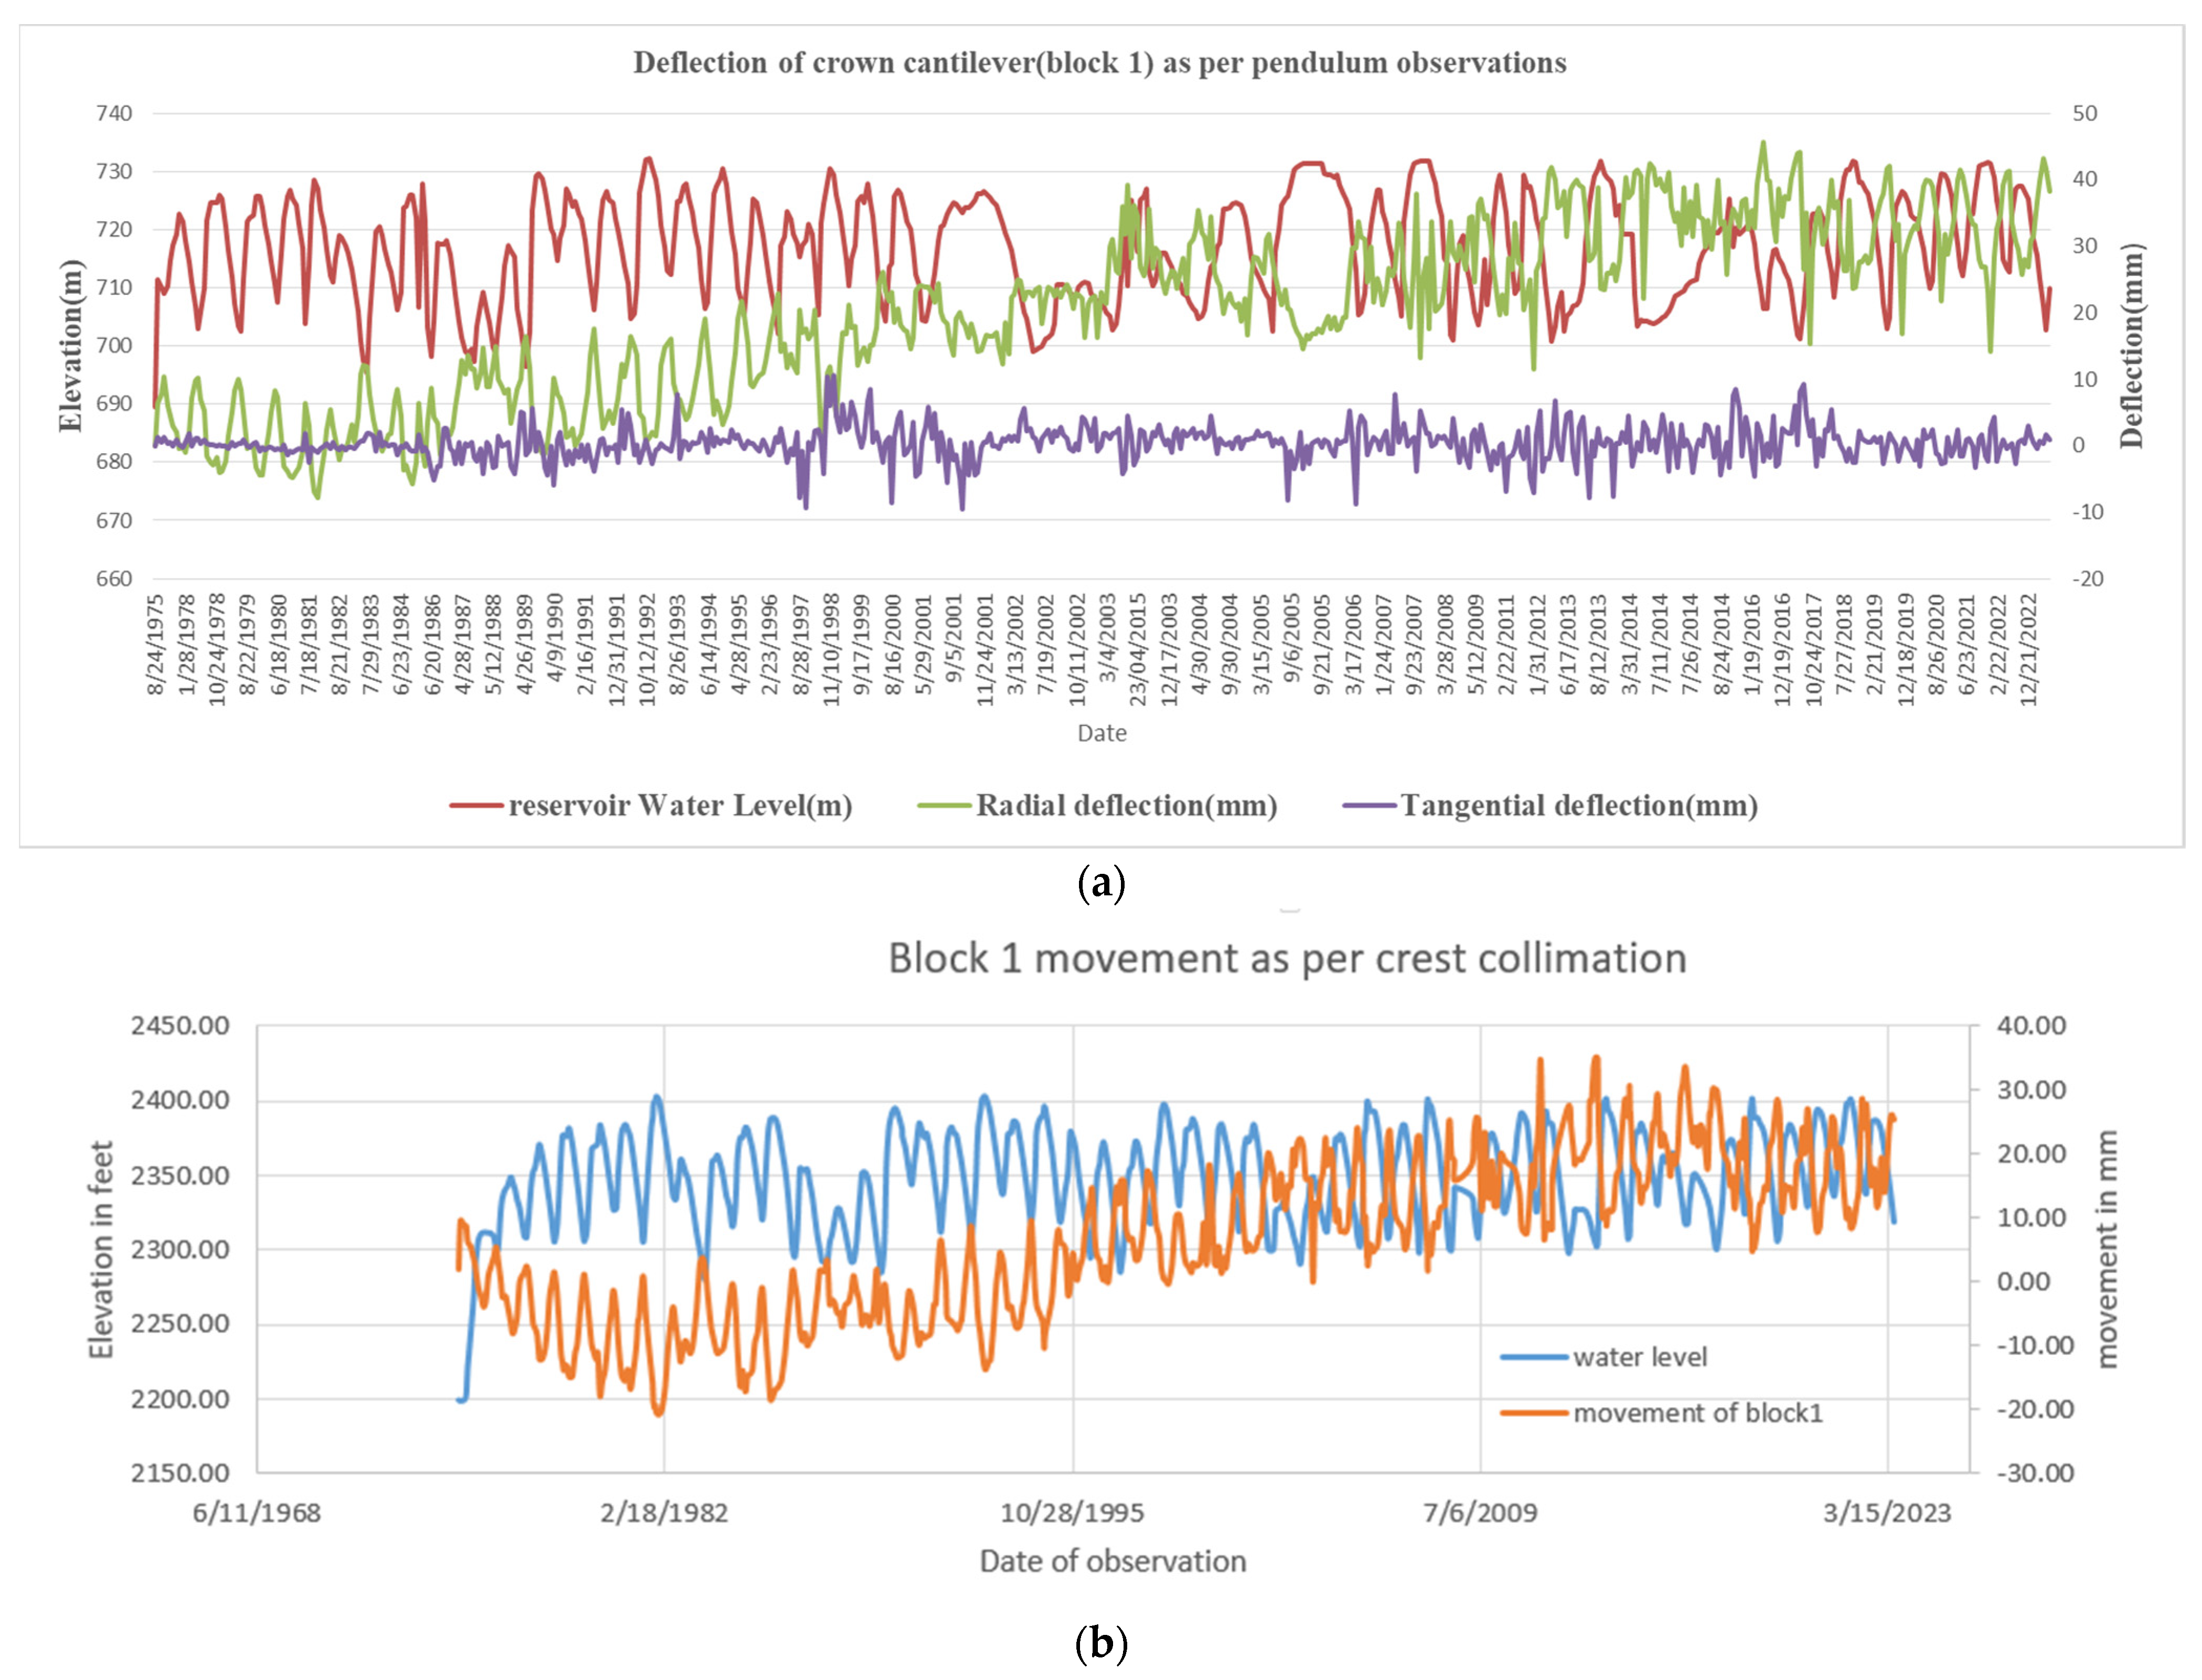
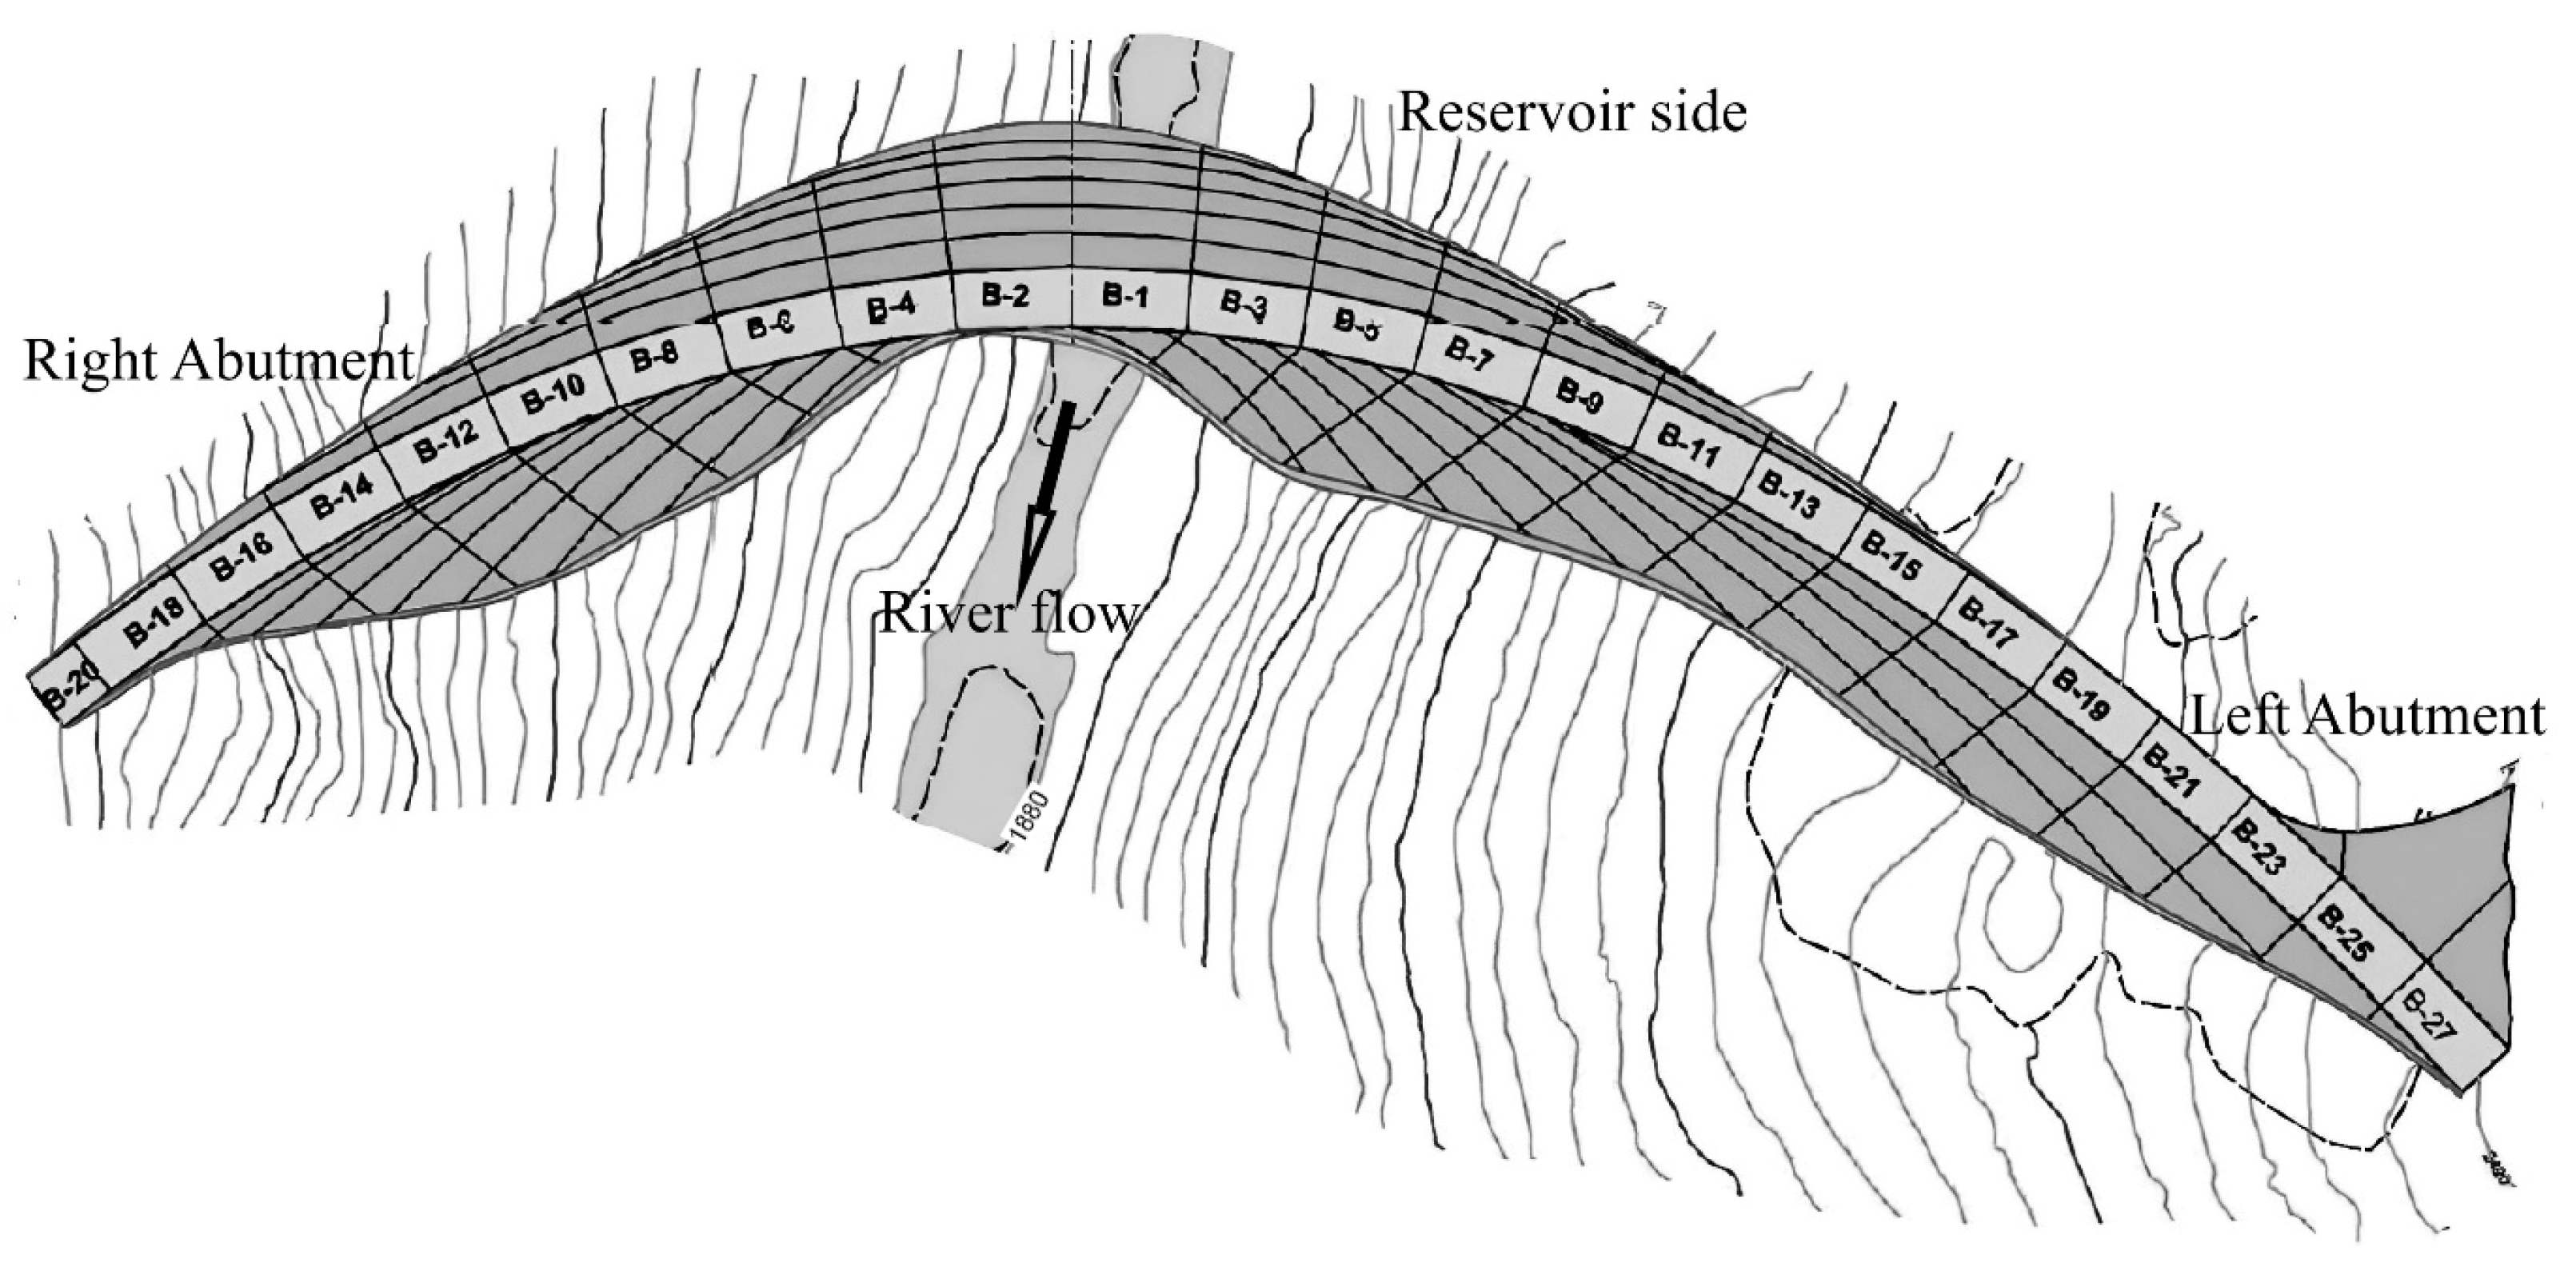
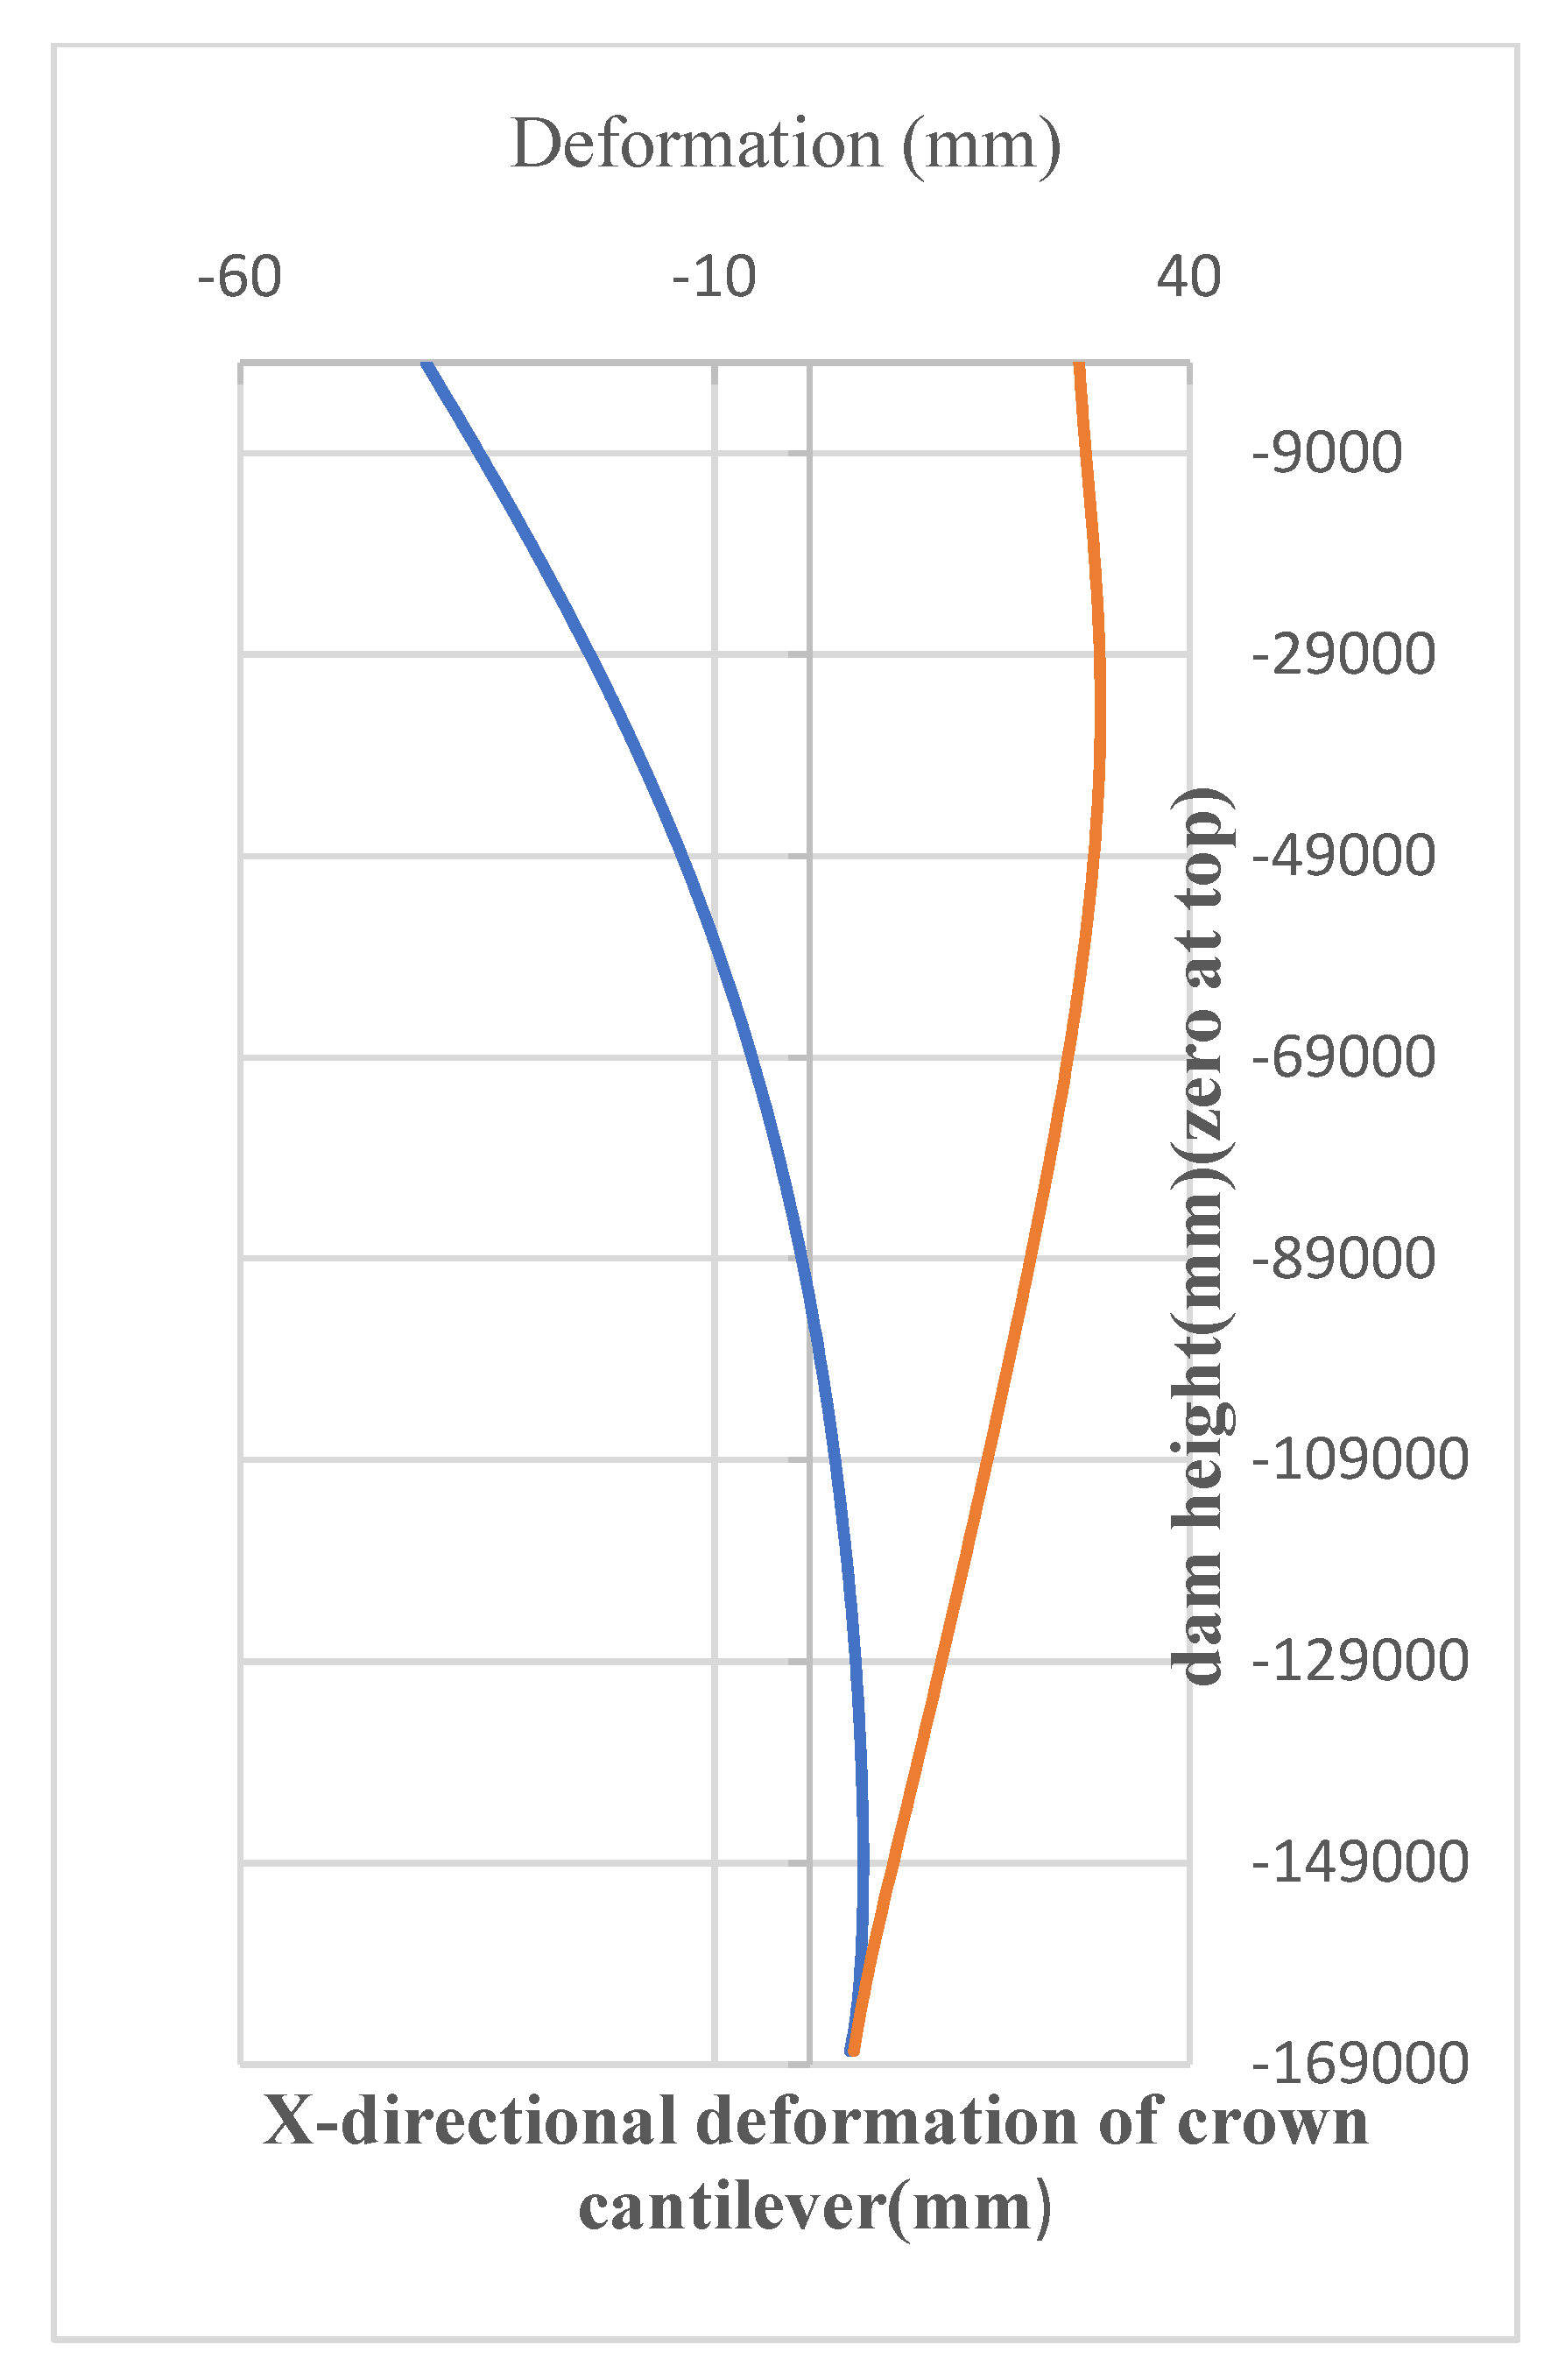
In the maximum ambient temperature case, it was observed that the compressive stresses and tensile stresses are generally of no concern within the dam body, though tensile stresses do develop near the top gallery level. The compressive stresses cause no concern to the structure. The field monitoring results of deflection of the crown cantilever (Block 1) measured at Ele. +731.52 m (2400 ft.) above mean sea level (m.s.l.), through direct pendulums at the galleries and the inverted pendulum anchored in the bottom at Ele. 537.05 m (+1762 ft.) above m.s.l., are shown in Figure 18a, whereas the deflection as per collimation survey data is plotted in Figure 18b. The relative positioning of the blocks (cantilevers) of the dam is shown in Figure 19, whereas the galleries and the pendulum are shown in Figure 20. The responses of the dam through crown cantilever in both the cases of low ambient temperature (Case 1) and high ambient temperature (Case 2) obtained through the 3D FEM analyses are compared and plotted as Figure 21. The orange line represents the downstream movement of the dam due to low temperature and high water level (Case 1), whereas the blue line represents the upstream movement of the dam due to an increase in temperature and low water level (Case 2). The analyses show that temperature rise will result in the crest deflecting towards upstream and the values compare well with the maximum observed deflections through field monitoring. The pendulum readings and crest collimation readings confirm this trend of upstream movement. Similarly the monitoring data of pendulums in Blocks 7 and 8 also confirms the upstream movement of the dam. Generally, the hydrostatic conditions and cyclic variations of temperature are causes for reversible deflections. However, the extreme higher temperature at continued lower water levels due to increased power generation in the non-monsoon months will contribute to the prolonged deflection towards reservoir direction.
The effect of temperature was further analyzed through the effects of certain rehabilitation works carried out. The entire exposed downstream face of the dam was painted with reflective coating as a measure to safeguard the dam body against detrimental effects of warming up. This risky work was completed in 2016. As per the monitoring data of pendulum readings and collimation survey, it is evident that the trend of upstream movement (Figure 18a,b) was stabilized henceforth, and it possibly checked further serious movement towards the reservoir. In the absence of direct observations of in-body temperature, the influence of the reflective coating is inferred indirectly, as evidenced by the reduction in or stabilization of dam–monolith deflections toward the reservoir, through the field observations of deflections after the coating is done.
Accordingly, based on the analysis, it can be stated that reducing the exposure of the dam faces to higher temperature would benefit in avoiding undesirable deflections of the dam body and preventing the development of undesirable tensile stresses in the dam body.
The results were compared with the analyses by the project authorities at the initial stages of the project. Linear elastic analysis done using trial load method and FEM analyses for the gravity and hydrostatic loads were compared in the present study. The trial load analysis showed a radial deflection of 28.7 mm with gravity load, with water up to MWL, and an FEM analysis with 26 elements showed 40.00 mm at crown cantilever at +716.00 m with gravity load, water load and silt load. The model test conducted gave 48.2 mm radial deflection for the crown cantilever of the arch dam at +696.5 m elevation [44]. The monitoring report containing the field observations by the dam owner during the year 1990 reported a maximum radial deflection of 23.0 mm in the upstream–downstream direction [45]. As per actual records—based on the instrumentation data of pendulum records of the dam owner—for the longer duration, it was found that the crest of the arch dam had moved 41.7 mm up to 2013–2014 [46]. The present study showed downstream movements, in general, to the fluctuating water levels for simulations without thermal loads. Meanwhile, the deflections of the dam were found to be either upstream or downstream based on the dam surface temperature, resulting from ambient air temperature or reservoir water temperature, which would cause differential temperature in the dam body from the upstream to downstream face. The radial deflection in the upstream direction was found to be contained from the continuously increasing trend, after the entire dam surface at the downstream was painted with reflective coating, which reduces the effect of conducting heat through the dam body (Figure 18a,b). This reinforces the finding that extreme thermal loading causing higher temperatures has a significant impact on the dam behavior.
Though behavior of arch dams, especially that of double-curvature ones, is not typical, but needs to be analyzed and monitored case by case. It is relevant to study the behavior of other such dams. However, it can be seen that the deflection of such dams can be either towards the reservoir (upstream) or in the flow direction (downstream) based on the loading conditions and it is pertinent to monitor whether this movement is normal or within design range. Similarly these analyses shall reveal whether stresses at salient points exceed the design values or as per the updated guidelines. Tensile stresses higher than the design or control values at any part of the dam body are a concern for dam safety. Corrective or rehabilitation measures can be undertaken based on periodic monitoring. As per the monitoring data, the maximum deformation of the Jinping-I Arch Dam—the tallest arch dam in the world—at initial impoundment up to its normal water level of 1880 m until November 2014 was 39.75 mm in the radial downstream directions. During the later period of initial impoundment, the dam body deformation was 40.75 mm (radial downstream) and the values of deflections were within the control values, as per arch-cantilever analyses [47]. However, as per the feedback analyses, by means of statistical modeling and numerical FEM analyses, at the NWL, the maximum radial deformation was 48.8 mm towards the inner side of the arch dam at 1870 m. As per the case study on working performance during the initial stages of impoundment, it showed negative values of deflections as well for the initial stages [48]. These deformation patterns, in general, had shown consistency with the monitoring results, and were within the design range. The stresses were mainly compressive in nature with meager values of tensile stresses, both well within the control values. As per the literature, arch dams in their operational period are found to exhibit decreasing radial deflections in the downstream direction and to deflect in the upstream directions [49,50]. Research conducted on certain gravity dams and arch dams for displacement prediction using various machine learning techniques showed that the combined action of hydrostatic and thermal loads caused notable positive and negative deflections (that is, movement in the upstream directions as well) [51,52]. Interestingly, in certain research papers on moderately thin arch dams, significant impacts of thermal loads were not reported [53]. The dam studied through this paper showed reversing trends; at lower reservoir water temperatures and dam body temperatures due to low ambient temperatures, the dam deflects downstream, while it deflects towards the reservoir when the higher ambient temperatures due to solar radiation cause the temperature of the reservoir water and dam body to undergo a corresponding increase in temperature. Higher thermal loading was found to have adverse effects on the dam, as it causes increasing upstream deflection and undesirable tensile stresses.
Under the lower extreme temperature case, the simulation results are consistent with the expected response. The temperature differential between intrados and extrados, and relative to the arch closure temperature, is small; when temperature falls below closure, the arches contract and tend to deflect downward, while expansion–contraction effects of arches and cantilevers remain marginal. Hydrostatic loading dominates, producing downstream deflection (Table 4). As intrados temperature rises, arch expansion increases the radius of curvature; at high temperature extremes, the arch moves upstream, with the opposing water load minimum at low reservoir levels, resulting in the crest deflections becoming more pronounced (Figure 20). These responses through deflections remain elastic and cyclic, as confirmed by crest collimation and pendulum data, although a long-term net upstream movement observed since the early 1990s appears to have stabilized or reversed after the application of reflective coating on the exposed downstream face.
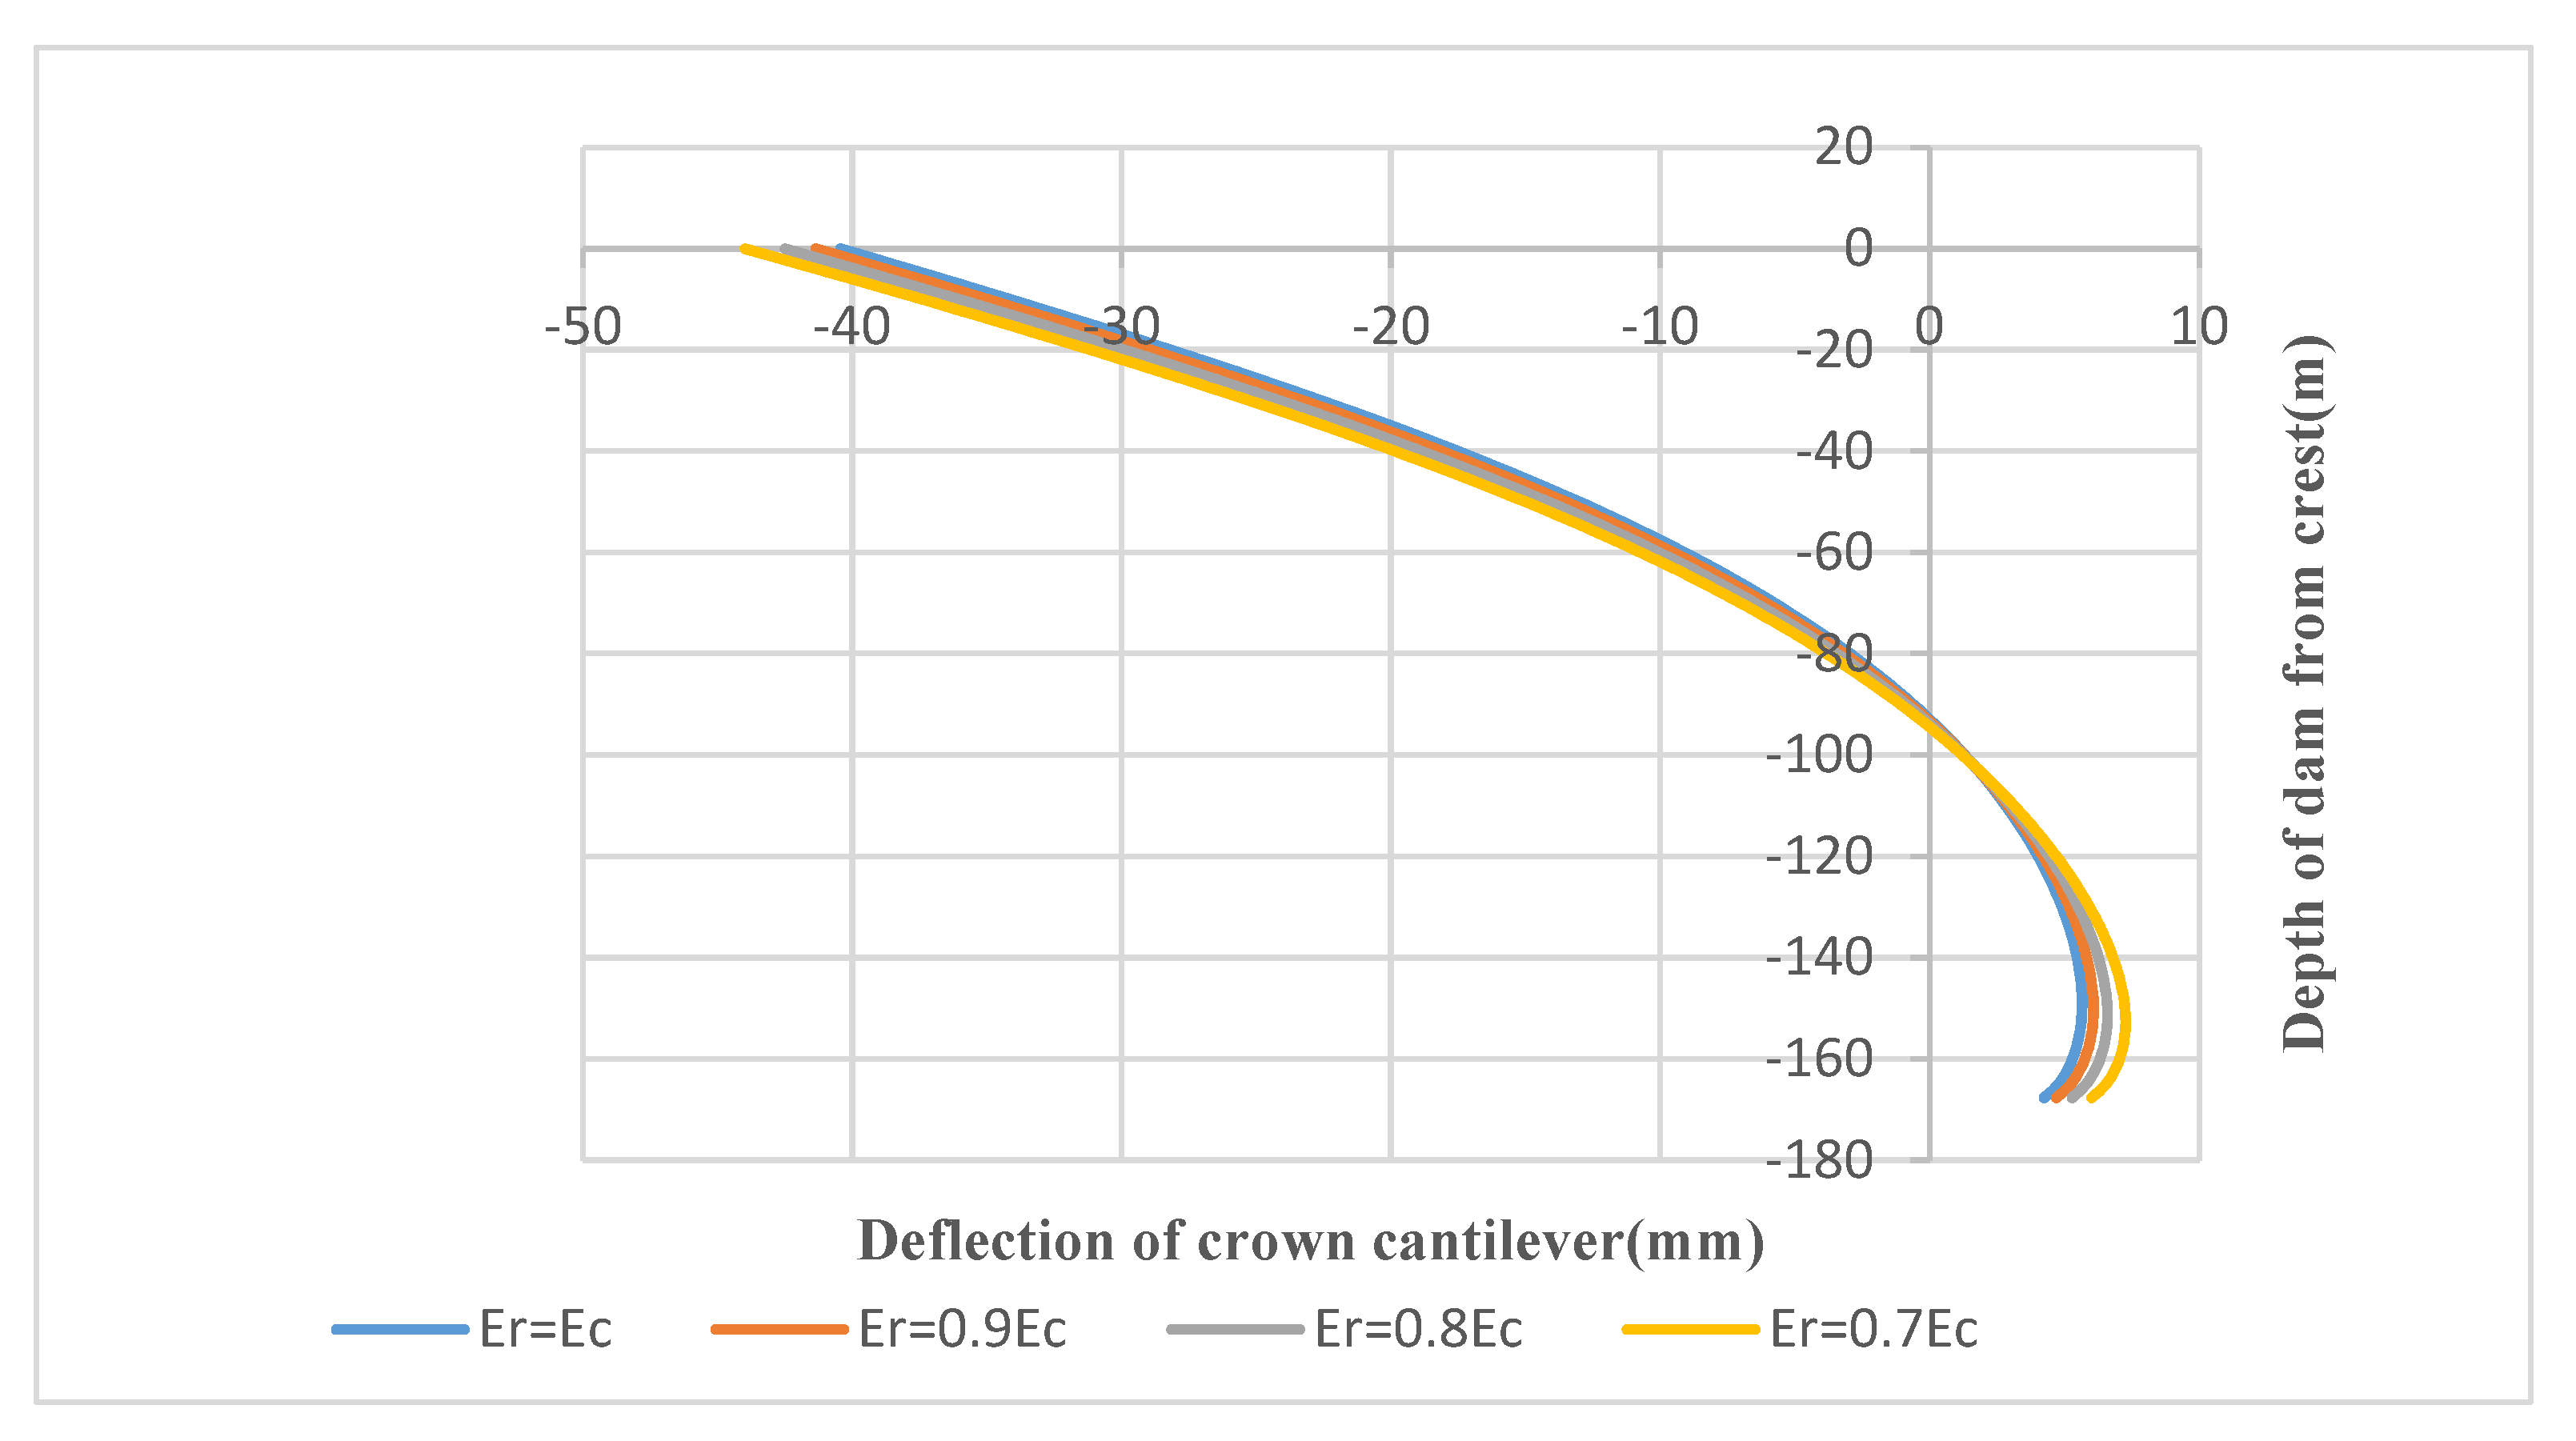
The results of the analyses with various modular ratios of rock to concrete, Er/Ec, revealed no significant impact on the behavior of the arch dam with respect to deflections in the study for the impact of thermal loads (Figure 22). Tensile forces occur at the u/s face 1.89 MPa; maximum and minimum tensile and compressive stresses occur at rock–foundation interface.
Previous studies suggest that dam geometry directly influences deformation behavior and the spatial extent of potential damage, but it does not govern localized damage at the most critical points [54]. Assessing the present condition and potential future risks is a critical aspect of dam safety [55].

6. Conclusions

Investigations into the behavior of the existing asymmetric double-curvature, concrete thin arch dam through the 3D-FEM analyses revealed the following pertinent conclusions:
  • Arch dams exhibit complex behavior in their response to various types of loading and extreme variations in ambient temperature. During cool weather conditions with high reservoir water levels, the dam moves in the downstream direction, and when the temperature rises towards the maximum, the dam moves in the reverse direction; towards the reservoir. As per the analyses of the double-curvature arch dam, under extreme conditions of low and high temperature, the crown cantilever monolith of the dam was found to be displaced by 31.33 mm near the top gallery level towards downstream and 43.92 mm at the crest towards the upstream, respectively. The field monitoring results revealed that maximum movement towards the reservoir direction occurs during lower reservoir level and when the temperature is high. Also, the downstream movement is at its maximum when the reservoir water level is high and the temperature is low. The results of the present study agree in general as per the field monitoring data. This shows that an increase in the dam body temperatures to an extreme during low water level will cause deflection of the arch dam in the reservoir direction.
  • The influence of temperature on the deflection will become a matter of concern to the safety of the dam as the continued exposure to extreme high temperature under low water level may eventually become a cause for continuing the upstream movement of the dam. So, measures to reduce the temperature at the downstream face and exposed upstream face above the low water level are desirable for the better performance of the dam.
  • The principal stress contour showed that the tensile stresses and compressive stresses do not exceed the limits within the dam body. Most areas of the dam body experience compressive stresses in general, though tensile stresses of smaller values are observed at some locations. The maximum values are found to occur at the rock–concrete foundation and abutment interface, though they are not threatening to the safety of the dam. Tensile stresses are also found to occur at the rock–dam body interface. However, it is also observed that tensile stresses of the order of 1.89 MPa occur in a small portion, horizontally, near the upper gallery level, at the upstream face. This is a potential cause for the formation of tensile cracks.
  • The behavior of the dam by way of its deflection against fluctuating water levels is not abnormal, though the response to thermal loads is not in the usually expected lines. Continuous movement towards the reservoir can impart more tensile stresses in the dam body and dam–rock interface and will cause cracks in the body and joints. If the temperature loads on the dam can be reduced, this will result in reduced deformation and tensile stresses, which is favorable for the health of the dam.
  • The deflections of the arch dam due to varying water loads were found to be conservative and on the same lines as per the analyses during the initial stages of the project construction.
  • Thermal loads due to temperature variations have a significant effect on the deflection pattern of the thin arch dam when they fluctuate during high temperature season (summer) to low temperature season (winter and monsoon season). Also, thermal loads due to an increase in temperature are a concern, as it is a cause of the development of tensile stresses in the thin arch dam, and hence, measures to reduce the temperature on the dam faces where there is continuous exposure to solar radiation would be beneficial to the long-term health of the dam.

Author Contributions

J.P.K.P.: conceptualization, problem identification, data collection and curation, investigation, initial methodology, analysis, software, validation, original draft and final manuscript; P.N.: research supervision, review of objectives and refinement, review of methodology, research design, review of analysis and results, review of validation, visualization, aligning with the objectives; S.G.T.: review of the conceptualization, refinement of research problem and objectives, research supervision for data collection, review of methodology and modification, review of analysis and results, editing the draft. All authors have read and agreed to the published version of the manuscript.

Funding

This research received no external funding.

Data Availability Statement

No new data were created or analyzed in this study. Data were obtained from Kerala State Electricity Board Limited. The original contributions presented in this study are included in the article. Further inquiries can be directed to the corresponding author.

Acknowledgments

We sincerely acknowledge our thanks to the Kerala State Electricity Board Limited, the dam owner for sourcing the data for the study.

Conflicts of Interest

The authors declare no conflicts of interest. The funders had no say in the design of the study; in the collection, analyses, or interpretation of data; in the writing of the manuscript; or in the decision to publish the results.

Abbreviations

The following abbreviations are used in this manuscript:
2D, 3DTwo-Dimensional, Three-Dimensional
FEMFinite Element Method
ICOLDInternational Commission on Large Dams
USBRUnited States Bureau of Reclamation
USACEUnited States Army Corps of Engineers
FERCFederal Energy Regulatory Commission
MDDLMinimum Draw-Down Level
FRLFull Reservoir Level
MWLMaximum Water Level
KSEBLKerala State Electricity Board Limited
m.s.l.mean sea level

References

  1. ICOLD-CIGB. World Register of Dams: General Synthesis. Available online: https://www.icold-cigb.org/GB/world_register/general_synthesis.asp (accessed on 1 January 2026).
  2. ICOLD-CIGB. Constitution Statuts; EDF LAB: Chatou, France, 2011; Available online: https://www.icold-cigb.org/userfiles/files/CIGB/INSTITUTIONAL_FILES/Constitution2011.pdf (accessed on 19 June 2025).
  3. UNFPA. State of world population report. In The Real Fertility Crisis: The Pursuit of Reproductive Agency in a Changing World; UNFPA: New York, NY, USA, 2025; Available online: https://eeca.unfpa.org/en/publications/real-fertility-crisis-pursuit-reproductive-agency-changing-world (accessed on 5 July 2025).
  4. ICOLD-CIGB. Dams and Environment. Available online: https://www.icold-cigb.org/GB/dams/dams_and_environment.asp (accessed on 19 June 2025).
  5. Cho, M.S.; Qi, J. Remote sensing-based assessment of dam impacts on hydrology, geomorphology, ecosystems, and society—A review. Environ. Earth Sci. 2025, 84, 344. [Google Scholar] [CrossRef] [Scilit]
  6. Hoque, M.M.; Islam, A.; Ghosh, S. Environmental flow in the context of dams and development with special reference to the Damodar Valley Project, India: A review. Sustain. Water Resour. Manag. 2022, 8, 62. [Google Scholar] [CrossRef] [Scilit]
  7. Wu, H.; Chen, J.; Xu, J.; Zeng, G.; Sang, L.; Liu, Q.; Yin, Z.; Dai, J.; Yin, D.; Liang, J.; et al. Effects of dam construction on biodiversity: A review. J. Clean. Prod. 2019, 221, 480–489. [Google Scholar] [CrossRef] [Scilit]
  8. Association of State Dam Safety officials USA. Supplement to the Position Paper on Dams and the Environment from 2012. Available online: https://damsafety.org/content/supplement-position-paper-dams-and-environment (accessed on 18 June 2025).
  9. ICOLD-CIGB (Ed.) Supplement to the Position Paper on Dams and the Environment, 1st ed.; CRC Press: London, UK, 2025; Available online: https://uat.taylorfrancis.com/books/edit/10.1201/9781351035668/supplement-position-paper-dams-environment-cigb-icold (accessed on 18 June 2025).
  10. ICOLD-CIGB. Bulletin 159. In Supplement to the Position Paper on Dams and the Environment; CRC Press: London, UK, 2025. [Google Scholar]
  11. Creager, W.P.; Justin, J.D.W.; Hinds, J. Engineering for Dams; J. Wiley& Sons, Inc.: London, UK, 1945; pp. 425–557. [Google Scholar]
  12. Chen, S.-H. Hydraulic Structures; Springer: Berlin/Heidelberg, Germany, 2015. [Google Scholar] [CrossRef] [Scilit]
  13. Sharma, H.D. Concrete Dams, Publication No. 266; Central Board of Irrigation and Power: New Delhi, India, 1998. [Google Scholar]
  14. EM 1110-2-2201; Manual, Arch Dam Design. US Army Corps of Engineering: Washington, DC, USA, 1994.
  15. U. S. Bureau of Reclamation. Design of Arch Dams, Design Manual for Concrete Arch Dams; United States Dept. of the Interior: Denver, CO, USA, 1977.
  16. Swaminathan, K.V. Lectures on Arch Dams by Dr. Swaminathan K.V. of Indian Institute of Science, Bangalore at Idukki; Archives of Kerala State Electricity Board: Thiruvananthapuram, India, 1969. [Google Scholar]
  17. Conde, A.; Toledo, M.A.; Salete, E. Cracks in Arch Dams: An Overview of Documented Instances. Appl. Sci. 2023, 14, 7580. [Google Scholar] [CrossRef] [Scilit]
  18. Wei, P.; Lin, P.; Peng, H.; Yang, Z.; Qiao, Y. Analysis of cracking mechanism of concrete galleries in a super high arch dam. Eng. Struct. 2021, 248, 113227. [Google Scholar] [CrossRef] [Scilit]
  19. Boggs, H.L.; Tarbox, G.S.; Jansen, R.B. Arch Dam Design and Analysis. In Advanced Dam Engineering for Design, Construction, and Rehabilitation; Jansen, R.B., Ed.; Springer: Boston, MA, USA, 1988; pp. 493–539. [Google Scholar] [CrossRef] [Scilit]
  20. U.S. Bureau of Reclamation. Bulletin 1, Part V-Technical Investigations. In Trial Load Method of Analysing Arch Dams; Boulder Canyon Project Final Report; United States Department of the Interior: Denver, CO, USA, 1938. [Google Scholar]
  21. Boggs, H.; Mays, J. Effects of Vertical Contraction Joints on the Dynamic Response of Arch Dams; Bureau of Reclamation: Washington, DC, USA, 1986.
  22. Yang, J.; Wang, J.; Pan, J. An intelligent method for temperature load of arch dams. Eng. Struct. 2024, 321, 118918. [Google Scholar] [CrossRef] [Scilit]
  23. Mirzabozorg, H.; Hariri-Ardebili, M.A.; Shirkhan, M.; Seyed-Kolbadi, S.M. Mathematical Modeling and Numerical Analysis of Thermal Distribution in Arch Dams considering Solar Radiation Effect. Sci. World J. 2013, 2014, 597393. [Google Scholar] [CrossRef] [Scilit] [PubMed]
  24. Bui, A.K.; Sancharoen, P.; Tangtermsirikul, S.; Tanapornraweekit, G.; Nanakorn, P. Effects of material properties on structural behavior and safety evaluation of an old arch dam. J. Eng. Res. 2022, 10, 46–71. [Google Scholar] [CrossRef] [Scilit]
  25. Wang, R. Key Technologies in the Design and Construction of 300 M Ultra-High Arch Dams. Engineering 2016, 2, 350–359. [Google Scholar] [CrossRef] [Scilit]
  26. Interpretation Report No.11; Kerala State Electricity Board Limited: Kerala, India, 2007.
  27. FEMA P-956; Catalog No. 13052-3, Living With Dams, Know Your Risks. Federal Emergency Management Agency, U.S. Department of Homeland Security: Washington, DC, USA, 2013.
  28. Zhang, L.; Peng, M.; Chang, D.; Xu, Y. Dam Failure Mechanisms and Risk Assessment; John Wiley & Sons Singapore Pte Ltd.: Singapore, 2016; pp. 53–55, 244–246. [Google Scholar]
  29. Federal Emergency Management Agency, United States. Selecting Analytic Tools for Concrete Dams to Address Key Events along Potential Failure Mode Paths; P-1016, Catalogue No. 14177-1; Federal Emergency Management Agency: Washington, DC, USA, 2014.
  30. Ghanaat, Y. Failure modes approach to safety evaluation of dams. In Proceedings of the 13th World Conference on Earthquake Engineering, Vancouver, BC, Canada, 1–6 August 2004; p. 1115. [Google Scholar]
  31. Tao, Z.; Liu, Y.; Yang, Q.; Wang, S. Study on the nonlinear deformation and failure mechanism of a high arch dam and foundation based on geomechanical model test. Eng. Struct. 2020, 207, 110287. [Google Scholar] [CrossRef] [Scilit]
  32. Song, Z.; Liu, Y.; Yang, Q. Experimental and numerical investigation on the stability of a high arch dam with typical problems of nonsymmetry: Baihetan Dam, China. Bull. Eng. Geol. Environ. 2016, 75, 1555–1570. [Google Scholar] [CrossRef] [Scilit]
  33. Liu, Y.R.; Guan, F.H.; Yang, Q.; Yang, R.Q.; Zhou, W.Y. Geomechanical model test for stability analysis of high arch dam based on small blocks masonry technique. Int. J. Rock Mech. Min. Sci. 2013, 61, 231–243. [Google Scholar] [CrossRef] [Scilit]
  34. Tao, Z.; Liu, Y.; Cheng, L.; Yang, Q. Failure and stability analysis of Jinping-I arch dam based on geomechanical model test and nonlinear numerical analysis. Rock Mech. Rock Eng. 2019, 52, 2245–2260. [Google Scholar] [CrossRef] [Scilit]
  35. Wang, X.; Liu, Y.; Tao, Z.; Wang, W.; Yang, Q. Study on the failure process and nonlinear safety of high arch dam and foundation based on geo-mechanical model test. Eng. Fail. Anal. 2020, 116, 104704. [Google Scholar] [CrossRef] [Scilit]
  36. Londe, P. Malpasset Dam. In Proceedings, International Workshop on Dam Failures; Purdue University: West Lafayette, IN, USA, 1985. [Google Scholar]
  37. Wittke, W.; Leonards, G.A. Modified Hypothesis for Failure of Malpasset Dam. In Proceedings, International Workshop on Dam Failures; Purdue University: West Lafayette, IN, USA, 1985. [Google Scholar]
  38. Wittke, W.; Leonards, G. Modified hypothesis for failure of the Malpasset Dam. Eng. Geol. 1987, 24, 407–421. [Google Scholar] [CrossRef] [Scilit]
  39. James, L.B.; Jansen, R.B.; Kiersch, G.A.; Leps, T.M. Lessons from Notable Events. In Advanced Dam Engineering for Design, Construction, and Rehabilitation; Jansen, R.B., Ed.; Springer: Boston, MA, USA, 1988. [Google Scholar] [CrossRef] [Scilit]
  40. Holman, J.P. Heat Transfer, 10th ed.; Mcgraw-Hill Companies: New York, NY, USA, 2010. [Google Scholar]
  41. Malm, R. Guideline for FE Analyses of Concrete Dams; Report 2016:270; Energiforsk AB: Stockholm, Sweden, 2016; pp. 1–160. [Google Scholar]
  42. Ansys Mechanical User Guide; ANSYS, Inc.: Canonsburg, PA, USA, 2024; Available online: https://ansyshelp.ansys.com/public/account/secured?returnurl=/Views/Secured/corp/v242/en/wb_sim/ds_static_thermal_analysis_type.html (accessed on 19 June 2025).
  43. FERC. Engineering Guidelines for the Evaluation of Hydropower Projects, Chapter 11, Arch Dams; Federal Energy Regulatory Commission, Office of Energy Projects: Washington, DC, USA, 2023.
  44. Central Board of Irrigation and Power. Design and Construction Features of Selected Dams in India; Publication No.138; Indian National Committee for International Commission on Large Dams: New Delhi, India, 1979; pp. 290–317. [Google Scholar]
  45. Kerala State Electricity Board. Idukki High Arch Dam Monitoring; Field Report No.1; 22 January–9 February 1990; Kerala State Electricity Board: Kerala, India, 1990. [Google Scholar]
  46. Pillai, B.R.K.; Patra, B.K.; Paul, A.; Agarwal, A.; Smiljkovic, Z. Understanding the unusual behaviour of an arch dam using FEM approach. In Proceedings of the Second National Dam Safety Conference, Bengaluru, India, 12–13 January 2016; Springer Nature: Singapore; pp. 266–271.
  47. Wu, S.; Cao, W.; Zheng, J. Analysis of Working Behavior of Jinping-I Arch Dam during Initial Impoundment. Water Sci. Eng. 2016, 9, 240–248. [Google Scholar] [CrossRef] [Scilit]
  48. Liu, Y.; Zhang, G.; Zhu, B.; Shang, F. Actual Working Performance Assessment of Super-High Arch Dams. J. Perform. Constr. Facil. 2016, 30, 04015011. [Google Scholar] [CrossRef] [Scilit]
  49. Thongthamchart, C.; Raphitphan, N. Performance of Bhumibol Concrete Arch Dam after 50 Years of Operation; EGAT: Nonthaburi, Thailand, 2016. [Google Scholar]
  50. Joshi, N.R.; Sriprasong, T.; Asamoto, S.; Sancharoen, P. Time-Dependent Deformation of a Concrete Arch Dam in Thailand—Numerical Study on Effect of Alkali Silica Reaction on Deflection of Arch. J. Adv. Concr. Technol. 2021, 19, 181–195. [Google Scholar] [CrossRef] [Scilit]
  51. Kang, F.; Li, J.; Zhao, S.; Wang, Y. Structural health monitoring of concrete dams using long-term air temperature for thermal effect simulation. Eng. Struct. 2019, 180, 642–653. [Google Scholar] [CrossRef] [Scilit]
  52. Yuan, D.; Gu, C.; Qin, X.; Shao, C.; He, J. Performance-improved TSVR-based DHM model of super high arch dams using measured air temperature. Eng. Struct. 2021, 250, 113400. [Google Scholar] [CrossRef] [Scilit]
  53. Bui, K.A.; Sancharoen, P.; Tanapornraweekit, G.; Tangtermsirikul, S.; Nanakorn, P. An evaluation of thermal effects on behavior of a concrete arch dam. Songklanakarin J. Sci. Technol. 2019, 41, 1059–1068. [Google Scholar] [CrossRef]
  54. Amin, M.; Salamon, J.; Mazza, G.; Tosun, H.; Xu, B. Advances in Dam Engineering. Infrastructures 2020, 5, 39. [Google Scholar] [CrossRef] [Scilit]
  55. Hariri-Ardebili, M.A. Risk, Reliability, Resilience (R3) and beyond in dam engineering: A state-of-the-art review. Int. J. Disaster Risk Reduct. 2018, 31, 806–831. [Google Scholar] [CrossRef] [Scilit]
Figure 1. Number of dams by purpose [1].
Infrastructures 11 00086 g001
Figure 2. Visualization of a potential failure scenario through the consequential actions of contraction joint opening and horizontal cracks.
Infrastructures 11 00086 g002
Figure 3. The double-curvature thin concrete arch dam.
Infrastructures 11 00086 g003
Figure 4. SOLID 187 element.
Infrastructures 11 00086 g004
Figure 5. Meshing for the arch dam with rock.
Infrastructures 11 00086 g005
Figure 6. Refined meshing for the arch dam alone.
Infrastructures 11 00086 g006
Figure 7. Meshing for the rock.
Infrastructures 11 00086 g007
Figure 8. Minimum ambient temperature condition (Case 1).
Infrastructures 11 00086 g008
Figure 9. Maximum ambient temperature condition (Case 2).
Infrastructures 11 00086 g009
Figure 10. Minimum principal stress of crown cantilever with water level at FRL.
Infrastructures 11 00086 g010
Figure 11. Maximum principal stress of crown cantilever with water level at full reservoir level.
Infrastructures 11 00086 g011
Figure 12. Maximum deformation in flow direction (Case 1: minimum ambient temperature).
Infrastructures 11 00086 g012
Figure 13. Maximum principal stress (Case 1).
Infrastructures 11 00086 g013
Figure 14. Minimum principal stress (Case 1).
Infrastructures 11 00086 g014
Figure 15. Horizontal deformation of dam. The negative values shows that the maximum displacement is observed towards the reservoir direction (Case 2: maximum ambient temperature).
Infrastructures 11 00086 g015
Figure 16. Maximum principal stress (Case 2).
Infrastructures 11 00086 g016
Figure 17. Minimum principal stress (Case 2).
Infrastructures 11 00086 g017
Figure 18. (a) Dam monitoring results for pendulum observations of block 1 (crown cantilever) at the elevation +731.52 m (2400 ft.) above m.s.l., with reference to the ele. 537.05 m of the inverted pendulum. Positive values of radial deflection show movement towards reservoir direction, whereas negative pendulum readings denote movement (deflection) in the stream direction. The green lines shows the deflection of block 1 against the reservoir water levels in red. (b) Deflection of Block 1 through crest collimation survey monitoring. The reversing or stabilizing trend of deflections (orange line) against reservoir water levels (blue lines) after 2016 is obvious.
Infrastructures 11 00086 g018
Figure 19. Plan view of the arch dam with the respective positioning of the blocks (cantilevers).
Infrastructures 11 00086 g019
Figure 20. Crown cantilever (Block 1) with positioning of the three level galleries and inverted pendulum.
Infrastructures 11 00086 g020
Figure 21. Behavior of crown cantilever for the ambient temperature variation. Deflection of crown cantilever when temperature of dam surface is low is shown in orange lines, whereas for the maximum temperature case, it is in blue lines.
Infrastructures 11 00086 g021
Figure 22. Deflection of crown cantilever with respect to Er/Ec values for the maximum temperature case.
Infrastructures 11 00086 g022
Table 1. Thickness-based classification of arch dams.
Type of Arch DamUSBR
[15]
USACE Classification [14]
b/h 1tc/H 1tb/H 1tb/tc 1
Thin<0.20.025–0.050.09–0.252.90–5.00
Medium thick0.2 to 0.30.025–0.050.25–0.405.00–10.00
Thick>0.30.05–0.100.50–1.008.00–15.00
1 Note: b = thickness at the base of the crown cantilever; h = structural height of the dam; tc = crest thickness; tb = base thickness; and H = height. The USACE classification classifies the 2nd and 3rd rows as ‘Moderately Thin’ and ‘Thick gravity arch’, respectively.
Table 2. Properties of dam concrete. (As per the tests conducted on the field specimens—core samples—from the structure).
PropertyValue
1Volumetric Weight,
Dry density (g) (MN/m3)
0.0245
2Compressive strength(fc) (MPa)40
3Tensile strength (ft) (MPa)2.7
4Sustained modulus of Elasticity (Ec) (MPa)25,000
5Poisson ration (µ)0.2
6Thermal Conductivity(W/m °C)2.65
Table 3. Properties of canyon rock for the study.
PropertyValue
1Volumetric Weight, Dry density (g) (MN/m3) 0.025
2Sustained modulus of Elasticity (Er) (MPa)21,000
3Poisson ration (µ)0.2
4Thermal Conductivity (W/m °C)3.1
Table 4. Maximum dam deformation with varying water levels (when the dam is subjected to gravity and varying water loads but with no thermal loads).
Water Level (m)Deformation
Max (mm)
Deflection at Crest (mm)Remarks
1736.128.02327.965Dam top
2734.125.59325.551MWL
3732.423.92923.885FRL
4702.307.940−3.376At 0.8 h
5679.705.083−4.1332/3 h
6651.505.139−3.996At 0.5 h
Disclaimer/Publisher’s Note: The statements, opinions and data contained in all publications are solely those of the individual author(s) and contributor(s) and not of MDPI and/or the editor(s). MDPI and/or the editor(s) disclaim responsibility for any injury to people or property resulting from any ideas, methods, instructions or products referred to in the content.