Article

Star Type Wireless Sensor Network for Future Distributed Structural Health Monitoring Applications

School of Engineering and Computing Sciences, Durham University, Durham, DH1 3LE, UK
*
Author to whom correspondence should be addressed.
Inventions 2019, 4(1), 6; https://doi.org/10.3390/inventions4010006
Submission received: 31 December 2018 / Revised: 13 January 2019 / Accepted: 17 January 2019 / Published: 23 January 2019
(This article belongs to the Special Issue Structural Health Monitoring and Their Applications Across Industry)

Abstract

:
A star type wireless sensor network based on nine-axis micro-electromechanical inertial motion sensors with the potential to include up to 254 sensor nodes is presented, and an investigation into the mechanical and structural effects of bell ringing on bell towers is presented as a possible application. This low-power and low-cost system facilitates the continual monitoring of mechanical forces exerted by swinging bells on their support and thus helps avoid structural degradation and damage. Each sensor measures bell rotation, and a novel method utilising only the instantaneous rotational angle is implemented to calculate the force caused by bell ringing. In addition, a commonly used, however, previously experimentally unconfirmed assumption that allows great simplification of force calculations was also proven to be valid by correlating predicted theoretical values with measurement data. Forces produced by ringing a 1425 kg bell in Durham Cathedral were characterised and found to agree with literature. The sensor network will form the basis of a toolkit that provides a scalable turnkey method to determine the exact mechanisms that cause excessive vibration in mechanical and architectural structures, and has the potential to find further applications in low-frequency distributed structural health monitoring.

1. Introduction

The wireless sensor network presented was developed to facilitate the continual real-time monitoring of the movement of bell towers due to bell ringing. Such movements could lead to cracks in the tower [1] and in extreme cases the destruction of the tower [2]. The tower considered is part of Durham Cathedral which is a UNESCO world heritage site. In Durham Cathedral, English full circle ringing style is practised where the bells are rung in patterns and rotate through an angle of slightly greater than 360°. Bell ringing causes the tower to sway with such magnitude that it is felt by the ringers in the bell chamber making it extremely difficult to keep the correct ringing times. In cases, tower movements can be so excessive that bells had to be hung dead meaning that they are no longer allowed to swing [3]. A typical bell, such as the one shown in Figure 1, is mounted in a robust steel frame and has a large wooden wheel attached to it. It is rung by pulling a rope that is attached to the circumference of the wheel and hangs down into a chamber underneath where the ringers are.
Investigating the interaction between the forces produced by ringing bells and their support is of paramount importance to ensure that regular ringing does not cause significant degradation to the tower jeopardising its structural integrity and safety. Once the mechanisms of tower movement are properly understood and characterised, steps can be taken to alleviate the effects, for example, by avoiding potentially damaging ringing patterns or reconfiguring the bell arrangement. A logical approach to investigate this relationship is to measure the forces produced by each bell and then correlate them with the back and forth, and the left and right sway of the tower. The forces exerted by a particular rotating bell on the bell frame can be shown to depend on only its angle of rotation as described in Section 1.1. However, it should be noted that the forces from each bell can couple or add together to produce a greater effect.
The chosen nine-axis sensor system can measure the angular rotation of each bell in the tower within ±4° during an hour-long sample time, and due to its 4.4 × 4.4 × 8.0 cm size, it could be conveniently installed on the wooden bell wheel. The large and complex motion and the close spacing of the bell structures called for a self-powered wireless solution that also enabled real-time data monitoring. Further details of the sensor system are described in Section 2.

1.1. Bell Theory

In 1913, a set of equations describing the forces produced by a bell rung in the English style as a function of angle were proposed [2,4]. In 1976, Heyman and Threlfall verified the equations experimentally [5]. The vertical force, FV, and horizontal force, FH, exerted by a bell on the frame in N are given by their respective equations
F V = m g c ( 1 c c + 3 c o s 2 ( θ ) 2 p c o s ( θ ) )
F H = m g c s i n ( θ ) ( 3 cos ( θ ) 2 p )
where m is the mass of the bell in kg, g is the acceleration due to gravity in m/s2, c is the dimensionless inertial form factor of the bell described by Equation (3), θ is the angle of the bell in radians and p is a dimensionless parameter described by Equation (4) that takes into account any initial velocity the bell may have and its dwell position. The inertial form factor of a bell is given by
c = h 2 h 2 + k 2
where h is the distance between the fixed point about which the bell rotates and its centroid of mass in m and k is the radius of gyration of the bell in m. The parameter p that takes into account initial velocity is given by
p = cos ( α ) + ω α τ 2 2 8 π 2   ( 4 )
where α is the angle of the bell relative to the vertical axis in its mouth-up or dwell position in radians as seen in the simplified diagram of a bell and bell wheel in Figure 2, ωα is the small angular velocity provided by the ringer that displaces it from this position in radians/s and τ is the period of small oscillation of the bell in s. It can be assumed that p = 1 providing that ωα is negligible. This assumption is verified in Section 3.3. The parameter c required to calculate the forces can be determined by taking simple measurements of the bell in situ described in [5].

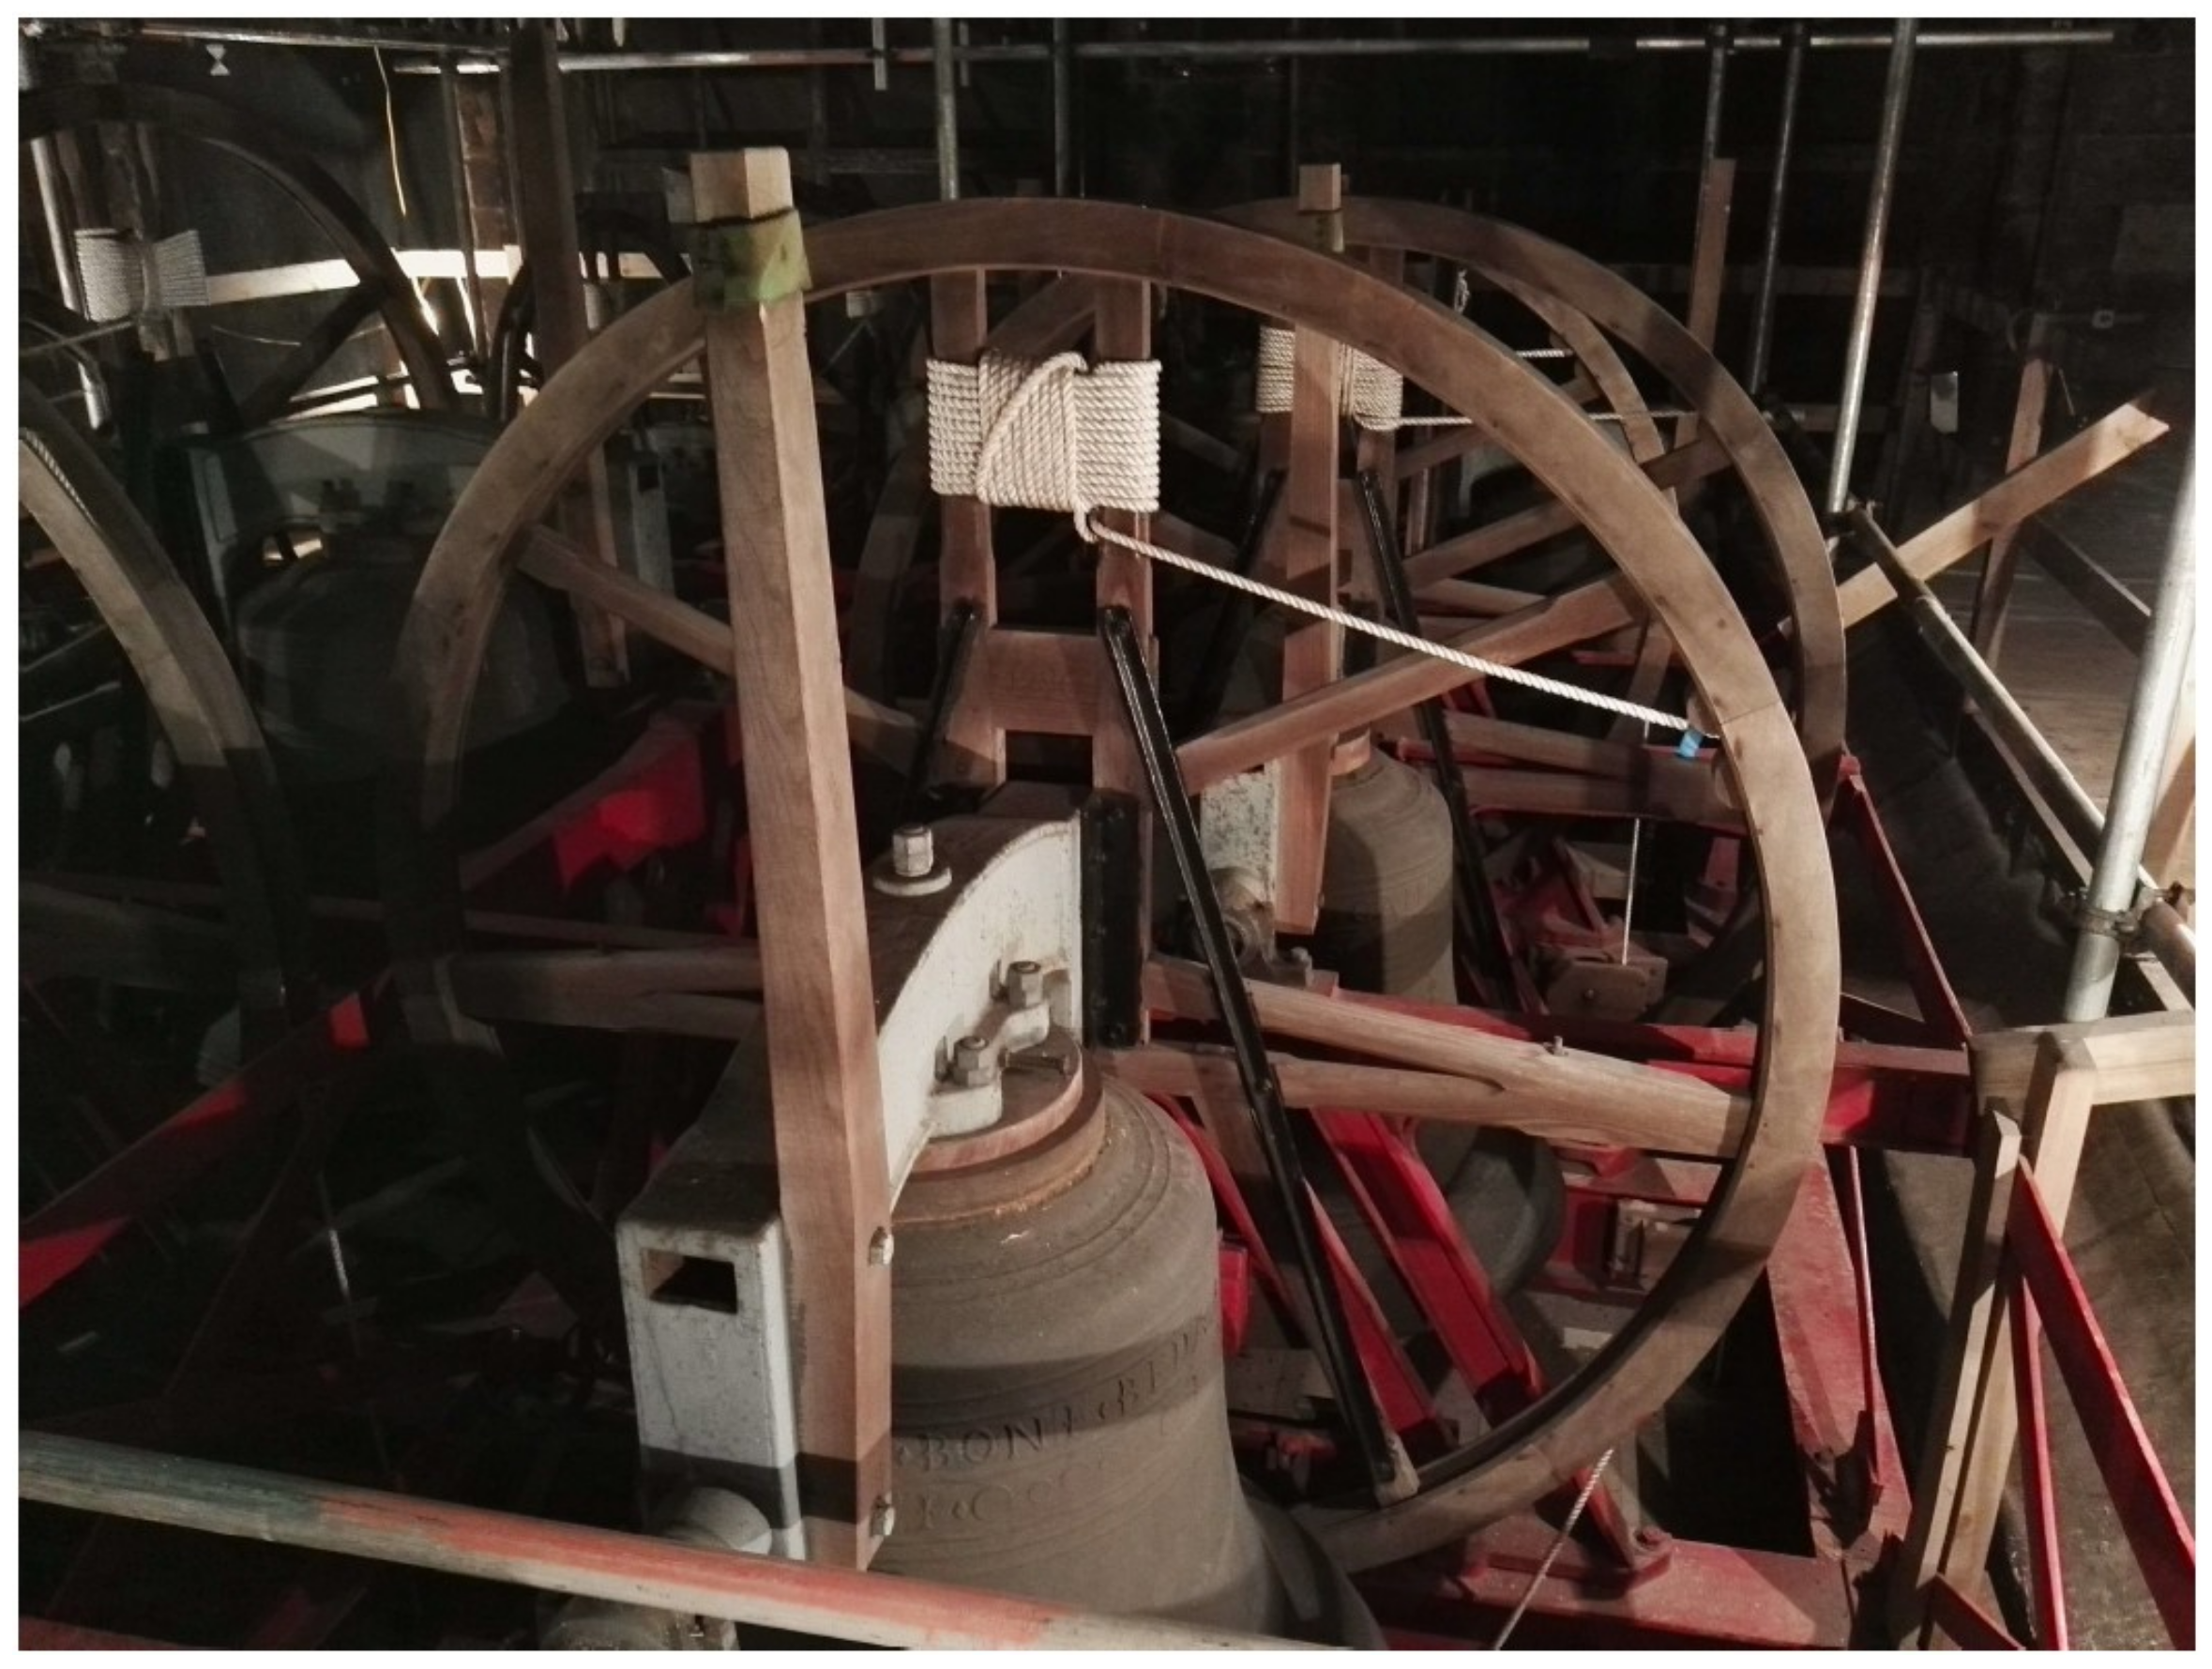
1.2. Durham Cathedral

Durham Cathedral tower displayed movement due to bell ringing and was ideal for the authors to measure for several reasons. First, there were ten bells in a frame 60 m above the foundation level [6], and such a large mass swinging at such a height produced measurable tower displacements on the order of 0.43 mm. The frame was constructed from structural steel fixed into the masonry of the tower, which was the most effective frame arrangement to minimise tower vibrations according to [2], and the MEMS sensors coupled with a low-frequency accelerometer for displacement monitoring could validate the effectiveness of this arrangement in terms of minimising vibrations. The bells are hung in either a N–S or an E–W orientation and the mass of the largest bell is 1425 kg. The maximum horizontal and vertical forces produced by the bells when rung individually using the procedure described in [5] are available in [6]. The velocities in the N–S and E–W directions were measured using high-sensitivity low-frequency geophones (velocity transducers) with a pen trace, and the maximum velocity recorded was 3.5 mm/s at the ringing chamber whilst ringing rounds one to ten. Using this velocity and an approximate equation, the maximum N–S and E–W displacements were estimated to be 0.43 mm and 0.31 mm, respectively. The maximum base stress was found to be 0.07 MPa assuming simple cantilever bending [6]. These values were the largest recorded but not necessarily the maximum that occurred during ringing. The investigation only included the ringing of one of the many different patterns that the bells were rung in. Each pattern produced forces that varied differently with time and therefore different tower displacements. The natural frequencies of the tower movement were measured to be 1.28 Hz E–W and 1.31 Hz N–S with a damping ratio of 0.016 [6].
Attempts by other authors were made to build finite element models of the tower but the results included inaccuracies between 10% and 50% [6]. The large difference between the measured and the computed values was due to the simplifications used in the model. For example, while the walls were made of sandstone with a rubble infill, they were modelled as solid and therefore their Young’s modulus had to be approximated. The finite element models did not capture the dynamics of the tower due to the underlying assumptions about the materials. The assumption that the angle of the bells as a function of time exactly followed the theoretical curves in [6] led to further inaccuracies that would have not been present if these angles were measured experimentally. This highlighted the need for experimental work to fully characterise the dynamics of towers.

1.3. Motivation for Experimental Work

Attempts to understand the tower movement through finite element models were unsuccessful not due to the lack of computational power but due to the difficulty of properly modelling the problem as seen in Section 1.2. It is clear that experimental work is required to capture the real dynamics of the tower and the bells. An experimental investigation into the link between forces from bell ringing and tower movement had never been attempted. In previous experimental studies, for example, in a study of 19 bell towers in the North East of England, there was no correlation found between the maximum displacement of bell towers due to ringing and the tower height [7]. Instead, the maximum displacement of the tower depended upon its natural frequency [7]. Slender towers tend to bend to produce displacement at the top of the tower; however, shorter towers could rock in their foundations to produce equally large displacements [7]. This further indicates that experimental work is required to assess whether the movement of any given tower can be considered safe. The gained insight into the interaction of bell forces that cause the movement could be used to establish criteria for bell tower safety. Currently, the ratio of maximum sway to tower height is accepted as the most effective measure of the safety of tower motion [8]; however, this criterion is somewhat arbitrary. A value under 200 × 10−6 was deemed acceptable, and it was generally agreed that bell ringers would be reluctant to use a tower if the acceleration in the ringing chamber was greater than 50 mm/s2 [8]. Nonetheless, the primary cause of movement was not addressed in [8] underlining the need for further experimental work.
In addition to understanding the tower dynamics, measuring the natural frequencies of bell towers regularly could help identify structural damages. A definite sign of damage occurring in a bell tower was the decrease of the natural frequency of the tower vibration between two annual measurements [1].
Total ringing time also has a large influence on the tower motion [9]; therefore, it would be advantageous to measure an entire session and review the data to see the oscillation build up over time. Large oscillations have the potential to develop during long sessions because in the English style, bells are rung in precise repeating patterns known as methods [2]. This effect is not observed in Continental Europe where the bells are rung in a random fashion [10]. It has been proven that the third harmonic is the most significant for the system used in Continental Europe [11]. In English full circle ringing, the contribution of the higher harmonics becomes much more significant, which means that simulations or experimental work are required to investigate the interaction of the bells [9]. Simulations of bell towers are problematic, because as previously mentioned, it is extremely difficult to develop an accurate model because of the simplifications and assumptions made about the building materials. Experimental measurements in the field, on the other hand, give valuable and inherently more valid insight into the causes of tower movements and lead to suggestions about how to reduce them, and the sensor network described in this work makes these measurements possible.

2. Materials and Methods

2.1. Networking Protocol and Hardware Selection

Little literature concerning the development of a wireless sensor network capable of measuring angular rotation has been published. There is, however, an extensive catalogue of work concerning the use of accelerometers, both wireless and wired for structural health monitoring [12,13,14]. For example, a wireless accelerometer network of Oracle Sun SPOT sensors has been used to assess the structural health of a wind turbine [13]. A device specifically for measuring bell angular rotation has never been developed. The sensor must be wireless as it would be physically attached to a rotating bell wheel in its application. Sending the data via infrared was ruled out because the dusty bell tower environment would have made such communication unreliable. A previous project attempting to solve the same problem with optical sensors proved too impractical to use for research. Group special mobile (GSM), now known as global system for mobile communication, was considered as a potential method of sending data but was deemed to be unsuitable due to the charges incurred for sending data and the need for network coverage. The system had to be able to communicate in any environment regardless of GSM network availability, and a local wireless network satisfied this requirement.

2.1.1. Wireless Networking Protocol

Wi-Fi, Zigbee—an IEEE 802.15.4 based specification, Bluetooth, and Bluetooth low energy (BLE) were considered as potential networking protocols for the system. The comparison can be seen in Table 1. Durham Cathedral has ten bells, and since one sensor is required for each bell, a networking protocol that can support at least ten nodes is required. The requirement on the data rate is based on a network with one computer to collect the data and 254 sensor nodes where each node sends five 32 bit floats at a rate of 100 Hz. The distance requirement is based on the size of the bell frame. The distances in Table 1 are specified for an open environment, since the devices would be operating in an enclosed environment their range would be reduced significantly [15]. From Table 1, it is clear that Wi-Fi is the only protocol that meets the requirements for this application.

2.1.2. Communication Protocol

With multiple devices sampling data and streaming it back to a computer, there is an unavoidable bottleneck at the receiving port, and a protocol that minimises the effect of the bottleneck is required. The user datagram protocol (UDP) and transmission control protocol (TCP) are the most commonly used protocols with many other protocols being based on them [17]. Table 2 comparing the two protocols shows that the UDP packet header is less than half the size of TCP’s, which means that UDP packets can be transmitted with less overhead. Both UDP and TCP perform error checking that allows them to detect and discard damaged packets, but UDP generally has higher speed. If a packet is dropped, TCP will attempt to recover the packet by requesting that the original sender attempts to send the packet again. This can significantly slow down data transfer via TCP, and hence TCP is marked as low speed in Table 2. UDP does not attempt recovery, the receiving device is unaware of any unreceived packets. In this application large amounts of data are being collected and the occasional loss of a single data point has no significance, UDP is found to be more suitable, especially because slowing down of TCP due to attempting to recover lost packets becomes worse as the number of the sensor nodes in the network increases.

2.1.3. System on Chip and Supporting Hardware

Vast amounts of similar development boards are available on the market and comparison of suitable boards can be seen in Table 3. Devices produced by Mbed were ruled out because there was a lack of good quality documentation and information for their microcontroller boards at the time of writing. Available documentation and the potential for manufacturing custom integrated sensor boards in the future were the driving factors behind the choice of microcontroller board. The BCM2835, the core chip of the Raspberry Pi was difficult to purchase in quantities smaller than 100; however, a system including the ATWINC1500 chip would not have this issue and could easily be translated to a custom printed circuit board (PCB). This would significantly reduce the costs with minimum added design time. The combination of all these factors meant that the Arduino MKR1000 offered the best trade-off between cost and development time whilst also future proofing the manufacture of the device as a commercial product.

2.1.4. Inertial Measurement Unit (IMU)

The three digital inertial measurement units that are considered in this work along with their primary characteristics are listed in Table 4. Each unit contained a three-axis accelerometer and gyroscope. The MPU-9250 also featured a magnetometer making it a nine-axis device. Devices that did not contain a gyroscope were not considered as it was unwieldy to use an accelerometer alone to determine angular rotation unless it was on the axis of rotation, which in this case was not feasible. The two MPU devices featured an internal Digital Motion Processor™ (DMP) capable of calculating quaternions which made them significantly more advanced than the ST LSM9DS1 as quaternions can be used to calculate the Euler angles (pitch, roll, and yaw) that can be used to determine the orientation of an object, in this application, a bell wheel in space. Both MPU devices had identical sensitivity and DMP update rate, and supported the same communication protocols. The nine-axis MPU-9250 was selected over the MPU-6050 because the latter was a six-axis device that was not recommended for new designs as it would soon be discontinued.

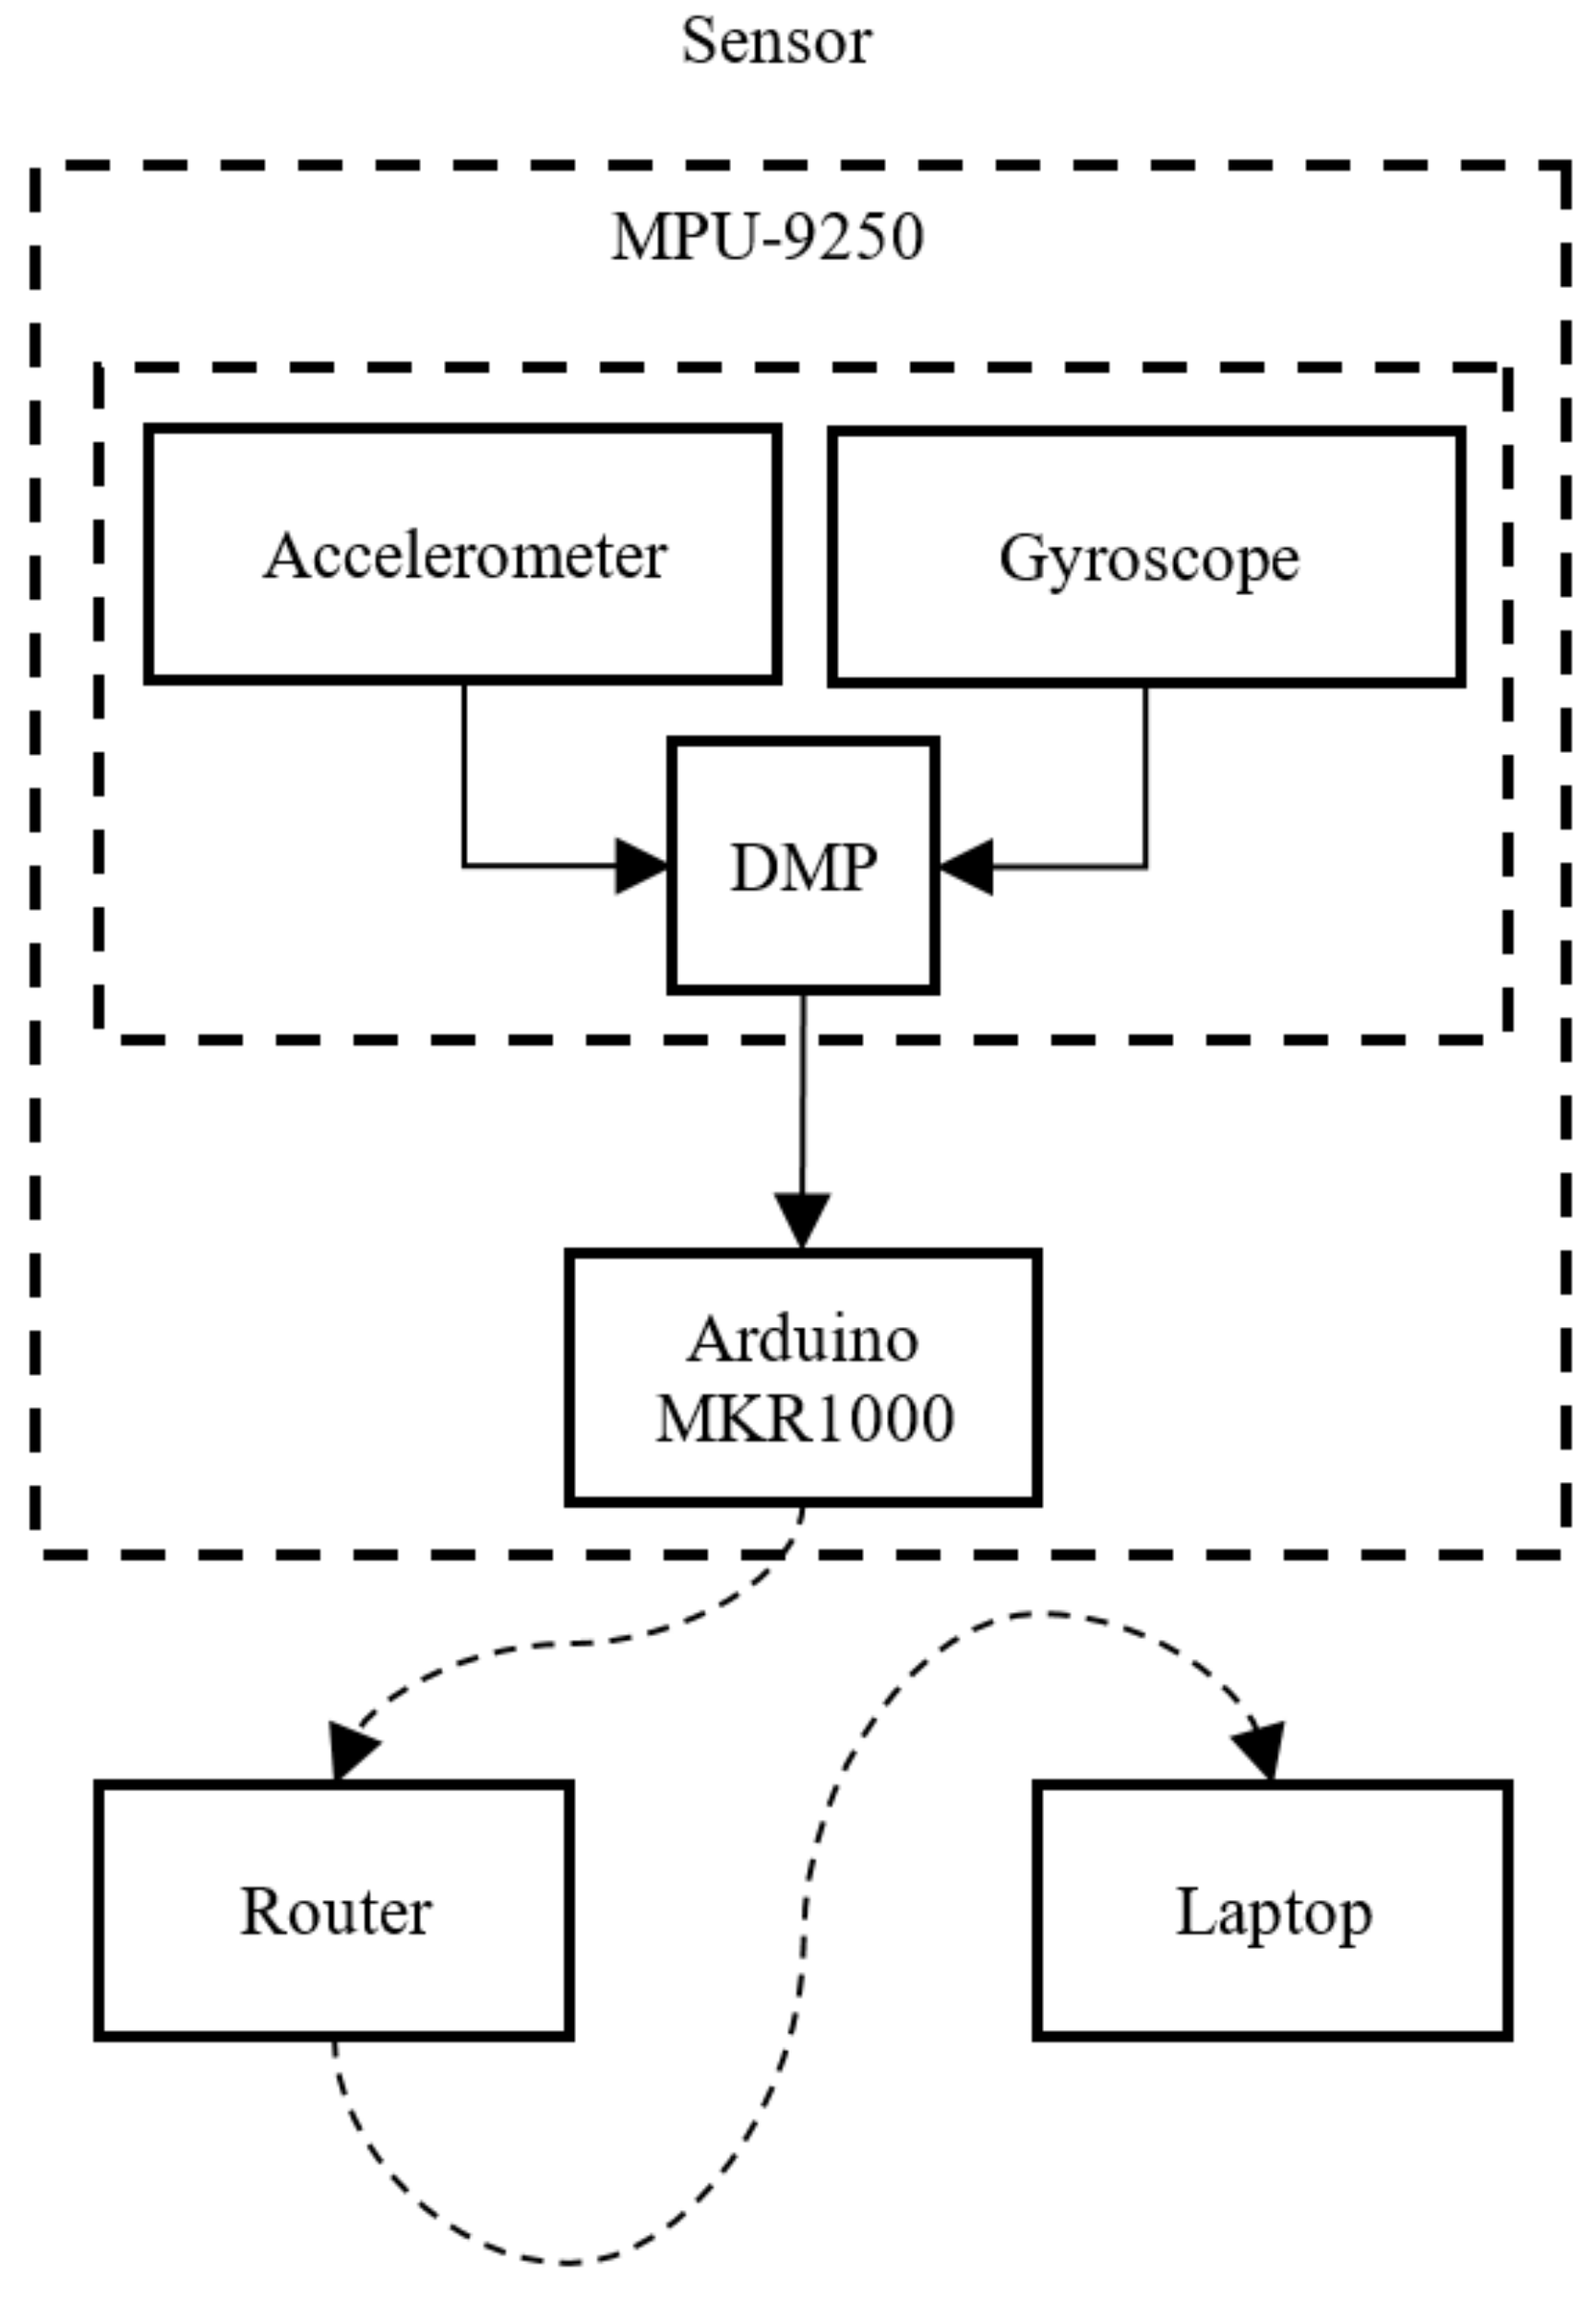
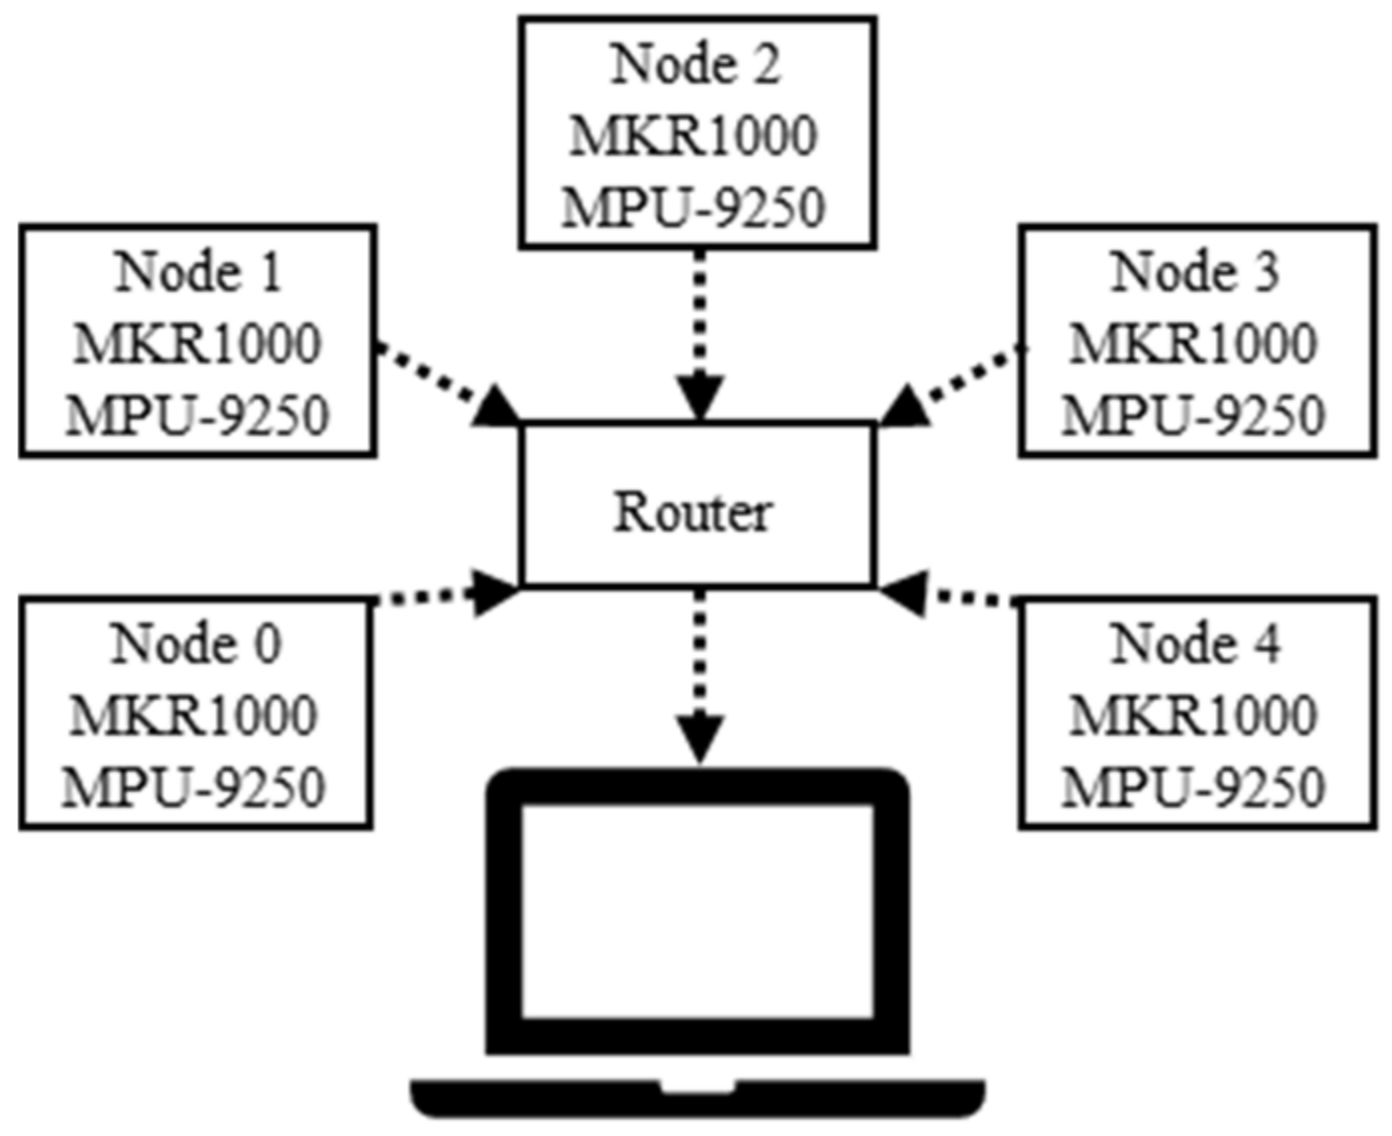
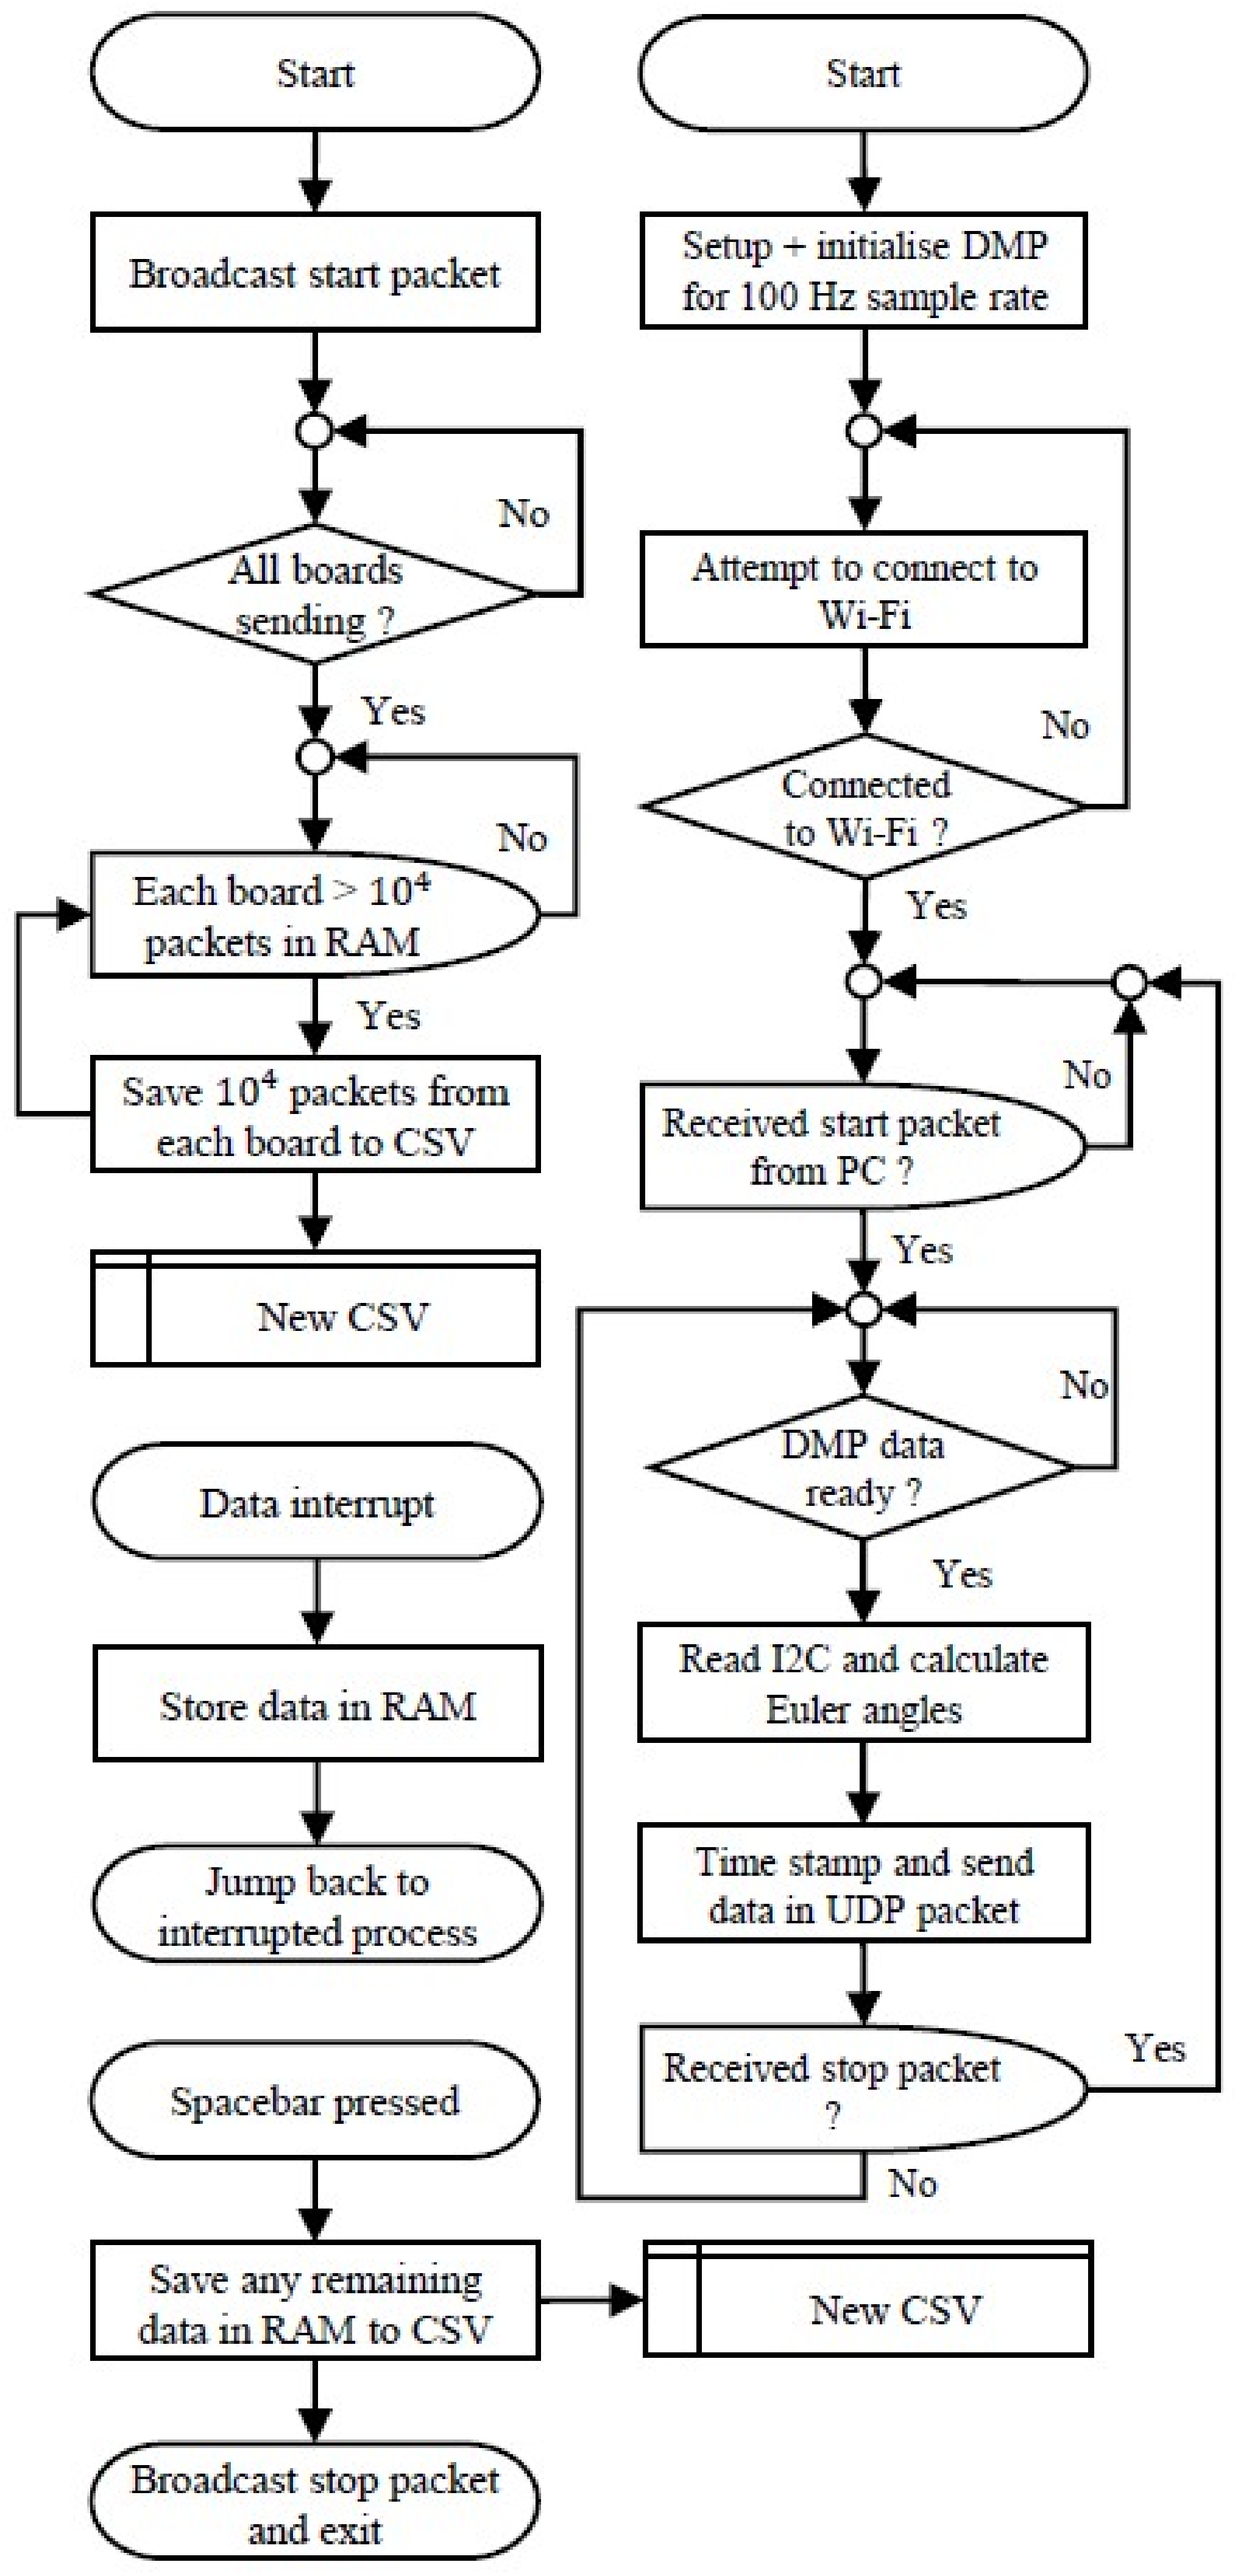
2.2. System Description

A system capable of accurate rotational angle measurements of bell wheels and wireless streaming of time-stamped angle data is presented in this work, and the design choices for its implementation are detailed in Section 2.1. The schematic block diagram including data flow directions can be seen in Figure 3, only one sensor is shown to avoid clutter. In reality, five nodes were included in the star configuration as seen in Figure 4. A sensor node, pictured in Figure 5, comprised of an Arduino MKR1000 board for wireless communication and an InvenSense MPU-9250 MotionTracking™ device for measuring angular rotation. The Digital Motion Processor™ (DMP) within the MPU-9250 sampled data from the embedded accelerometer and gyroscope. The data was calibrated using factory trim values and a temperature compensated sensitivity scale factor from an embedded temperature sensor. The accelerometer and gyroscope used low-pass filters at an appropriate frequency to avoid aliasing. The DMP then calculated quaternions that were capable of describing three-axis rotation and translation in three-dimensional space and wrote them to the inter-integrated circuit (I2C) bus at a rate of 100 Hz. The Arduino MKR1000 read the I2C bus, time-stamped each quaternion, and then converted the quaternions to the Euler angle roll using the equation from [34]. The roll angle was selected to measure the rotation of the bell because its drift was an order of magnitude less than that of yaw. The time-stamped angles were then sent wirelessly to a computer via a router in data packets. The packets were filtered at the receiving computer using a unique identification number for each board. The MPU-9250 was controlled using the Open-source MPU-9250 DMP library downloaded from SparkFun [35].
The computer that receives the packets runs Java code in the Processing integrated development environment (IDE). A flow diagram describing the function of the Arduino and Java codes can be seen in Figure 6. The system also sent x-, y- and z-axis accelerometer data which were not used in this experiment, and were left out of the initial description for clarity. There were two interrupt processes in the Java code, one to enable sampling to continue whilst writing to files and another to allow sampling to be stopped at any time. Connecting more sensors was as simple as uploading the Arduino code to a new sensor and giving it a unique identification number. The unique identification number allowed the Java code to determine from which sensor a data packet came when it arrived at the computer. The system was designed such that there were no hard-coded internet protocol (IP) addresses, therefore allowing it to work on any IEEE 802.11 (Wi-Fi) network. The Java program saved the data in a comma separated value (CSV) files each containing 10,000 samples which could be read into MATLAB for analysis.

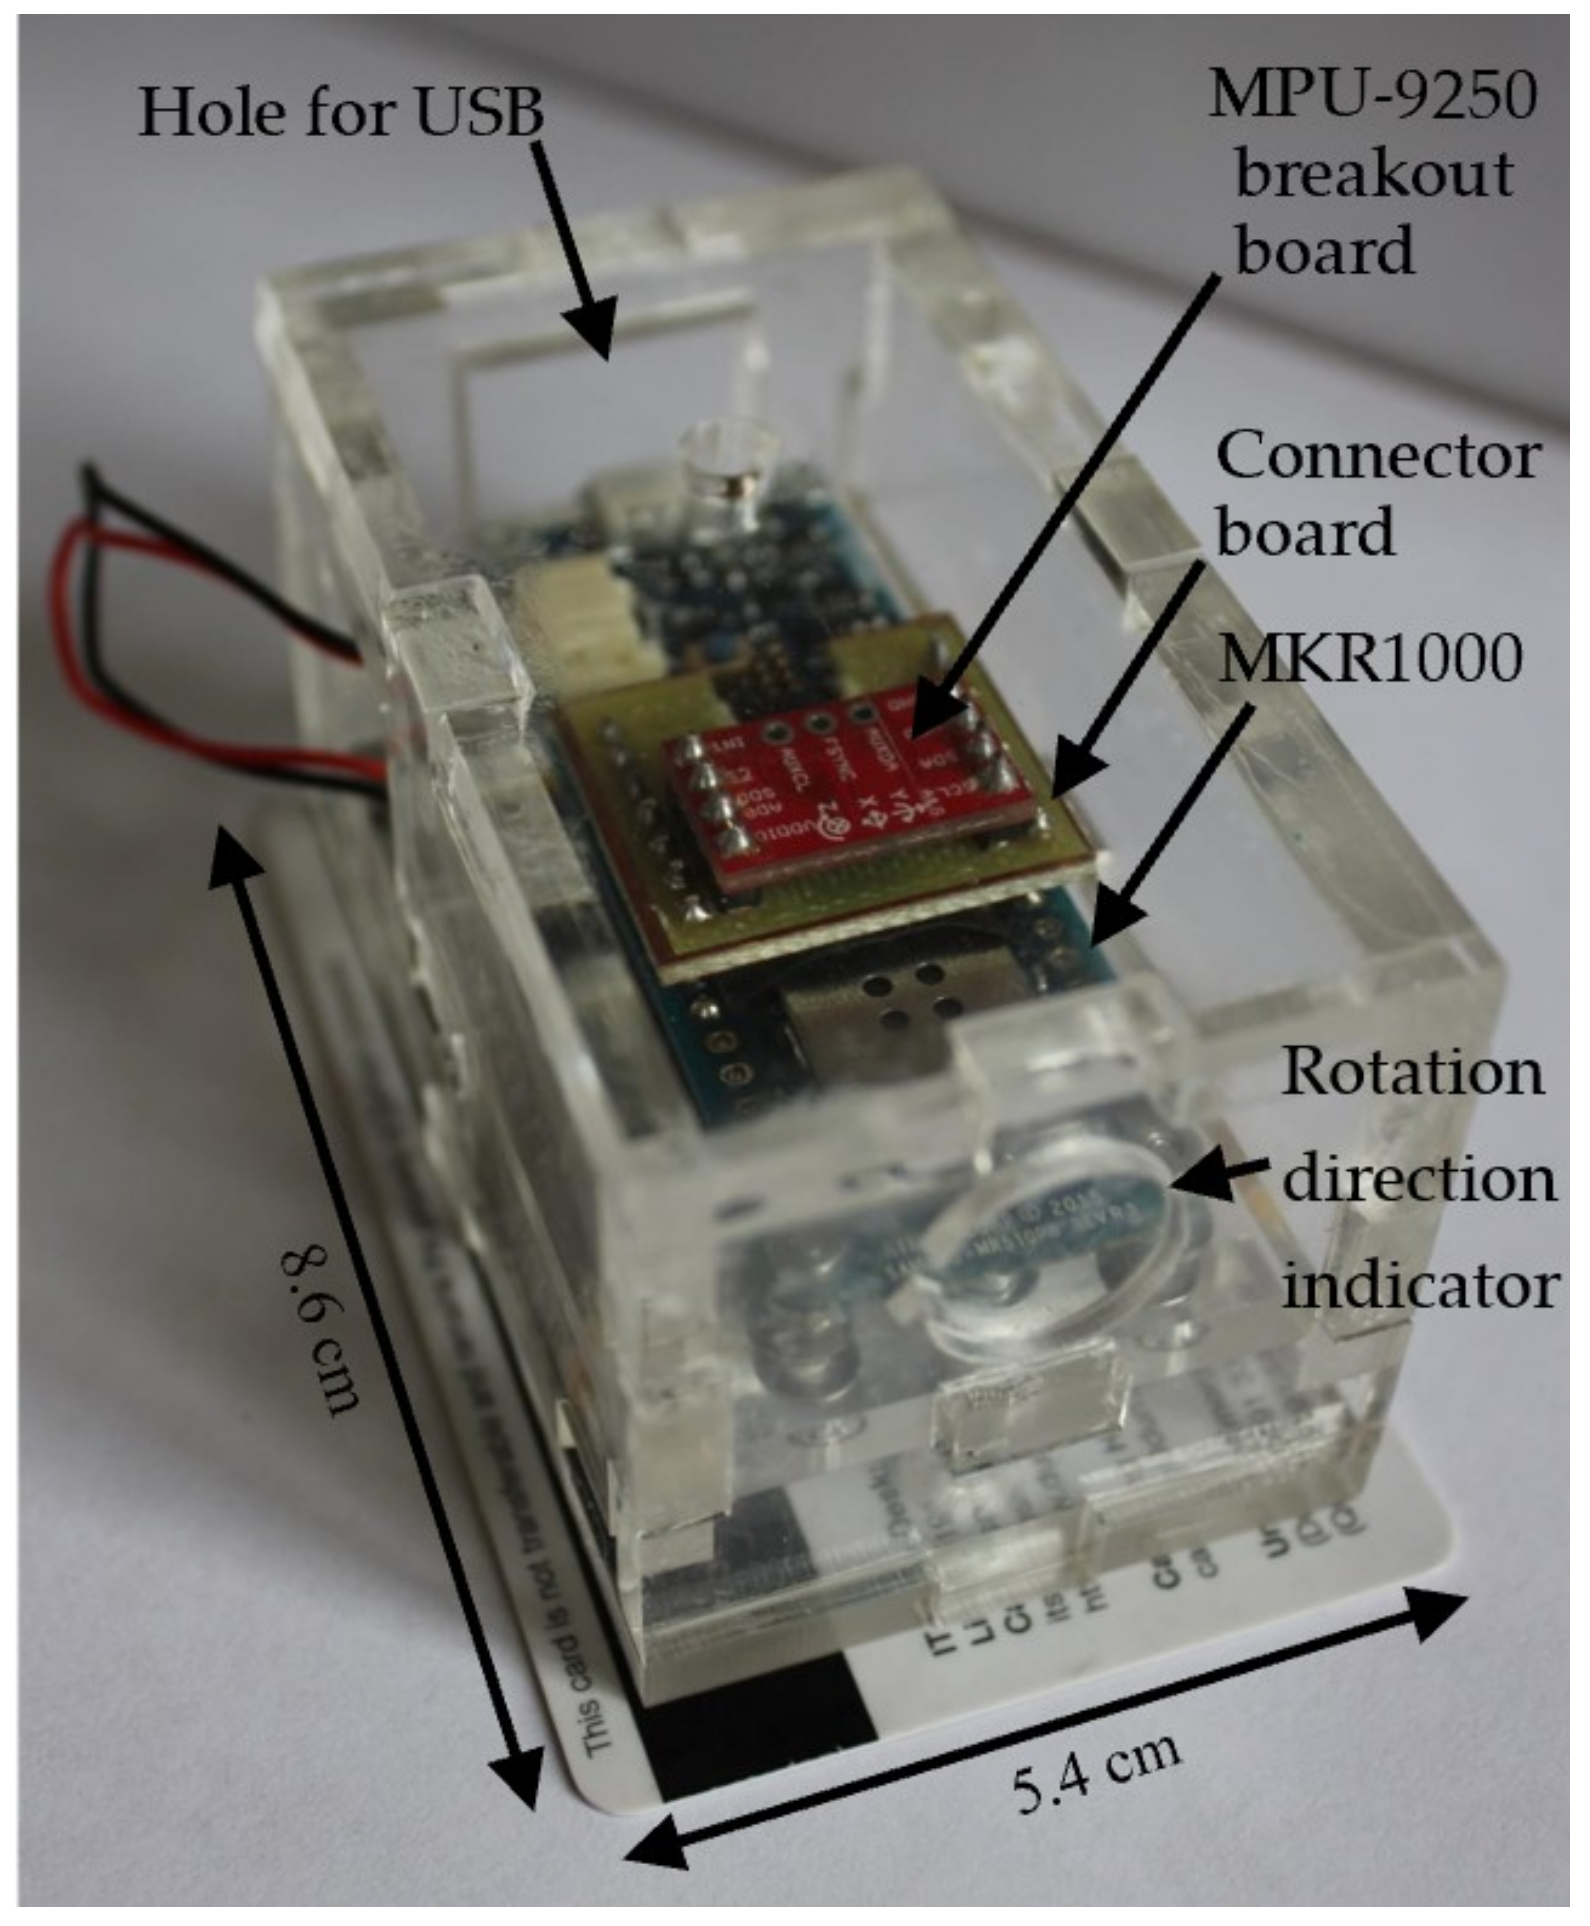
2.2.1. Sensor Description

A labelled photograph of a sensor node can be seen in Figure 5. The case underside features a removable bottom plate with countersunk bolts so that the lithium-polymer battery can be replaced. There are two holes either side of the case so that the device can be quickly and securely attached to the bell wheel with a Velcro strap. The yellow printed circuit board (PCB) acts as a vibration proof soldered interface between the Arduino and the MPU-9250 breakout board.
The accelerometer in the DMP can be set to have ±2, 4, 8 and 16 g ranges with a maximum sensitivity of 61 µg. The gyroscope can be set to have ±250, 500, 1000 and 2000°/s ranges with a maximum sensitivity of 7.196‘’/s. The drift was measured to be 0.927° per hour with a typical noise magnitude of 0.0785°, which was more than sufficient for the application. The maximum shock acceleration the device can take is 10,000 g [36]. The power source is the limit for the application but each node has a battery life of approximately ten hours, which is sufficient given that a peal usually takes around three hours [37]. A peal is the maximum amount of time that the bells are ever rung for. Removing the devices to charge them was not an issue as they had to be removed after data collection as the cathedral staff considered them to be a fire risk. A peal is the longest duration of any ringing activity in a tower. The battery is automatically charged when the board is plugged in with the micro universal serial bus (USB).

2.3. Verification of Data Integrity

Recording the swinging of a pendulum made of a 30-cm-long, 0.1-cm-thick, and 6-cm-wide plastic beam, an object of known parameter and predictable motion, the accuracy of the angle measurements and the reliability of data transmission were assessed.

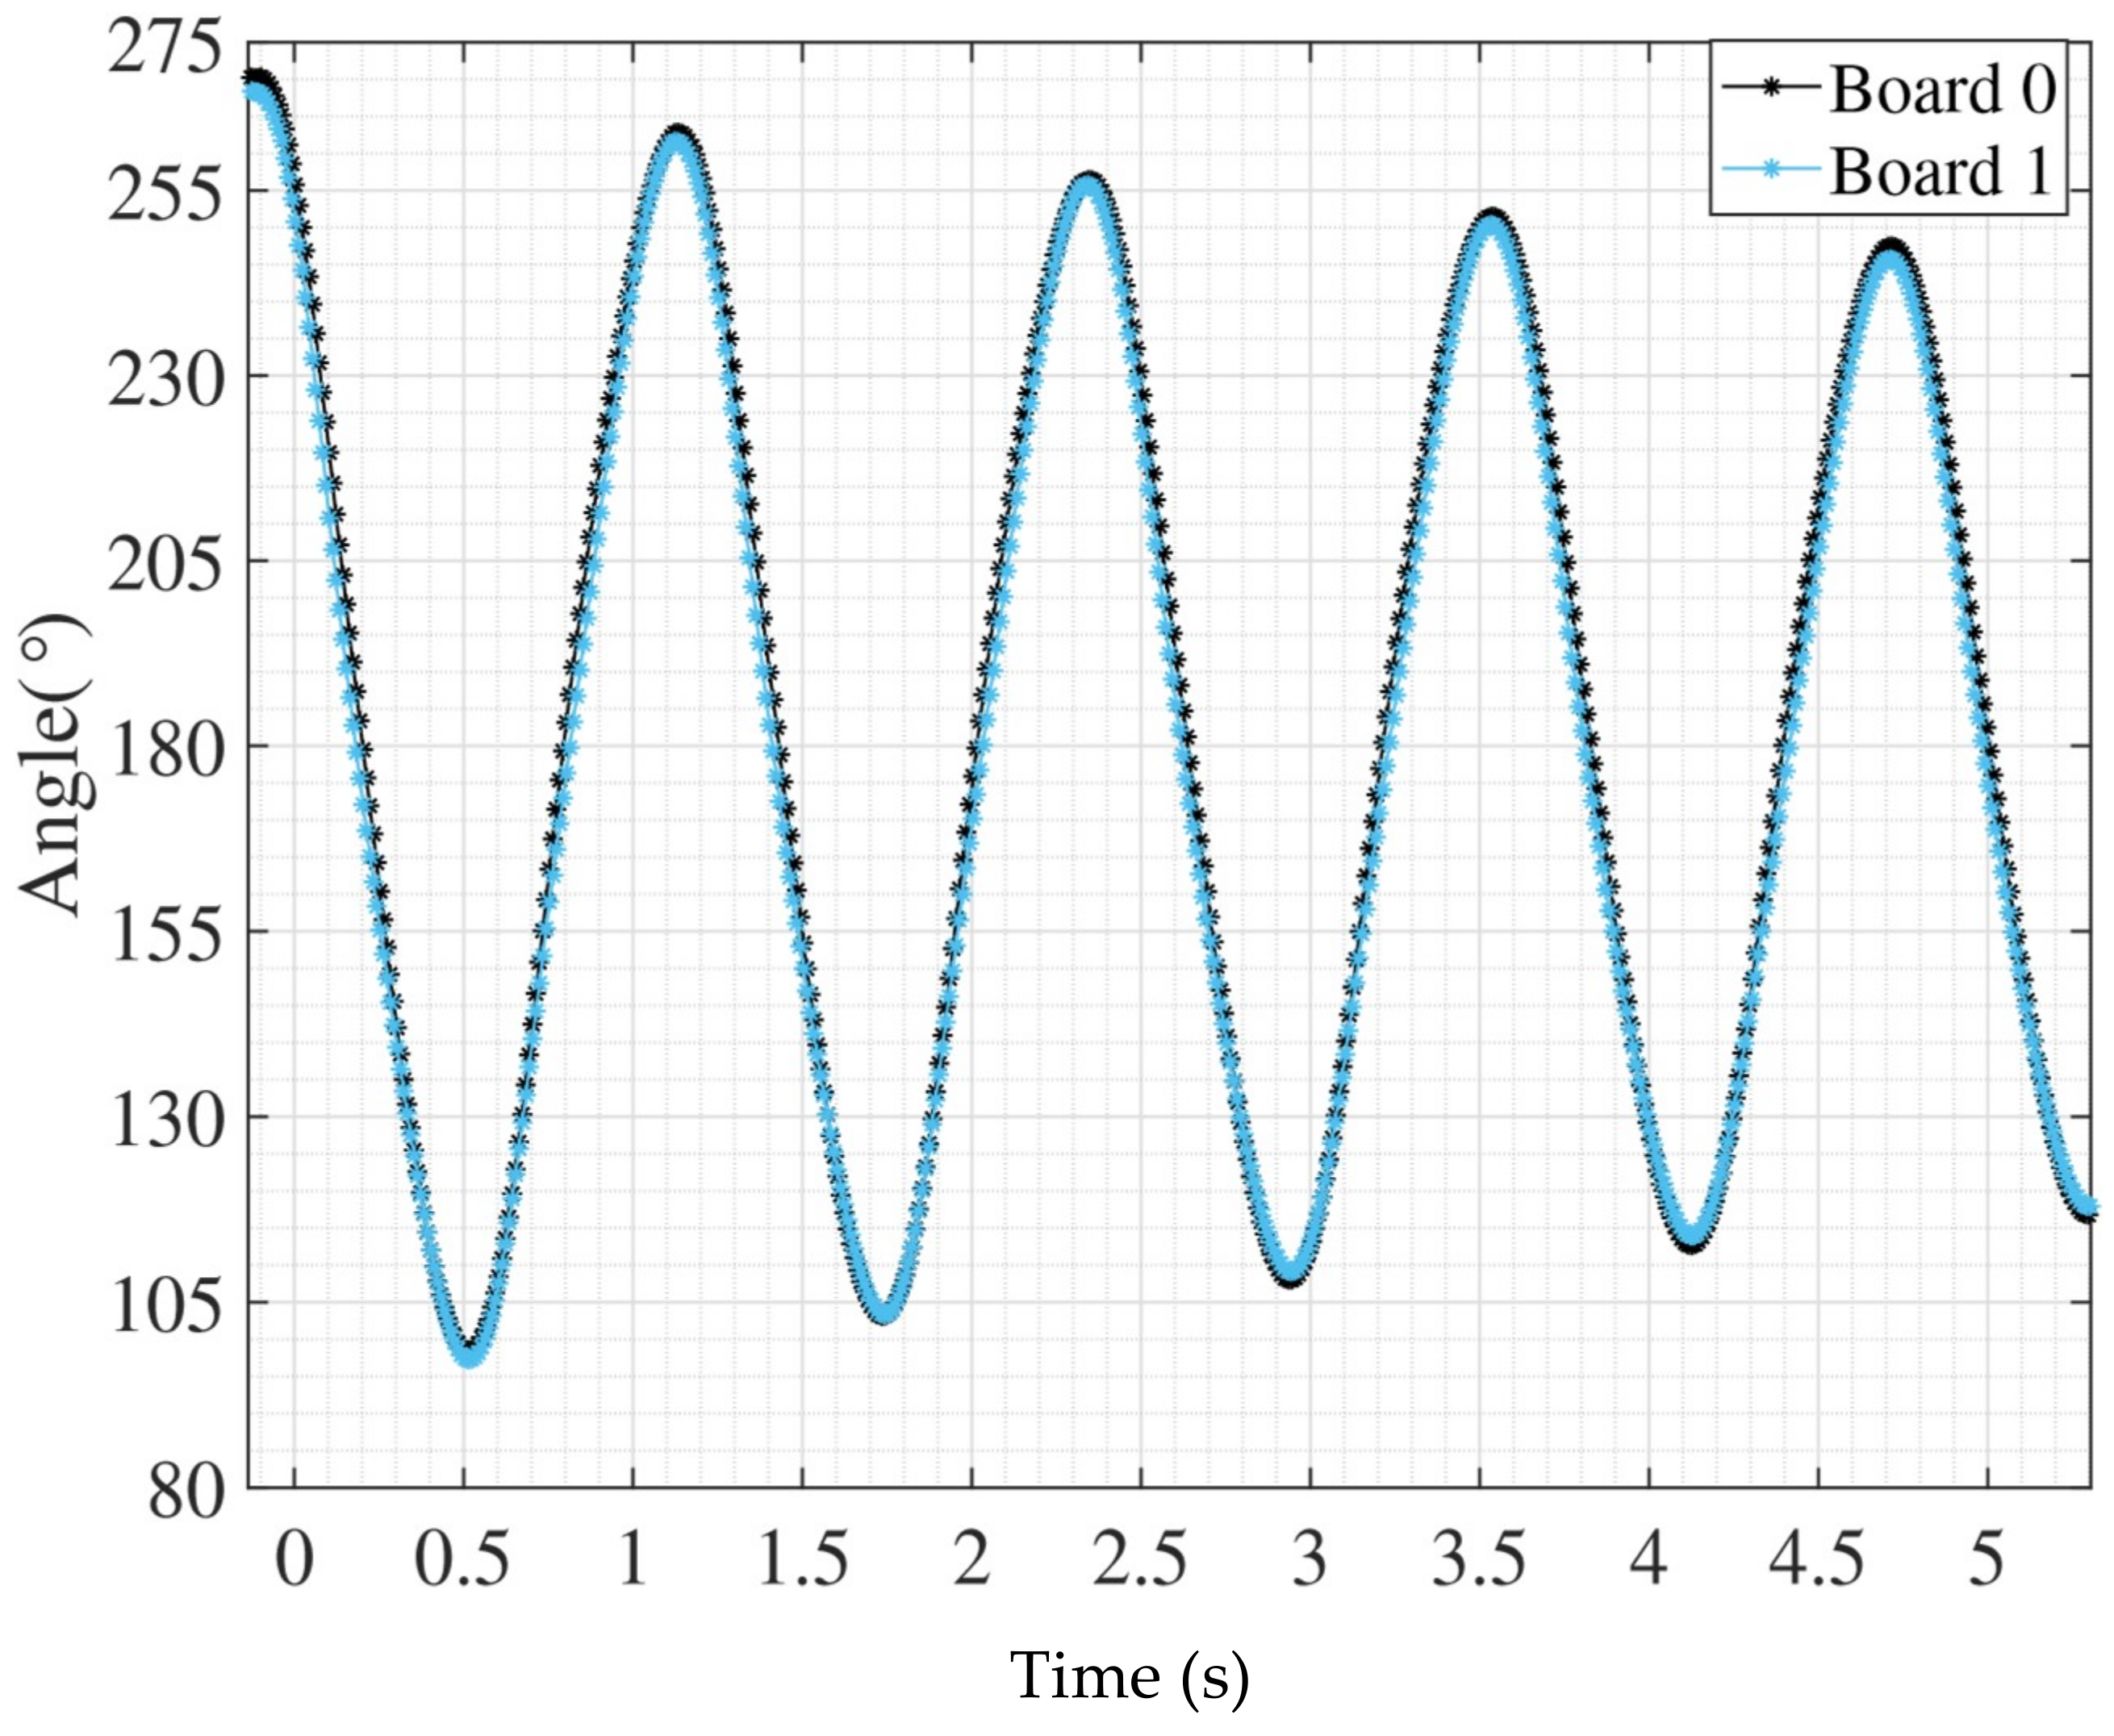
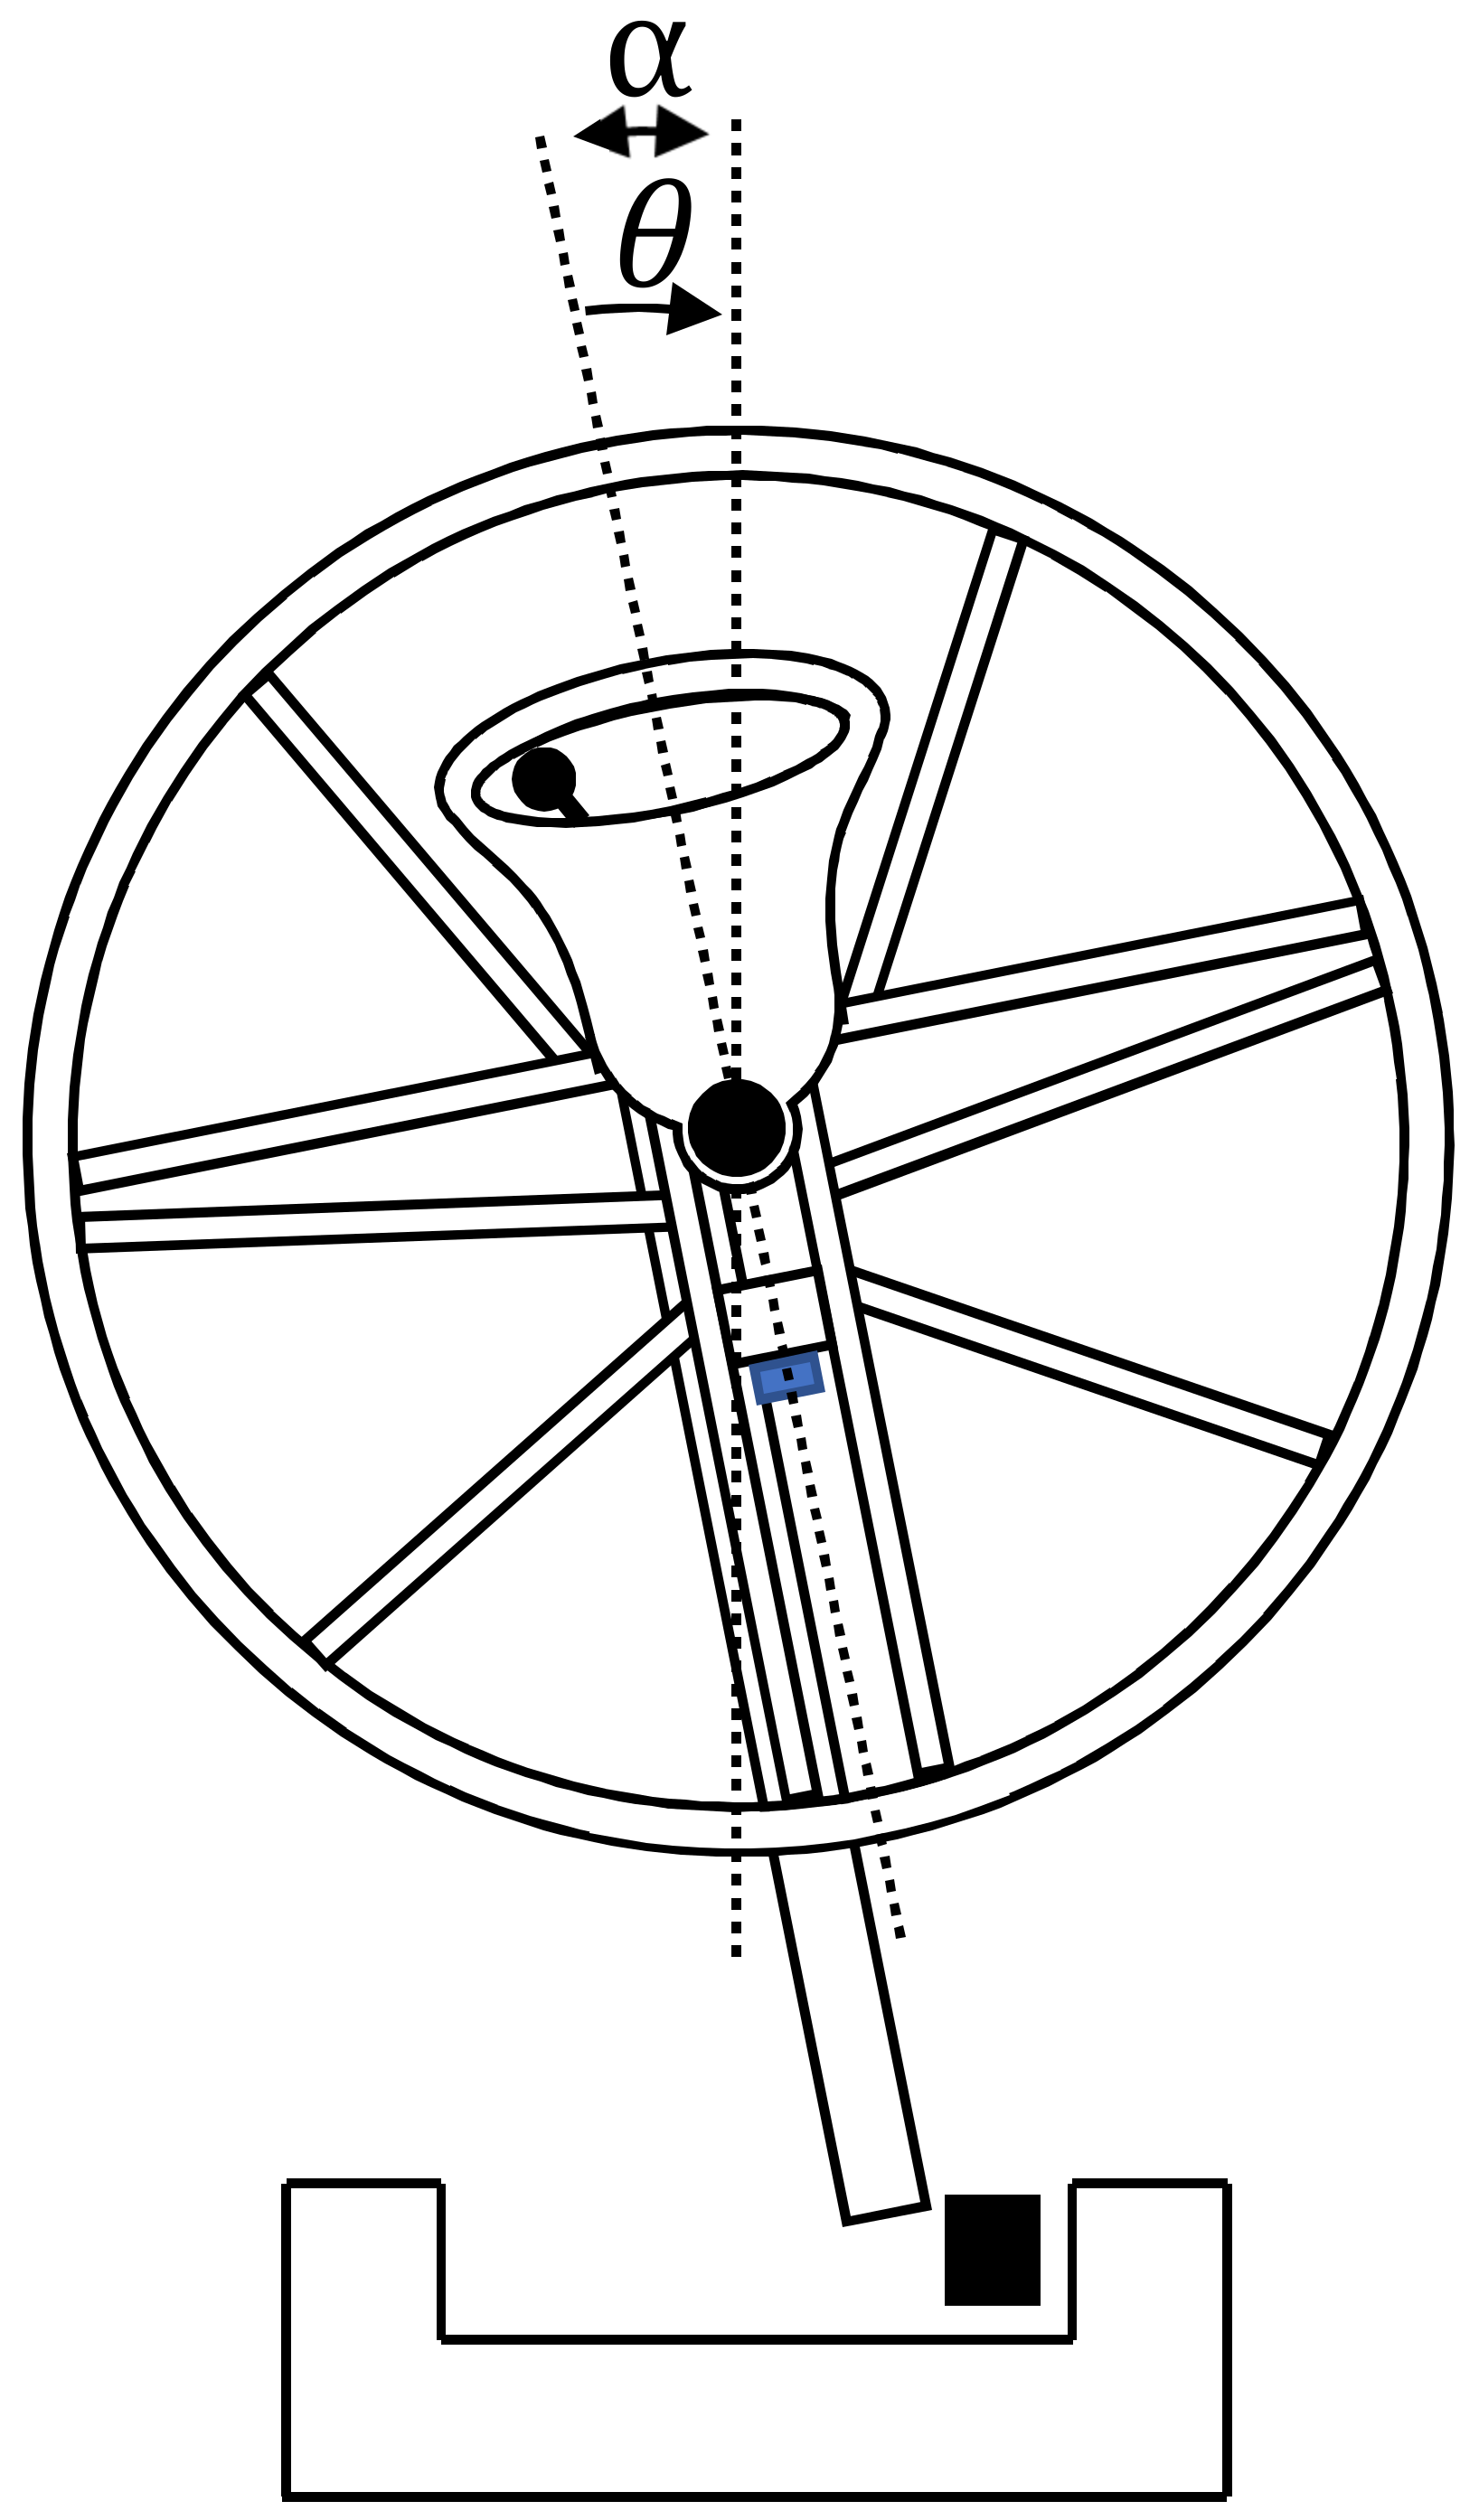
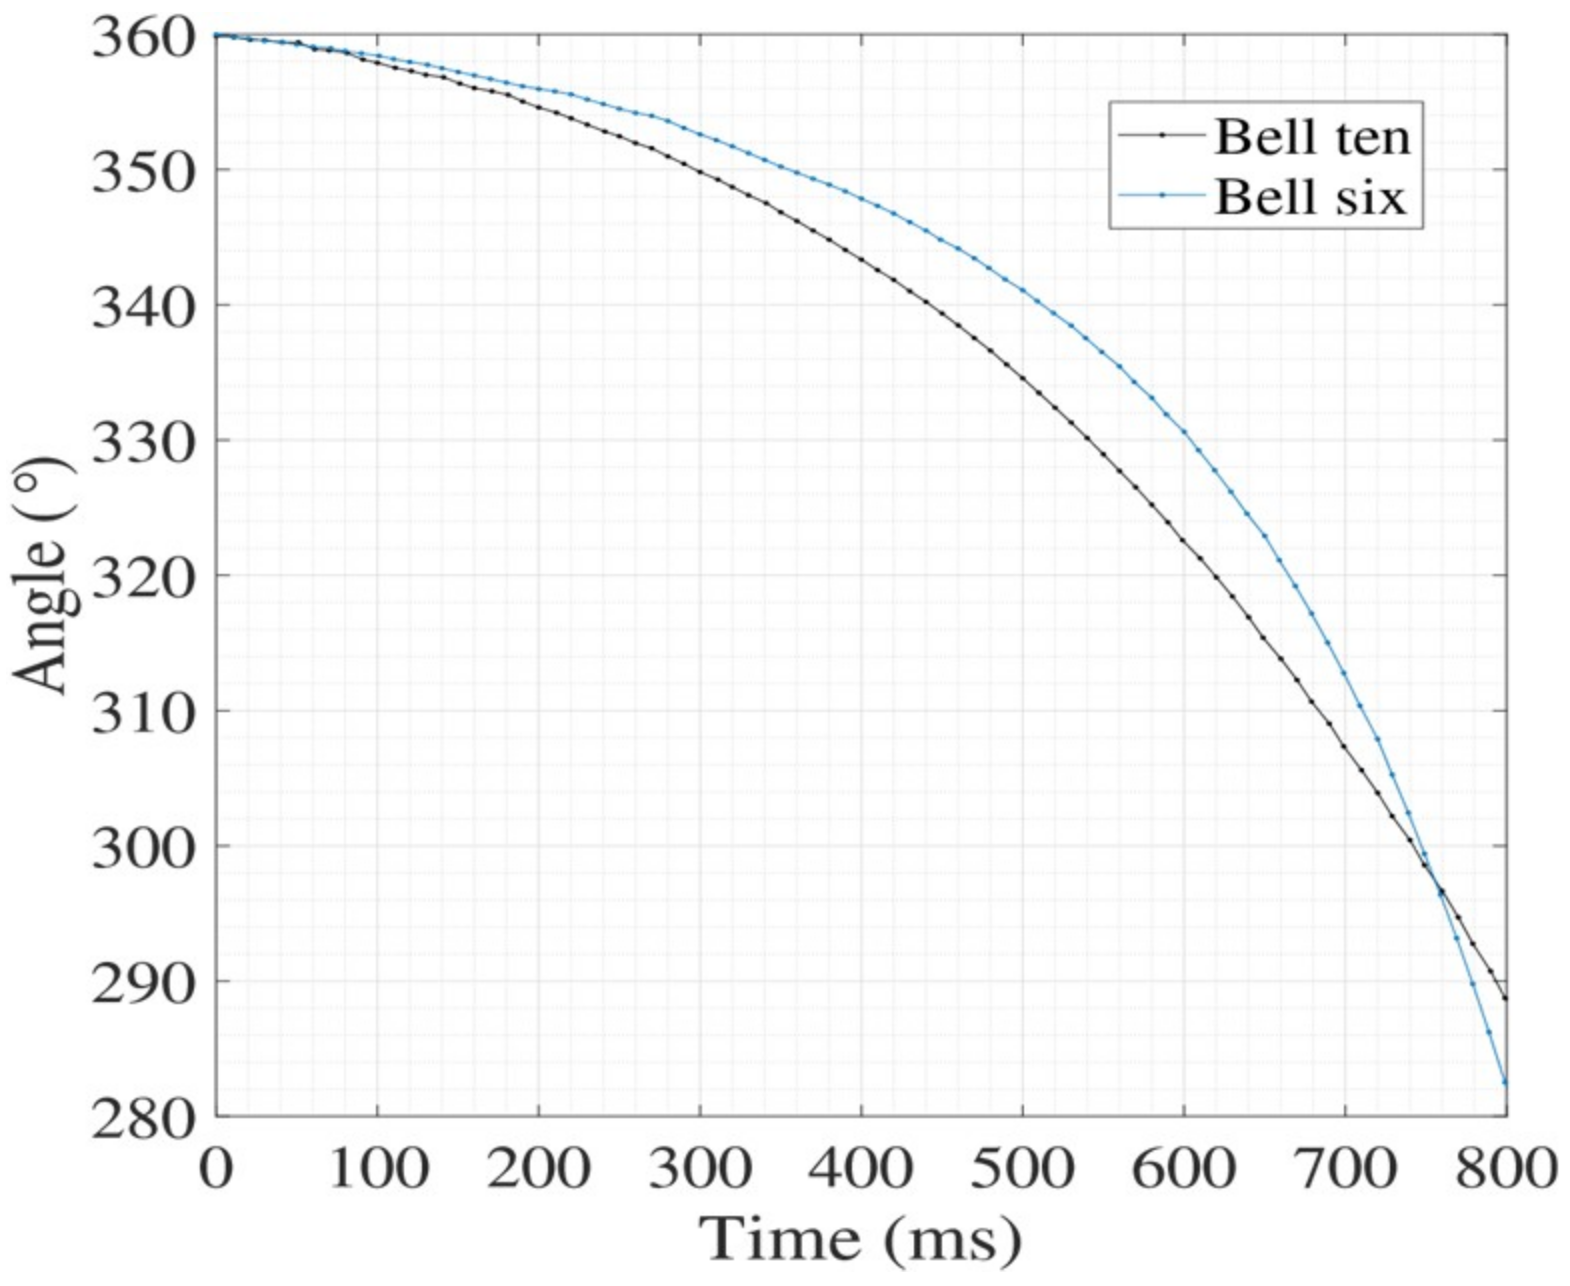
2.3.1. Angle Measurement Reliability

Two sensors were attached securely to the pendulum and a protractor that could be read to a precision of ±1° was used to determine the displaced position. The sensor readings at the initial rest position (180°) were recorded, and the pendulum was rotated by 90° to 270°, and the sensor readings were recorded again. Then the pendulum was released and allowed to oscillate until it came to rest. This was repeated for an hour. The final rest and displaced position was then recorded for both sensors. This one-hour measurement was repeated three times and the results were then averaged and used to calculate the data presented in Section 3.2.

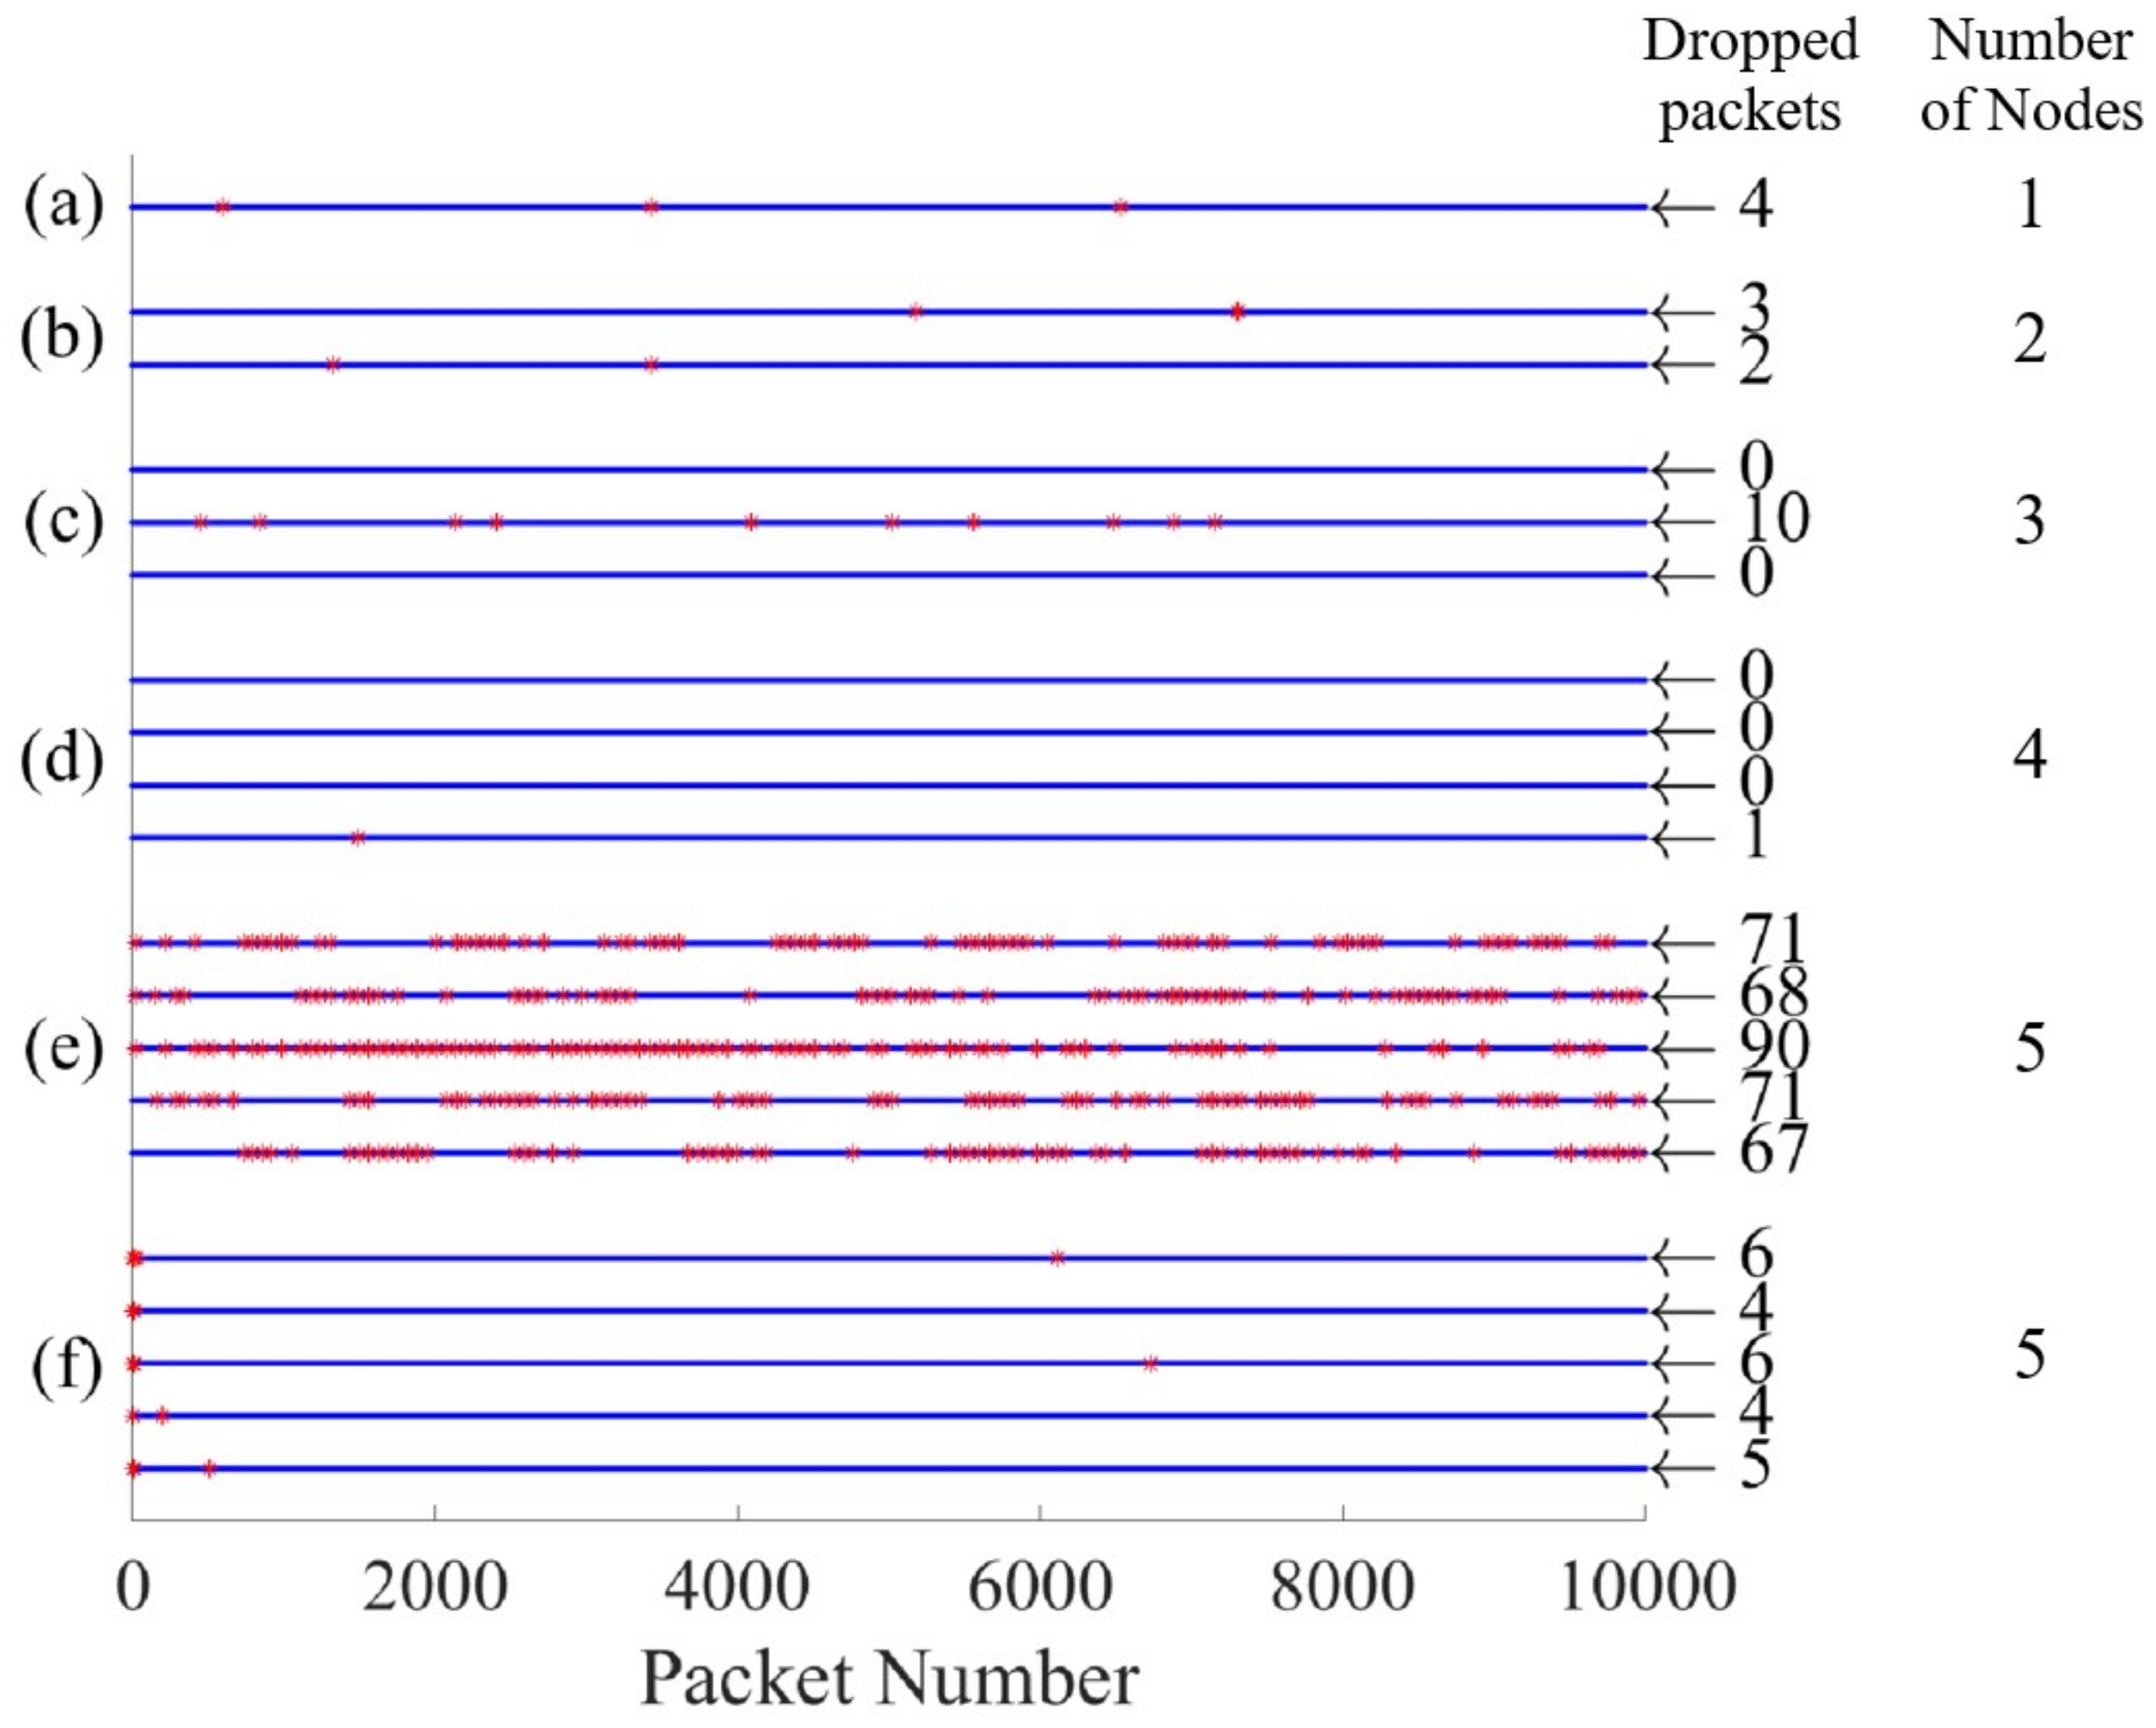
2.3.2. Dropped Packets

Each board was set up to send 10,000 packets upon receiving the start packet and then stop sending. Because each packet was assigned a time-stamp, it was possible to track lost packets and identify any pattern of data loss. A high rate of dropped packets (e.g., >1%) would adversely affect the accuracy of the angle measurements, and a pattern of dropped packets would indicate a flaw in the system. The verification of the reliability of data transfer was crucial because the implemented transmission protocol, UDP, did not guarantee delivery of every packet. This experiment was conducted with two routers—a Google Nexus 6 Plus phone and then an O2 wireless box IV. A varying number of sensor boards were placed 1 m apart with their PCB antennas pointing towards the router, which was 1 m from the first board.

2.4. Field Work in Durham Cathedral

A five-sensor network was field tested in Durham Cathedral with an O2 wireless box IV router and a Microsoft Surface Pro 4 tablet computer. The lightest five bells were measured simultaneously for a one and a half hour ringing practice during which the Durham Bell Ringing Society rang various methods on the bells. The procedure was repeated for the heaviest five bells the next day. During both tests, the sensors were securely fixed to the bell wheels in the position shown in Figure 2. On the second occasion, the temperature in the bell chamber was below 0 °C and the computer became too cold and powered off, but the data was not lost as it was automatically saved to a CSV file every 100 s.

3. Results

3.1. Data Transfer Rate and Quality

A key parameter determining the accuracy and resolution of the sensor network is its data transfer rate and quality. Bell angle data is sent from each sensor node as packets, and a measure of data transfer quality is the number of lost packets. The distribution of the lost packets, measured by sending a set number of packets at a set data rate for different sensor node arrangements, is shown in Figure 7, with each line representing an individual node. Plots a–e show how data transfer quality varies as the number of simultaneously transmitting nodes increases from 1 to 5 when a Google Nexus 6 Plus mobile phone is used as a router. The more than 1 order of magnitude increase in packet loss for five sensor nodes indicated that the capacity of the phone was reached. This was confirmed by repeating the experiment with an O2 wireless box IV router, shown in plot f, and observing the same minimal packet loss as in plots a–d. Table 5 shows that the packet loss rate is ≥0.05% independent of the number of boards as long as data transfer rate is within the maximum capacity of the router. No pattern emerged in the lost packet distribution indicating that packets were lost due to random variations in noise from external sources.

3.2. Angle Data Reliability

The drift and the offset of the MEMS accelerometers were characterised using two identical sensor boards mounted on a pendulum and sampled for 60 min. The average drift values of the two boards were 0.161° and 0.904°, and the maximum drift found in any individual test was 1.037°. The two boards were found to have an average offset of 3.494° at the start of the tests, which increased to 3.655° at the end of the tests. The offset was explained by the inaccuracy of mounting the MPU9250 onto the board and the board onto the case, and the offset increased with time due to drift. These values were well within the range that was required for the application. The experimental setup used is described in Section 2.3.1. Typical data from the experiment can be seen in Figure 8.

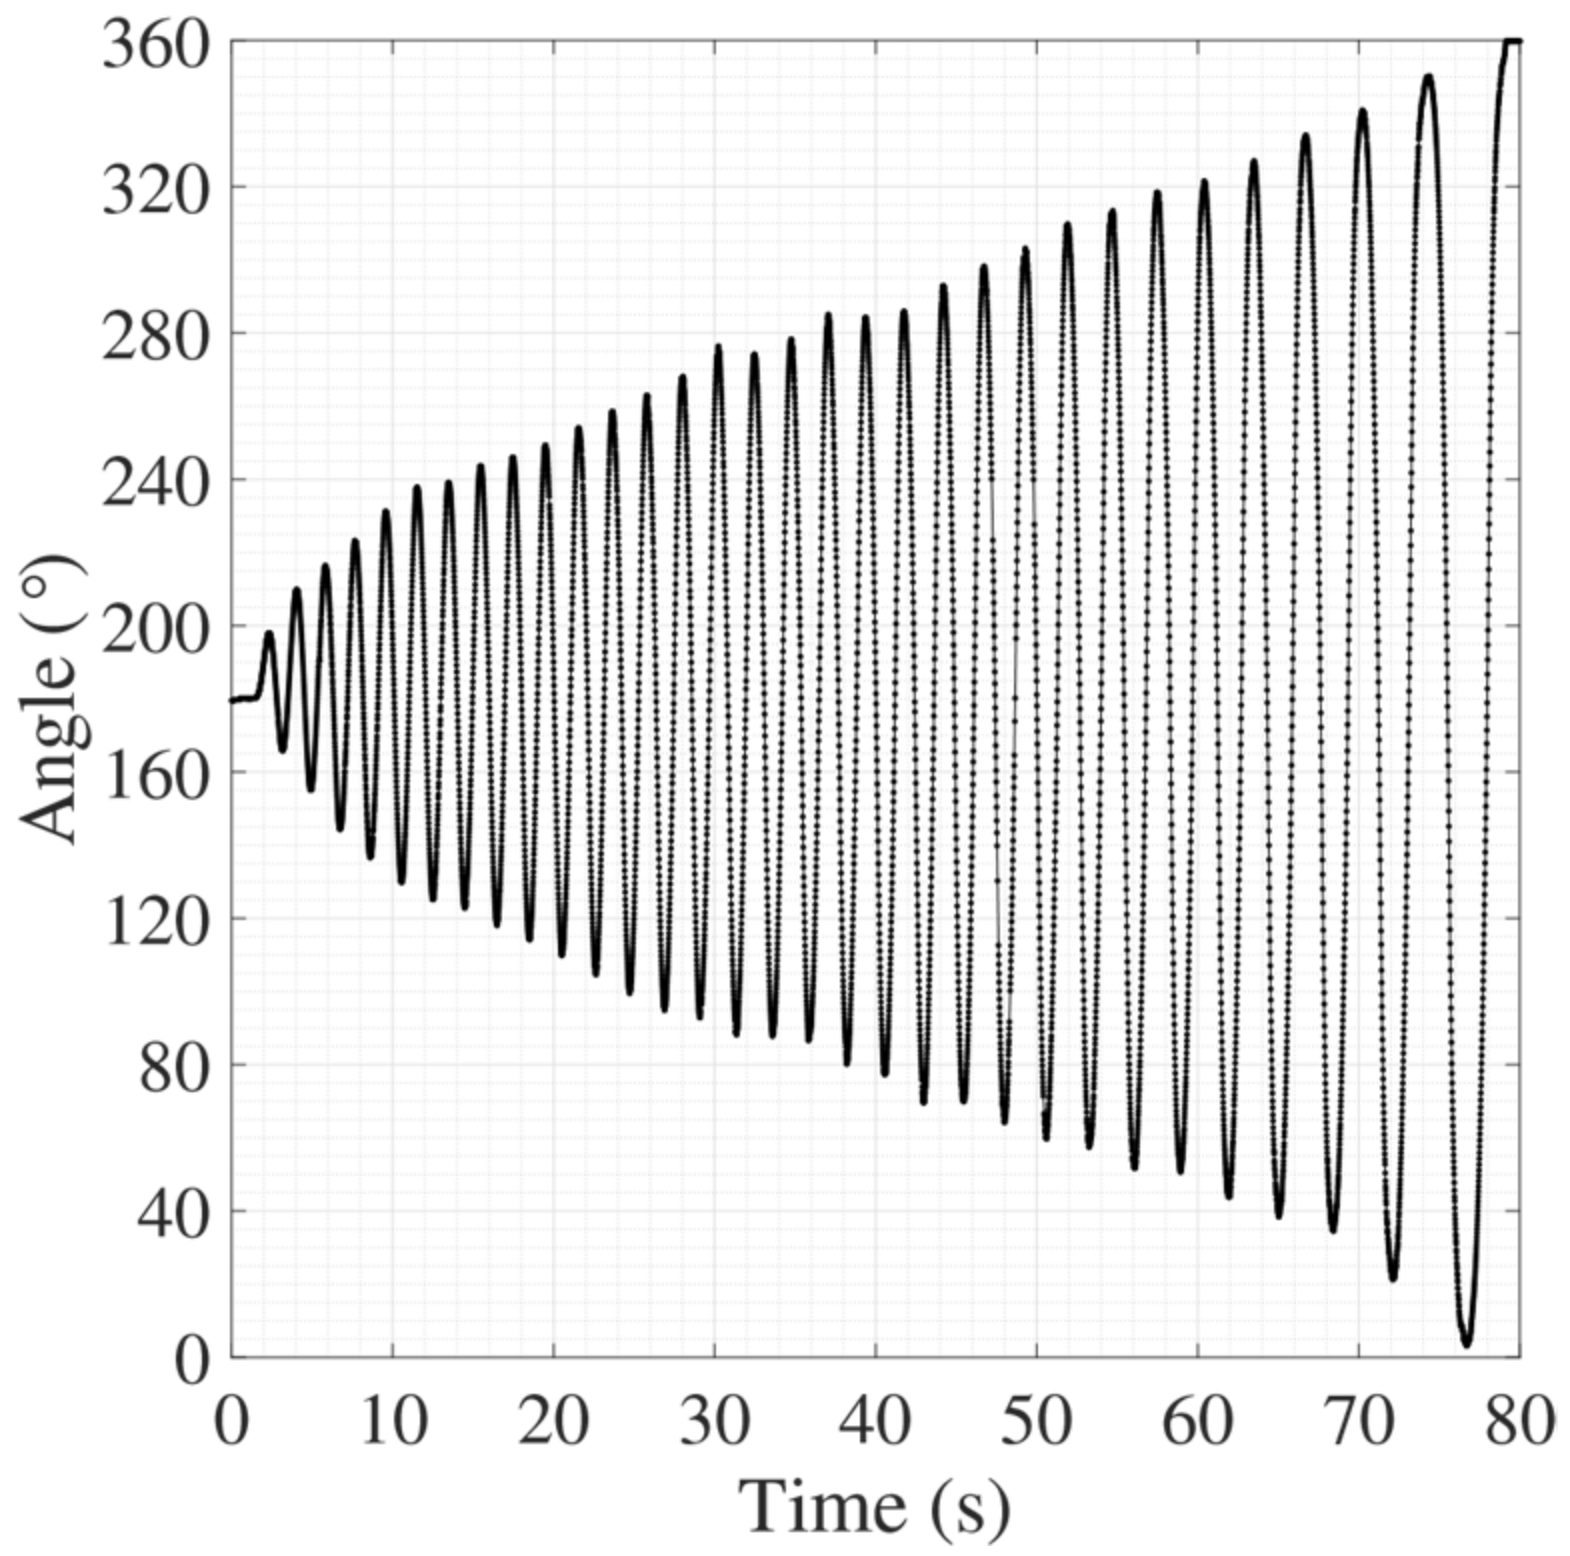
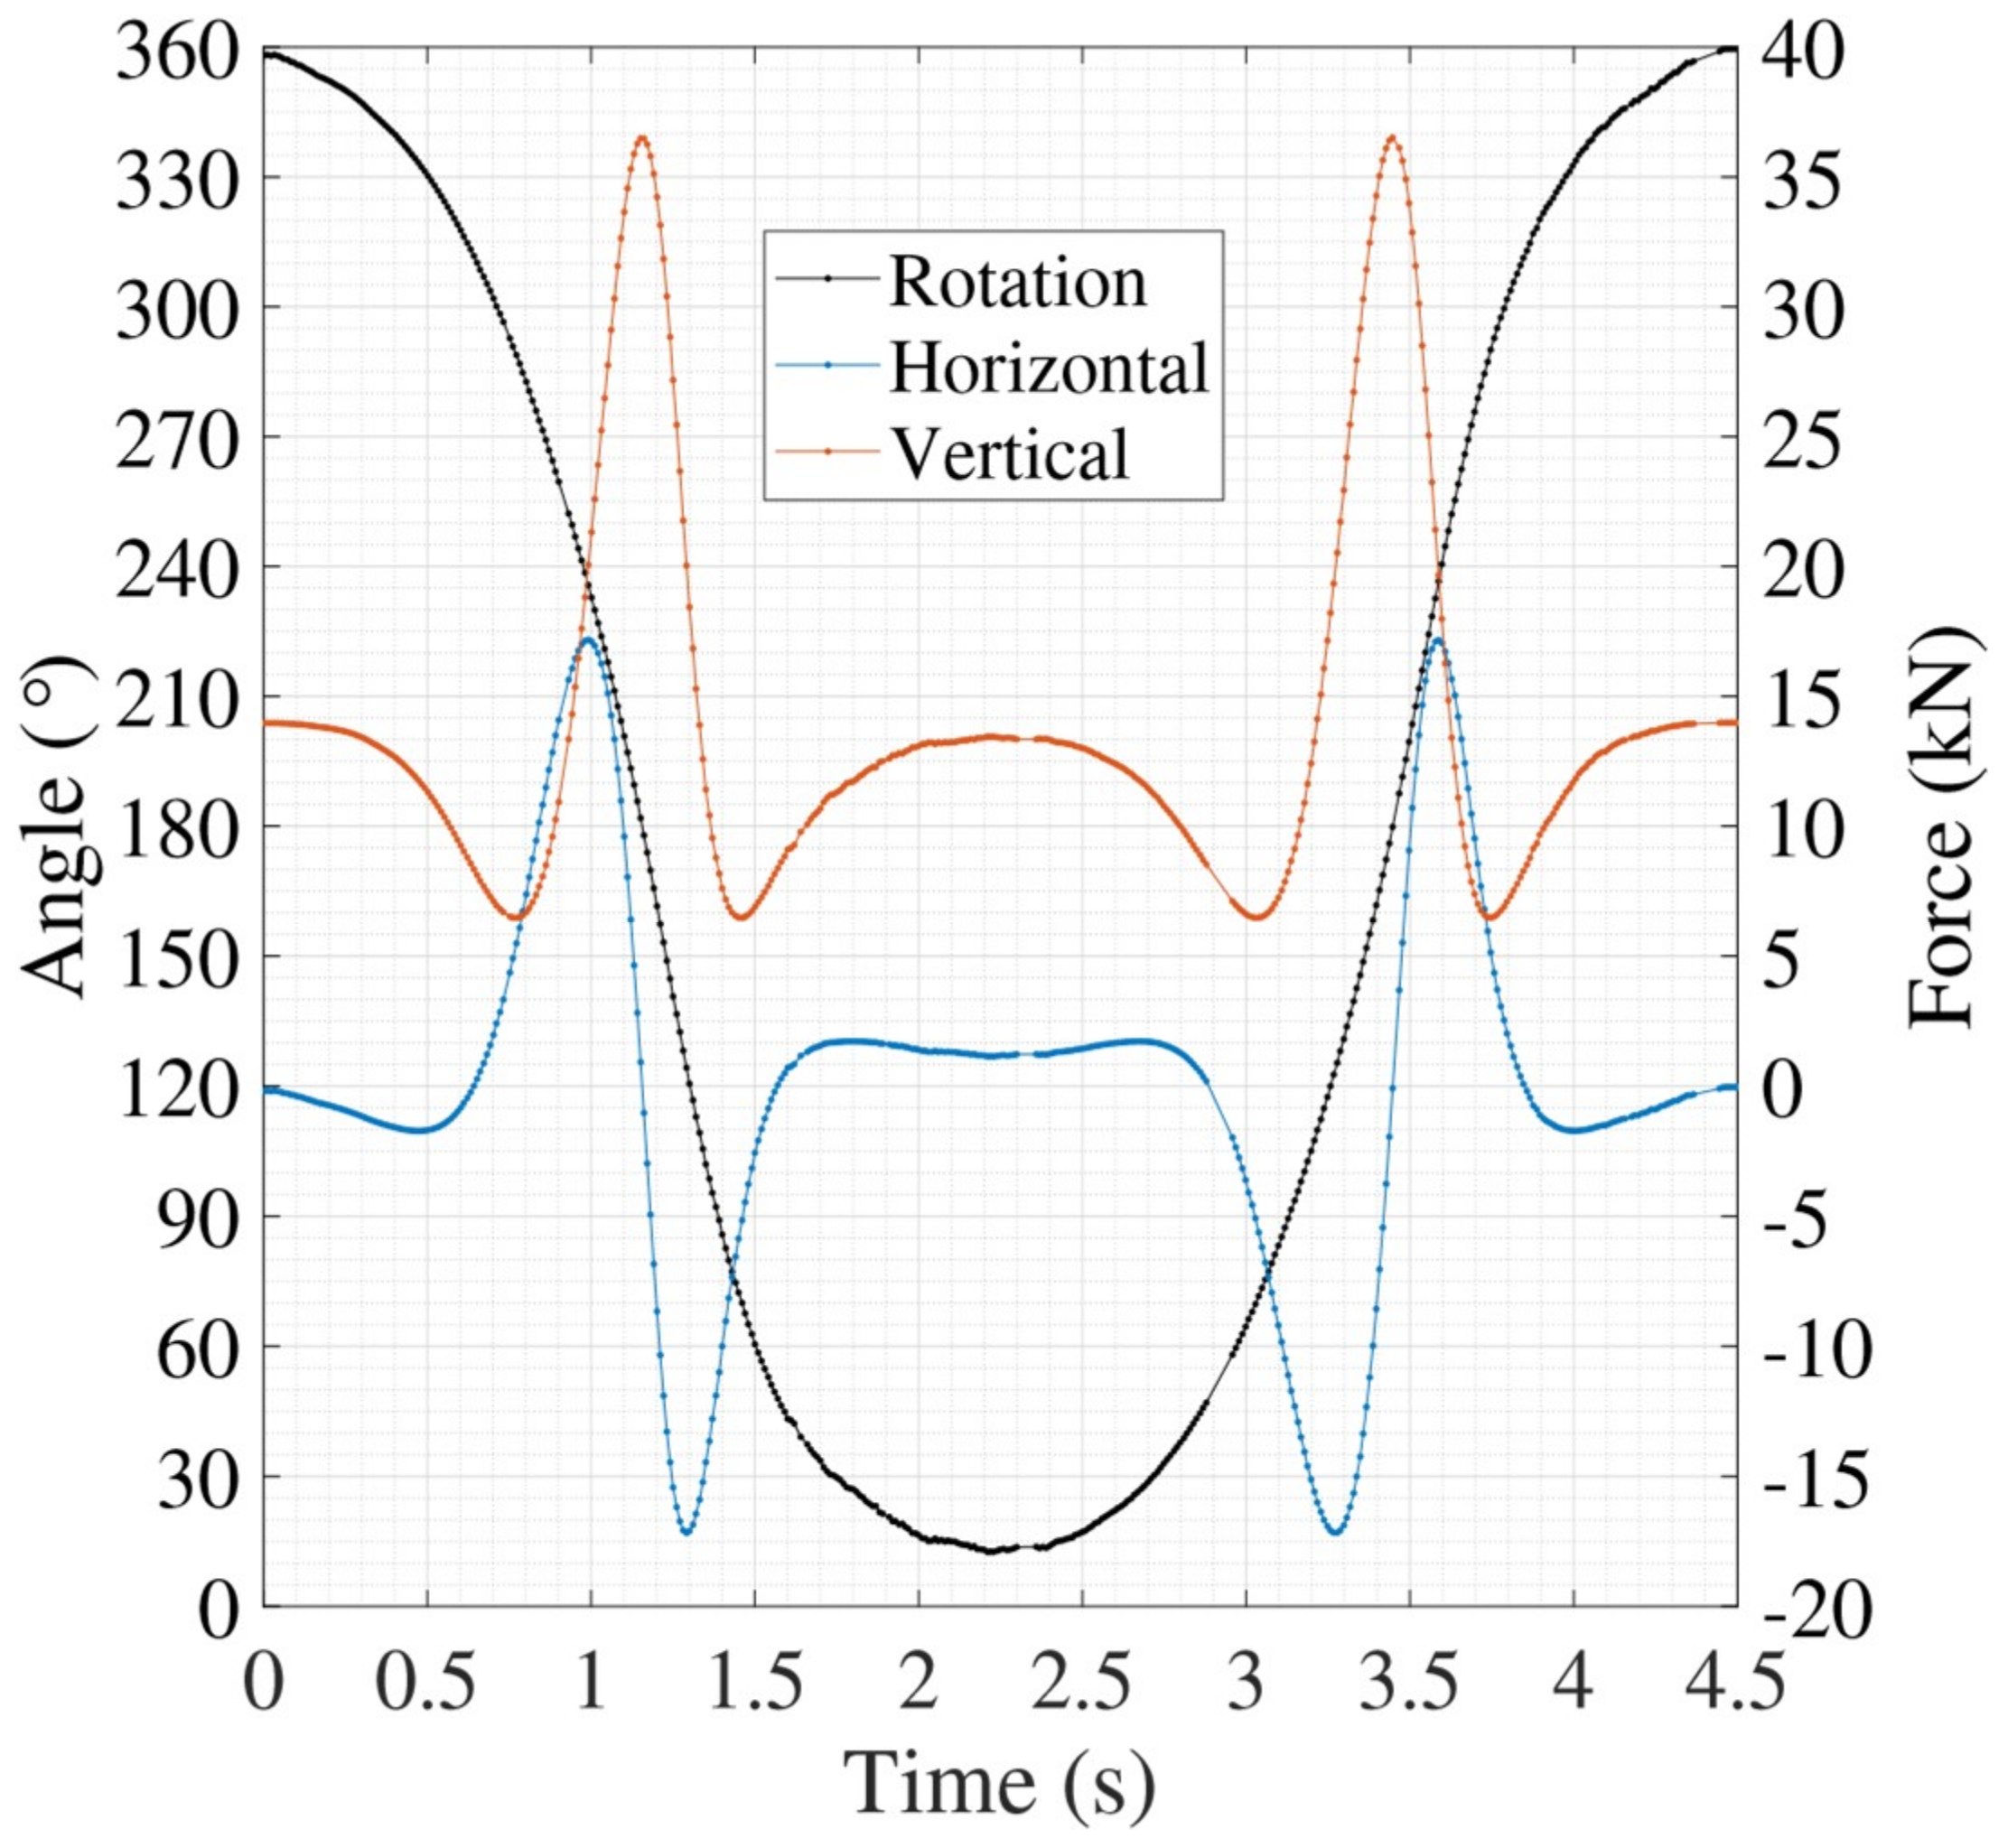
3.3. Field Work in Durham Cathedral Results

Ringing up is when the ringer moves the bell from its resting, mouth-down position which can been seen in Figure 1 to its mouth-up position seen in Figure 2. The ringer does this by repeatedly pulling the rope to make the bell swing higher and higher until it rests in the mouth-up position. The measured angle during the ringing up of the largest bell of mass 1425 kg can be seen in Figure 9. Ringing down is the reverse of this process. After the bells in the Cathedral were rung down, they continued to oscillate with an amplitude of ~5° for a period of time. The results of measuring this period of small oscillation are summarised in Table 6. The period of oscillation for each of the five lightest bells was measured by taking the average time for ten complete oscillations. This was done using the data obtained from the sensors. It should be noted that for all plots in this section, 0° and 360° corresponded to when the bell was in its mouth-up position.
Based on the collected data set, it was possible to validate the assumption that the initial velocity given to the bell by the bell ringer at the start of its rotation was negligible. The initial velocity for all bells was observed to be negligible at the start of their rotation by observing the angular velocity against time curves calculated from the data set. The angular rotation of bell ten of mass 1425 kg and bell six of mass 563 kg for the first 800 ms of ringing can be seen in Figure 10. The initial angular velocity of both bells, calculated from the slope of the curves, at 360° was 14.45°/s for bell 10 and 7.95°/s for bell 6 which was negligible compared to the angular velocities of 224.10°/s and 147.92°/s at 310°, respectively. Considering bell 10, which had a period of τ = 2.08 s [6], plugging into the right hand side of Equation (4) yielded a value of 3.27 × 10⁻³ which was three orders of magnitude smaller than the maximum value of the left hand side of the equation.
The rotational angle of bell ten, and the horizontal and vertical forces exerted on the bell due to its motion as a function of time, calculated using Equations (1) and (2), are shown in Figure 11. To the authors’ knowledge, this is the first time that such plots could be produced based on the experimental data. Because each swing of the bell was slightly different, instead of averaging a set of swings, typical data of all swings of the bell were shown and they were observed to have the same shape as the data presented here.

4. Discussion

As shown in a typical ringing up pattern of bell ten, which is the heaviest bell in Figure 9, the ringer only increases the angle through which the bell rotates by approximately 4.0° each time they pull the rope. The nearly linear increase with each pull suggested a very skilled bell ringer. At around 50 s, some data loss could be seen, which was due to the fact that no attempt was made to recover lost packets in the user datagram protocol (UDP). Linear interpolation could be used to recover the data. Similar curves were produced for all of the bells but omitted to avoid repetition. All the small oscillation period values from Table 6 agree within ±0.7% of the measurements taken by Wilson and Selby in 1993 [6]. It is highly likely that the sensor network is more accurate than the methods used by Wilson and Selby simply due to the elimination of human error. The sensor produced a data point every 10 ms, whereas the typical reaction time of a human to visual stimuli was 180–200 ms according to [38]. The more than one order of magnitude higher time resolution of the sensors guaranteed a better time accuracy.
It can be seen in Figure 10 that the assumption the initial velocity imparted to the bell by the bell ringer is negligible is valid. The velocity at 360° is clearly negligible compared to the velocity at 310°. These velocities were calculated in Section 3.3. Bell 6 can be seen to overtake bell 10 in terms of angular rotation at ~295°, which can be explained by its significantly smaller mass (1425 versus 563 kg). The assumption that the ringer provided negligible initial velocity was widely used in the literature as it greatly simplified the equations used to calculate the forces produced by a bell as a function of angular rotation. This assumption, however, has never been proven experimentally. Every data set collected during this work showed this assumption to be valid. It is therefore correct to assume that the initial angular velocity is negligible for the types of bells measured at Durham Cathedral and take p = 1 in Equations (1) and (2). It should be noted that although this assumption is valid for experimental data, the initial velocity should still be taken into account in theoretical studies to avoid timing issues where the angle of the bell in the simulation lags behind the real life angle. Further experimental studies that attempt to correlate N–S and E–W tower vibration with bell forces via angle measurements from each bell will not have to consider the initial velocity of the bell for each rotation. The assumption is only valid once the bell has been rung up to its mouth-up position, not during the ringing up of the bell though.
The plot of the forces produced by bell ten in Figure 11 displays abrupt peaks indicating sudden and large increases in forces acting over a few 100s of ms. The plot displayed a rotation of the bell in one direction from 360° to 0° then a rotation in the other direction from 0° to 360°. The vertical forces reached a sharp maximum when the bell was at 180° (in its mouth-down position), the horizontal forces were momentarily zero as the bell passed through 180° but had sharp excursions on either side of 180°. The process was mirror imaged when the bell swung back in the other direction from 0° to 360°. The horizontal forces matched the shape and magnitude of the theoretical plot in [6]. The vertical forces matched the shape but not the magnitude of the theoretical plot in [6]. As the equations for the maximum vertical force in [6] agreed with the experimental results of this work, it was a reasonable assumption that there was an oversight by the authors of [6] leading to a slightly overstated magnitude value in the plot.
The amplitudes of the vertical and horizontal forces were approximately twice and the same as the weight of the bell, respectively. The reader should bear in mind that bell number ten weighed as much as a large car meaning that these were alarmingly large forces to be applied to the top of a 60-m tall tower. It should also be noted that this was just one bell, there were nine others also producing forces that could add or couple with the forces produced by bell ten. It follows that a set of these impulses from multiple bells occurring at the same time could lead to large tower displacements. Plots such as this could be produced for all ten bells in the Cathedral and summed together to visualise the resultant vertical and horizontal forces produced by the bells as a function of time.

5. Conclusions

A low-cost, low-power, star-type wireless network capable of measuring and recording the angle of rotation of a set of bell wheels was designed and validated using data from both the laboratory and the field. The sensors had a fixed sample rate of 100 Hz, and could produce x-, y-, and z-axis acceleration data with a resolution of 61 µg. Typical values for the drift and noise magnitude in the angle were 0.927° per hour and 0.0785°, respectively. The network is capable of supporting 254 sensor nodes but only 5 nodes were built and tested as a proof of concept. The periods of small oscillations of the five lightest bells in Durham Cathedral were measured and the values agreed within ±0.7% with the theoretical values in [6].
For the first time, it was proven experimentally that the initial velocities of all the bells in Durham Cathedral during ringing were negligible, allowing simplifications in the equations used to calculate the forces produced by a ringing bell. The sensors can, with confidence, be used to determine the forces produced by a ring of bells and to identify the ones that may lead to structural damage. The forces produced by bell ten in Durham Cathedral were computed and found to be much larger than the weight of the bells in agreement with the theoretical values in the literature [6]. The sensors have been proven to be reliable and accurate; they will soon be used to undertake further research into the vibration of the tower of Durham Cathedral and also many others around the UK. The network also has potential applications in low-frequency structural-health monitoring because of its capability to measure acceleration in three axes.

Author Contributions

All sections and experiments, J.M.; supervision, Z.R.; application concept, C.C.

Funding

This research was supported by the School of Engineering, Durham University and received no external funding.

Acknowledgments

The authors would like to thank the Durham Bell Ringers society for invitations to Durham Cathedral bell tower and also for sharing information about the art of change ringing.

Conflicts of Interest

The authors declare no conflict of interest.

References

  1. Majer, J.; Niederwanger, G. Observations during stabilisation of old bell towers damaged by cracks. Eng. Fracture Mech. 1990, 35, 493–499. [Google Scholar] [CrossRef]
  2. Bart, A.P.H. Bell Towers and Bell Hanging an Appeal to Architects; Longmans, Green and CO.: Harlow, UK, 1914. [Google Scholar]
  3. Ivorra, S.; Pallares, F.J.; Adam, J.M. Dynamic behaviour of a modern bell tower—A case study. Eng. Struct. 2009, 31, 1085–1092. [Google Scholar] [CrossRef]
  4. Lewis, E. Calculation of the Forces Acting upon a Church Tower; Central Council of Church Bell Ringers: London, UK, 1914. [Google Scholar]
  5. Heyman, J.; Threlfall, B. Inertia forces due to bellringing. Int. J. Mech. Sci. 1976, 18, 161–164. [Google Scholar] [CrossRef]
  6. Wilson, J.; Selby, A. Durham cathedral tower vibrations during bell ringing. In Engineering A Cathedral Durham; ICE Publishing: London, UK, 1993; pp. 77–100. [Google Scholar]
  7. Lund, J.; Selby, A.; Wilson, J. The dynamics of bell towers—A survey in northeast England. Trans. Built Environ. 1995, 15, 45–52. [Google Scholar]
  8. Selby, A.; Wilson, J. The structural safety and acceptability of bell towers. Trans. Built Environ. 1997, 26, 321–331. [Google Scholar]
  9. Smith, R.; Hunt, H. Vibration of bell towers excited by bell ringing—A new approach to analysis. In Proceedings of the International Conference on Noise and Vibration Engineering, Leuven, Belgium, 15–17 September 2008. [Google Scholar]
  10. Other Ringing Styles. Available online: http://jaharrison.me.uk/BellsAreRinging/styles.html (accessed on 9 March 2018).
  11. Mercier, H.; Ammann, W.J.; Deischl, F.; Eisenmann, J.; Floegl, I.; Hirsch, G.H.; Klein, G.K.; Lande, G.J.; Mahrenholtz, O.; Natke, H.G.; et al. Vibration Problems in Structures: Practical Guidelines; Springer Science & Business Media: New York, NY, USA, 1995. [Google Scholar]
  12. Sabato, A.; Feng, M.Q.; Fukuda, Y.; Carni, D.L.; Fortino, G. A Novel Wireless Accelerometer Board for Measuring Low-Frequency and Low-Amplitude Structural Vibration. J. IEEE Sens. J. 2016, 16, 2942–2949. [Google Scholar] [CrossRef]
  13. Kilic, G.; Unluturk, M.S. Testing of wind turbine towers using wireless sensor network and accelerometer. Renew. Energy 2015, 75, 318–325. [Google Scholar] [CrossRef]
  14. Hughes, J.; Yan, J.; Soga, K. Development of Wireless Sensor Network Using Bluetooth Low Energy (BLE) For Construction Noise Monitoring. Int. J. Smart Sens. Intell. Syst. 2015, 8, 1379–1405. [Google Scholar] [CrossRef]
  15. Zhao, X.; Geng, S.; Coulibaly, B.M. Path-Loss Model Including LOS-NLOS Transition Regions for Indoor Corridors at 5 GHz. IEEE Antennas Propag. Mag. 2013, 55, 217–223. [Google Scholar] [CrossRef]
  16. Comparing Low-Power Wireless Technologies. Available online: https://www.digikey.co.uk/en/articles/techzone/2017/oct/comparing-low-power-wireless-technologies (accessed on 9 October 2017).
  17. Trends in Wide Area IP Traffic Patterns. Available online: http://www.utdallas.edu/~kxs028100/Papers/ trends-in-wide-area-ip-traffic-patterns.pdf (accessed on 13 February 2018).
  18. Stallings, W. Data and Computer Communications; Pearson: London, UK, 2013; pp. 487–495. [Google Scholar]
  19. ESP8266 THING Breakout and Development Board for ESP8266 Wi-Fi Soc. Available online: https://goo.gl/ maU7NA (accessed on 13 February 2018).
  20. ESP8266 Thing Hookup Guide. Available online: https://learn.sparkfun.com/tutorials/esp8266-thinghookup-guide (accessed on 13 February 2018).
  21. Arduino MKR1000. Available online: https://bit.ly/2CCzy97 (accessed on 22 January 2019).
  22. Arduino MKR1000. Available online: https://goo.gl/hV1dbd (accessed on 13 February 2018).
  23. RASPBERRY PI HARDWARE. Available online: https://www.raspberrypi.org/documentation/hardware/ raspberrypi/README.md (accessed on 13 February 2018).
  24. Raspberry Pi Zero W. Available online: https://shop.pimoroni.com/products/raspberry-pi-zero-w (accessed on 13 February 2018).
  25. ESP8266EX Datasheet. Available online: https://cdn-shop.adafruit.com/product-files/2471/0A-ESP8266_ _Datasheet__EN_v4.3.pdf (accessed on 13 February 2018).
  26. ATSAMW25-MR210PB. Available online: http://ww1.microchip.com/downloads/en/DeviceDoc/Atmel-42618-SmartConnect-ATSAMW25-MR210PB_Datasheet.pdf (accessed on 13 February 2018).
  27. CYW43438. Available online: http://www.cypress.com/file/298076/download (accessed on 13 February 2018).
  28. TDK InvenSense MPU-9250. Available online: https://www.digikey.co.uk/product-detail/en/tdkinvensense/MPU-9250/1428-1019-1-ND/4626450 (accessed on 23 February 2018).
  29. TDK InvenSense MPU-6050. Available online: https://www.digikey.co.uk/product-detail/en/tdkinvensense/MPU-6050/1428-1007-1-ND/4038010 (accessed on 23 February 2018).
  30. STMicroelectronics LSM9DS1TR. Available online: https://www.digikey.co.uk/product-detail/en/ stmicroelectronics/LSM9DS1TR/497-14946-1-ND/4988079 (accessed on 23 February 2018).
  31. 9 Degrees of Freedom IMU Breakout—MPU-9250. Available online: https://goo.gl/SPVqQi (accessed on 23 February 2018).
  32. Triple Axis Accelerometer + Gyro Breakout—MPU-6050. Available online: https://coolcomponents.co.uk/ products/triple-axis-accelerometer-gyro-breakout-mpu-6050 (accessed on 23 February 2018).
  33. SparkFun 9 Degrees of Freedom IMU Breakout—LSM9DS1. Available online: http://www.hobbytronics.co.uk/lsm9ds1-9dof (accessed on 23 February 2018).
  34. Fernandez-Madrigal, J.-A.; Claraco, J.L.B. Simultaneous Localization and Mapping for Mobile Robots: Introduction and Methods, Information Science Reference; IGI Publishing: Hershey, PA, USA, 2012. [Google Scholar]
  35. 9DoF Razor IMU M0 Hookup Guide. Available online: https://learn.sparkfun.com/tutorials/9dof-razorimu-m0-hookup-guide/introduction (accessed on 9 March 2018).
  36. MPU-9250. Available online: https://www.invensense.com/products/motion-tracking/9-axis/mpu-9250/ (accessed on 18 January 2018).
  37. Ringing Themes. Available online: https://cccbr.org.uk/services/pr/publicity/themes/ (accessed on 9 March 2018).
  38. Thompson, P.D.; Colebatch, J.G.; Brown, P.; Rothwell, J.C.; Day, B.L.; Obeso, J.A.; Marsden, C.D. Voluntary stimulus—Sensitive jerks and jumps mimicking myoclonus or pathological startle syndromes. Mov. Disord. 1992, 7, 257–262. [Google Scholar] [CrossRef] [PubMed]
Figure 1. Image of the fifth bell and its bell wheel in Durham Cathedral.
Inventions 04 00006 g001
Figure 2. Diagram of a bell and bell wheel. The blue box indicates where the sensor was located in all experiments in the Cathedral. The black slider holds the bell in position close to its balance point so that minimum effort is required to ring it.
Inventions 04 00006 g002
Figure 3. Block diagram of the data flow for one sensor through the system; solid arrows represent electrical connections and dashed arrows represent wireless links.
Inventions 04 00006 g003
Figure 4. Block diagram of the star network; dashed arrows represent wireless links.
Inventions 04 00006 g004
Figure 5. View of sensor in clear acrylic case. The sensor was placed on top of a standard-sized ID card to give an idea of scale.
Inventions 04 00006 g005
Figure 6. Flow chart describing the Java code that runs on the computer in Processing (top left), two of the interrupts for the Java code (bottom left) and the Arduino code (right) that run on the MKR1000(s). The ’All boards sending?’ block also relies on an interrupt process but the details are omitted.
Inventions 04 00006 g006
Figure 7. Distribution of packets lost with increasing number of devices simultaneously sending data through a Google Nexus 6 Plus mobile phone (ae), and five devices simultaneously sending data through an O2 wireless box IV (f). The red “*” symbol represents a dropped packet and the blue “.” symbol represents a received packet. The number to the right of each trace shows the number of dropped packets for that board. Each board sends 10,000 packets at a sample rate of 100 Hz, giving a total sample time of 100 s.
Inventions 04 00006 g007
Figure 8. Oscillations recorded by two sensors attached to a pendulum.
Inventions 04 00006 g008
Figure 9. The ringing up of bell number ten of mass 1425 kg in Durham Cathedral.
Inventions 04 00006 g009
Figure 10. The angular rotation of bell ten and six at the beginning of the hand stroke where the ringer pulls upon the rope to displace the bell from its mouth-up position.
Inventions 04 00006 g010
Figure 11. The angular rotation and horizontal and vertical forces of bell ten against time.
Inventions 04 00006 g011
Table 1. Comparison of wireless networking protocols [14,16]; data rates are theoretical maximums.
Max NodesData Rate (Mb/s)Range (m)
Requirements≥10≥4.064>10
Wi-Fi2556100
Zigbee2550.24450
Bluetooth7110
BLE71100
Table 2. Comparison of communication protocols [18]. (Flow control is the ability to delay packet transmission to go back and request that a dropped packet is resent.)
ProtocolHeader Size (Byte)SpeedFlow ControlError CheckingError Recovery
UDP8HighNoYesNo
TCP20LowYesYesYes
Table 3. Comparison of Wi-Fi microcontroller boards [19,20,21,22,23,24,25,26,27].
Ease of ManufactureArea (cm2)Documentation Quality *
RequirementsStraightforward<50Good
MKR1000Straightforward16.25Good
Pi Zero WDifficult19.50Poor
ESP8266 ThingStraightforward14.35Poor
* indicates the authors’ personal opinion.
Table 4. Comparison of inertial measurement units [28,29,30,31,32,33].
Chip Price (£)Breakout Price (£)Quaternion CalculationPart Status
RequirementsYesActive
MPU-92507.4814.95YesActive
MPU-60505.8434.03YesNot active
LSM9DS14.469.20NoActive
Table 5. Summary of packet loss for different node numbers.
GroupNo. of NodesTotal Packet Loss (%)
(a)10.0400
(b)20.0250
(c)30.0333
(d)40.0025
(e)50.7340
(f)5 (Wi-Fi box)0.0500
Table 6. Comparison with small oscillation period measured in 1993 [6].
Bellτ [6] (s)τ (s)Difference (%)
11.5941.586–0.502
21.6001.6110.687
31.6891.685–0.237
41.7561.744–0.683
51.7421.730–0.689

