1. Introduction
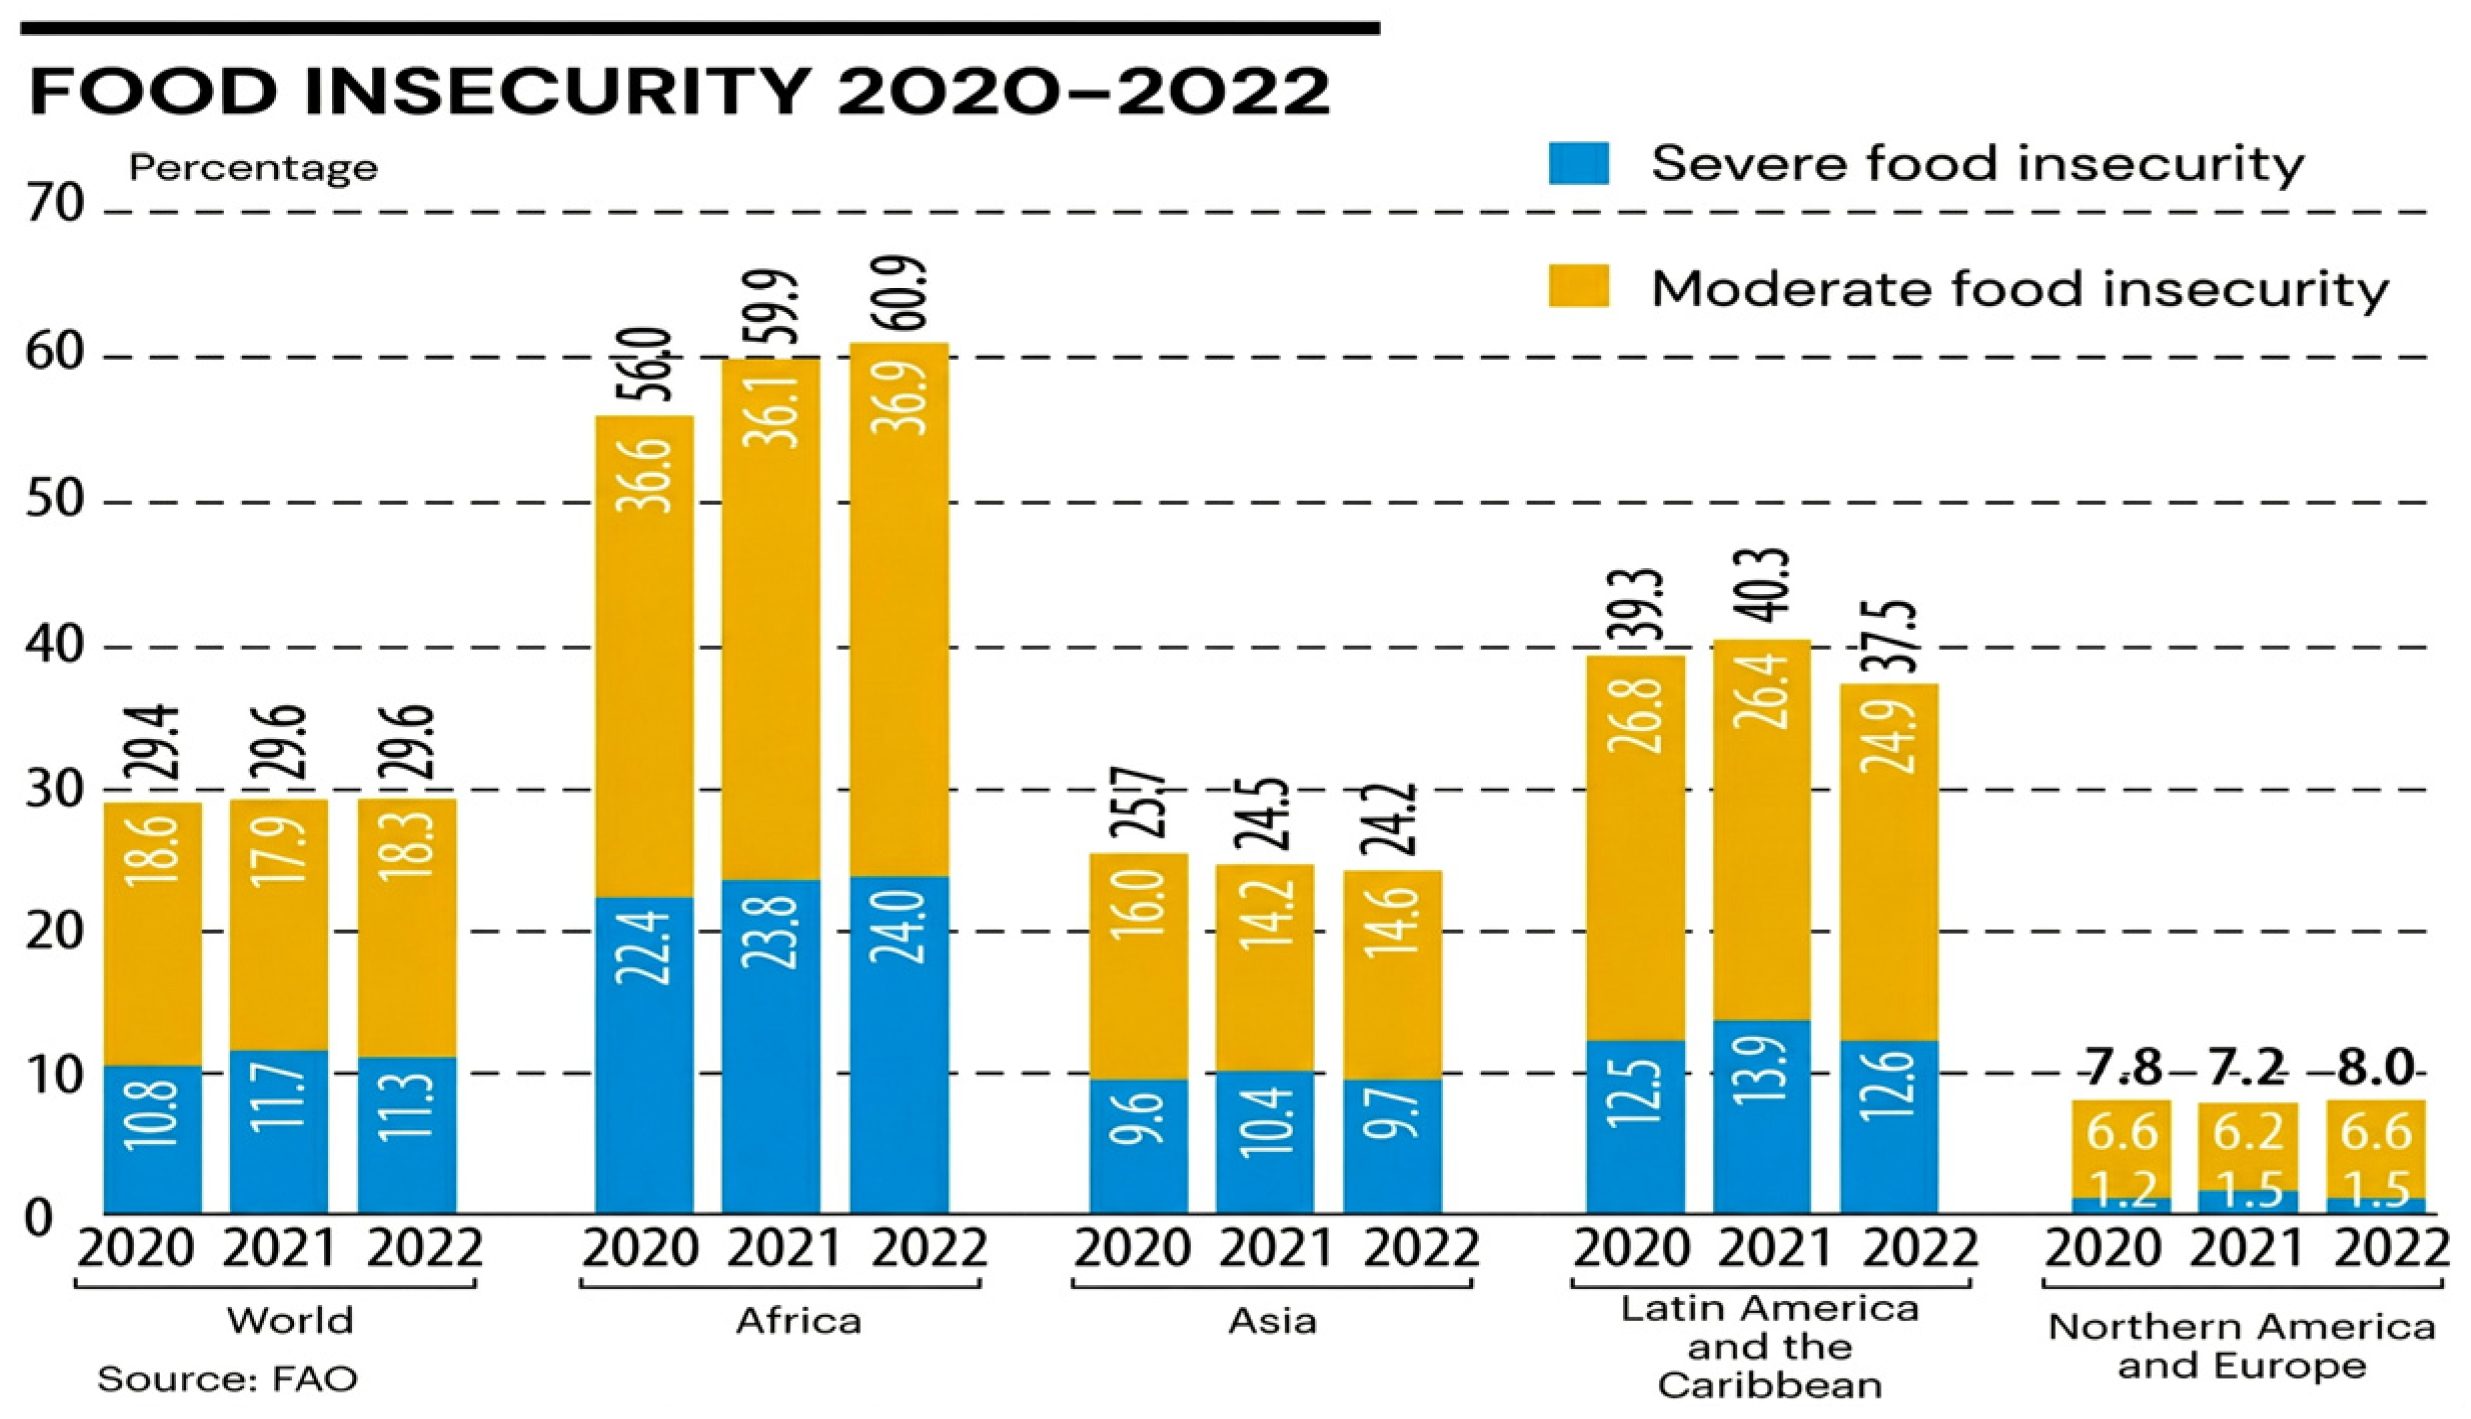
Food security is a global challenge that affects both the availability of and equitable access to food. According to FAO [
1], more than 9% of the world’s population faces severe food insecurity, a situation aggravated by climate change, water scarcity, armed conflicts, natural resource depletion, and economic crises, as illustrated in
Figure 1 for the 2020–2022 period.
In Colombia, this situation is intensified by the structural vulnerability of rural territories in terms of water and energy access, where the agricultural sector accounts for a large share of total freshwater withdrawals [
2]. In addition, barriers to technological adoption in rural communities [
3] limit the deployment of smart agriculture solutions [
4], especially in regions where traditional farming practices still prevail [
5].
In response, precision agriculture and smart farming systems have emerged as effective solutions for improving productivity using IoT technologies, AI, and renewable energy sources. Recent research reports advances in distributed monitoring, digital twins, and greenhouse automation [
4,
6,
7,
8], as well as hybrid renewable energy integration for resilient operation in controlled environments [
9]. However, in many rural contexts, it is still necessary to develop low-cost, scalable solutions that can be deployed and maintained with limited infrastructure.
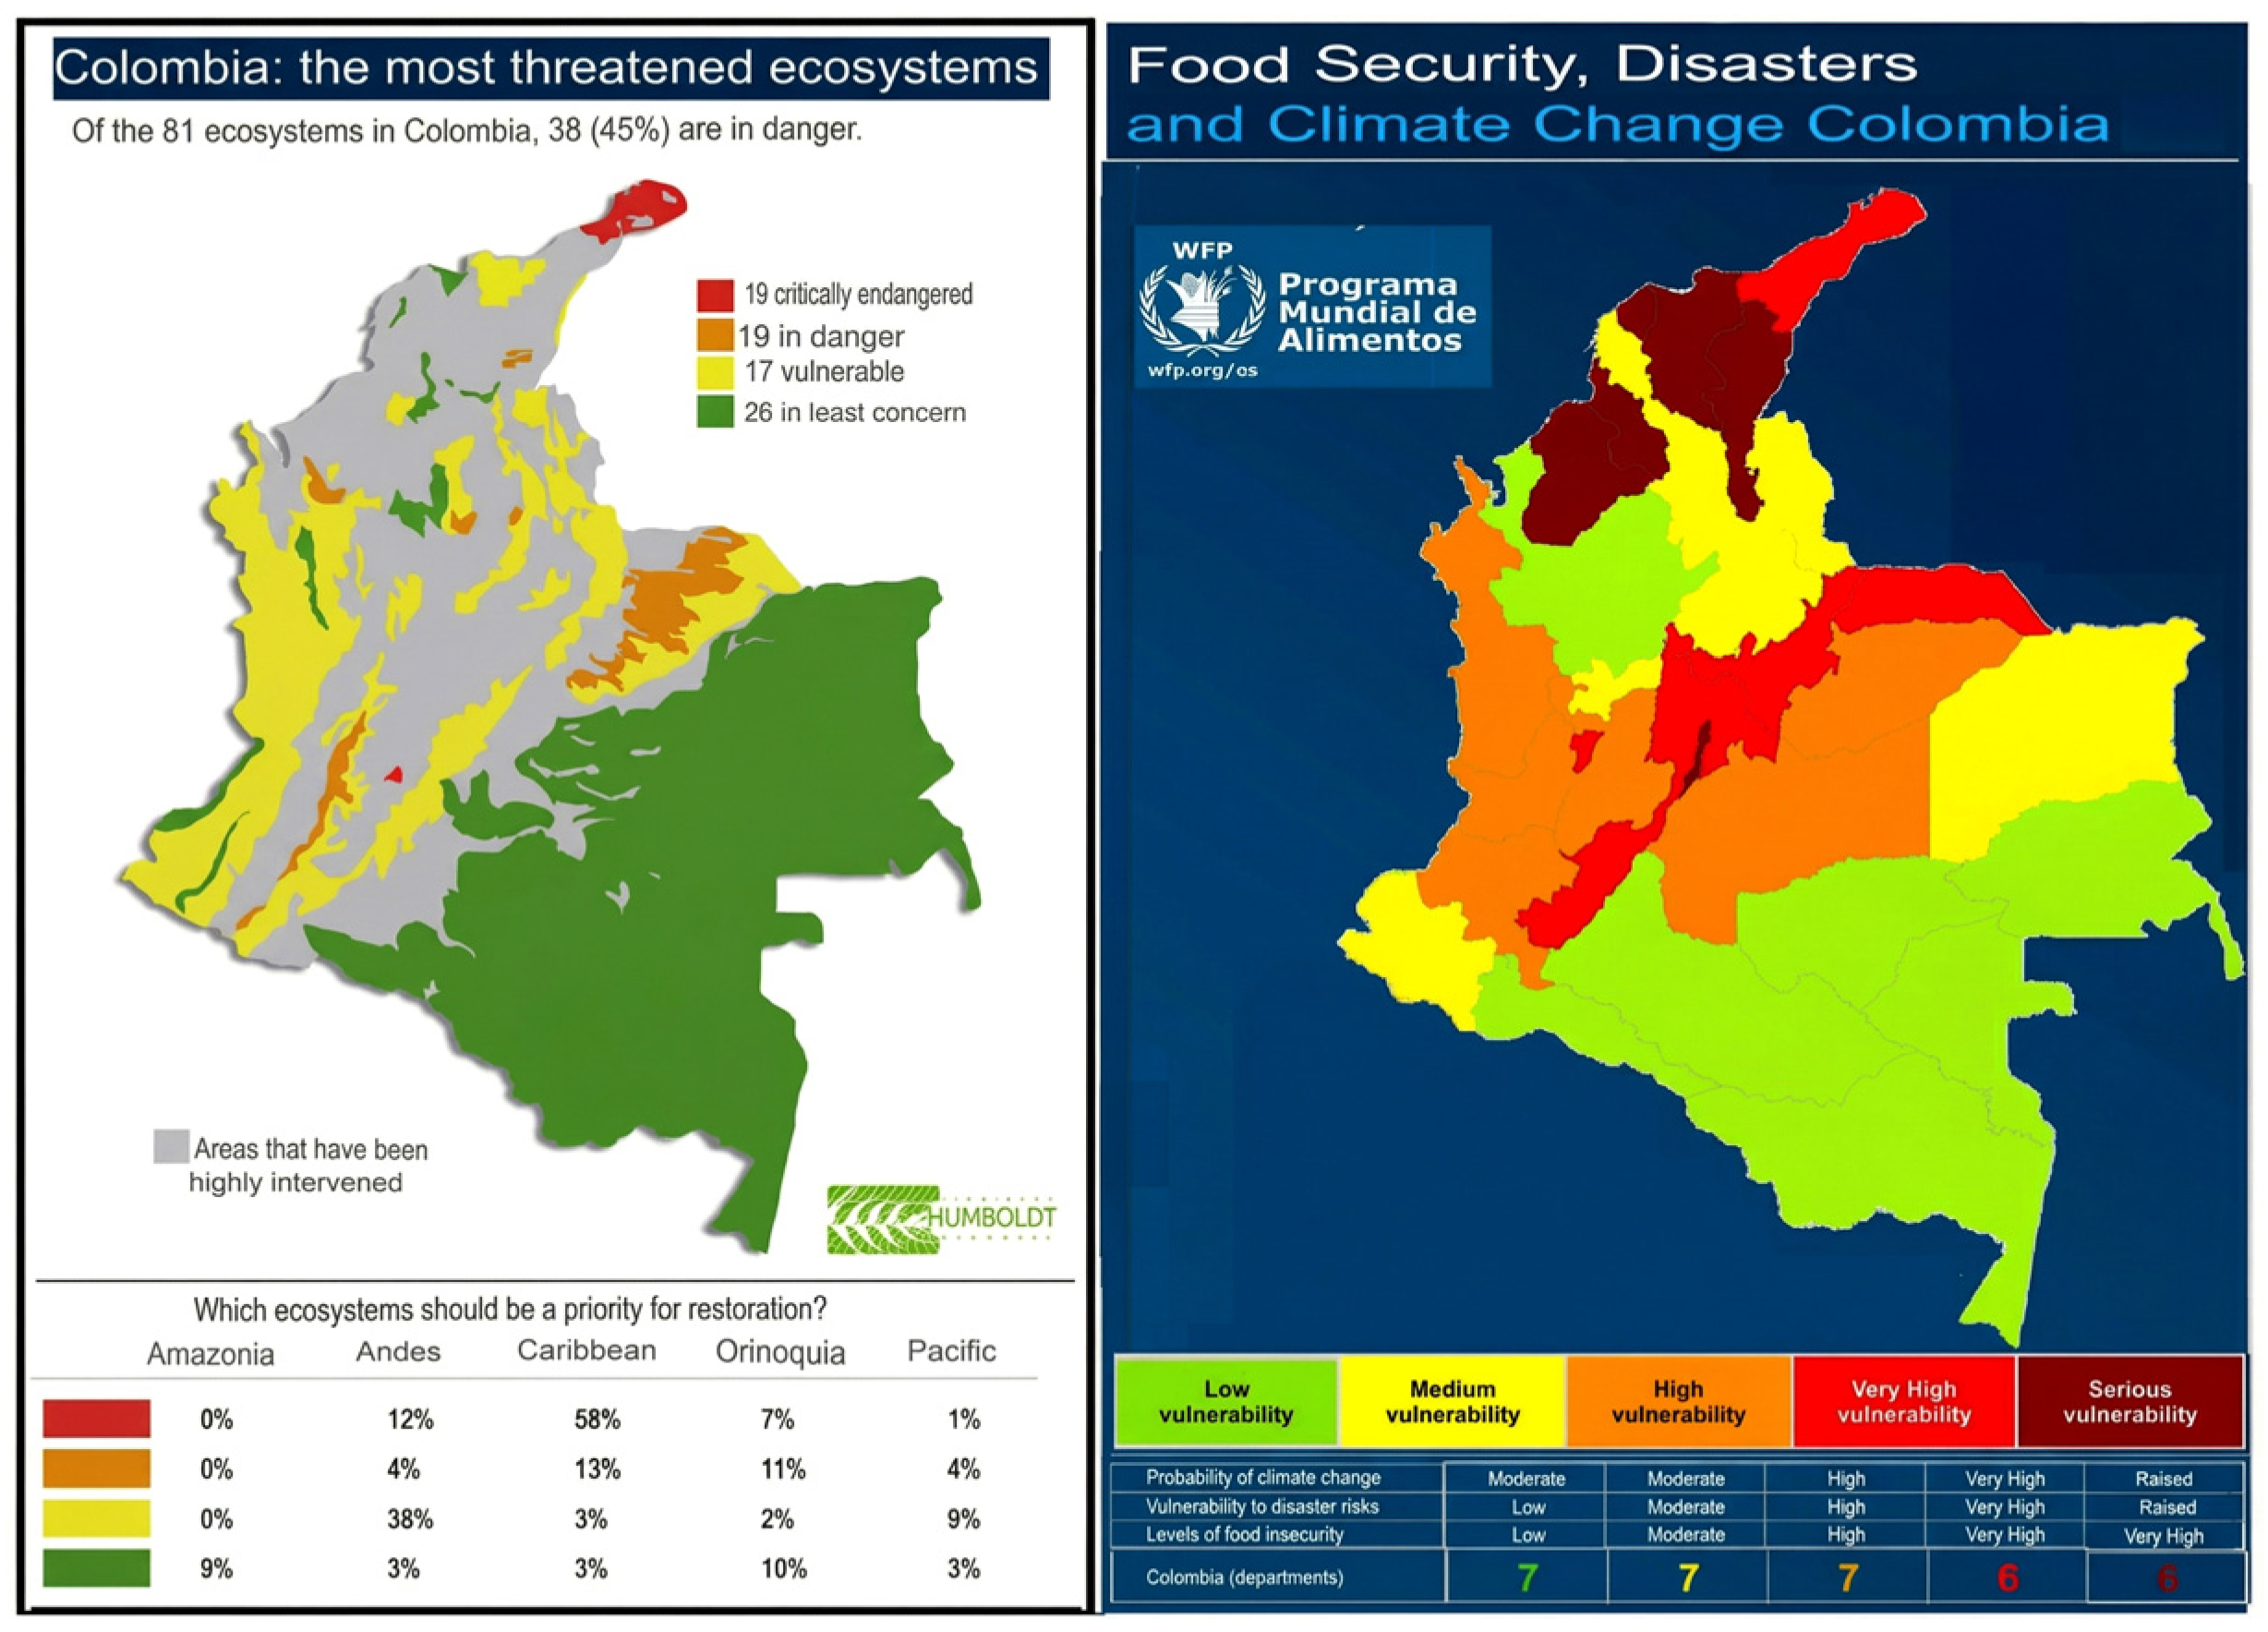
Colombian agriculture, like that of other Latin American countries, is highly vulnerable to phenomena such as El Niño (characterized by prolonged droughts) and La Niña (characterized by abundant rainfall), which impact food production and availability.
Figure 2 shows that 78% of the territory, equivalent to 26 of the 33 departments that make up the country’s political division, is in a state of vulnerability above the average level, and of these, 19 departments are in critical danger regarding food security, disasters, and climate change [
5,
10,
11].
This work addresses this gap by designing a smart greenhouse with integrated energy and water management, capable of operating in resource-constrained rural Colombian environments. The proposal aims to optimize crop quality, reduce water and energy consumption, and serve as a foundation for a digitally assisted, sustainable agriculture model.
Despite the maturity of IoT-based greenhouse monitoring solutions, many reported systems focus primarily on architecture descriptions and provide limited reproducible evidence of crop state assessment under low-cost constraints, particularly when energy and water resilience must be addressed simultaneously. In this context, accessible image-based diagnostics that can be implemented with lightweight tools and shared code are valuable for small producers, academic laboratories, and training activities.
The main contributions of this work are: (1) a low-cost, modular IoT architecture for microclimate monitoring and control in a lettuce greenhouse; (2) a complementary image analysis workflow that couples AI classification with box-counting fractal descriptors for non-destructive crop state assessment, with MATLAB-based processing scripts provided as
Supplementary Materials; and (3) an integrated water and energy management approach reported through transparent, estimation-based indicators and limitations suitable for resource-constrained deployments.
This article is structured as follows.
Section 2 describes the materials and methods, including the smart greenhouse prototype and the definition of the conventional baseline.
Section 3 presents the preliminary results and their discussion.
Section 4 summarizes the main limitations of the current proof of concept and outlines future work. Finally,
Section 5 provides the conclusions.
2. Materials and Methods
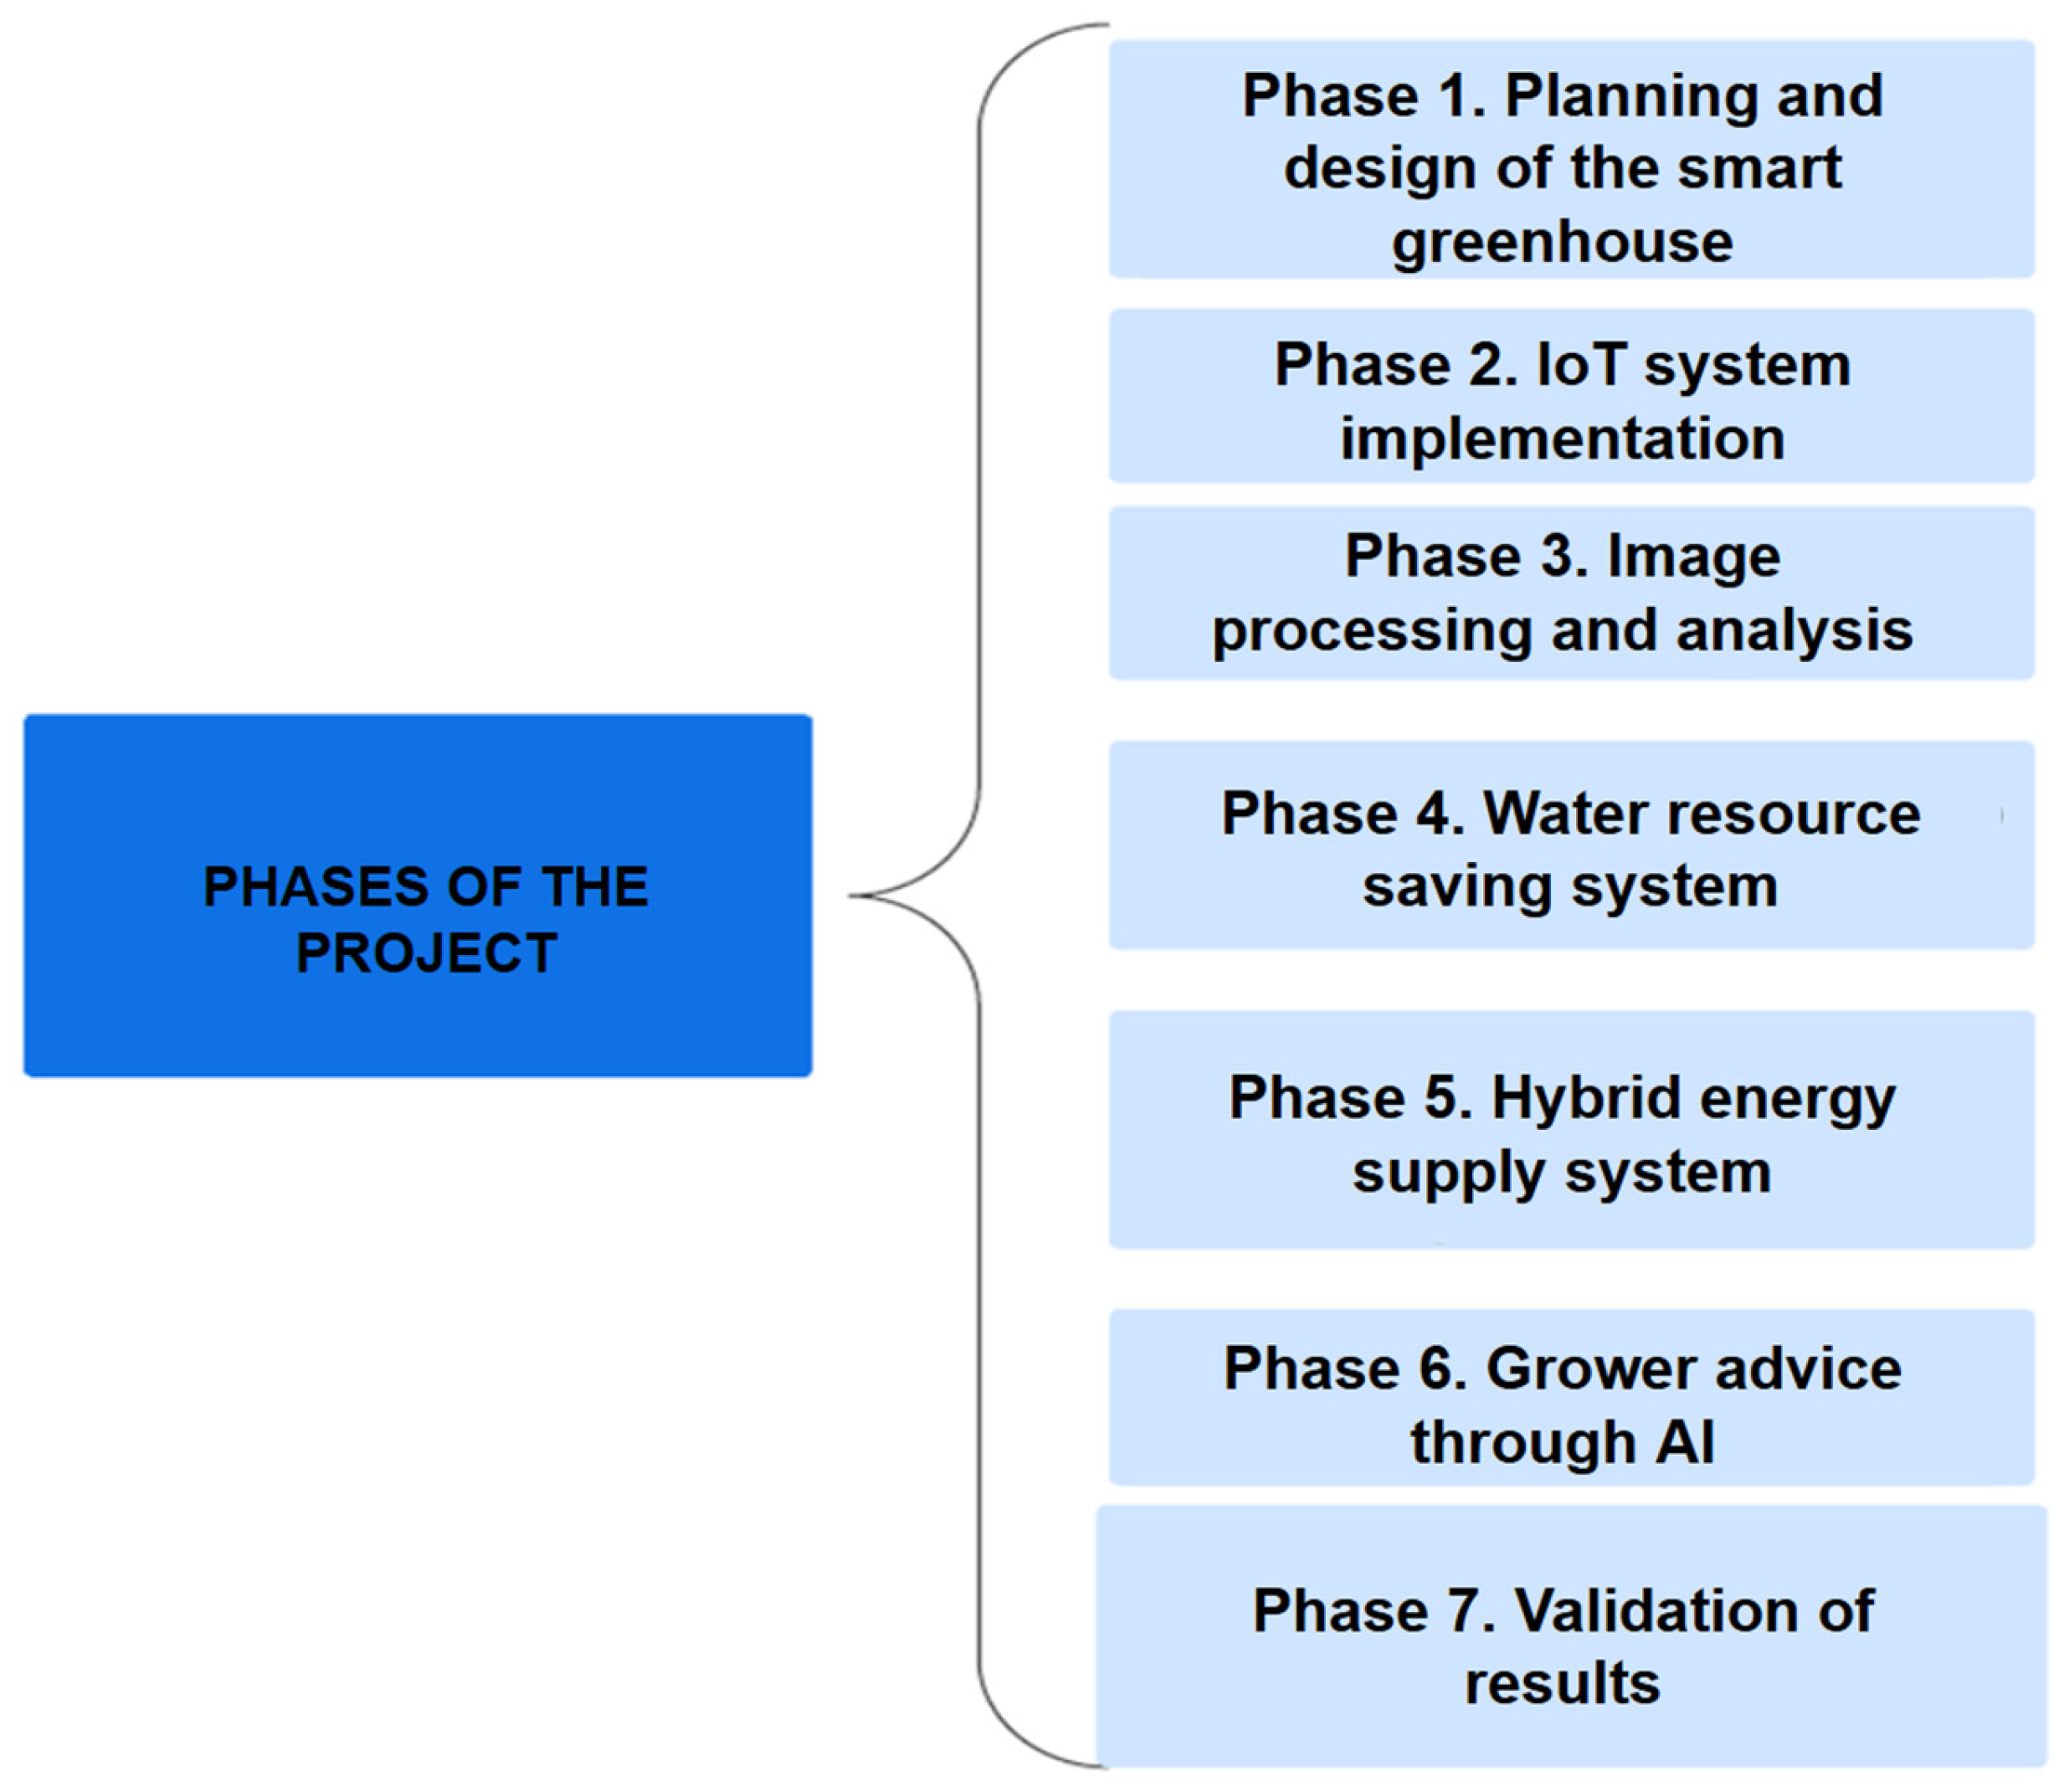
The methodology was structured in seven main phases that range from planning to system validation (
Figure 3).
2.1. Phase 1. The Planning and Design of the Smart Greenhouse
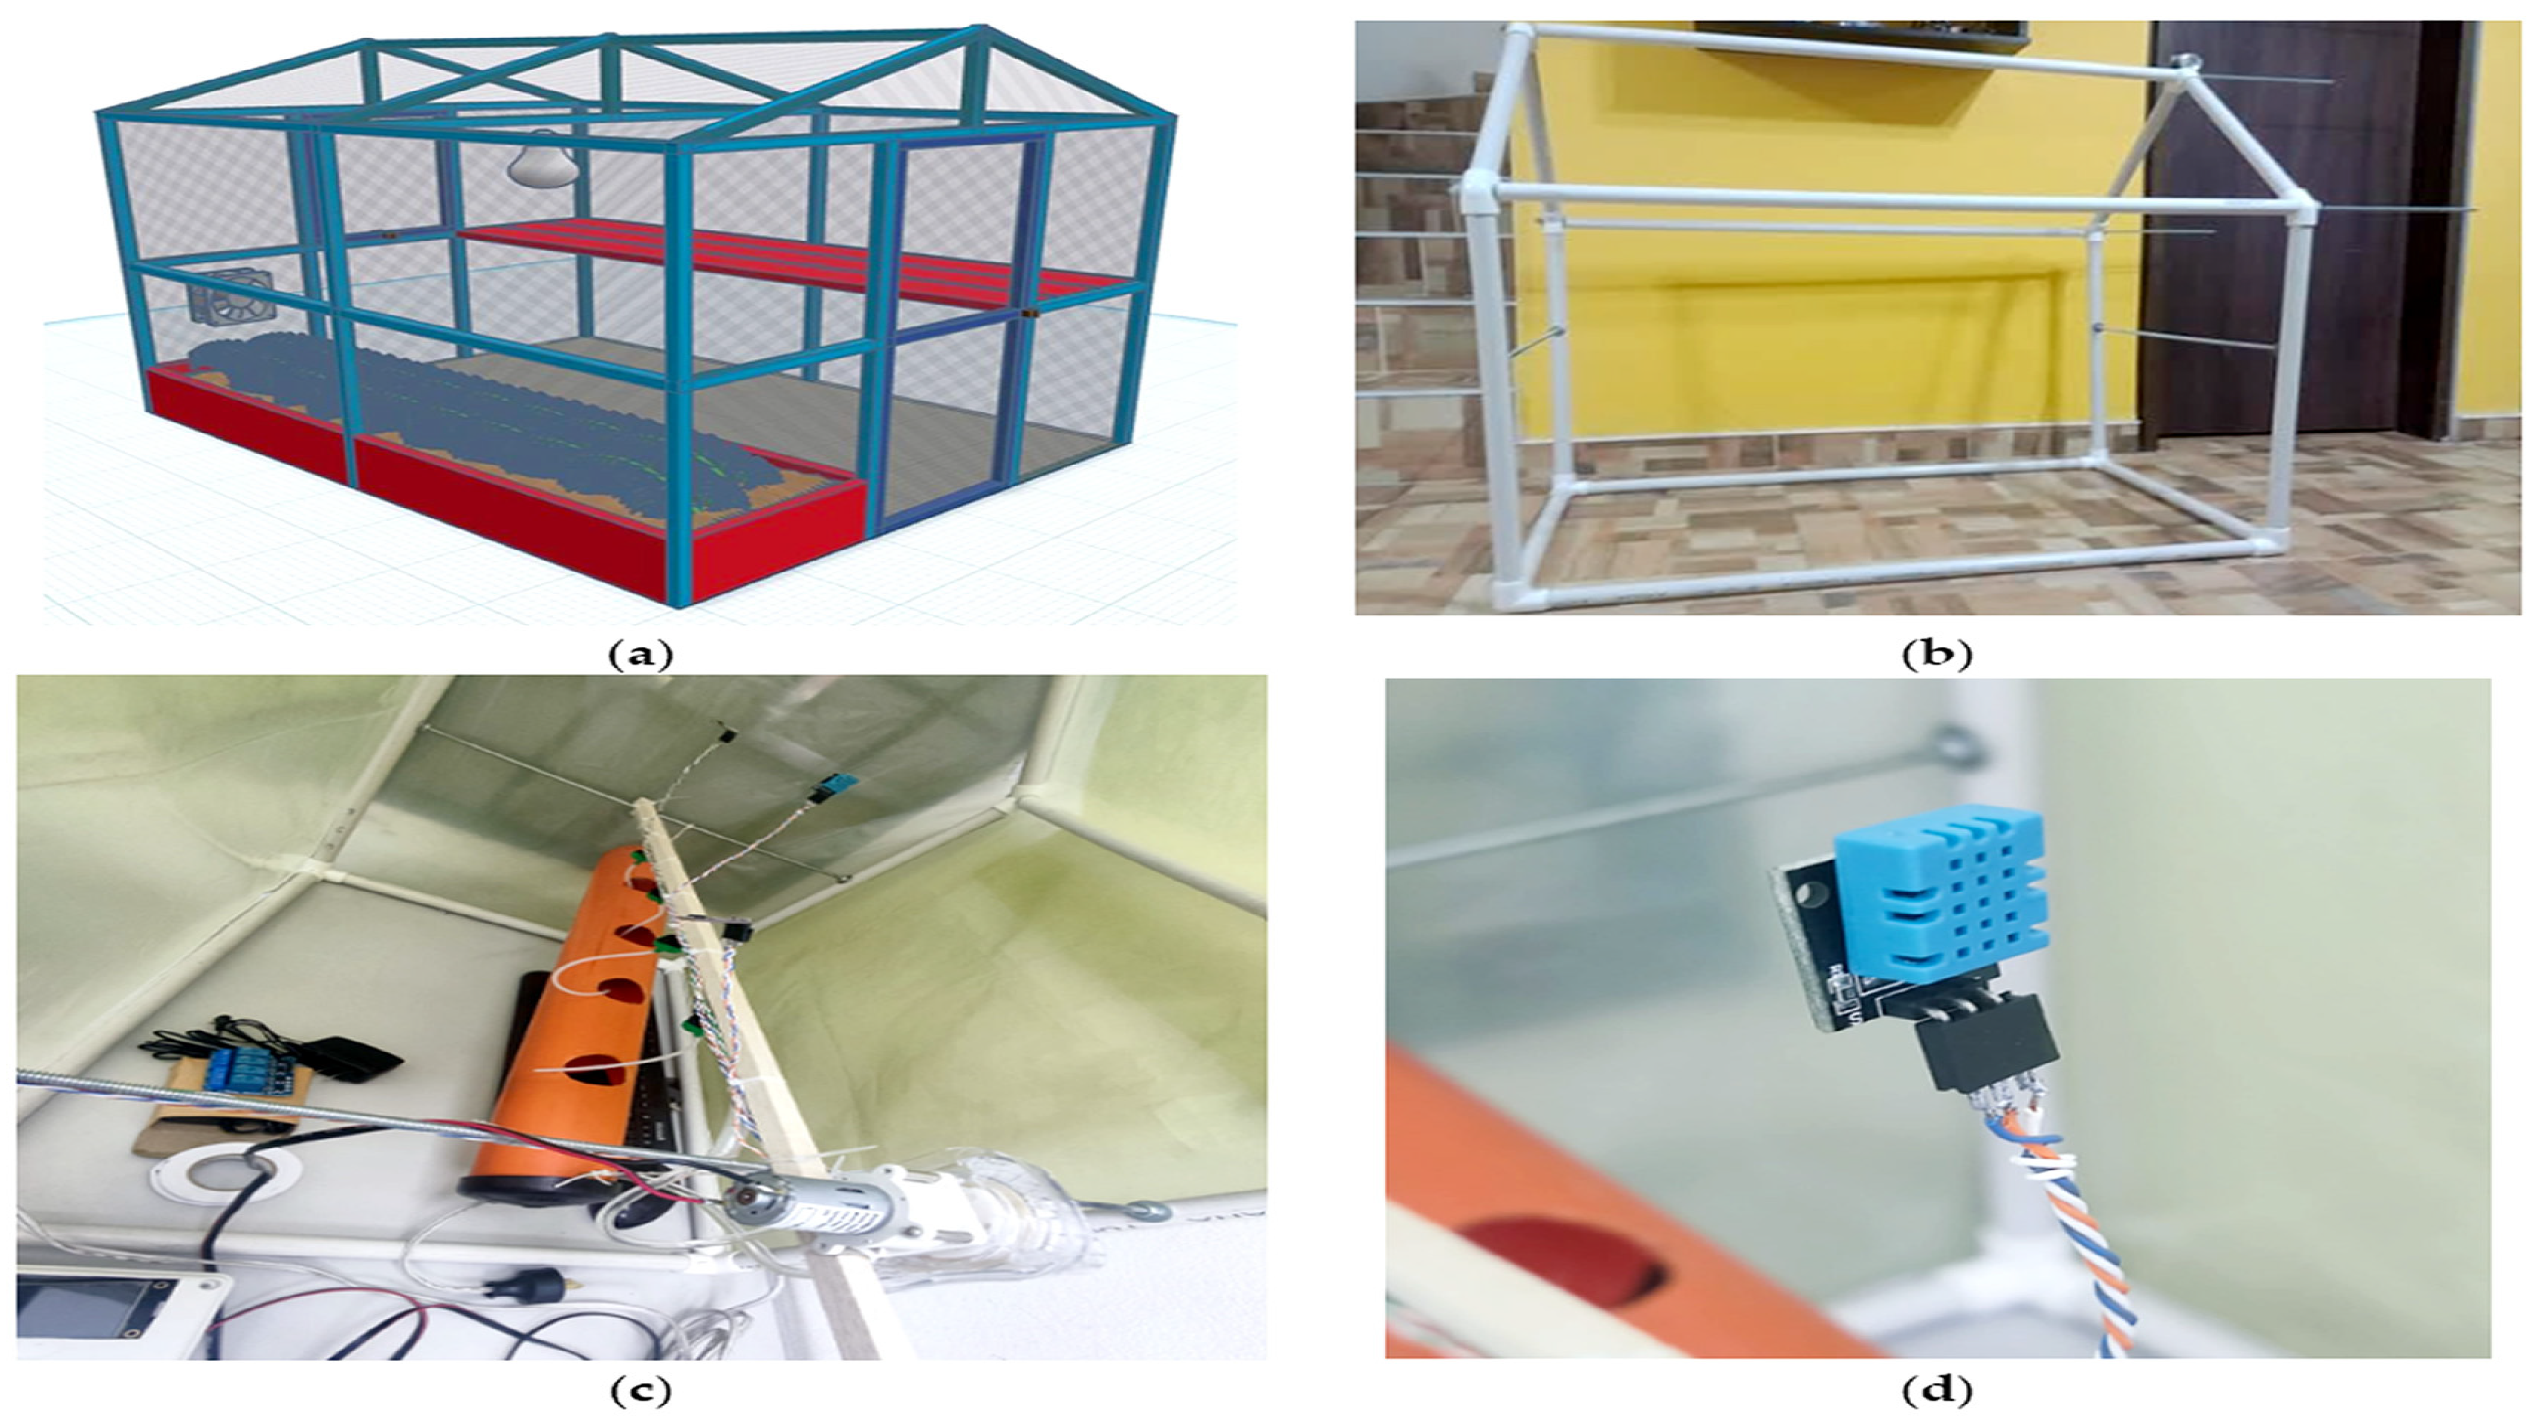
The system objectives and critical control variables (temperature, humidity, solar radiation, pH, and nutrients) were defined. The prototype was implemented and tested at Universidad ECCI (Bogotá, Colombia). The base structure was fabricated from PVC, measuring 1.80 × 1.20 × 1.80 m, allowing for modularity and scalability. The selected devices included a DHT11 temperature/humidity sensor (Aosong Electronics Co., Guangzhou, China), flow meters, solar radiation sensors, and ESP32-CAM camera modules (Espressif Systems, Shanghai, China). Data were acquired using an STM32 Nucleo-F446RE development board (STMicroelectronics, Geneva, Switzerland) and displayed on a Nextion HMI screen (ITEAD Intelligent Systems, Shenzhen, China), programmed with Nextion Editor (v1.65.1).
Figure 4a–d show the details of the prototype smart greenhouse model designed at Universidad ECCI.
2.2. Phase 2. IoT System Implementation
In this phase, a distributed network of sensors linked by ESP32 modules (Espressif Systems, Shanghai, China) was implemented to acquire and transmit environmental data in real time. The system included sensors for indoor and outdoor greenhouse temperature, air and substrate humidity, and solar radiation (luminosity), all connected via a local Wi-Fi network. Additionally, two ESP32-CAM cameras were installed, oriented toward the lettuce plants and programmed to capture images four times a day to analyze leaf growth using fractal techniques [
12,
13,
14].
Sensory and visual data were collected continuously over a period of approximately 60 days and stored in a central database linked to the Power BI platform (Microsoft Corp., Redmond, WA, USA; v2.149.1203.0). From there, the data were processed to analyze correlations between environmental variables and crop development. Based on this information, an intelligent chatbot was integrated to provide the farmer with daily feedback on crop status, including automatic recommendations for adjusting irrigation, internal temperature, and greenhouse light levels.
This IoT architecture, based on data exchange between ESP-32 nodes, enabled the near-real-time monitoring and remote visualization of the greenhouse variables. Similar IoT deployments in controlled environment agriculture report practical benefits in monitoring, energy awareness, and operational management [
4,
15]. Furthermore, integration with Power BI and the chatbot enabled the creation of an interactive precision agriculture model, combining quantitative analysis, visual diagnostics, and real-time advice for growers [
4].
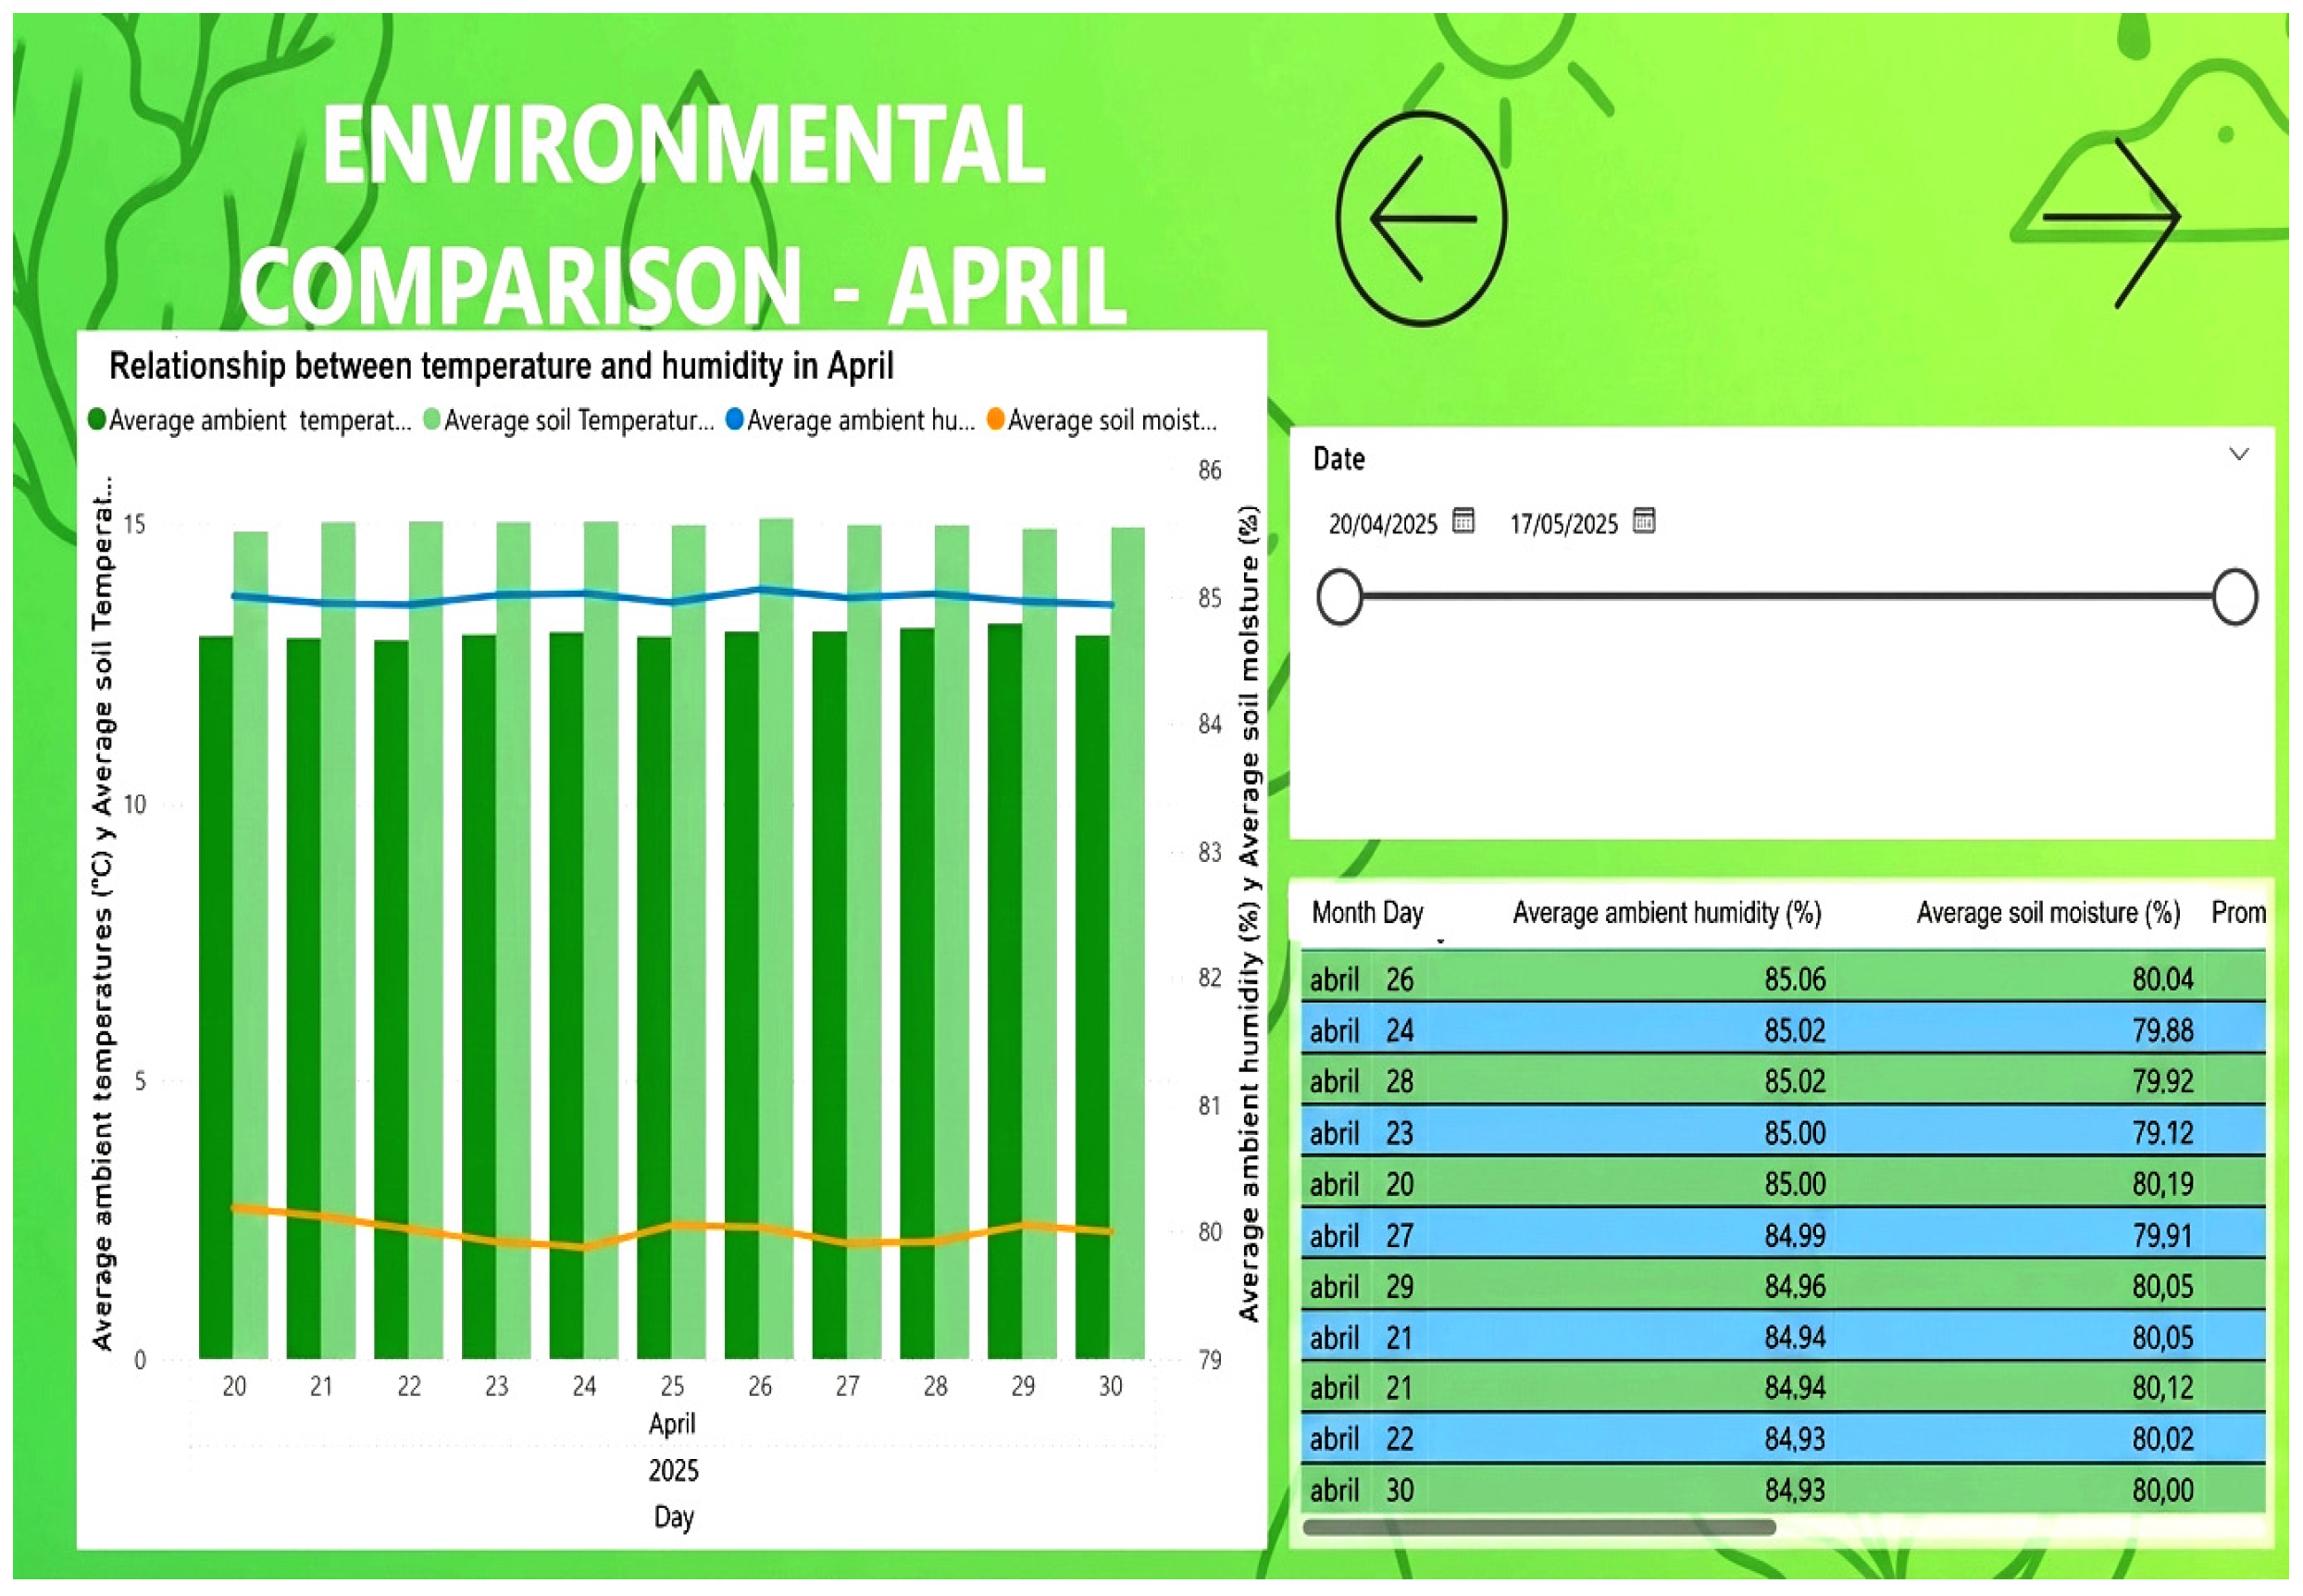
Figure 5 shows the details of data capture in Power BI, displaying the temperature and humidity levels in the greenhouse for the month of April.
2.3. Phase 3. Image Processing and Analysis
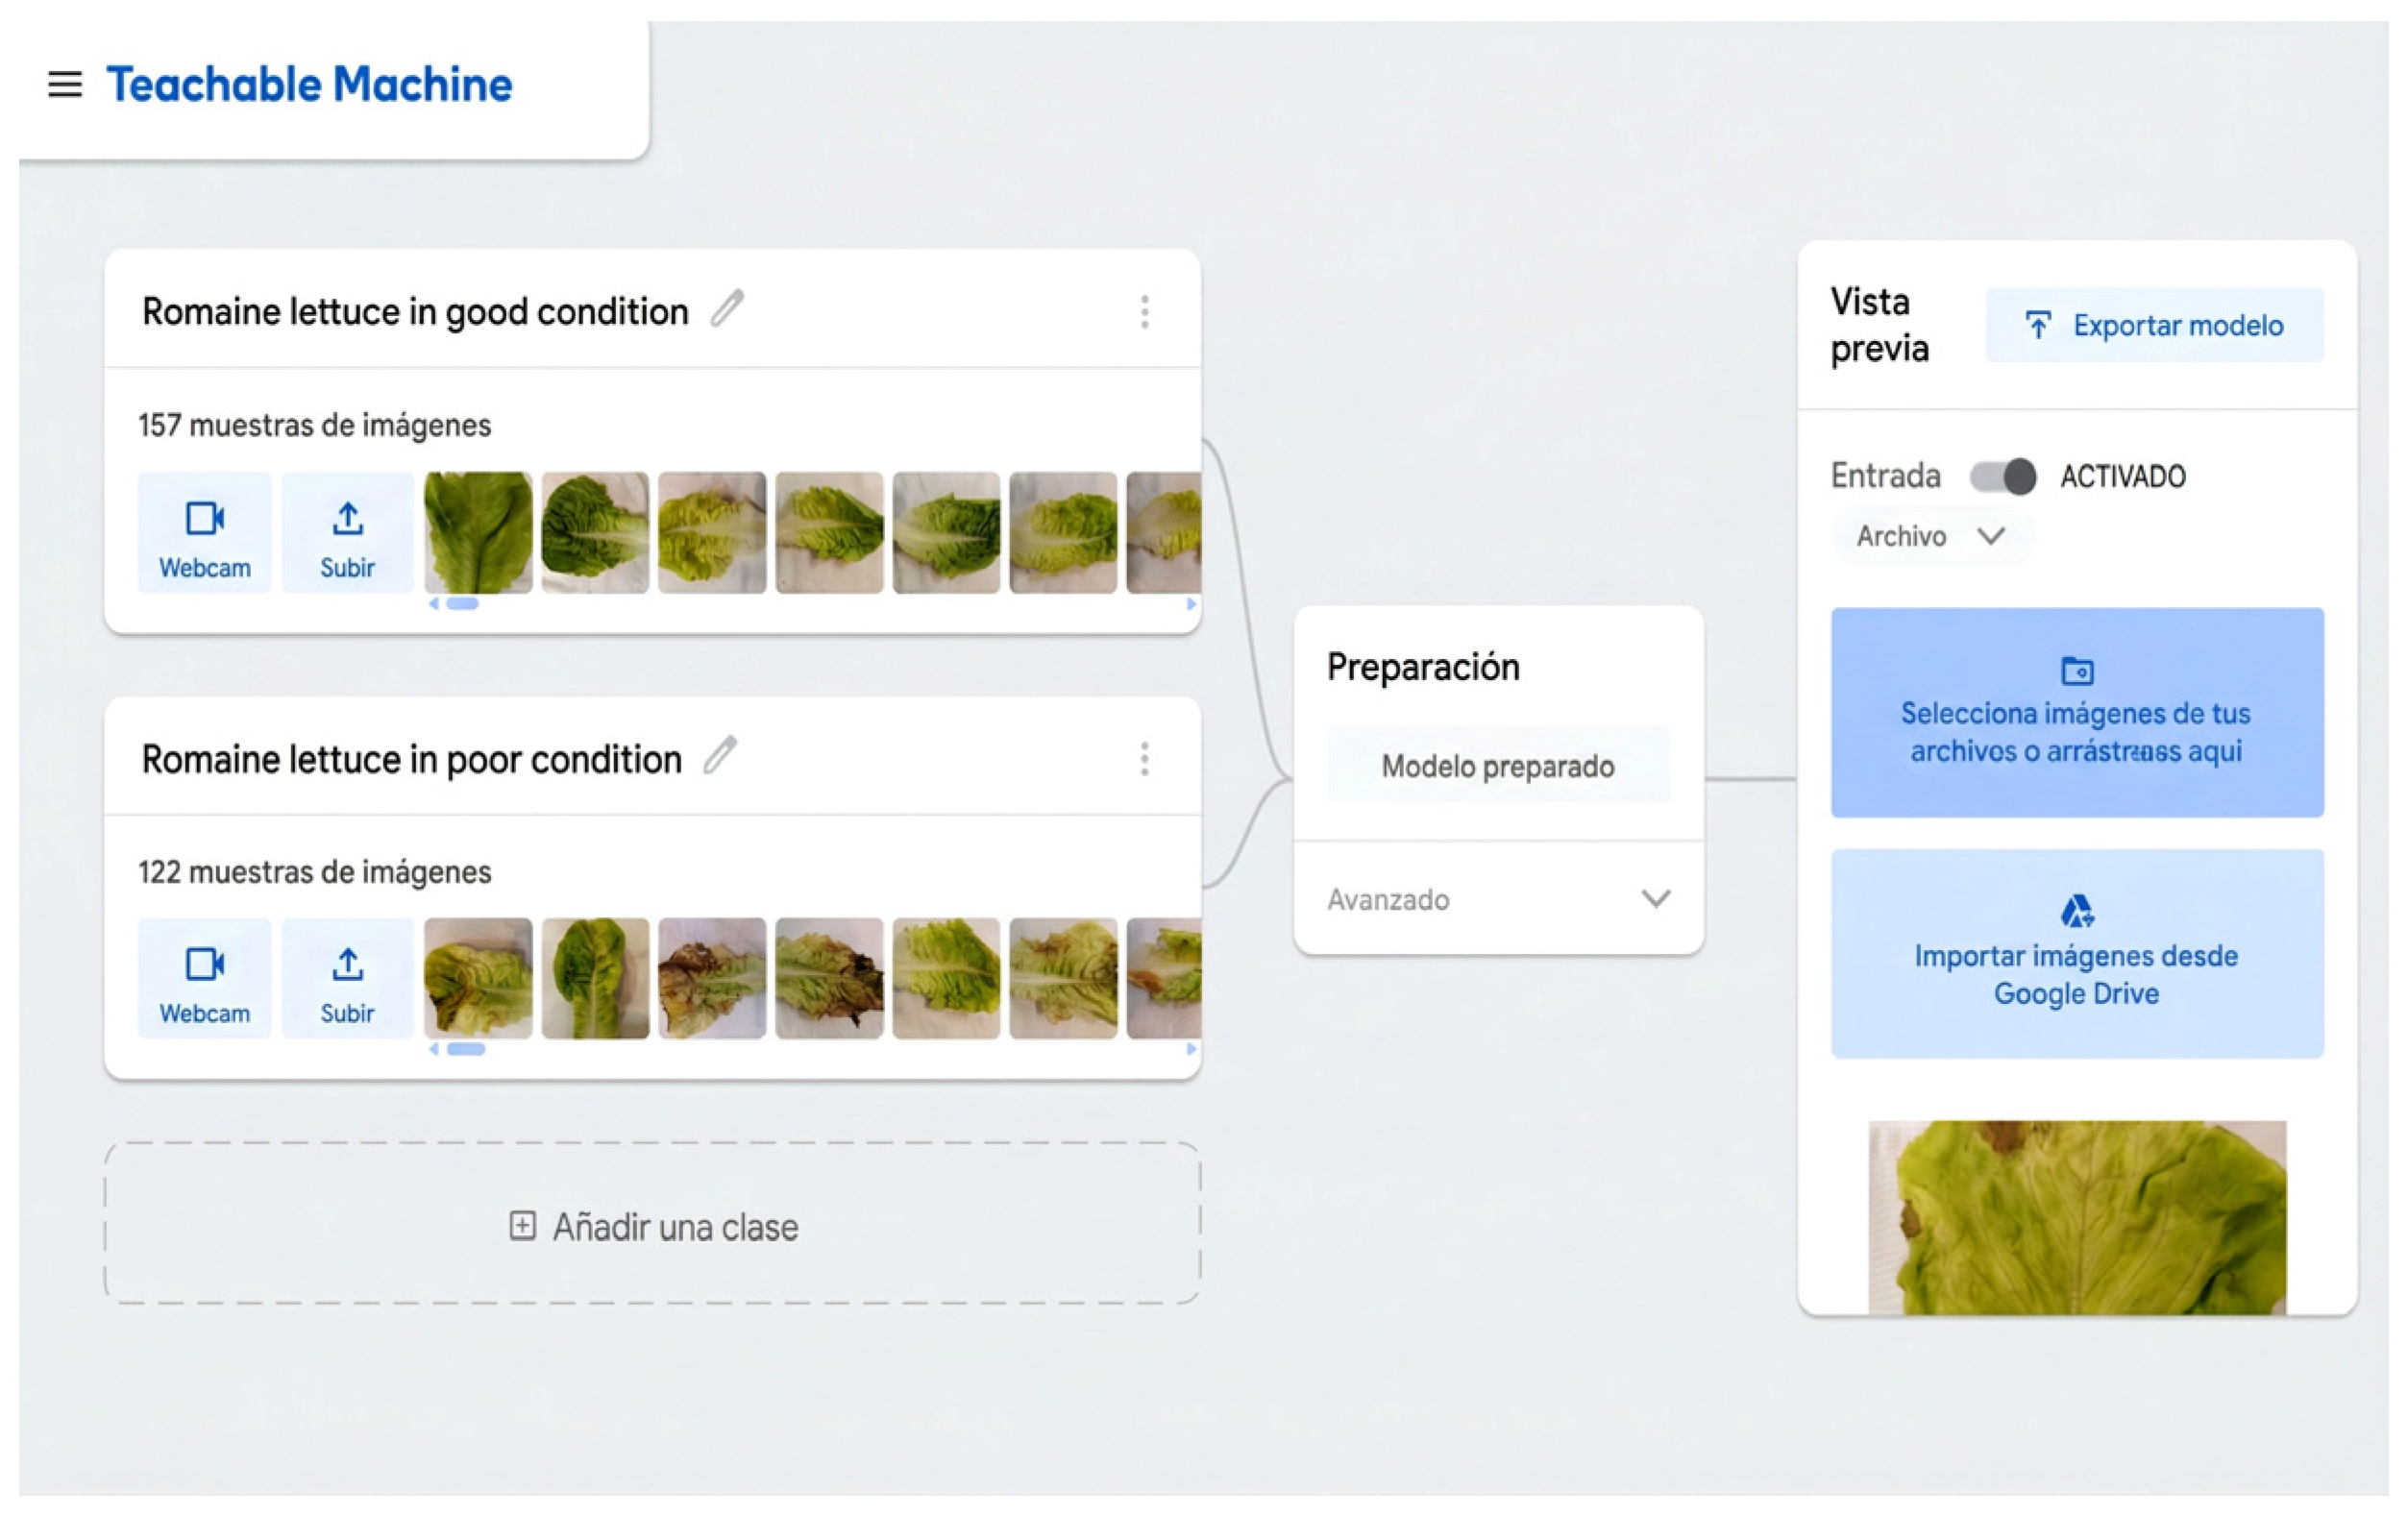
For visual growth monitoring, an AI-based image classification model was used. A dataset of 1500 labeled images was collected during prototype operation and used to train a binary classifier (optimal vs. deficient lettuce) on the Teachable Machine web platform [
16] (Google LLC, Mountain View, CA, USA; version 2025; accessed on 21 January 2026). An independent held-out subset of 350 images was reserved for final testing and was not used during training/validation. Subsequently, a fractal texture analysis was applied using MATLAB (MathWorks, Natick, MA, USA; version R2025b), allowing for the quantification of morphological similarity between leaves and the determination of the optimal crop stage.
Figure 6 shows the initial class training setup with representative examples.
The dataset includes variability in viewpoints and illumination conditions typical of the deployment. Images were labeled to denote two practical classes (optimal/deficient) based on visible leaf quality and growth condition. The final test set confusion matrix and class-wise precision/recall/F1 metrics (reported in Image Classification Performance Section) correspond to the independent held-out subset (n = 350) and indicate 97.1% overall accuracy under the pilot conditions. As a proof of concept, these results support feasibility; nevertheless, generalization to other greenhouses, cameras, lighting conditions, and lettuce cultivars should be validated in multi-site experiments.
Fractality refers to the geometric property by which certain natural objects exhibit self-similar patterns at different scales. In the case of lettuce leaves, the complexity of their edges and surface texture can be quantitatively described by their fractal dimension (Df), which represents the degree of irregularity or fragmentation of the structure [
12,
13].
Unlike conventional statistical texture methods, fractal geometry allows us to capture the self-similarity and structural complexity of the leaf, better reflecting the physiological changes associated with water stress and cell density [
13,
14,
17].
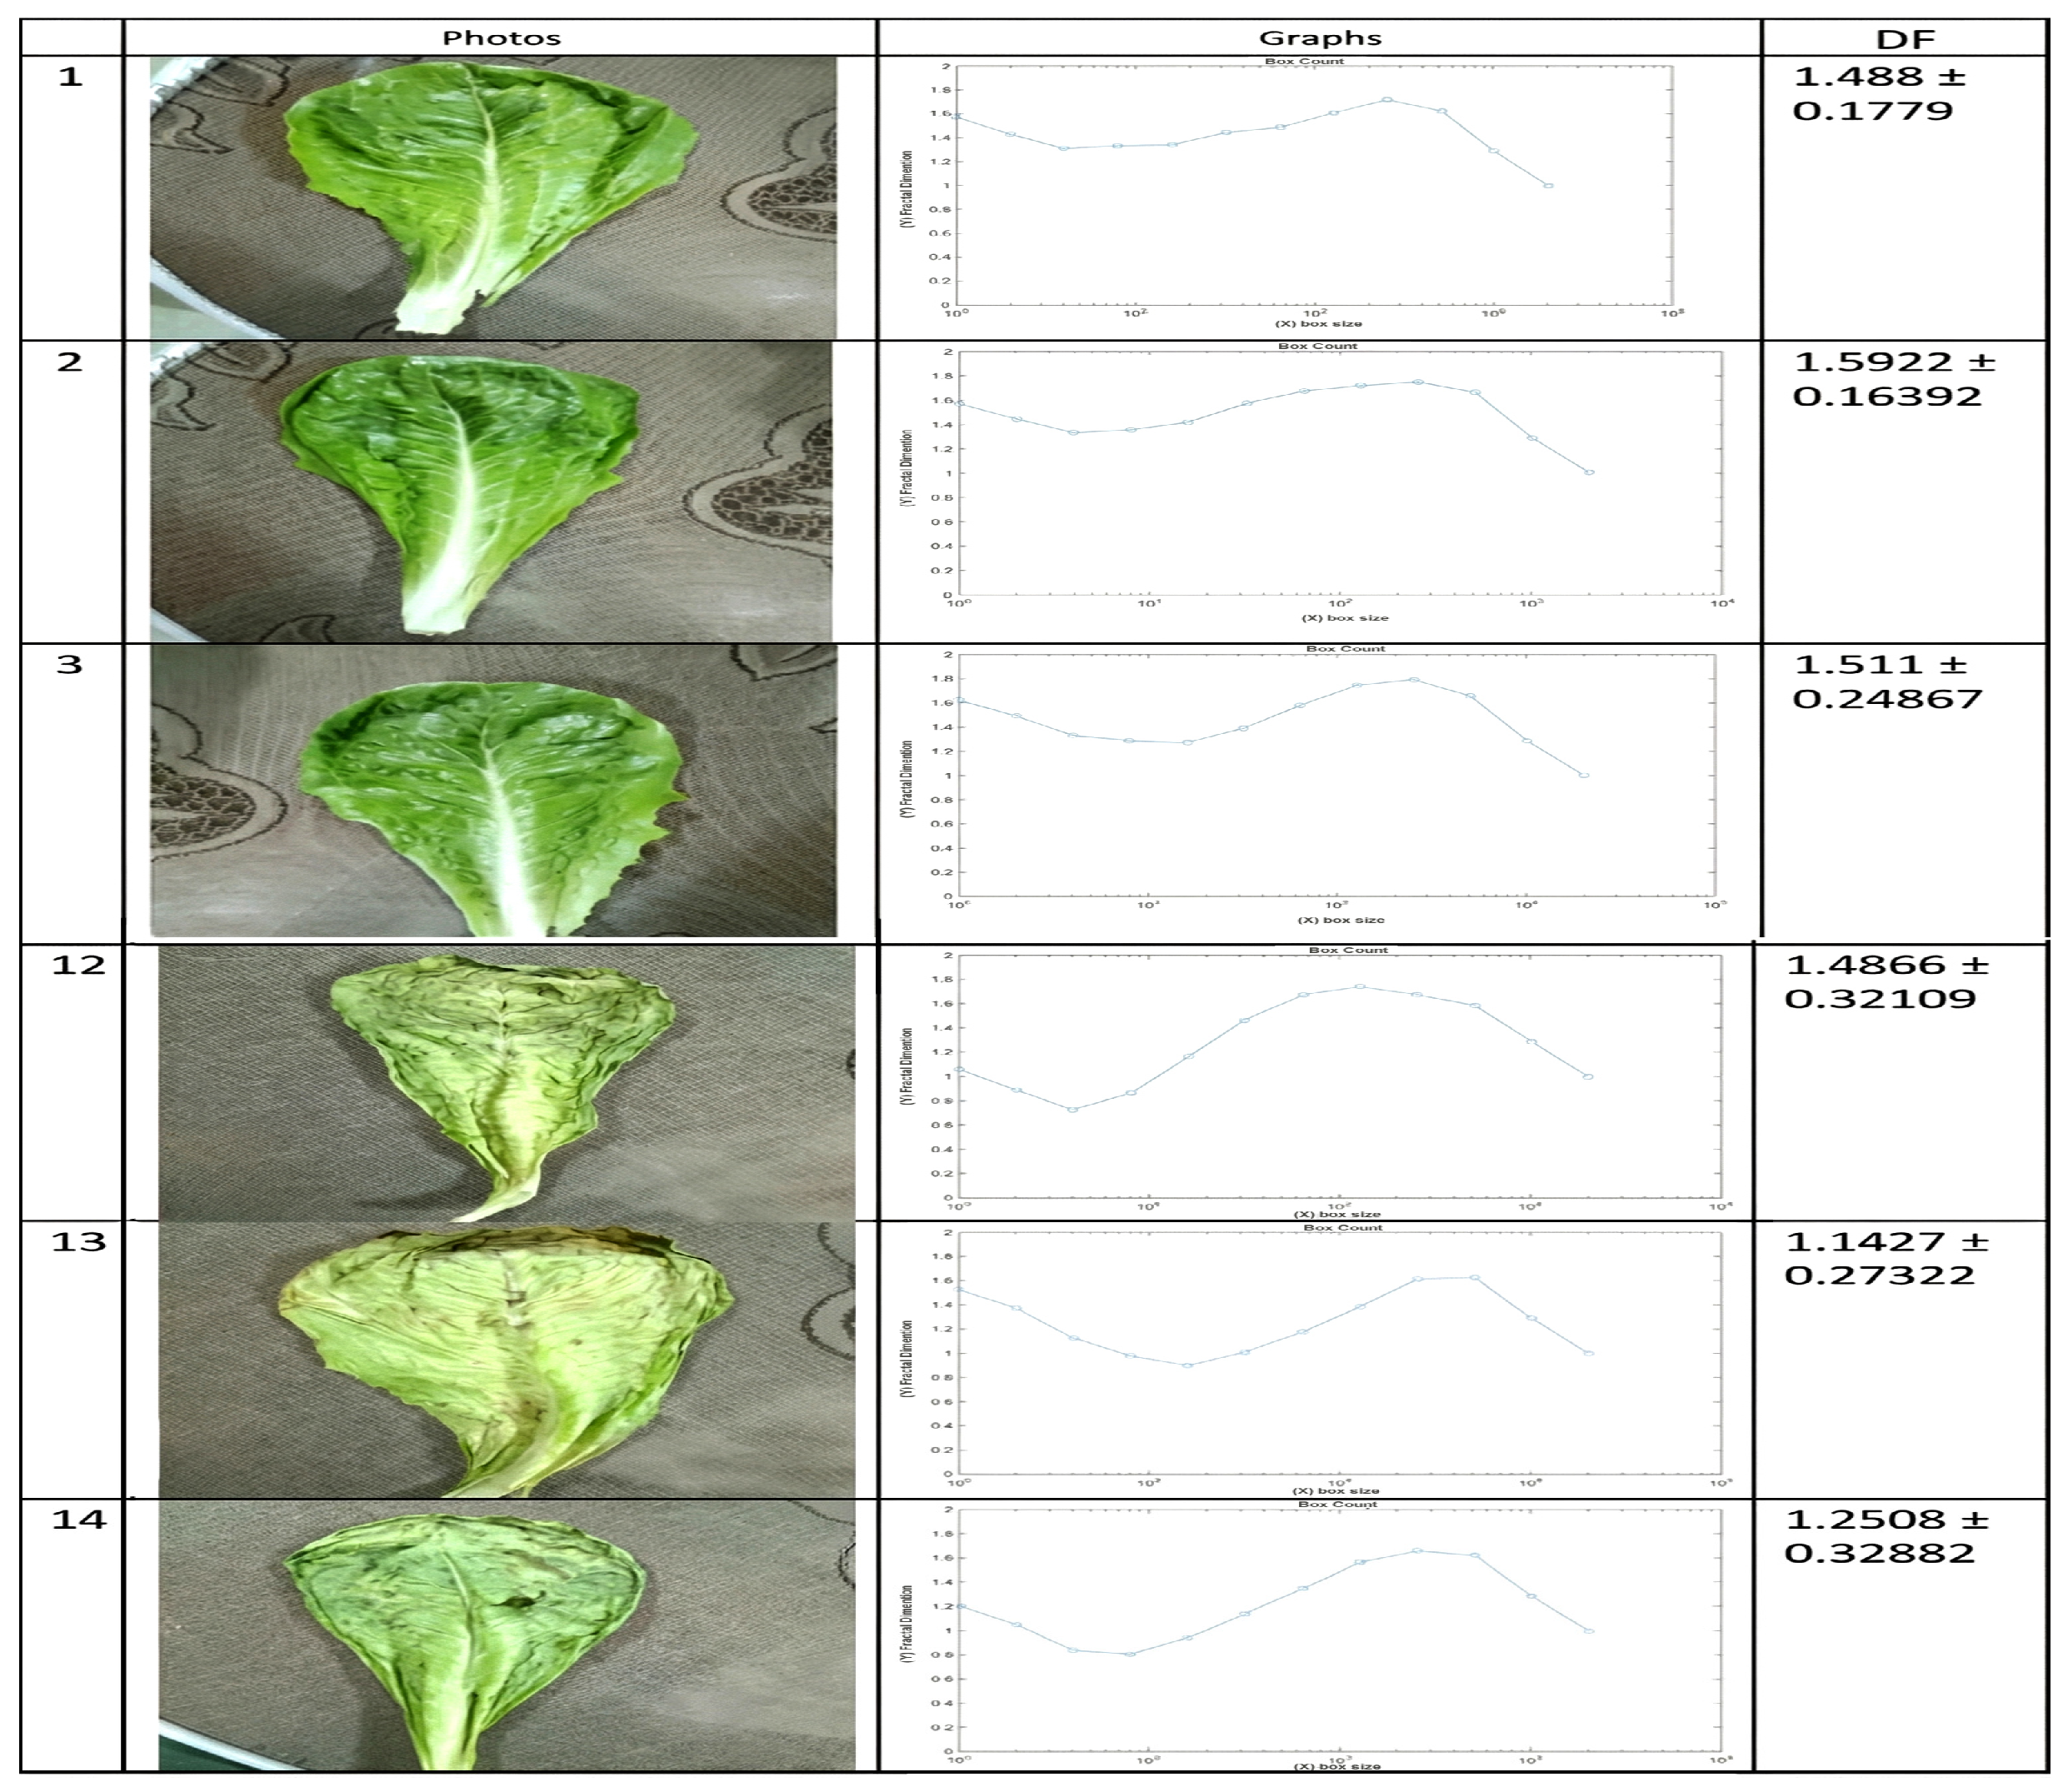
Figure 7 shows the results obtained using MATLAB’s box-counting tool for a fractal analysis of lettuce samples, including the image, the response curve, and the quantitative value associated with each classification. The numbers shown in the first column correspond to representative sample IDs. Additional details of the box-counting utility are available at the MATLAB Central File Exchange page (accessed on 21 January 2026).
For reproducibility, the MATLAB implementation used in this work is provided as
Supplementary File S1 (boxcount.m) and
Supplementary File S2 (lechugaoptima.m).
where N(ε) is the number of boxes, and ε is the size of each one.
The graphs obtained using the box-counting method show a distinct behavior between healthy lettuce leaves (images 1–3) and those with physiological deterioration (images 12–14). Healthy leaves exhibit a denser foliar structure with uniform edges and a stable self-similarity pattern, reflected in fractal dimension values between 1.65 and 1.70. This high fractal dimension (Df) indicates a surface with a compact texture, associated with balanced growth and adequate cell turgor. In contrast, the damaged leaves show a decrease in fractal dimension to values close to 1.50–1.55, denoting a loss of morphological continuity, irregular contours, and possible effects of water stress or nutritional deficiency [
13,
14,
17]. The slopes of the corresponding log–log curves show a lower density of occupied boxes in these samples, confirming the structural degradation of the leaf. Therefore, the fractal dimension is consolidated as a quantitative and non-destructive indicator of the physiological state of the plant, allowing for precise differentiation between vigorous and deteriorated leaves without the need for physical intervention, in accordance with the results reported by [
14,
16,
17].
2.4. Phase 4. Water Resource Saving System
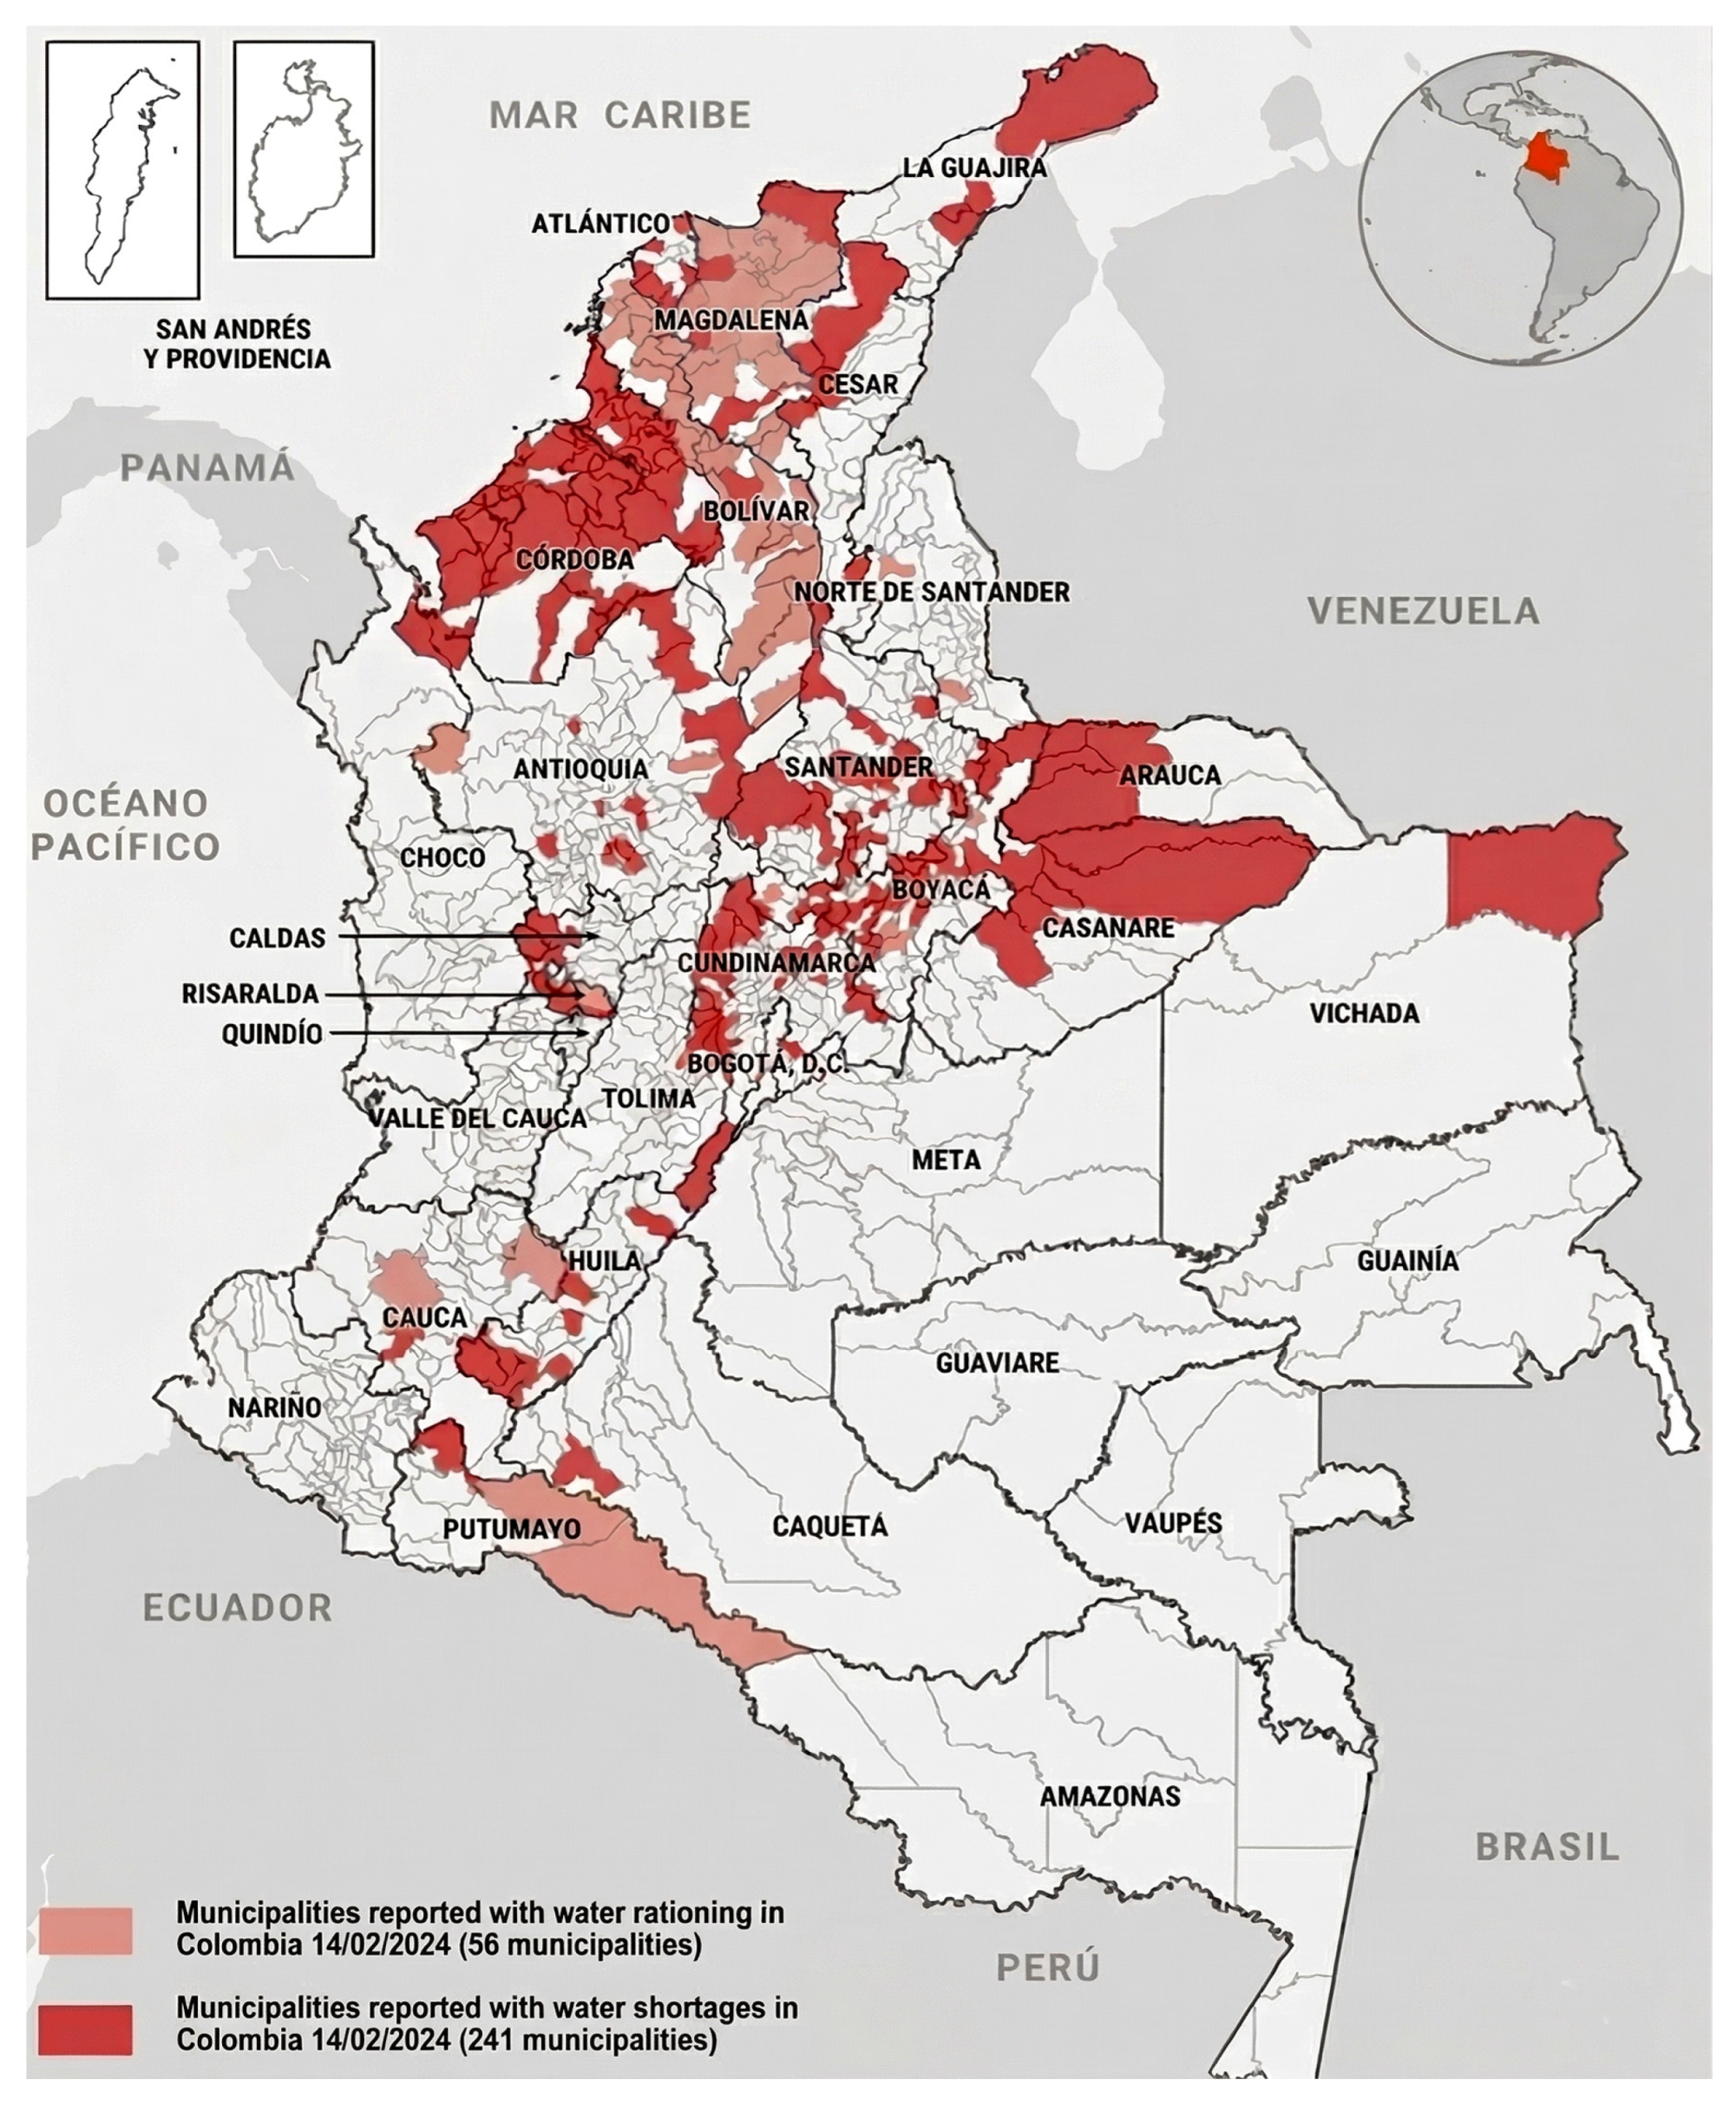
As can be seen in
Figure 8, a significant number of municipalities are at risk of water rationing and shortages. This could affect approximately 1.7 million people in the event of a moderate El Niño phenomenon and up to 3 million in the event of a strong El Niño phenomenon, according to reports from the Colombian National Unit for Disaster Risk Management (UNGRD).
In Colombia, a review of official documents reveals a crisis in the integrated management of water resources, exacerbating problems associated with their use, exploitation, and availability (quality and quantity), as detailed in the technical report of the National Water Governance Program [
2]. This crisis generates conflicts among the actors involved in water management due to a lack of ownership of responsibilities that would allow for proper administration and appropriate planning.
The need to guarantee the integrated management of water resources is a primary objective for the Colombian State and is directly aligned with global policies such as the Sustainable Development Goals (SDGs), in particular Goal 6: “Ensure availability and sustainable management of water and sanitation for all” [
18,
19]
The review of the specialized literature highlights rainwater harvesting and graywater reuse as viable options to reduce dependence on freshwater sources, particularly in water-stressed contexts [
20,
21]. Graywater typically originates from kitchens, bathrooms (excluding toilets), dishwashers, washing machines, and showers; when properly separated and treated, it can be reused for non-potable applications such as irrigation [
21,
22].
For example, Rodrigues et al. [
21] present design considerations for combined rainwater harvesting and graywater reuse systems in urban settings, emphasizing storage sizing, treatment train selection, and operational constraints.
When reuse is considered, it is necessary to evaluate collection points, collection methods, and key water quality parameters and to select an appropriate treatment approach based on the intended end use [
21,
22].
Graywater from residential buildings can constitute between 50% and 80% of total wastewater. While it is generally not suitable for direct human consumption, it can be used for irrigation after simple treatments such as sedimentation and gravity filtration, depending on local guidelines and risk management [
22].
This project proposes a model for improving water resource use and thermal process efficiency by integrating multiple sources (rainwater, graywater, and mains/groundwater), along with solar thermal heating. Graywater is assumed to originate from the final rinse cycles of washing machines or sinks and to be treated through sedimentation and filtration before storage and reuse for irrigation and/or heating support [
21,
22]. Rainwater contribution is included when available and is subject to seasonal rainfall variability in Colombia [
11].
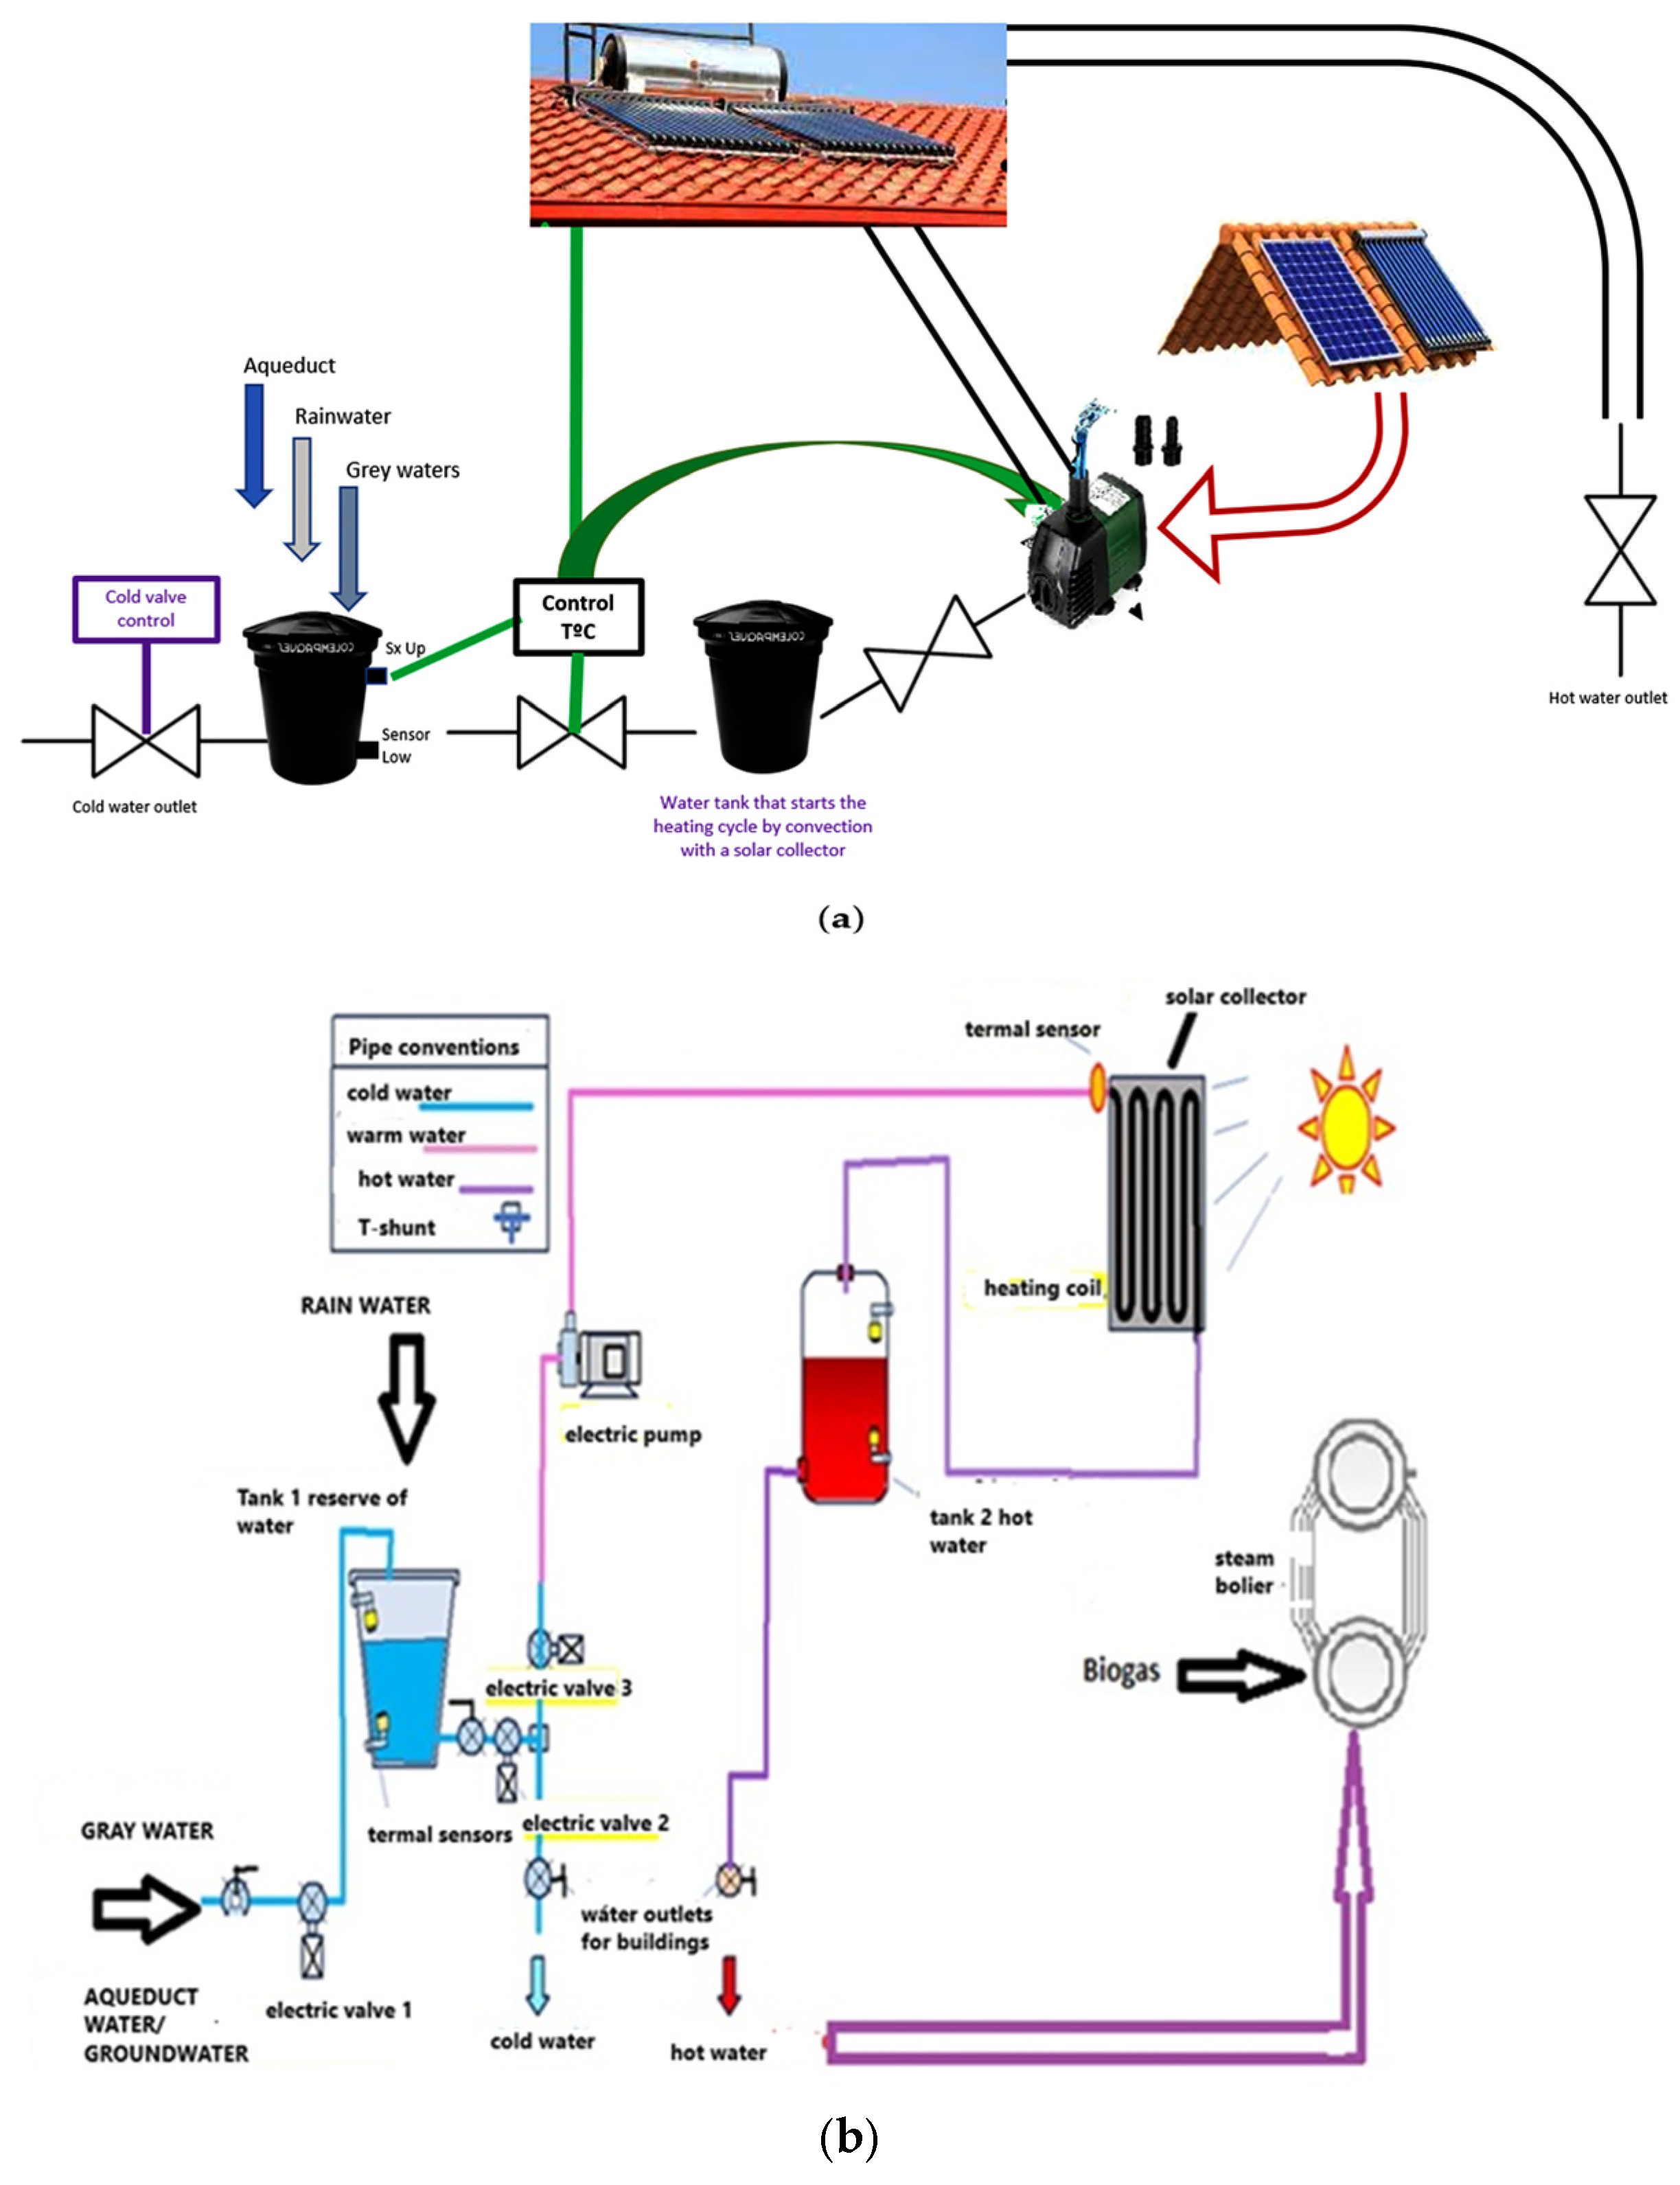
Figure 9a shows a schematic diagram of the integrated water management and heating system, while
Figure 9b presents a simplified diagram of the cold water control system (mains, rainwater, graywater) and pumping to roof-mounted solar collectors.
The water system utilizes rainwater and graywater treated through sedimentation and filtration. A main tank was designed with level sensors (minimum and maximum) that control a pump and solenoid valves via an Arduino Uno microcontroller (Arduino, Monza, Italy).
Water heating is achieved using a flat-plate solar collector with 80% thermal efficiency and a capacity of 125 L, reaching temperatures between 50 and 70 °C.
The circulation pump (1.3 kW, 50 m head) is powered by a 2 kW photovoltaic system, which can cover up to 80% of the greenhouse’s daily energy consumption.
For the operation of the storage system, water is taken from the conventional aqueduct system (or from groundwater or nearby water sources).
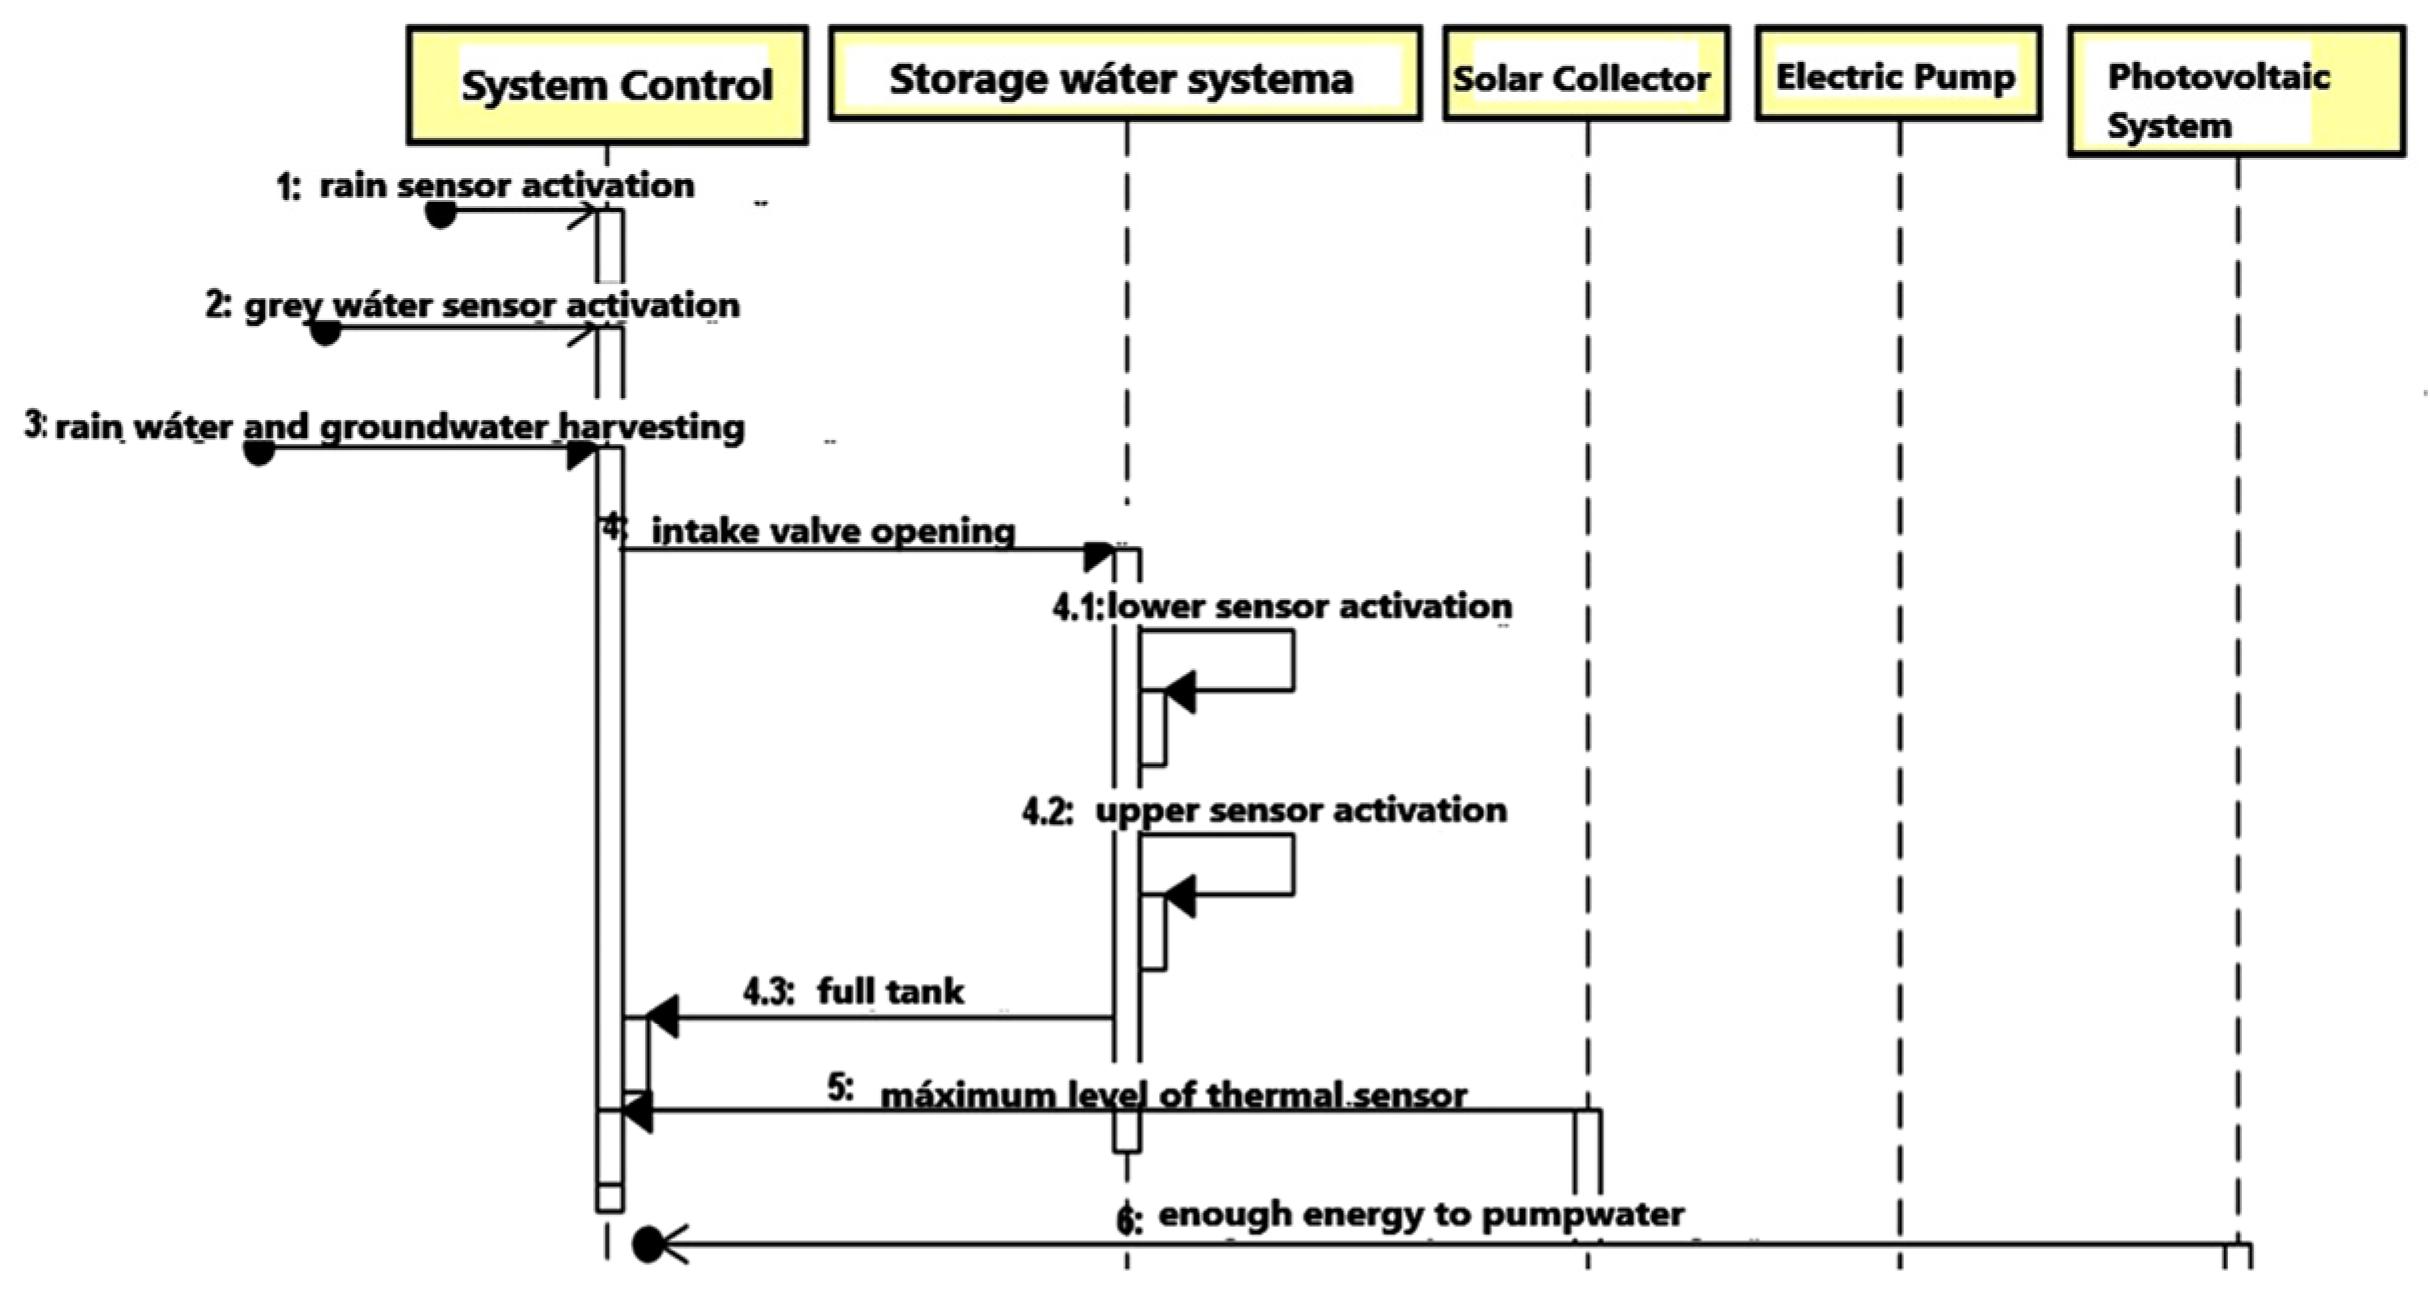
Figure 10 shows a sequence diagram for the operation of the entire water saving and heating system.
As shown in the sequence diagram, once the water level sensors are activated, they send a signal to open the inlet valve to the storage tank. Once the tank is filled to the user-set level, the water can be used for various purposes, such as flushing toilets, watering plants, and cleaning floors, among others. The control system awaits the start of the second phase, which is activated only under two specific conditions: first, when the collector sensor detects the maximum operating temperature and second, when the photovoltaic system has sufficient energy to power the pump and initiate the water recirculation process through the solar collector. It is important to note that when the collector reaches its maximum temperature, it facilitates the pump’s operation thanks to the thermosiphon effect, which assists in pumping water.
Hot water is used for the needs of building facilities in urban or rural areas, but it can also be included as part of an initial preheating phase for steam generators.
2.5. Phase 5. Hybrid Energy Supply System
The energy system combines the local power grid and photovoltaic solar power using a 24 V inverter for 3 kW, with 600 Ah battery backup. A solar panel cleaning robot was also implemented, controlled from a digital twin developed in Siemens TIA Portal (Siemens AG, Munich, Germany; V20), with remote monitoring via an internet connection.
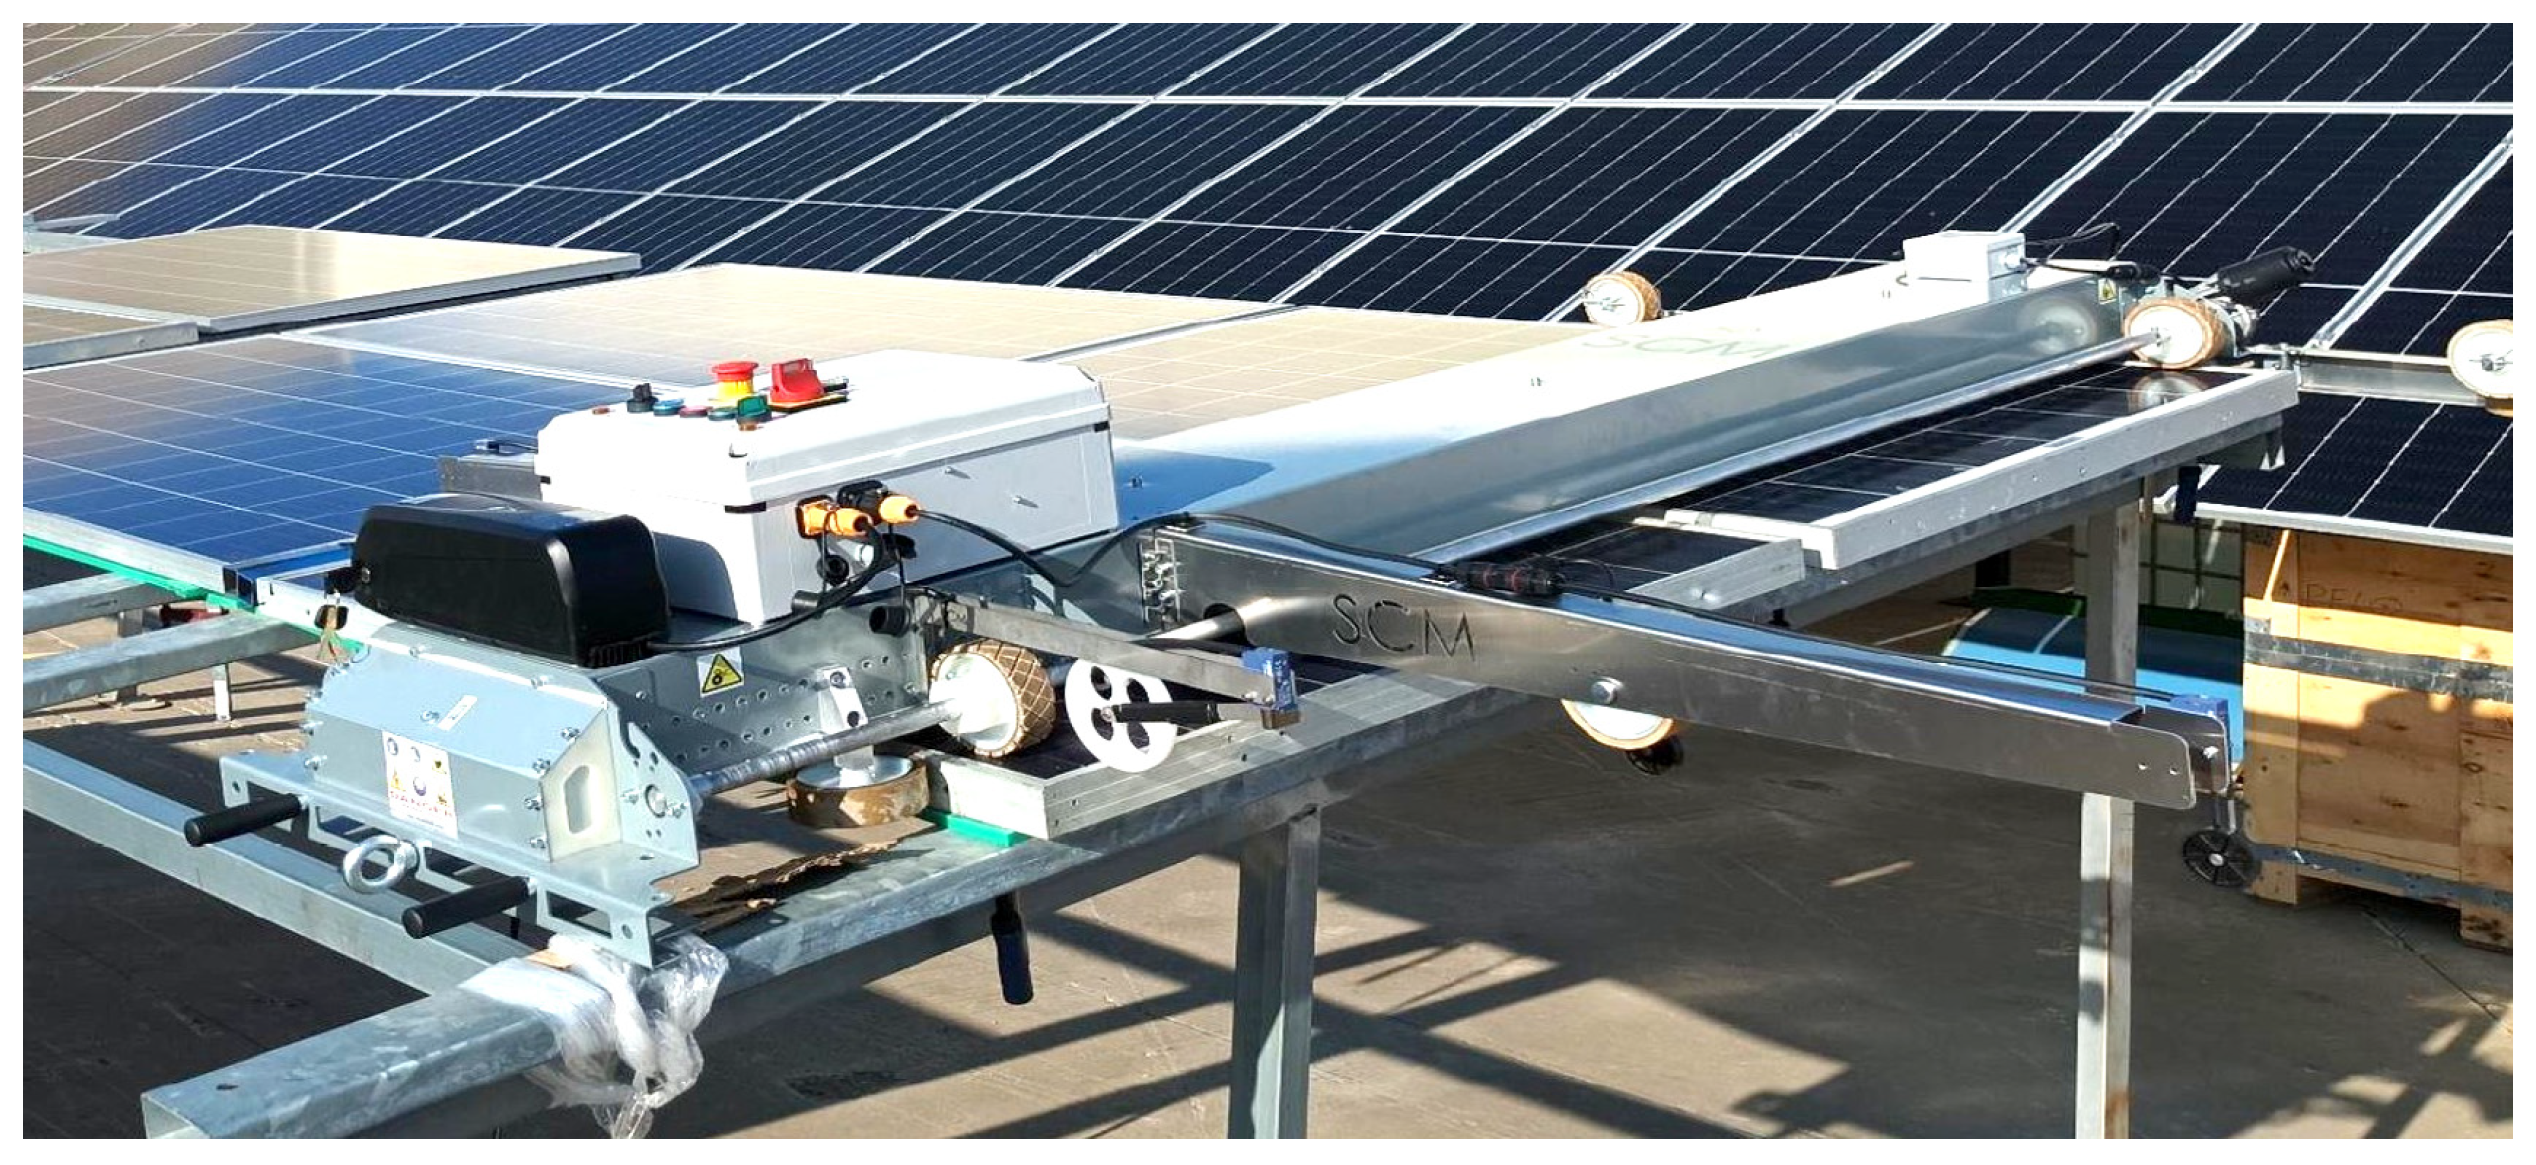
Figure 11 shows the S2 CC-DC robot from Solar Cleaner Machinery, an autonomous device specifically designed for cleaning photovoltaic solar panels installed in large fields or structures, which has been used as a reference for the digital twin designed at ECCI University.
The digital model replicates the robot’s position, energy consumption, and cleaning performance in real time, ensuring uniform cleaning across the entire panel surface. Its dual-rail drive system on the top and bottom guarantees a stable, safe, and guided path. Furthermore, we used semi-fixed roller robots as a reference, such as the S2 CC-DC model from Solar Cleaning Machinery, S.L., which employs weather-resistant materials like IP65-rated treated aluminum and features lightweight, durable components that ensure optimal outdoor performance [
23].
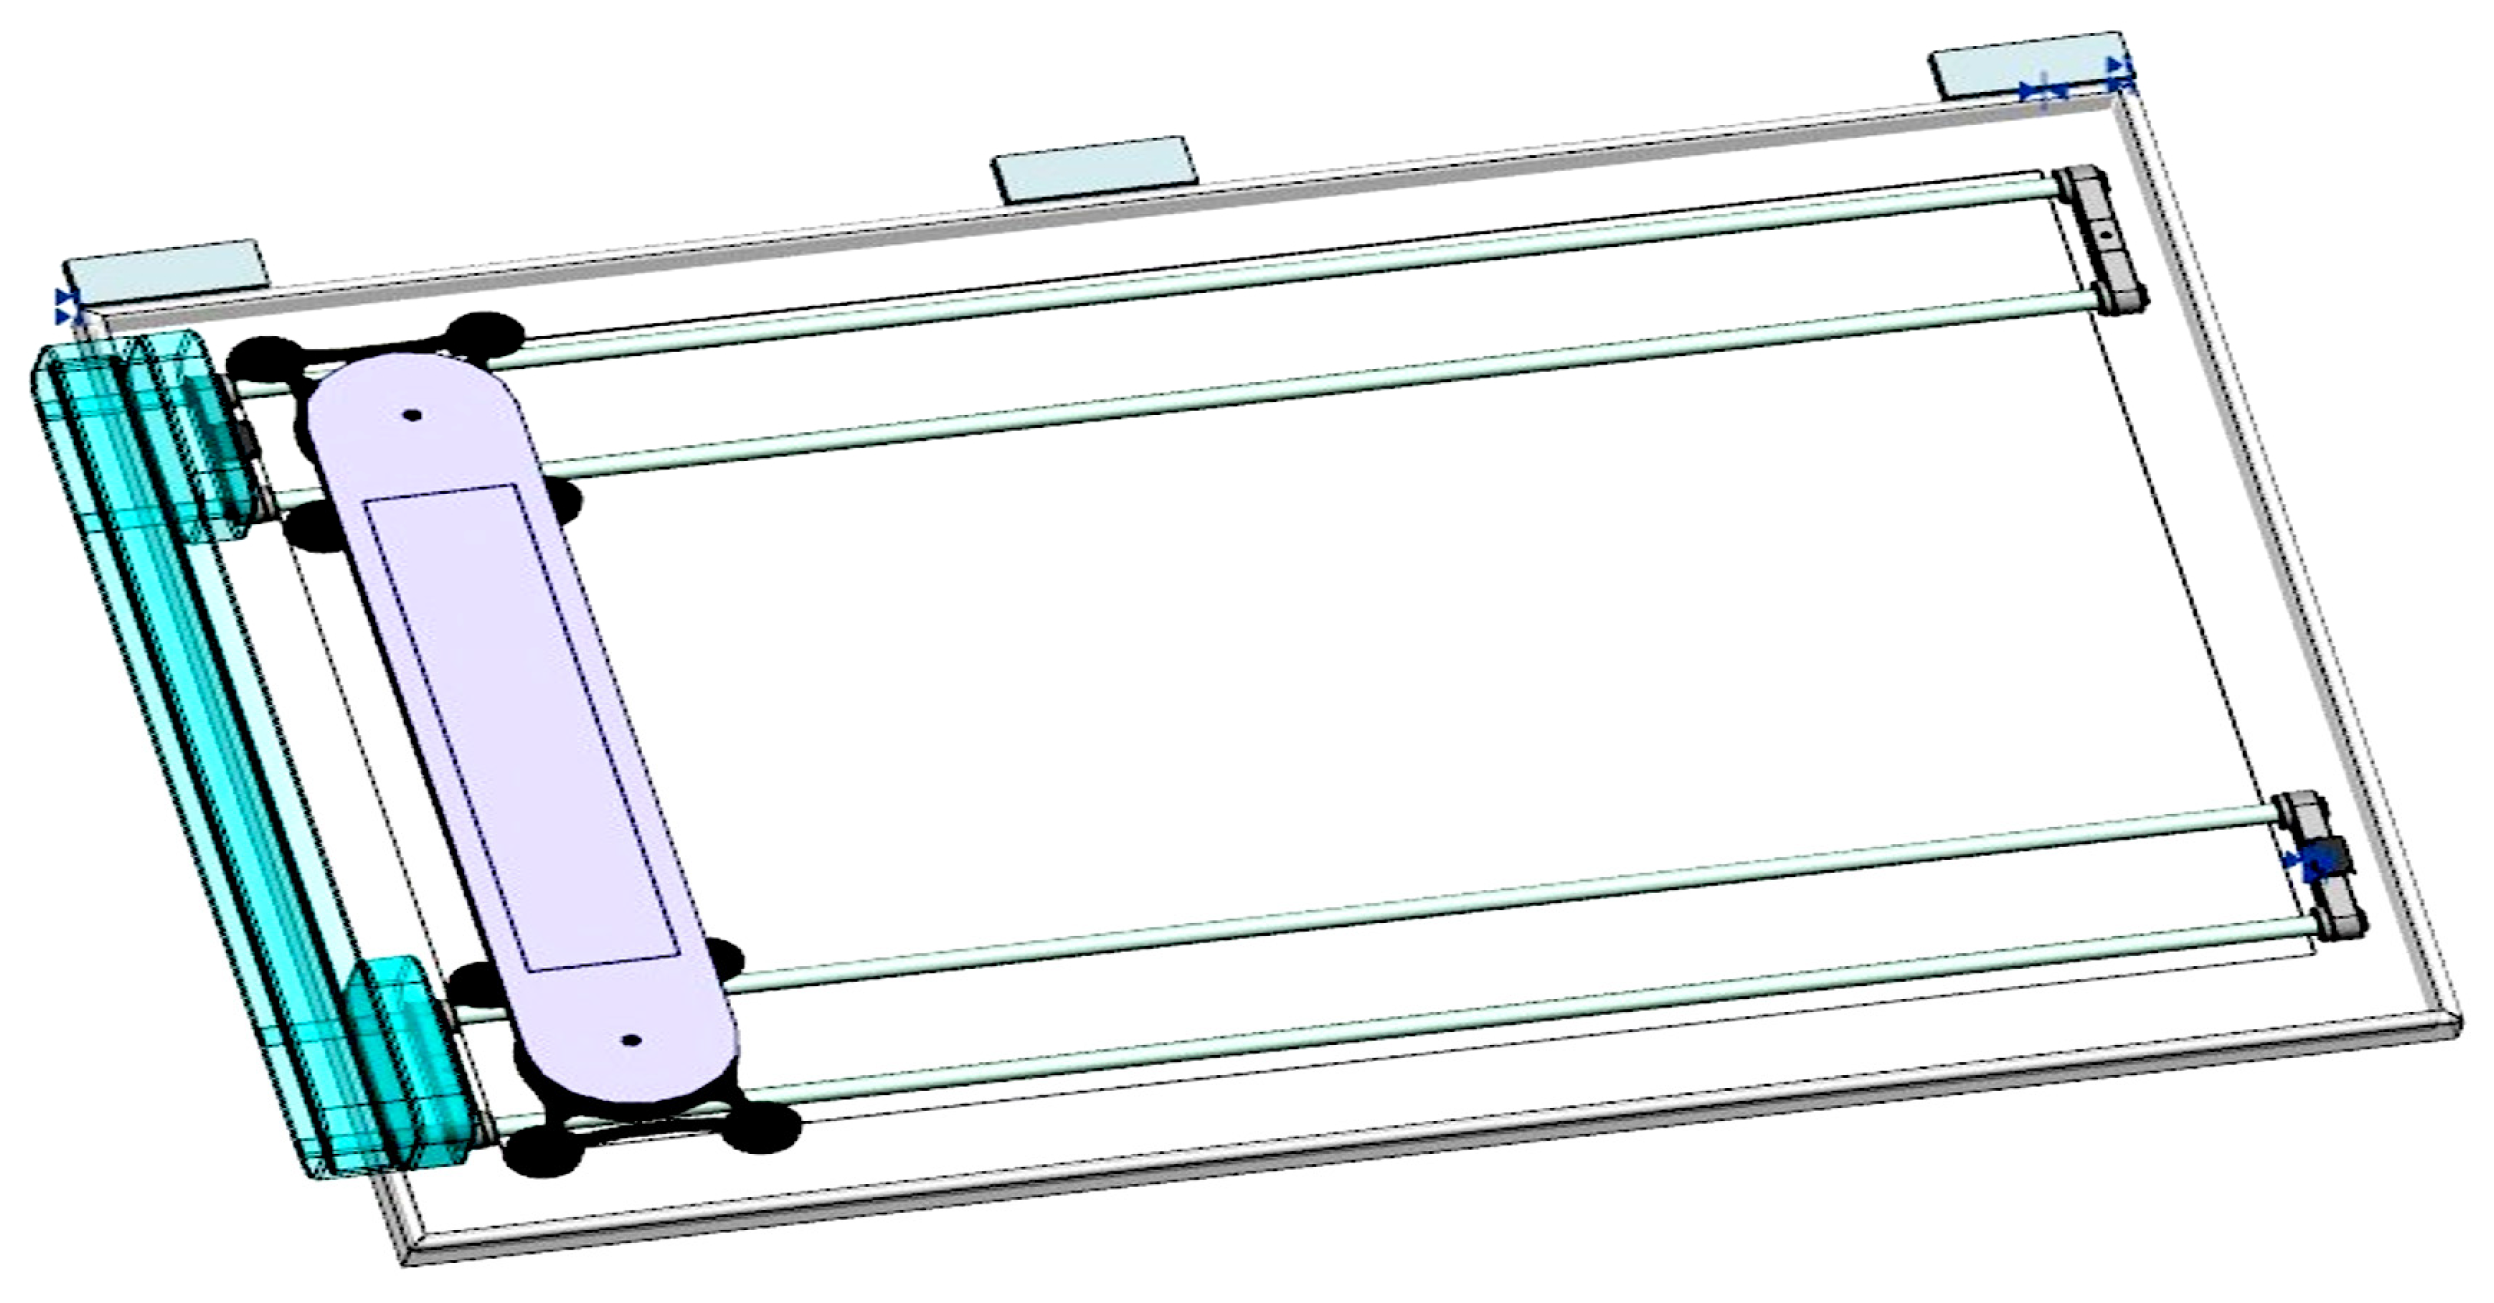
The following diagram (
Figure 12) presents the model to be used in Siemens NX (Siemens AG, Munich, Germany; version NX 2506), a model taken from GrabCAD, for the purpose of implementing routines and work cycles using an HMI that communicates with TIA Portal software (V20). For practical purposes, we refer to the model as “ECC25” throughout this report.
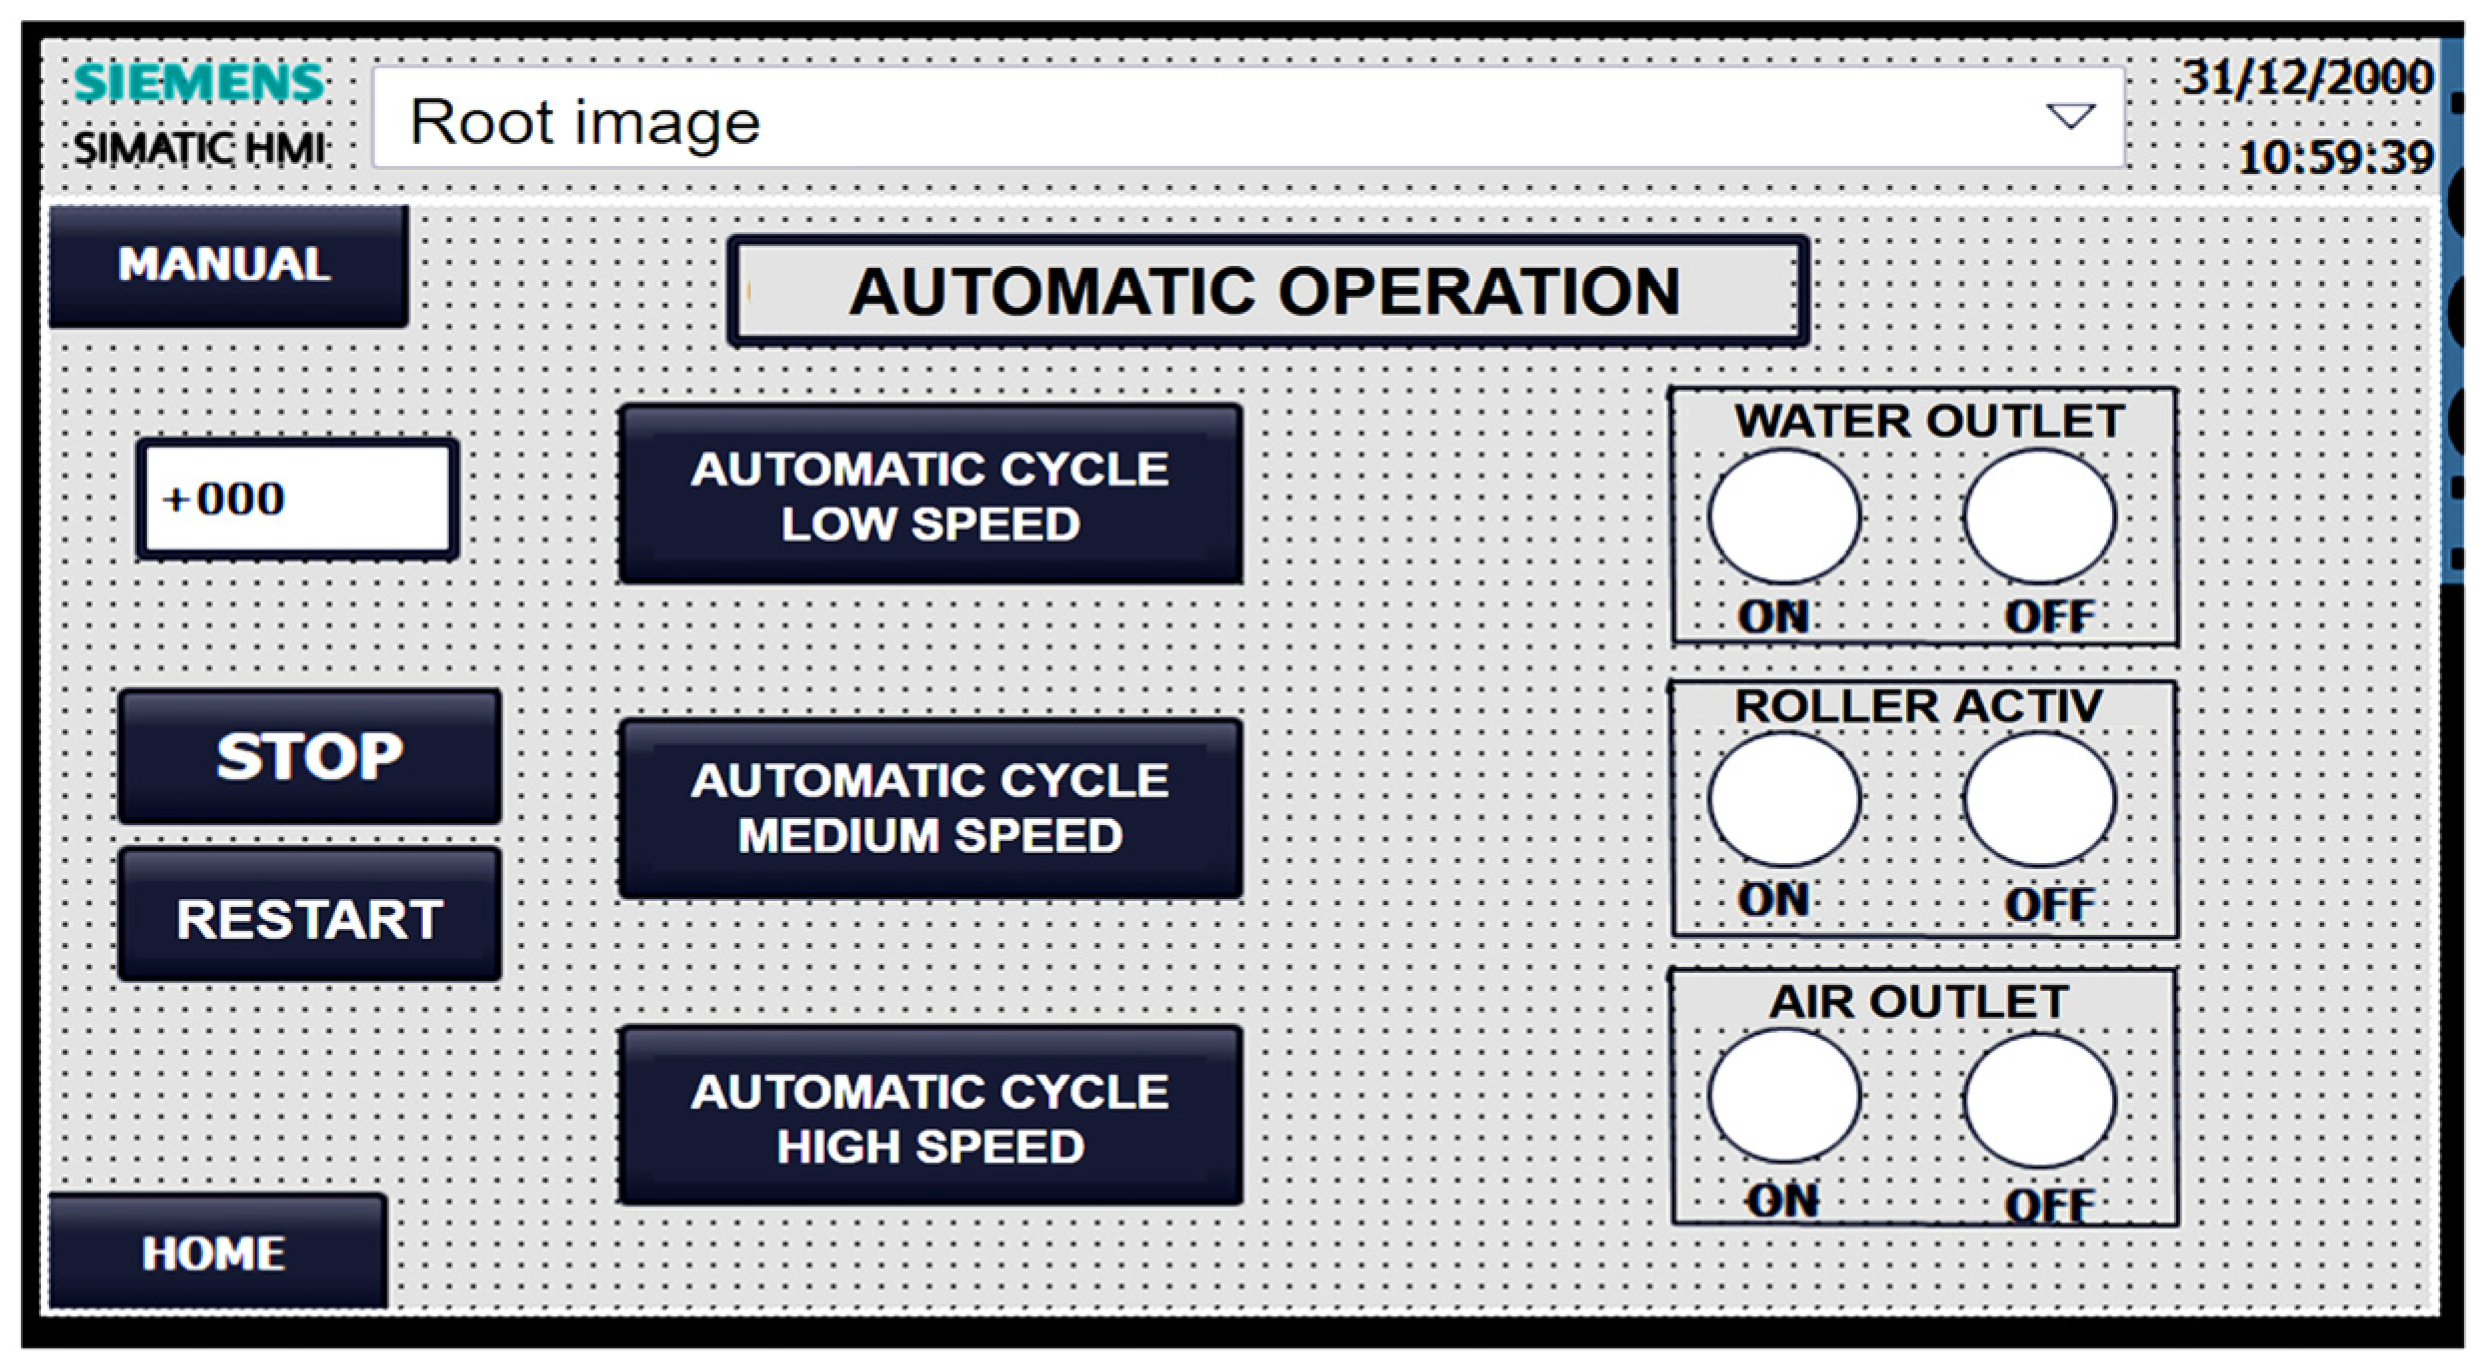
Figure 13 shows the SIMATIC HMI interface of the ECC25 cleaning robot, dedicated to automatic operation. It allows for selection between three automatic cycle modes based on cleaning speed (Low, Medium, or High). On the right side, the interface offers manual control to activate or deactivate key robot components: the Water Outlet, Roller Activation, and Air Outlet. Additionally, it includes buttons for Stop, Restart, and returning to the system’s home menu.
2.6. Phase 6. Grower Advice Using AI
An intelligent chatbot was programmed to deliver automated messages on the HMI screen regarding crop status and adjustment recommendations (irrigation, lighting, nutrients) [
4,
25,
26,
27]. The system can operate in manual or automatic mode, according to the farmer’s preferences.
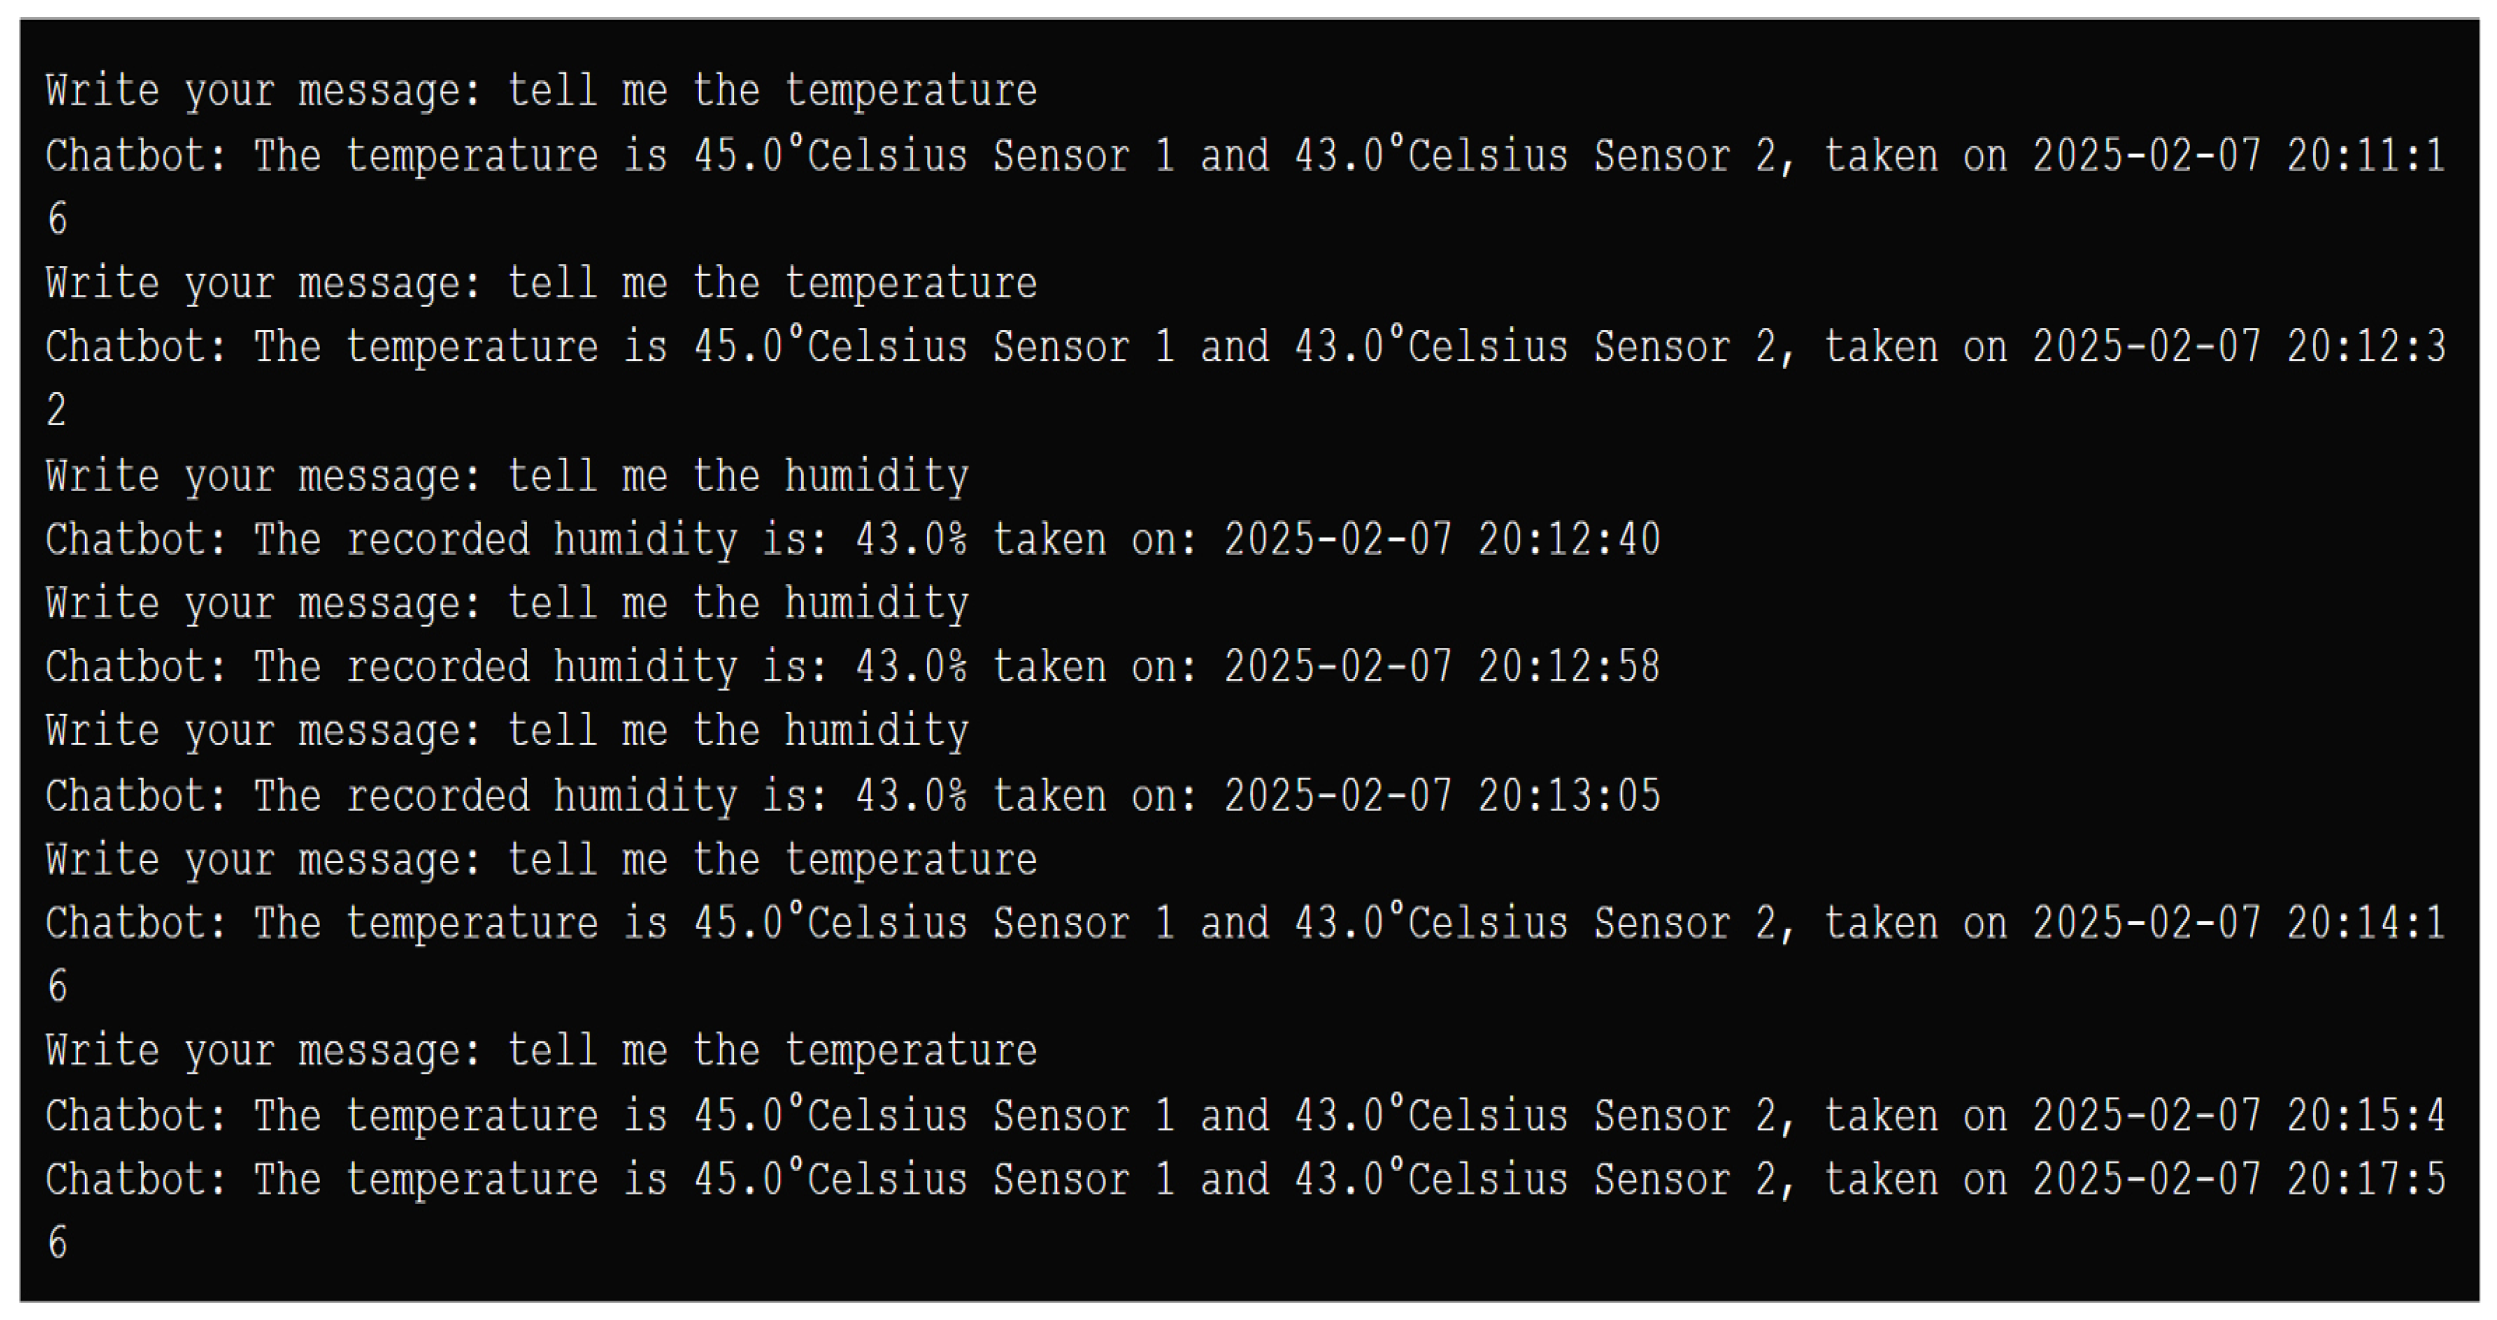
Figure 14 presents an example of interaction through a chatbot dialog box designed to offer advice to farmers. The user (represented by “Write your message”) inquires about two key environmental parameters: temperature and humidity. The chatbot system responds immediately, providing real-time sensor readings. For temperature, the reported values are 45.0 °Celsius (Sensor 1) and 43.0 °Celsius (Sensor 2); for humidity, a value of 43.0% is indicated. Crucially, each response includes the exact date and time (7 February 2025 20:1x:xx) when the measurement was taken.
2.7. Phase 7. Validation of Results
Validation was performed by comparing experimental observations with the system’s recommendations. Indicators of water consumption, energy-related operation, and plant biomass growth were evaluated and contrasted against representative literature baselines and related controlled environment agriculture studies [
9,
28,
29].
2.8. Baseline Definition (Conventional System)
In this manuscript, the conventional system refers to soil-based (open-field or non-climate-controlled) romaine lettuce cultivation under standard agronomic management (e.g., irrigation and nutrient supply without automated environmental control). The baseline values reported in
Table 1 were defined as representative indicators consistent with the ranges and recommendations reported by agricultural extension guidelines and the peer-reviewed literature for romaine lettuce growth cycle and cultivation requirements. The cited sources include extension guides and trials from distinct regions (e.g., U.S. state extension publications) and therefore reflect typical soil cultivation conditions rather than a single local experiment; for this reason, the baseline is used strictly for contextual comparison. Accordingly, the conventional indicators are used as a literature-supported reference baseline, while the smart greenhouse indicators correspond to the measurements obtained from the proposed prototype under controlled operation [
30,
31,
32,
33,
34,
35,
36,
37]. Specifically, the conventional baseline sources include extension publications and field trials conducted under different cultivation contexts, such as organic soil lettuce management reports (e.g., Florida EDIS) [
30], open-field production guidelines from U.S. state extension services (e.g., North Carolina and South Carolina) [
31,
32], variety trial reports (e.g., New York) [
33], evapotranspiration-based irrigation trials in the Salinas Valley (California) [
34], extended season production guidance (West Virginia) [
36], and tropical production guidelines (Hawaii) [
37]. Therefore, the baseline values reflect typical literature-supported conditions across diverse regions and management settings rather than a single local experiment and are used strictly for contextual comparison.
3. Results and Discussion
The preliminary results from the prototype, together with contextual comparisons against a literature-based conventional baseline, suggest improvements in key crop parameters.
Table 1 summarizes the indicators for the conventional system (defined in
Section 2.8) and the smart greenhouse. Water and energy indicators should be interpreted as estimates, as described in
Section 4.
To contextualize the proposed contribution,
Table 2 summarizes a qualitative comparison with representative smart greenhouse works cited in this manuscript.
4. Future Work and Limitations
The AI dataset will be expanded with additional labeled images covering more variability in leaf morphology, stress symptoms, and illumination, and the decision support module will be refined by integrating agronomic rules and data-driven models to recommend irrigation and climate control actions with transparent confidence indicators.
To strengthen the water and energy assessment, the next prototype iteration will incorporate inline flow metering and electrical energy metering to directly measure the irrigation volumes and power consumption of key subsystems (pumps, lighting, ventilation, and control electronics). These measurements will also enable sensitivity analysis and cost–benefit assessment under realistic operating profiles.
Future work will focus on conducting replicated experiments across multiple seasons and cultivars, including a contemporaneous conventional control, to enable a statistical analysis of yield and quality indicators under comparable conditions.
Regarding the AI module, its classification performance depends on the size and diversity of the image dataset, the definition of the “optimal/poor” classes, and the stability of imaging conditions (lighting, camera position, background). In this revision, we report the confusion matrix and class-wise precision/recall/F1 metrics on an independent held-out test subset; however, additional validations are needed to assess generalization across different greenhouses, cameras, growth stages, and cultivars.
Resource indicators related to water and energy are subject to measurement uncertainty. In the current prototype, water use and energy consumption were estimated from operational records (e.g., irrigation event volumes/flow rates and component nominal power with logged operating time) rather than direct metering. This may introduce bias in the absolute values and in the derived relative changes.
In addition, the conventional system values used in
Table 1 were defined as a literature-based baseline rather than a simultaneous side-by-side control plot. Consequently, the relative changes shown in
Table 1 provide contextual comparison and should not be interpreted as causal effects of the proposed system.
This work should be considered a proof-of-concept demonstration of an IoT-assisted smart greenhouse for romaine lettuce. The experimental evidence reported in
Section 3 is based on a limited number of cultivation cycles and a restricted number of plants, and therefore the observed differences may be influenced by cultivar choice, seasonality, and local microclimate conditions.
5. Conclusions
The development of the hybrid smart greenhouse demonstrates the technical and scientific feasibility of integrating Artificial Intelligence, IoT, fractal image analysis, and sustainable energy and water systems in a controlled agricultural environment. The proposed architecture enabled the real-time monitoring of critical variables such as temperature, humidity, solar radiation, and leaf condition, achieving the simultaneous optimization of energy and water resources through automatic and predictive system management.
The fractal analysis of lettuce leaves, complemented by AI classification, has been established as a non-destructive and quantitative tool for evaluating the physiological vigor of the crop. Fractal dimension values (Df = 1.68 ± 0.05 in healthy leaves and Df = 1.53 ± 0.07 in deficient leaves) demonstrated a clear correlation between morphological texture and physiological state, allowing for the early identification of signs of water or nutrient stress. This diagnostic capability improves decision-making regarding irrigation and fertilization, increasing the quality of the final product.
From an energy perspective, the integration of grid-backed photovoltaic panels ensured up to 14 h of daily autonomy under the reported operating profile (estimated), while the water system, based on rainwater and graywater harvesting and treatment, allowed for an estimated ≈34% reduction in potable water use. Furthermore, the intelligent chatbot and the system’s digital twin facilitated interaction with the farmer by providing automated recommendations and real-time operational status visualization; formal usability evaluation remains to be conducted in future work. Informal feedback during prototype demonstrations suggested that the information presented by the chatbot was easy to interpret and the interaction was perceived as user-friendly; however, no structured user study (e.g., SUS/UEQ) was conducted in this work.
In a contextual comparison against literature-based baseline values (rather than a contemporaneous controlled trial), the prototype suggests potential improvements in fresh weight at harvest (≈+17%) and growth time (≈−15%) under the reported operating conditions. These differences should be interpreted as indicative, given the limited number of cultivation cycles and the absence of side-by-side control plots. This approach contributes to the Sustainable Development Goals (SDGs 2, 6, and 7) by promoting resilient, efficient, and digitally supported agriculture.
As future work, it is proposed to incorporate predictive models based on neural networks and extend the validation to other types of crops, reinforcing the use of fractal analysis as a universal descriptor of agricultural quality and its integration with intelligent control systems.
Supplementary Materials
The following supporting information can be downloaded at:
https://www.mdpi.com/article/10.3390/inventions11030044/s1, File S1, MATLAB function for box-counting fractal analysis (boxcount.m); File S2, MATLAB script for lettuce leaf image preprocessing and fractal-dimension estimation (lechugaoptima.m).
Author Contributions
Conceptualization, L.A.A.B.; Methodology, L.A.A.B., R.A.G. (Ricardo Alirio Gonzalez), L.F.R., V.H.B., A.A. and R.A.G. (Ricardo Alfonso Gómez); Software, L.F.R. and A.A.; Validation, L.A.A.B., R.A.G. (Ricardo Alirio Gonzalez), L.F.R., V.H.B., A.A. and R.A.G. (Ricardo Alfonso Gómez); Formal Analysis, L.F.R.; Research, all authors; Resources, L.A.A.B.; Data Curation, L.F.R.; Drafting, L.A.A.B.; Writing, Revision and Editing, all authors; Visualization, L.F.R. and R.A.G. (Ricardo Alfonso Gómez); Supervision, L.A.A.B.; Project Management, L.A.A.B.; Fundraising, L.A.A.B. All authors have read and agreed to the published version of the manuscript.
Funding
This research received institutional support from ECCI University, the SEREPA research group (Renewable Energy and Applied Power Research Group), and the Electronic Engineering program of ECCI University. No external grant number was available for this study.
Data Availability Statement
The data presented in this study are available on request from the corresponding authors as the data are being used to structure undergraduate and graduate research at the University, which requires a certain degree of confidentiality.
Conflicts of Interest
The authors declare no conflicts of interest. The funders had no role in the study design; in the collection, analysis, or interpretation of the data; in the writing of the manuscript; or in the decision to publish the results.
References
- The State of Food Security and Nutrition in the World 2023: Urbanization, Agrifood Systems Transformation and Healthy Diets across the Rural–Urban Continuum; FAO: Rome, Italy; IFAD: Rome, Italy; UNICEF: New York, NY, USA; WFP: Rome, Italy; UNICEF: Geneva, Switzerland, 2023. [CrossRef] [Scilit]
- World Bank. Annual Freshwater Withdrawals, Agriculture (% of Total Freshwater Withdrawal)—Colombia. Available online: https://data.worldbank.org/indicator/ER.H2O.FWAG.ZS?locations=CO (accessed on 18 March 2026).
- Puppala, H.; Peddinti, P.R.T.; Tamvada, J.P.; Ahuja, J.; Kim, B. Barriers to the adoption of new technologies in rural areas: The case of unmanned aerial vehicles for precision agriculture in India. Technol. Soc. 2023, 74, 102335. [Google Scholar] [CrossRef] [Scilit]
- Maraveas, C.; Piromalis, D.; Arvanitis, K.G.; Bartzanas, T.; Loukatos, D. Applications of IoT for optimized greenhouse environment and resources management. Comput. Electron. Agric. 2022, 198, 106993. [Google Scholar] [CrossRef] [Scilit]
- Ministerio de Agricultura y Desarrollo Rural. Informe sobre la Vulnerabilidad de las Regiones frente a la Seguridad Alimentaria, Desastres y Cambio Climático. 2023. Available online: https://www.minagricultura.gov.co (accessed on 18 March 2026).
- Peladarinos, N.; Piromalis, D.; Cheimaras, V.; Tserepas, E.; Munteanu, R.A.; Papageorgas, P. Enhancing Smart Agriculture by Implementing Digital Twins: A Comprehensive Review. Sensors 2023, 23, 7128. [Google Scholar] [CrossRef] [Scilit]
- Wang, L. Digital Twins in Agriculture: A Review of Recent Progress and Open Issues. Electronics 2024, 13, 2209. [Google Scholar] [CrossRef] [Scilit]
- Slimani, H.; El Mhamdi, J.; Jilbab, A. Real-time greenhouse management using IoT, digital twin, and augmented reality for optimal control and decision-making. Acta IMEKO 2025, 14, 1–15. [Google Scholar] [CrossRef] [Scilit]
- La Notte, L.; Giordano, L.; Calabro, E.; Bedini, R.; Colla, G.; Puglisi, G.; Reale, A. Hybrid and organic photovoltaics for greenhouse applications. Appl. Energy 2020, 278, 115582. [Google Scholar] [CrossRef] [Scilit]
- Unidad Nacional para la Gestión del Riesgo de Desastres (UNGRD). Plan Nacional de Gestión ante el Fenómeno “El Niño”. 2023. Available online: https://portal.gestiondelriesgo.gov.co/Documents/PLAN-NACIONAL-DE-GESTION-ANTE-EL-FENOMENO-El-Nino.pdf (accessed on 18 March 2026).
- Instituto de Hidrología, Meteorología y Estudios Ambientales (IDEAM). Monitoreo de Índices de Sequía—Informe Técnico Diario (ITD). 24 January 2024. Available online: https://www.ideam.gov.co/sites/default/files/prensa/boletines/2024-08-02/024_itd_enero_24_2024.pdf (accessed on 18 March 2026).
- Mandelbrot, B.B. The Fractal Geometry of Nature; W.H. Freeman: San Francisco, CA, USA, 1983. [Google Scholar]
- Vishnu, M.; Jaishanker, R. Fractal–Thermodynamic system analogy and complexity of plant leaves. Environ. Res. Commun. 2023, 5, 055013. [Google Scholar] [CrossRef] [Scilit]
- Shen, P.; Ma, X.; Guan, H.; He, H.; Wang, F.; Yu, M.; Yang, C. Calculation method of wilting index based on fractal dimension of multispectral images for soybean canopy. Comput. Electron. Agric. 2023, 207, 107656. [Google Scholar] [CrossRef] [Scilit]
- Google LLC. Teachable Machine. Available online: https://teachablemachine.withgoogle.com/ (accessed on 18 March 2026).
- Tariq, M.H.; Sultan, H.; Akram, R.; Kim, S.G.; Kim, J.S.; Usman, M.; Gondal, H.A.H.; Seo, J.; Lee, Y.H.; Park, K.R. Estimation of Fractal Dimensions and Classification of Plant Disease with Complex Backgrounds. Fractal Fract. 2025, 9, 315. [Google Scholar] [CrossRef] [Scilit]
- MathWorks. Box Counting Fractal Dimension (boxcount)—MATLAB Central File Exchange. Available online: https://www.mathworks.com/matlabcentral/fileexchange/13063-boxcount (accessed on 18 March 2026).
- United Nations Educational, Scientific and Cultural Organization (UNESCO). Water and Sustainable Development: Goal 6; UNESCO: Paris, France, 2018. [Google Scholar]
- Ministerio de Ambiente y Desarrollo Sostenible. Agua lluvia. Available online: https://www.minambiente.gov.co/gestion-integral-del-recurso-hidrico__trashed/agua-lluvia/ (accessed on 18 March 2026).
- Rodrigues, A.M.; Formiga, K.T.M.; Milograna, J. Integrated systems for rainwater harvesting and greywater reuse: A systematic review of urban water management strategies. Water Supply 2023, 23, 4112–4125. [Google Scholar] [CrossRef] [Scilit]
- Albalawneh, A.; Chang, T.K. Greywater reuse: Knowledge, perceptions, and practices in a rural area of Jordan. Water 2016, 8, 511. [Google Scholar] [CrossRef] [Scilit]
- Solar Cleaning Machinery S.L. (SCM Solar). Solar Panel Cleaning Robot S2 (Product Information). Available online: https://scmsolar.com/products/s2/ (accessed on 18 March 2026).
- GrabCAD. Photovoltaic Cleaning Robot (3D CAD Model Library). Available online: https://grabcad.com/library/photovoltaic-cleaning-robot-1 (accessed on 18 March 2026).
- Gaitán, N.C.; Batinas, B.I.; Ursu, C.; Crainiciuc, F.N. Integrating Artificial Intelligence into an Automated Irrigation System. Sensors 2025, 25, 1199. [Google Scholar] [CrossRef] [Scilit]
- Centorame, L.; Gasperini, T.; Ilari, A.; Del Gatto, A.; Foppa Pedretti, E. An Overview of Machine Learning Applications on Plant Phenotyping, with a Focus on Sunflower. Agronomy 2024, 14, 719. [Google Scholar] [CrossRef] [Scilit]
- Oguzturk, G.E. AI-driven irrigation systems for sustainable water management: A systematic review and meta-analytical insights. Smart Agric. Technol. 2025, 11, 100982. [Google Scholar] [CrossRef] [Scilit]
- Et-taibi, B.; Abid, M.R.; Boufounas, E.-M.; Morchid, A.; Bourhnane, S.; Abu Hamed, T.; Benhaddou, D. Enhancing water management in smart agriculture: A cloud and IoT-based smart irrigation system. Results Eng. 2024, 22, 102283. [Google Scholar] [CrossRef] [Scilit]
- Dutta, M.; Gupta, D.; Sahu, S.; Limkar, S.; Singh, P.; Mishra, A.; Kumar, M.; Mutlu, R. Evaluation of Growth Responses of Lettuce and Energy Efficiency of the Substrate and Smart Hydroponics Cropping System. Sensors 2023, 23, 1875. [Google Scholar] [CrossRef] [Scilit]
- Herrera-Arroyo, R.; Martínez-Nolasco, J.; Botello-Álvarez, E.; Sámano-Ortega, V.; Martínez-Nolasco, C.; Moreno-Aguilera, C. Smart Hydroponic Cultivation System for Lettuce (Lactuca sativa L.) Growth Under Different Nutrient Solution Concentrations in a Controlled Environment. Appl. Syst. Innov. 2025, 8, 110. [Google Scholar] [CrossRef] [Scilit]
- Santos, L.; Wright, A.L.; Luo, Y.; Lu, H.; Odero, D.C. Nitrogen Cycling and Management for Romaine and Crisphead Lettuce Grown on Organic Soils. EDIS 2013, 2013, 8. [Google Scholar] [CrossRef] [Scilit]
- Torres Quezada, E.; Sanders, D.C. Lettuce Production in North Carolina. NC State Extension Publications, 2001; revised 2025. Available online: https://content.ces.ncsu.edu/lettuce (accessed on 18 March 2026).
- Clemson Cooperative Extension. Lettuce. Home & Garden Information Center (HGIC), 2023. Available online: https://hgic.clemson.edu/factsheet/lettuce/ (accessed on 18 March 2026).
- Stewart-Courtens, C. 2018 Lettuce Variety Trial First Planting Results. Cornell Cooperative Extension—Cornell Vegetable Program, 2018. Available online: https://cvp.cce.cornell.edu/submission.php?id=601 (accessed on 18 March 2026).
- Cahn, M.D.; Johnson, L.F.; Benzen, S. Evapotranspiration Based Irrigation Trials Examine Water Requirement, Nitrogen Use, and Yield of Romaine Lettuce in the Salinas Valley. Horticulturae 2022, 8, 857. [Google Scholar] [CrossRef] [Scilit]
- United States Department of Agriculture, Agricultural Marketing Service (USDA-AMS). United States Standards for Grades of Lettuce; USDA-AMS: Washington, DC, USA, 1997. Available online: https://www.ams.usda.gov/sites/default/files/media/Lettuce_Standard%5B1%5D.pdf (accessed on 18 March 2026).
- Jett, L.W. Extended Season Lettuce Production; West Virginia University Extension: Morgantown, WV, USA, 2020; Available online: https://ccd.uky.edu/sites/default/files/2024-11/ccd-wvu-fs-1_extended-season-lettuce-production.pdf (accessed on 18 March 2026).
- Valenzuela, H.; Kratky, B.; Cho, J. Lettuce Production Guidelines for Hawaii; University of Hawaii: Honolulu, HI, USA, 2000; Available online: https://www2.hawaii.edu/~hector/prod%20guides%20fold/LETTHI-HV.pdf (accessed on 18 March 2026).
- Akintan, O.; Babawale, S.; Olomo, A.; Adeyemo, R.; Opadotun, O.; Ajayi, J.T.; Mba, P.C.; Njoku, J.N.; Chesang, A.; Zahid, A.; et al. A Digital Twin Framework for Sensor Selection and Microclimate Monitoring in Greenhouses. AgriEngineering 2025, 7, 315. [Google Scholar] [CrossRef] [Scilit]
Figure 1.
The levels of food insecurity in the world (2020–2022). Adapted from [
1].
Figure 1.
The levels of food insecurity in the world (2020–2022). Adapted from [
1].
Figure 2.
Vulnerability of Colombian departments to food insecurity and climate change. Adapted from [
5].
Figure 2.
Vulnerability of Colombian departments to food insecurity and climate change. Adapted from [
5].
Figure 3.
General diagram of methodological phases. Source: Authors.
Figure 3.
General diagram of methodological phases. Source: Authors.
Figure 4.
Structural design of greenhouse and arrangement of sensors. (a) Software design. (b) Prototype structure in PVC. (c) Irrigation pump location. (d) DHT11 humidity sensor. Source: Authors (this work).
Figure 4.
Structural design of greenhouse and arrangement of sensors. (a) Software design. (b) Prototype structure in PVC. (c) Irrigation pump location. (d) DHT11 humidity sensor. Source: Authors (this work).
Figure 5.
Monitoring of greenhouse environmental parameters during April. Relationship between average ambient temperature, average soil temperature, average ambient humidity, and average soil moisture. Sample Power BI records used for greenhouse monitoring. Source: Authors (this work).
Figure 5.
Monitoring of greenhouse environmental parameters during April. Relationship between average ambient temperature, average soil temperature, average ambient humidity, and average soil moisture. Sample Power BI records used for greenhouse monitoring. Source: Authors (this work).
Figure 6.
Initial training of good and bad lettuce classes using the Teachable Machine web application. Source: Screenshot from Teachable Machine (Google LLC, Mountain View, CA, USA; accessed on 21 January 2026).
Figure 6.
Initial training of good and bad lettuce classes using the Teachable Machine web application. Source: Screenshot from Teachable Machine (Google LLC, Mountain View, CA, USA; accessed on 21 January 2026).
Figure 7.
Fractal classification and comparison of representative lettuce images using the box-counting method. Representative leaves classified as optimal (sample IDs 1–3) with their corresponding fractal plots and Df values. Representative leaves classified as deficient (sample IDs 12–14) with their corresponding fractal plots and Df values. Source: Authors (this work).
Figure 7.
Fractal classification and comparison of representative lettuce images using the box-counting method. Representative leaves classified as optimal (sample IDs 1–3) with their corresponding fractal plots and Df values. Representative leaves classified as deficient (sample IDs 12–14) with their corresponding fractal plots and Df values. Source: Authors (this work).
Figure 8.
Overview of Colombian municipalities at risk of drought by 2024. Source: Authors, based on UNGRD and IDEAM reports [
10,
11].
Figure 8.
Overview of Colombian municipalities at risk of drought by 2024. Source: Authors, based on UNGRD and IDEAM reports [
10,
11].
Figure 9.
General diagram of the water-saving and heating subsystem. (a) Conceptual scheme of water collection, storage, and solar-assisted heating. (b) Simplified hydraulic layout showing rainwater, graywater, groundwater/aqueduct supply, storage tanks, electric pump, solar collector, and hot-water outlet. Source: Authors (this work).
Figure 9.
General diagram of the water-saving and heating subsystem. (a) Conceptual scheme of water collection, storage, and solar-assisted heating. (b) Simplified hydraulic layout showing rainwater, graywater, groundwater/aqueduct supply, storage tanks, electric pump, solar collector, and hot-water outlet. Source: Authors (this work).
Figure 10.
Simplified operation sequence of the water-saving and heating subsystem. The control system opens the intake valve after water-source detection; the storage tank reports lower/upper sensor activation and full-tank status; the solar collector reports maximum operating temperature; the photovoltaic system confirms energy availability; and the electric pump starts the recirculation of water through the collector, returning heated water to the storage system. Source: Authors (this work).
Figure 10.
Simplified operation sequence of the water-saving and heating subsystem. The control system opens the intake valve after water-source detection; the storage tank reports lower/upper sensor activation and full-tank status; the solar collector reports maximum operating temperature; the photovoltaic system confirms energy availability; and the electric pump starts the recirculation of water through the collector, returning heated water to the storage system. Source: Authors (this work).
Figure 11.
Robot S2 CC-DC by Solar Cleaner Machinery. Source: Solar Cleaning Machinery S.L. (SCM Solar) [
23].
Figure 11.
Robot S2 CC-DC by Solar Cleaner Machinery. Source: Solar Cleaning Machinery S.L. (SCM Solar) [
23].
Figure 12.
ECC25 photovoltaic module cleaning robot model. Source: Adapted from GrabCAD model library [
24].
Figure 12.
ECC25 photovoltaic module cleaning robot model. Source: Adapted from GrabCAD model library [
24].
Figure 13.
HMI graphical interface for automatic operation of ECC25 photovoltaic module cleaning robot. Source: Authors (this work).
Figure 13.
HMI graphical interface for automatic operation of ECC25 photovoltaic module cleaning robot. Source: Authors (this work).
Figure 14.
Chatbot dialog box for grower advice. Source: Authors (this work).
Figure 14.
Chatbot dialog box for grower advice. Source: Authors (this work).
Table 1.
Performance indicators for lettuce cultivation in the conventional system and the smart greenhouse (conventional system values are literature-based and derived from extension guidelines and trials [
30,
31,
32,
33,
34,
35,
36,
37]; water and energy indicators for the prototype are estimated from component nominal power and logged operating time/irrigation volumes).
Table 1.
Performance indicators for lettuce cultivation in the conventional system and the smart greenhouse (conventional system values are literature-based and derived from extension guidelines and trials [
30,
31,
32,
33,
34,
35,
36,
37]; water and energy indicators for the prototype are estimated from component nominal power and logged operating time/irrigation volumes).
| Indicator | Conventional System | Smart Greenhouse | Relative Change (%) |
|---|
| Water consumption (L/plant) | 6.2 | 4.1 | −34% |
| Energy consumption (kWh/day) | 3.2 | 2.4 | −25% |
| AI accuracy (optimal/poor classification) | - | 97.1% (test set, n = 350) | - |
| Growth time (days) | 68 | 58 | −15% |
| Fresh weight at harvest (g/plant) | 210 | 245 | +17% |
Table 2.
A qualitative comparison with representative smart greenhouse systems reported in the literature.
Table 2.
A qualitative comparison with representative smart greenhouse systems reported in the literature.
| Work (Ref.) | Focus and Techniques | Evidence/Evaluation |
|---|
| This work | IoT monitoring/control + AI classifier + box-counting fractal descriptors (Df); PV + grid; rainwater + graywater reuse (estimated indicators) | Accuracy 97.1% (test set n = 350; dataset n = 1500); Df statistics; contextual baseline comparison (not a controlled trial) |
| Review of IoT-based smart greenhouse systems [4] | Review of architectures, sensors, and control strategies for IoT greenhouses | Survey (no single prototype benchmark) |
| Digital twin + AR greenhouse management [8] | Real-time greenhouse management using IoT, digital twin, and augmented reality | System-level demonstration reported by the authors |
| Digital twin for sensor selection [38] | Digital twin framework to support sensor selection and microclimate monitoring | Framework evaluation reported by the authors |
| Renewable energy integration review [9] | Technical review of photovoltaic and hybrid energy integration strategies for smart greenhouses | Survey and design-level comparison |
Table 3.
The confusion matrix for the image classifier on the independent test subset (n = 350).
Table 3.
The confusion matrix for the image classifier on the independent test subset (n = 350).
| Predicted Deficient | Predicted Optimal |
|---|
| Actual deficient | 172 | 6 |
| Actual optimal | 4 | 168 |
| Disclaimer/Publisher’s Note: The statements, opinions and data contained in all publications are solely those of the individual author(s) and contributor(s) and not of MDPI and/or the editor(s). MDPI and/or the editor(s) disclaim responsibility for any injury to people or property resulting from any ideas, methods, instructions or products referred to in the content. |




 ,
,