Article

DAFNE-Light DXR1 Soft X-Ray Synchrotron Radiation Beamline: Characteristics and XAFS Applications

by
Antonella Balerna
INFN, Laboratori Nazionali di Frascati, 00044 Frascati (RM), Italy
Condens. Matter 2019, 4(1), 7; https://doi.org/10.3390/condmat4010007
Submission received: 21 November 2018 / Revised: 19 December 2018 / Accepted: 3 January 2019 / Published: 8 January 2019
(This article belongs to the Special Issue High Precision X-Ray Measurements)

Abstract

:
X-ray Absorption Fine Structure Spectroscopy (XAFS) is a powerful technique to investigate the local atomic geometry and the chemical state of atoms in different types of materials, especially if lacking a long-range order, such as nanomaterials, liquids, amorphous and highly disordered systems, and polymers containing metallic atoms. The INFN-LNF DAΦNE-Light DXR1 beam line is mainly dedicated to soft X-ray absorption spectroscopy; it collects the radiation of a wiggler insertion device and covers the energy range from 0.9 to 3.0 keV or the range going from the K-edge of Na through to the K-edge of Cl. The characteristics of the beamline are reported here together with the XAFS spectra of reference compounds, in order to show some of the information achievable with this X-ray spectroscopy. Additionally, some examples of XAFS spectroscopy applications are also reported.

1. Introduction

Soft X-rays ranging from 0.9 to 3.0 keV cover an important energy range because they can be used in the study of materials containing atoms like magnesium, aluminum, silicon, sulfur, and many others. These atomic elements have an important role in fields like biology, medicine, catalysis, cultural heritage, materials, and space science. Furthermore, soft X-ray beamlines can be used for the characterization of samples using X-ray spectroscopies, but also for tests of optics and detectors needed for soft X-ray applications in other fields like space science.
X-ray Absorption Fine Structure (XAFS) spectroscopy is particularly useful to investigate the electronic structure and local environment of specific atoms in quite different samples like solids, liquids, and gasses. XAFS spectra come from the X-ray induced transition of electrons from inner-shell orbitals to unoccupied electronic states, and from the scattering of the photo-emitted core electrons by all the neighboring atoms. For samples containing light elements, in the soft X-ray region, K absorption edges can be studied, due to the excitation of 1s electrons; however for the ones containing heavier elements like Mo, Au, and so on, L or M absorption edges can be used to achieve important information on their valence band structures.
The DXR1 soft X-ray beamline is one of the beamlines of the DAΦNE-Light [1] Instituto Nazionale di Fisica Nucleare (INFN) Laboratori Nazionali di Frascati (LNF) synchrotron radiation facility. The Double Annular Φ-factory for Nice Experiments (DAΦNE) [2] storage ring is a high-luminosity, 0.51 GeV, e+-e collider, designed for a broad high-energy physics program. Due to its low-energy and high-electron current (higher than 1.5 A), DAΦNE provides high-flux synchrotron radiation (SR) beams in the energy range from IR to soft X-rays, and for this reason it is being used, in both dedicated and parasitic mode, as well as for SR applications.
In this paper, the characteristics of the DXR1 beamline, together with some XAFS measurements to show its performance, will be reported.

2. The DXR1 Beamline

The DAΦNE DXR1 soft X-ray beamline, mainly dedicated to X-ray absorption spectroscopy, started delivering beamtime to users at the end of 2004. The radiation source of the DXR1 beamline is one of the four planar wigglers (6-poles equivalent) installed on the DAΦNE electron storage ring to control the beam emittance [3]. The wiggler forces the accelerated electrons to emit a wide, intense, and polarized fan of electromagnetic radiation. Due to the wiggler higher magnetic field, the critical energy of the emitted synchrotron radiation spectrum of the DXR1 beamline (296 eV) is higher than the one of the bending magnet beamlines (219 eV). The 6 poles of the wiggler and the high storage ring current >1.5 A of DAΦNE, give a useful X-ray flux (Figure 1) for measurements well beyond ten times the critical energy.

2.1. The Beamline Layout

A schematic view of the soft X-ray beamline is shown in Figure 2. The front end of the beamline is placed at about 4 m from the wiggler and its optical axis is geometrically aligned to the insertion device. The exit flange was designed to accept the entire vertical SR divergence (1 mrad), and about 12 mrad in the horizontal plane.
A gold-coated silicon mirror, at a grazing angle of about 2.2 degrees, deflects, in the horizontal plane, half of the beam into the UV-VIS DXR2 branch line. A removable thin high-transmittance window (8 μm Be) separates the Ultra High Vacuum (UHV) of the machine from the HV of the rest of the beamline. A double wire beam monitor can be used to control the beam position. To define the beam shape and dimensions, remotely controlled vertical and horizontal slits were installed before and after the soft X-ray monochromator, very near to the experimental chamber. The beam size used clearly depends on the dimensions of the samples to be measured; a standard one is about 2 mm in the vertical length and 8 mm in horizontal length.
To select the soft X-ray energies, the beamline is equipped with a Toyama double-crystal monochromator (Figure 3) in ‘boomerang’ geometry, that ensures a fixed beam exit at all achievable energies and can cover Bragg angles from 15° to 75°. The monochromator is at about 30 m from the exit flange of the front end. Different sets of crystals (see Table 1) can be used to cover the available photon energy range (0.9–3 keV). To change the crystals, the UHV chamber of the monochromator must be opened and the operation normally takes several hours.
The typical energy resolution (E/ΔE) of the monochromator is about 1500 for Beryl and InSb, while the flux measured at 1300 eV using the Beryl crystal is 6 × 10⁸ ph/s and 3 × 10⁸ ph/s at 2500 eV using the InSb crystals. In both cases, the first ionization chamber was filled with N2 gas, the gas pressure was chosen to have 10% efficiency, and the beam dimensions were (2 × 8) mm2.

2.2. The Beamline Experimental Setup

A multipurpose experimental HV chamber (Figure 3), placed at about 1 m from the monochromator, was realized to allocate several samples to be measured in transmission, fluorescence, and total electron yield mode. At the moment, the only allowed mode is the transmission one where the incoming and outgoing X-ray beams are monitored using two ionization chambers. The sample holder normally used at RT can host up to ten samples. The experimental chamber can also host other kinds of sample holders, but only with a maximum dimension of about 10 × 10 cm2.
From 2019 onwards, it will also be possible to perform XAFS measurements in fluorescence mode. A new 4-channel array of Silicon Drift Detectors (SDDs), called ARDESIA and developed by INFN and the Politecnico di Milano [4], has been tested on the beamline in February 2018 and will be definitively installed by the end of the year. The ARDESIA detector, having a finger-like structure, can be introduced in the experimental chamber using a specific vacuum-tight translating system and uses as an entrance window an AP5 MOXTEK thin polymer with high transmission in the soft X-ray region. In Figure 4, the first XAFS spectrum of a Pyrex thin glass, taken in fluorescence mode at the Si K-edge, is shown. The values reported for the fluorescence mode are the average values of the data measured by the four ARDESIA SDD detectors and are compared with the data taken on a Pyrex powder sample measured in transmission mode. This new detector will open the possibility to also accept experimental proposals on diluted and supported samples.
In order to control the sample temperature and open the beamline to experimental proposals requiring low temperatures, one can use an OXFORD Instruments cryostat, which can work from 4 K up to room temperature, giving the possibility to perform XAFS measurements as a function of temperature. The sample holder for measurements from RT to 77 K can host six samples, while the one for lower temperatures can only host three.
At the end of the DXR1 experimental hutch, there is a small hutch where a tungsten micro-focus conventional X-ray tube has been installed together with an experimental chamber; this can be used to make tests on samples or devices connected to optical or detection systems.

3. XAFS Spectroscopy and Measurements

3.1. XAFS Spectroscopy

XAFS [5,
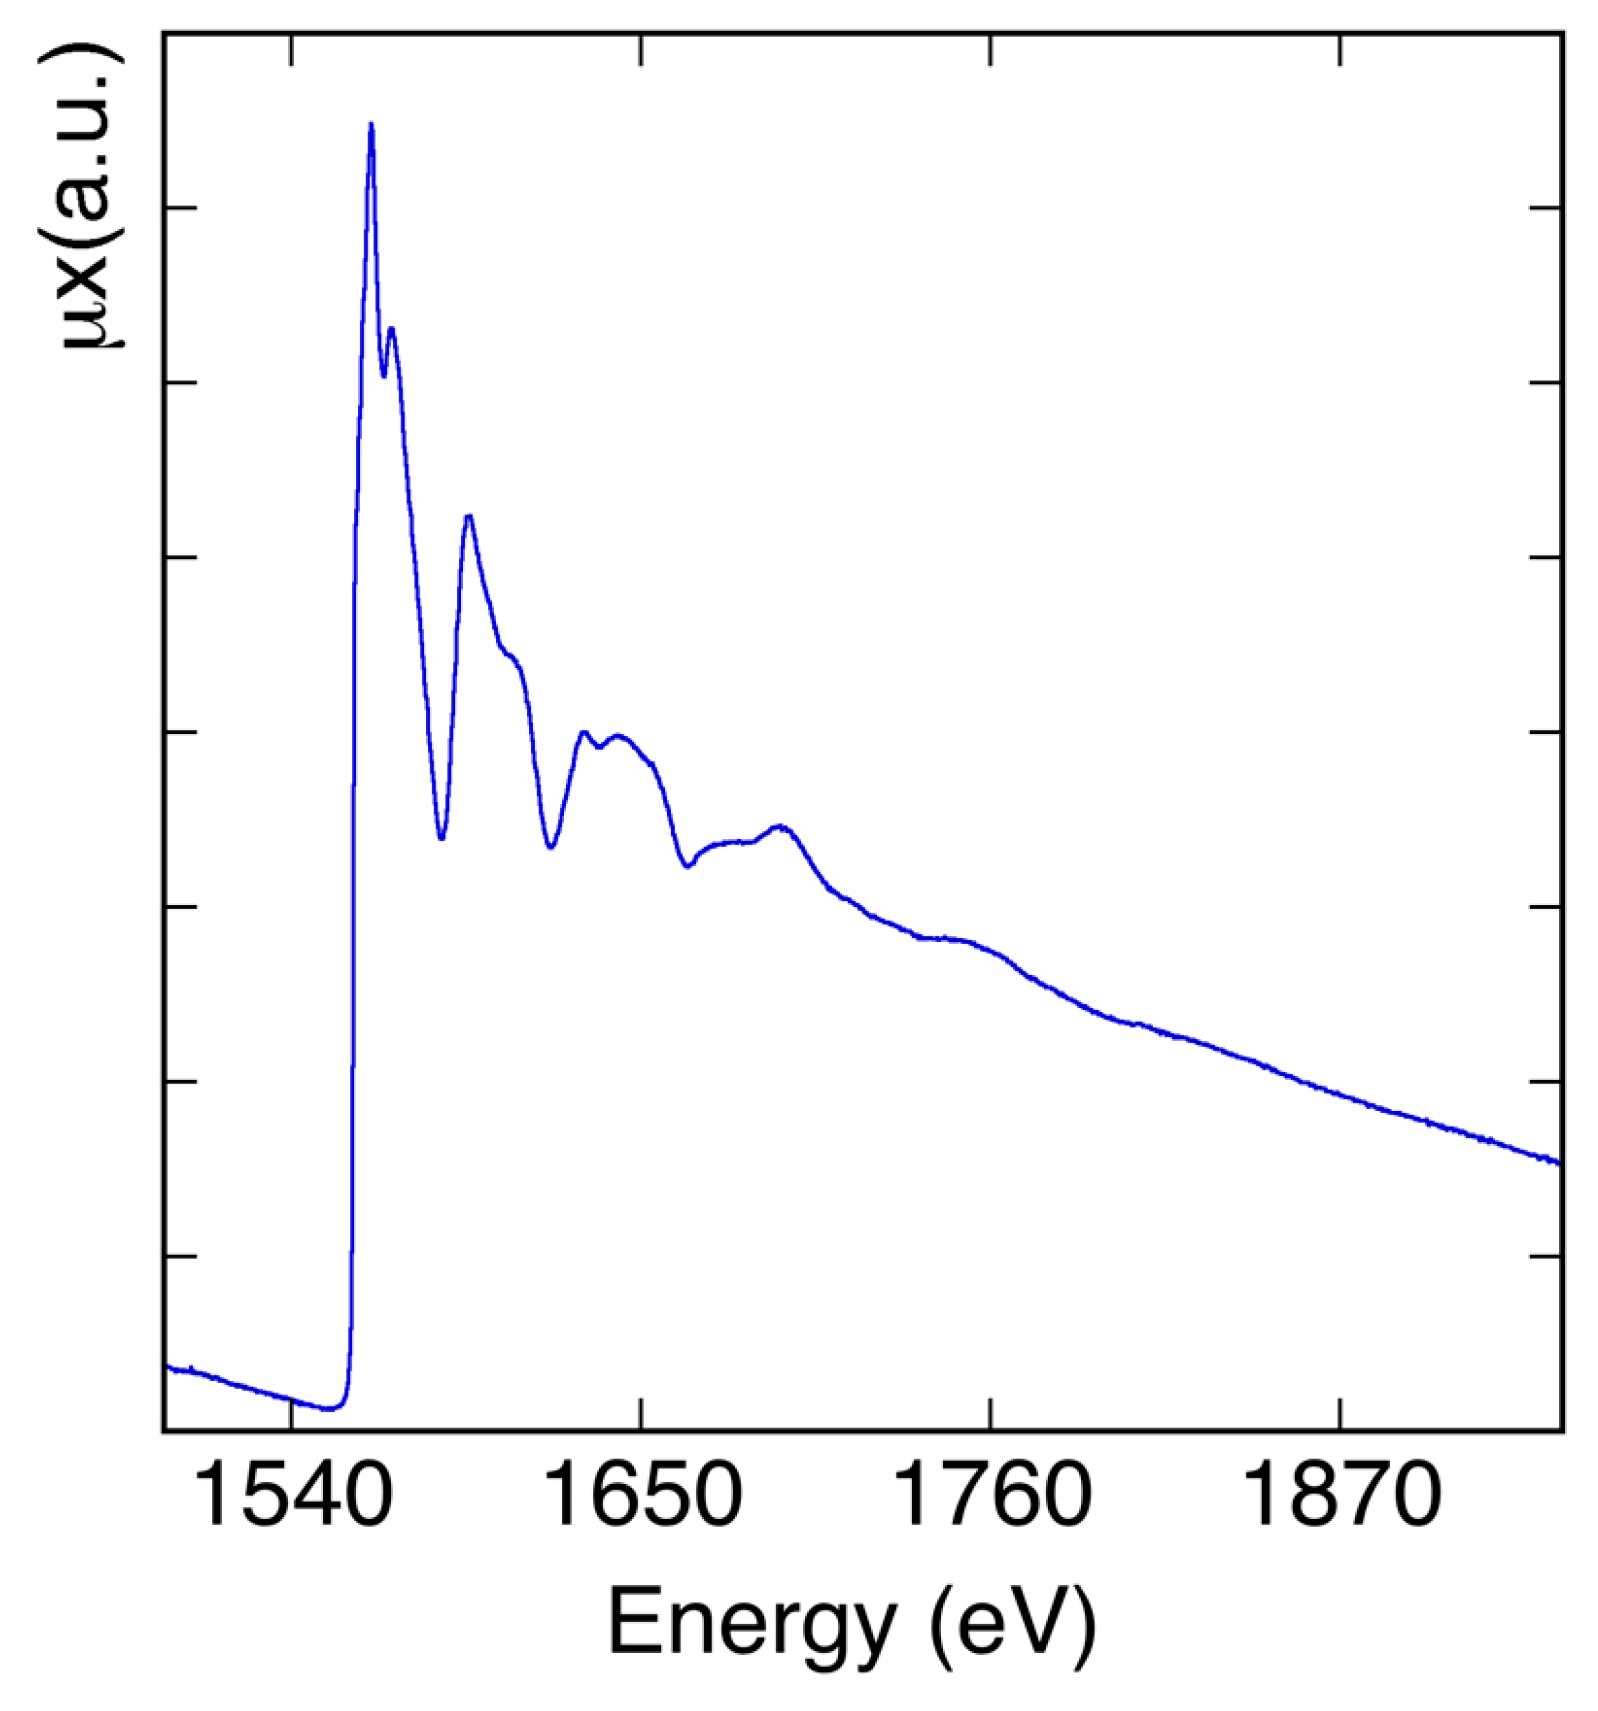
6] can help understand the physical properties of materials, giving information on their local structure. XAFS is element-selective because choosing the energy of the X-rays means choosing the atomic number, Z, of the atom whose surroundings have to be characterized. XAFS is considered core level spectroscopy, because the X-ray energies used are the ones of the deep-core electrons and not of the valence ones. As a function of energy, XAFS measures the modulations of the X-ray absorption coefficient, near and above the core-level binding energies of a specific atom (Figure 5). XAFS spectra are sensitive to the oxidation state, coordination chemistry, and to the distances, coordination numbers, and species of the atoms surrounding the selected atomic element. XAFS can be used to study ordered and disordered systems, even if very diluted. XAFS can help measure 2D interatomic distances with high resolution, but also has 3D structural sensitivity. XAFS spectroscopy can be applied in the study of nanostructures, thin films, interfaces, alloys, dopants, liquids and many other very important fields, such as life-science, catalysis, cultural heritage, material, and space science.
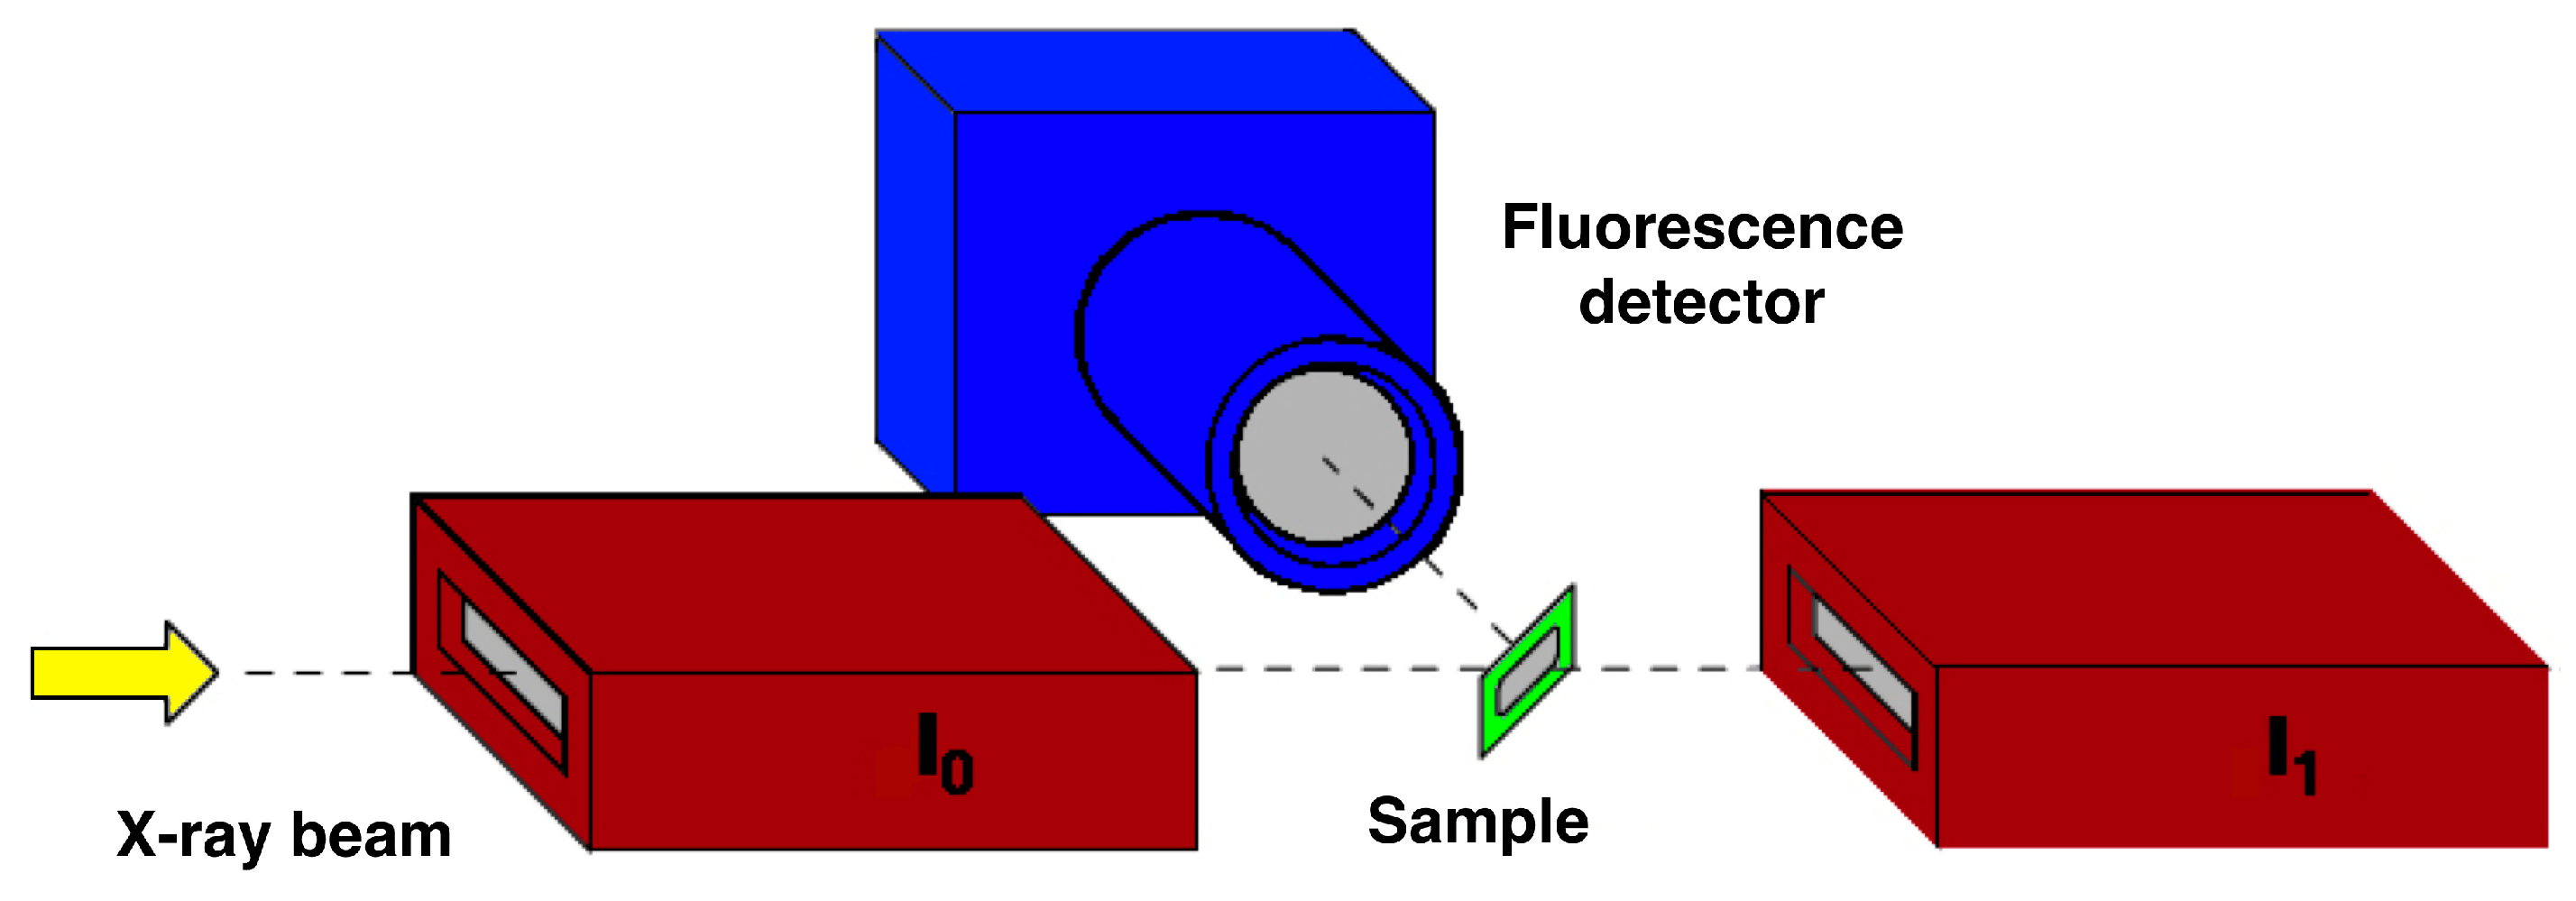
When an X-ray beam passes through a sample, normally its intensity decreases by an amount related to the absorption characteristics of the sample itself, especially for photon energies between 1 keV and 50 keV, mainly used in XAFS spectroscopy. The mechanism contributing to the X-ray attenuation is the photoelectric absorption, resulting in the absorption of photons and emission of photoelectrons. The intensity of the transmitted X-ray beam (I1) is related to the intensity of the incoming beam (I0) by the Beer’s Law:
I1 = I0 exp[−μ(E)x],
where μ(E) is the linear absorption coefficient as a function of energy, and x is the thickness of the sample; a typical XAFS setup is shown in Figure 6. I0 and I1 are the signals measured by the ion chambers positioned before (incoming flux) and after the sample (transmitted flux) working in transmission mode (μ(E)x = ln(I0/I1). In the presence of supported or very diluted/thin samples, the transmission mode cannot be used. In this case, a fluorescence detector must be used to measure the fluorescence flux IF (μ(E)x = IF/I0) [5].
As clearly visible in Figure 5, where the μ(E)x, evaluated using Equation (1), is reported in the low energy side of the spectrum, as the X-ray energies increase, the absorption coefficient decreases. This behavior changes at the absorption edge when the energy value of the incoming X-rays becomes enough to extract electrons from a deeper level. As shown in Figure 5, a fine structure (XAFS) starts appearing at the edge and is also present well above it. In XAFS spectra, three different regions [5] can be evidenced: the pre-edge and edge region, the near edge region or XANES (X-ray Absorption Near Edge Structure) up to about 50 eV (information on the local electronic and geometric 3D structure), and the extended region or EXAFS (Extended X-ray Absorption Fine Structure) [6], that can reach thousands of eV above the edge and can give information on the local geometric structure surrounding the absorbing atoms.

3.2. XANES and EXAFS Spectra

Even if XANES modeling [
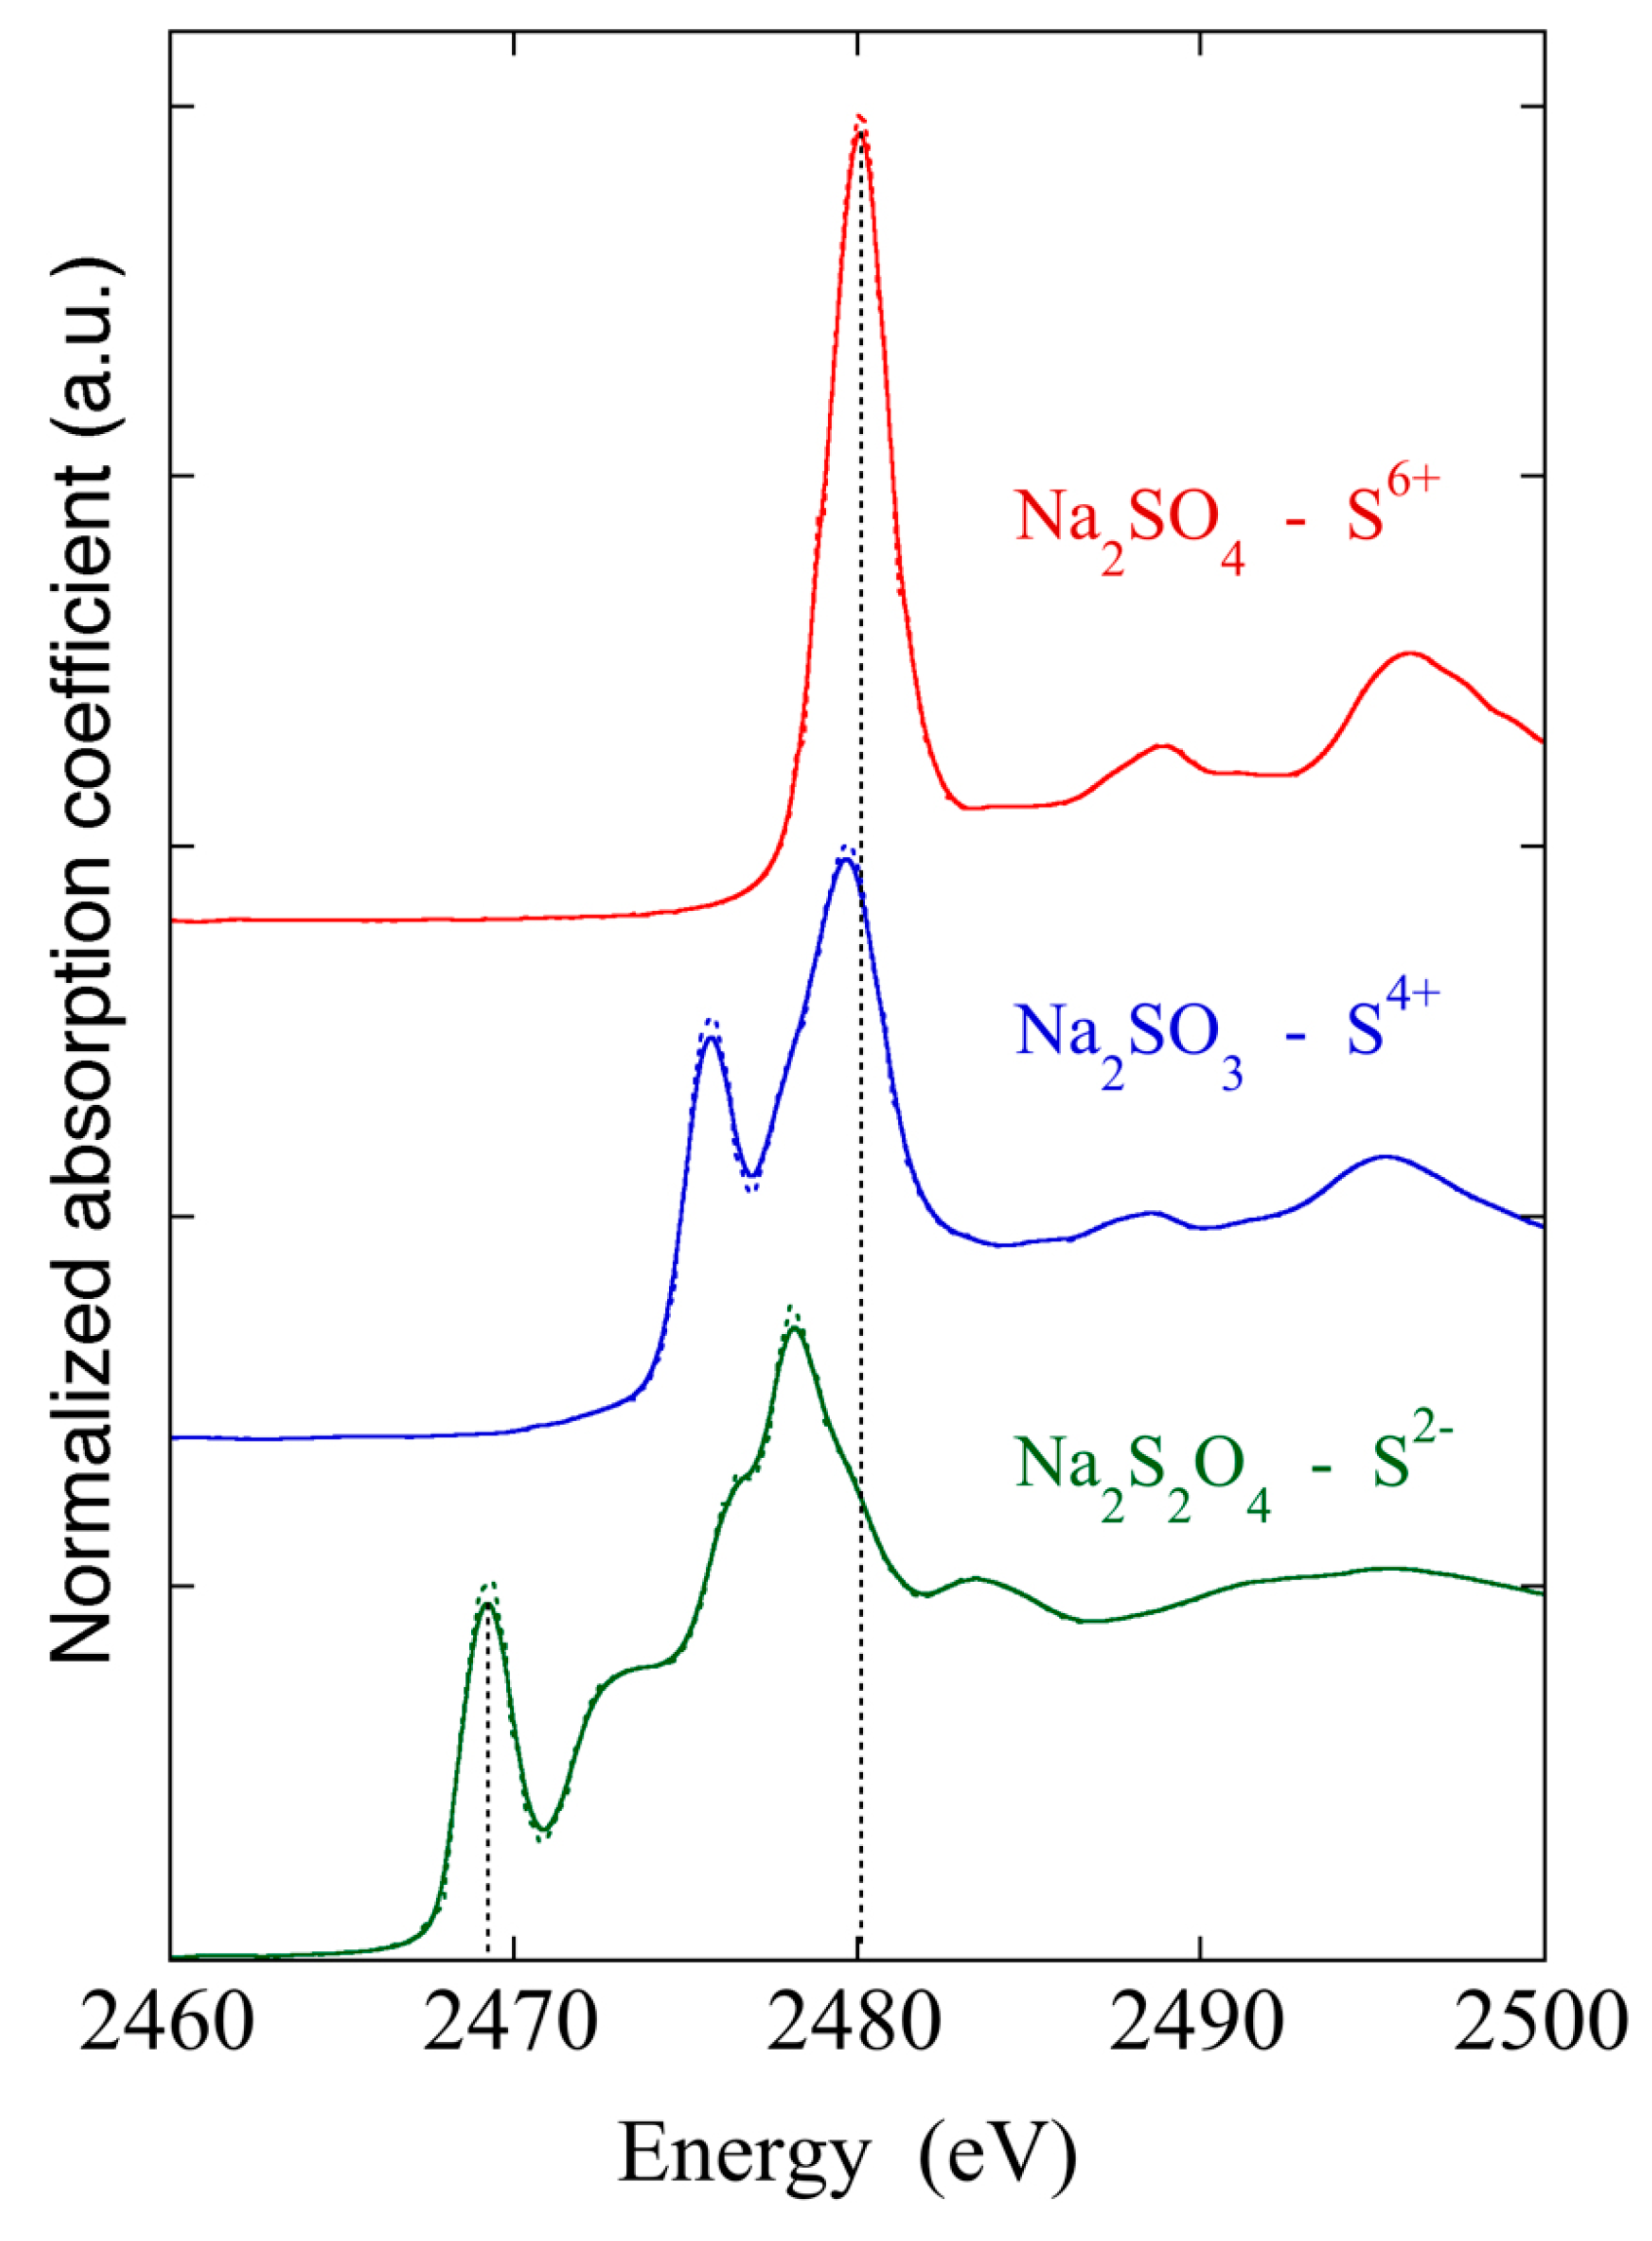
5] is very complex, important information like the oxidation state, three dimensional geometry, and coordination environment of elements under investigation can be achieved by also comparing the measured spectra with those of well-known model compounds. In Figure 7, the normalized XANES spectra measured on crystalline samples with known crystal structures, containing sulfur at different valence states, are reported.
The shape of the edge and the pre-edge resonances are characteristic of the local symmetry of the investigated atom sites and can be used as fingerprints in the identification of the local structure of unknown samples. The binding energies of the valence orbitals and therefore the energy position of the sulfur edge are correlated with the valence state of the absorbing atom. As the oxidation state increases, the absorption edges in the XANES spectra move to higher energies. Energy shifts vary linearly with the valence of the absorbing atom [5], and in particular, as a function of the sulfur oxidation state, large energy differences up to 12 eV can be found between S2− and S6+ [7].
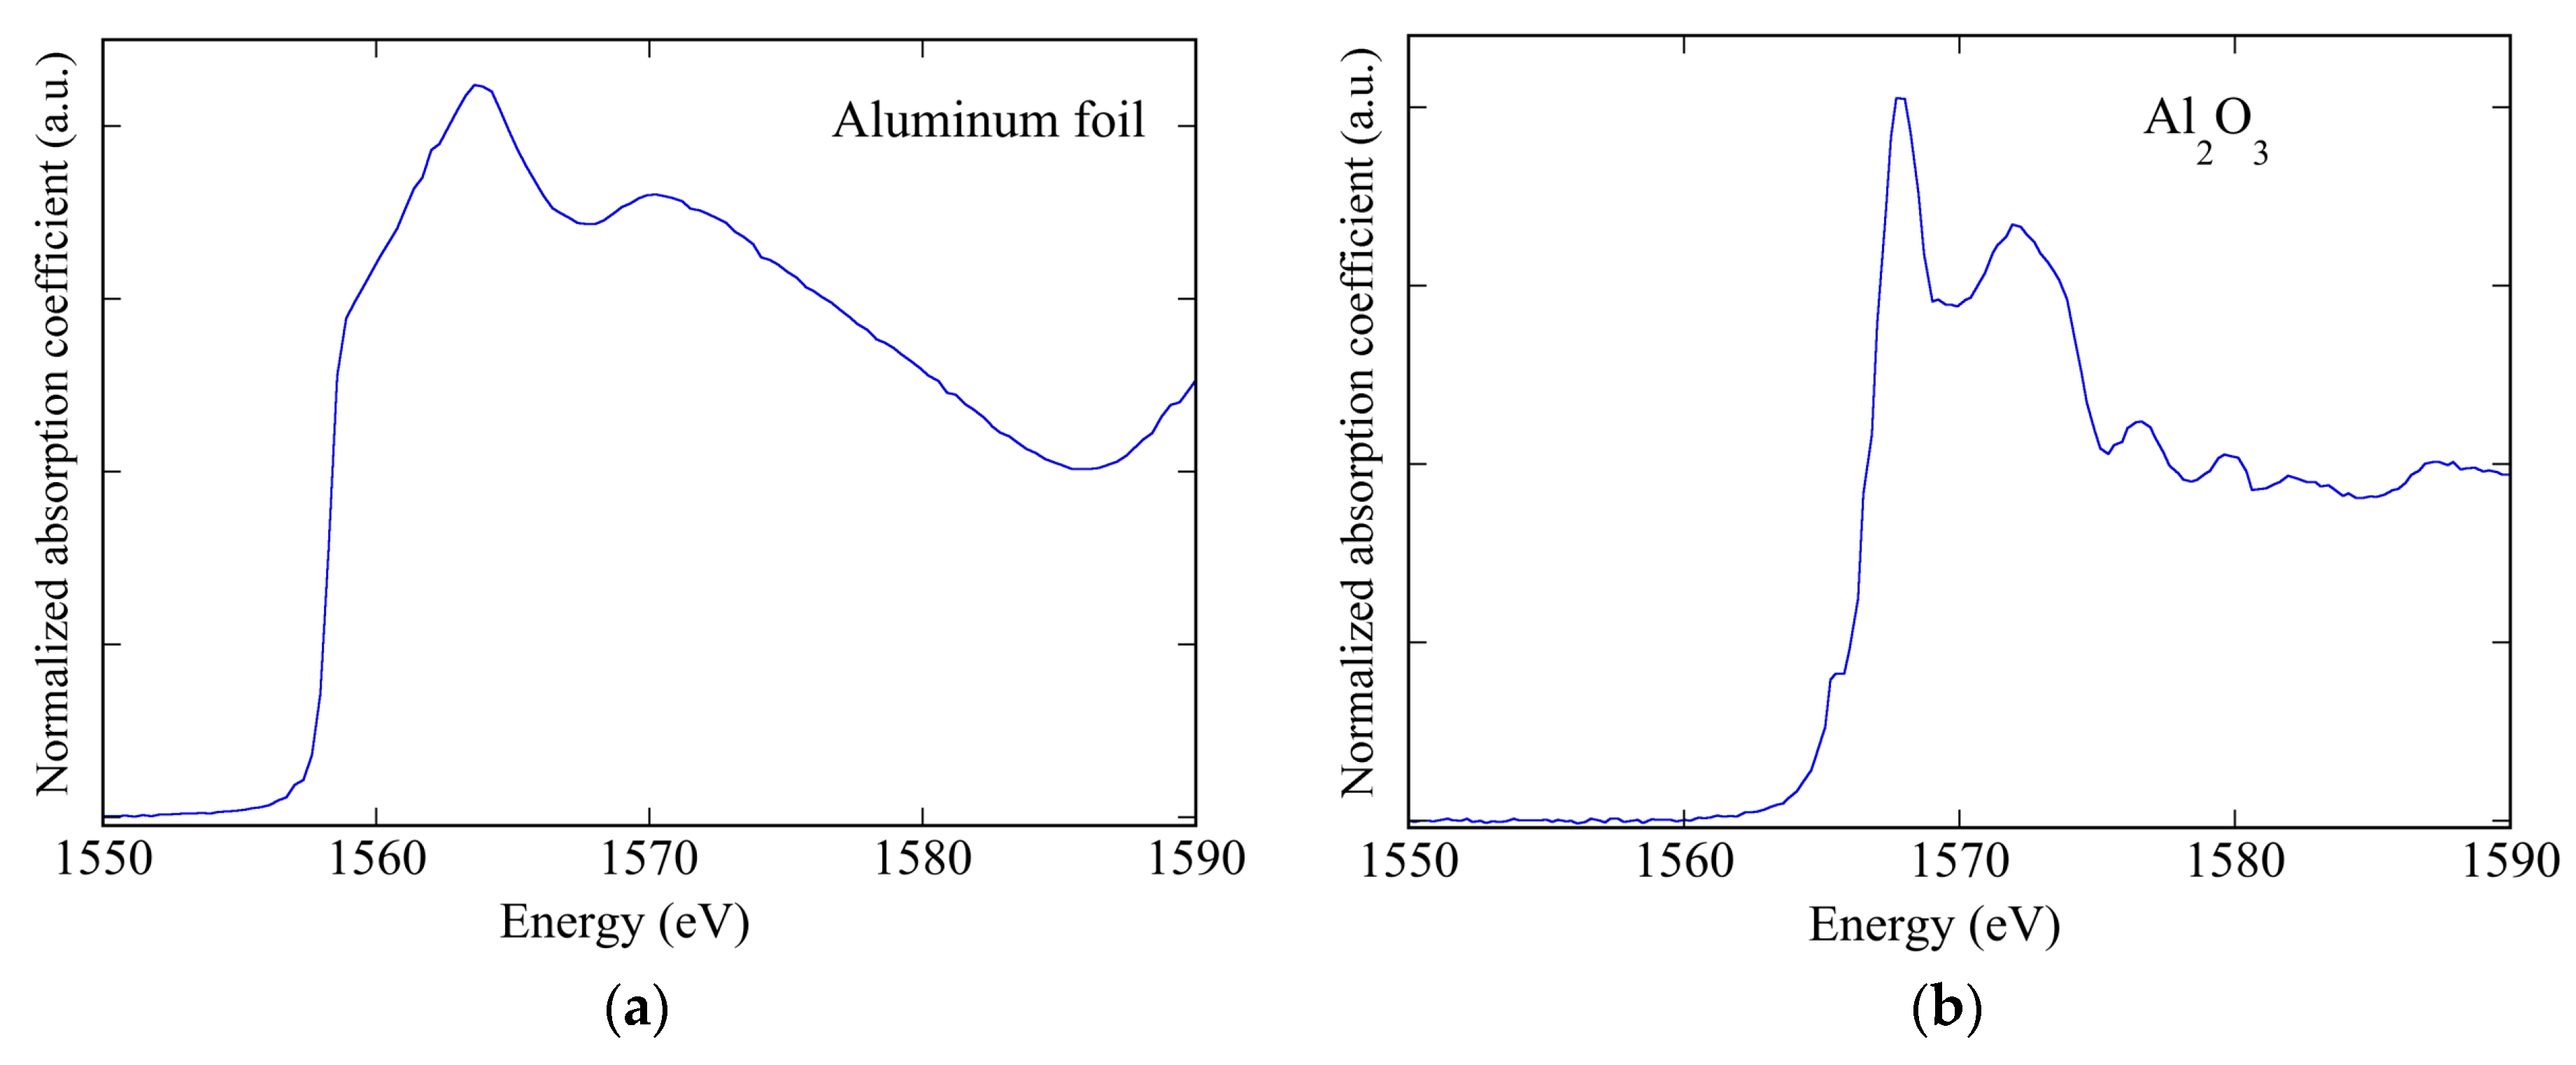
XANES spectra can give chemical and structural information and can be very important in many different fields. In the field of cultural heritage, X-ray elemental micro mapping can give information on the atomic elements present in paintings; but when using XAFS spectroscopy, it becomes also possible to achieve information on the chemical composition in the presence of trace elements as well [8]. Due to the very different features present in the XANES spectra of elements in metallic or different oxide phases (see Figure 8), sometimes XANES spectra can directly give the required information on the chemical state of the materials being studied [9].
From the analysis of the EXAFS data, quantitative information on the short-range order structure can be achieved. EXAFS oscillations are usually indicated as χ(k):
χ ( k ) = μ ( k ) μ 0 ( k ) μ 0 ( k ) ,
where μ0(k) is the monotonically decreasing atomic absorption coefficient, μ(k) is the effective absorption coefficient oscillating around it, and k is the photoelectron wave vector [10] given by Equation (3)
k = 2 m ( E E 0 ) 2 ,
where E is the incoming photon energy, and E0 is the absorption edge energy calculated as the energy of the maximum derivative of μ(E). EXAFS oscillations can be well approximated by Equation (4):
χ ( k ) = j S 0 2 N j f j ( k ) e 2 k 2 σ j 2 k R j 2 sin ( 2 k R j + δ j ( k ) ) .
In χ(k), the backscattering atoms around the absorbing one are grouped in coordination shells [5,6], each one containing a number, Nj of atoms, of the same species, at the same distance Rj from the absorbing atom. χ(k) is formally given by the sum over the index j of the contributions coming from the j coordination shells [5,6]. In Equation (4), fj(k) and dj(k) are scattering properties of the atoms around the absorbing one and in particular fj(k) is the backscattering amplitude of the Nj neighbors, while dj(k) is a k-dependent phase shift [5,6]. As shown in Figure 9, EXAFS data can be extracted using programs like the ATHENA program [11], after the linear subtraction of the pre-edge background and the removal of the atomic absorption.
Since the EXAFS signal contains the contributions of all of the j coordination shells and each contribution can be approximated by a damped sinusoidal function in k-space whose frequency is proportional to a specific absorber-backscatterer distance, Fourier transforming (FT) the EXAFS data enables the separation of the different frequencies. This operation transforms each EXAFS sinusoidal component in a FT modulus peak, going from the k
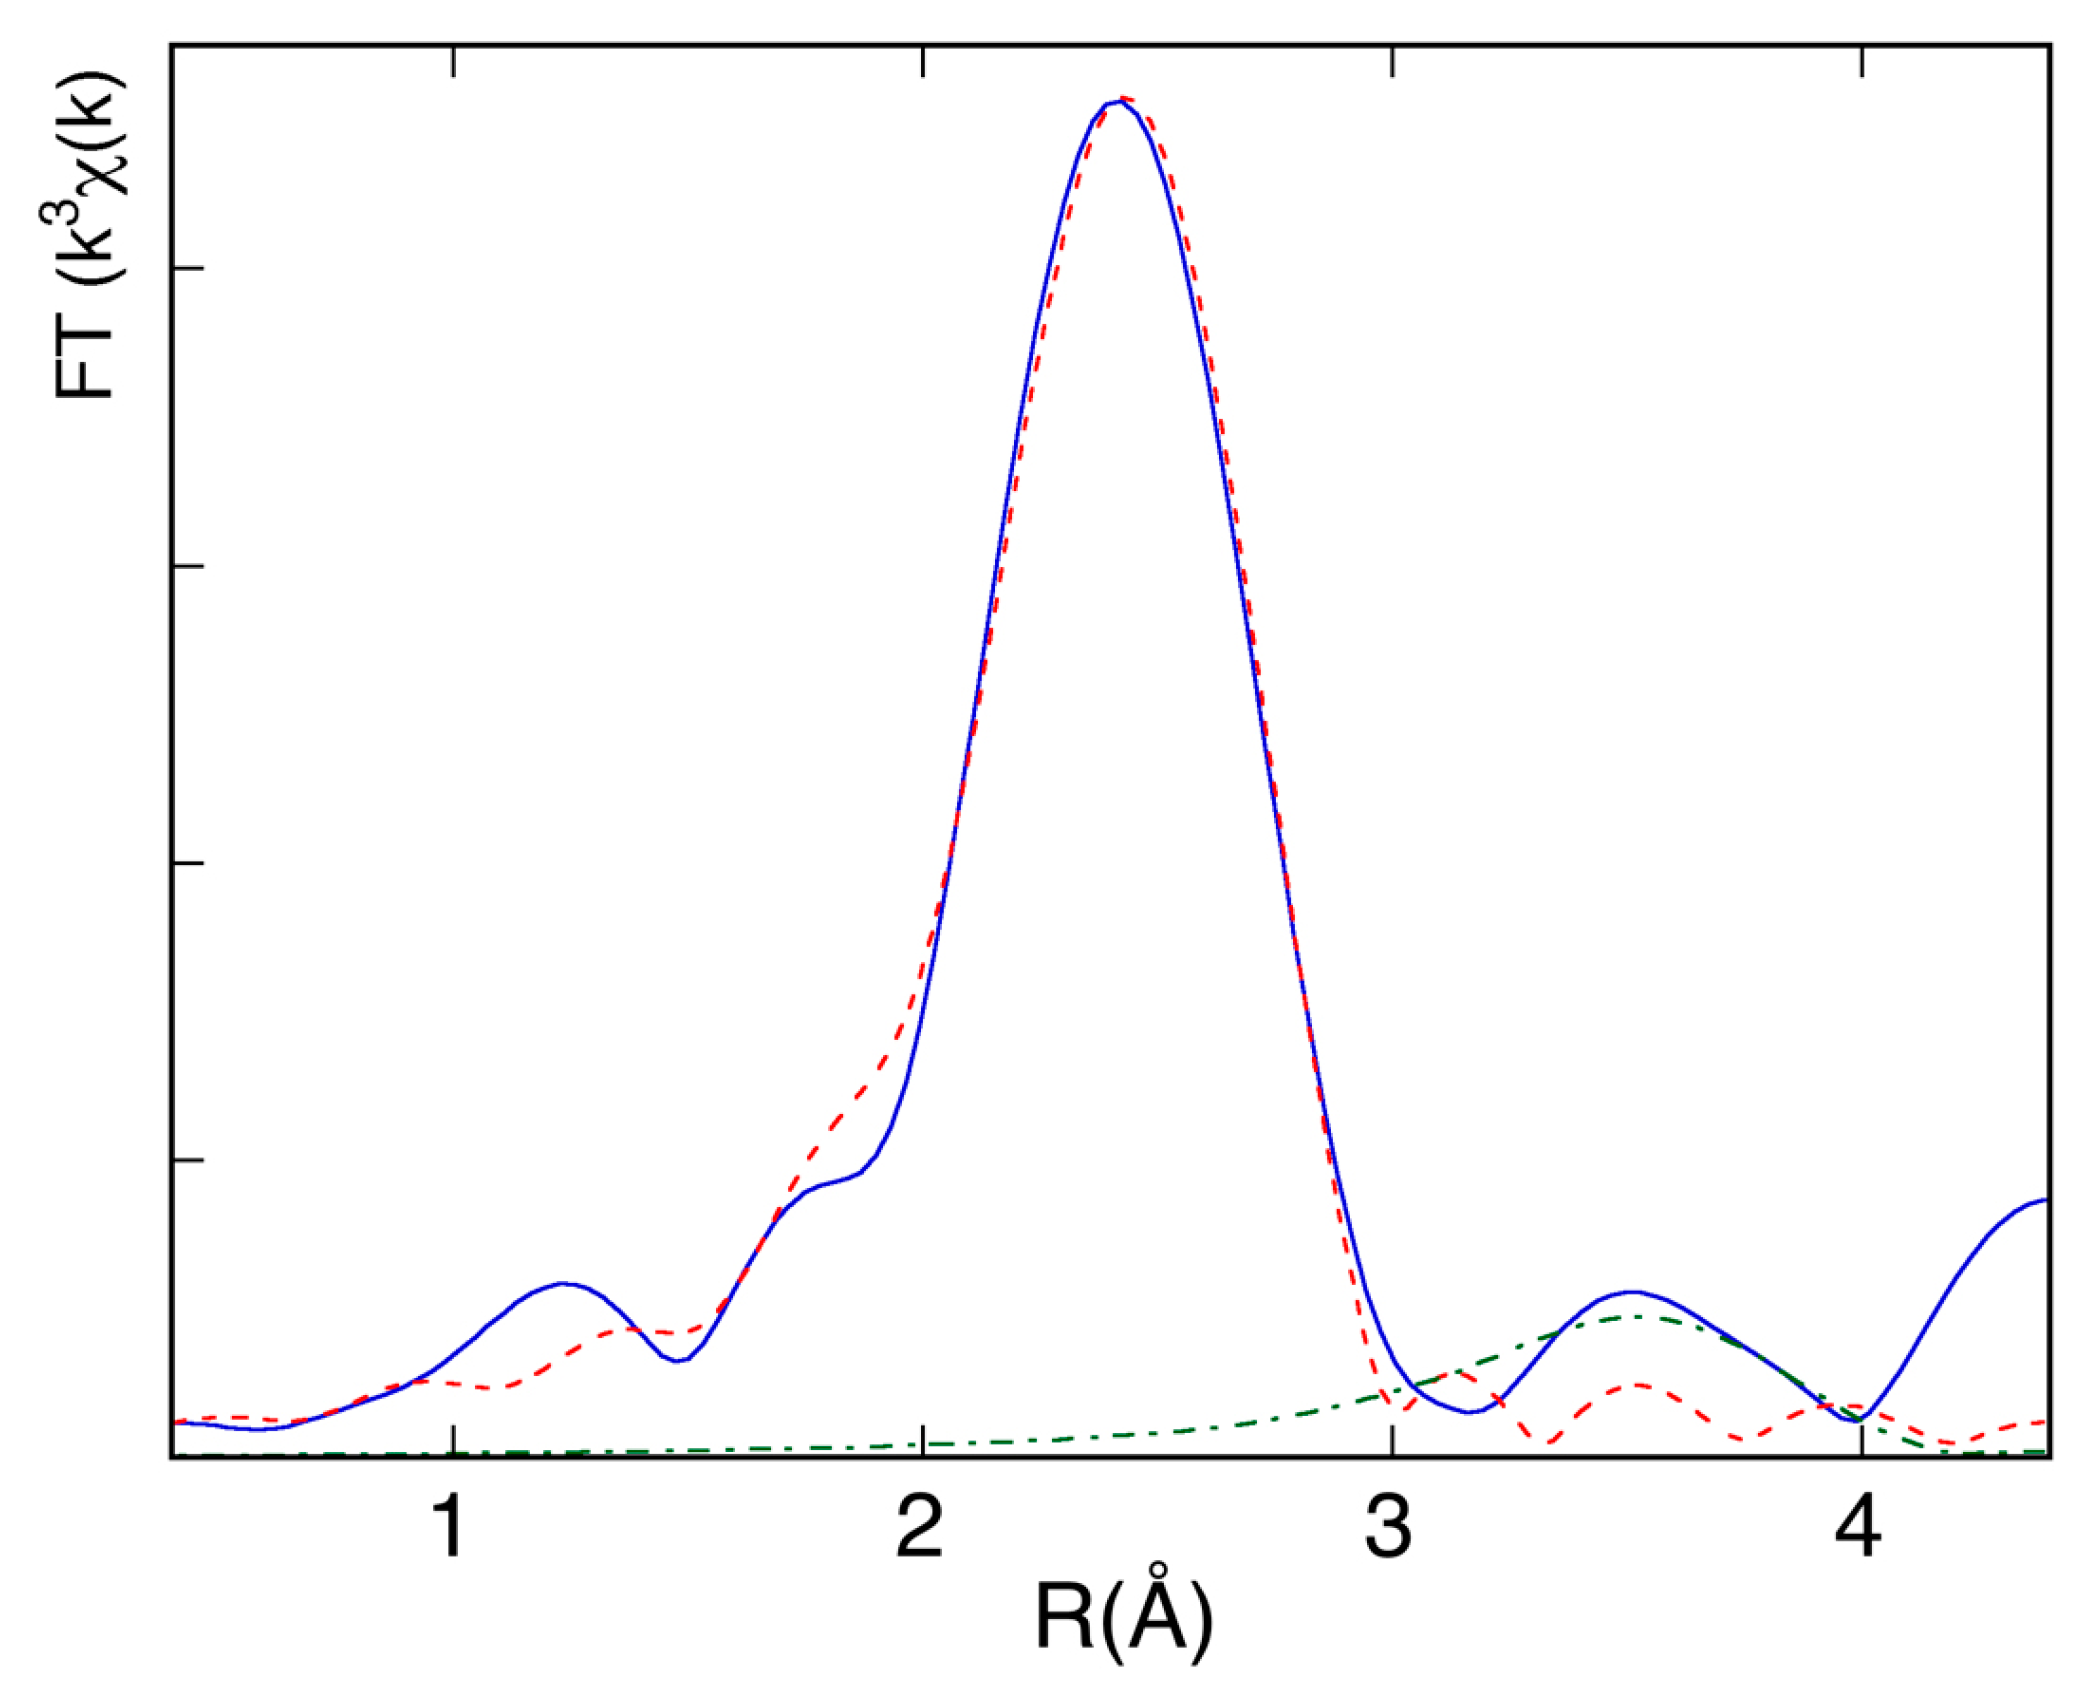
−1) space to an R(Å) space. The height of the peaks depends on the amplitude parameters of the EXAFS equation, while their position depends on the phase parameters. In Figure 10 the FT of the EXAFS spectrum of an Aluminum foil is reported: the first and second peaks represent the first and second coordination shells. Having aluminum a face centered cubic (fcc) structure [12], the coordination number of the nearest neighbors is 12, while the second shell coordination number is 6.
A fitting procedure can be used to determine the coordination numbers (Nj), the interatomic distances (Rj) and Debye–Waller thermal and static disorder factors (σ2) of the coordination shells around the absorbing atom.
The least-square fitting of the structural parameters can be performed using a program like ARTEMIS [11] that—together with the ATHENA program—is implemented in the IFEFFIT package [13]. In the fitting procedures, the scattering contributions can be calculated by software packages like FEFF [14,15], and depend on the coordination shells around the absorbing atom that must be studied. In all cases, an estimation of the accuracy of the obtained structural parameters, compatible with data quality and range used [16] is also normally evaluated. In Table 2, the results achieved in the fitting procedure of the first two Al coordination shells are reported. The results achieved by the XAFS data taken at room temperature, are in good agreement with the fcc Al values [17].

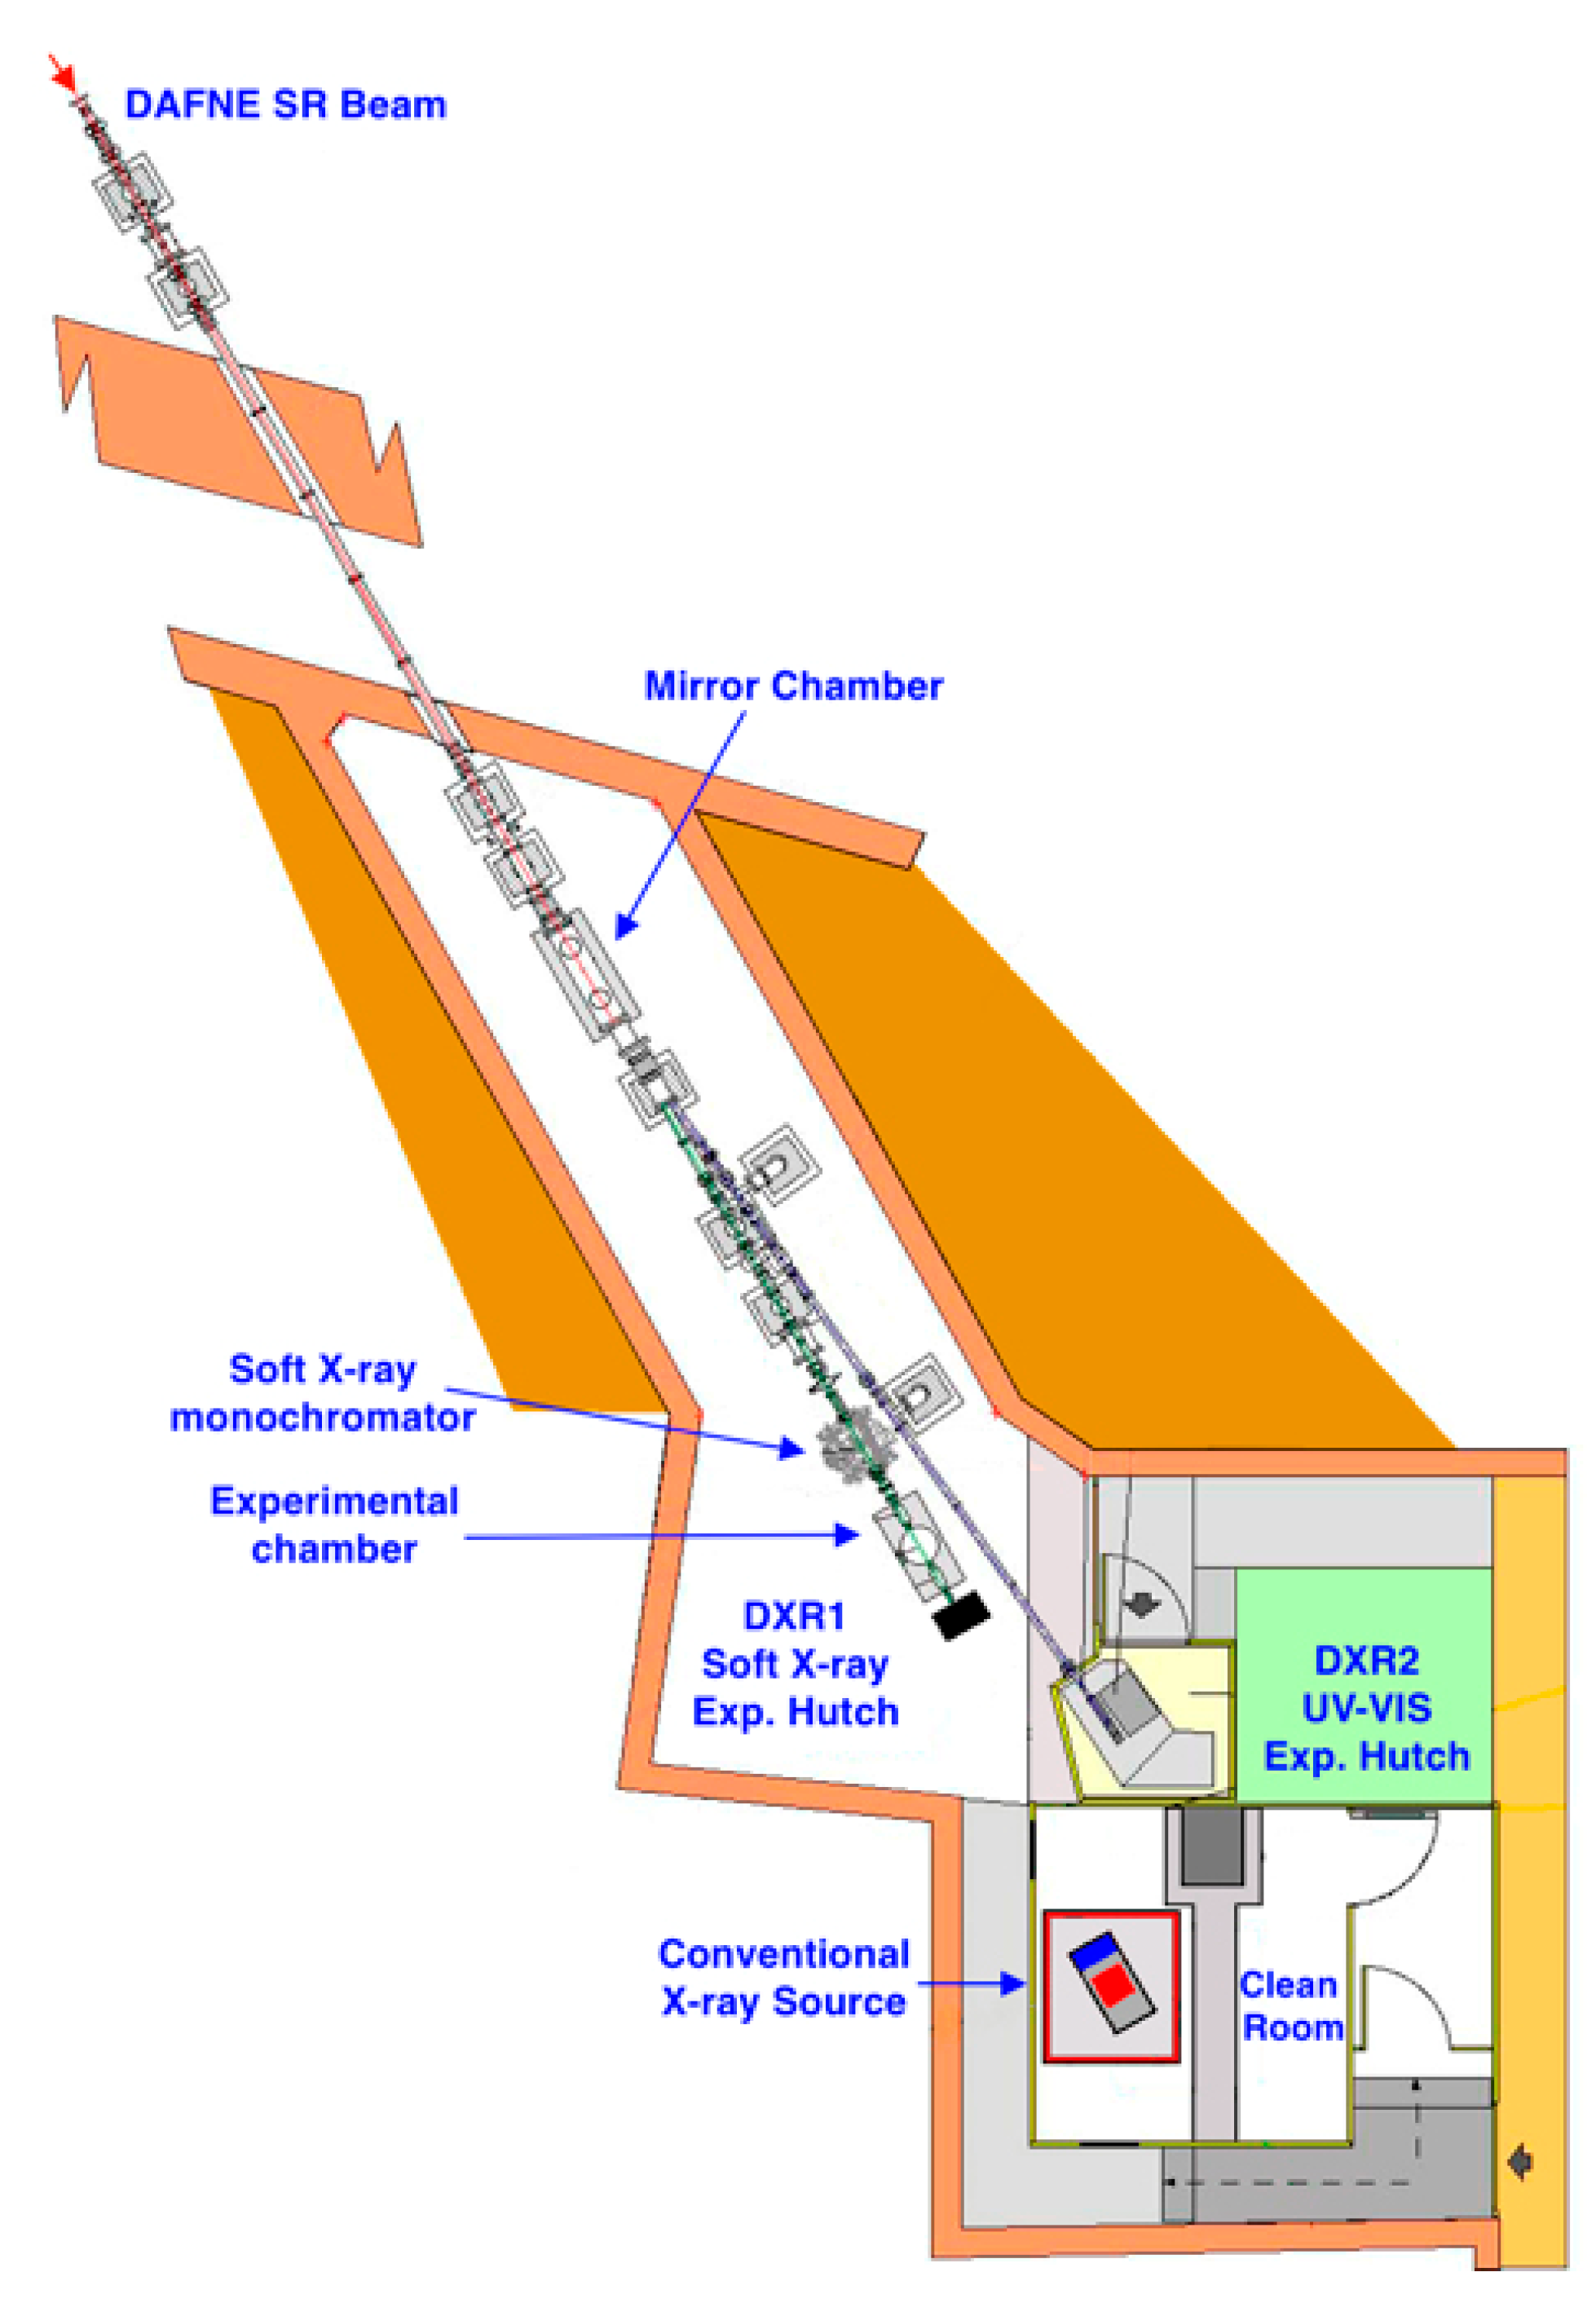
3.3. Using the Beamline for XAFS Applications

Twice a year, a call for proposals is open to EU, Italian, and other external users coming from Universities or Research Centers. The transnational access to all the DAFNE-Light beamlines open to users is nowadays supported by the EU CALIPSOplus project [18]. In recent years, the soft X-ray line has successfully delivered beamtime to many different experimental proposals. The X-ray Absorption Near Edge Spectroscopy (XANES) technique has been routinely applied in transmission mode on different samples within the energy range 1.0–3.0 keV. XANES spectra were acquired in parasitic and in dedicated beamtime days. During the parasitic mode days, tests of new samples and experiments not requiring long acquisition times, like studies of diamond detectors, soft X-ray multi-layers, and imaging of metal impurities in leaves were performed. Dedicated beamtime was normally used for selected experimental proposals chosen by the INFN-LNF DAFNE-Light User Selection Panel.
In the last year, some interesting experiments on silicate and lapis lazuli pigments at the Si and S K-edges that can have applications in the cultural heritage field have been performed and XANES data are being analyzed.
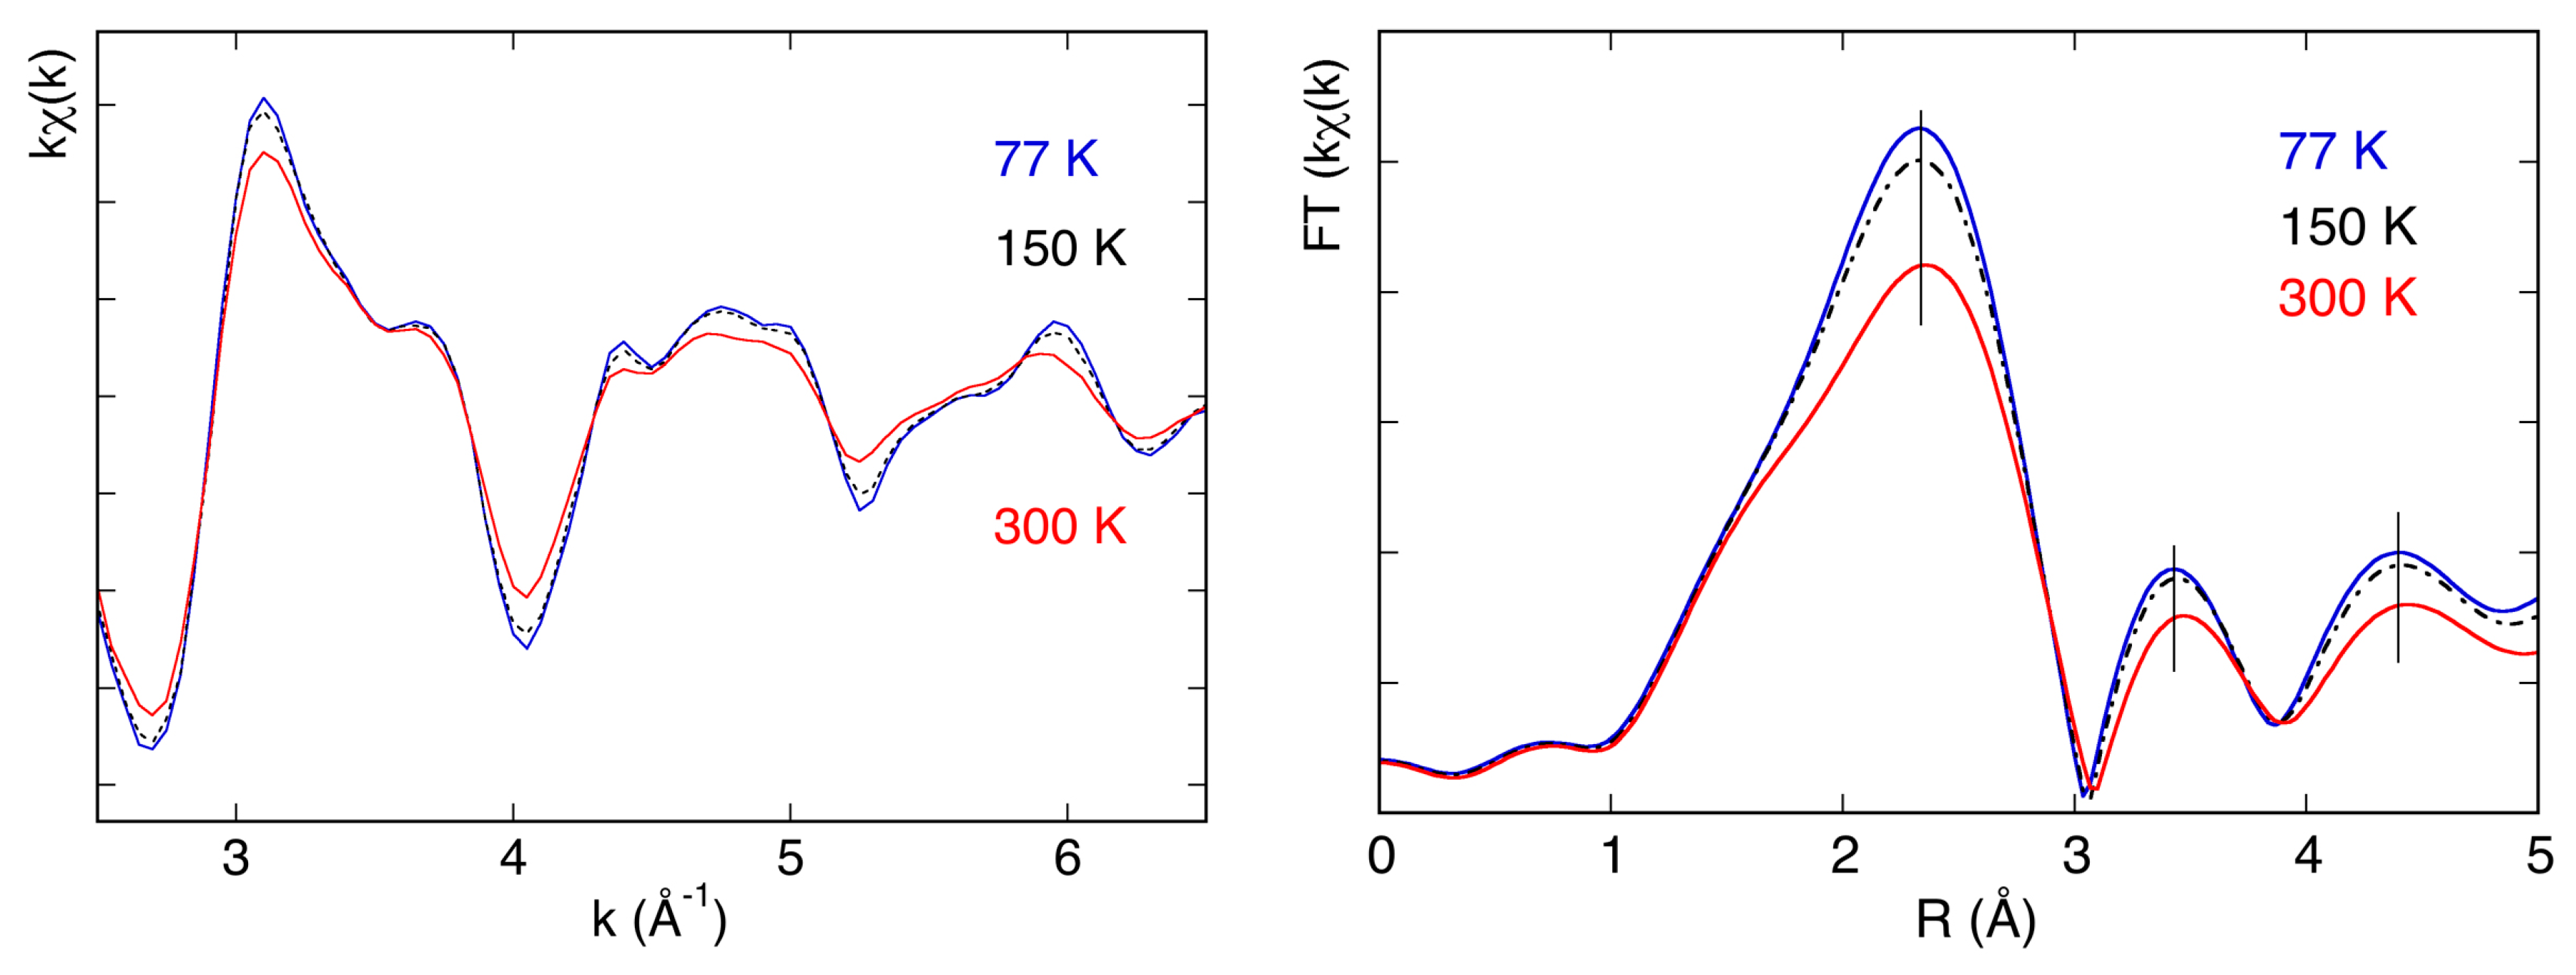
The possibility to perform measurements at low temperatures was used in experiments requiring tests of systems needed for space applications. In particular, the thermal characterization of the X-ray transmission of thin aluminum filters, needed to protect X-ray detectors for space missions, was performed at the DXR1 beamline. These measurements are important to characterize the effects induced on the detector by the aluminum filters. As shown in Figure 11 (left panel), where the EXAFS spectra of an aluminum foil as a function of temperature are reported, X-ray transmission measures the presence of a fine structure, but also of thermal effects that affect the phase and amplitude of the EXAFS oscillations. Both effects are probably more evident in Figure 11 (right panel), where the Fourier transforms of these spectra, calculated in the k range (2–7) Å−1, are reported. The reduction of the intensity of the peaks corresponding to the different coordination shells and the shift of their positions in R space, as a function of temperature, are now clearly more visible.
Just to give an idea of other kind of measurements that can be performed at the DXR1 beamline, some interesting applications will be reported concerning hydrogen storage materials [19], thiol-capped gold nanoparticles [20], and anticancer metallodrugs [21].
Concerning hydrogen storage materials, tetrahydroaluminates or alanates, complex hydrides containing AlH4 groups, were studied [19] for the development of higher-efficiency hydrogen storage materials, since it was discovered that the hydrogen de- and absorption can be catalyzed by doping with titanium and other transition metal and rare earth metal species. The aim of the experiments at the Al K edge was to investigate the local structure around Al atoms studying the alanate phase at different stages of the reaction after the material has been cycled under hydrogen. The study allowed showing the presence of modification within the alanate structure during cycling under hydrogen.
Moving to nanomaterials, it is well-known that the study on their size dependent structural and electronic properties asks, as ideal condition, nearly monodisperse particles. One way to achieve this is by capping nanoparticles with molecular species that interact with the surface preventing the nucleation or aggregation of single clusters. Capping molecules generally contain functional groups such as amine, alcohol, thiol, and phosphine, providing a wide range of interactions. Thiol-capping molecules are particularly suitable in preparative methods based on the chemical synthesis of nanoparticles, such as SMAD [20]. In general, thiols interact strongly with a gold surface, inducing meaningful charge redistribution. A thiol–Au interaction is quite important because it exhibits the interesting property of self-assembly. In principle, alkanethiolates are dissociatively chemisorbed to a gold surface via the sulfur atom after cleavage of S–H bonds. When interacting with a gold surface, different structural phases occur at increasing coverage; in particular, high coverage results in a formation of ordered structures. To better understand the gold–sulfur interactions, the XAFS sulfur K-edge measurements were performed at the DXR1 beamline (Figure 12), while the Au L3 measurements were performed elsewhere.
Moving to a totally different field, an important study has been performed on adducts of ruthenium anticancer metallodrugs with serum proteins and fragments of proteins [21]. There is a great interest in the analysis of the interactions of metal-based drugs with serum proteins in view of their relevant biological and pharmacological implications. Specifically, great attention has been given to ruthenium complexes that seem to be very promising.
The mechanisms through which the metal complexes produce their biological and pharmacological effects are still largely unexplored and it seems that ruthenium complexes act on different targets, most likely on proteins.
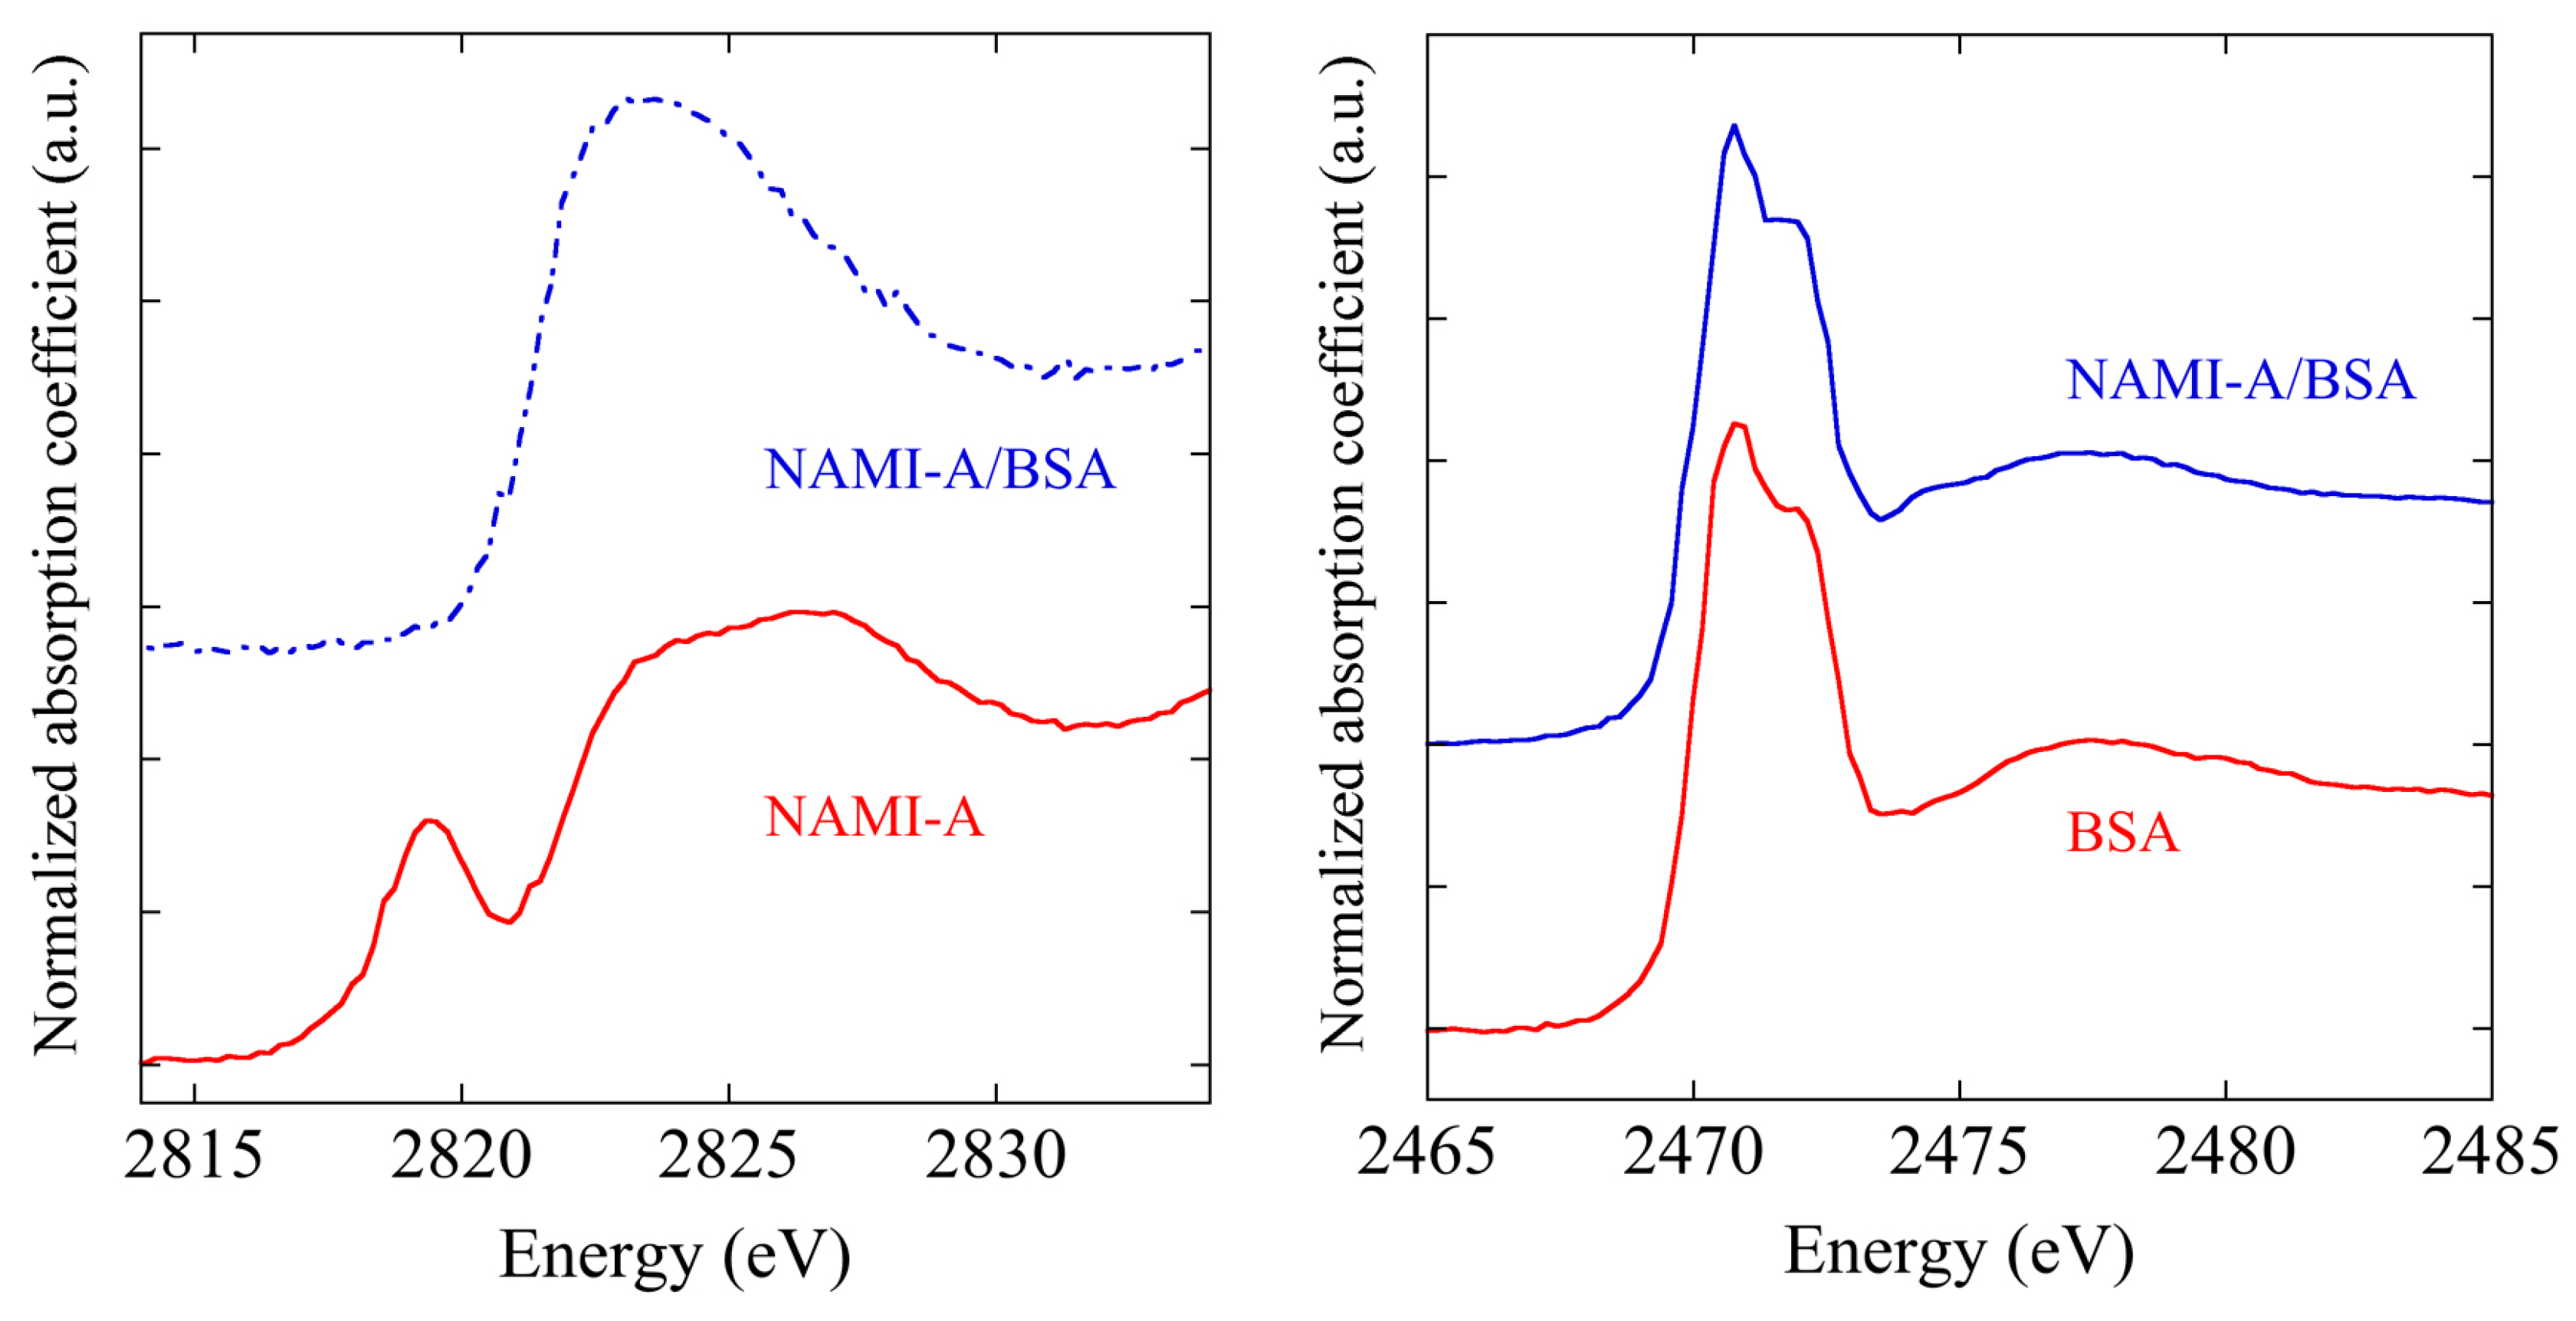
The reaction of bovine serum albumin (BSA) with [trans-RuCl4 (Im)(dimethylsulfoxide)][ImH] (Im = imidazole) (NAMI-A), an experimental ruthenium(III) anticancer drug, and the formation of the respective NAMI-A/BSA adduct have been investigated at the DXR1 beamline by XAFS measurements at the sulfur and chlorine K-edges and at the ruthenium L3 edge. Ruthenium XAFS data proved unambiguously that the ruthenium remains in the oxidation state, Ru(III), after protein binding. Comparative analysis of the chlorine K-edge XAS spectra of NAMI-A and NAMI-A/BSA revealed that the chlorine environment was greatly perturbed upon protein binding (Figure 13). Only small changes were observed in the sulfur K-edge spectra (Figure 13), probably because it was dominated by several protein sulfur groups. Valuable information on the nature of this metallodrug/protein adduct and on the mechanism of its formation was gained, and XAFS spectroscopy turned out to be a very suitable method for the study of this kind of systems.

4. Conclusions

The INFN-LNF soft X-ray DXR1 beamline started delivering beamtime to users at the end of 2004, but during the last few years, several improvements have been made concerning the sample environment. XAFS measurements can now be performed at low temperatures and, starting from 2019, in fluorescence mode as well, opening the possibility to study diluted and supported samples. The DXR1 beamline is mainly used for XAFS spectroscopy measurements but has also been used to test detectors and optical elements. As mentioned, XAFS spectroscopy can help achieving a complete local structural characterization of different kinds of samples, being very sensitive to the formal oxidation states, coordination chemistry, distances, coordination number, and species of the atoms immediately surrounding the selected atomic elements. At the DXR1 soft X-ray beamline, XAFS spectroscopy has been applied in many different fields, some examples of which have been reported here.

Funding

This research received no external funding.

Acknowledgments

The author wants to acknowledge the technical support given by A. Grilli, M. Pietropaoli, A. Raco, G. Viviani, V. Tullio, and V. Sciarra.

Conflicts of Interest

The author declares no conflict of interest.

References

  1. Balerna, A. DAΦNE-Light Facility Update. Synchrotron Radiat. News 2014, 27, 21–24. [Google Scholar] [CrossRef]
  2. Zobov, M.; Alesini, D.; Biagini, M.E.; Biscari, C.; Bocci, A.; Boni, R.; Boscolo, M.; Bossi, F.; Buonomo, B.; Clozza, A.; et al. Test of “Crab-Waist” Collisions at the DA Φ NE Φ Factory. Phys. Rev. Lett. 2010, 104, 174801. [Google Scholar] [CrossRef] [PubMed]
  3. Titkova, I.; Zobov, M.; Dabagov, S. Synchrotron Radiation from DAFNE Bending Magnet and Wiggler. Available online: https://www.openaccessrepository.it/record/20738/files/LNF-03-2(IR).pdf (accessed on 7 January 2019).
  4. Bellotti, G.; Butt, A.D.; Carminati, M.; Fiorini, C.; Bombelli, L.; Borghi, G.; Piemonte, C.; Zorzi, N.; Balerna, A. The ARDESIA Detection Module: A 4-Channel Array of SDDs for Mcps X-ray Spectroscopy in Synchrotron Radiation Applications. IEEE Trans. Nucl. Sci. 2018, 65, 1355–1364. [Google Scholar] [CrossRef]
  5. Koningsberger, D.C.; Prins, R. X-ray Absorption: Principles and Application Techniques of EXAFS, SEXAFS and XANES; John Wiley & Sons: New York, NY, USA, 1988. [Google Scholar]
  6. Rehr, J.J.; Albers, R.C. Theoretical approaches to X-ray absorption fine structure. Rev. Mod. Phys. 2000, 72, 621–654. [Google Scholar] [CrossRef]
  7. Jalilehvand, F. Sulfur: Not a “silent” element any more. Chem. Soc. Rev. 2006, 35, 1256–1268. [Google Scholar] [CrossRef] [PubMed]
  8. Cotte, M.; Susini, J.; Dik, J.; Janssens, K. Synchrotron-Based X-ray Absorption Spectroscopy for Art Conservation: Looking Back and Looking Forward. Acc. Chem. Res. 2010, 43, 705–714. [Google Scholar] [CrossRef] [PubMed]
  9. Li, D.; Bancroft, G.M.; Fleet, M.E.; Feng, X.H.; Pan, Y. Al K-edge XANES spectra of aluminosilicate minerals. Am. Mineral. 1995, 80, 432–440. [Google Scholar] [CrossRef]
  10. Lee, P.A.; Citrin, P.H.; Eisenberger, P.; Kincaid, B.M. Extended X-ray absorption fine structure and limitations as a structural tool. Rev. Mod. Phys. 1981, 53, 769–806. [Google Scholar] [CrossRef]
  11. Ravel, B.; Newville, M.; Athena, A. Hephaestus: Data analysis for X-ray absorption spectroscopy using IFEFFIT. J. Synchrotron Radiat. 2005, 12, 537–541. [Google Scholar] [CrossRef] [PubMed]
  12. Jouve, A.; Nagy, G.; Somodi, F.; Tiozzo, C.; Villa, A.; Balerna, A.; Beck, A.; Evangelisti, C.; Prati, L. Gold-silver catalysts: Effect of catalyst structure on the selectivity of glycerol oxidation. J. Catal. 2018, 368, 324–335. [Google Scholar] [CrossRef]
  13. Newville, M. IFEFFIT: Interactive XAFS analysis and FEFF fitting. J. Synchrotron Radiat. 2001, 8, 322–324. [Google Scholar] [CrossRef] [PubMed]
  14. Zabinsky, S.I.; Rehr, J.J.; Ankudinov, A.; Albers, R.C.; Eller, M.J. Multiple-scattering calculations of X-ray-absorption spectra. Phys. Rev. B 1995, 52, 2995–3009. [Google Scholar] [CrossRef]
  15. Rehr, J.J.; Kas, J.J.; Vila, F.D.; Prange, M.P.; Jorissen, K. Parameter-free calculations of X-ray spectra with FEFF9. Phys. Chem. Chem. Phys. 2010, 12, 5503–5513. [Google Scholar] [CrossRef] [PubMed]
  16. Li, G.G.; Bridges, F.; Booth, C.H. X-ray-absorption fine-structure standards: A comparison of experiment and theory. Phys. Rev. B 1995, 52, 6332–6348. [Google Scholar] [CrossRef]
  17. Zeng, L.; Tran, D.T.; Tai, C.-W.; Svensson, G.; Olsson, E. Atomic structure and oxygen deficiency of the ultrathin aluminium oxide barrier in Al/AlOx/Al Josephson junctions. Sci. Rep. 2016, 6, 29679. [Google Scholar] [CrossRef] [PubMed] [Green Version]
  18. CALIPSOplus Is an H2020 Integrating Activity for Advanced Communities-Grant Agreement N. Available online: http://www.calipsoplus.eu/ (accessed on 7 January 2019).
  19. Leon, A.; Balerna, A.; Cinque, G.; Frommen, C.; Fichtner, M. Al K-edge XANES Measurements in NaAlH4 Doped with TiCl3 by Ball Milling. J. Phys. Chem. C 2007, 111, 3795. [Google Scholar] [CrossRef]
  20. Comaschi, T.; Balerna, A.; Mobilio, S. Temperature dependence of the structural parameters of gold nanoparticles investigated with EXAFS. Phys. Rev. B 2008, 77, 075432. [Google Scholar] [CrossRef]
  21. Ascone, I.; Messori, L.; Casini, A.; Gabbiani, C.; Balerna, A.; Dell’Unto, F.; Congiu Castellano, A. Exploiting Soft and Hard X-Ray Absorption Spectroscopy to Characterize Metallodrug/Protein Interactions: The Binding of [trans-RuCl4(Im)(dimethylsulfoxide)][ImH] (Im = imidazole) to Bovine Serum Albumin. Inorg. Chem. 2008, 47, 8629–8634. [Google Scholar] [CrossRef] [PubMed]
Figure 1. Calculated photon flux of the DXR1 DAΦNE wiggler (log scale), taking into account an electron circulating current of 1 A.
Condensedmatter 04 00007 g001
Figure 2. Schematic view of the DXR1 Soft X-ray and DXR2 UV-VIS beamlines.
Condensedmatter 04 00007 g002
Figure 3. DXR1 Soft X-ray beamline monochromator and experimental chamber from left to right.
Condensedmatter 04 00007 g003
Figure 4. Comparison between the XAFS spectra of Pyrex samples measured at the DXR1 beamline in absorption and fluorescence mode.
Condensedmatter 04 00007 g004
Figure 5. XAFS absorption spectrum at the K-edge of aluminum metal measured at the DXR1 beamline at room temperature.
Condensedmatter 04 00007 g005
Figure 6. Schematic view of a typical XAFS experimental setup, where in transmission mode, I0 and IT are measured using two ionization chambers, while in fluorescence mode, a fluorescence detector needs to be used.
Condensedmatter 04 00007 g006
Figure 7. Energy shifts of the S K-edge as a function of S valence changes.
Condensedmatter 04 00007 g007
Figure 8. The very different XANES spectra of: (a) aluminum metal foil and (b) an aluminum oxide Al2O3.
Condensedmatter 04 00007 g008
Figure 9. Left side: Data extraction process for the analysis of the EXAFS data of an aluminum metal foil pre-edge background subtraction and normalization; Right side: Extracted EXAFS data of an aluminum metal foil.
Condensedmatter 04 00007 g009
Figure 10. Fourier Transforms of the EXAFS experimental data (full line) and of the theoretical first (red dashed lines) and second (green dashed lines) shell contributions.
Condensedmatter 04 00007 g010
Figure 11. EXAFS spectra (left panel) of an aluminum foil measured at 77 K, 150 K and 300 K) and their Fourier transforms (right panel).
Condensedmatter 04 00007 g011
Figure 12. XANES spectrum at S K-edge of a gold thiol-capped sample.
Condensedmatter 04 00007 g012
Figure 13. Left panel: normalized spectra at the chlorine K-edge of NAMI-A and of the NAMI-A/BSA adduct; Right panel: normalized spectra at the sulfur K-edge of bovine serum albumin (BSA) and of the NAMI-A/BSA adduct.
Condensedmatter 04 00007 g013
Table 1. Available sets of X-ray crystals.
Crystal2d Spacing (Å)Energy Range (eV)Absorption Edges
Beryl (10-10)15.954900–1560Na K, Mg K
KTP (011)10.9501200–2200Al K
InSb (111)7.4811800–3000Si K–Cl K
Ge (111)6.5322100–3000P K–Cl K
Table 2. Results achieved in the fitting procedure of the first two Al coordination shells.
ShellNR (Å)σ22)
First122.85(1)0.014(3)
Second64.04(1)0.027(4)

