Article

Transcriptomic Comparison of Liver Tissue across Different Largemouth Bass (Micropterus salmoides) Strains

1
Zhejiang Fisheries Technical Extension Center, Hangzhou 310023, China
2
Key Laboratory of Molecular Animal Nutrition, Zhejiang University, Hangzhou 310058, China
3
College of Animal Science, Zhejiang University, Hangzhou 310058, China
*
Authors to whom correspondence should be addressed.
These authors contributed equally to this work.
Fishes 2023, 8(11), 558; https://doi.org/10.3390/fishes8110558
Submission received: 23 October 2023 / Revised: 10 November 2023 / Accepted: 16 November 2023 / Published: 19 November 2023
(This article belongs to the Special Issue Immune Response in Fish)

Abstract

:
Over the past few years, China has become a hotspot for the domestication of the commercially valuable largemouth bass (Micropterus salmoides). Although the food preference of this fish has been studied, little is known about the genes regulating its growth. Population breeding was performed using two indigenous strains (QT1 and QT2), with the results showing that the organ/body ratio, abdominal fat rate and the body weight gain of QT1 and QT2 were higher than for the offspring YL1 and Y3 which are extensively cultured in China. Subsequent RNA sequencing (RNA-Seq) allowed for the identification of potential genes and pathways involved in growth performance. Overall, the transcriptome analysis generated 89,056 transcripts and 42,529 Unigenes. A PCA revealed significant differences between QT1 and the other three strains, while the other three strains did not show much difference. A KEGG enrichment analysis of differentially expressed genes showed that steroid biosynthesis was the most enriched pathway among the four strains. These pathways could be related to the growth of largemouth bass. In addition, a co-expression network analysis suggested a strong interaction between liver steroid biosynthesis and the genes for photosynthesis, secondary metabolism and stress response. Taken together, the above results can provide new insights into the liver metabolism of different strains of largemouth bass during culture and provide references for the subsequent domestication and breeding programs of largemouth bass.
Key Contribution: First of all, in China, two new species of largemouth bass have been bred—Youlu 1 and Youlu 3. At the same time, many research institutions have worked on the breeding of largemouth bass. Most of the published research papers have focused on the changes of population diversity in breeding, physiology, biochemistry and selection of a single breed. There are a few studies on the culture growth traits of different species of largemouth bass based on comparative transcriptomics, so our paper can fill the gap in such studies.

1. Introduction

Fish, as a major source of food and high-quality protein, accounts for 16% of the animal proteins that are consumed around the world [1]. Over the past few years, the largemouth bass (Micropterus salmoides) industry has experienced a rapid expansion, especially in China where this carnivorous freshwater fish of the Perciformes order, Centrarchidae family and Micropterus genus is largely cultured due to its favorable attributes in terms of adaptability, rapid growth rate and superior meat quality [2]. Within its native range, two subspecies of largemouth bass are currently recognized, namely, the northern largemouth bass (M. s. salmoides), with a native range extending throughout southeastern Canada, northeastern Mexico as well as the eastern and central U.S., and the Florida largemouth bass (M. s. floridanus) which is native to peninsular Florida [3].
After its introduction into China in 1983, largemouth bass became an important cultured fish species, with production totaling 702,093 tons in 2021 [4,5]. However, over the past three decades, the breeding practices for this fish have largely neglected scientific principles. Indeed, farms prioritized convenience and economic benefits by often breeding largemouth bass that did not meet market standards [6], and this resulted in a significant decline in genetic diversity that was manifested as decreased resistance to stress, inefficient feed conversion, early sexual maturity and reduced growth rate [7]. To address these issues, genetic breeding efforts, undertaken by the farming industry, have been focused on enhancing the growth rate of largemouth bass [8]. Such breeding programs, started in 2016 using two indigenous strains (Youlu NO.1, YL1, and Youlu NO.3, YL3), have so far generated two strains named QT1 and QT2, for which the fourth-generation offspring have shown favorable productive traits. However, the underlying molecular mechanism governing these traits are not yet fully understood, hence limiting future breeding and selection processes.
Transcriptome technology, which uses high-throughput sequencing to analyze the RNA sequences in specific cells or tissues, has emerged as an important tool for identifying differential genes that could be associated with specific traits or to study the regulation of gene expression [9]. Hence, through this approach, it is now possible to study an organism’s genetic features [10], its growth and development [11], its stress or immune defense mechanisms [12] as well as other biological processes.
The liver, as the largest digestive gland and a key metabolic organ in fish, exhibits a strong ability to metabolize substances while also fulfilling a number of other biological functions, such as immune defense [13], carbohydrate and lipid metabolism [14,15], growth [16] as well as hormone secretion and synthesis [17]. This work used comparative transcriptomics at the whole-genome level to study liver tissues from the four aforementioned strains of largemouth bass. The aim was to gain a comprehensive understanding of the fish’s metabolism while providing insights that could assist breeding programs.

2. Materials and Methods

2.1. Fish and Sample Collection

Four strains of Micropterus Salmoides (YL1, YL3, QT1 and QT2) were provided by our breeding base in Xiaoshan District, Hangzhou, Zhejing Province, P. R. China. All samples were hatched in the same batch and allowed to acclimatize so that they could fully consume the compound diet. The initial weight of each individual was nearly similar at approximately 55 g. Prior to the sampling process, scissors, tweezers, blades and other required instruments were sterilized in an autoclave (121 °C, 2 h). In addition, they were wiped with ethanol (75%) and flame-sterilized before use. For sample collection, the fish were first anesthetized (MS-222) and dissected on an ice tray. Liver tissues were then isolated and treated with liquid nitrogen prior to storage at −80 °C.

2.2. Growth Performance

To evaluate the growth performance of the four largemouth bass strains, a feeding trial, based on an indoor recirculating aquaculture system, was performed at the Hangzhou Xi-ba field station which is part of the Zhejiang Fisheries Technical Extension Center (Hangzhou, China). Each fish breed was placed in three 500-L tanks (triplicates) for a total of twelve tanks for the four strains. Thirty fish, with an average initial body weight of 6.10 ± 0.09 g, were then randomly selected from each tank and fed a diet containing 46% of crude protein and 9% of crude lipid. Feeding was performed, up to apparent satiation, twice daily (08:00 a.m. and 17:00 p.m.) for 8 weeks.

2.3. Extraction of RNA, Library Preparation and Sequencing

Trizol reagent (Invitrogen) was used to extract RNA as previously described [18]. The amount and purity of the extracted RNA was then assessed with a Bioanalyzer 2100 and an RNA 1000 Nano LabChip Kit (Agilent, CA, USA). In this case, a RIN number of >7.0 was selected as threshold for acceptable RNA quality. Purification of poly(A) RNA from total RNA (5 μg) was then performed two times using Poly-T oligo-attached magnetic beads, and this was followed by RNA fragmentation using divalent cations at a high temperature. A cDNA library, with an average insert size of 300 bp (for paired-ends libraries), was then generated through reverse transcription of the RNA fragments (±50 bp) by following the procedure for the RNA-seq sample preparation kit (Illumina, San Diego, CA, USA). Eventually, paired-end sequencing was performed on an Illumina Hiseq 4000 platform (LC Sciences, Pittsburgh, PA, USA) as required by established procedures.

2.4. De Novo Assembly, Unigene Annotation and Functional Classification

Reads containing adaptor sequences as well as low-quality and undetermined bases were removed using Cutadapt (https://cutadapt.readthedocs.io/en/stable/guide.html, accessed on 5 July 2022) and Perl scripts V5.8.7 [19]. Prior to downstream analyses, the quality of the remaining sequences was assessed with FastQC (http://www.bioinformatics.babraham.ac.uk/projects/fastqc/, accessed on 15 July 2022) based on Q20 and Q30 scores as well as the GC-content of the data. This was followed by de novo assembly of the transcriptome using Trinity 2.4.0 [20] which uses shared sequence content to group transcripts into clusters. In this case, given that a ‘gene’ loosely refers to a transcript cluster, the longest transcript in each cluster was selected as the representative ‘gene’ (Unigene).

2.5. Analysis of Differentially Expressed Unigenes (DEGs) and Functional Enrichment Analyses

OmicShare tools (https://www.omicshare.com/tools, accessed on 25 July 2022), a free online platform, was used for analyzing DEGs prior to GO and KEGG pathway enrichment analyses. All assembled Unigenes were then aligned against the Kyoto Encyclopedia of Genes and Genomes (KEGG) (http://www.genome.jp/kegg/) and the Gene ontology (GO) (http://www.geneontology.org) databases using Diamond Cut V8.0.2 [21]. Raw p-values were adjusted using the Bonferroni method, with 0.05 selected as the significance level.

2.6. Analysis of Protein–Protein Interaction (PPI) and Scoring of the Gene Network

Gene interaction was analyzed with the STRING database (http://string-db.org/) [22]. In this case, a score threshold of >0.400 and seven interactors (text-mining, databases, experiments, co-expression, co-occurrence, gene fusion and neighborhood) were selected, along with the default settings, to screen for potential targets [23]. Each gene identified within the PPI network was eventually ranked based on its score (in descending order) which was determined from the number of connected genes.

2.7. Statistical Analysis

SPSS 19.0 software was used for statistical analysis of the growth performance, with the results provided as mean ± standard error of mean (SEM). The data were also compared with one-way analysis of variance (ANOVA) and tested for significance at p < 0.05.

3. Results

3.1. Growth Performance of the Four Largemouth Bass Strains

Table 1 shows the growth performance of the four largemouth bass strains. A comparison of the data revealed that, under similar survival rates, organ/body ratios and abdominal fat rates, the body weight gain of QT1 and QT2 strains was higher compared with YL1 and Y3 (Table 1). In this case, the final mean body weights (BW) were 828.9 ± 11.0, 792.8 ± 10.3, 788.9 ± 7.9 and 819.1 ± 13.2 g, respectively. Furthermore, feed and protein efficiency varied significantly between the fish strains at the end of the experiment, although food intake was not significantly different (Table 1). Hence, the results suggested that the higher body weight gain was not due to food intake, but was instead correlated with feed and protein availability. To investigate the potential mechanism involved, this study focused on the liver, a key metabolic organ in fish.

3.2. Sequencing and Annotation of Unigenes

A total of 903,806,038 raw reads were generated after the transcriptome sequencing of liver tissues from the four fish strains, and of these, 895,278,968 reads remained after filtering out low-quality reads (Table 2). The quality of the clean reads was validated based on their Q20 and Q30 scores which were higher than 98.19% and 94.17%, respectively, as well as on their GC content which varied between 48.44% and 49.79%. In addition, the RIN values of the extracted RNA met the required standard, thereby confirming its integrity and suitability for library preparation and sequencing.
The Trinity program was used to predict ORFs (open reading frames) for all assembled Unigenes in order to obtain and validate sequence-based annotations. This step yielded 89,056 transcripts and 42,529 Unigenes, with an average length of 901 and 378 bp, respectively (Table 3). In this case, the quality of the assembly was reflected in the unigene’s N50 value of 3675.

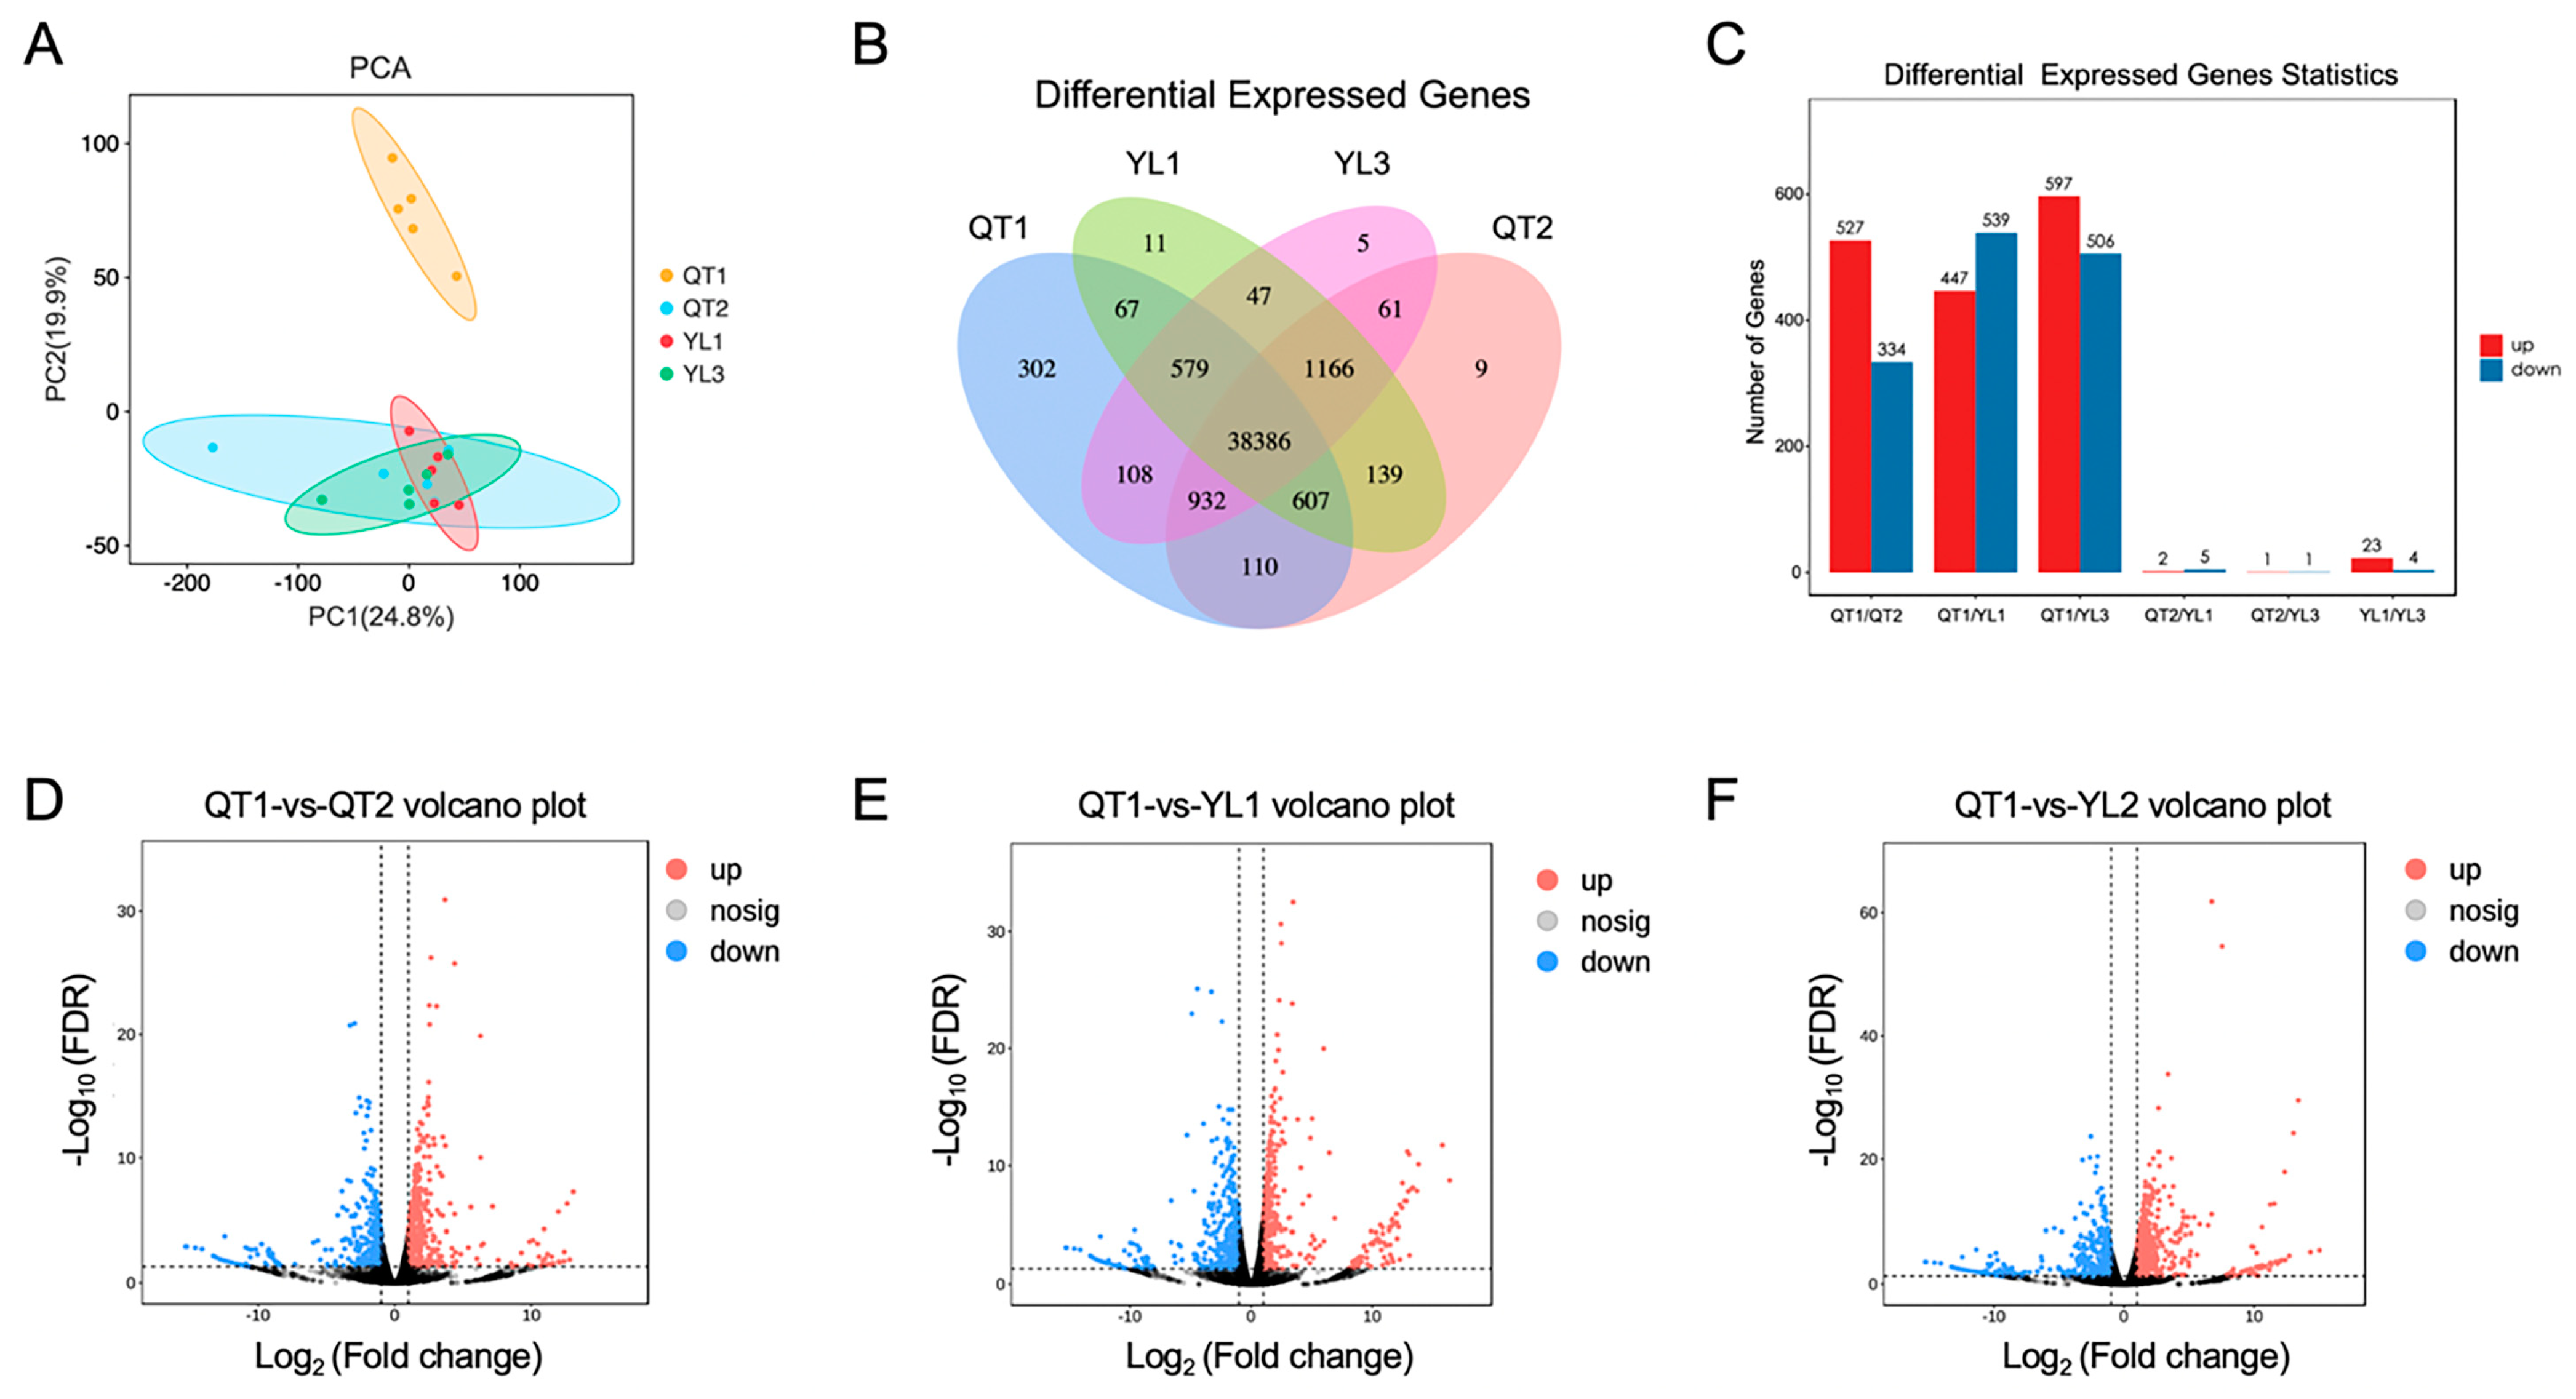
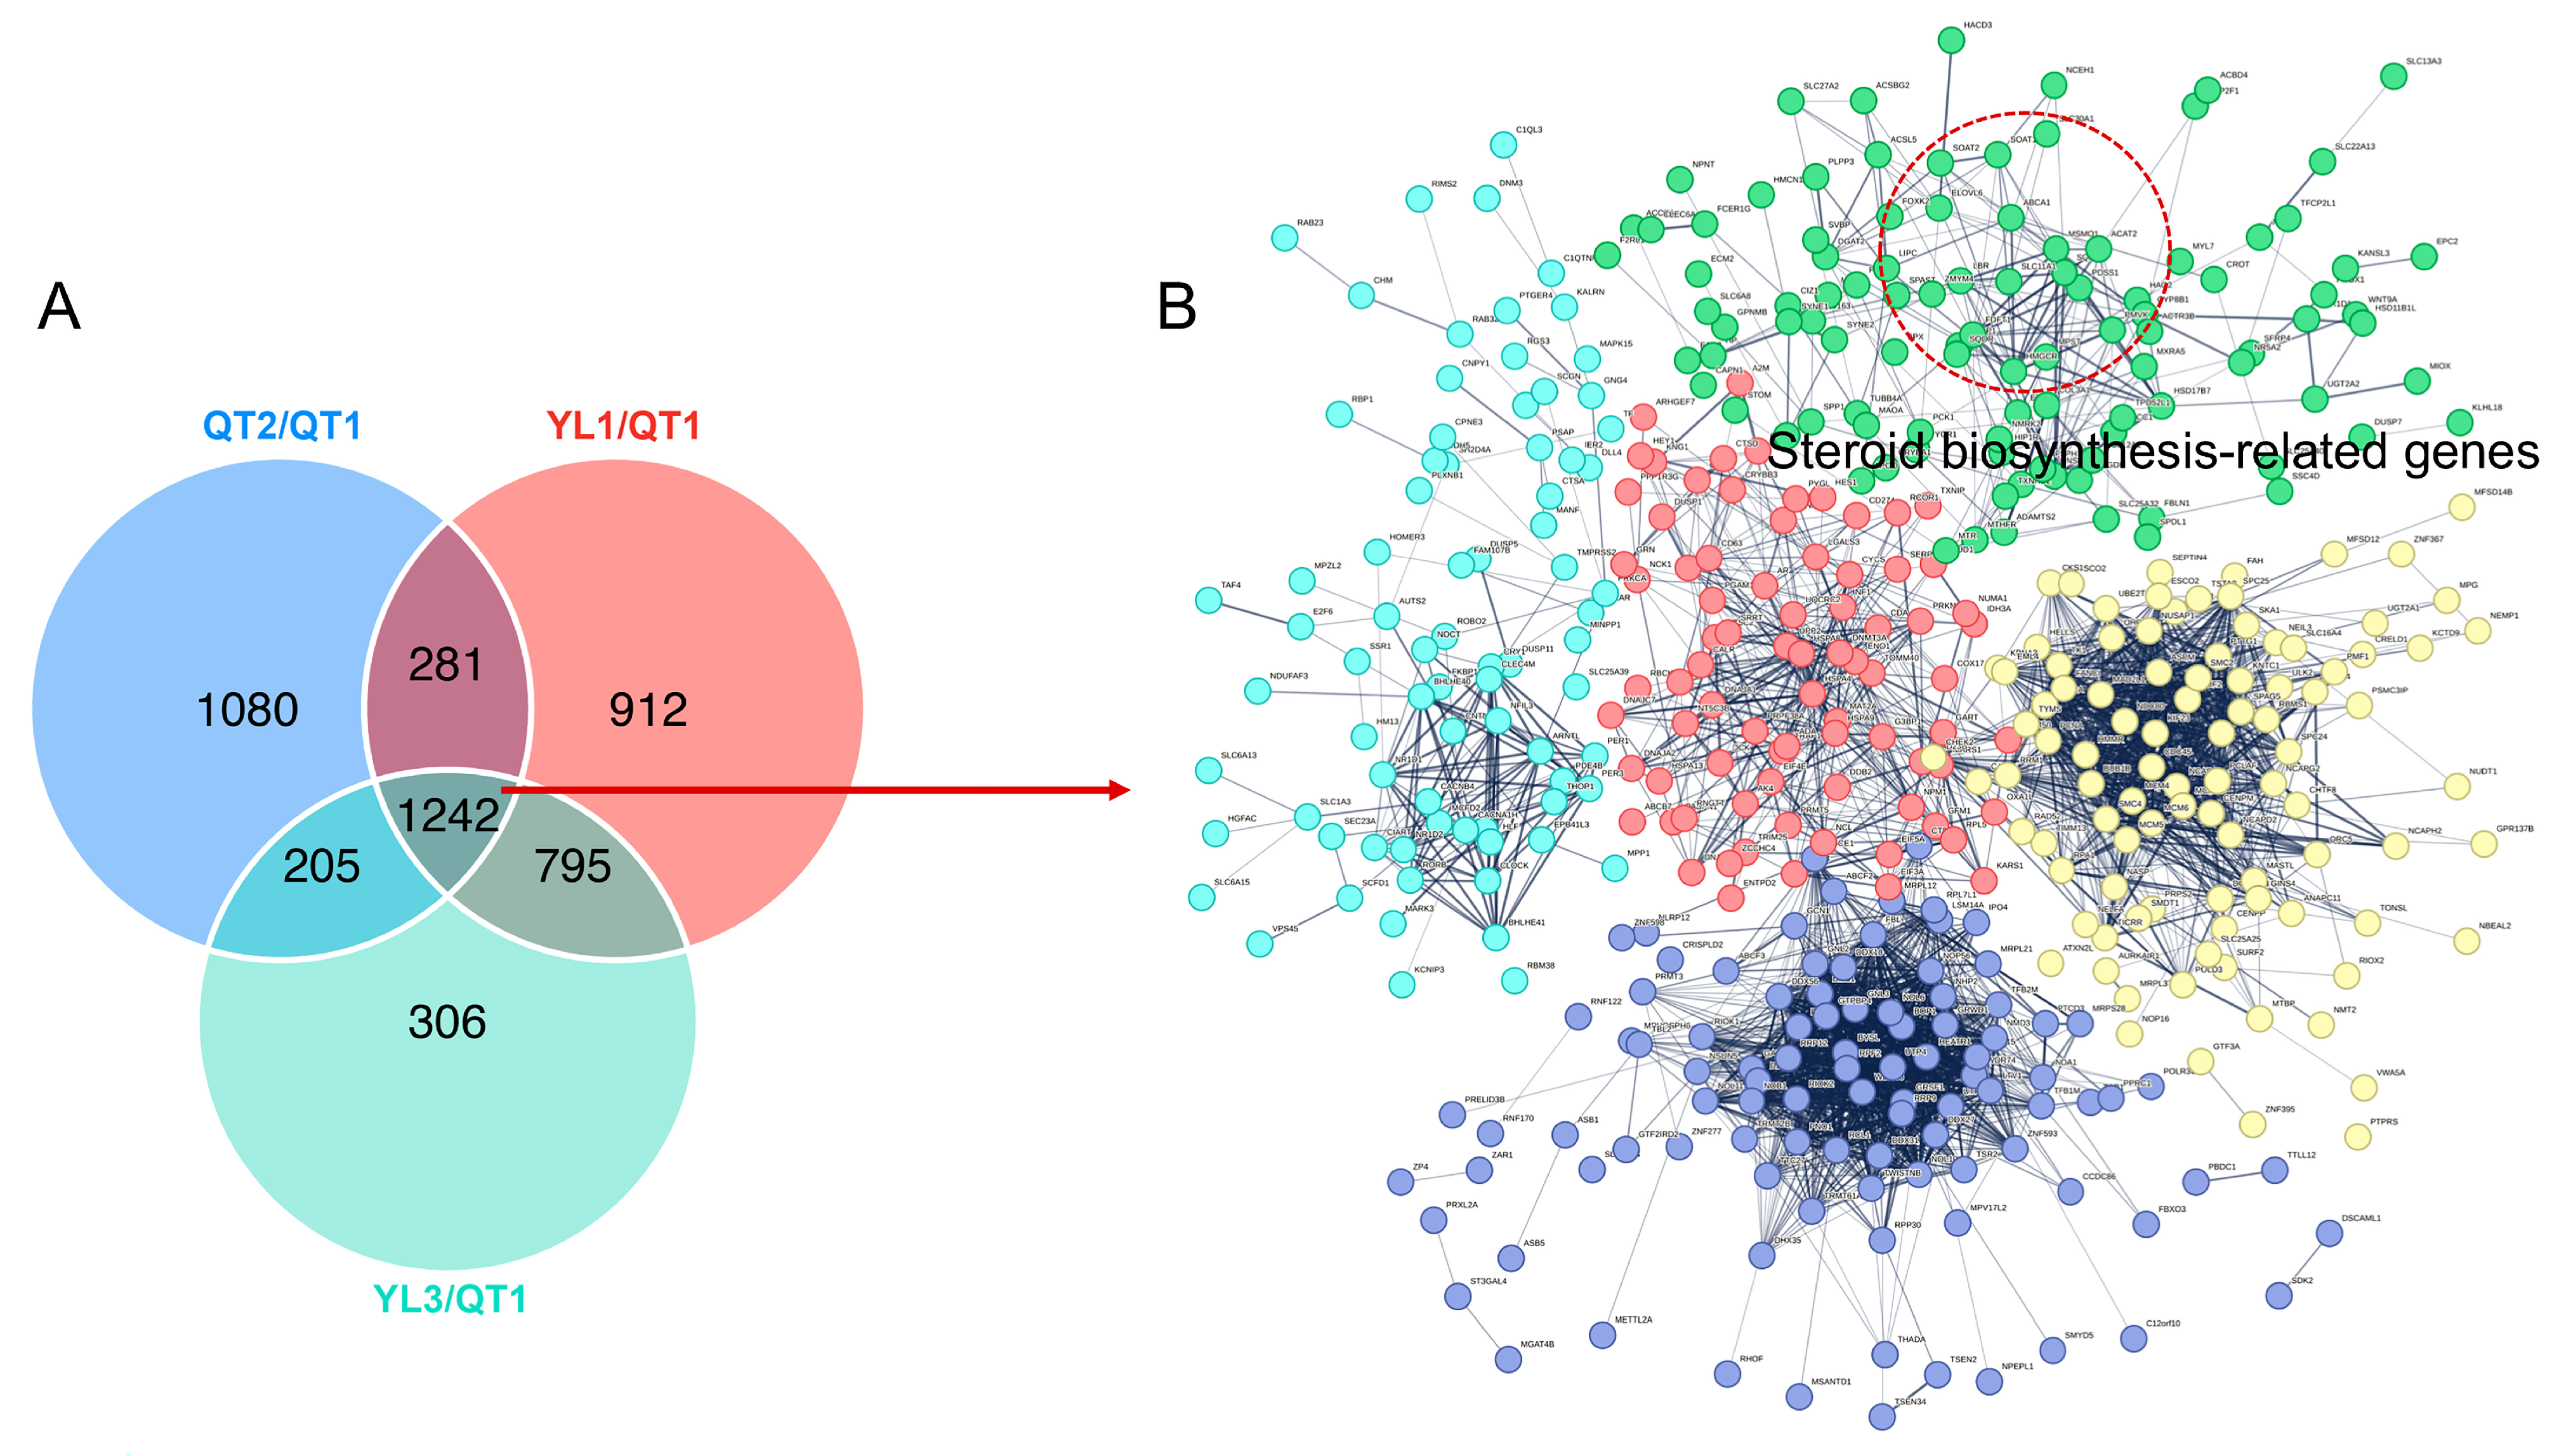
3.3. Analysis of Differentially Expressed Genes

A PCA analysis revealed significant differences between QT1 and the other three strains, with the latter’s close clustering suggesting smaller differences between them (Figure 1A). This was consistent with the results for the number of differentially expressed genes (Figure 1B,C). A total of 1880 DEGs were found between QT1 and QT2, of which 844 were up-regulated and 1036 were down-regulated (Figure 1D). Similarly, comparing YL1 and QT1 revealed 1876 DEGs which included 1018 up-regulated and 858 down-regulated genes (Figure 1E). Finally, 2179 DEGs were identified between YL3 and QT1, with 1189 being up-regulated and 990 being down-regulated (Figure 1F). Thus, pairwise comparisons highlighted variations in the number of differentially expressed genes between the strains.

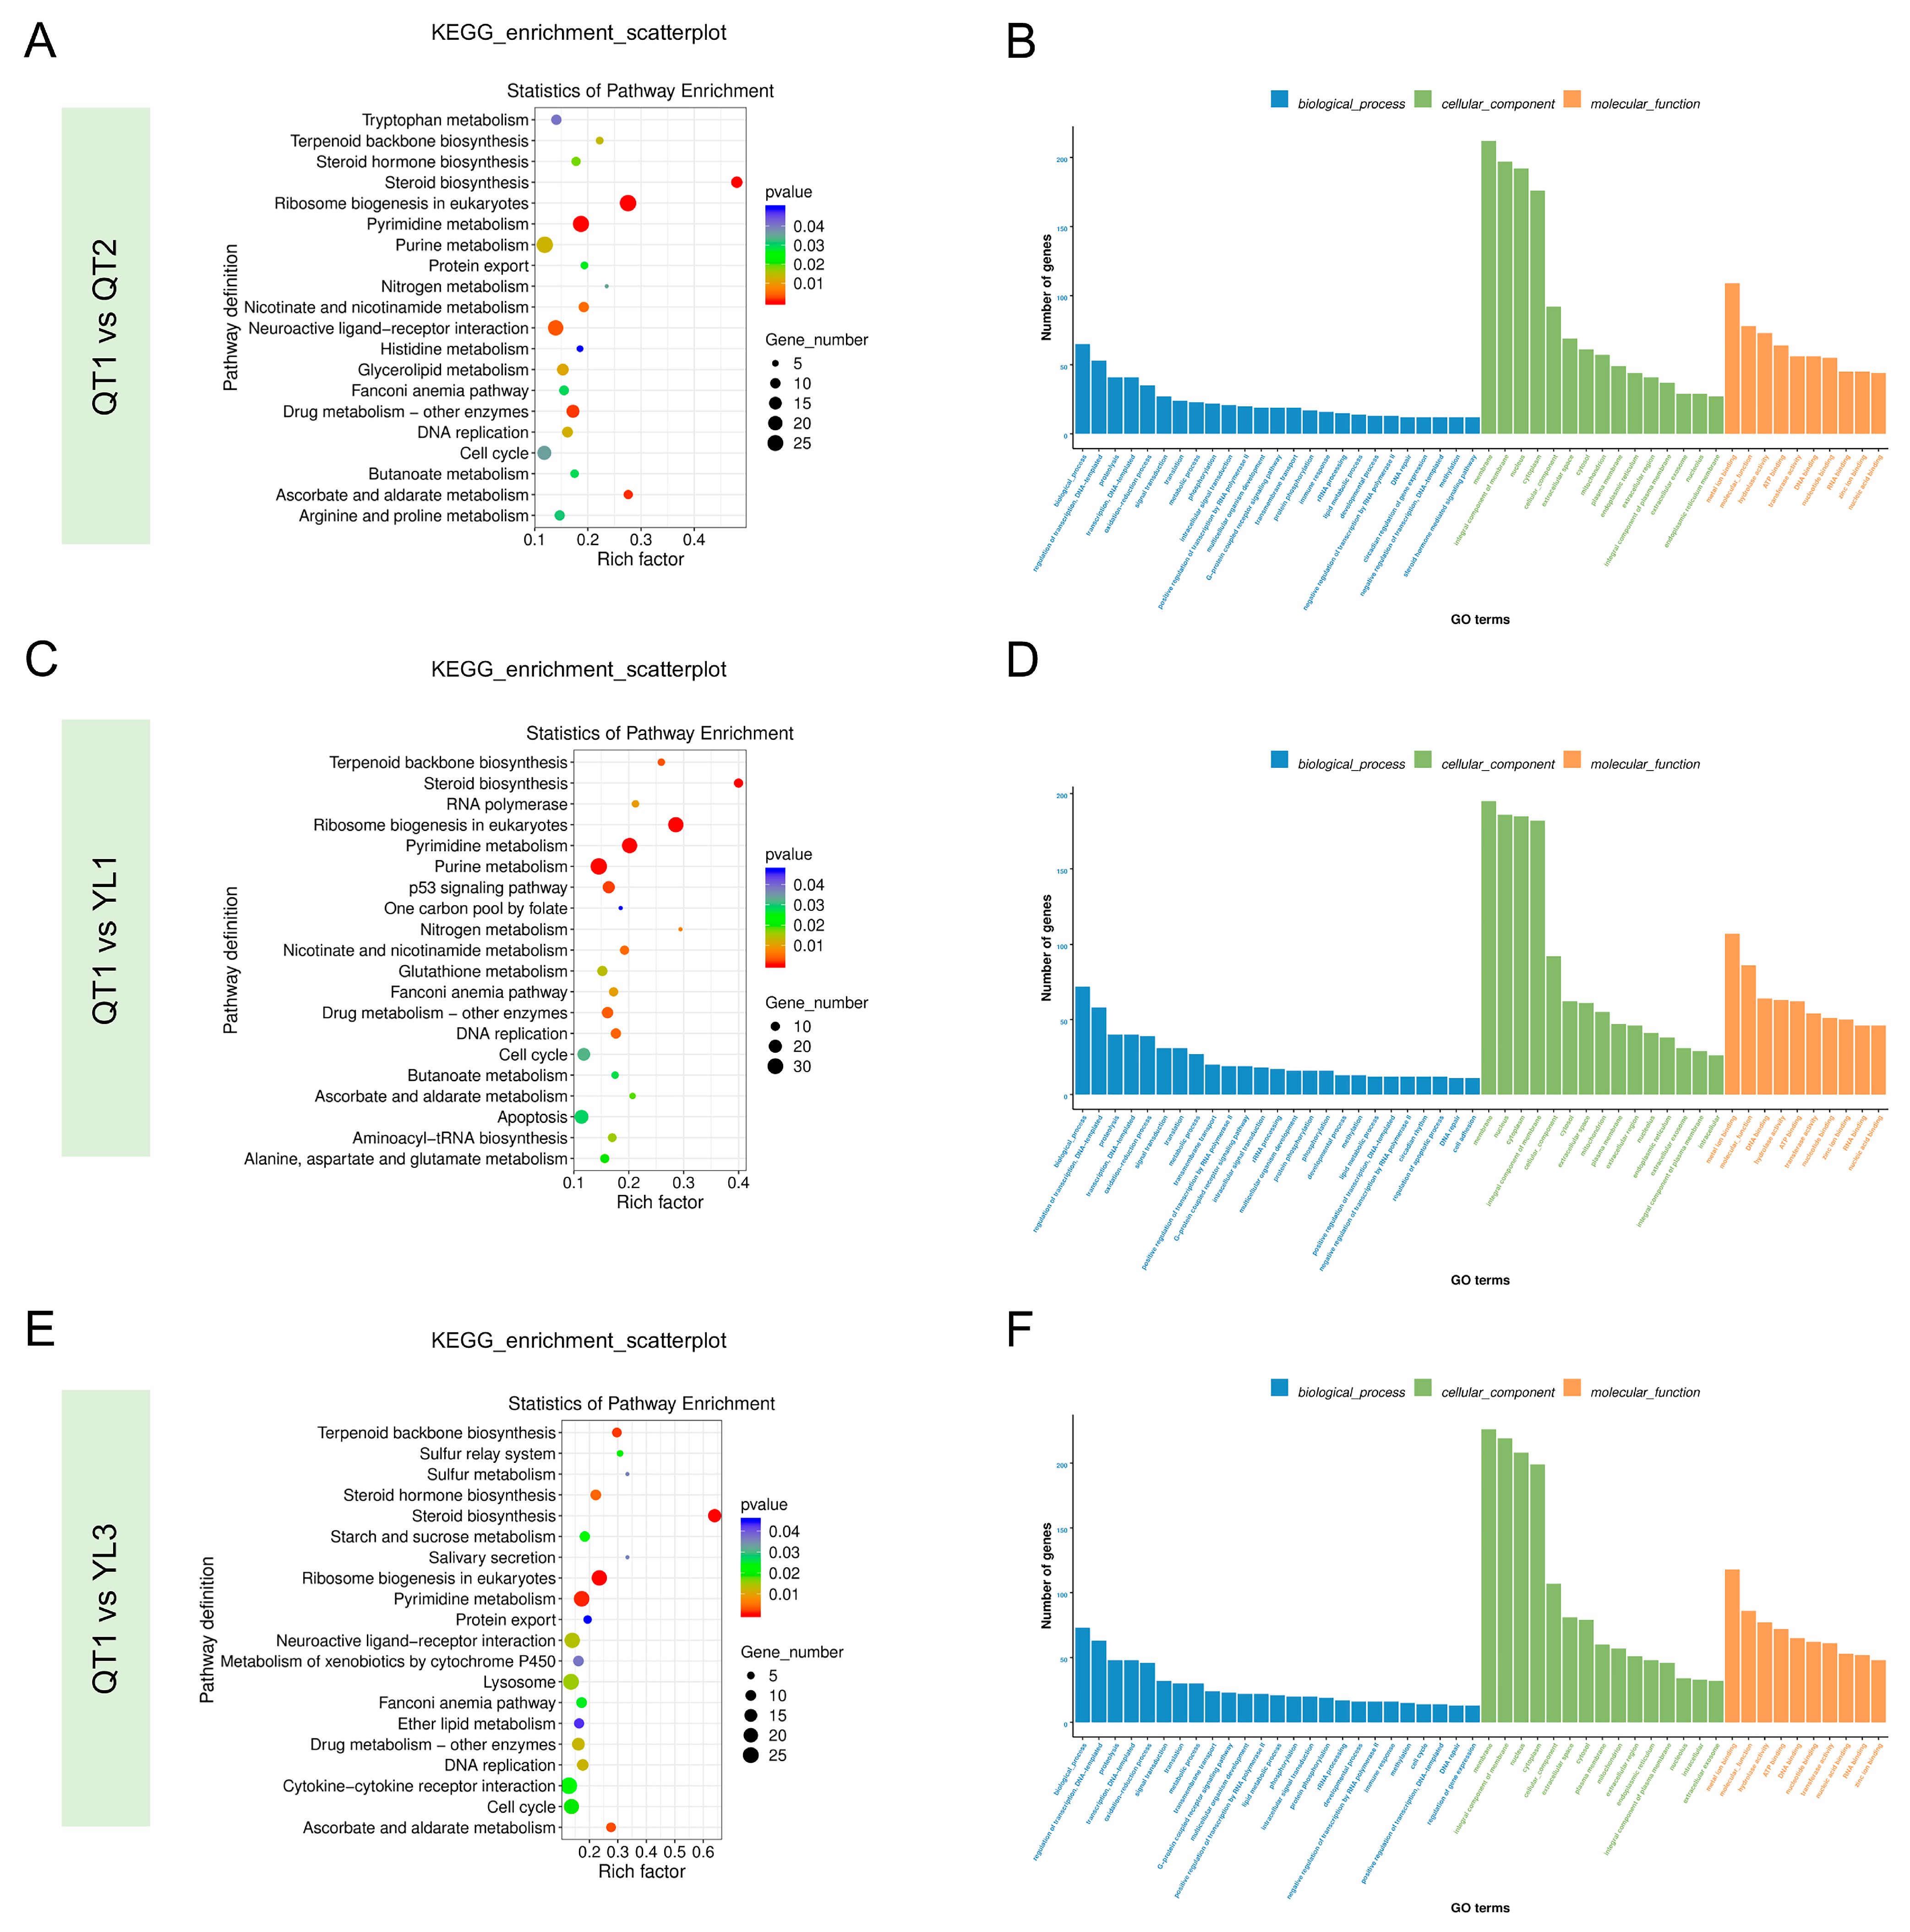
3.4. Functional Annotation of Unigenes

Once the Unigenes were obtained, functional annotation was performed against two public databases: for the GO database, 16,122 genes, accounting for 37.91% of the genes, were annotated, while in the case of the KEGG database, 15,365 genes, representing 36.13%, were functionally annotated. The KEGG enrichment analysis further showed that 17,102 differentially expressed transcripts were enriched into 244 KEGG pathways, of which 30 were significant. The top 20 most significantly enriched pathways are presented in a scatterplot, and they included tryptophan metabolism, steroid biosynthesis and pyrimidine metabolism (Figure 2A,C,E). Interestingly, steroid biosynthesis was identified as the most enriched pathway in all four strains of the fish.
Gene Ontology (GO) is a comprehensive database that describes gene functions by assigning DEGs to three GO domains and a total of 50 GO terms, of which 25 are part of biological processes, 15 are part of cellular components and 10 are part of molecular functions. In this study, genes related to the regulation of transcription and biological processes were enriched within the biological process. Similarly, within the cell composition domain, genes related to membrane (integral component of membrane), nucleus and cytoplasm were enriched. Finally, there was enrichment of the genes that were related to binding sites (e.g., metal ions, ATP, nucleotides) and active enzymes (e.g., transferase and hydrolase) (Figure 2B,D,F).

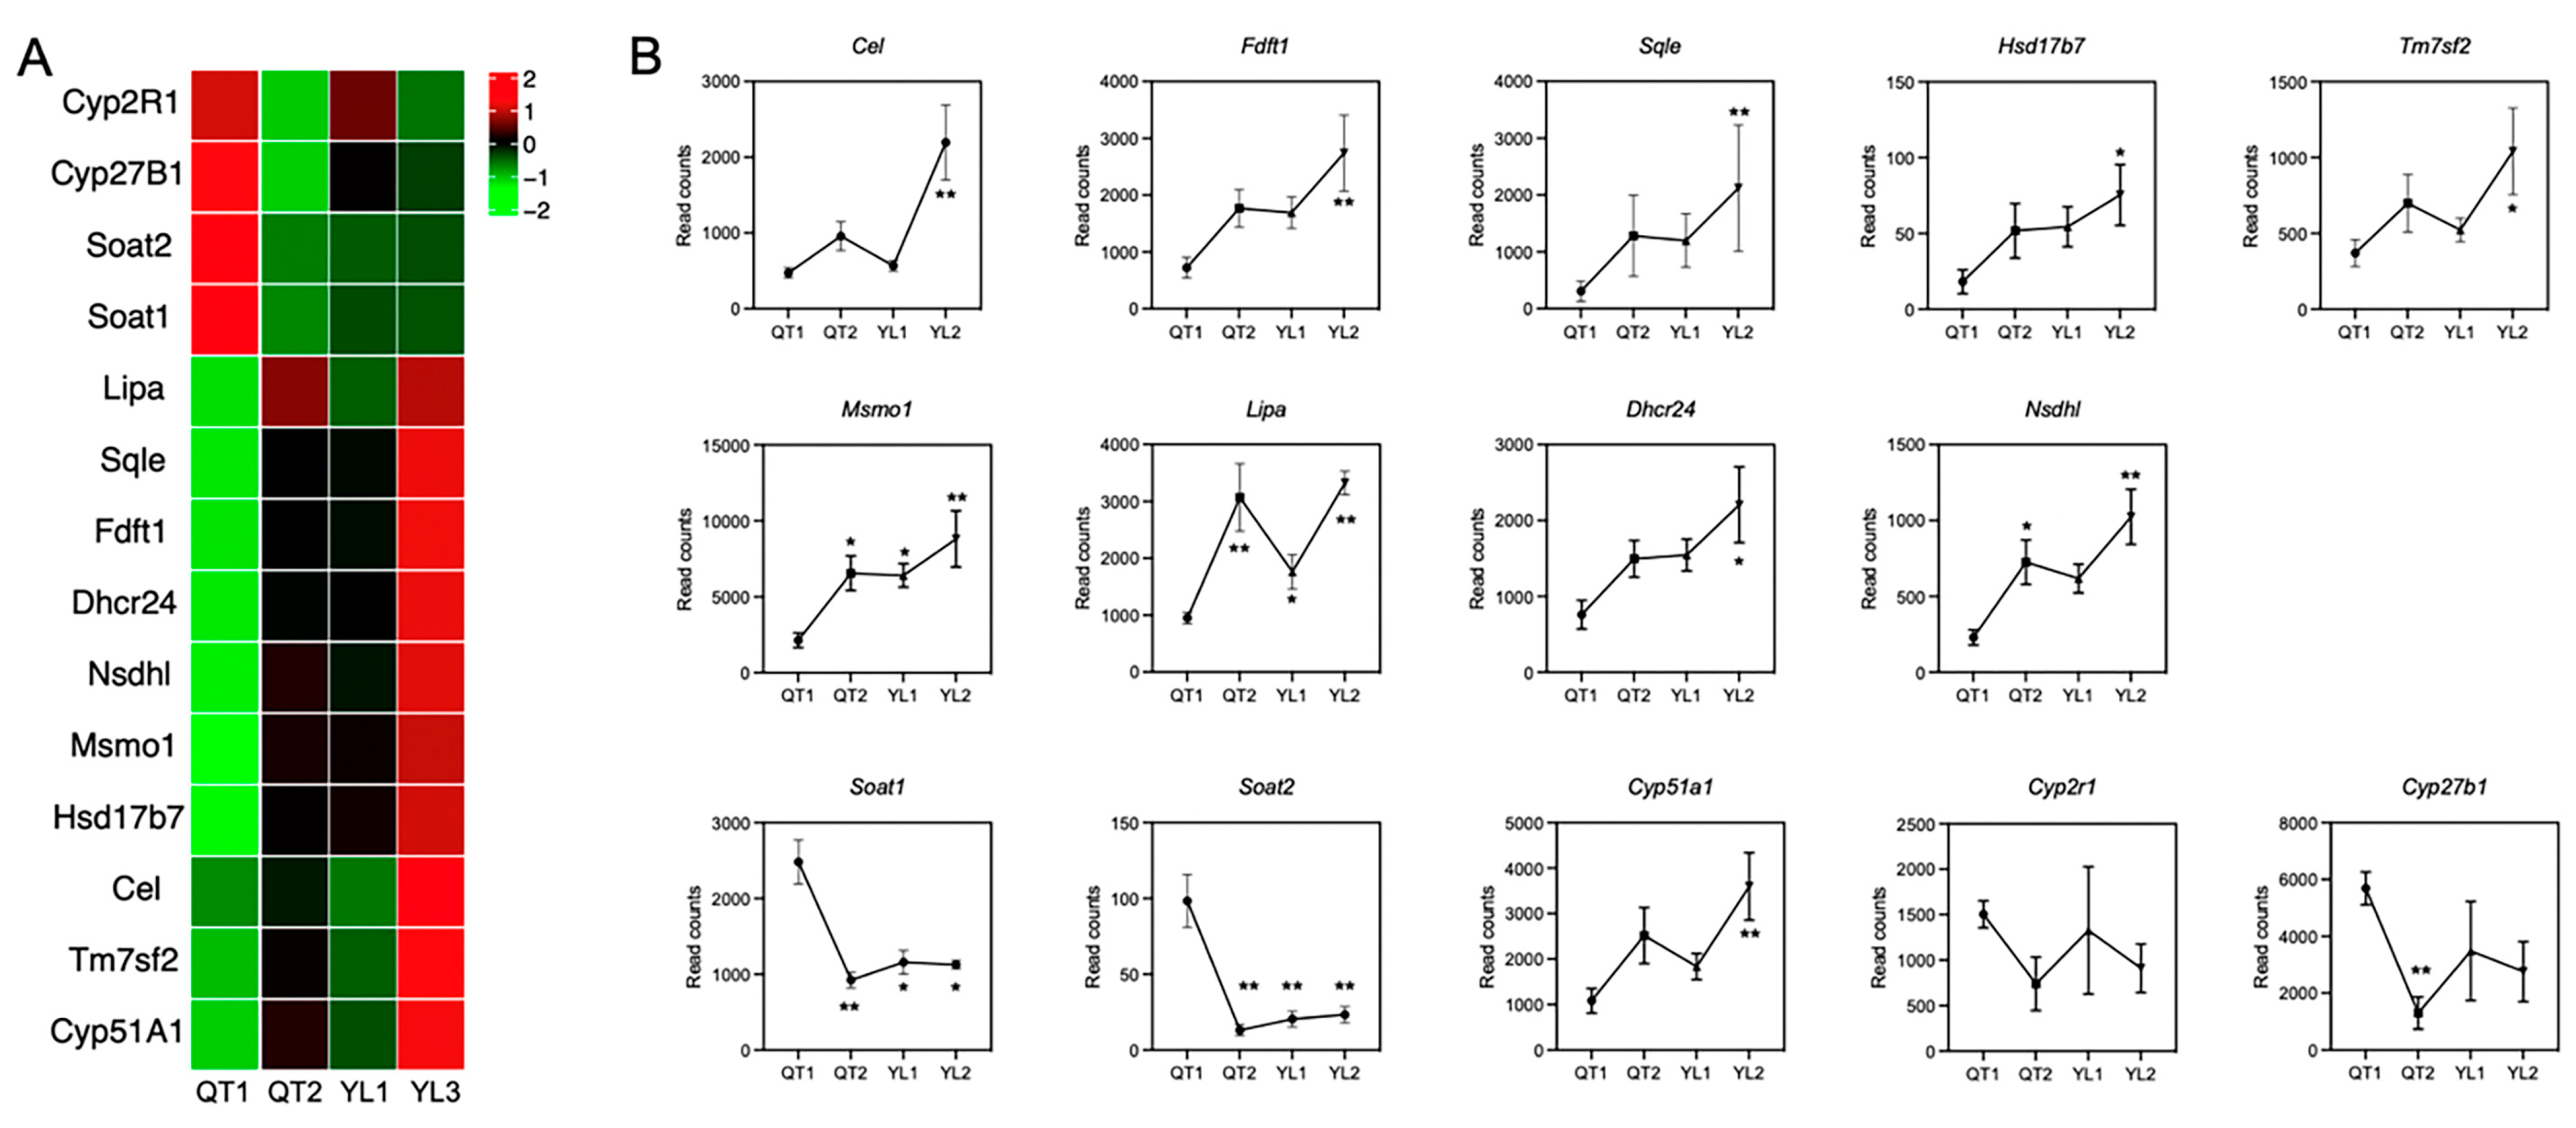
3.5. Expression Level of Genes Involved in Liver Steroid Biosynthesis

From the results of functional annotation, 14 genes associated with liver steroid biosynthesis were selected to explore their expression profiles. Compared with QT1, the other strains QT2, YL1 and YL3 had 10 up-regulated genes and four down-regulated ones (Figure 3A). More specifically, the expression of Cytochrome P450 family 2R1 (Cyp2r1), Cyp27b1, sterol O-acyltransferase 1 (Soat1) and Soat2 was higher in QT1 compared with QT2, YL1 and YL3. At the same time, the expression involved in steroid biosynthesis, namely, NAD(P) dependent steroid dehydrogenase-like (Nsdhl), cholesterol lipase (Cel), methylsterol monooxygenase 1 (Msmo1), arnesyl-diphosphate famesyltransferase 1 (Fdft1), squalene epoxidase (Sqle), hydroxysteroid (17beta) dehydrogenase 7 (Hsd17b7), Cyp51a1, transmembrane 7 Superfamily Member 2 (Tm7sf2), Lipase (Lipa) and 24-Dehydrocholesterol Reductase (Dhcr24), was higher in QT2, YL1 and YL3.

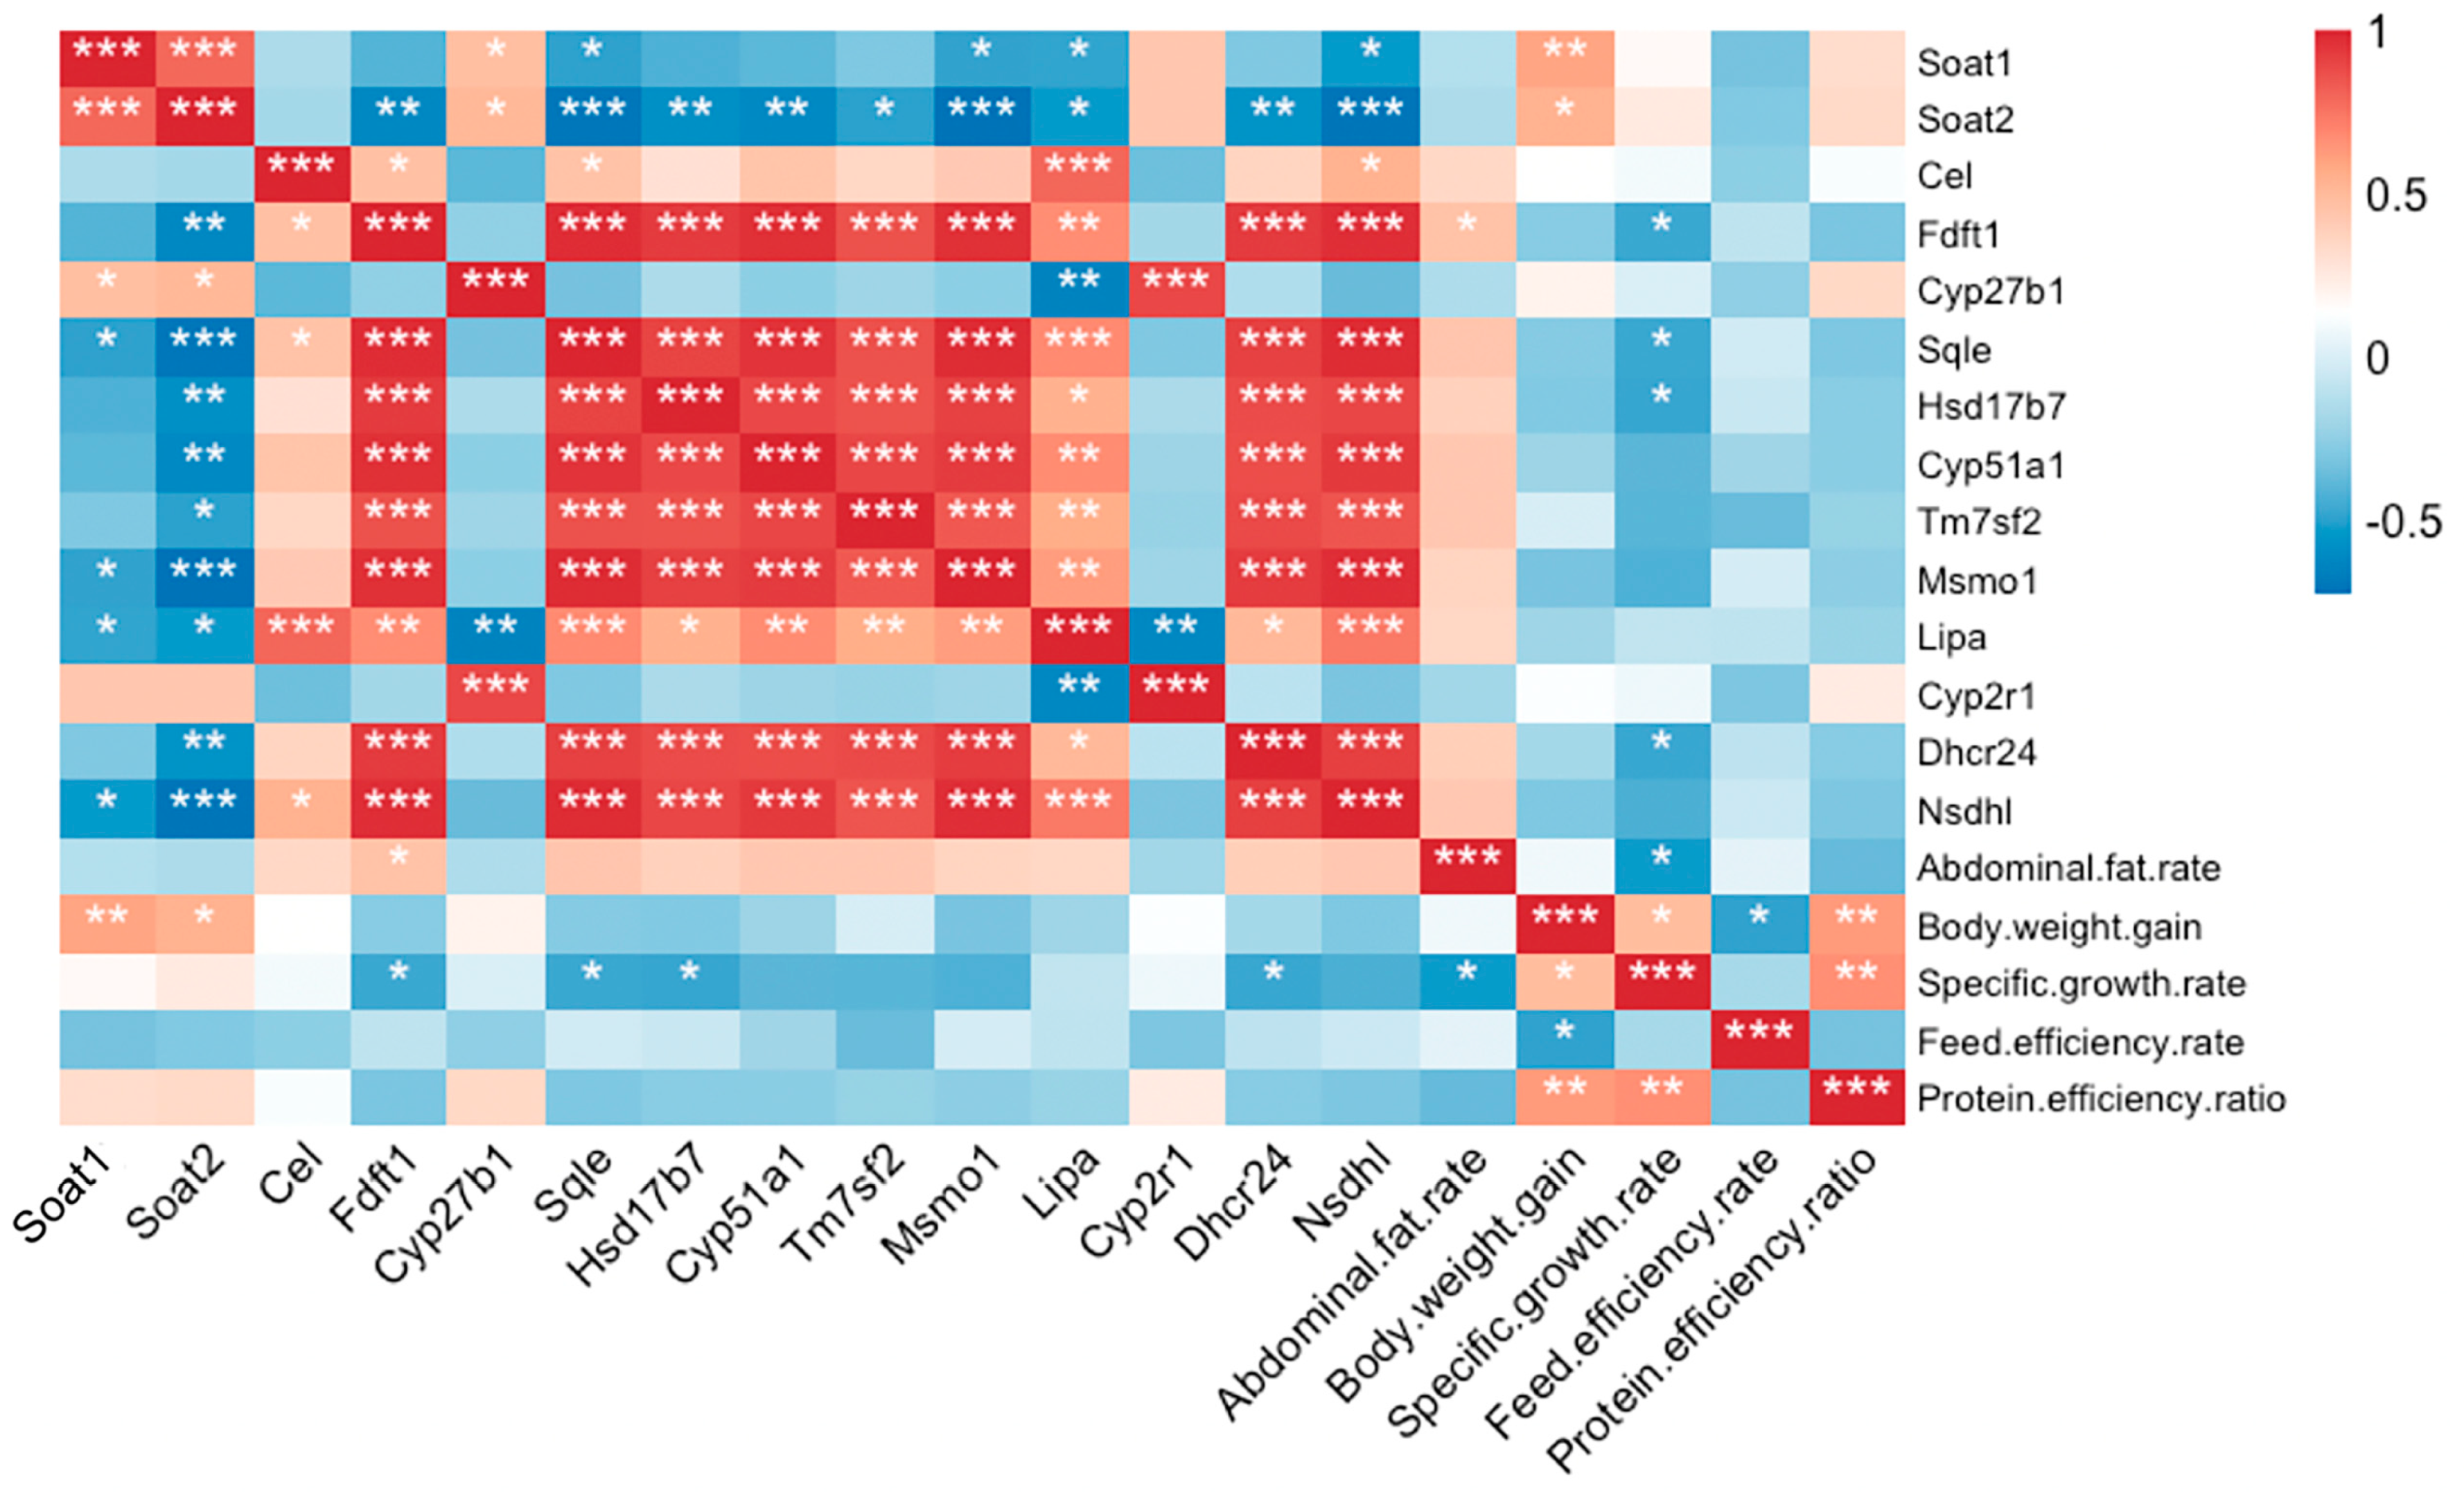
3.6. Correlation Analysis

To further understand the relationship between these genes and growth performance in the four fish strains, a correlation analysis, based on Pearson’s correlation modeling, was performed. The focus was especially on growth performance indicators that were significantly different between QT1 and the other three strains, namely, protein efficiency ratio, feed efficiency rate, specific growth rate, body weight gain and abdominal fat rate. The results indicated that the higher level of abdominal fat rate in QT1 was related to the expression of the Fdft1 gene (Figure 4), while in the case of body weight gain, it was regulated by sterol O-acyltransferase genes Soat1 and Soat2 (Figure 4). In addition, it was found that the mechanisms regulating specific growth rates were also linked to metabolism-related genes, such as Fdft1, Sqle, Hsdd17b7 and Dhcr24 (Figure 4). However, those genes were not significantly correlated with protein efficiency ratio or feed efficiency rate (Figure 4). Nevertheless, it is hypothesized that increasing the expression of Soat1, Soat2 and Cyp27b1 could influence the protein efficiency ratio.

3.7. Co-Expression Network Analysis

From the DEGs that were identified, potential key ones that could regulate largemouth bass performance were further explored by constructing a PPI network. A total of 1242 proteins encoded by DEGs related to growth and liver steroid biosynthesis across all four strains were identified (Figure 5A), with their subsequent mapping against the STRING database yielding a network of 179 nodes and 472 edges. The interaction network revealed significant enrichment of GO terms, with 152 under the biological process domain, 27 in the molecular function domain and 42 in the cellular component domain. Similarly, nine were enriched in KEGG pathways (Figure 5B and Supplementary Table S1). Obviously, a lot of genes related to steroid biosynthesis, such as Akr1d1, Hsd17b7, Msmo1, Sqle, Slc27a2, Hmgcr, Cyp8b1, Cacna1h, Lbr, Pmvk, Nsdhl and Fdft1, were enriched (Figure 5B and Supplementary Table S1). Moreover, a strong interaction was eventually noted between the liver’s steroid biosynthesis and heat shock proteins (HCPs) or genes involved in stress response (i.e., dehydration responsive element binding transcription factor (DREB)) and secondary metabolism (i.e., terpenoid and phenylpropanoid) (Figure 5B).

4. Discussion

It is important to understand the growth performance of different strains of perch which represent a commercially valuable aquatic species. In addition, studies involving the transcriptomic analyses of perch are relatively few, while the molecular mechanisms regulating differences in growth performance between strains are yet to be fully understood. In order to further promote and assist the development of future breeding programs, liver tissues from four largemouth bass strains (QT1, QT2, YL1 and YL3) were studied. Illumina high-throughput sequencing technology was used for transcriptome sequencing, while the molecular genetic information was obtained through data assembly, comparison of tissue expression and annotation of differentially expressed gene. The transcriptomes and differentially expressed genes were then analyzed, and their functions were explored. It is expected that this work will provide basic data for the protection of germplasm resources while providing insight that will assist in the selection and promotion of new strains.
The functional annotation of unigenes indicated that 30 KEGG pathways were significant, including tryptophan metabolism, steroid biosynthesis and pyrimidine metabolism. Tryptophan, an essential amino acid found in all animals, serves as a necessary precursor for the production of several vital bioactive substances. In mammals, the majority of tryptophan undergoes catabolism and is transformed through the kynurenic pathway into bioactive compounds that have the potential to interact with stress responses [24]. Additionally, research has demonstrated that infections, stress and alterations in the gut microbiome can divert tryptophan metabolism away from 5-hydroxytryptamine production, favoring this pathway [25]. Despite these findings, the mechanisms connecting tryptophan metabolism to fish liver health remain not fully elucidated.
Nucleotides play a vital role in various biological processes, including promoting growth [26], enhancing immunity [27] and regulating fatty acid composition in animals [28]. Previous studies have demonstrated that nucleotide supplementation can influence amino acid and fatty acid metabolism in sow-piglet and fish models [29]. Additionally, uridine also plays a crucial role in regulating amino acids, fatty acids and bile acid metabolism, contributing to the maintenance of energy homeostasis [30]. Furthermore, it can produce pyrimidine–lipid and pyrimidine–sugar conjugates, serving as substrates for glycogen deposition [31]. However, there is no report about the impact of adding nucleotides to the fish’s diet on the development of neonatal fish.
Of note, some DEGs, such as Cel, Fdft1, Sqle, Hsd17b7, Cyp51a1, Tm7sf2, Msmo1, Lipa, Dhcr24 and Nsdhl, involved in the liver’s steroid biosynthesis were related to GO terms and KEGG pathways, hence suggesting their correlation with required growth performance indicators. For aquatic species, the liver’s steroid biosynthesis is an important trait to measure economic benefit. In this context, the Fdft1 gene is a key factor in steroid biosynthesis [32], as variations in its expression have been reported to be linked with both fat and meat traits [33,34]. This is in accordance with the current results which observed high expression levels of the genes Dhcr24, Fdft1 and Sqle that are involved in the steroid biosynthesis pathway. In vertebrates, metabolic pathways associated with liver steroid biosynthesis are important for fatty acid biosynthesis. In this study, Sqle, Hsd17b7, Cyp51a1 and Tm7sf2 were up-regulated in QT1, and this could explain its better performance in terms of steroid biosynthesis.
The PPI network analysis is a valuable tool for constructing gene interaction networks [35]. In this study, a strong interaction was noted between the liver’s steroid biosynthesis and genes related to stress response. The latter is a key factor that regulates growth [36] and development [37], which eventually influence the production of aquatic products. DREB and HSP proteins had the highest value within the network. As important transcription factors, DREB proteins help to regulate genes in response to different environmental stimuli [38]. In this study, few genes related to DREB were found to be up-regulated, and this included insulin-like growth factor binding proteins (IGFBPs) that are secreted by the liver to increase or decrease the activity of IGF depending on the physiological conditions. Thus, regulating the IGF system could be associated with growth control [39]. IGFBP levels were significantly different for QT1 compared with the other three groups, and this could help QT1 to achieve better growth performance.

5. Conclusions

This work used liver transcriptome profiling to compare the gene expression profiles of liver tissues from four different strains of local largemouth bass in order to identify candidate genes that were related to growth performance. Genes and pathways that were differentially expressed between the strains were identified and included a number of potential genes, such as Cel, Fdft1, Sqle, Hsd17b7, Cyp51a1, Tm7sf2, Msmo1, Lipa, Dhcr24 and Nsdhl, that are associated with growth traits. These findings provide new clues about the molecular basis of largemouth bass growth. This study generated large amounts of transcriptomic data and provided a molecular basis for understanding the growth traits of different strains of largemouth bass. In addition, understanding the molecular mechanisms and regulatory pathways can provide insights that may strongly contribute to future breeding and cultivation programs.

Supplementary Materials

The following are available online at https://www.mdpi.com/article/10.3390/fishes8110558/s1, Table S1. GO enrichment analysis statistical table.

Author Contributions

F.Z.: Conceptualization, Methodology, Resources, Writing—Review and Editing. X.Z.: Writing—Original Draft. G.Y.: Methodology, Formal Analysis, Investigation, Resources. X.C.: Validation, Writing—Review and Editing. M.Q., Q.Z., N.Z. and Q.M.: Project Administration, Resources, Funding Acquisition, Review and Editing. Y.Z.: Conceptualization, Formal Analysis, Investigation, Writing—Review and Editing. X.D.: Conceptualization, Formal Analysis, Investigation, Resources, Writing—Original Draft, Writing—Review and Editing. All authors have read and agreed to the published version of the manuscript.

Funding

This research was funded by the Key Scientific and Technological Grant of Zhejiang for Breeding New Agricultural (Aquaculture) Varieties (2021C02069-2), the China Agriculture Research System (CARS-46) and the Zhejiang Province Science and Technology Projects (2019C02060).

Institutional Review Board Statement

The studies were carried out in strict accordance with the Regulations of the Administration of Affairs Concerning Experimental Animals under protocol license number SYXK(MIN)2007-0004 and approved by the Institutional Animal Care and Use Committee of Fujian Province. All of the surgery was performed under Tricaine-S anesthesia, and all efforts were made to minimize suffering.

Data Availability Statement

Data will be made available on request.

Acknowledgments

We are thankful to Xin Zong of Zhejiang University for his help in analyzing the data and guiding the writing of the manuscript.

Conflicts of Interest

The authors declare no conflict of interest.

References

  1. Marijani, E. Prevalence and Antimicrobial Resistance of Bacteria Isolated from Marine and Freshwater Fish in Tanzania. Int. J. Microbiol. 2022, 2022, 4652326. [Google Scholar] [CrossRef]
  2. Zou, J.H.; Hu, P.; Wang, M.Y.; Chen, Z.W.; Wang, H.; Guo, X.L.; Gao, J.; Wang, Q.C. Liver Injury and Metabolic Dysregulation in Largemouth Bass (Micropterus salmoides) after Ammonia Exposure. Metabolites 2023, 13, 274. [Google Scholar] [CrossRef]
  3. Lutz-Carrillo, D.J.; Nice, C.C.; Bonner, T.H.; Forstner, M.R.J.; Fries, L.T. Admixture analysis of Florida largemouth bass and northern largemouth bass using microsatellite loci. Trans. Am. Fish. Soc. 2006, 135, 779–791. [Google Scholar] [CrossRef]
  4. Chen, Y.J.; Yuan, R.M.; Liu, Y.J.; Yang, H.J.; Liang, G.Y.; Tian, L.X. Dietary vitamin C requirement and its effects on tissue antioxidant capacity of juvenile largemouth bass, Micropterus salmoides. Aquaculture 2015, 435, 431–436. [Google Scholar] [CrossRef]
  5. Hou, H.C.; Ren, A.Q.; Yu, L.X.B.; Ma, Z.; Zhang, Y.; Liu, Y. An Environmental Impact Assessment of Largemouth Bass (Micropterus salmoides) Aquaculture in Hangzhou, China. Sustainability 2023, 15, 12368. [Google Scholar] [CrossRef]
  6. Guo, Y.H.; Bai, J.J.; Chang, O.Q.; Lao, H.H.; Ye, X.; Luo, J.R. Molecular structure of the largemouth bass (Micropterus salmoides) Myf5 gene and its effect on skeletal muscle growth. Mol. Biol. Rep. 2009, 36, 1497–1504. [Google Scholar] [CrossRef]
  7. Bai, J.J.; Lutz-Carrillo, D.J.; Quan, Y.C.; Liang, S.X. Taxonomic status and genetic diversity of cultured largemouth bass Micropterus salmoides in China. Aquaculture 2008, 278, 27–30. [Google Scholar] [CrossRef]
  8. Wang, D.; Yao, H.; Li, Y.H.; Xu, Y.J.; Ma, X.F.; Wang, H.P. Global diversity and genetic landscape of natural populations and hatchery stocks of largemouth bass across American and Asian regions. Sci. Rep. 2019, 9, 16697. [Google Scholar] [CrossRef]
  9. Zhu, L.Y.; Zong, X.; Xiao, X.; Cheng, Y.Z.; Fu, J.; Lu, Z.Q.; Jin, M.L.; Wang, F.Q.; Wang, Y.Z. Multi-Omics Analysis of the Gut-Liver Axis Reveals the Mechanism of Liver Injury in Colitis Mice. Front. Immunol. 2022, 12, 773070. [Google Scholar] [CrossRef]
  10. Aung, T.N.; Qu, Z.P.; Kortschak, R.D.; Adelson, D.L. Understanding the Effectiveness of Natural Compound Mixtures in Cancer through Their Molecular Mode of Action. Int. J. Mol. Sci. 2017, 18, 656. [Google Scholar] [CrossRef]
  11. Guan, C.; Cen, H.F.; Cui, X.; Tian, D.Y.; Tadesse, D.; Zhang, Y.W. Proline improves switchgrass growth and development by reduced lignin biosynthesis. Sci. Rep. 2019, 9, 20117. [Google Scholar] [CrossRef]
  12. Gonçalves, M.F.M.; Nunes, R.B.; Tilleman, L.; Van de Peer, Y.; Deforce, D.; Van Nieuwerburgh, F.; Esteves, A.C.; Alves, A. Dual RNA Sequencing of during Infection Unveils Host-Pathogen Interactions. Int. J. Mol. Sci. 2019, 20, 6083. [Google Scholar] [CrossRef] [PubMed]
  13. Taylor, R.S.; Ruiz Daniels, R.; Dobie, R.; Naseer, S.; Clark, T.C.; Henderson, N.C.; Boudinot, P.; Martin, S.A.M.; Macqueen, D.J. Single cell transcriptomics of Atlantic salmon (Salmo salar L.) liver reveals cellular heterogeneity and immunological responses to challenge by Aeromonas salmonicida. Front. Immunol. 2022, 13, 984799. [Google Scholar] [CrossRef] [PubMed]
  14. Harvey, T.N.; Sandve, S.R.; Jin, Y.; Vik, J.O.; Torgersen, J.S. Liver slice culture as a model for lipid metabolism in fish. PeerJ 2019, 7, e7732. [Google Scholar] [CrossRef] [PubMed]
  15. Song, X.; Marandel, L.; Skiba-Cassy, S.; Corraze, G.; Dupont-Nivet, M.; Quillet, E.; Geurden, I.; Panserat, S. Regulation by Dietary Carbohydrates of Intermediary Metabolism in Liver and Muscle of Two Isogenic Lines of Rainbow Trout. Front. Physiol. 2018, 9, 1579. [Google Scholar] [CrossRef]
  16. Cox, A.G.; Goessling, W. The lure of zebrafish in liver research: Regulation of hepatic growth in development and regeneration. Curr. Opin. Genet. Dev. 2015, 32, 153–161. [Google Scholar] [CrossRef]
  17. Cao, Q.Q.; Shan, H.Y.; Zhao, J.; Deng, J.H.; Xu, M.; Kang, H.; Li, T.; Zhao, Y.; Liu, H.F.; Jiang, J. Liver fibrosis in fish research: From an immunological perspective. Fish Shellfish Immunol. 2023, 139, 108885. [Google Scholar] [CrossRef]
  18. Zong, X.; Cheng, Y.Z.; Xiao, X.; Fu, J.; Wang, F.Q.; Lu, Z.Q.; Wang, Y.Z.; Jin, M.L. Protective effects of sulfated polysaccharide from Enterobacter cloacae Z0206 against DSS-induced intestinal injury via DNA methylation. Int. J. Biol. Macromol. 2021, 183, 861–869. [Google Scholar] [CrossRef]
  19. Zhang, Y.; Chen, Z.; Tao, Y.; Wu, W.; Zeng, Y.; Liao, K.; Li, X.; Chen, L. Transcriptomic and Physiological Responses of Chlorella pyrenoidosa during Exposure to 17alpha-Ethinylestradiol. Int. J. Mol. Sci. 2022, 23, 3583. [Google Scholar] [CrossRef]
  20. Moreno-Santillan, D.D.; Machain-Williams, C.; Hernandez-Montes, G.; Ortega, J. De Novo Transcriptome Assembly and Functional Annotation in Five Species of Bats. Sci. Rep. 2019, 9, 6222. [Google Scholar] [CrossRef]
  21. Kanehisa, M.; Goto, S. KEGG: Kyoto Encyclopedia of Genes and Genomes. Nucleic Acids Res. 2000, 28, 27–30. [Google Scholar] [CrossRef]
  22. Szklarczyk, D.; Kirsch, R.; Koutrouli, M.; Nastou, K.; Mehryary, F.; Hachilif, R.; Gable, A.L.; Fang, T.; Doncheva, N.T.; Pyysalo, S.; et al. The STRING database in 2023: Protein-protein association networks and functional enrichment analyses for any sequenced genome of interest. Nucleic Acids Res. 2023, 51, D638–D646. [Google Scholar] [CrossRef]
  23. Dangaj, D.; Bruand, M.; Grimm, A.J.; Ronet, C.; Barras, D.; Duttagupta, P.A.; Lanitis, E.; Duraiswamy, J.; Tanyi, J.L.; Benencia, F.; et al. Cooperation between Constitutive and Inducible Chemokines Enables T Cell Engraftment and Immune Attack in Solid Tumors. Cancer Cell 2019, 35, 885–900.e10. [Google Scholar] [CrossRef]
  24. Le Floc’h, N.; Otten, W.; Merlot, E. Tryptophan metabolism, from nutrition to potential therapeutic applications. Amino Acids 2011, 41, 1195–1205. [Google Scholar] [CrossRef]
  25. O’Mahony, S.M.; Clarke, G.; Borre, Y.E.; Dinan, T.G.; Cryan, J.F. Serotonin, tryptophan metabolism and the brain-gut-microbiome axis. Behav. Brain Res. 2015, 277, 32–48. [Google Scholar] [CrossRef] [PubMed]
  26. Gao, L.M.; Liu, G.Y.; Wang, H.L.; Wassie, T.; Wu, X. Maternal pyrimidine nucleoside supplementation regulates fatty acid, amino acid and glucose metabolism of neonatal piglets. Anim. Nutr. 2022, 11, 309–321. [Google Scholar] [CrossRef]
  27. Waititu, S.M.; Yin, F.; Patterson, R.; Yitbarek, A.; Rodriguez-Lecompte, J.C.; Nyachoti, C.M. Dietary supplementation with a nucleotide-rich yeast extract modulates gut immune response and microflora in weaned pigs in response to a sanitary challenge. Animal 2017, 11, 2156–2164. [Google Scholar] [CrossRef]
  28. Liu, G.; Liu, H.; Tian, W.; Liu, C.; Yang, H.; Wang, H.; Gao, L.; Huang, Y. Dietary nucleotides influences intestinal barrier function, immune responses and microbiota in 3-day-old weaned piglets. Int. Immunopharmacol. 2023, 117, 109888. [Google Scholar] [CrossRef]
  29. Gao, L.M.; Liu, Y.L.; Zhou, X.; Zhang, Y.; Wu, X.; Yin, Y.L. Maternal supplementation with uridine influences fatty acid and amino acid constituents of offspring in a sow-piglet model. Br. J. Nutr. 2021, 125, 743–756. [Google Scholar] [CrossRef] [PubMed]
  30. Zhang, Y.; Guo, S.; Xie, C.; Wang, R.; Zhang, Y.; Zhou, X.; Wu, X. Short-Term Oral UMP/UR Administration Regulates Lipid Metabolism in Early-Weaned Piglets. Animals 2019, 9, 610. [Google Scholar] [CrossRef] [PubMed]
  31. Yamamoto, T.; Koyama, H.; Kurajoh, M.; Shoji, T.; Tsutsumi, Z.; Moriwaki, Y. Biochemistry of uridine in plasma. Clin. Chim. Acta 2011, 412, 1712–1724. [Google Scholar] [CrossRef]
  32. Hayes, M.G.; Urbanek, M.; Ehrmann, D.A.; Armstrong, L.L.; Lee, J.Y.; Sisk, R.; Karaderi, T.; Barber, T.M.; McCarthy, M.I.; Franks, S.; et al. Genome-wide association of polycystic ovary syndrome implicates alterations in gonadotropin secretion in European ancestry populations. Nat. Commun. 2015, 6, 7502. [Google Scholar] [CrossRef]
  33. Sherwood, W.B.; Kothalawala, D.M.; Kadalayil, L.; Ewart, S.; Zhang, H.M.; Karmaus, W.; Arshad, S.H.; Holloway, J.W.; Rezwan, F.I. Epigenome-Wide Association Study Reveals Duration of Breastfeeding Is Associated with Epigenetic Differences in Children. Int. J. Environ. Res. Public Health 2020, 17, 3569. [Google Scholar] [CrossRef] [PubMed]
  34. Chen, B.; Li, P.S.; Li, J.; Chen, J.P. Putative Genes and Pathways Involved in the Acne Treatment of Isotretinoin via Microarray Data Analyses. BioMed Res. Int. 2020, 2020, 5842795. [Google Scholar] [CrossRef] [PubMed]
  35. Chen, Y.F.; Xia, Y. Convergent perturbation of the human domain-resolved interactome by viruses and mutations inducing similar disease phenotypes. PLoS Comput. Biol. 2019, 15, e1006762. [Google Scholar] [CrossRef]
  36. Tsai, C.Y.; Tsai, C.Y.; Arnold, S.J.; Huang, G.J. Ablation of hippocampal neurogenesis in mice impairs the response to stress during the dark cycle. Nat. Commun. 2015, 6, 8373. [Google Scholar] [CrossRef] [PubMed]
  37. Li, Y.X.; Feng, X.P.; Wang, H.L.; Meng, C.H.; Zhang, J.; Qian, Y.; Zhong, J.F.; Cao, S.X. Transcriptome analysis reveals corresponding genes and key pathways involved in heat stress in Hu sheep. Cell Stress Chaperon. 2019, 24, 1045–1054. [Google Scholar] [CrossRef]
  38. Chen, L.H.; Han, J.P.; Deng, X.M.; Tan, S.L.; Li, L.L.; Li, L.; Zhou, J.F.; Peng, H.; Yang, G.X.; He, G.Y.; et al. Expansion and stress responses of AP2/EREBP superfamily in Brachypodium distachyon. Sci. Rep. 2016, 6, 21623. [Google Scholar] [CrossRef]
  39. Castillo-Castrejon, M.; Yang, I.V.; Davidson, E.J.; Borengasser, S.J.; Jambal, P.; Westcott, J.; Kemp, J.F.; Garces, A.; Ali, S.A.; Saleem, S.; et al. Preconceptional Lipid-Based Nutrient Supplementation in 2 Low-Resource Countries Results in Distinctly Different IGF-1/mTOR Placental Responses. J. Nutr. 2021, 151, 556–569. [Google Scholar] [CrossRef]
Figure 1. Analysis of the differentially expressed genes (DEGs) between different strains of largemouth bass. (A) Principal component analysis (PCA); (B) Venn diagram showing the overlap of DEGs between the four strains; (C) Statistical analysis of the number of differentially expressed genes; (DF) Volcano plots of DEGs between QT1 and the other groups. n = 5.
Fishes 08 00558 g001
Figure 2. (A,C,E) Annotation of differentially expressed genes (DEGs) of the four fish strains through KEGG enrichment analysis. The size of the dots in the figure indicates the number of genes in each pathway, while their colors reflect the different ranges of p value. (B,D,F) Enriched gene ontology (GO) terms based on DEGs identified in the liver samples of the four fish strains.
Fishes 08 00558 g002
Figure 3. (A) Heatmap of DEGs involved in steroid biosynthesis. (B) Expression of genes related to steroid biosynthesis. Datasets show mean ± SEM. One-way ANOVA and Tukey’s post hoc test. * p < 0.05 and ** p < 0.01.
Fishes 08 00558 g003
Figure 4. Correlation analysis for the expression of genes related to steroid biosynthesis and significantly different growth performance indicators. False-discovery-rate corrections for multiple analyses were employed. * p < 0.05, ** p < 0.01 and *** p < 0.001.
Fishes 08 00558 g004
Figure 5. (A) Venn diagram representing DEGs. (B) Network of protein–protein interactions between QT1 and the three other strains. The colored nodes represent query proteins and the first shell of interactors, whereas white nodes represent the second shell of interactors. Image generated by String v11.0 (STRING: https://string-db.org, accessed on 15 July 2023).
Fishes 08 00558 g005
Table 1. Growth performance of the four strains of largemouth bass.
ItemGroup
QT1QT2YL1YL3
Initial body weight, g6.05 ± 0.086.14 ± 0.076.03 ± 0.156.17 ± 0.11
Survival rate 1, %100.00 ± 0.0098.89 ± 1.9298.89 ± 1.92100.00 ± 0.00
Final body length, cm13.67 ± 0.4513.57 ± 0.1513.27 ± 0.3213.30 ± 0.41
Final body weight, g55.58 ± 0.8554.08 ± 1.1553.17 ± 3.0956.01 ± 1.37
Condition factor 2, g/cm 32.29 ± 0.132.32 ± 0.082.28 ± 0.062.37 ± 0.11
XLiver/body ratio 3, %2.04 ± 0.332.05 ± 0.132.03 ± 0.272.15 ± 0.17
Organ/body ratio 4, %9.11 ± 0.569.08 ± 0.329.42 ± 0.509.36 ± 0.38
Abdominal fat rate 5, %2.49 ± 0.19 a2.54 ± 0.07 a2.82 ± 0.19 ab3.01 ± 0.21 b
Body weight gain 6, g828.9 ± 11.0 a792.8 ± 10.3 a788.9 ± 7.9 b819.1 ± 13.2 b
Specific growth rate 7, %/day4.05 ± 0.02 a4.05 ± 0.02 b3.97 ± 0.02 a4.03 ± 0.02 a
Average food intake, g/day0.90 ± 0.010.90 ± 0.020.91 ± 0.030.92 ± 0.01
Feed efficiency rate 80.99 ± 0.03 a1.01 ± 0.02 a1.05 ± 0.02 b1.00 ± 0.01 a
Protein efficiency ratio 92.32 ± 0.10 a2.20 ± 0.03 a2.13 ± 0.06 b2.23 ± 0.03 ab
1 Survival rate = survival number/sample number × 100%; 2 Condition factor = final body weight/final body length × 100%; 3 Liver/body ratio = liver weight/ final body weight × 100%; 4 Organ/body ratio = organ weight/final body weight × 100%; 5 Abdominal fat rate = abdominal fat weight/final body weight × 100%; 6 Body weight gain = (final body weight − initial body weight)/initial body weight × 100%; 7 Specific growth rate = Ln (final  body weight) − Ln (initial  body weight) days elapsed × 100%; 8 Feed efficiency rate = wet weight gain/dry feed intake × 100%; 9 Protein efficiency ratio = body weight gain/protein intake × 100%. Different letters in the shoulder notes indicated significant difference between groups (p < 0.05).
Table 2. Summary of sequences analysis.
Raw ReadsValid ReadsValid%Q20%Q30%GC%
QT141,263,68040,606,56898.4198.2394.2649.51
48,528,91647,838,20698.5898.3494.549.79
43,071,94842,371,89898.3798.1994.1749.41
46,583,92445,965,53098.6798.2994.3848.87
QT240,637,87039,709,51697.7298.2194.0648.44
44,131,56443,591,28098.7898.6195.1149.1
44,273,84243,705,15498.7298.695.1349.16
38,160,52637,616,55898.5798.695.1249.07
YL150,196,11049,594,18498.898.5594.9649.5
48,186,32847,599,10298.7898.5695.0149.3
40,125,83438,890,24496.9298.2594.1949.68
48,112,39047,515,17098.7698.695.1349.68
YL338,414,58037,946,35298.7898.6295.1849.69
36,765,13236,245,69498.5998.594.8249.02
45,187,45244,623,85298.7598.5594.9949.43
49,797,46049,214,32498.8398.695.149.75
Table 3. Results of the assembly process.
IndexAllGC%Median LengthTotal Assembled BasesN50
Transcript89,05645.45901135,827,6432854
Unigene42,52944.9937848,407,9512675
Disclaimer/Publisher’s Note: The statements, opinions and data contained in all publications are solely those of the individual author(s) and contributor(s) and not of MDPI and/or the editor(s). MDPI and/or the editor(s) disclaim responsibility for any injury to people or property resulting from any ideas, methods, instructions or products referred to in the content.

