Abstract
Silurus lanzhouensis is a large endemic fish exclusively found in the middle and upper reaches of China’s Yellow River, with a restricted distribution range and a small population size and is listed as an endangered species. To investigate the potential genetic factors contributing to the observed decrease in the population of S. lanzhouensis, we have successfully assembled the first chromosome-level genome of S. lanzhouensis. This genome comprises a total of 30 chromosomes, with a size of 794.43 Mb, and 23,093 protein-coding genes. Comparative genomics analysis reveals that the genetic relationship between S. lanzhouensis and S. meridionalis Chen is the closest, and their common ancestor experienced two rounds of whole genome duplication (WGD) before diverging. Notably, amino acid metabolism-related pathways are enriched in the unique S. lanzhouensis gene family. In addition, we observed that the chemokine receptor and scavenger receptor gene families contracted in S. lanzhouensis, which may be associated with its diminished immune response. Our research findings provide valuable insights into the endangered mechanism of S. lanzhouensis and enhance our understanding of the evolution of Siluriformes fish.
Key Contribution:
This study constructed the first chromosome-level genome of S. lanzhouensis, providing valuable insights into the endangered mechanism of S. lanzhouensis.
1. Introduction
Silurus lanzhouensis, a species belonging to the order Siluriformes, family Siluridae, and genus Silurus, is an endemic fish found exclusively in the middle and upper reaches of the Yellow River in China [1,2]. Recent studies have indicated a continuous decline in the wild population of S. lanzhouensis, leading to its classification as an endangered (EN) species on the “Red List of China’s Biodiversity” [3,4]. While habitat loss, fragmentation, overexploitation of resources, and water pollution likely contribute to the endangerment of S. lanzhouensis, the population size of Silurus asotus, which occupies a similar ecological niche and shares morphological characteristics, has not been significantly impacted. This suggests that genetic factors other than the environment may influence the survival of S. lanzhouensis.
For many years, researchers considered S. lanzhouensis and S. asotus to be the same species due to their similar morphology and ecological niche. It was not until 1977 that Chen classified S. lanzhouensis as a distinct species of Silurus based on characteristics such as the number of pterygoid teeth and neural arches [1]. Since then, research on S. lanzhouensis has started domestically and internationally, focusing primarily on germplasm characteristics, resource evaluation and conservation, conservation genetics, reproductive biology, gut microbiota, and the analysis and cloning of genes associated with growth traits [5,6,7,8,9,10,11,12,13,14]. Among them, genetic research is important for the targeted protection of precious fish [15]. In a comparative study of the morphological, histological, and serum biochemical indicators of the digestive system, Yang et al. found that S. lanzhouensis exhibited a higher liver cell density compared to S. asotus, while the relative weight of the stomach, liver, and pancreas was found to be significantly lower in S. lanzhouensis [16]. These findings suggest that S. lanzhouensis has weaker digestive capabilities than S. asotus. Additionally, S. lanzhouensis exhibited significantly higher alanine aminotransferase activity in the serum when compared to S. asotus, along with significantly lower serum calcium (Ca) and phosphorus (P) [17]. These observations indicate that S. lanzhouensis has a more carnivorous diet, higher protein, and a stronger synthesis compared to S. asotus. Moreover, the albumin–globulin ratio (A/G) in S. lanzhouensis was significantly lower than that of S. asotus [17]. This suggests that S. lanzhouensis has a weaker liver function and immune system compared to S. asotus [18]. These findings indicate that S. lanzhouensis may exhibit physiological weaknesses and lower adaptability to the environment compared to S. asotus, although further evidence is required to confirm whether these weaknesses are caused by genetic factors.
Genome sequencing and comparative genomics research are powerful tools for uncovering the genetic factors that contribute to differences in environmental adaptability among species. To date, several Siluriformes fishes, including I. punctatus, P. fulvidraco, P. hypophthalmus, and S. meridionalis Chen, have had their genomes sequenced [19,20,21,22]. These sequenced genomes provide an opportunity to compare the genomic differences among closely related species and identify the genetic factors that may determine their differences in environmental adaptability. In this study, we utilized muscle samples obtained from wild S. lanzhouensis captured in the Heyang section of the Yellow River in Shaanxi Province. By utilizing PacBio HiFi (CCS) sequencing and Hi-C technology, we sequenced and assembled a chromosome-level reference genome of S. lanzhouensis. We performed phylogenetic and whole genome duplication (WGD) analyses to identify the S. lanzhouensis phylogenetic position, divergence time, and WGD events. By comparative genomics analysis, we investigated unique gene families, gene family expansions and contractions, and positive selection in S. lanzhouensis, which would provide further insights into its genetic basis.
2. Materials and Methods
2.1. Sequencing and Assembly of S. lanzhouensis Genome
Wild S. lanzhouensis was caught from the Yellow River section of Heyang County, Shaanxi Province, and white muscle samples were collected. Genomic DNA was extracted using the SDS method, and short fragment libraries were prepared for sequencing. The Illumina platform’s short reads were quality-filtered using the fastp software (v0.23.4) [23]. Kmer calculations were performed using the Jellyfish software (v2.1.4), and genome characteristics were analyzed using the Genomescope software (v2.0) [24,25].
We constructed sequencing libraries according to PacBio’s standard protocol. DNA samples were fragmented using g-TUBE, ligated with dumbbell-shaped adapters [26]. The sequencing library was purified using AMPure PB Beads. The library was sequenced using the PacBio Sequel II platform.
The HiFi reads were assembled into a draft genome assembly using Hifiasm [27]. Redundancy was removed using purge dups [28]. Genome assembly completeness and uniformity of sequence coverage were assessed using CEGMA, BUSCO, short-read mapping, and long-read mapping [29,30].
2.2. Hi-C Analysis and Chromosome Construction
Hi-C libraries were constructed and quality-controlled, followed by sequencing on the Illumina platform [31]. Raw Hi-C sequencing data were screened to eliminate adapter sequences and low-quality reads, resulting in clean data. Library quality was assessed by identifying invalid interaction pairs in sequencing results using HiC Pro (v2.10.0) [32]. The Hi-C data were aligned to the genome sequence using Bwa (v0.7.17) [33]. Hi-C-assisted genome assembly was conducted by first performing Hi-C error correction. The contig version of the genome was fragmented into equal-sized 50 kb segments, and Hi-C was used for reassembly. Candidate error regions were regions that could not be recovered from the original sequence. LACHESIS software (v2.0.1) was then used to assemble the error-corrected genome [34].
2.3. Gene Annotation and Functional Assessment
The genome of S. lanzhouensis was annotated using de novo prediction, homology search, and transcript-based prediction. Augustus (v3.1.0) and SNAP (28 July 2006) were employed to generate de novo gene models [35,36]. Homology searches were carried out using GeMoMa (v1.7) software [37]. Hisat (v2.1.0) and Stringtie (v2.1.4) were used to map RNA-sequencing data to the reference genome for transcript-based prediction. GeneMarkS-T (v5.1) was used for gene prediction [38,39,40]. Genes were predicted from unigenes assembled by Trinity (v2.11) using PASA (v2.4.1) [41,42]. The EVM software (v1.1.1) combined the gene models from these different methods and PASA was used to update the models [43]. The predicted gene sequences were subjected to annotation analysis using databases such as NR, eggNOG, GO, KEGG, TrEMBL, KOG, SWISS-PROT, and Pfam [44,45,46,47,48]. Non-coding RNAs include microRNAs, rRNAs, and tRNAs. The tRNAscan-SE (v1.3.1) was employed for the identification of the tRNAs [49]. Barrnap (version 0.9) was applied for the identification of the rRNA-associated genes [50]. Infernal (v1.1) was used against Rfam (v14.5) to identify microRNAs, snoRNAs, and snRNAs [51,52]. We scanned the whole genomes using GenBlastA (v1.0.4) after masking predicted functional genes [53]. Using GeneWise (v2.4.1), we analyzed potential candidates such as frame-shift mutations and premature stop mutations [54].
2.4. Annotation of Repetitive Sequences
The following workflows were used to annotate transposon elements (TEs) and tandem repeats. Firstly, a de novo repeat library of the genome was customized using RepeatModeler2 (v2.0.1) [55]. LTRharvest (v1.5.10) and LTR_finder (v1.07) were applied to identify fl-LTR RTs [56,57]. LTR_retriever was then employed to produce the non-redundant LTR library and the fl-LTR RTs [58]. By using the above de novo TE sequence library in combination with the established Dfam (v3.5) database, a non-redundant species-specific TE library was constructed. Finally, RepeatMasker (v4.12) was used to identify TE sequences from the S. lanzhouensis genome [59]. Tandem repeats were annotated using the TRF 409 and the MISA (v2.1) [60,61].
2.5. Gene Families and Phylogenetic Analysis
Using Orthofinder v2.4 software, the protein sequences of S. lanzhouensis, P. hypophthalmus, S. meridionalis Chen, P. fulvidrac, C. carpio, L. oculatus, I. punctatus, X. maculatus, L. chalumnae, and D. rerio were grouped into gene families and annotated using PANTHER V15. Subsequently, the species-specific gene families were subjected to GO and KEGG enrichment analysis using clusterProfile v3.4.4 [62,63,64].
The IQ-TREE v1.6.11 software was used for phylogenetic tree construction [65]. In particular, sequence alignment of the single-copy gene family was performed using MAFFT v7.205, and the aligned protein sequences were transformed into codon sequences by PAL2NAL v14 [66,67]. Then Gblocks v0.91b was used to remove regions with poor sequence alignment or large differences. Finally, all aligned gene families from each species were concatenated into supergenes [68]. The best model was determined using ModelFinder, a model detection tool provided by MAFFT. The phylogenetic tree was constructed via maximum likelihood [69].
CAFE v4.2 was applied to generate predictions of the expansion and contraction of gene families with respect to their ancestors [70,71]. Gene family expansions and contractions in S. lanzhouensis were extracted and annotation was performed. Finally, GO enrichment analysis was performed using clusterProfiler [64].
2.6. Positive Selection Analysis
From the phylogenetic tree, the five closest species were selected: I. punctatus, P. hypophthalmus, P. fulvidraco, S. lanzhouensis, S. meridionalis Chen. The PAML (v4.9i) package was used to estimate the rate ratio (ω) of non-synonymous (Ka) to synonymous (Ks) nucleotide substitutions [72]. In the likelihood framework, a series of evolutionary models were compared using the species trees. The branch-site model was utilized to determine the mean ω across the tree (ω0), ω of the selected branch under testing (ω2), and ω of all remaining branches (ω1). The positive selection gene of S. lanzhouensis was eventually identified (p < 0.05).
2.7. Whole Genome Duplication
WGD is a process whereby the entire genome undergoes duplication [73]. This process is significant for the origin of species and expansion of the genome. WGD events were calculated using wgd v1.1.1 [74]. Additionally, we plotted the Ks distribution between S. lanzhouensis and P. hypophthalmus, S. meridionalis Chen, P. fulvidrac, C. carpio, L. oculatus, I. punctatus, X. maculatus, L. chalumnae, D. rerio for comparison.
3. Results
3.1. Genome Sequencing and Assembly
We conducted whole genome sequencing of S. lanzhouensis employing Illumina sequencing, PacBio (HiFi), and Hi-C technologies. Firstly, the genome size was estimated by Illumina sequencing. We generated 103.51 GB of high-quality reads with a GC content of approximately 38.87%. K-mer analysis (k = 21) indicated a genome size of around 678.50 Mb for S. lanzhouensis, with a heterozygous rate of approximately 0.48%.
To construct a PacBio library with long reads for the S. lanzhouensis genome, we sequenced the library. We obtained approximately 45.54 GB of clean data. The average read length was 17.17 kb, with an N50 read length of 18.21 kb. The de novo assembly of the CCS reads generated an initial genome of 835.49 Mb, comprising 499 contigs. The contig N50 size was 15.9 Mb. After removing redundancy, the assembled genome contig sequences had a total length of 806.01 Mb, with a contig N50 size of 16.1 Mb. CEGMA analysis identified 440 (96.07%) core eukaryotic genes in the assembled S. lanzhouensis genome. BUSCO analysis revealed the presence of 3469 (95.30%) core conserved genes in the S. lanzhouensis genome. The overall mapping rate of the short reads was 99.35%, and the mapping rate of the HiFi reads was 99.75%.
Hi-C sequencing was applied to obtain chromosome-level scaffolds, and approximately 156.35 Gb of clean data were obtained. After aligning the clean data to the genome, we identified 443,986,225 pairs of uniquely mapped Hi-C read pairs, of which 199,653,196 pairs represented valid Hi-C data, accounting for 44.97% of the uniquely mapped reads. After Hi-C correction and assembly, we ultimately obtained 30 chromosome-level scaffolds constructed from 373 contigs with a total length of 794.43 Mb (98.56% of the total length of all contigs) (Table 1). Among the sequences mapped to the chromosomes, 778.20 Mb could be assigned to specific positions and orientations. The contig N50 was 16.10 Mb, and the scaffold N50 was 29.14 Mb. The genome circular plot (Figure 1) displayed gene density, repetitive sequence density, GC content, and collinearity. The Hi-C assembly chromosome interaction heatmap (Figure 2) demonstrated a strong interaction intensity between adjacent sequences, confirming the effectiveness of the genome assembly.

Table 1.
Genome assembly metrics of S. lanzhouensis.
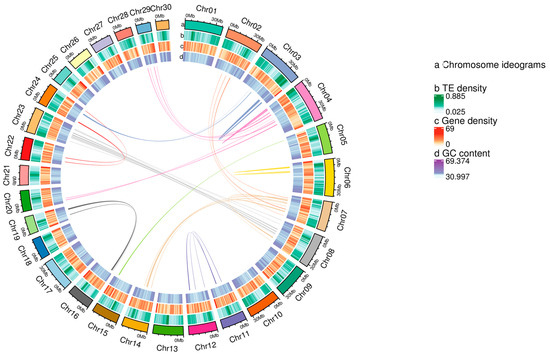
Figure 1.
Genomic cycle diagram.
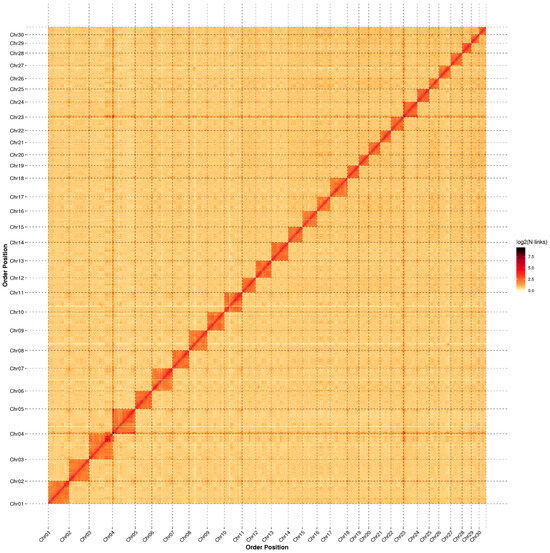
Figure 2.
Hi-C assembly chromosome interaction heatmap.
3.2. Genome Annotation
The S. lanzhouensis genome was annotated using homology-based prediction, de novo prediction, and transcriptome prediction, resulting in 23,093 protein-coding genes. Among these genes, 22,814 (98.79%) were predicted by at least two different methods, indicating high-quality predictions. With an average of 10.33 exons per gene, the average gene length was 17,150.79 bp and the average CDS length was 1756.34 bp. The number of genes in the S. lanzhouensis genome are comparable to P. fulvidraco (23,790), higher than S. meridionalis Chen (22,294) and I. punctatus (22,872), but lower than D. rerio (30,994). Furthermore, we assessed the quality of gene predictions by comparing the length distribution of the coding sequences (CDS) with that of closely related species (Figure 3), confirming the reliability of our gene predictions.
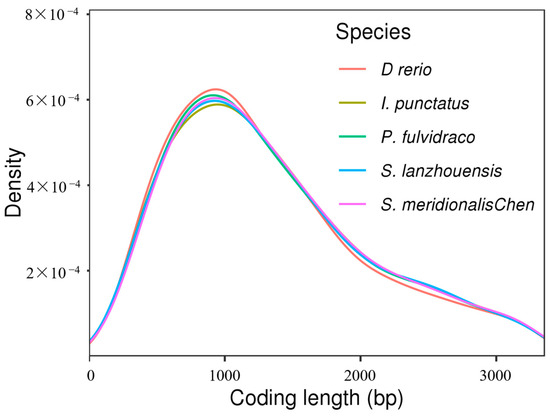
Figure 3.
Distribution map of gene coding sequences (CDS) of various species.
By using the vertebrate database in BUSCO with 3354 conserved genes, we detected that 96.93% of BUSCO genes were included in our predicted gene set, which highlights the great accuracy of our gene predictions. Among the protein-coding genes, 99.35% could be annotated in various databases, including 21,246 genes in the GO database, 20,744 genes in the KEGG database, and 20,600 genes in the eggNOG database. Additionally, we predicted 20,301 tRNAs, 8547 rRNAs, 245 miRNAs, 2118 snRNAs, 185 snoRNAs, and 46 pseudogenes in the S. lanzhouensis genome.
Dispersed repeats, also known as transposable elements, include retroelements and DNA transposons. The S. lanzhouensis genome contains approximately 245,819,409 bp of TE sequences, accounting for 30.50% of the genome. Among these, retroelements make up 16.41%, and DNA transposons make up 14.08%. Additionally, we annotated 77,680,978 bp of tandem repeat sequences, accounting for 9.64% of the genome, with microsatellites accounting for 4.1%, minisatellites accounting for 3.53%, and satellites accounting for 2%.
3.3. Evolutionary Analysis and Gene Families
We compared the assembled genome of S. lanzhouensis with those of four other Siluriformes species (P. hypophthalmus, P. fulvidraco, S. meridionalis Chen, I. punctatus) as well as five outgroup species (C. carpio, L. chalumnae, L. oculatus, X. maculatus, D. rerio). Through classification and annotation of protein sequences from these 10 species, we obtained a total of 28,277 gene families. Of the total, 7290 gene families were shared among all 10 species, with 54 gene families being unique to S. lanzhouensis. S. lanzhouensis had a total of 18,093 gene families (Figure 4a). A significant proportion of the gene families in S. lanzhouensis and the other eight fishes (excluding C. carpio) consisted of single-copy genes, similar to the copy number distribution observed in the closely related species S. meridionalis Chen (Figure 4b). However, C. carpio had a high percentage of gene families with two copies, possibly due to an additional round of genome duplication. Notably, its genome consists of 100 chromosomes, approximately twice as many as other cyprinid fishes [75]. By comparing the gene families of S. lanzhouensis with those of four other fishes (S. meridionalis Chen, P. hypophthalmus, I. punctatus, P. fulvidraco), we identified 276 gene families specific to S. lanzhouensis. KEGG enrichment analysis revealed the significant enrichment of these specific gene families in pathways such as the biosynthesis of amino acids, cysteine and methionine metabolism, and carbon metabolism (Figure 5).
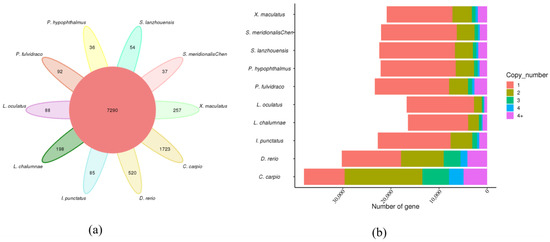
Figure 4.
Analysis of gene families of various species. (a) Gene family clustering petal map; (b) copy number distribution of all gene families in each species.

Figure 5.
Analysis of KEGG enrichment in the unique gene family of S. lanzhouensis.
We constructed a highly reliable phylogenetic tree using 1559 single-copy gene sequences from the ten species and estimated the divergence times using MCMCTREE (Figure 6). Among the ten species, S. meridionalis Chen was determined to be the closest relative to S. lanzhouensis, with a divergence time estimated to be around 8.21 million years ago during the Neoproterozoic era. The lineages of the S. lanzhouensis, P. fulvidraco, P. hypophthalmus, and I. punctatus diverged from a common ancestor approximately 58.08 million years ago. The split between the five Siluriformes species (S. lanzhouensis, S. meridionalis Chen, P. fulvidraco, P. hypophthalmus, I. punctatus) and the Cypriniformes species (D. rerio, C. carpio) occurred approximately 151.53 million years ago from a common ancestor.

Figure 6.
Expansion/contraction of phylogenetic trees and gene families in 10 species of fish. The numbers on the nodes represent the estimated divergence time (millions of years ago [Mya]). The green and red numbers indicate the expansion and contraction of gene families in the lineage, respectively. The background color corresponds to the order of the species. MRCA refers to the most recent common ancestor.
The analysis of gene family expansion and contraction unveiled that S. lanzhouensis exhibited 219 expanded gene families and 318 contracted gene families compared to the other nine species. The gain-to-loss ratio of the gene families was 0.688 (219/318) (Figure 6). We conducted separate GO enrichment analyses for the expanded and contracted gene families (Figure 7). The expanded gene families demonstrated significant enrichment in molecular functions, including carbohydrate binding, protein homodimerization activity, and oxygen carrier activity, among others. The contracted gene family exhibits significant enrichment in molecular functions, including trace-amine receptor activity, chemokine receptor activity, scavenger receptor activity, olfactory receptor activity, and other molecular functions.

Figure 7.
GO enrichment analysis of the gene family involved in the expansion and contraction of the S. lanzhouensis (molecular function). (a) GO enrichment analysis of the expansion gene family; (b) GO enrichment analysis of the contraction gene family.
A comparative analysis of single-copy gene families among S. lanzhouensis, I. punctatus, P. hypophthalmus, P. fulvidraco, and S. meridionalis Chen identified genes under significant positive selection, which were further subjected to GO and KEGG enrichment analysis (Figure 8). The GO enrichment analysis demonstrated that the positively selected genes in S. lanzhouensis were primarily enriched in molecular functions related to growth factor receptor binding and cytokine receptor binding. The KEGG enrichment analysis further revealed that the positively selected genes were predominantly associated with pathways such as thiamine metabolism, protein processing in the endoplasmic reticulum, and protein digestion and absorption.
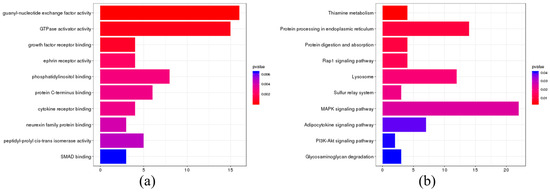
Figure 8.
Enrichment analysis of positive selection genes in S. lanzhouensis. (a) GO enrichment analysis; (b) KEGG enrichment analysis.
3.4. Whole Genome Duplication Events
WGD is a crucial process in which the complete genome undergoes replication and doubling. This process plays a significant role in species origin and genome expansion. We assessed the occurrence of whole genome duplications by analyzing the distribution of the Ks values. Our findings unveiled two distinct peaks in the Ks values of the S. lanzhouensis species, suggesting that it has experienced two rounds of WGD (Figure 9). The peak Ks value of 0.0327 between the S. lanzhouensis and the S. meridionalis Chen group suggests that their divergence occurred subsequent to two rounds of WGD. Furthermore, the peak Ks value of approximately 0.5 between S. lanzhouensis and the P. fulvidraco, P. hypophthalmus, and I. punctatus species indicates a relatively recent divergence among these Siluriformes species, which aligns with the estimated divergence time from the phylogenetic tree.

Figure 9.
Ks value distribution map.
3.5. Characteristics of the Immune System of S. lanzhouensis
In the genome of S. lanzhouensis, we identified multiple immune-related genes. Among them, innate immune system-related genes include Toll-like receptors, antimicrobial peptides, lectins, chemokines, etc. Adaptive immune system-related genes include MHC I, MHC II, CD3, CD4, CD8, CD79a, CD79b, and other genes. The innate immunity-related genes and adaptive immunity-related genes are shown in Table 2. In addition, there are also per1 and cry1 genes related to the core biological clock in the genome of S. lanzhouensis.
Table 2.
Immune system-related genes of S. lanzhouensis.
4. Discussion
Being a species that shares morphological similarities with S. asotus and occupies a similar ecological niche, S. lanzhouensis is currently facing the threat of extinction in its natural habitat. Previous studies have indicated that S. lanzhouensis exhibits weaker digestive and immune functions compared to S. asotus, and it may have a higher protein requirement, which could contribute to its limited adaptability to the environment [16,17]. However, these studies mainly relied on physiological assessments and lacked genetic evidence. To fill this void, we conducted the sequencing and assembly of the reference genome of S. lanzhouensis and subsequently performed a comparative genomics analysis with nine other fishes. This comprehensive analysis encompassed the clustering of gene sequences into gene families, the construction of phylogenetic trees, the examination of gene family expansion and contraction, the analysis of positive selection, as well as the investigation of whole genome duplication events.
By employing Illumina, PacBio (HiFi), and Hi-C technologies, we successfully acquired a high-quality, chromosome-level genome of S. lanzhouensis, with a size of 794.43 Mb, with a scaffold N50 of 29.14 Mb, and a contig N50 of 16.1 Mb. This groundbreaking accomplishment signifies the initial assembly of the S. lanzhouensis genome.
The phylogenetic analysis results reveal that S. lanzhouensis shares the closest evolutionary relationship with S. meridionalis Chen, and their divergence took place around 8.21 million years ago, during the Neoproterozoic era. The Ks distribution plot demonstrates that the common ancestor of S. lanzhouensis and S. meridionalis Chen underwent two rounds of WGD before their separation. Notably, despite the close phylogenetic affinity between S. lanzhouensis and S. meridionalis Chen, they exhibit substantial dissimilarities in terms of morphology and ecological niche. It is suggested that the Yellow River and Changjiang River systems were connected 8.21 million years ago, and subsequent geological changes have led to habitat barriers and species differentiation into the S. meridionalis Chen in the Changjiang River and S. lanzhouensis in the Yellow River. This may be consistent with the conclusion that the third period (65 million to 2.6 million years) to the early Pleistocene period (2.588 million to 11.5 million years ago) was the incubation period for the Yellow River. The S. lanzhouensis genome is characterized as a compact genome, comprising 23,093 protein-coding genes, which is similar to other Siluriformes species such as S. meridionalis Chen (22,660), P. fulvidraco (24,308), P. hypophthalmus (22,939), and I. punctatus (23,781). However, the gene count is lower than that of Cypriniformes fish like C. carpio (48,229) and D. rerio (32,481). These gene counts are consistent with the taxonomic classification of each species.
Through the process of genome annotation, it has been determined that S. lanzhouensis exhibits a relatively comprehensive innate immune system as well as an initial adaptive immune system. We have verified the existence of genes associated with innate immunity, including Toll-like receptors (TLRs), antimicrobial peptides (AMPs), lectins, chemokines, and other genes, in S. lanzhouensis. These findings demonstrate a resemblance to the well-established innate immune-related genes observed in catfish [76]. Among these, TLRs function as the primary defense mechanism against infectious diseases by detecting pathogen-associated molecular patterns (PAMPs) and initiating immune responses within the organism [77]. Our study has uncovered that TLRs are relatively complete in the genome of S. lanzhouensis, which holds significant importance for innate immunity. AMPs refer to a class of small molecular peptides that possess antimicrobial properties [78]. We have identified β-defensins, Hepcidin-1, LEAP2, and other AMPs present in S. lanzhouensis. It is noteworthy that in teleost, hepcidin is typically composed of multiple copies, which are classified as hamp-1 and hamp-2. The regulatory function of hamp-1 is associated with iron levels, whereas hamp-2 demonstrates antibacterial properties [26]. However, it was observed that only hepcidin-1 was present in the genome of S. lanzhouensis, potentially leading to a decrease in its antimicrobial efficacy. Additionally, the presence of CLEC1B, CLEC4C, CLEC6A, and other lectins, which have a significant impact on immune system regulation, has been confirmed in S. lanzhouensis [79]. Chemokines play a crucial role in directing the chemotaxis of cells involved in pathogen defense and clearance processes [80]. In the species S. lanzhouensis, we have observed the presence of relatively intact chemokines, including CCL3, CCL4, CXCL9, and others. However, the genes related to chemokine receptors exhibited contraction, indicating a potential decrease in chemokine function. We have verified the existence of MHC I, MHC II, CD3, CD4, CD8, CD79a, CD79b, and other genes associated with adaptive immunity in S. lanzhouensis. These genes are associated with the mechanisms of antigen processing and presentation, T cell differentiation, and B cell signal transduction [81]. Therefore, it can be inferred that S. lanzhouensis exhibits a rudimentary adaptive immune system.
The expanded gene families in S. lanzhouensis are enriched in molecular functions related to energy metabolism and oxygen binding, such as carbohydrate binding and oxygen carrier activity. Conversely, the contracted gene families are enriched in molecular functions associated with immunity and stress response, such as chemokine receptor activity and scavenger receptor function. Intriguingly, these patterns of gene expansion and contraction in S. lanzhouensis align with certain physiological characteristics. Our previous studies have demonstrated that S. lanzhouensis exhibits a weaker immune function compared to S. asotus, while having a higher nutritional requirement [16,17]. Therefore, the observed gene expansion and contraction in S. lanzhouensis suggest that if its ancestors inhabited water environments similar to the present, the water quality of the early Yellow River may have been clearer (fewer pathogens) and food resources within it might have been sufficient, thus providing a suitable habitat for S. lanzhouensis.
The unique gene families and positive selection genes in S. lanzhouensis also reflect its high protein demand. The 54 gene families specific to this species are enriched in amino acid synthesis and metabolism pathways. In addition, the genes showing significantly positive selection are primarily enriched in pathways related to protein digestion. Additionally, the significantly positive selection genes are mainly enriched in protein digestion pathways. This distinction further enhances our understanding of the original habitat of S. lanzhouensis, indicating that S. lanzhouensis likely thrives in an environment with relatively abundant food resources relative to other Siluriformes species.
It is important to note several limitations in this study. Although S. lanzhouensis closely resembles S. asotus in terms of morphology and ecological niche, we did not include the S. asotus genome in our analysis because it lacks available genomic data. As a next step, we plan to sequence and assemble the S. asotus genome and compare it with the genome of S. lanzhouensis to further explore the potential mechanisms underlying the vulnerability of S. lanzhouensis.
5. Conclusions
This study has successfully assembled the first genome of S. lanzhouensis at the chromosome level and has provided annotations for its encoded genes, non-coding RNAs, and repetitive sequences. Phylogenetic analysis and examination of WGD events provided insights into the evolutionary status of S. lanzhouensis and the factors contributing to its genome size. By comparing the genomes of S. lanzhouensis and nine other fishes, we discovered gene family expansions in signal pathways related to energy metabolism and oxygen binding, as well as gene family contractions in signal pathways related to immunity and stress response. S. lanzhouensis also possesses unique gene families that are enriched in amino acid synthesis and protein digestion-related signaling pathways compared to other fishes. This study offers important clues for investigating the reasons behind the endangerment of S. lanzhouensis and establishes a foundation for the conservation of its genetic resources in the future.
Author Contributions
Conceptualization, Y.Y. and Y.Z.; methodology, Y.Z. and F.L.; software, Y.Z.; formal analysis, Y.Z., F.L. and Y.L.; investigation, Y.Y., Y.Z., F.L., S.W., L.W., G.L. and Z.Z.; resources, S.W., L.W., Y.Z., F.L. and J.Z.; writing—original draft preparation, Y.Z. and Y.Y.; writing—review and editing, Y.Y. and Y.Z.; supervision, Y.Y.; project administration, Y.Y.; funding acquisition, Y.Y. All authors have read and agreed to the published version of the manuscript.
Funding
This study was supported by grants from the Ministry of Agriculture and Rural Affairs financial special project “Yellow River Fisheries Resources and Environment Survey” (grant number HHDC-2022-0302), Shaanxi Provincial Agricultural Science and Technology Innovation Driver Project (2022-01).
Institutional Review Board Statement
The studies were conducted in strict compliance with the Regulations of the Administration of Affairs Concerning Experimental Animals, which were approved by the Institutional Animal Care and Use Committee of Shaanxi Province. This study has also been reviewed and approved by the ethics committee of the Yellow River Fisheries Research Institute (Approval Code: YFRI (EC) 2022-0003; Approval Date: 27 March 2022).
Data Availability Statement
The raw genome sequence reads have been submitted and are available in the National Centre for Biotechnology Information (NCBI) under BioProject accession number PRJNA1039265.
Acknowledgments
We thank the referees for their thoughtful comments and recommendations.
Conflicts of Interest
The authors declare no conflict of interest.
References
- Chen, X. A general introduction to Siluridae fish in China. Acta Hydrobiol. Sin. 1977, 2, 197–218. [Google Scholar]
- Yang, Y.; Zhou, J.; Wang, L.; Li, F.; Zhou, J.; Li, L.; Yang, J.; Gan, J.; He, L.; Lan, G.; et al. Lanzhouen Catfish; Standards Press of China: Beijing, China, 2022. [Google Scholar]
- Wang, S.; Xie, Y. China Species Red List; Higher Education Press: Beijing, China, 2004. [Google Scholar]
- Yue, P.; Chen, Y. China Red Data Book of Endangered Animals: Pisces; Science Press: Beijing, China, 1998. [Google Scholar]
- Li, L. Research on the Characteristics of Silurus lanzhouensis in Shaanxi Section of the Yellow River. Master’s Thesis, Northwest A&F University, Yangling, China, 2016. [Google Scholar]
- Xiao, W. Studies on the Conservation Genetics of Silurus lanzhouensis. Master’s Thesis, Gansu Agricultural University, Lanzhou, China, 2011. [Google Scholar]
- Shi, L. Studies on the Growing Development and Reproduce Biology of Silurus lanzhouensis. Master’s Thesis, Gansu Agricultural University, Lanzhou, China, 2007. [Google Scholar]
- Shi, L.; Zhang, Q.; Wu, X.; Li, L.; Zhang, L. Individual fertility of the Silurus lanzhouensis. J. Gansu Agric. Univ. 2008, 1, 67–70. [Google Scholar]
- Wu, X.; Li, L.; Zhang, F.; Lian, Z.; Zhao, H. A preliminary study on the embryonic development of Silurus lanzhouensis. Curr. Fish. 2011, 36, 65–67. [Google Scholar]
- Fan, Z.; Ren, H. Discussion on artificial breeding techniques of Silurus lanzhouensis. Sci. Fish Farming 2023, 6, 25–26. [Google Scholar]
- Du, W.; Bai, F.; Xu, Z.; Zhao, D.; Huang, J. The composition, enzyme production capacity and growth characteristics of intestinal bacteria from Silurus lanzhouensis. Lab. Sci. 2022, 25, 15–20. [Google Scholar]
- Wang, F.; Lian, Z.; Wu, X.; Wei, D.; Xiao, W.; Li, L. Cloning and sequence analysis of growth hormone (GH) gene in Silurus lanzhouensis. Freshw. Fish. 2015, 45, 20–25. [Google Scholar]
- Yu, Z. Gene Isolation, Sequence Features and Tissue-Specific Expression Associated with Growth Traits in Silurus lanzhouensis. Master’s Thesis, Gansu Agricultural University, Lanzhou, China, 2016. [Google Scholar]
- Yu, Z.; Lian, Z.; Wu, X.; Yang, Z.; Li, L.; Zhang, F.; Xiao, W.; Sai, Q. Cloning and bioinformatics analysis of the MyoD gene in Silurus lanzhouensis. Freshw. Fish. 2016, 46, 10–15. [Google Scholar]
- Herkenhoff, M.E.; Bajay, M.M.; Costamilan, C. Genetic Structure and Biodiversity in Wild Centropomus parallelus and in Wild and Recently Domesticated Centropomus undecimallis Populations. Life 2023, 13, 1595. [Google Scholar] [CrossRef]
- Yang, Y.; Wang, L.; Li, X.; Zhou, J.; Wang, L.; Li, F.; Ren, H.; Han, G. Comparative study on morphology and histology of digestive system of Silurus lanzhouensis and catfish (Silurus asotus). Acta Hydrobiol. Sin. 2017, 41, 174–181. [Google Scholar]
- Yang, Y.; Zhou, J.; Lu, L.; Li, C.; Ji, H.; Li, L.; Wang, L.; Wang, L. A comparison study on morphological character and serum biochemical parameters between Silurus lanzhouensis. J. Hydroecol. 2013, 34, 87–91. [Google Scholar]
- Lan, G.; Li, T.; Yang, Y.; Chen, B.; Li, F.; Fan, J.; Wu, J.; Li, H.; Wang, L. A comparison study on serum biochemical parameters between Brachymystax lenok tsinlingensis and Silurus lanzhouensis. J. Domest. Anim. Ecol. 2019, 40, 50–53. [Google Scholar]
- Kim, O.T.P.; Nguyen, P.T.; Shoguchi, E.; Hisata, K.; Vo, T.T.B.; Inoue, J.; Shinzato, C.; Le, B.T.N.; Nishitsuji, K.; Kanda, M.; et al. A draft genome of the striped catfish, Pangasianodon hypophthalmus, for comparative analysis of genes relevant to development and a resource for aquaculture improvement. BMC Genom. 2018, 19, 733. [Google Scholar] [CrossRef] [PubMed]
- Chen, X.; Zhong, L.; Bian, C.; Xu, P.; Qiu, Y.; You, X.; Zhang, S.; Huang, Y.; Li, J.; Wang, M.; et al. High-quality genome assembly of channel catfish, Ictalurus punctatus. Gigascience 2016, 5, 39. [Google Scholar] [CrossRef] [PubMed]
- Zheng, S.; Shao, F.; Tao, W.; Liu, Z.; Long, J.; Wang, X.; Zhang, S.; Zhao, Q.; Carleton, K.L.; Kocher, T.D.; et al. Chromosome-level assembly of southern catfish (silurus meridionalis) provides insights into visual adaptation to nocturnal and benthic lifestyles. Mol. Ecol. Resour. 2021, 21, 1575–1592. [Google Scholar] [CrossRef] [PubMed]
- Gong, G.; Dan, C.; Xiao, S.; Guo, W.; Huang, P.; Xiong, Y.; Wu, J.; He, Y.; Zhang, J.; Li, X.; et al. Chromosomal-level assembly of yellow catfish genome using third-generation DNA sequencing and Hi-C analysis. Gigascience 2018, 7, giy120. [Google Scholar] [CrossRef] [PubMed]
- Chen, S.; Zhou, Y.; Chen, Y.; Gu, J. fastp: An ultra-fast all-in-one FASTQ preprocessor. Bioinformatics 2018, 34, i884–i890. [Google Scholar] [CrossRef] [PubMed]
- Marcais, G.; Kingsford, C. A fast, lock-free approach for efficient parallel counting of occurrences of k-mers. Bioinformatics 2011, 27, 764–770. [Google Scholar] [CrossRef] [PubMed]
- Ranallo-Benavidez, T.R.; Jaron, K.S.; Schatz, M.C. GenomeScope 2.0 and Smudgeplot for reference-free profiling of polyploid genomes. Nat. Commun. 2020, 11, 1432. [Google Scholar] [CrossRef]
- Mu, Y.; Huo, J.; Guan, Y.; Fan, D.; Xiao, X.; Wei, J.; Li, Q.; Mu, P.; Ao, J.; Chen, X. An improved genome assembly for Larimichthys crocea reveals hepcidin gene expansion with diversified regulation and function. Commun. Biol. 2018, 1, 195. [Google Scholar] [CrossRef]
- Cheng, H.; Concepcion, G.T.; Feng, X.; Zhang, H.; Li, H. Haplotype-resolved de novo assembly using phased assembly graphs with hifiasm. Nat. Methods 2021, 18, 170–175. [Google Scholar] [CrossRef]
- Guan, D.; McCarthy, S.A.; Wood, J.; Howe, K.; Wang, Y.; Durbin, R. Identifying and removing haplotypic duplication in primary genome assemblies. Bioinformatics 2020, 36, 2896–2898. [Google Scholar] [CrossRef] [PubMed]
- Parra, G.; Bradnam, K.; Korf, I. CEGMA: A pipeline to accurately annotate core genes in eukaryotic genomes. Bioinformatics 2007, 23, 1061–1067. [Google Scholar] [CrossRef] [PubMed]
- Simao, F.A.; Waterhouse, R.M.; Ioannidis, P.; Kriventseva, E.V.; Zdobnov, E.M. BUSCO: Assessing genome assembly and annotation completeness with single-copy orthologs. Bioinformatics 2015, 31, 3210–3212. [Google Scholar] [CrossRef] [PubMed]
- Rao, S.S.; Huntley, M.H.; Durand, N.C.; Stamenova, E.K.; Bochkov, I.D.; Robinson, J.T.; Sanborn, A.L.; Machol, I.; Omer, A.D.; Lander, E.S.; et al. A 3D map of the human genome at kilobase resolution reveals principles of chromatin looping. Cell 2014, 159, 1665–1680. [Google Scholar] [CrossRef] [PubMed]
- Servant, N.; Varoquaux, N.; Lajoie, B.R.; Viara, E.; Chen, C.J.; Vert, J.P.; Heard, E.; Dekker, J.; Barillot, E. HiC-Pro: An optimized and flexible pipeline for Hi-C data processing. Genome Biol. 2015, 16, 259. [Google Scholar] [CrossRef] [PubMed]
- Li, H.; Durbin, R. Fast and accurate short read alignment with Burrows-Wheeler transform. Bioinformatics 2009, 25, 1754–1760. [Google Scholar] [CrossRef] [PubMed]
- Burton, J.N.; Adey, A.; Patwardhan, R.P.; Qiu, R.; Kitzman, J.O.; Shendure, J. Chromosome-scale scaffolding of de novo genome assemblies based on chromatin interactions. Nat. Biotechnol. 2013, 31, 1119–1125. [Google Scholar] [CrossRef]
- Stanke, M.; Diekhans, M.; Baertsch, R.; Haussler, D. Using native and syntenically mapped cDNA alignments to improve de novo gene finding. Bioinformatics 2008, 24, 637–644. [Google Scholar] [CrossRef]
- Korf, I. Gene finding in novel genomes. BMC Bioinform. 2004, 5, 59. [Google Scholar] [CrossRef]
- Keilwagen, J.; Wenk, M.; Erickson, J.L.; Schattat, M.H.; Grau, J.; Hartung, F. Using intron position conservation for homology-based gene prediction. Nucleic Acids Res. 2016, 44, e89. [Google Scholar] [CrossRef]
- Kim, D.; Langmead, B.; Salzberg, S.L. HISAT: A fast spliced aligner with low memory requirements. Nat. Methods 2015, 12, 357–360. [Google Scholar] [CrossRef]
- Pertea, M.; Pertea, G.M.; Antonescu, C.M.; Chang, T.C.; Mendell, J.T.; Salzberg, S.L. StringTie enables improved reconstruction of a transcriptome from RNA-seq reads. Nat. Biotechnol. 2015, 33, 290–295. [Google Scholar] [CrossRef] [PubMed]
- Tang, S.; Lomsadze, A.; Borodovsky, M. Identification of protein coding regions in RNA transcripts. Nucleic Acids Res. 2015, 43, e78. [Google Scholar] [CrossRef] [PubMed]
- Grabherr, M.G.; Haas, B.J.; Yassour, M.; Levin, J.Z.; Thompson, D.A.; Amit, I.; Adiconis, X.; Fan, L.; Raychowdhury, R.; Zeng, Q.; et al. Full-length transcriptome assembly from RNA-Seq data without a reference genome. Nat. Biotechnol. 2011, 29, 644–652. [Google Scholar] [CrossRef] [PubMed]
- Haas, B.J.; Delcher, A.L.; Mount, S.M.; Wortman, J.R.; Smith, R.K., Jr.; Hannick, L.I.; Maiti, R.; Ronning, C.M.; Rusch, D.B.; Town, C.D.; et al. Improving the Arabidopsis genome annotation using maximal transcript alignment assemblies. Nucleic Acids Res. 2003, 31, 5654–5666. [Google Scholar] [CrossRef] [PubMed]
- Haas, B.J.; Salzberg, S.L.; Zhu, W.; Pertea, M.; Allen, J.E.; Orvis, J.; White, O.; Buell, C.R.; Wortman, J.R. Automated eukaryotic gene structure annotation using EVidenceModeler and the Program to Assemble Spliced Alignments. Genome Biol. 2008, 9, R7. [Google Scholar] [CrossRef] [PubMed]
- Huerta-Cepas, J.; Szklarczyk, D.; Heller, D.; Hernandez-Plaza, A.; Forslund, S.K.; Cook, H.; Mende, D.R.; Letunic, I.; Rattei, T.; Jensen, L.J.; et al. eggNOG 5.0: A hierarchical, functionally and phylogenetically annotated orthology resource based on 5090 organisms and 2502 viruses. Nucleic Acids Res. 2019, 47, D309–D314. [Google Scholar] [CrossRef] [PubMed]
- Gene Ontology, C. Gene Ontology Consortium: Going forward. Nucleic Acids Res. 2015, 43, D1049–D1056. [Google Scholar] [CrossRef]
- Kanehisa, M.; Sato, Y.; Kawashima, M.; Furumichi, M.; Tanabe, M. KEGG as a reference resource for gene and protein annotation. Nucleic Acids Res. 2016, 44, D457–D462. [Google Scholar] [CrossRef]
- Boeckmann, B.; Bairoch, A.; Apweiler, R.; Blatter, M.C.; Estreicher, A.; Gasteiger, E.; Martin, M.J.; Michoud, K.; O’Donovan, C.; Phan, I.; et al. The SWISS-PROT protein knowledgebase and its supplement TrEMBL in 2003. Nucleic Acids Res. 2003, 31, 365–370. [Google Scholar] [CrossRef]
- Finn, R.D.; Mistry, J.; Schuster-Bockler, B.; Griffiths-Jones, S.; Hollich, V.; Lassmann, T.; Moxon, S.; Marshall, M.; Khanna, A.; Durbin, R.; et al. Pfam: Clans, web tools and services. Nucleic Acids Res. 2006, 34, D247–D251. [Google Scholar] [CrossRef] [PubMed]
- Lowe, T.M.; Eddy, S.R. tRNAscan-SE: A program for improved detection of transfer RNA genes in genomic sequence. Nucleic Acids Res. 1997, 25, 955–964. [Google Scholar] [CrossRef] [PubMed]
- Liu, N.; Zhu, L.; Zhang, Z.; Huang, H.; Jiang, L. Draft genome sequence of a multidrug-resistant bla(OXA-69)-producing Acinetobacter baumannii L13 isolated from Tarim River sample in China. J. Glob. Antimicrob. Resist. 2019, 18, 145–147. [Google Scholar] [CrossRef] [PubMed]
- Griffiths-Jones, S.; Moxon, S.; Marshall, M.; Khanna, A.; Eddy, S.R.; Bateman, A. Rfam: Annotating non-coding RNAs in complete genomes. Nucleic Acids Res. 2005, 33, D121–D124. [Google Scholar] [CrossRef] [PubMed]
- Nawrocki, E.P.; Eddy, S.R. Infernal 1.1: 100-fold faster RNA homology searches. Bioinformatics 2013, 29, 2933–2935. [Google Scholar] [CrossRef] [PubMed]
- She, R.; Chu, J.S.; Wang, K.; Pei, J.; Chen, N. GenBlastA: Enabling BLAST to identify homologous gene sequences. Genome Res. 2009, 19, 143–149. [Google Scholar] [CrossRef] [PubMed]
- Birney, E.; Clamp, M.; Durbin, R. GeneWise and Genomewise. Genome Res. 2004, 14, 988–995. [Google Scholar] [CrossRef]
- Flynn, J.M.; Hubley, R.; Goubert, C.; Rosen, J.; Clark, A.G.; Feschotte, C.; Smit, A.F. RepeatModeler2 for automated genomic discovery of transposable element families. Proc. Natl. Acad. Sci. USA 2020, 117, 9451–9457. [Google Scholar] [CrossRef]
- Ellinghaus, D.; Kurtz, S.; Willhoeft, U. LTRharvest, an efficient and flexible software for de novo detection of LTR retrotransposons. BMC Bioinform. 2008, 9, 18. [Google Scholar] [CrossRef]
- Xu, Z.; Wang, H. LTR_FINDER: An efficient tool for the prediction of full-length LTR retrotransposons. Nucleic Acids Res. 2007, 35, W265–W268. [Google Scholar] [CrossRef]
- Ou, S.; Jiang, N. LTR_retriever: A Highly Accurate and Sensitive Program for Identification of Long Terminal Repeat Retrotransposons. Plant Physiol. 2018, 176, 1410–1422. [Google Scholar] [CrossRef] [PubMed]
- Tarailo-Graovac, M.; Chen, N. Using RepeatMasker to identify repetitive elements in genomic sequences. Curr. Protoc. Bioinform. 2009, 4, 4.10.1–4.10.14. [Google Scholar] [CrossRef] [PubMed]
- Beier, S.; Thiel, T.; Munch, T.; Scholz, U.; Mascher, M. MISA-web: A web server for microsatellite prediction. Bioinformatics 2017, 33, 2583–2585. [Google Scholar] [CrossRef] [PubMed]
- Benson, G. Tandem repeats finder: A program to analyze DNA sequences. Nucleic Acids Res. 1999, 27, 573–580. [Google Scholar] [CrossRef] [PubMed]
- Emms, D.M.; Kelly, S. OrthoFinder: Phylogenetic orthology inference for comparative genomics. Genome Biol. 2019, 20, 238. [Google Scholar] [CrossRef] [PubMed]
- Mi, H.; Muruganujan, A.; Ebert, D.; Huang, X.; Thomas, P.D. PANTHER version 14: More genomes, a new PANTHER GO-slim and improvements in enrichment analysis tools. Nucleic Acids Res. 2019, 47, D419–D426. [Google Scholar] [CrossRef]
- Yu, G.; Wang, L.G.; Han, Y.; He, Q.Y. clusterProfiler: An R package for comparing biological themes among gene clusters. Omics J. Integr. Biol. 2012, 16, 284–287. [Google Scholar] [CrossRef]
- Nguyen, L.T.; Schmidt, H.A.; von Haeseler, A.; Minh, B.Q. IQ-TREE: A fast and effective stochastic algorithm for estimating maximum-likelihood phylogenies. Mol. Biol. Evol. 2015, 32, 268–274. [Google Scholar] [CrossRef]
- Katoh, K.; Asimenos, G.; Toh, H. Multiple alignment of DNA sequences with MAFFT. Methods Mol. Biol. 2009, 537, 39–64. [Google Scholar]
- Suyama, M.; Torrents, D.; Bork, P. PAL2NAL: Robust conversion of protein sequence alignments into the corresponding codon alignments. Nucleic Acids Res. 2006, 34, W609–W612. [Google Scholar] [CrossRef]
- Talavera, G.; Castresana, J. Improvement of phylogenies after removing divergent and ambiguously aligned blocks from protein sequence alignments. Syst. Biol. 2007, 56, 564–577. [Google Scholar] [CrossRef] [PubMed]
- Kalyaanamoorthy, S.; Minh, B.Q.; Wong, T.K.F.; von Haeseler, A.; Jermiin, L.S. ModelFinder: Fast model selection for accurate phylogenetic estimates. Nat. Methods 2017, 14, 587–589. [Google Scholar] [CrossRef] [PubMed]
- Han, M.V.; Thomas, G.W.; Lugo-Martinez, J.; Hahn, M.W. Estimating gene gain and loss rates in the presence of error in genome assembly and annotation using CAFE 3. Mol. Biol. Evol. 2013, 30, 1987–1997. [Google Scholar] [CrossRef] [PubMed]
- Ao, J.; Mu, Y.; Xiang, L.X.; Fan, D.; Feng, M.; Zhang, S.; Shi, Q.; Zhu, L.Y.; Li, T.; Ding, Y.; et al. Genome sequencing of the perciform fish Larimichthys crocea provides insights into molecular and genetic mechanisms of stress adaptation. PLoS Genet. 2015, 11, e1005118. [Google Scholar] [CrossRef] [PubMed]
- Yang, Z. PAML: A program package for phylogenetic analysis by maximum likelihood. Comput. Appl. Biosci. 1997, 13, 555–556. [Google Scholar] [CrossRef] [PubMed]
- Shao, G.; He, T.; Mu, Y.; Mu, P.; Ao, J.; Lin, X.; Ruan, L.; Wang, Y.; Gao, Y.; Liu, D.; et al. The genome of a hadal sea cucumber reveals novel adaptive strategies to deep-sea environments. iScience 2022, 25, 105545. [Google Scholar] [CrossRef]
- Zwaenepoel, A.; Van de Peer, Y. wgd-simple command line tools for the analysis of ancient whole-genome duplications. Bioinformatics 2019, 35, 2153–2155. [Google Scholar] [CrossRef]
- Xu, P.; Zhang, X.; Wang, X.; Li, J.; Liu, G.; Kuang, Y.; Xu, J.; Zheng, X.; Ren, L.; Wang, G.; et al. Genome sequence and genetic diversity of the common carp, Cyprinus carpio. Nat. Genet. 2014, 46, 1212–1219. [Google Scholar] [CrossRef]
- Gao, L.; He, C.; Liu, X.; Su, H.; Gao, X.; Li, Y.; Liu, W. The innate immune-related genes in catfish. Int. J. Mol. Sci. 2012, 13, 14172–14202. [Google Scholar] [CrossRef]
- Liao, Z.; Su, J. Progresses on three pattern recognition receptor families (TLRs, RLRs and NLRs) in teleost. Dev. Comp. Immunol. 2021, 122, 104131. [Google Scholar] [CrossRef]
- Katzenback, B.A. Antimicrobial Peptides as Mediators of Innate Immunity in Teleosts. Biology 2015, 4, 607–639. [Google Scholar] [CrossRef] [PubMed]
- Vasta, G.R.; Nita-Lazar, M.; Giomarelli, B.; Ahmed, H.; Du, S.; Cammarata, M.; Parrinello, N.; Bianchet, M.A.; Amzel, L.M. Structural and functional diversity of the lectin repertoire in teleost fish: Relevance to innate and adaptive immunity. Dev. Comp. Immunol. 2011, 35, 1388–1399. [Google Scholar] [CrossRef] [PubMed]
- Bird, S.; Tafalla, C. Teleost Chemokines and Their Receptors. Biology 2015, 4, 756–784. [Google Scholar] [CrossRef]
- Wilson, A.B. MHC and adaptive immunity in teleost fishes. Immunogenetics 2017, 69, 521–528. [Google Scholar] [CrossRef] [PubMed]
Disclaimer/Publisher’s Note: The statements, opinions and data contained in all publications are solely those of the individual author(s) and contributor(s) and not of MDPI and/or the editor(s). MDPI and/or the editor(s) disclaim responsibility for any injury to people or property resulting from any ideas, methods, instructions or products referred to in the content. |
© 2023 by the authors. Licensee MDPI, Basel, Switzerland. This article is an open access article distributed under the terms and conditions of the Creative Commons Attribution (CC BY) license (https://creativecommons.org/licenses/by/4.0/).