Article

Spatial Distribution of Major Fish Species Catches and Their Relationship with Environmental Factors in the Beibu Gulf, South China Sea

1
South China Sea Fisheries Research Institute, Chinese Academy of Fishery Sciences, Guangzhou 510300, China
2
College of Marine Sciences, Shanghai Ocean University, Shanghai 201306, China
3
National Digital Fisheries (Marine Ranching) Innovation Sub-Center, Guangzhou 510300, China
4
Key Laboratory of Marine Ranching, Ministry of Agriculture and Rural Affairs, Guangzhou 510300, China
5
Scientific Observing and Experimental Station of South China Sea Fishery Resources and Environments, Ministry of Agriculture and Rural Affairs, Guangzhou 510300, China
6
Guangdong Engineering Technology Research Center of Marine Recreational Fishery, Guangzhou 510300, China
7
Key Laboratory of Marine Ranching Technology, Chinese Academy of Fishery Sciences, Guangzhou 510300, China
8
Sanya Tropical Fisheries Research Institute, Sanya 572000, China
*
Author to whom correspondence should be addressed.
Fishes 2023, 8(11), 559; https://doi.org/10.3390/fishes8110559
Submission received: 9 October 2023 / Revised: 12 November 2023 / Accepted: 13 November 2023 / Published: 20 November 2023
(This article belongs to the Special Issue Response of Aquatic Animals to Environmental Changes)

Abstract

:
This study focused on major fish species caught from different ecological habitats to analyze the habitat changes in economically important fish in the Beibu Gulf. The maximum entropy model was constructed based on the data from 26 voyages obtained through the otter trawl fishery stock surveys conducted in the Beibu Gulf from 2006 to 2018. A total of 10 taxa of major fish catches, belonging to 4 families, 1 genus, and 5 species, were analyzed for their distribution characteristics in potential habitats during various ecological periods, specifically the withered and high-water periods, as well as their relationships with crucial environmental factors. During both the withered and high-water periods, the average area under the curve was 0.927, and all models had values exceeding 0.9. Salinity was identified as the principal factor during both periods. The salinity niche of Acropoma japonicum and the primary productivity niche of Sciaenidae were identified as the most restricted factors. The total distribution area of potentially suitable regions for major fish catches extended between 106°30′–109°45′ E and 17°30′–20°45′ N, and the area was lesser during the withered period. During the withered period, the distribution areas of Sciaenidae, Leiognathidae, and Saurida increased, while the distribution area of Trachurus japonicus increased during the high-water period. Sciaenidae and Trachurus japonicus exhibited the highest rates of change at 6.22% and 10.92%, respectively. This indicates that the high-water period may expand the range of suitable habitats for large catches that have an ideal habitat status in the Beibu Gulf. Therefore, it is crucial to anticipate the potential fish habitats in the Beibu Gulf and clarify their spatial distribution patterns.
Key Contribution: In this study, we predicted the suitable areas for catches of 10 major fish taxa in the Beibu Gulf using long-time series and large sample sizes to account for various flood periods. We utilized the maximum entropy (MaxEnt) model to predict potential habitats for major fish catches in the Beibu Gulf during both withered and high-water periods and to analyze the correlation between environmental factors and their distribution across different flood stages. The results of this study may provide significant insights into fishery stock allocation and enable more effective management during changing flood conditions.

1. Introduction

As the world’s largest carbon sink, the ocean absorbs the excess heat generated from considerably high greenhouse gas emissions, therefore causing an increase in water temperatures [1,2,3]. A continuous increase in temperature leads to the narrowing of marine biodiversity, alterations in the community structure, and shifts in fish distribution in the polar regions [4]. In recent years, the improved efficiency of social and industrial fishing has diminished the availability of sustainable fish stocks, therefore accelerating the degradation of the marine ecosystem and causing irreparable dangers of ecological transition [5,6,7]. In addition, changes in fish resources can affect the stability and sustainability of ecosystems, disrupting the biodiversity and ecological balance [8]. The persistence of extreme global climate change affects marine ecosystems, which increases the risk of extinction of certain species, particularly in near-shore marine ecosystems [9,10].
Surrounded by land on three sides and abundant in fish resources, the Beibu Gulf was formerly one of the four primary fishing grounds and played a crucial role in developing fishery resources in China [11,12]. However, the densely populated Beibu Gulf coast houses many factories that resulted in environmental pollution, directly causing a rise in water temperatures [13]. Therefore, anthropogenic activities and climate change have led to a decline in fish resources and changes in their spatial distribution [14,15,16]. Large-scale, comprehensive studies utilizing long-time series and large sample sizes to predict various flood periods have not been conducted.
MaxEnt models have multiple applications, such as analyzing habitat distribution, predicting species invasion, and assessing environmental risks [17,18]. For instance, the MaxEnt model was used to simulate the optimal habitat for marine life in estuaries to delineate the ecological corridors and protect marine biodiversity [19]. Potentially suitable areas over different months were simulated for three pelagic fish species on the Northwest Atlantic continental shelf, and the influence of environmental factors on their distribution was studied [20]. However, the analysis of the potential areas with high catch rates for the major fish species in the Beibu Gulf requires further investigation. This study used the maximum entropy (MaxEnt) model to predict the potential habitats for major fish catches in the Beibu Gulf across withered and high-water periods and to analyze the correlation between environmental factors and the distribution in different flood stages. The results may provide significant insight into fishery stock allocation and enable more effective management during changing conditions of floods. Therefore, it is crucial to anticipate the potential fish habitats in the Beibu Gulf and clarify their spatial distribution patterns.
This study focused on major fish Species Catches with different ecological habitats to analyze the habitat changes in economically important fish in the Beibu Gulf. The MaxEnt model was constructed using data from 26 voyages in the Beibu Gulf from 2006 to 2018. This model was used to predict the distribution characteristics of potentially suitable areas for fish catches of different ecological types. In addition, their relationship with crucial environmental factors was determined, thus providing theoretical evidence for the conservation and management of fishery ecosystems in the Beibu Gulf.

2. Materials and Methods

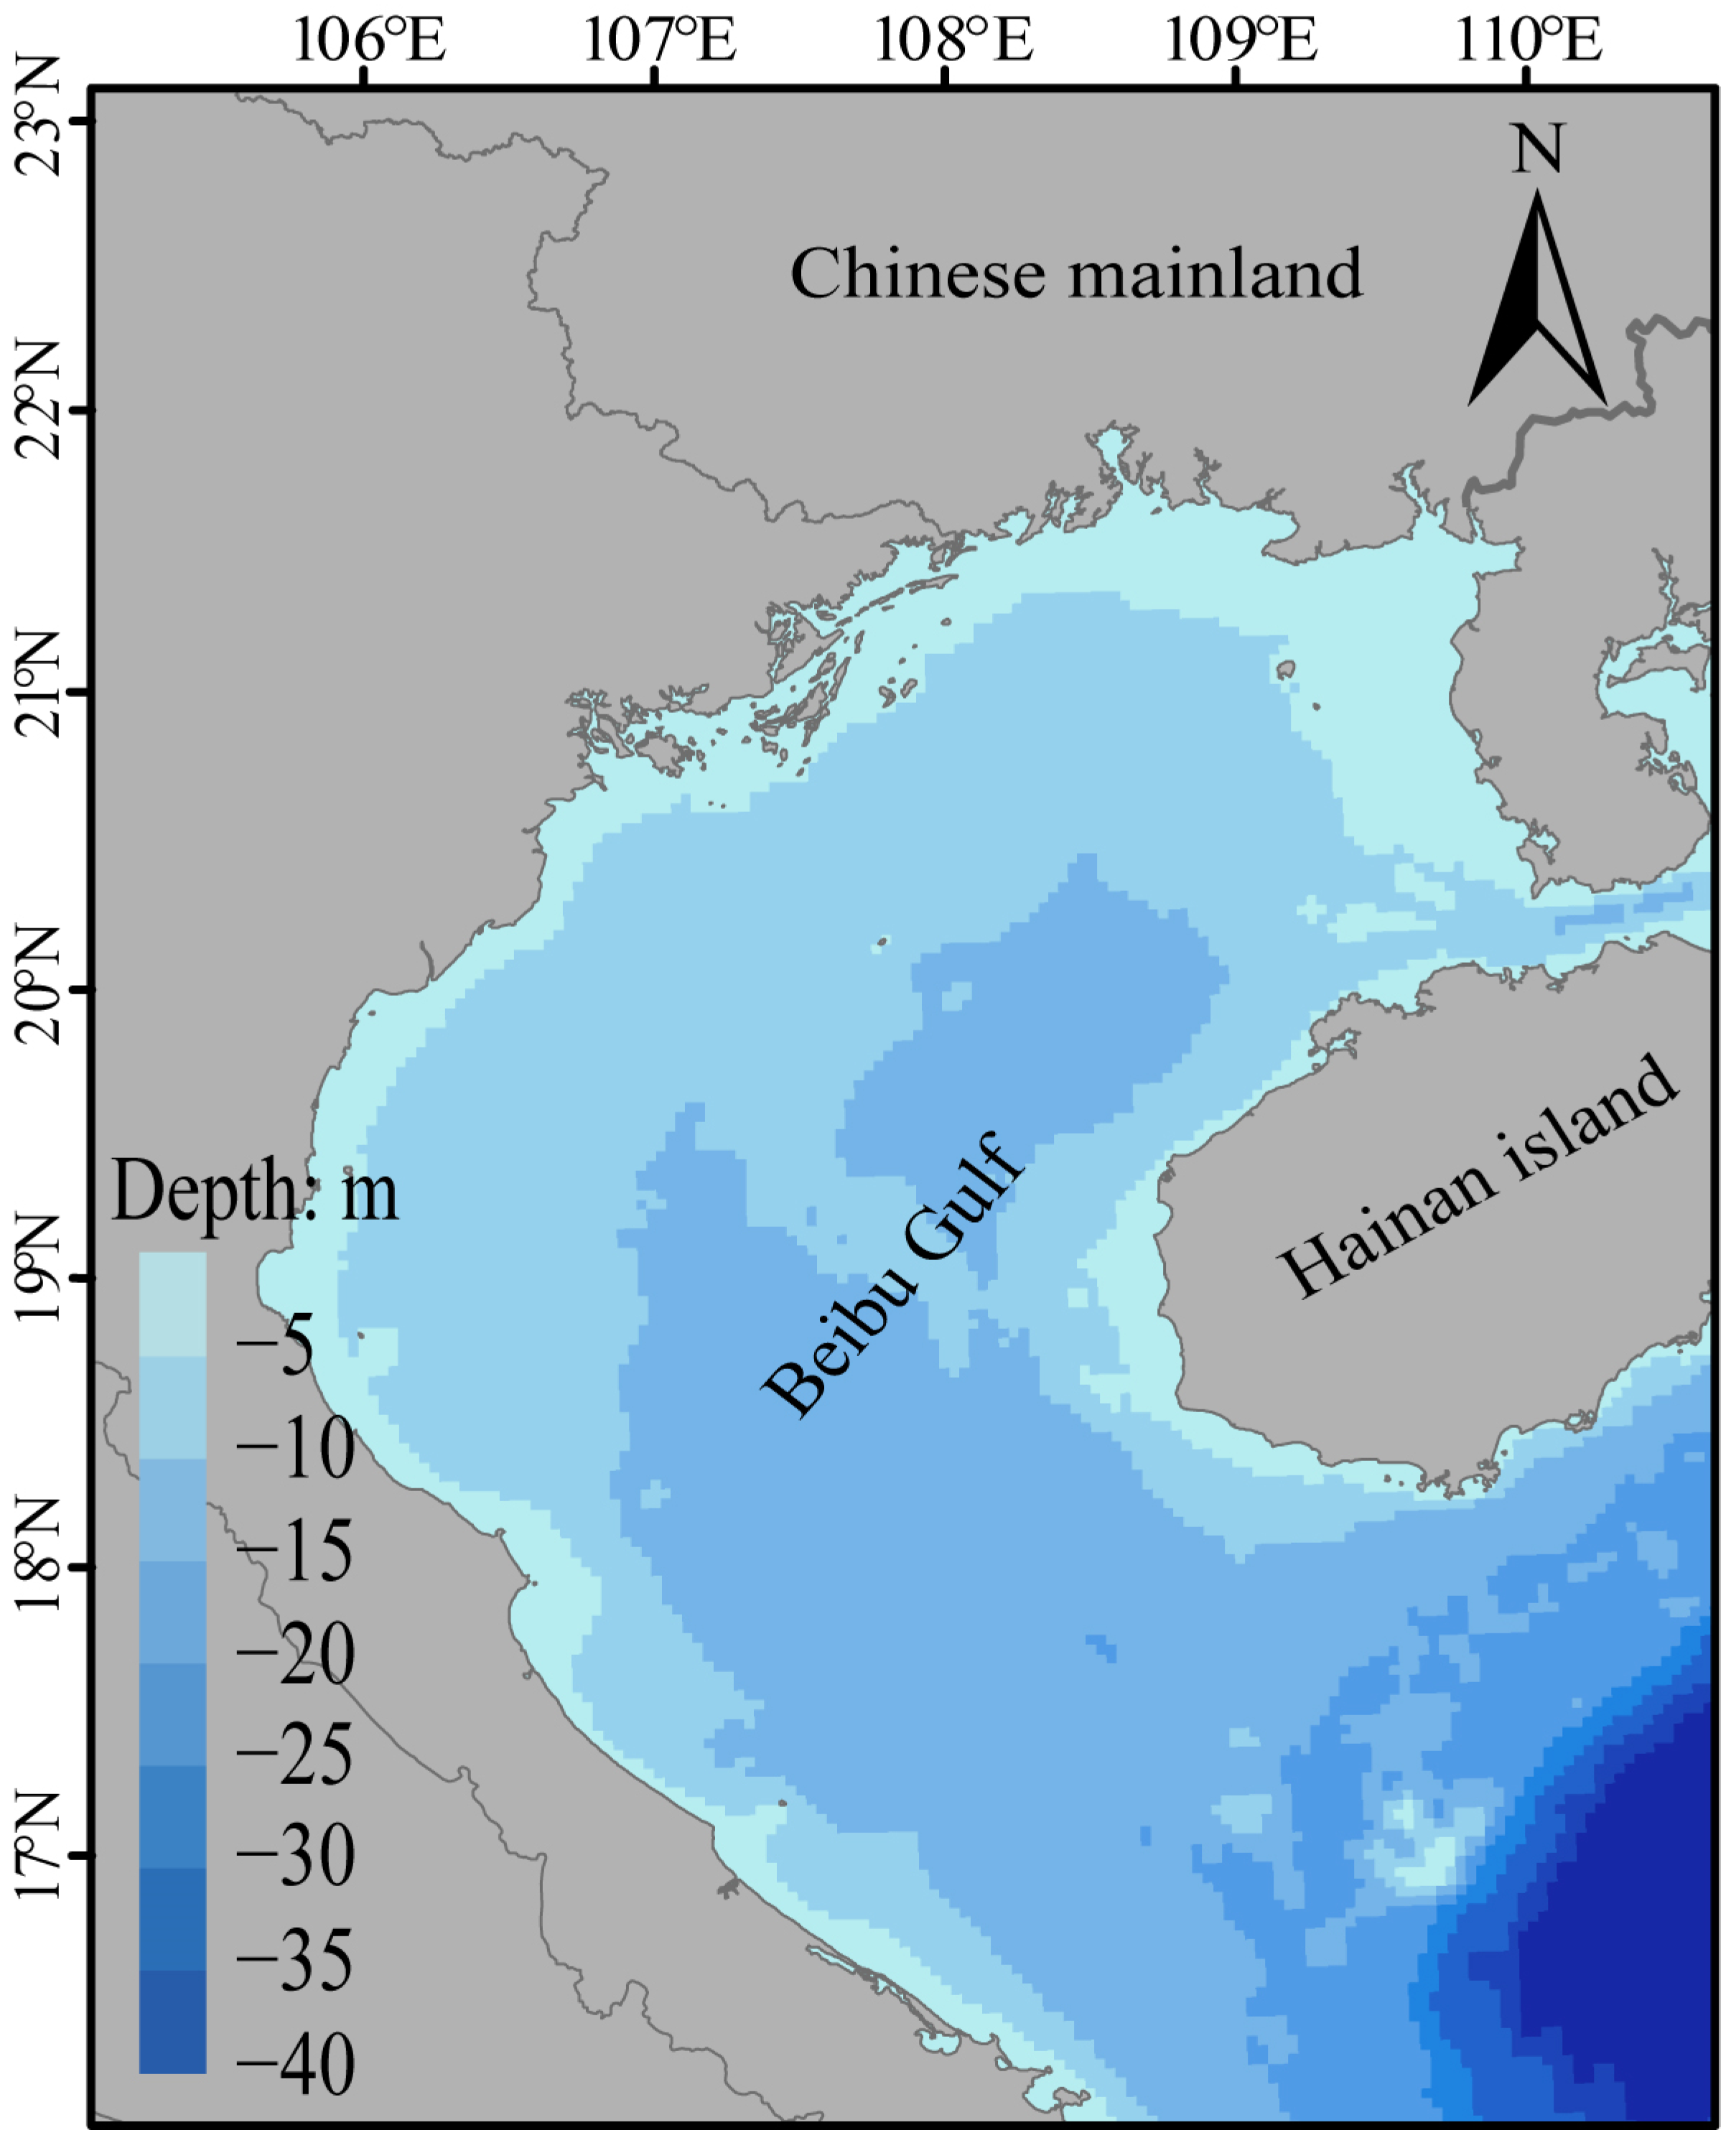
2.1. Data Collection and Collation

The data from 26 voyages were collected through the otter trawl fishery stock survey conducted in the Beibu Gulf during January (withered-water period) and July (high-water period) from 2006 to 2018. Based on the average monthly runoff characteristics, the period from April to October is classified as the withered-water period, while the period from November to March is classified as the high-water period. The spatial distribution range was between 106°–110° E and 17°–22° N. The fish distribution data were collected, sorted, and stored in the CSV format (Figure 1). The SDMtools toolbox in ArcGIS was used to prevent any spatial autocorrelation between the distribution points and avoid their repetition within an area of 1 × 1 km. This reduced the possibility of simulation error in the model. Finally, the accurate distribution points of the major fish catches were obtained (Table 1 and Table S1).

2.2. Acquisition and Processing of Environmental Data

Based on careful consideration of the availability and widespread use of environmental variables in the Beibu Gulf, eight environmental factors were selected for this study: bottom temperature, bottom salinity, bottom light intensity, water current velocity, dissolved oxygen, phosphate content, pH, and primary productivity. The resolution used in this study was 5′ × 5′ (approximately 9.2 × 9.2 km). The environmental data, except for pH, were sourced from Bio-ORACLE (ORACLE (https://bio-oracle.org/, accessed on 1 May 2023). All environmental factors were resampled using ArcGIS to attain a unified resolution of 30″ (approximately 1 × 1 km) and stored in the ASCII format.

2.3. Evaluation of the MaxEnt Model

The MaxEnt model (version 3.4.3, Columbia University, New York, NY, USA) was employed to identify the present and future potential suitable areas for catches of 10 major fish taxa in the Beibu Gulf. The pertinent distribution and environmental data were saved in the CSV and ASCII formats, respectively, and imported to the MaxEnt software. Of the collected data, 25% and 75% were randomly selected as the test and training data, respectively. This process was iterated 10 times, and the average value was calculated to obtain the predictive results of the model. The accuracy of the model was assessed by determining the area under the curve (AUC). An AUC value of 0–1 represents a positive correlation with accuracy. Typically, an AUC of 0.8–0.9 indicates good, whereas 0.9–1 indicates excellent predictive accuracy [21].

2.4. Prediction of Potentially Suitable Areas and Analysis of Major Environmental Factors

ArcGIS (10.4) software was used to convert the predictions into raster data. Abbreviations of technical terms were explained upon their initial use. The actual distribution area serves as the basis for classifying the potentially suitable regions into four groups: unsuitable areas, distribution area ranging from 0 to 0.2; generally suitable areas, from 0.2 to 0.3; moderately suitable areas, from 0.3 to 0.5; and highly suitable areas, from 0.5 to 1.0.

3. Results

3.1. Evaluation of the Model Performance

The evaluation results of the accuracy of the MaxEnt model for catches of 10 major fish taxa in the Beibu Gulf are shown in Table 2. The average AUC value was 0.927 for both withered and high-water periods. Across all model groups, the AUC values exceeded 0.9, signifying high accuracy and reliability in the simulation results. Furthermore, the standard deviation of the 10 models after 10 iterations was less than 0.02, indicating remarkable stability, minimal fluctuations in the simulation outcomes, and excellent overall performance.

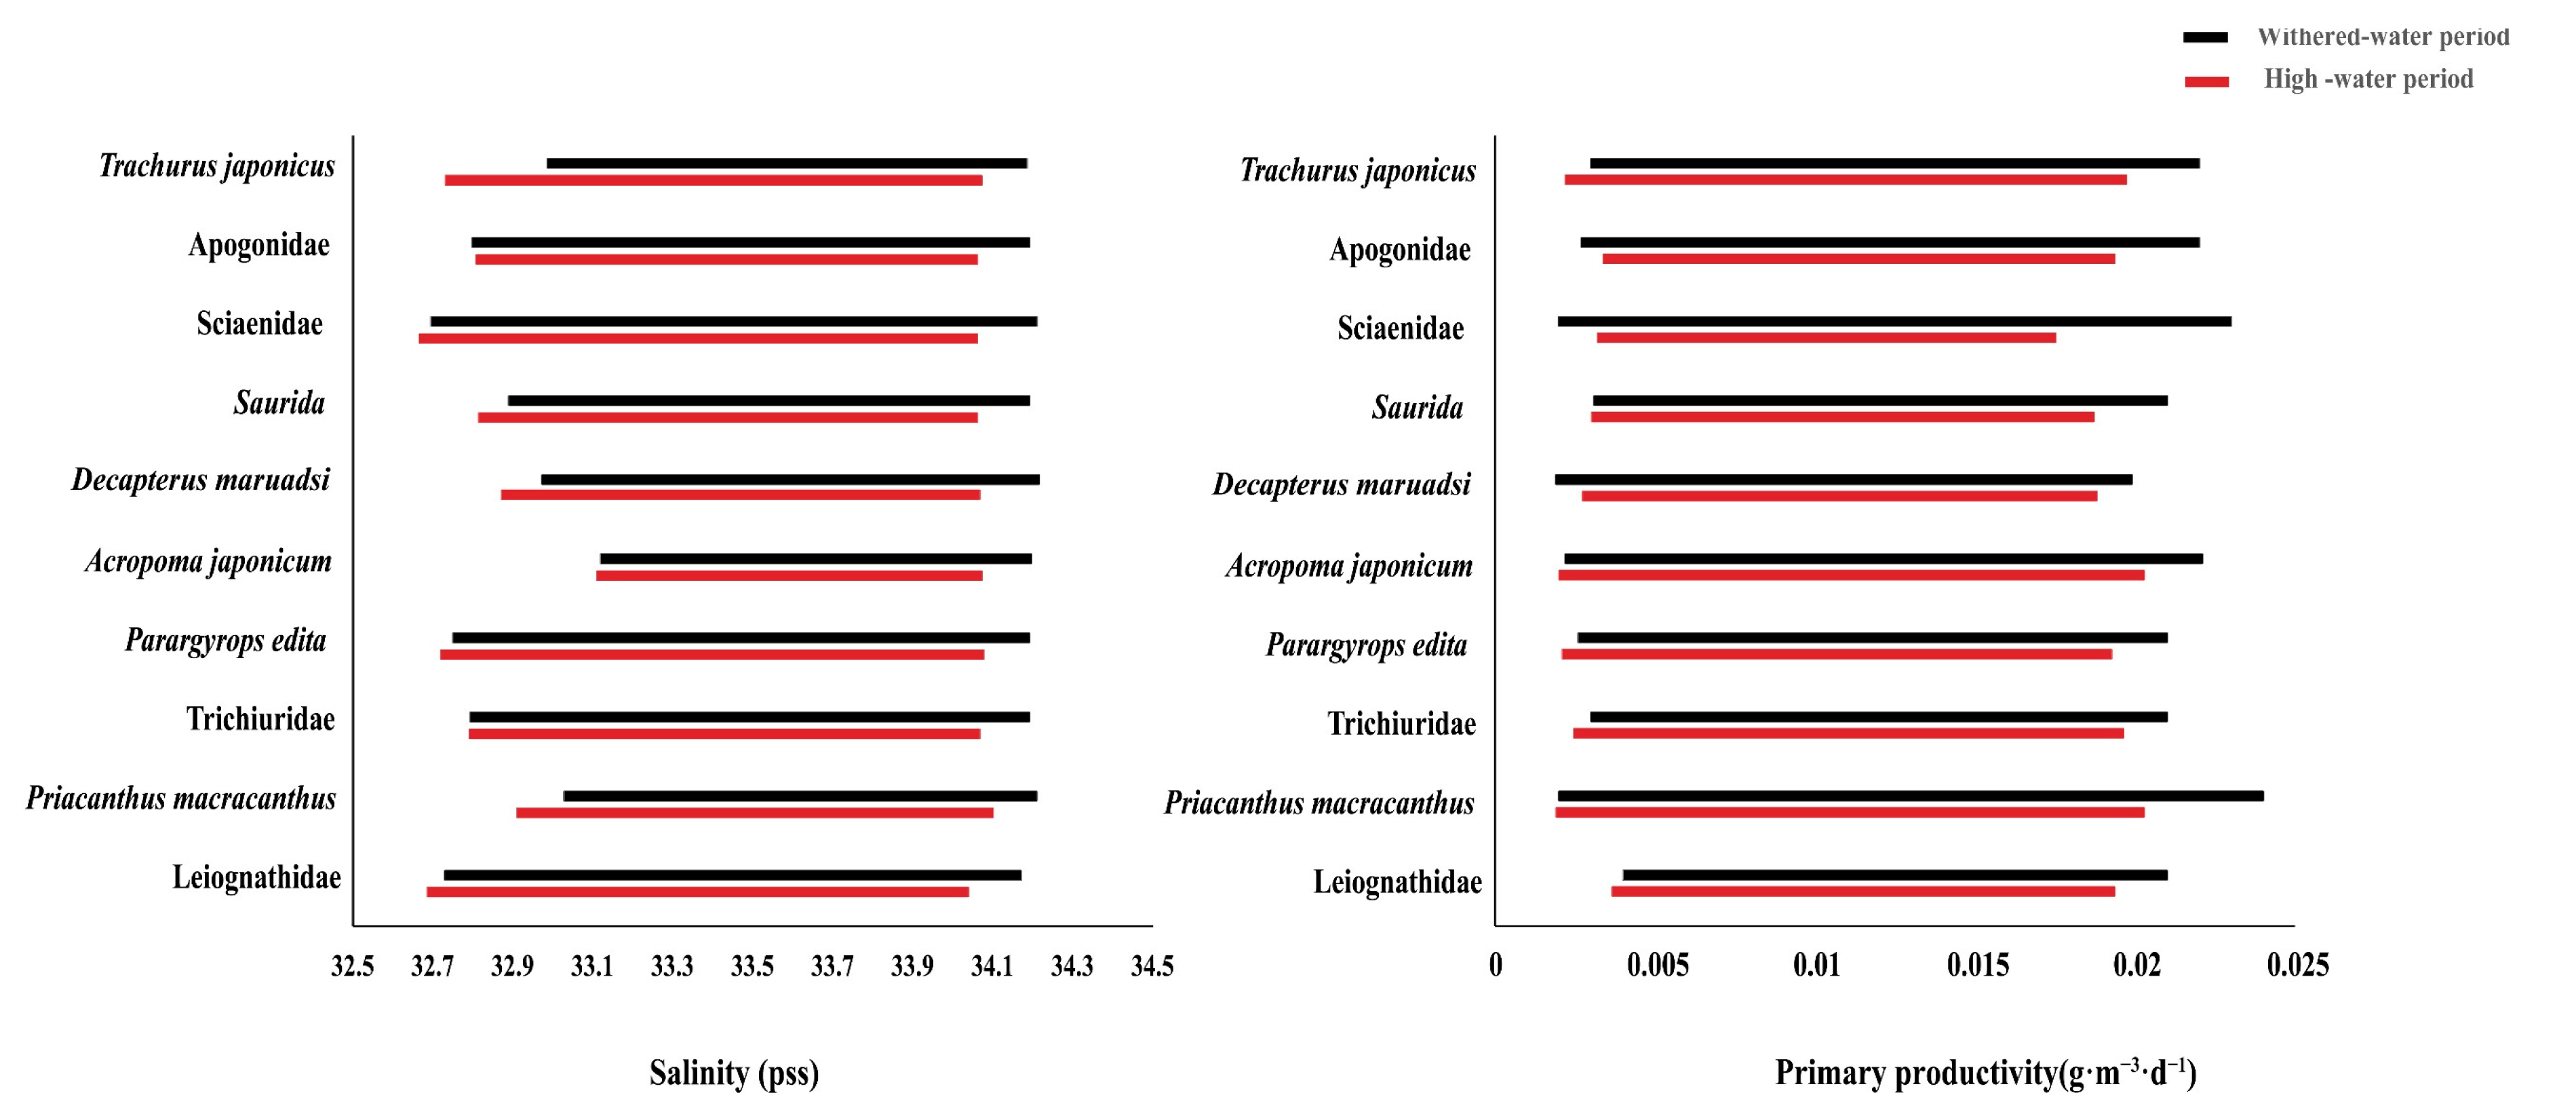
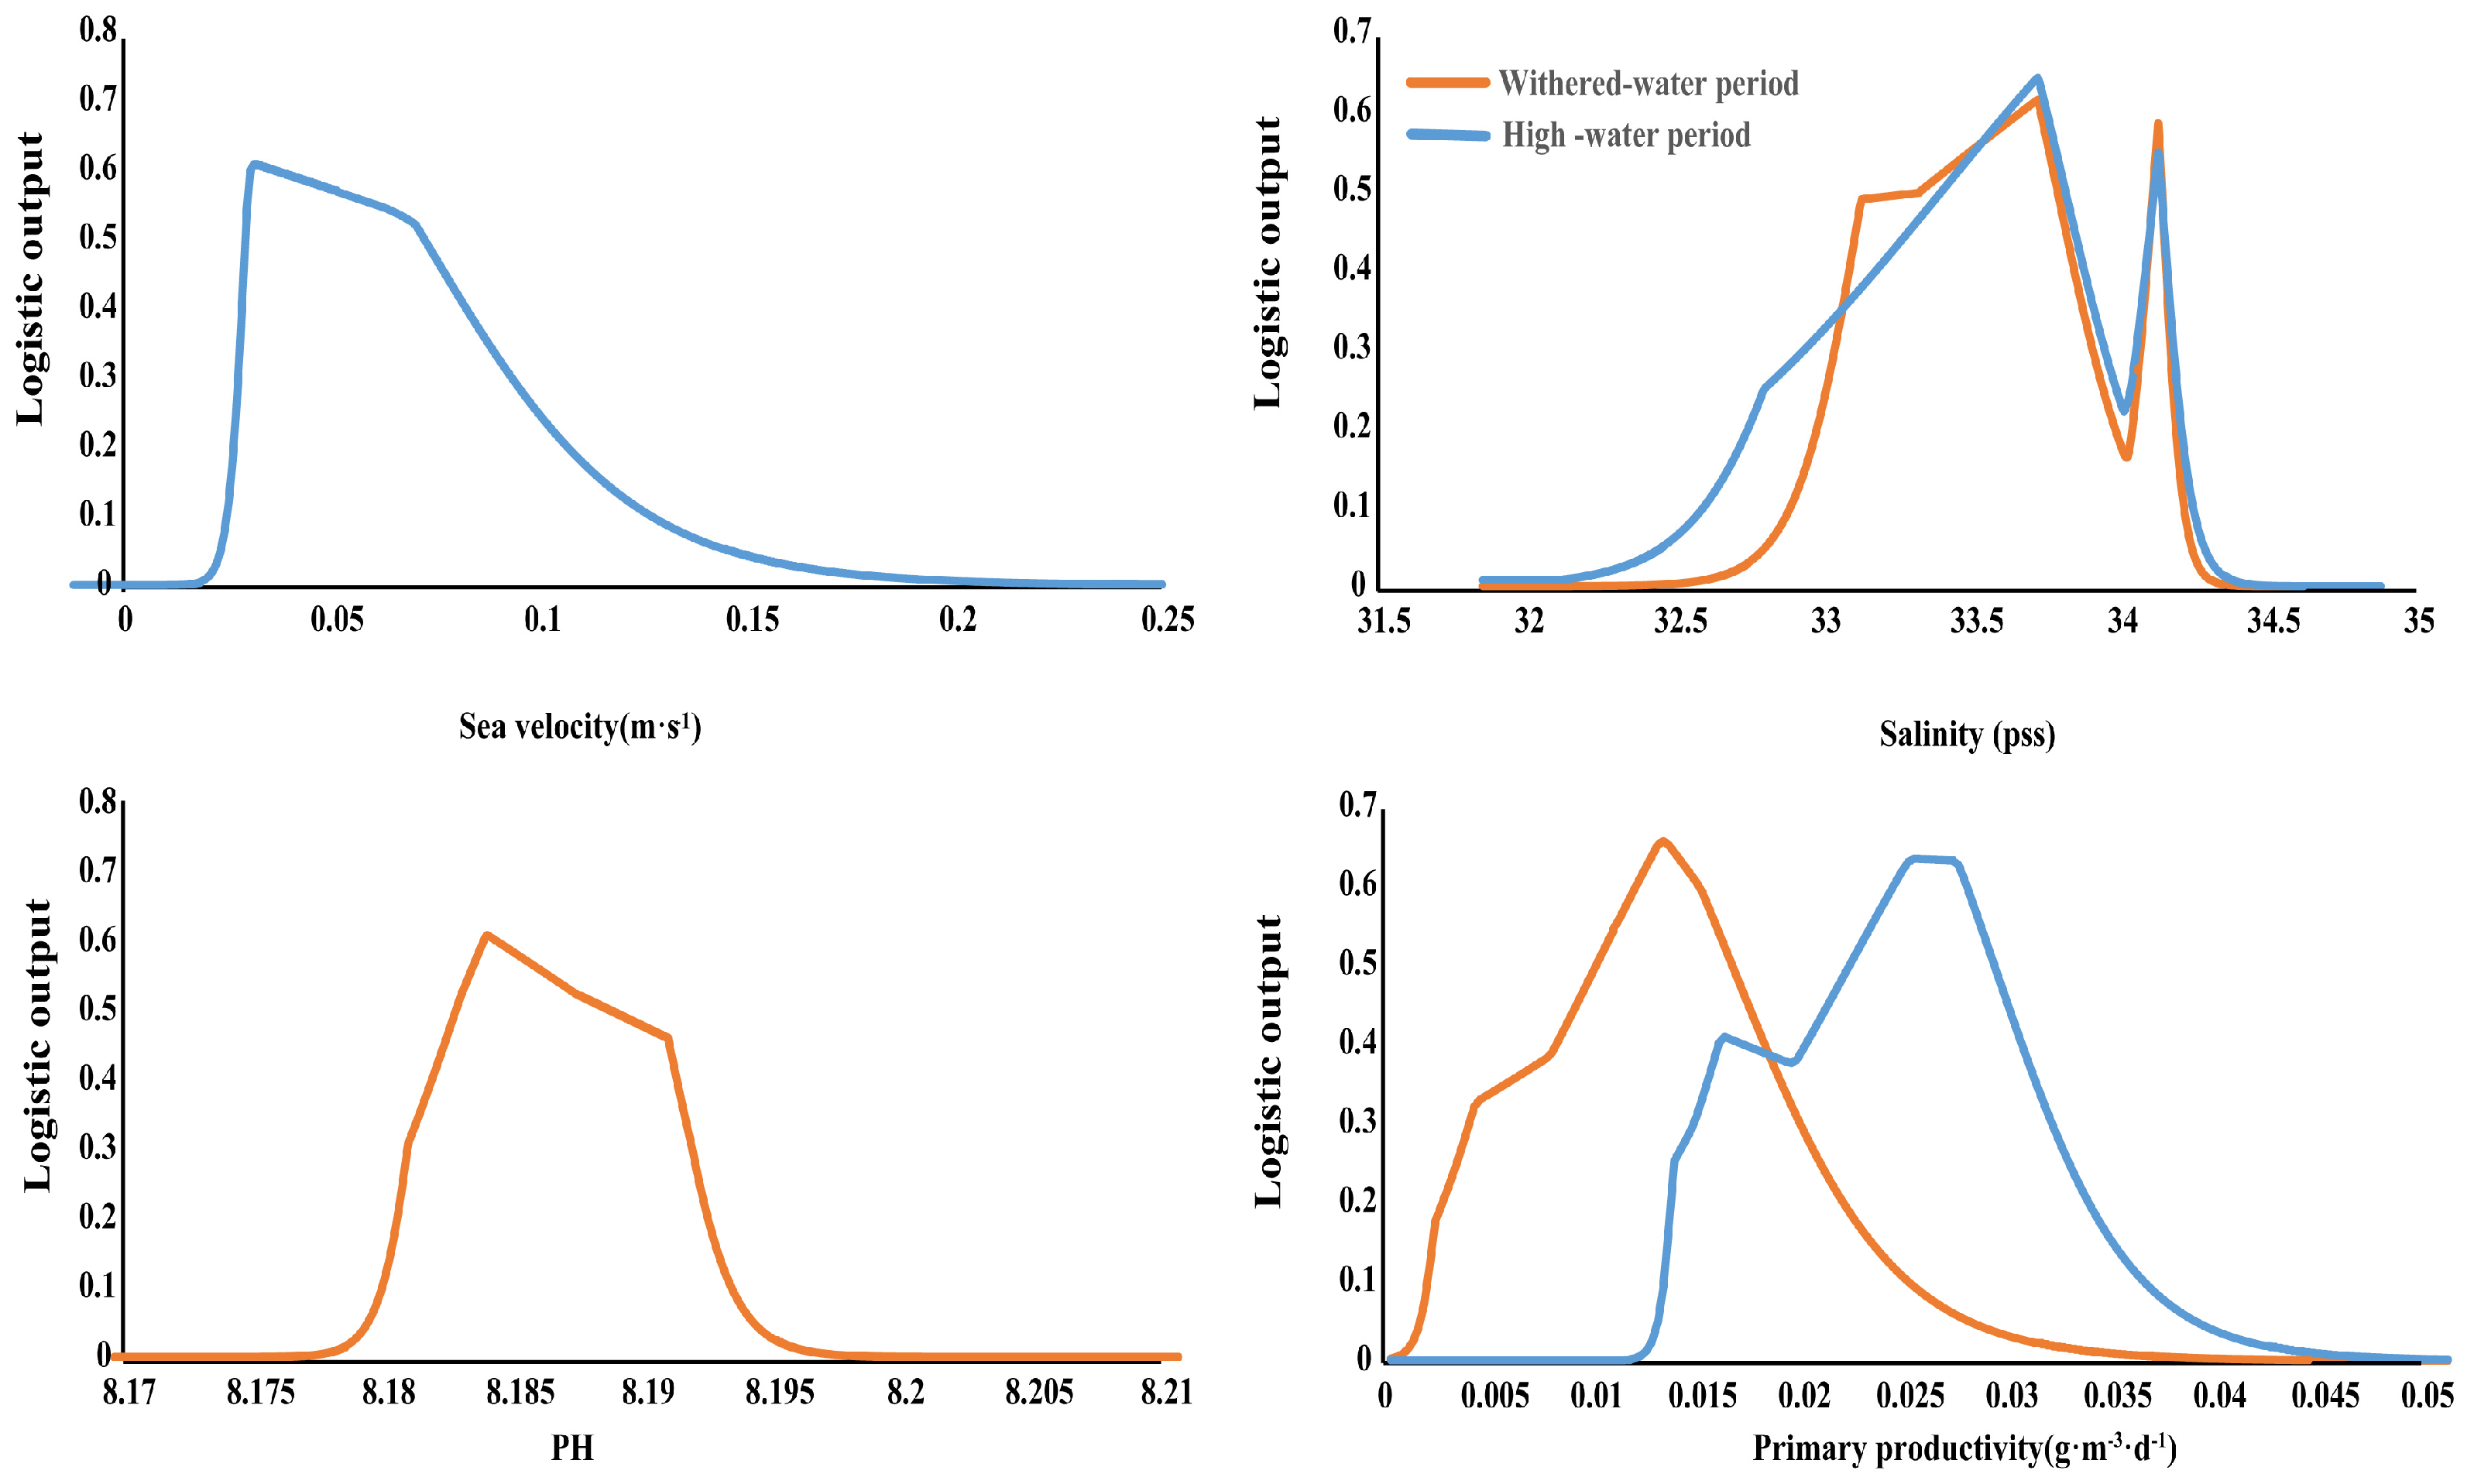
3.2. Dominant Environmental Factors

The response results of catches of 10 major fish taxa in the Beibu Gulf to the major environmental factors are presented. According to the findings from Table 3, salinity emerges as the most crucial factor, contributing significantly to the variation in major fish catches during the withered-water period. Primary productivity comes next, playing a significant role in determining the response of major fish catches.
The environmental factors that demonstrated the highest contribution rate to the response of the major fish catches remained consistent during high and withered-water periods. Therefore, salinity and primary productivity are crucial factors influencing the major fish catches in the Beibu Gulf.
We compared the effects of environmental variables on different taxa and revealed that the dominant factors remained consistent during both withered and high-water periods of pelagic fish. This finding suggests that the same environmental factors affected the fish within a single water layer. The distribution of Acropoma japonicum and Sciaenidae during the high-water period of demersal fish was primarily influenced by pH, whereas that of Priacanthus macracanthus and Apogonidae was influenced by variations in primary productivity. In addition, the ecological niches of salinity and primary productivity in the catches of 10 major fish taxa in the Beibu Gulf are shown in Figure 2. The salinity and primary productivity niches of A. japonicum and Sciaenidae exhibited the narrowest range, respectively, during the withered-water period. The results of niche analysis during the high-water period were consistent with those obtained during the withered-water period.
The predicted pattern in the potential fitness probability (≥0.2) and environmental changes was determined based on the response curve of environmental variables (Figure 3). Using the economically important fish T. japonicus as a case study, it was observed that when the dominant environmental factor/salinity, affecting T. japonicus during the withered-water period reached a concentration of 32.97 psu, the minimal optimal concentration was achieved. The salinity was directly proportional to the likelihood of fitness. Finally, when the salinity reached 33.73 psu, the probability of fitness achieved its peak value of 0.62, and at 34.19 psu, the maximum survivable concentration was attained. Therefore, the potentially suitable salinity range for T. japonicus during the withered-water period was 32.97–34.19 psu. Furthermore, based on the response curve of T. japonicus to primary productivity, it is apparent that a primary productivity range of 0.003–0.022 g·m−3·d−1 represented a potentially suitable area for T. japonicus, with the highest probability for optimal fitness observed at 0.013 g·m−3·d−1. Based on its response curve to primary productivity, mackerel could have a potentially suitable area in the range of 0.003–0.022 g·m−3·d−1, with the highest probability of suitability of 0.6 achieved at 0.013 g·m−3·d−1.
The salinity levels suitable for T. japonicus were 32.75–34.20 psu during the high-water period. The optimum salinity was 33.72 psu, resulting in the highest probability of potential suitability at 0.62. The appropriate pH range was 8.181–8.193, with the highest potential fitness probability of 0.61 at the optimum pH of 8.184. The ideal range of primary productivity was 0.003–0.022 g·m−3·d−1, with the highest potential fitness probability of 0.63 at the optimum primary productivity of 0.013 g·m−3·d−1.

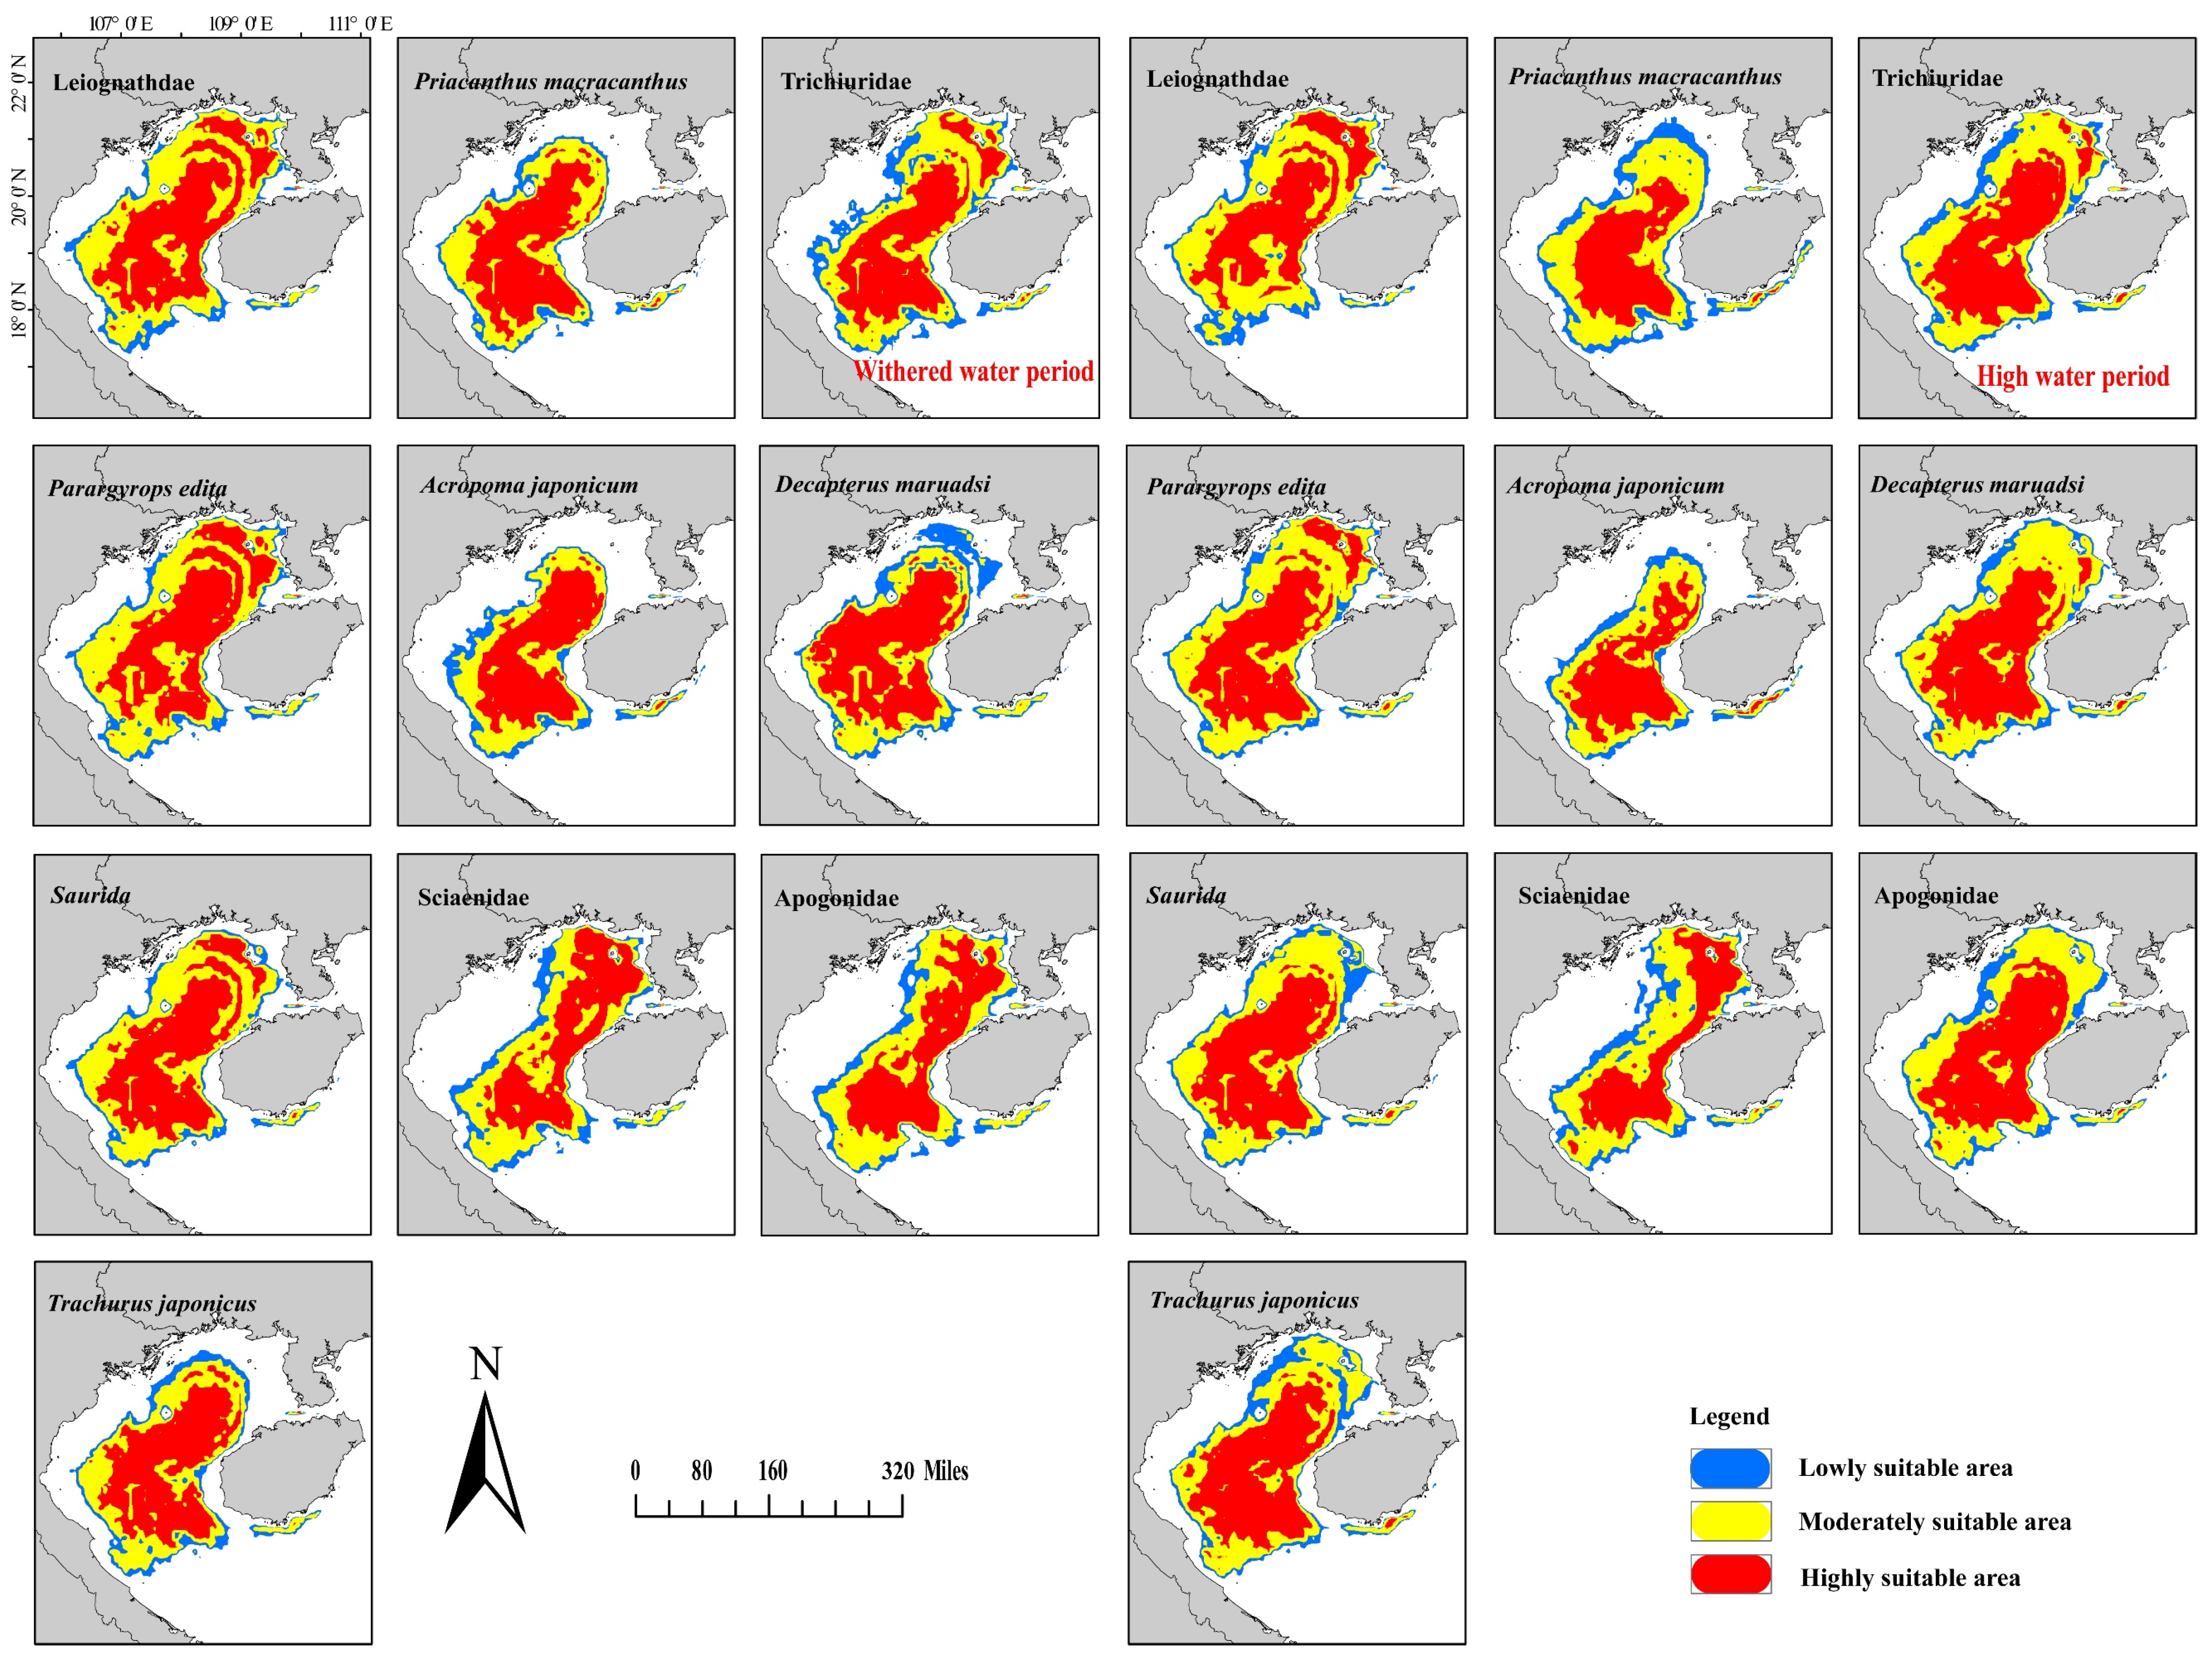
3.3. Distribution of Potentially Suitable Areas for Different Flood Seasons

The potentially suitable areas of the major fish catches in the withered and high-water periods as per the MaxEnt model are shown in Figure 4, the overall distribution range of which was between 106°30′–109°45′ and 17°30′–20°45′. The demersal fish retreated from the northeast to the southwest, while the pelagic fish moved closer to the shore in the northeast direction. As a result, the spatial distribution varied.
The potentially suitable areas for the major fish catches demonstrated a trend of expansion from the outside to inside during the withered-water period, and the appropriate areas shifted to the mouth of the bay and Hainan Island. Although the trend of distribution areas during the high-water period was similar to that during the withered-water period, the changes in the distribution gradient were inconsistent. The total area of potentially suitable regions during the withered-water period was lower than that in the high-water period (Table 4). The areas of Sciaenidae, Leiognathidae, and Saurida increased during the withered-water period, with the highest rate of change of 6.22% observed in Sciaenidae. Conversely, the area of T. japonicus increased remarkably during the high-water period, with the highest rate of change reaching 10.92%. These findings suggest that the high-water period may expand the range of suitable habitats for significant catches that are more suited to the Beibu Gulf’s habitat conditions.

4. Discussion

4.1. Relationships between the Major Fish Catches and Environmental Factors

The simulation results of catches of 10 major fish taxa in the Beibu Gulf revealed that their environmentally suitable areas differed. The spatial distribution was driven by various dominant environmental factors, but the factors affecting different fish taxa remained consistent. Salinity was the dominant factor influencing the distribution of fish habitats in the Beibu Gulf, and primary productivity was an important influencing factor. However, the effects of pH and water current velocity were minimal.
Seasonal variations in salinity are related to river inputs, topography, and water masses [22,23]. The Beibu Gulf is a semi-enclosed bay surrounded by land on three sides, with three different water systems: coastal, offshore, and mixed waters. The coastal, offshore, and mixed waters are observed during the high-water period, whereas only coastal and mixed waters are observed during the withered-water period [24]. The characteristics of each water system were different. The intensity of coastal water was strong in summer and fall but weak in winter and spring; the intensity of open seawater was strong in summer and weak intensity in winter. It is characterized by high temperature and salinity, and the mixed water was characterized by low temperature and salinity [25]. Owing to seasonal variations, the strength of the water system also varies. The intensity of the coastal water weakens in spring, and the coastal water retreats to the inner coast of the bay under the influence of the outer sea and mixed waters, which not only alters the salinity of the seawater but also drives the flow of nutrients [26]. Therefore, the resulting salinity level is the dominant factor affecting the distribution of suitable areas. In addition, primary productivity requires inorganic nutrients, which can be used as indicators to assess environmental quality and are closely related to the abundance of phytoplankton [27]. Being located in tropical and subtropical regions, the Beibu Gulf experiences temperatures that are conducive to the survival of phytoplankton and the maintenance of photosynthetic enzyme activities. This leads to a high and prolonged conversion of inorganic matter into organic matter at a significant rate of photosynthesis. Therefore, primary productivity is a crucial factor that influences the habitats of fish species. Recent studies on the relationship between fish and environmental factors in the Beibu Gulf have indicated that salinity is a crucial factor involved in fish migration [23,28], thus highlighting the importance of salinity and the accuracy of the results.

4.2. Applicability of the Prediction of Potentially Suitable Areas

The total area of the potentially suitable regions for the major fish catches and that of the withered and high-water periods determined using the MaxEnt model were compared. The total area was observed to be enhanced in the high-water period than in the withered-water period (Table 4), as most fish in the Beibu Gulf spawn in the spring [24]. Replenishing fish stocks during the flood season directly leads to a significant increase in their resources. Fish communities are highly dependent on the water temperature and changes, which cause fluctuations in biomass [29,30]. A decrease in water temperature affects certain deep water and migratory fish, which causes changes in clustering, resulting in a reduction in the catch during the withered-water period [31]. In addition, a seasonal change in the total area also reflects the positive effects of the moratorium on fishing on fish protection, during which the fish food was sufficient, no damage to habitat was caused by overfishing, the disturbance in marine ecology was reduced, and fishery resources were restored to a great extent [32,33].
The predicted distribution areas for catches of 10 major fish taxa in the Beibu Gulf were consistent with their actual distribution areas. The potentially suitable sites for major fish catches during the withered and high-water periods were distributed between 106°30′–109°45′ and 17°30′–20°45′. The outer edges of these areas were closer to the mouth of the Beibu Gulf and the western edge of Hainan Island, consistent with the dominance of certain fish species in the center of the typical fishing area. Population survival stabilized in the typical fishing area and the western edge of the Hainan Island [34]. This study showed that P. edita was more suitable for survival in the southeastern than in the southwestern region during the high-water period. Additionally, the habitat was more suitable for survival in the middle of the bay during the withered-water period, consistent with the spatial distribution of P. edita in the Beibu Gulf [35]. T. japonicus was primarily spatially distributed in the Beibu Gulf along the western edge of Hainan Island and the mouth of the gulf [36]. This study reveals that T. japonicus was predominantly distributed in the western, central, and bay-mouth regions of Hainan Island, aligning with the previous outcomes.
The predictive results of this study were generally consistent with previous research findings and were distributed in accordance with the suitability. They illustrated the distribution of suitable areas for various major fish catches, which were broader in scope than those of earlier studies due to the availability of more comprehensive survey data. The augmented accuracy of the model further improved the predictions.

4.3. Outlook

Based on the prediction of the habitat distribution of catches of 10 major fish taxa in the Beibu Gulf, we determined that the primary fish catch was primarily concentrated in the western, central, and bay estuaries of Hainan Island. However, the combination of climate change and overfishing has resulted in a decline in fish resources and a gradual reduction in biodiversity [37,38,39]. This has the potential to alter the spatial distribution as it affects the community structure and agglomeration effect [40,41,42]. To protect and restore fish stocks and manage fishery ecosystems in the Beibu Gulf, the highly suitable areas during the withered and high-water periods can be superimposed over the gradient-suitable area of the MaxEnt model. The overlapping regions can be divided into protected areas, which provide a basis for formulating relevant policies to protect and restore fish stocks and manage fishery ecosystems in the Beibu Gulf. It is important to note that with the increase in climate warming, the spatial distribution of fish stocks will continue to change in the future. Therefore, it is crucial to thoroughly examine and assess the current effectiveness of the protected areas in order to adapt their function accordingly. However, in the future, various CO2 emission strategies may be developed to predict changes in the spatial distribution of potentially suitable areas under different climatic conditions. Additionally, the spatial distribution of fish in the Beibu Gulf can be compared with the outcomes of this study, and the protected areas may be reclassified based on the predicted results.

5. Conclusions

Overall, the MaxEnt model exhibits excellent performance in evaluation, highlighting a clear tendency of potential habitat migration from the outer margin to the central areas. Salinity emerged as the principal factor influencing migration patterns during both periods. Notably, the salinity niche of A. japonicum and the primary productivity niche of Sciaenidae were identified as the most influential factors shaping their distribution. The demersal fish exhibited a retreat from the northeast to the southwest, while the pelagic fish moved closer to the shore in a northeastern direction. Additionally, the spatial distribution of fish taxa showed significant variability. During the withered-water period, there was an increase in the areas occupied by Sciaenidae, Leiognathidae, and Saurida, with Sciaenidae showing the highest rate of change at 6.22%. The area occupied by T. japonicus significantly increased during the high-water period, with the highest rate of change reaching 10.92%. The total area of potentially suitable regions in the high-water period exceeded that of the withered-water period. These findings indicate that the distribution of potentially suitable habitats varies across different flood periods, suggesting that the high-water period may expand the range of suitable habitats for significant catches in the Beibu Gulf. Therefore, it is crucial to anticipate the potential fish habitats in the Beibu Gulf and clarify their spatial distribution patterns.

Supplementary Materials

The following supporting information can be downloaded at https://www.mdpi.com/article/10.3390/fishes8110559/s1, Table S1: Composition of major catch fish catches in the Beibu Gulf from 2006 to 2018.

Author Contributions

M.L.: methodology, data processing, and writing the manuscript. X.W. and F.D.: reviewing, editing, and funding acquisition. S.P., D.S., L.W., Y.W., P.C. and Y.Q.: conceptualization and reviewing. All authors have read and agreed to the published version of the manuscript.

Funding

This work was supported by Hainan Provincial Natural Science Foundation of China (422MS156), Science and Technology Basic Resources Investigation Program of China (2018FY100105, 2017FY201405), Central Public-Interest Scientific Institution Basal Research Fund, South China Sea Fisheries Research Institute, CAFS (NO. 2022TS02) and Guangdong Key Areas R&D Program Projects (2020B1111030002).

Institutional Review Board Statement

The study was conducted in accordance with the Declaration of Helsinki, and approved by the Committee on Laboratory Animal Welfare and Ethics of South China Sea Fisheries Research Institute (Approval code: nhdf 2023-11, date: 13 November 2023).

Informed Consent Statement

Not applicable.

Data Availability Statement

The raw data supporting the conclusions of this article will be made available by the authors. Further inquiries can be directed to the corresponding author.

Acknowledgments

We thank Hendrick H for editing a draft of this manuscript.

Conflicts of Interest

The authors declare that the research was conducted in the absence of any commercial or financial relationships that could be construed as a potential conflict of interest.

References

  1. Hoegh-Guldberg, O.; Bruno, J.F. The Impact of Climate Change on the World’s Marine Ecosystems. Science 2010, 328, 1523–1528. [Google Scholar] [CrossRef] [PubMed]
  2. Polansky, L.; Newman, K.B.; Nobriga, M.L.; Mitchell, L. Spatiotemporal Models of an Estuarine Fish Species to Identify Patterns and Factors Impacting Their Distribution and Abundance. Estuaries Coasts 2018, 41, 572–581. [Google Scholar] [CrossRef]
  3. Navarrete, S.A.; Barahona, M.; Weidberg, N.; Broitman, B.R. Climate change in the coastal ocean: Shifts in pelagic productivity and regionally diverging dynamics of coastal ecosystems. Proc. Biol. Sci. 2022, 289, 20212772. [Google Scholar] [CrossRef] [PubMed]
  4. Wang, L.; Zhang, Z.; Lin, L.; Peng, X.; Lin, L.; Kang, B. Redistribution of the Lizardfish Harpadon Nehereus in Coastal Waters of China Due to Climate Change. Hydrobiologia 2021, 848, 4919–4932. [Google Scholar] [CrossRef]
  5. Yin, F.; Liu, Q.; Chen, X. Evaluation of Biological Reference Points of Two Important Fishery Resources in the East China Sea. J. Mar. Sci. Eng. 2023, 11, 121. [Google Scholar] [CrossRef]
  6. Cai, L.; Fu, S.; Yang, J.; Zhou, X. Distribution of Meiofaunal Abundance in Relation to Environmental Factors in Beibu Gulf, South China Sea. Acta Oceanol. Sin. 2012, 31, 92–103. [Google Scholar] [CrossRef]
  7. Salvetat, J.; Bez, N.; Habasque, J.; Lebourges-Dhaussy, A.; Lopes, C.; Roudaut, G.; Simier, M.; Travassos, P.; Vargas, G.; Bertrand, A. Comprehensive Spatial Distribution of Tropical Fish Assemblages from Multifrequency Acoustics and Video Fulfils the Island Mass Effect Framework. Sci. Rep. 2022, 12, 8787. [Google Scholar] [CrossRef]
  8. Worm, B.; Hilborn, R.; Baum, J.K.; Branch, T.A.; Collie, J.S.; Costello, C.; Fogarty, M.J.; Fulton, E.A.; Hutchings, J.A.; Jennings, S.; et al. Rebuilding Global Fisheries. Science 2009, 325, 578–585. [Google Scholar] [CrossRef]
  9. Degenford, J.H.; Liang, D.; Bailey, H.; Hoover, A.L.; Zarate, P.; Azócar, J.; Devia, D.; Alfaro-Shigueto, J.; Mangel, J.C.; de Paz, N.; et al. Using Fisheries Observation Data to Develop a Predictive Species Distribution Model for Endangered Sea Turtles. Conserv. Sci. Pract. 2021, 3, e349. [Google Scholar] [CrossRef]
  10. Shapiro, K. Climate and coastal habitat change: A recipe for a dirtier ocean. Mar. Pollut. Bull. 2012, 64, 1079–1080. [Google Scholar] [CrossRef]
  11. Zhu, Z.; Wei, H.; Guan, Y.; Zhang, L.; Sun, P.; Zhang, Q. Spatial and Seasonal Characteristics of Dissolved Heavy Metals in the Seawater of Beibu Gulf, the Northern South China Sea. Front. Mar. Sci. 2022, 9, 996202. [Google Scholar] [CrossRef]
  12. Wang, Y.; Yao, L.; Chen, P.; Yu, J.; Wu, Q. Environmental Influence on the Spatiotemporal Variability of Fishing Grounds in the Beibu Gulf, South China Sea. J. Mar. Sci. Eng. 2020, 8, 957. [Google Scholar] [CrossRef]
  13. Zhang, K.; Guo, J.; Xu, Y.; Jiang, Y.; Fan, J.; Xu, S.; Chen, Z. Long-Term Variations in Fish Community Structure under Multiple Stressors in a Semi-Closed Marine Ecosystem in the South China Sea. Sci. Total Environ. 2020, 745, 140892. [Google Scholar] [CrossRef] [PubMed]
  14. Wang, Y.; Zhou, X.; Chen, J.; Xie, B.; Huang, L. Climate-Induced Habitat Suitability Changes Intensify Fishing Impacts on the Life History of Large Yellow Croaker (Larimichthys crocea). Ecol. Evol. 2022, 12, e9342. [Google Scholar] [CrossRef]
  15. Ramírez, F.; Shannon, L.J.; Angelini, R.; Steenbeek, J.; Coll, M. Overfishing Species on the Move May Burden Seafood Provision in the Low-Latitude Atlantic Ocean. Sci. Total Environ. 2022, 836, 155480. [Google Scholar] [CrossRef]
  16. Yan, H.F.; Kyne, P.M.; Jabado, R.W.; Leeney, R.H.; Davidson, L.N.K.; Derrick, D.H.; Finucci, B.; Freckleton, R.P.; Fordham, S.V.; Dulvy, N.K. Overfishing and Habitat Loss Drive Range Contraction of Iconic Marine Fishes to near Extinction. Sci. Adv. 2021, 7, eabb6026. [Google Scholar] [CrossRef]
  17. Elith, J.; Graham, C.; Valavi, R.; Abegg, M.; Bruce, C.; Ford, A.; Guisan, A.; Hijmans, R.J.; Huettmann, F.; Lohmann, L.; et al. Presence-Only and Presence-Absence Data for Comparing Species Distribution Modeling Methods. Biodivers. Inform. 2020, 15, 69–80. [Google Scholar] [CrossRef]
  18. Naimi, B.; Araújo, M.B. Sdm: A reproducible and extensible R platform for species distribution modelling. Ecography 2016, 39, 368–375. [Google Scholar] [CrossRef]
  19. Xing, Y.; Wang, L.; Kiu, M.; Zhao, L.; Kang, B. Global prediction of spatial distribution and migratory corridors of green turtles based on species distribution modeling. J. Fish. Sci. China 2021, 28, 1337–1345. [Google Scholar]
  20. Wang, L.; Kerr, L.A.; Record, N.R.; Bridger, E.; Tupper, B.; Mills, K.E.; Armstrong, E.M.; Pershing, A.J. Modeling Marine Pelagic Fish Species Spatiotemporal Distributions Utilizing a Maximum Entropy Approach. Fish. Oceanogr. 2018, 27, 571–586. [Google Scholar] [CrossRef]
  21. Yang, W.; Hu, W.; Chen, B.; Tan, H.; Su, S.; Ding, L.; Dong, P.; Yu, W.; Du, J. Impact of Climate Change on Potential Habitat Distribution of Sciaenidae in the Coastal Waters of China. Acta Oceanol. Sin. 2023, 42, 59–71. [Google Scholar] [CrossRef]
  22. Guo, J.; Wang, Y.; Lai, J.; Pan, C.; Wang, S.; Fu, H.; Zhang, B.; Cui, Y.; Zhang, L. Spatiotemporal Distribution of Nitrogen Biogeochemical Processes in the Coastal Regions of Northern Beibu Gulf, South China Sea. Chemosphere 2020, 239, 124803. [Google Scholar] [CrossRef] [PubMed]
  23. Feng, Y.; Shi, H.; Hou, G.; Zhao, H.; Dong, C. Relationships between Environmental Variables and Spatial and Temporal Distribution of Jack Mackerel (Trachurus japonicus) in the Beibu Gulf, South China Sea. PeerJ 2021, 9, e12337. [Google Scholar] [CrossRef] [PubMed]
  24. Lao, Q.; Zhang, S.; Li, Z.; Chen, F.; Zhou, X.; Jin, G.; Huang, P.; Deng, Z.; Chen, C.; Zhu, Q.; et al. Quantification of the Seasonal Intrusion of Water Masses and Their Impact on Nutrients in the Beibu Gulf Using Dual Water Isotopes. J. Geophys. Res. Oceans. 2022, 127, e2021JC018065. [Google Scholar] [CrossRef]
  25. Chen, B.; Xu, X.; Jefferson, T.A.; Olson, P.A.; Qin, Q.; Zhang, H.; He, L.; Yang, G. Conservation Status of the Indo-Pacific Humpback Dolphin (Sousa chinensis) in the Northern Beibu Gulf, China. Adv. Mar. Biol. 2016, 73, 119–139. [Google Scholar]
  26. Pessanha, A.L.M.; Araújo, F.G. Spatial, Temporal and Diel Variations of Fish Assemblages at Two Sandy Beaches in the Sepetiba Bay, Rio de Janeiro, Brazil. Coast. Shelf Sci. 2003, 57, 817–828. [Google Scholar] [CrossRef]
  27. Sharitt, C.A.; González, M.J.; Williamson, T.J.; Vanni, M.J. Nutrient Excretion by Fish Supports a Variable but Significant Proportion of Lake Primary Productivity over 15 Years. Ecology 2021, 102, e03364. [Google Scholar] [CrossRef]
  28. Jaureguizar, A.J.; Menni, R.; Guerrero, R.; Lasta, C. Environmental Factors Structuring Fish Communities of the Río de La Plata Estuary. Fish. Res. 2004, 66, 195–211. [Google Scholar] [CrossRef]
  29. Begum, M.; Masud, M.M.; Alam, L.; Mokhtar, M.B.; Amir, A.A. The Impact of Climate Variables on Marine Fish Production: An Empirical Evidence from Bangladesh Based on Autoregressive Distributed Lag (ARDL) Approach. Environ. Sci. Pollut. Res. Int. 2022, 29, 87923–87937. [Google Scholar] [CrossRef]
  30. van der Sleen, P.; Zuidema, P.A.; Morrongiello, J.; Ong, J.L.J.; Rykaczewski, R.R.; Sydeman, W.J.; Di Lorenzo, E.; Black, B.A. Interannual Temperature Variability Is a Principal Driver of Low-Frequency Fluctuations in Marine Fish Populations. Commun. Biol. 2022, 5, 28. [Google Scholar] [CrossRef]
  31. Colombano, D.D.; Carlson, S.M.; Hobbs, J.A.; Ruhi, A. Four Decades of Climatic Fluctuations and Fish Recruitment Stability across a Marine-Freshwater Gradient. Glob. Chang. Biol. 2022, 28, 5104–5120. [Google Scholar] [CrossRef] [PubMed]
  32. Tian, H.; Liu, Y.; Tian, Y.; Jing, Y.; Liu, S.; Liu, X.; Zhang, Y. Advances in the Use of Nighttime Light Data to Monitor and Assess Coastal Fisheries under the Impacts of Human Activities and Climate and Environmental Changes: A Case Study in the Beibu Gulf. Mar. Policy. 2022, 144, 105227. [Google Scholar] [CrossRef]
  33. Carlotta, M.; Beare, D.; Hall-Spencer, J.M. Overfishing and the Replacement of Demersal Finfish by Shellfish: An Example from the English Channel. PLoS ONE 2014, 9, e101506. [Google Scholar]
  34. Wang, X.; Qiu, Y.; Du, F.; Lin, Z.; Sun, D.; Huang, L. Spatio-temporal variability of fish diversity and dominant species in the Beibu Gulf. J. Fish. Sci. China 2011, 18, 427–436. [Google Scholar] [CrossRef]
  35. Hou, G.; Feng, Y.; Chen, Y.; Wang, J.; Wang, S.; Zhao, H. Spatiotemporal distribution of threadfin porgy evynnis cardinalis in Beibu Gulf and its relationship with environmental factors. J. Guangdong Ocean Univ. 2021, 41, 8–16. [Google Scholar]
  36. Yan, R.; Fan, J.; Chen, Z.; Cai, Y.; Zhang, K.; Xu, Y.; Xu, S. The probability distribution of the jack mackerel (Trachurus japonicus) density in the offshore of the northern South China Sea. J. Fish. Sci. China 2019, 26, 91. [Google Scholar] [CrossRef]
  37. Le Pape, O.; Bonhommeau, S.; Nieblas, A.-E.; Fromentin, J.-M. Overfishing Causes Frequent Fish Population Collapses but Rare Extinctions. Proc. Natl. Acad. Sci. USA 2017, 114, E6274. [Google Scholar] [CrossRef]
  38. Rooper, C.N.; Ortiz, I.; Hermann, A.J.; Laman, N.; Cheng, W.; Kearney, K.; Aydin, K. Predicted Shifts of Groundfish Distribution in the Eastern Bering Sea under Climate Change, with Implications for Fish Populations and Fisheries Management. ICES J. Mar. Sci. 2021, 78, 220–234. [Google Scholar] [CrossRef]
  39. Liang, J.; Peng, Y.; Zhu, Z.; Li, X.; Xing, W.; Li, X.; Yan, M.; Yuan, Y. Impacts of Changing Climate on the Distribution of Migratory Birds in China: Habitat Change and Population Centroid Shift. Ecol. Indic. 2021, 127, 107729. [Google Scholar] [CrossRef]
  40. Guo, K.; Yuan, S.; Wang, H.; Zhong, J.; Wu, Y.; Chen, W.; Hu, C.; Chang, Q. Species distribution models for predicting the habitat suitability of Chinese fire-bellied newt Cynops orientalis under climate change. Ecol. Evol. 2021, 11, 10147–10154. [Google Scholar] [CrossRef]
  41. Beaumont, L.J.; Hughes, L.; Pitman, A.J. Why Is the Choice of Future Climate Scenarios for Species Distribution Modelling Important? Ecol. Lett. 2008, 11, 1135–1146. [Google Scholar] [CrossRef] [PubMed]
  42. Zhang, L.; Shi, Z.; Zhang, J.; Jiang, Z.; Wang, F.; Huang, X. Spatial and Seasonal Characteristics of Dissolved Heavy Metals in the East and West Guangdong Coastal Waters, South China. Mar. Pollut. Bull. 2015, 95, 419–426. [Google Scholar] [CrossRef] [PubMed]
Figure 1. Study area.
Fishes 08 00559 g001
Figure 2. Salinity and primary productivity niches of catches of 10 major fish taxa.
Fishes 08 00559 g002
Figure 3. Response curve of the probability of the presence of Trachurus japonicus to the dominant environmental factors.
Fishes 08 00559 g003
Figure 4. Distribution of potentially suitable areas for major fish catches in the Beibu Gulf under different flood seasons.
Fishes 08 00559 g004
Table 1. Available data of catches of 10 major fish taxa in the Beibu Gulf.
TaxaIndexAvailable Data
January (Withered-Water Period)July (High-Water Period)
Leiognathidaebottom514462
Priacanthus macracanthusbottom281136
Trichiuridaebottom389408
Parargyrops editabottom479528
Acropoma japonicumbottom403328
Decapterus maruadsipelagic325479
Sauridabottom492505
Sciaenidaebottom447300
Apogonidaebottom380388
Trachurus japonicuspelagic388500
Table 2. AUC values of the simulated MaxEnt model.
Taxa Withered-Water PeriodHigh-Water Period
Area under the Curve (AUC) ValueStandard DeviationAUC ValueStandard Deviation
Leiognathidae0.9140.0060.9210.006
Priacanthus macracanthus0.9420.0050.9440.009
Trichiuridae0.9290.0070.9240.006
Parargyrops edita0.9240.0050.9220.005
Acropoma japonicum0.9330.0050.9420.005
Decapterus maruadsi0.9260.0060.9120.006
Saurida0.9190.0050.9240.005
Sciaenidae0.9250.0050.950.006
Apogonidae0.9260.0070.9170.006
Trachurus japonicus0.9340.0050.9170.005
Table 3. Test results of the model and importance of environmental factors.
TaxaWithered-Water PeriodHigh-Water Period
Dominant Environmental Factors
LeiognathidaeBottom salinity, primary productivity, water current velocityBottom salinity, primary productivity, water current velocity
Priacanthus macracanthusBottom salinity, pH, water current velocityPrimary productivity, bottom salinity, pH
TrichiuridaeBottom salinity, primary productivity, pHBottom salinity, pH, primary productivity
Parargyrops editaBottom salinity, primary productivity, water current velocityBottom salinity, pH, primary productivity
Acropoma japonicumBottom salinity, pH, primary productivitypH, bottom salinity, primary productivity
Decapterus maruadsiBottom salinity, primary productivity, water current velocityBottom salinity, primary productivity, pH
SauridaBottom salinity, primary productivity, water current velocityBottom salinity, Primary productivity, Water current velocity
SciaenidaeBottom salinity, pH, primary productivitypH, bottom salinity, primary productivity
ApogonidaeBottom salinity, pH, Primary productivityPrimary productivity, bottom salinity, pH
Trachurus japonicusBottom salinity, primary productivity, water current velocityBottom salinity, primary productivity, pH
Table 4. Areas suitable for major fish catches in the Beibu Gulf during different flood seasons.
TaxaArea ComparisonWithered-Water PeriodHigh-Water Period
Rate of Change
(%)
Total Area/km2Less Suitable Area/km2Moderately Suitable Area/km2Highly
Suitable Area/km2
Total Area/km2Less Suitable Area/km2Moderately Suitable Area/km2Highly
Suitable Area/km2
Leiognathidae−4.78%81,023.288998.2834,484.2137,540.7977,148.910,028.0634,719.4632,401.38
Priacanthus macracanthus9.56%65,981.638389.0324,586.2733,006.3272,291.2814,682.3130,835.626,773.37
Trichiuridae3.57%75,997.6213,423.3129,439.5933,134.7278,712.9610,995.7931,172.5436,544.62
Parargyrops edita0.81%80,887.128882.834,299.7937,704.5281,542.059405.0235,709.636,427.43
Acropoma japonicum10.23%55,406.379101.6920,864.4225,440.2661,076.619864.3320,560.2330,652.05
Decapterusmaruadsi6.26%73,117.6913,783.5122,459.536,874.6778,002.889735.0632,591.8335,675.99
Saurida−0.88%77,737.478409.7131,575.8437,751.9277,055.8310,632.130,527.9635,894.87
Sciaenidae−6.22%68,149.7611,121.627,264.5629,763.663,909.1412,194.4727,502.424,212.28
Apogonidae10.61%69,620.7511,191.428,421.8730,007.4777,004.1310,746.7530,16036,097.38
Trachurus japonicus10.92%68,919.299704.924,924.9434,289.4576,448.3111,843.7427,580.8237,023.75
Disclaimer/Publisher’s Note: The statements, opinions and data contained in all publications are solely those of the individual author(s) and contributor(s) and not of MDPI and/or the editor(s). MDPI and/or the editor(s) disclaim responsibility for any injury to people or property resulting from any ideas, methods, instructions or products referred to in the content.

