Article

The Effect of Dietary Lipid Supplementation on the Serum Biochemistry, Antioxidant Responses, Initial Immunity, and mTOR Pathway of Juvenile Tilapia (Oreochromis niloticus)

1
Guangxi Key Laboratory for Polysaccharide Materials and Modifications, Guangxi Minzu University, Nanning 530008, China
2
Guangxi Marine Microbial Resources Industrialization Engineering Technology Research Center, Guangxi Minzu University, Nanning 530008, China
3
School of Marine Sciences and Biotechnology, Guangxi Minzu University, 158 University Road, Nanning 530008, China
*
Authors to whom correspondence should be addressed.
These authors contributed equally to this work.
Fishes 2023, 8(11), 535; https://doi.org/10.3390/fishes8110535
Submission received: 28 September 2023 / Revised: 22 October 2023 / Accepted: 25 October 2023 / Published: 26 October 2023
(This article belongs to the Special Issue Fish Nutrition, Metabolism and Physiology)

Abstract

:
The objectives of this study were to investigate the effect of different dietary lipid levels on the serum biochemistry, antioxidant responses, initial immunity, and mTOR pathway of juvenile genetic improvement-farmed tilapia (GIFT, Oreochromis niloticus). Six groups of the juveniles (initial body weight 20.66 ± 1.33 g) in triplicate were fed for 90 days using six iso-nitrogen diets with different lipid levels (0.35%, 3.35%, 6.35%, 9.35%, 12.35%, and 15.35%). The main results were as follows: Compared with the control group (0.35%), the diets with different lipid supplementation significantly improved (p < 0.05) the contents of total protein (TP), albumin (ALB), globulin (GLB), glucose (GLU), triglyceride (TG), total cholesterol (T-CHO), high-density lipoprotein (HDL), low-density lipoprotein (LDL), total antioxidant capacity (T-AOC), malondialdehyde (MDA), complement 3 (C3), and immunoglobulin M (IgM), the activities of superoxide dismutase (SOD), glutathione peroxidase (GSH-Px), catalase (CAT), lysozyme (LYZ), and alkaline phosphatase (ALP), the expression level of phosphatidylinositol-3-kinase (PI3K), Akt protein kinase B (Akt), and mammalian target of rapamycin (mTOR) genes in juvenile tilapia. However, diets with different lipid supplementation significantly reduced (p < 0.05) the expression level of tumor necrosis factor α (TNF-α), interleukin-1β (IL-1β), and interleukin-6 (IL-6) genes of juvenile tilapia. In conclusion, the with different lipid supplementation could significantly affect the serum biochemistry, antioxidant responses, initial immunity, and mTOR pathway of juvenile tilapia.
Key Contribution: The diets adding different doses of fish oil could downregulate the expression of inflammation-related genes and upregulate the expression of PI3K/Akt/mTOR signaling pathway genes in juvenile tilapia, which indicates that dietary lipid supplementation could promote the immune capacity and protein metabolism of juvenile tilapia. The greatest effect was found in the diet with 9.35% lipid, which is the optimal dietary lipid in the experiment.

1. Introduction

Lipid, as one of the most essential nutrients for fish, plays a crucial role in their growth, development, and metabolism [1]. Lipid not only provides energy for fish but also serves as an important component of their bodies [2]. However, both excessive and insufficient levels of dietary lipid supplementation can have inhibitory effects on growth, development, and disease resistance [3]. The serum physiological and biochemical indicators of fish are closely related to their nutritional status, metabolism, and diseases [4,5]. Therefore, studying the influence of dietary lipid supplementation on the serum biochemical indicators of fish is an important approach for evaluating the nutritional value of feed.
Fish possess natural antioxidant and non-specific immune systems [6]. Superoxide dismutase (SOD), glutathione peroxidase (GSH-Px), and catalase (CAT) are the main antioxidant enzymes involved in the elimination of free radicals in the fish, while lysozyme (LZM), alkaline phosphatase (ALP), and the complement system are important components of the non-specific immune system [7,8,9]. Previous studies have shown that lipids play a crucial role in regulating the antioxidant and immune responses, and the level of dietary lipid supplementation is closely related to the antioxidant capacity and immune function of fish [10,11,12]. The inflammatory factors include tumor necrosis factor α (TNF-α), interleukin 1β (IL-1β), and interleukin 6 (IL-6). These factors are important inflammatory mediators in animals and play a significant role in immune regulation. Their expression levels are often used as indicators of the inflammatory response in the body [13]. The expression levels of inflammatory-related genes are influenced by the composition of the diet [14,15], but the mechanisms by which dietary lipid levels affect the immune response in juvenile tilapia are still not clear and require further research.
The mechanistic target of rapamycin (mTOR) is one of the major pathways involved in protein metabolism in animals. It has been found in various studies that the mTOR signaling pathway is positively regulated by substances such as hormones, nutrients, and growth factors [16]. Activation of the mTOR signaling pathway leads to increased expression of ribosomal protein S6 kinase Beta-1 (S6K1) and Akt protein kinase B (Akt) [17]. Wacyk et al. found that the mTOR signaling pathway in rainbow trout (Oncorhynchus mykiss) was influenced by dietary protein, and altering the protein content in the diet activated the mTOR signaling pathway [18]. Wang et al. found that the addition of glutamine to the diet activated the mTOR signaling pathway in the malabar grouper (Pinephelus malabricus), resulting in improved growth performance [19]. However, there is currently limited research on the effect of dietary lipid levels on the mTOR signaling pathway in juvenile tilapia. Investigating the impact of dietary lipid levels on the TOR signaling pathway in juvenile tilapia can provide insights into the mechanisms by which dietary lipids regulate lipid synthesis and protein synthesis in juvenile tilapia.
Genetic improvement-farmed tilapia (GIFT, Oreochromis niloticus) is an important commercially cultured species worldwide and known for its strong disease resistance, fast growth rate, high nutritional value, and low-cost feed ingredients [2]. Considering the omnivorous nature and economic significance of GIFT tilapia, this study selected GIFT tilapia as the experimental fish. This study primarily investigates the effect of different dietary lipid levels on the serum biochemicals, antioxidant capacity, non-specific immunity, inflammatory response, and the expression of mTOR signaling pathway-related genes in juvenile GIFT tilapia. This study aims to enrich and enhance the research on fish feed nutrition and fish physiology and provide references for the nutritional standards and commercial aquaculture production of juvenile GIFT tilapia in terms of their lipid requirements in the formulated feed.

2. Materials and Methods

2.1. Feed Materials and Formulas

All the feed materials were animal food grade from Feed of Tongwei, Nanning, China. The six experimental feed formulas were designed with different dietary lipid levels based on the reference [20], in which the optimal dietary lipid level for juvenile tilapia is 7.7–9.3%. Casein was used as the dietary protein source, and fish oil was used as the dietary lipid source. The control diet contained 0.35% lipid without lipid supplementation, and the other diets added different doses of fish oil to make the different dietary lipid levels of 3.35, 6.35, 9.35, 12.35, and 15.35% based on per kg of dried feed. The feed materials were passed through a 260 μm mesh-graded sieve and processed into spherical pellet feed (diameter: 2.0 mm) after full mixing. The pellet feed was dried in the drying oven at 60 °C, then placed in the sealed plastic bags and stored at −20 °C. The composition of the experimental diets for juvenile tilapia is shown in Table 1.
The fatty acids in the diets were determined using a gas chromatograph (GC, Agilent Technologies, Inc., Santa Clara, CA, USA) following the method of Ding et al. [3]. Briefly, the fatty acids were determined as follows: First, the lipid was extracted and purified. Second, the lipid was saponified. Third, the fatty acids were methyl esterified. Fourth, the fatty acid methyl esterification was extracted. Fifth, the fatty acids were determined using a GC. The mixing standards of fatty acid methyl esterification (No. GLC 455) from Sigma-Aldrich (Shanghai) Trading Co., Ltd., Shanghai, China. The fatty acid composition in fish oil and formulated diets is shown in Table 2.

2.2. Fish Farming and Sampling

The same batch of 1000 juvenile GIFT tilapia was from the Guangxi Academy of Fishery Sciences’ Seed-breeding Farm, Nanning, China. After disinfection with potassium permanganate solution at a concentration of 1/100,000, the juvenile tilapia was domesticated in the breeding tank for 2 weeks. The juvenile tilapia used in this experiment was approved by the Ethics Committee of Guangxi Minzu University, Nanning, China (Approved No. GXMZU-2022-002).
During the acclimatization, the circulating water was used in the breeding tank; the water temperature was 26 ± 1 °C; the pH was 7.0–8.0; and the dissolved oxygen was ≥5 mg·L−1. The juveniles were fed three times a day at 9:00, 14:00, and 19:00, and diets containing 0.35% lipids were used as the basic diets. Before feeding each morning, manure was removed from the breeding system and replaced with one-third of the total water.
After 2 weeks of acclimatization, the juveniles were fasted for 24 h. Then, 540 juveniles (initial body weight 20.66 ± 1.33 g. body length 8.36 ± 0.45 cm) were randomly selected and divided into 6 groups with 3 replicates per group and a total of 18 breeding tanks. Each breeding tank (60 cm × 40 cm × 40 cm) had a total of 30 juvenile tilapia.
As described in acclimatization progress, the juvenile tilapia were cultured in the same aquaculture system. The juveniles were fed three times a day at 9:00, 14:00, and 19:00. The diet with 0.35% lipid level was used as the control group diet, and other diets with different lipid levels (3.35, 6.35, 9.35, 12.35, and 15.35%) were used as the experimental group diets, respectively. The daily feeding amount was 5% of the total wet weight of the fish. To adjust the feed quality, 6 fish were randomly weighed in each group every week. The feeding period was 90 days.
At the end of the experiment, the juvenile tilapia were starved for 24 h, and then the fish were randomly sampled. The 9 fish were randomly sampled in each group (3 fish were extracted from each aquaculture tank), and then the samples were anesthetized with 0.03% of ethyl m-aminobenzoate mesylate (MS-222, Shanghai Adamas Reagent Co., Ltd., Shanghai, China). The blood was collected from the caudal vein of the fish, and the collected blood samples were placed in a sterile EP tube, stood at 4 °C for 24 h, and then centrifuged at 4 °C at 3000× g for 15 min. The upper serum was taken, placed in a new EP tube, and marked accordingly. The samples of the spleen, head kidney, and liver were taken, respectively. All samples were, respectively, put into the marked sample bag and stored in liquid nitrogen. After all samples were sampled, they were uniformly stored in the ultra-low temperature refrigerator at −80 °C for later detection.

2.3. Determination of Serum Biochemical, Antioxidant, and Immune Indexes

The total protein (TP), albumin (ALB), globulin (GLB), glucose (GLU), triglyceride (TG), total cholesterol (T-CHO), high-density lipoprotein (HDL), low-density lipoprotein (LDL), aspartate aminotransferase (AST), alanine aminotransferase (ALT), lysozyme (LZM), alkaline phosphatase (ALP), immunoglobulin M (IgM), and complement protein 3 (C3) in the serum, and the catalase (CAT), superoxide dismutase (SOD), glutathione peroxidase (GSH-Px), total antioxidant capacity (T-AOC), and malondialdehyde (MDA) in the liver and serum were determined using an ELISA analyzer (RT-6100, Rayto, Shenzhen, China) and assay kits, respectively. The assay kits were made by Shanghai Sangon Bioengineering Technology Service Co., Ltd. (Shanghai, China). All the operation steps were carried out according to the kits’ manuals, and all the kits’ manuals can be found and downloaded at https://www.sangon.com (accessed on 1 September 2023).

2.4. Determination of Gene Expression

The expression of phosphatidylinositol 3 kinase (PI3K), Akt protein kinase B (Akt), and mammalian target of rapamycin (mTOR) genes in the liver, and the tumor necrosis factor α (TNF-α), interleukin 1β (IL-1β), and interleukin 6 (IL-6) genes in the liver, spleen, and head kidney were determined by real-time quantitative polymerase chain reaction (RT-qPCR). β-actin was selected as the internal reference gene. Based on the mRNA sequences of GIFT tilapia published in the National Center for Biotechnology Information (NCBI), Primer Premier 7.0 (Premier Biosoft International, Palo Alto, CA, USA) was used to design the forward and reverse primers. The primers were synthesized by Shanghai Sangon Bioengineering Technology Service Co., Ltd. (Shanghai, China), as shown in Table 3.
The RT-qPCR method of Zhang et al. was applied [21], and the brief steps were as follows: First, the total RNA was extracted from the liver, spleen, and head kidney of tilapia using the Marine Animal Tissue RNA Extraction Kit, produced by Biotech Ltd., Co. of TIANGEN, Beijing, China. The RNA quantity and purity were determined by spectrophotometry and assessed based on the absorbance ratio of 260:280 nm using an ND-2000 spectrophotometer (Thermo, Waltham, MA, USA). The RNA integrity was evaluated based on gel electrophoresis in a 1% (w/v) agarose TAE gel stained with Gel RedTM nucleic acid stain (UVP, Upland, CA, USA). Second, 1 μL of total RNA was reverse-transcribed into cDNA using the RNA PCR Kit (AMV) Ver 3.0 produced by Biotech Ltd. Co., Takara, Dalian, China. The reverse-transcription processes were 30 °C for 10 min, 42 °C for 15 min, 95 °C for 5 min, 5 °C for 5 min, and 1 cycle. The compositions of the reactive solution were carried out with 0.50 μL of AMV Reverse Transcriptase, 0.50 μL of Oligo dT-Adaptor Primer, 2.00 μL of MgCl2, 1.00 μL of 10 × RTBuffer, 3.75 μL of RNase-Free dH2O, 1.00 μL of dNTP Mixture, 0.25 μL of Rnase Inhibit, 1.00 μL of RNA Sample, in a total reaction volume of 10 μL. After the PCR reaction, the cDNA sample was obtained. Third, RT-qPCR assays were performed using an RT-qPCR Detection System (LightCycler 96, Roche, Basel, Switzerland) and the SYBR Green Pro Taq HS Premix (AG) produced by Biotech Ltd., Co., Takara, Dalian, China. The RT-qPCR reactions were carried out with 12.5 μL of SYBR Premix Ex Taq, 1 μL of primer F, 1 μL of primer R, 2 μL of cDNA, and 8.5 μL of dH2O, in a total reaction volume of 25 μL. The RT-qPCR thermal cycling conditions were preheated at 95 °C for 10 s, 1 cycle, followed by 40 cycles of three steps: denaturation at 95 °C for 60 s; annealing at 60 °C for 30 s; and extension at 72 °C for 90 s. The reaction specificity was detected by the 95 °C melting curve.
The 2−ΔΔCt method [22] was applied to calculate the relative expression levels of PI3K, Akt, mTOR, TNF-α, IL-1β, and IL-6 genes.

2.5. Data Calculation and Statistics

All the data were preliminarily processed by Microsoft Excel 2023 (Version number: 16.78 (23100802), Microsoft Corporation, Washington, WA, USA), and a one-way analysis of variance (ANOVA) was performed by IBM SPSS 21 (International Business Machines Corporation, Armonk, NY, USA). The normality and homogeneity of variances among groups were tested. Duncan’s multiple range test was used to compare them. When p < 0.05, it is significantly different. Results were expressed as Mean ± standard error (Mean ± SE).

3. Results

3.1. Effect of Dietary Lipid Supplementation on Serum Biochemical Parameters of Juvenile TilapiaP

The contents of total protein (TP), albumin (ALB), globulin (GLB), glucose (GLU), triglyceride (TG), total cholesterol (T-CHO), high-density lipoprotein (HDL), and low-density lipoprotein (LDL) in the serum of juvenile tilapia fed different dietary lipid supplementations (3.35%, 6.35%, 9.35%, 12.35%, and 15.35% lipid) for 90 days were significantly higher (p < 0.05) than those of juvenile tilapia fed a control diet (0.35% lipid). With the increase in the lipid level, the contents of TP, ALB, GLB, GLU, TG, T-CHO, HDL, and LDL in the serum of juvenile tilapia gradually increased. The highest TP, ALB, GLB, GLU, TG, T-CHO, HDL, and LDL in the serum of juvenile tilapia were fed 15.35% dietary lipid, as shown in Table 4.
The HDL/LDL in the serum of juvenile tilapia fed 15.35% dietary lipid supplementation for 90 days was significantly lower (p < 0.05) than that of juvenile tilapia fed the control diet (0.35% lipid). However, there was no significant difference (p > 0.05) between the HDL/LDL in the serum of juvenile tilapia fed 3.35%, 6.35%, 9.35%, and 12.35% dietary lipid supplementation and that of juvenile tilapia fed the control diet, as shown in Table 4.
The activity levels of aspartate aminotransferase (AST) and alanine aminotransferase (ALT) in the serum of juvenile tilapia fed 3.35% dietary lipid supplementation for 90 days were significantly lower (p < 0.05) than that of juvenile tilapia fed control diet (0.35% lipid), and the activity of AST and ALT in the serum fed 15.35% dietary lipid supplementation were significantly higher (p < 0.05) than that of juvenile tilapia fed control diet. However, there was no significant difference (p > 0.05) between the AST in the serum of juvenile tilapia fed 6.35%, 9.35%, and 12.35% dietary lipid supplementation and that of juvenile tilapia fed the control diet, and there was no significant difference (p > 0.05) between the ALT in the serum of juvenile tilapia fed 12.35% dietary lipid supplementation and that of juvenile tilapia fed the control diet, as shown in Table 4.

3.2. Effect of Dietary Lipid Supplementation on Antioxidant Responses of Juvenile Tilapia

The activities of superoxide dismutase (SOD), catalase (CAT), and glutathione peroxidase (GSH-Px) and the contents of total antioxidant capacity (T-AOC) and malondialdehyde (MDA) in the serum and liver of juvenile tilapia fed different dietary lipid supplementations (3.35%, 6.35%, 9.35%, 12.35%, and 15.35% lipid) for 90 days were significantly higher (p < 0.05) than those of juvenile tilapia fed the control diet (0.35% lipid). With the increase in the lipid level, the activities of SOD, CAT, and GSH-Px and the contents of T-AOC in the serum and liver of juvenile tilapia firstly increased and then decreased. The highest SOD, CAT, GSH-Px, and T-AOC in the serum and liver of juvenile tilapia were fed 9.35% dietary lipid. With the increase in the lipid level, the content of MDA in the serum and liver of juvenile tilapia gradually increased. The highest MDA in the serum and liver of juvenile tilapia was fed 15.35% dietary lipid, as shown in Table 5 and Table 6.

3.3. Effect of Dietary Lipid Supplementation on Initial Immunity Parameters of Juvenile Tilapia

The activities of lysozyme (LZM) and alkaline phosphatase (ALP) and the contents of complement 3 (C3) and immunoglobulin M (IgM) in the serum of juvenile tilapia fed different dietary lipid supplementations (3.35%, 6.35%, 9.35%, 12.35%, and 15.35% lipid) for 90 days were significantly higher (p < 0.05) than those of juvenile tilapia fed the control diet (0.35% lipid). With the increase in the lipid level, the activities of LZM and ALP, and the contents of C3 and IgM in the serum of juvenile tilapia firstly increased and then decreased. The highest LZM, ALP, C3, and IgM in the serum of juvenile tilapia were fed 9.35% dietary lipid, as shown in Table 7.

3.4. Effect of Dietary Lipid Supplementation on the Expression of TNF-α, IL-1β, and IL-6 Genes of Juvenile Tilapia

The expression level of tumor necrosis factor α (TNF-α), interleukin 1β (IL-1β), and interleukin 6 (IL-6) genes in the spleen, head kidney, and liver of juvenile tilapia fed different dietary lipid supplementations (3.35%, 6.35%, 9.35%, 12.35%, and 15.35% lipid) for 90 days were significantly downregulated (p < 0.05) compared to those of juvenile tilapia fed the control diet (0.35% lipid). With the increase in the lipid level, the expression levels of the TNF-α, IL-1β, and IL-6 genes in the spleen, head kidney, and liver of juvenile tilapia were firstly downregulated and then upregulated. The lowest expression levels of the TNF-α and IL-6 genes in the spleen, head kidney, and liver of juvenile tilapia were fed 9.35% dietary lipid. The lowest expression level of the IL-1β gene in the spleen of juvenile tilapia was fed 12.35% dietary lipid. The lowest expression levels of IL-1β gene in the head kidney and liver of juvenile tilapia were fed 9.35% dietary lipid, as shown in Figure 1.

3.5. Effect of Dietary Lipid Supplementation on the Expression of PI3K/Akt/mTOR Pathway of Juvenile Tilapia

The expression level of the phosphoinositide 3-kinase (PI3K), Akt protein kinase B (Akt), and mammalian target of rapamycin (mTOR) genes in the liver of juvenile tilapia fed different dietary lipid supplementations (3.35%, 6.35%, 9.35%, 12.35%, and 15.35% lipid) for 90 days were significantly upregulated (p < 0.05) than those of juvenile tilapia fed the control diet (0.35% lipid). With the increase in the lipid level, the expression levels of the PI3K, Akt, and mTOR gene in the liver of juvenile tilapia were firstly upregulated and then downregulated. The highest expression levels of the PI3K and Akt genes in the liver of juvenile tilapia were fed 9.35% dietary lipid. The highest expression level of the mTOR gene in the liver of juvenile tilapia was fed 6.35% dietary lipid, as shown in Figure 2.

4. Discussion

The levels of total protein (TP), albumin (ALB), and globulin (GLB) in serum represent the metabolic status and amino acid or peptide absorption of the organism and can also reflect the non-specific immune function of the fish [23]. The results of this study showed that, compared to the control group, the addition of lipids in the feed significantly increased the levels of TP, ALB, and GLB in the serum, indicating that increasing the lipid level in the feed could promote metabolic processes and amino acid or peptide absorption in the fish, as well as enhance the non-specific immune function of the fish. The reason might be that the higher lipid content in the feed accelerated the rate of protein synthesis, resulting in an increased secretion of proteins into the serum [24]. However, when the lipid content is excessively high, it could lead to liver cell damage. After the digestion and absorption of lipids into the bloodstream, they participate in the metabolism of blood substances or generate feedback mechanisms to regulate blood osmotic pressure and fish immune function by synthesizing albumin and affecting the transport of globulins [25]. A similar study had shown that the addition of lipids in the feed (80–160 g/kg) significantly increased the levels of TP and ALB in the serum of tilapia [26]. In this study, the GLU content in the serum increased with the increasing lipid content in the feed, indicating that increasing the lipid content in the feed could enhance glucose metabolism in fish and promote an increase in serum glucose levels. The main sources of glucose (GLU) in fish serum are primarily obtained through three aspects: the absorption of carbohydrates in the food, the breakdown of liver glycogen, and the gluconeogenesis of proteins and lipids [27]. A similar result had also been observed in triploid rainbow trout, where the GLU content in the serum increased with increasing lipid levels [28]. The levels of total cholesterol (T-CHO) and triglycerides (TG) in serum are important indicators of lipid metabolism and the nutritional status of fish [29]. In this study, the levels of T-CHO and TG in the serum increased with the increasing lipid levels in the feed, indicating that the lipid content in the feed could affect the levels of T-CHO and TG in the serum. Serum T-CHO is mainly synthesized in the liver and is a major component of blood lipids. Changes in its levels could reflect the chemical reactions of liver fat [30,31]. The increase in the levels of T-CHO and TG in the serum might be due to the higher lipid levels in the feed, which increased the lipid metabolism pressure in the fish, leading to increased activity of endogenous lipid transport in the body, resulting in liver cell damage and elevated levels of T-CHO and TG in the serum [32]. A similar study showed that in the case of turbot (Scophthalmus maximus L.), the levels of T-CHO and TG gradually increased with increasing dietary lipid levels [33]. Low-density lipoprotein (LDL) is a lipoprotein particle that transports cholesterol into peripheral tissue cells, while high-density lipoprotein (HDL) transports cholesterol from peripheral tissues to the liver for metabolic clearance [34]. In this study, the levels of HDL and LDL increased with the increasing lipid levels, which could be attributed to the increased cholesterol content in the blood under high-fat feeding conditions. The fish synthesized more HDL to transport cholesterol back to the liver for metabolism. As cholesterol continued to be transported to the liver, the metabolic pressure on the liver increased, leading to liver cell damage. Consequently, LDL levels increased in the serum, facilitating the removal of accumulated cholesterol from the liver [35].
In this study, compared to the control group, the addition of lipids to the feed significantly increased the activities of superoxide dismutase (SOD), total antioxidant capacity (T-AOC), glutathione peroxidase (GSH-Px), and catalase (CAT) in the liver and serum of juvenile tilapia, indicating that lipids could enhance the antioxidant capacity of juvenile tilapia. This might be attributed to several factors: First, lipids were not only important nutrients for fish but also played crucial physiological roles in growth, development, and reproduction, as well as influencing the antioxidant and immune functions of fish through various physiological mechanisms [7]. For example, feeding a juvenile yellow croaker (Larmichthys crocea) with fish oil-enriched feed could promote the activities of CAT, SOD, and T-AOC in the liver, thereby enhancing the antioxidant capacity of the yellow croaker [36]. Second, polyunsaturated fatty acids (PUFAs) present in lipids possess the ability to combat or eliminate free radicals, especially long-chain PUFAs. They not only had a strong free radical scavenging ability, reducing intracellular reactive oxygen species (ROS) and cell death, but they also effectively eliminated H2O2 in the body, thereby enhancing the antioxidant capacity, reducing cell damage, and improving the overall antioxidant function [37]. Third, lipids could form stable hydroperoxides through their peroxidation reactions and react with ROS, effectively clearing free radicals. They could also regulate the level of ROS in the body by inhibiting the activity of reductive coenzyme oxidases, thus participating in the modulation of the antioxidant capacity [38].
However, in this study, as the lipid levels in the feed increased, the activities of SOD, GSH-Px, CAT, and T-AOC in the liver and serum of juvenile tilapia showed an initial increase followed by a decrease. This indicated that high levels of dietary lipids inhibited the antioxidant capacity of juvenile tilapia. This might be because the high lipid levels exceeded the tolerance of juvenile tilapia, resulting in lipid peroxidation and oxidative damage [39]. Malondialdehyde (MDA) is the product of lipid peroxidation in the body, which can cause cell membrane damage and functional impairment, thus affecting other physiological functions of the organism. The MDA content in the body is an important indicator reflecting the degree of oxidative damage [33]. In this study, the MDA content in the liver and serum increased with the increasing lipid levels in the feed, indicating that high levels of dietary lipid could lead to increased lipid peroxidation in the body. The characteristics of lipids, especially highly unsaturated fatty acids, being easily oxidized, coupled with the consumption of feed with excessive fat content, triggered lipid peroxidation reactions in the fish, resulting in elevated levels of the lipid peroxidation product MDA in the tissues [40].
The results of this study showed that, compared to the control group, the addition of lipids to the feed significantly increased the activities of LZM and ALP in the serum of juvenile tilapia, as well as the levels of C3 and IgM, indicating that lipids could enhance the non-specific immune response of juvenile tilapia. The level of lipids in the feed could affect the non-specific immune function of fish for several reasons: First, the cell membrane was an important barrier to the non-specific immune system in organisms, and lipids were essential components of cell membranes. The addition of lipids to the feed could significantly increase the levels of IgM and LZM enzyme activity in the serum of fish, possibly because fatty acids are important constituents of fish tissue cell membranes. They played a crucial role in maintaining membrane fluidity, promoting lymphocyte proliferation and differentiation, and regulating immune function [41]. Second, lipids could regulate the immune response of fish and enhance the bactericidal ability of macrophages in vitro. Unsaturated fatty acids in lipids could prevent damage to immune cells caused by free radicals produced in the fish body, ensuring the integrity of immune cell structure and function, thereby maintaining immune cell activity and function [42]. Third, lipids could stimulate the development of immune organs in fish, to some extent enhancing the organism’s immune capacity. In finless eel (Monopterus albus), the addition of lipids to the feed significantly increased the activity of IgM and LZM in the serum. This might be attributed to the essential fatty acids in lipids, which not only enhanced the humoral and cellular immune functions in animals’ specific immunity but also enhanced the production of cytokines in immune responses and stimulated the proliferation and differentiation of immune cells [43].
However, in this study, the activities of LZM and ALP in the serum, as well as the levels of C3 and IgM, showed a trend of initial increase followed by a decrease with increasing levels of dietary lipids. This suggested that excessive levels of dietary lipids could inhibit the non-specific immune performance of juvenile tilapia. This might be attributed to the following reasons: First, excessive lipids reduced the expression of pathogen recognition receptors and their adaptor proteins on the surface of fish immune organs [44]. Second, excessive unsaturated fatty acids in the fish body were prone to lipid peroxidation, and superoxide anions could attack immune cell membranes, thereby reducing the immune performance of the organism [45]. Studies have indicated that LZM in non-specific immunity was highly sensitive to stress, with increased activity under acute stimulation, while chronic long-term stress could inhibit LZM activity [46]. Lipids in the feed acted as immune stimulants for fish, and appropriate levels of lipids could enhance the activity of fish immune enzymes. However, high levels of lipids could induce metabolic stress and increase the metabolic rate of the liver and pancreas, thereby impairing the function of these organs and reducing the activity of fish immune enzymes, ultimately inhibiting the immune system of the organism [47].
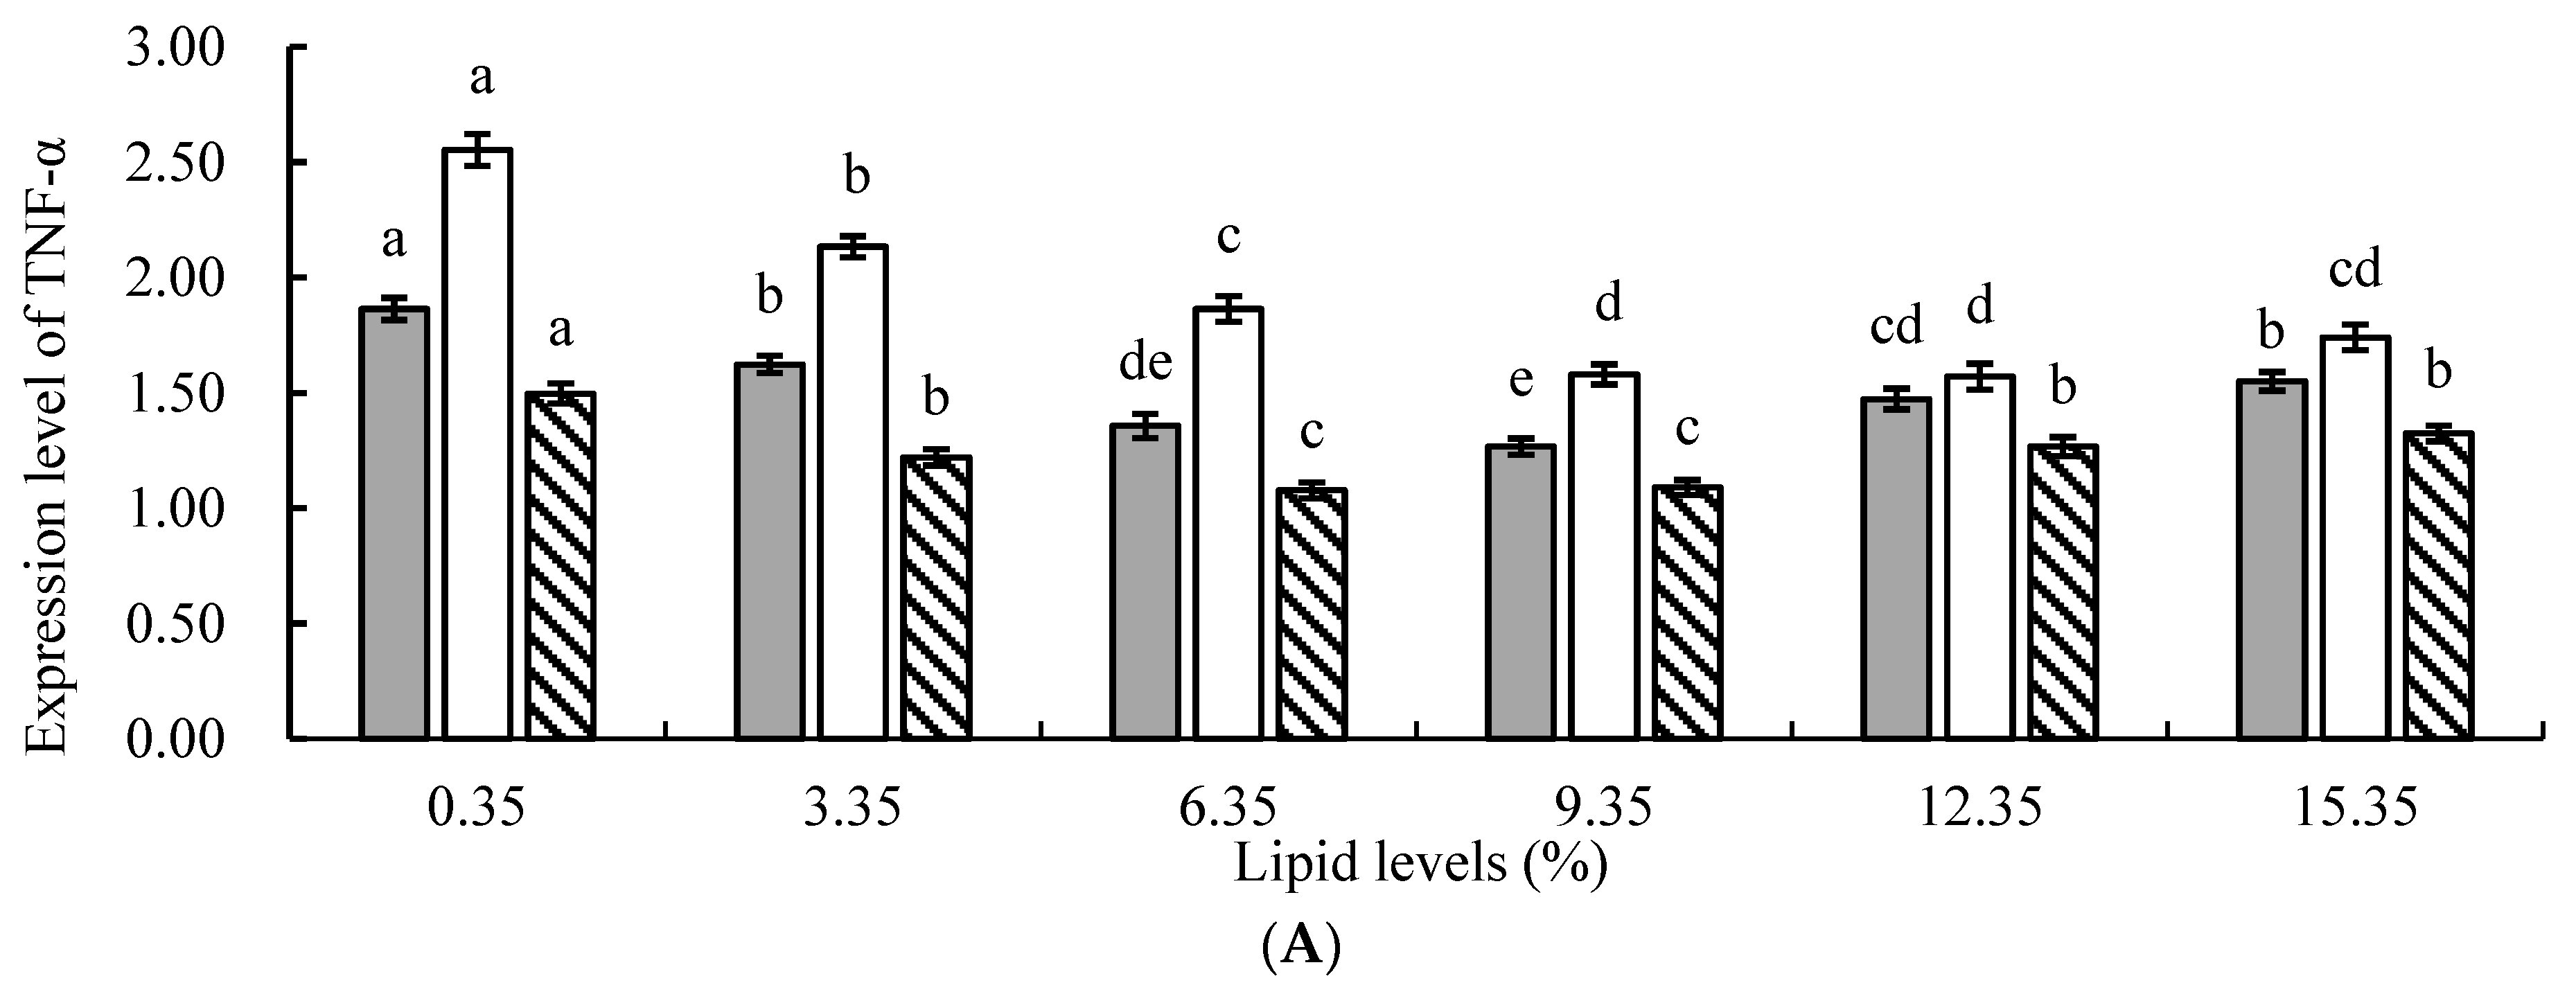
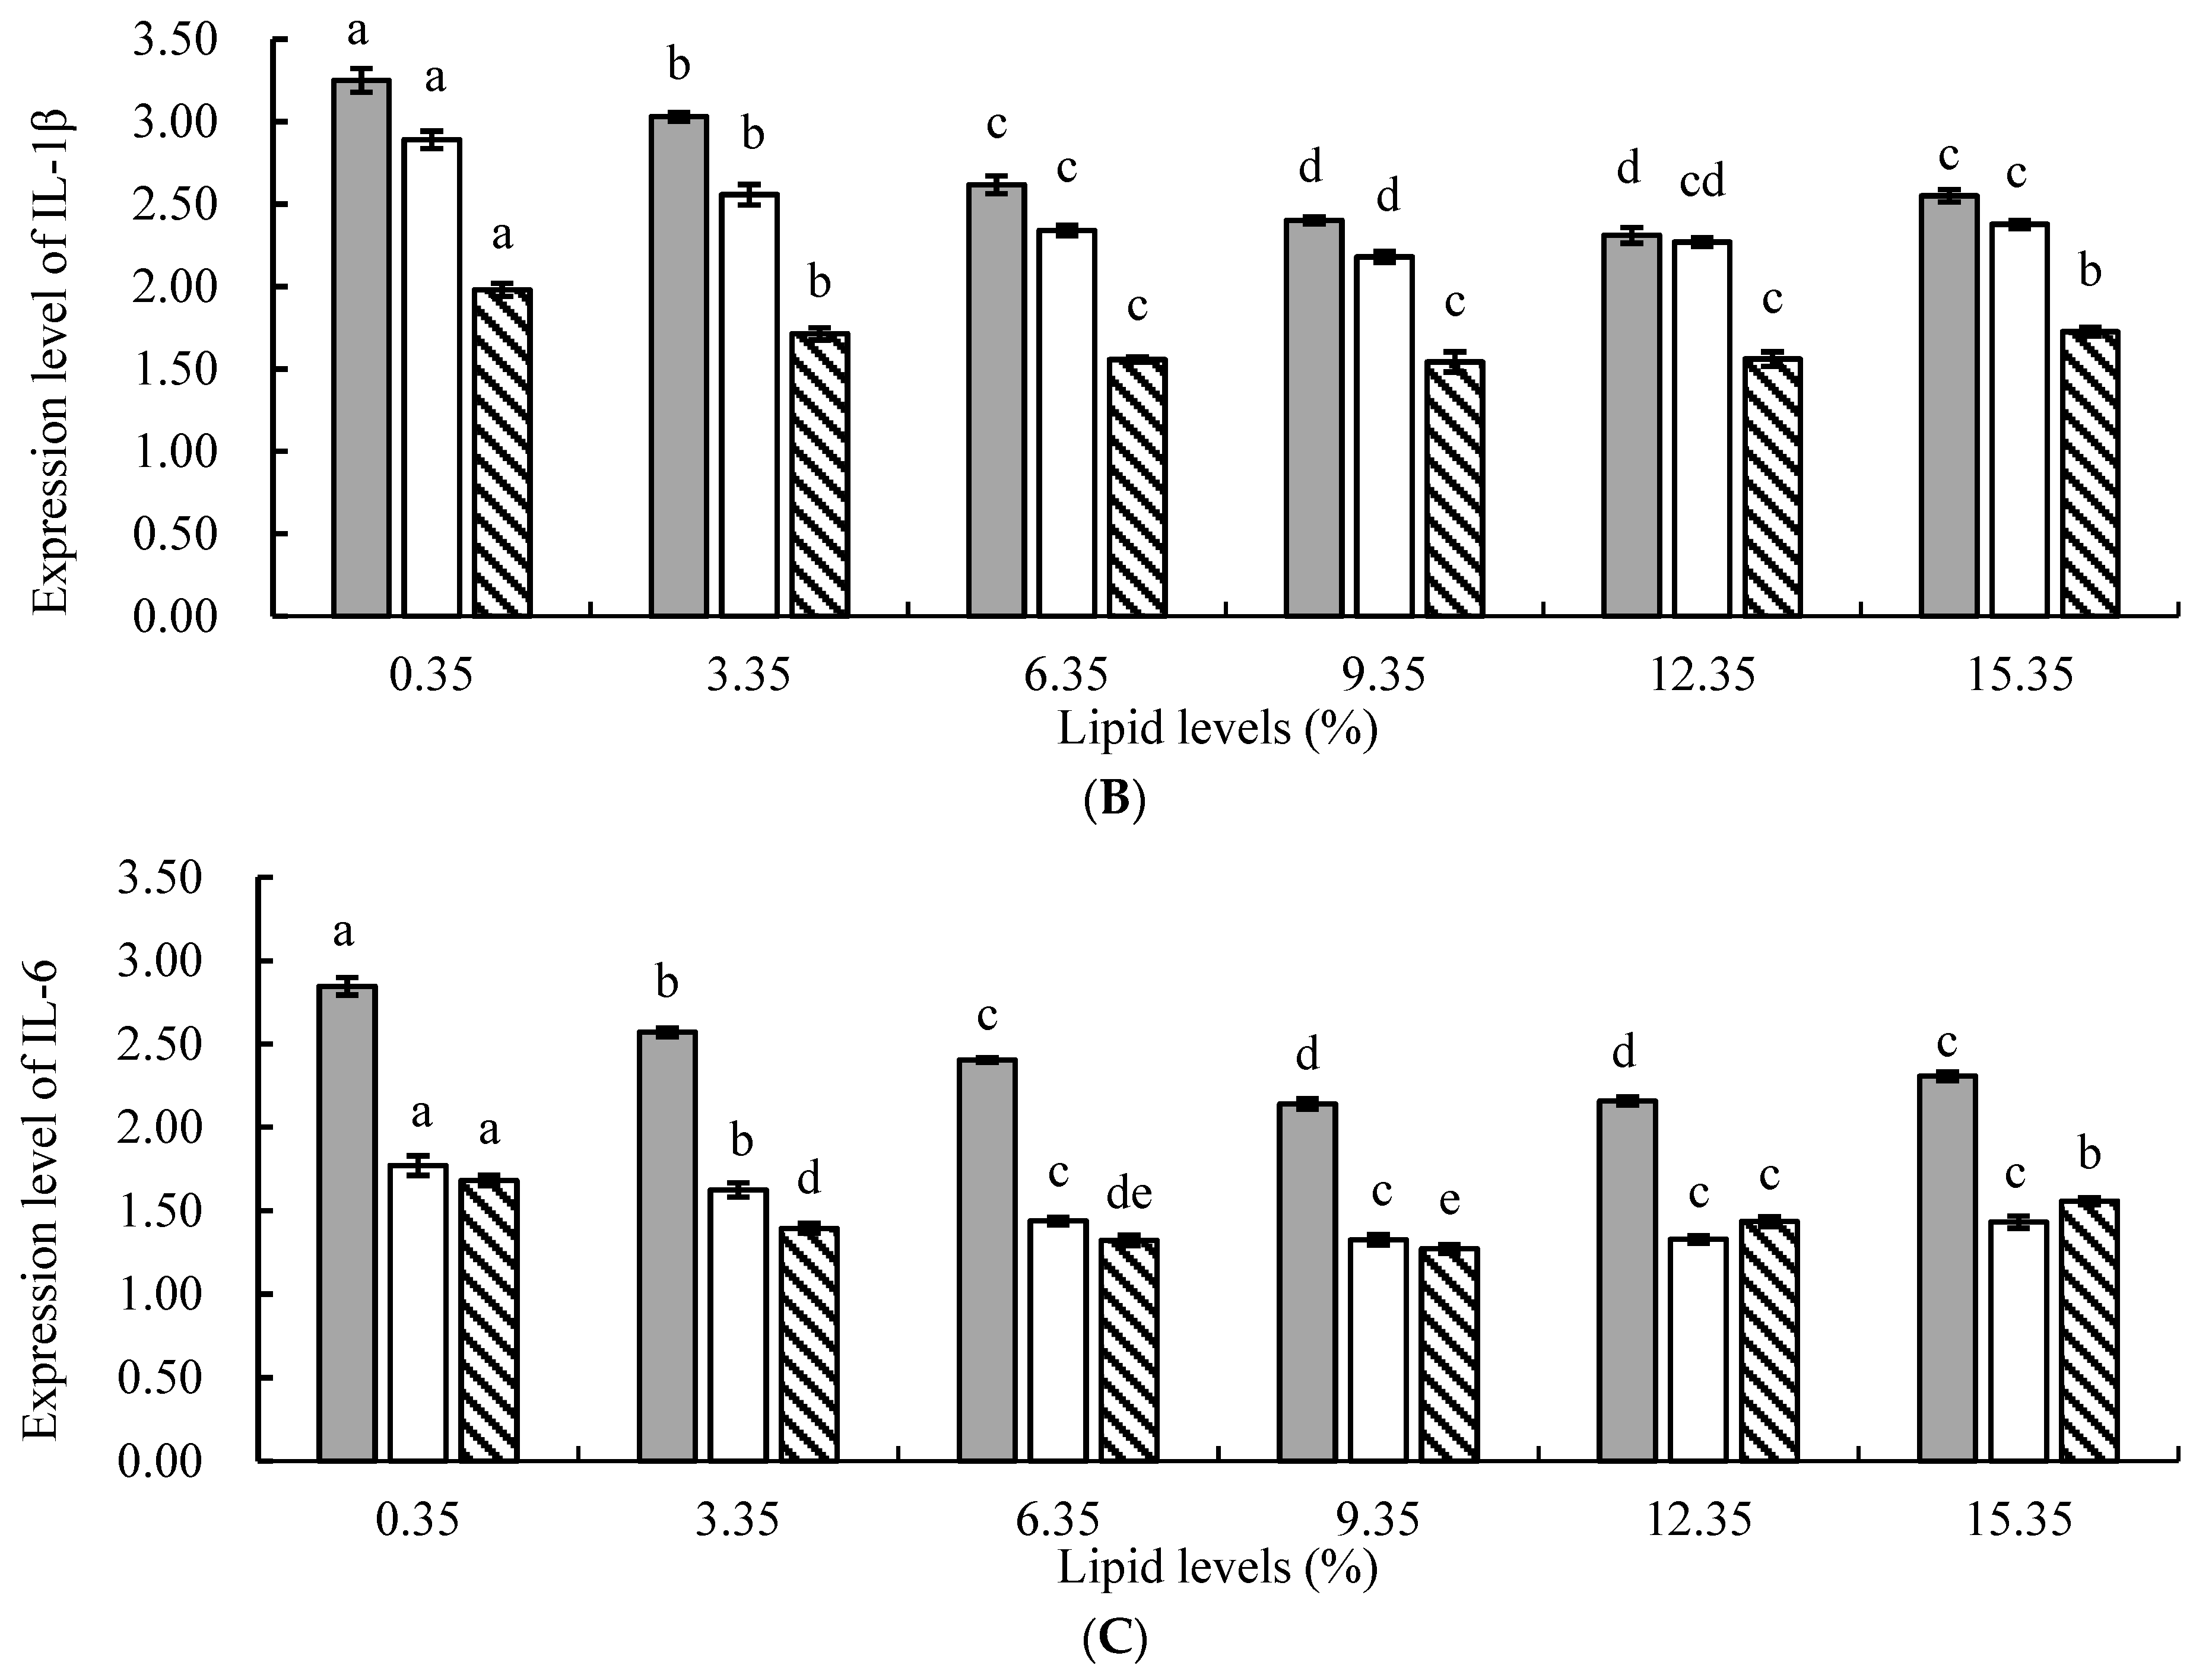
In animals, ROS generated by cellular oxidative stress is considered one of the main factors leading to chronic inflammation [48]. The results of this study revealed that, compared to the control group, the addition of lipids to the feed significantly suppressed the relative expression levels of tumor necrosis factor α (TNF-α), interleukin 1β (IL-1β), and interleukin 6 (IL-6) genes in juvenile tilapia, indicating that lipids could significantly reduce the occurrence of inflammatory responses in fish. This might be attributed to the following reasons: First, the protective effect of n−3 PUFAs in lipids against inflammation was mediated by upregulating the expression of heme oxygenase-1 (HO-1) through nuclear factor erythroid 2-related factor 2 (Nrf2), thereby inhibiting the expression of the nuclear transcription factor kB (NF-kB) signaling pathway and subsequently suppressing the inflammatory response in the organism [49]. For example, in the study on tunny (Puntius gonionotous), an increase in dietary lipid levels resulted in higher levels of n – 3 PUFAs and n−3-LC-PUFAs, which upregulated the expression of anti-inflammatory genes and downregulated the expression of pro-inflammatory genes (such as TNF-α, IL-1β, and IL-6), thereby enhancing the immune capacity of the fish [50]. In mice supplemented with n − 3 PUFA-rich oils, the secretion of TNF-α, IL-1β, and IL-6 by peritoneal macrophages decreased [51]. Feeding with a high ratio of n − 3/n − 6 PUFAs-rich diet could reduce the expression of TNF-α, IL-1β, and IL-6 mRNA, indicating that different ratios of n − 3/n − 6 PUFAs could affect the immune function of the organism by altering the expression of TNF-α, IL-1β, IL-6 genes, and the composition of fatty acids in immune cell membranes [52,53]. Second, TNF-α, IL-1β, and IL-6, as important immune-regulatory cytokines in fish, played a crucial role in the non-specific immune response of the organism. Under normal conditions without pathogen infection, the expression levels of TNF-α, IL-1β, and IL-6 genes in fish were maintained at a low level. However, when fish are subjected to external stress or pathogen invasion, an upregulation of their expression levels occurs [54]. In this study, the relative expression levels of TNF-α, IL-1β, and IL-6 genes in the experimental groups were significantly lower than those in the control group, indicating that the addition of lipids to the feed effectively alleviated the stress response in fish, enhanced their disease resistance, and inhibited the inflammatory response.
However, this study found that when the level of lipid in the feed was too high, there was an increasing trend in the relative expression levels of TNF-α, IL-1β, and IL-6 genes. This may be because PUFAs in lipids could metabolize and generate a series of bioactive substances, such as eicosanoids, which play an important regulatory role in inflammation, T lymphocyte, and B lymphocyte function [44]. The level of prostaglandin E2 (PGE2), a derivative of arachidonic acid (AA), was negatively correlated with the strength of animal immune function. Concentrations within the appropriate physiological range were beneficial for maintaining normal immune function in the body. However, when the level of lipids was too high and the PGE2 content exceeded the normal level, it could lead to the occurrence of inflammatory reactions or diseases such as cancer and could also promote the secretion of cytokines such as TNF-α, IL-1β, and IL-6, thereby affecting the function of the immune system [55]. Generally, a high level of n-6 PUFAs in the feed could increase the levels of eicosanoids derived from AA before the inflammatory response, thus enhancing the inflammatory response in the body [56]. In addition, a certain concentration of saturated fatty acids and arachidonic acid in lipids could stimulate the TLR4/NF-kB signaling pathway, triggering an inflammatory response in the body [57].
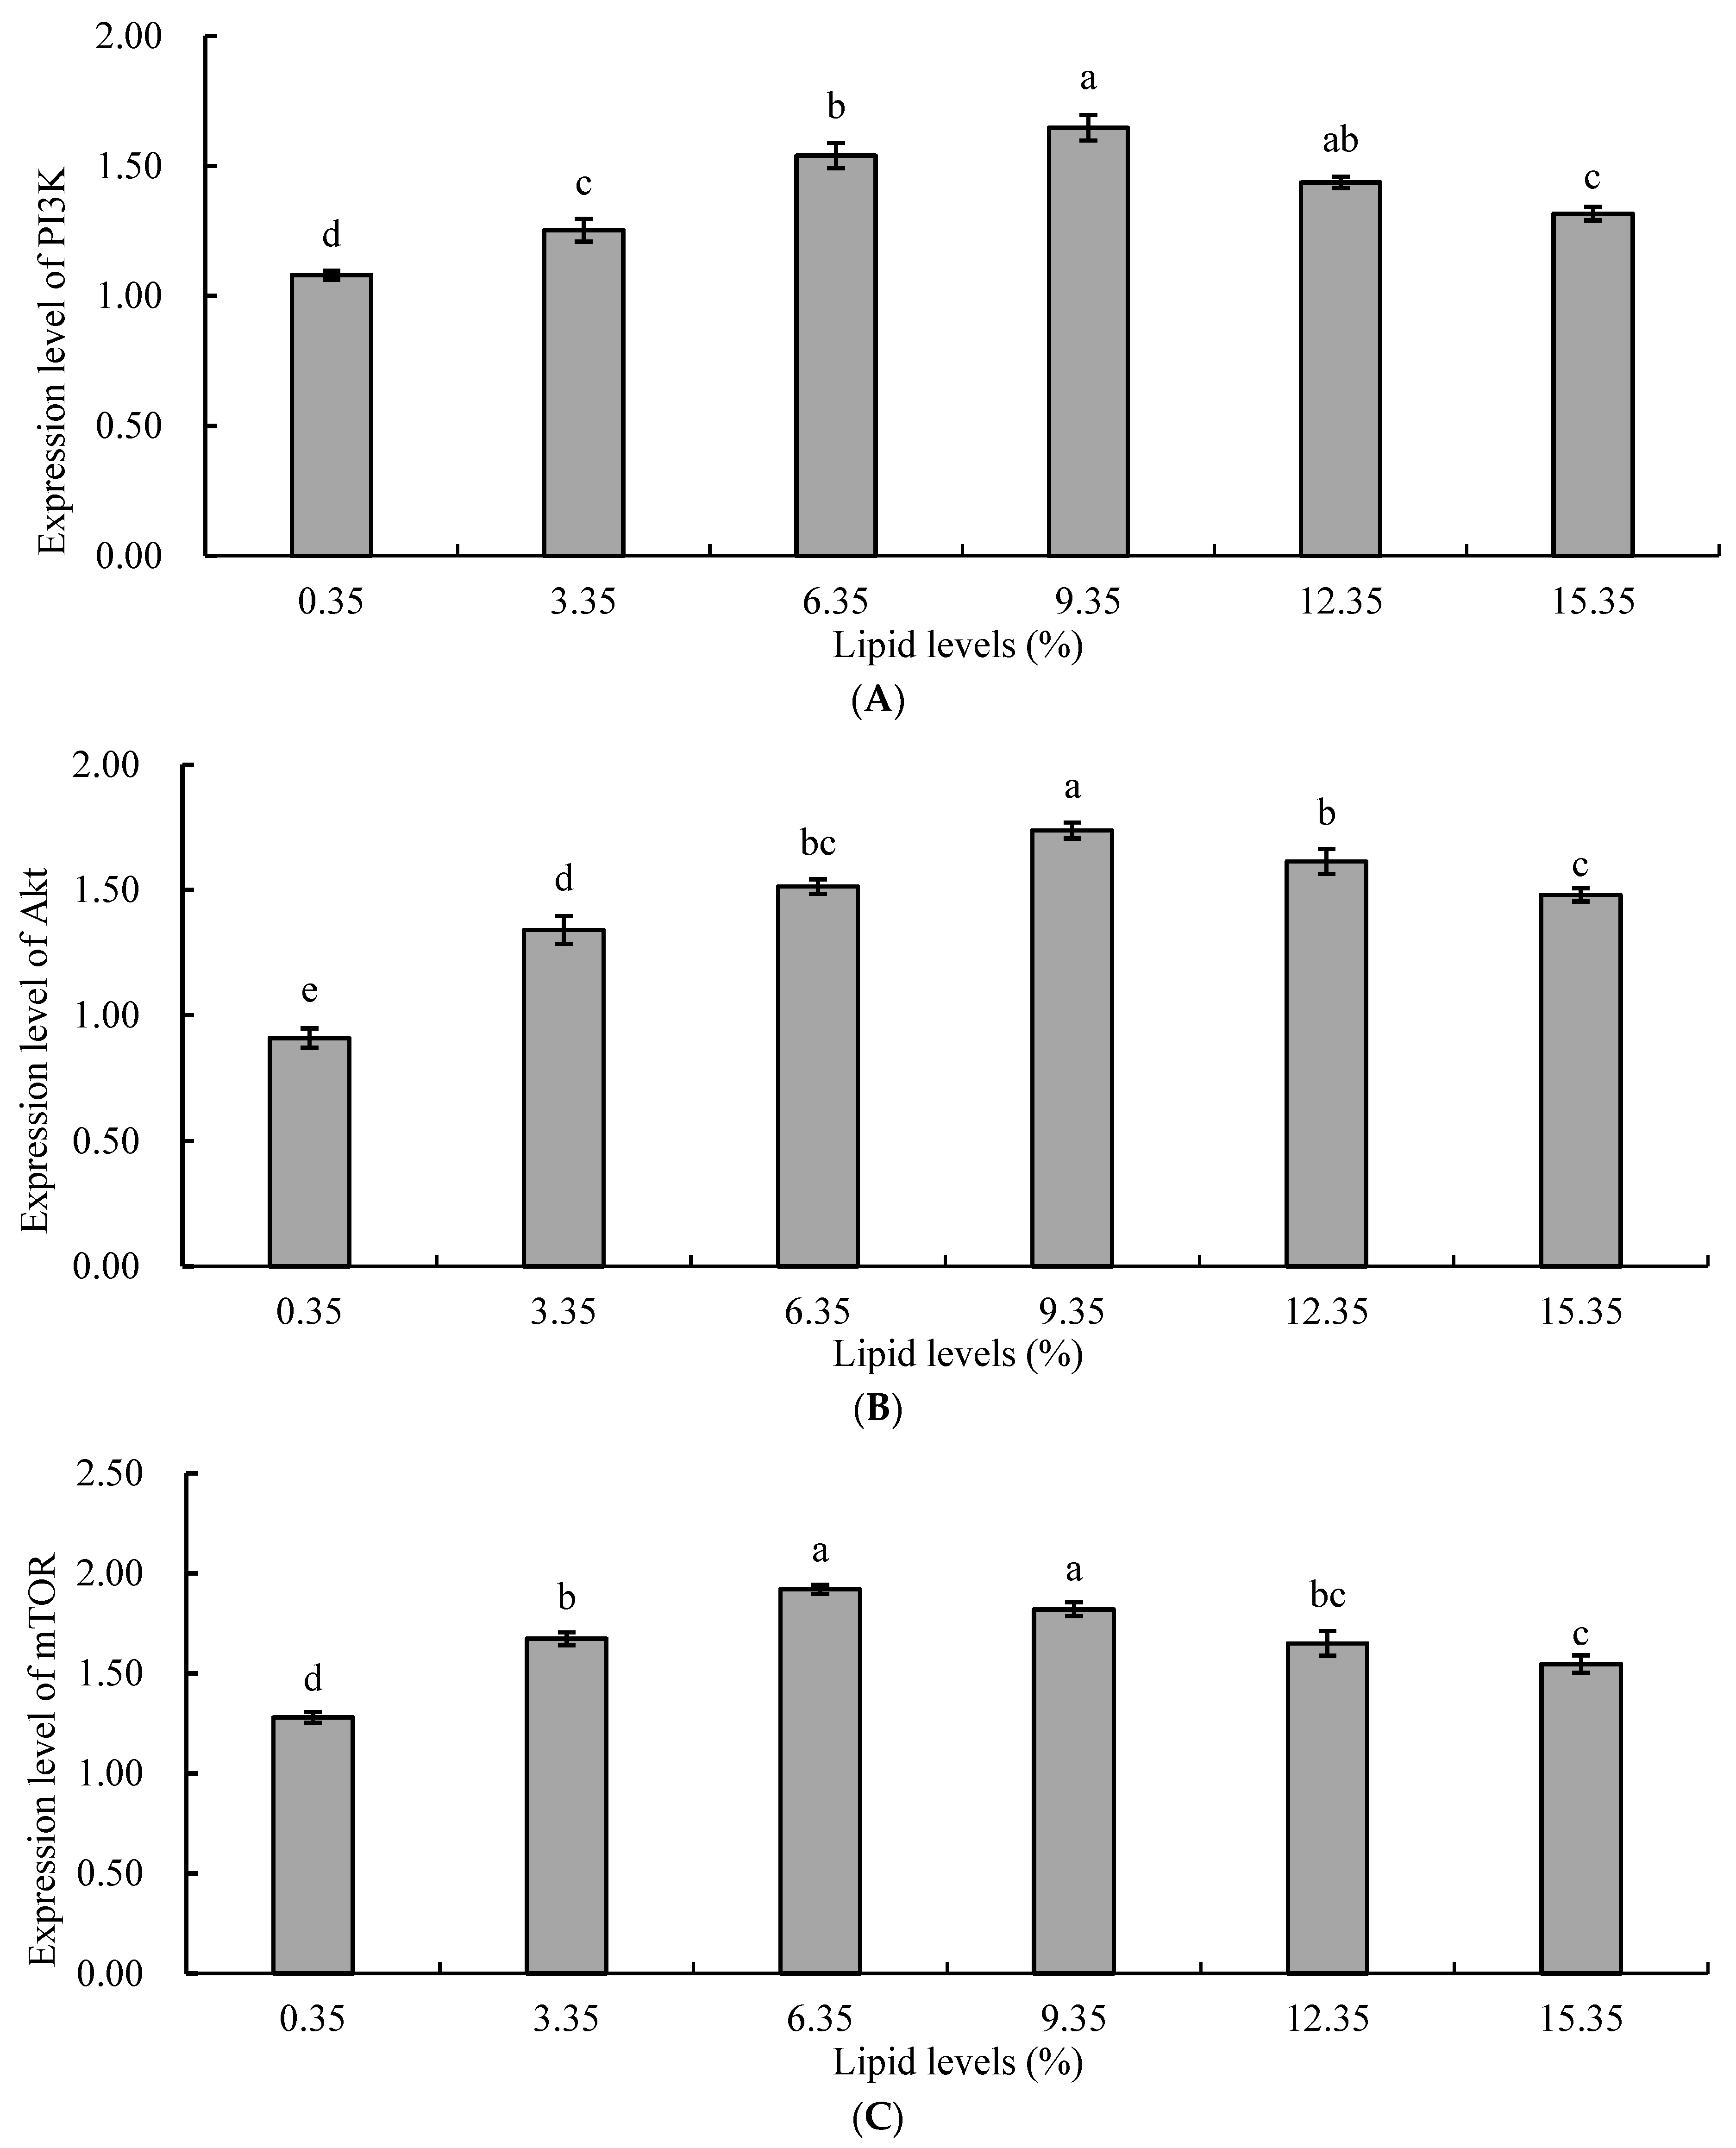
Protein synthesis in aquatic animals is regulated by the rapamycin target protein signaling pathway (PI3K/Akt/mTOR). The PI3K/Akt/mTOR signaling pathway plays a crucial role in protein synthesis metabolism by regulating the activity of ribosomal protein S6 kinases (S6Ks) and eukaryotic translation initiation factor 4E-binding protein (4E-BP), thereby controlling protein synthesis and lipid synthesis [58]. In this study, the expression levels of mTOR, PI3K, and Akt genes in the liver of juvenile tilapia in the lipid supplementation groups were significantly higher than those in the control group. With increasing levels of lipids, the relative expression levels of mTOR, PI3K, and Akt genes in the liver of juvenile tilapia in the experimental groups initially increased and then decreased. It could be inferred that an appropriate concentration of lipids could increase the rate of protein metabolism, enhance the utilization and absorption of protein in juvenile tilapia, and promote the expression of protein metabolism-related genes. The reason for this might be that an increase in lipid intake increases the metabolic energy of the organism, resulting in a decreased proportion of protein in the feed being used for energy, and more protein being used for the synthesis of fish protein, promoting growth, development, and reproduction in fish [59]. Additionally, the PI3K/Akt/mTOR pathway was also an important signaling pathway involved in regulating lipid metabolism, mainly by regulating the expression of lipid synthesis-related factors, and enzymes and played a role in regulating lipid metabolism [60]. Therefore, an increase in the level of dietary lipids also upregulated the expression of genes related to the PI3K/Akt/mTOR pathway. When the level of dietary lipid was too high, a large amount of lipid accumulated in liver cells, inducing oxidative damage to liver tissue, disrupting lipid metabolism in the body, and subsequently feedback inhibiting the expression of genes related to the PI3K/Akt/mTOR pathway [61]. In Li’s study, high-lipid diets were found to inhibit the expression of genes related to the PI3K/Akt/mTOR pathway in Chinese soft-shelled turtles (Pelodiscus sinensis) [62]. In Xin’s study on cows, high concentrations of fatty acid diets were found to downregulate the phosphorylation levels of mTOR and S6K1 [63]. In Yu’s study on coho salmon (Oncorhynchus kisutch), as the level of dietary lipids increased, the expression of Akt, PI3K, and mTOR genes initially increased and then decreased [64]. In a study on Senegalese sole (Solea senegalensis), feeding a high concentration of lipids led to the downregulation of genes related to the PI3K/AKT/mTOR pathway in the muscle [65].

5. Conclusions

In summary, the addition of lipids in the feed could affect the serum biochemical parameters, enhance the antioxidant responses in the liver and serum, improve the non-specific immune parameters in the serum, downregulate the expression of the inflammatory response genes, and upregulate the expression of the mTOR pathway genes. The greatest effect was found in the diet with 9.35% lipid, which is the optimal dietary lipid in the experiment.
However, it is important to note that high-lipid diets can also have negative consequences, such as obesity, liver disease, and cardiovascular disease in fish. More research is needed to determine the optimal lipid level for fish and to develop cost-effective and environmentally sustainable aquaculture practices that use high-lipid feeds. Additionally, this study did not measure the levels of specific fatty acids in the feed. Future studies should measure the levels of specific fatty acids in the feed and assess their impact on the growth performance, metabolic processes, amino acid or peptide absorption, antioxidant, and non-specific immune functions of fish.

Author Contributions

Conceptualization, Y.L. and Q.Z.; Methodology, Y.L., E.H., Y.X., L.M., D.L., Z.Z., J.Z. and Q.Z.; Investigation, Y.L., E.H., Y.X., L.M., D.L., Z.Z., J.Z. and Q.Z.; Data curation, Y.L., E.H., Q.Z. and T.T.; Writing original draft preparation, E.H.; Writing—review and editing, Y.L., E.H. and Q.Z.; Supervision, Y.L.; Funding acquisition, Y.L., Q.Z. and T.T.; Validation and visualization, Y.L., E.H., Y.X., L.M., D.L., Z.Z., J.Z. and Q.Z.; Formal analysis, Y.L., E.H. and Q.Z.; Project administration, Y.L., Q.Z. and T.T. All authors have read and agreed to the published version of the manuscript.

Funding

This research was funded by grants from the Scientific Research Foundation for the Introduced Talents of Guangxi Minzu University (2021KJQD17); the Research Capacity Enhancement Project for Young and Middle-aged Teachers in Guangxi Universities (2023KY0174); the Joint Funds of the National Natural Science Foundation of China (U20A2064); the Shandong Provincial Key Research and Development Programs (2019JZZY020710); the Innovation-driven Development Special Fund Project of Guangxi (AA17204044); the Grants from the Scientific Research Foundation for the Introduced Talents of Guangxi Minzu University (2018KJQD14).

Institutional Review Board Statement

All animal experiments were approved by the Ethics Committee of Guangxi Minzu University, Nanning, China (Approved No. GXMZU-2022-002), and this research does not contain any studies with human participants.

Informed Consent Statement

Not applicable.

Data Availability Statement

The original contributions presented in the study are included in the article, and further inquiries can be directed to the corresponding author(s).

Conflicts of Interest

The authors declare that they have no known competing financial interest or personal relationship that could have appeared to influence the work reported in this paper.

References

  1. Paulino, R.R.; Silva, R.F.; Guevara, M.J.P.; Rodrigues, E.J.D.; Costa, L.S.; Alves, A.P.D.C.; Teles, A.O.; Rosa, P.V. Dietary lipid level and source affect metabolic responses in hybrid catfish (Pseudoplatystoma reticulatum × Leiarius marmoratus). Aquac. Res. 2020, 51, 1567–1583. [Google Scholar] [CrossRef]
  2. Ding, Z.; Liu, Y.; Liu, X.; Han, J.; Zheng, Y.; Li, W.; Xu, Y. Growth performance, nucleic acids, leptin and adiponectin and their receptor gene expression were significantly affected by feeding different lipid supplementation in GIFT tilapia juveniles. Aquac. Res. 2021, 52, 1046–1062. [Google Scholar] [CrossRef]
  3. Ding, Z.; Liu, Y.; Han, J.; Liu, X.; Zheng, Y.; Li, W.; Xu, Y. Dietary Lipid Supplementation Could Significantly Affect the Growth, Fatty Acid Profiles, and Expression of PPARα, Leptin, and Adiponectin Genes in Juvenile Genetically Improved Farmed Tilapia. Eur. J. Lipid Sci. Technol. 2020, 123, 19–22. [Google Scholar] [CrossRef]
  4. Dawood, M.A.O.; Eweedah, N.M.; Khalafalla, M.M.; Khalid, A. Evaluation of fermented date palm seed meal with Aspergillus oryzae on the growth, digestion capacity and immune response of Nile tilapia (Oreochromis niloticus). Aquac. Nutr. 2020, 26, 828–841. [Google Scholar] [CrossRef]
  5. Zhang, Q.; Yang, Q.; Guo, M.; Li, F.; Qin, M.; Xie, Y.; Xu, J.; Liu, Y.; Tong, T. The Effects of Dietary Fermented Soybean Meal Supplementation on the Growth, Antioxidation, Immunity, and mTOR Signaling Pathway of Juvenile Coho Salmon (Oncorhynchus kisutch). Fishes 2023, 8, 448. [Google Scholar] [CrossRef]
  6. Soares, M.P.; Cardoso, I.L.; Ishikawa, M.M.; Oliveira, A.D.S.S.; Sartoratto, A.; Jonsson, C.M.; Queiroz, S.C.D.N.; Duarte, M.C.T.; Rantin, F.T.; Sampaio, F.G. Effects of Artemisia annua alcohol extract on physiological and innate immunity of Nile tilapia (Oreochromis niloticus) to improve health status. Fish Shellfish Immunol. 2020, 105, 369–377. [Google Scholar] [CrossRef]
  7. Zhao, Y.; Wang, L.; Gao, J. Effects of dietary highly unsaturated fatty acid levels on growth, fatty acid profiles, antioxidant activities, mucus immune responses and hepatic lipid metabolism related gene expressions in loach (Misgurnus anguillicaudatus) juveniles. Aquac. Res. 2019, 50, 2486–2495. [Google Scholar] [CrossRef]
  8. Jin, M.; Lu, Y.; Yuan, Y.; Li, Y.; Qiu, H.; Sun, P.; Ma, H.N.; Ding, L.Y.; Zhou, Q.C. Regulation of growth, antioxidant capacity, fatty acid profiles, hematological characteristics and expression of lipid related genes by different dietary n-3 highly unsaturated fatty acids in juvenile black seabream (Acanthopagrus schlegelii). Aquaculture 2017, 471, 55–65. [Google Scholar] [CrossRef]
  9. Shi, Y.; Zhong, L.; Zhang, J.Z.; Ma, X.K.; Hu, Y. Substitution of fish meal with krill meal in rice field eel (Monopterus albus) diets: Effects on growth, immunity, muscle textural quality, and expression of myogenic regulation factors. Anim. Feed Sci. Technol. 2021, 280, 115047. [Google Scholar] [CrossRef]
  10. Yanlin, G.; Dong, H.; Mingzhu, P.; Mengxi, Y.; Kai, L.; Jiahuan, L.; Chenglong, W.; Wenbing, Z.; Kangsen, M. High dietary lipid level decreases the immunity and disease resistance of abalone Haliotis discus hannai and affects the perilipin-2/TLR4, JNK and Keap1/Nrf2 pathways. Aquac. Nutr. 2021, 27, 2042–2055. [Google Scholar] [CrossRef]
  11. Meng, Y.; Li, C.; Qin, Q.; Tong, Y.; Zhu, R.; Xu, G.; Shi, Y.; Shi, J.; Ma, R. Dietary Lipid Levels Affect the Growth Performance, Lipid Deposition, and Antioxidative Capacity of Juvenile Scaleless Carp, Gymnocypris przewalskii, on the Qinghai-Tibetan Plateau. J. World Aquacult. Soc. 2018, 49, 788–797. [Google Scholar] [CrossRef]
  12. Lee, C.H.; Kim, H.S.; Lee, K.W.; Han, G.S.; Choi, J. Effects of dietary lipid level on growth performance, feed utilization, fatty composition and antioxidant parameters of juvenile walleye pollock, Gadus chalcogrammus. Aquacult. Rep. 2021, 19, 100631. [Google Scholar] [CrossRef]
  13. Xiuhua, M.; Qingzhu, B.; Yaoyao, K.; Houguo, X.; Mengqing, L.; Kangsen, M.; Yanjiao, Z. Dietary lipid levels affected antioxidative status, inflammation response, apoptosis and microbial community in the intestine of juvenile turbot (Scophthalmus maximus L.). Comp. Biochem. Physiol. Part A Mol. Integr. Physiol. 2021, 264, 111118. [Google Scholar] [CrossRef]
  14. Ahmadifar, E.; Kalhor, N.; Dawood, M.A.O.; Ahmadifar, M.; Yousefi, M. Effects of dietary poumaric acid on the growth performance, digestive enzyme activity, humoral immunity and immune-related gene expression in common carp. Cyprinus carpio. Aquac. Nutr. 2021, 27, 747–756. [Google Scholar] [CrossRef]
  15. Xie, S.; Lin, Y.; Wu, T.; Tian, L.; Liang, J.; Tan, B. Dietary lipid levels affected growth performance, lipid accumulation, inflammatory response and apoptosis of japanese seabass (lateolabrax japonicus). Aquac. Nutr. 2021, 27, 807–816. [Google Scholar] [CrossRef]
  16. Peterson, K.R.; Sabatini, D.M.; Sengupta, S. Regulation of the mTOR complex 1 pathway by nutrients, growth factors, and stress. Mol. Cell 2010, 40, 310–322. [Google Scholar] [CrossRef]
  17. Wu, C.C.; Hou, S.; Orr, B.A.; Kuo, B.R.; Youn, Y.H.; Ong, T.; Roth, F.; Eberhart, C.G.; Robinson, G.W.; Solecki, D.J. mTORC1-Mediated Inhibition of 4EBP1 Is Essential for Hedgehog Signaling-Driven Translation and Medulloblastoma. Dev. Cell 2017, 43, 673–688. [Google Scholar] [CrossRef]
  18. Wacyk, J.; Powell, M.; Rodnick, K.; Overturf, K.; Hill, R.A.; Hardy, R. Dietary protein source significantly alters growth performance, plasma variables and hepatic gene expression in rainbow trout (Oncorhynchus mykiss) fed amino acid balanced diets. Aquaculture 2012, 356–357, 223–234. [Google Scholar] [CrossRef]
  19. Wang, Y.; Li, K.; Han, H.; Zheng, Z.X.; Bureau, D.P. Potential of using a blend of rendered animal protein ingredients to replace fish meal in practical diets for malabar grouper (Epinephelus malabricus). Aquaculture 2008, 281, 117. [Google Scholar] [CrossRef]
  20. Wang, A.M.; Han, G.M.; Feng, G.N.; Yang, W.P.; Xu, P. Effects of dietary lipid levels on growth performance, nutrient digestibility and blood biochesmical indices of GIFT tilapia (Oreochromis niloticus). Acta Hydrobiol. Sinica. 2011, 35, 80–87. [Google Scholar] [CrossRef]
  21. Zhang, Q.; Guo, M.; Li, F.; Qin, M.; Yang, Q.; Yu, H.; Xu, J.; Liu, Y.; Tong, T. Evaluation of Fermented Soybean Meal to Replace a Portion Fish Meal on Growth Performance, Antioxidant Capacity, Immunity, and mTOR Signaling Pathway of Coho Salmon (Oncorhynchus kisutch). Aquac. Nutr. 2023, 2023, 2558173. [Google Scholar] [CrossRef]
  22. Schmittgen, T.D.; Livak, K.J. Analyzing real-time PCR data by the comparative C(T) method. Nat. Protoc. 2008, 3, 1101–1108. [Google Scholar] [CrossRef]
  23. Rao, Y.V.; Das, B.K.; Jyotyrmayee, P.; Chakrabarti, R. Effect of Achyranthes aspera on the immunity and survival of Labeo rohita infected with Aeromonas hydrophila. Fish Shellfish Immunol. 2006, 20, 263–273. [Google Scholar] [CrossRef]
  24. Zhou, X.; Xin, W.; Tang, X.; Gao, Y.; Huang, R.; Yin, Y. Effects of Different Dietary Arginine Activator Additive on Growth Performance and Plasma Biochemical Parameters in Early-weaned Piglets. Res. Agric. Modernizat. 2010, 31, 237–240. [Google Scholar] [CrossRef]
  25. Chen, T.; Shen, Y.; Li, R. Effect of different fat levels on the growth and blood biochemical indices of juvenile red tilapia. Chinese Feed Res. 2019, 42, 20–23. [Google Scholar] [CrossRef]
  26. Mritunjoy, P.; Parimal, S.; Prasad, S.N.; Prasanta, J.; Dharmendra, D.A.; Vungurala, H.; Tincy, V.; Nazeema, S.; Pankaj, K.; Gopal, K. Effect of Dietary Lipid Level on Growth Performance, Body Composition, and Physiometabolic Responses of Genetically Improved Farmed Tilapia (GIFT) Juveniles Reared in Inland Ground Saline Water. Aquac. Nutr. 2022, 2022, 5345479. [Google Scholar] [CrossRef]
  27. Li, P.; Song, Z.; Huang, L.; Sun, Y.; Sun, Y.; Wang, X.; Li, L. Effects of Dietary Protein and Lipid Levels in Practical Formulation on Growth, Feed Utilization, Body Composition, and Serum Biochemical Parameters of Growing Rockfish Sebastes schlegeli. Aquac. Nutr. 2023, 2023, 65–70. [Google Scholar] [CrossRef] [PubMed]
  28. Liu, G.; Chen, L.; Tian, H.; Sun, G.; Wei, F.; Meng, Y.; Ma, R. Adult Triploid Rainbow Trout Can Adapt to Various Dietary Lipid Levels by Coordinating Metabolism in Different Tissues. Metabolites 2023, 13, 396. [Google Scholar] [CrossRef] [PubMed]
  29. Wu, F.; Tian, J.; Yu, L.; Wen, H.; Jiang, M.; Lu, X. Effects of dietary rapeseed meal levels on growth performance, biochemical indices and flesh quality of juvenile genetically improved farmed tilapia. Aquacult. Rep. 2021, 20, 4–6. [Google Scholar] [CrossRef]
  30. Ding, L.; Zhang, L.; Wang, J.; Ma, J.; Meng, X.; Duan, P.; Sun, L.; Sun, Y. Effect of dietary lipid level on the growth performance, feed utilization, body composition and blood chemistry of juvenile starry flounder (Platichthys stellatus). Aquac. Res. 2010, 41, 1470–1478. [Google Scholar] [CrossRef]
  31. Jin, Y.; Tian, L.X.; Zeng, S.L.; Xie, S.W.; Liu, Y.J. Dietary lipid requirement on non-specific immune responses in juvenile grass carp (Ctenopharyngodon idella). Fish Shellfish Immunol. 2013, 34, 1202–1208. [Google Scholar] [CrossRef]
  32. Zhao, W.; Luo, J.; Fang, F.; Zhu, T.; Xie, S.; Yang, Z.; Guo, C.; Yang, Y.; Li, X.; Jiao, L.; et al. Differential regulatory effects of dietary lipid level on growth, antioxidant capacity and expression of genes involved in lipid and glucose metabolism of juvenile mud crab Scylla paramamosain. Aquacult. Rep. 2023, 29. [Google Scholar] [CrossRef]
  33. Zhang, W.; Dan, Z.; Zhuang, Y.; Zheng, J.; Gong, Y.; Liu, Y.; Mai, K.; Ai, Q. Effects of Dietary Lipid Levels on Growth, Digestive Enzyme Activities, Antioxidant Capacity, and Lipid Metabolism in Turbot (Scophthalmus maximus L.) at Three Different Stages. Aquac. Nutr. 2022, 2022, 1042263. [Google Scholar] [CrossRef]
  34. Shen, Y.; Li, X.; Bao, Y.; Zhu, T.; Wu, Z.; Yang, B.; Jiao, L.; Zhou, Q.; Jin, M. Differential regulatory effects of optimal or excessive dietary lipid levels on growth, lipid metabolism and physiological response in black seabream (Acanthopagrus schlegelii). Aquaculture 2022, 560, 738532. [Google Scholar] [CrossRef]
  35. Meng, Y.; Tian, H.; Hu, X.; Han, B.; Li, X.; Zhong, L.; Ma, R. Effects of Dietary Lipid Levels on the Lipid Deposition and Metabolism of Subadult Triploid Rainbow Trout (Oncorhynchus mykiss). Aquac. Nutr. 2022, 2022, 6924835. [Google Scholar] [CrossRef]
  36. Wang, J.; Xu, H.; Zuo, R.; Mai, K.; Xu, W.; Ai, Q. Effects of oxidised dietary fish oil and high-dose vitamin E supplementation on growth performance, feed utilisation and antioxidant defence enzyme activities of juvenile large yellow croaker (Larmichthys crocea). Br. J. Nutr. 2016, 115, 1531–1538. [Google Scholar] [CrossRef]
  37. Shimazawa, M.; Nakajima, Y.; Mashima, Y.; Hara, H. Docosahexaenoic acid (DHA) has neuroprotective effects against oxidative stress in retinal ganglion cells. Brain Res. 2009, 1251, 269–275. [Google Scholar] [CrossRef]
  38. Richard, D.; Kefi, K.; Barbe, U.; Bausero, P.; Visioli, F. Polyunsaturated fatty acids as antioxidants. Pharmacol. Res. 2008, 57, 451–455. [Google Scholar] [CrossRef]
  39. Sheikhzadeh, N.; Tayefi-Nasrabadi, H.; Oushani, A.; Enferadi, M. Effects of Haematococcus pluvialis supplementation on antioxidant system and metabolism in rainbow trout (Oncorhynchus mykiss). Fish Physiol. Biochem. 2012, 38, 413–419. [Google Scholar] [CrossRef]
  40. Gou, N.; Chang, Z.; Deng, W.; Ji, H.; Zhou, J. Effects of dietary lipid levels on growth, fatty acid composition, antioxidant status and lipid metabolism in juvenile Onychostoma macrolepis. Aquac. Res. 2019, 50, 3369–3381. [Google Scholar] [CrossRef]
  41. Montero, D.; Tort, L.; Izquierdo, M.S.; Socorro, J.; Robaina, L.; Vergara, J.M.; Fernández-Palacios, H. Effect of a-Tocopherol and n-e HUFA deficient diets on blood cells, selected immune parameters and body composition of gilthead seabream (Sparus aurata). In Modulators of Immune Responses. The Evolutionary Trail; SOS Publications: Lagos, Nigeria, 1996; pp. 251–266. [Google Scholar]
  42. Montero, D.; Socorro, J.; Tort, L.; Caballero, M.J.; Robaina, L.E.; Vergara, J.M.; Izquierdo, M.S. Glomerulonephritis and immunosuppression associated with dietary essential fatty acid deficiency in gilthead sea bream, Sparus aurata L., juveniles. J. Fish Dis. 2010, 27, 297–306. [Google Scholar] [CrossRef]
  43. Yang, Y.; Bing, X.; Xu, Z. Effects of non-specific immune and metabolism indices on Monopterus albus fed by feedstuff containing unsaturated fatty acids. J. Fish. Sci. China 2008, 15, 600–605. [Google Scholar] [CrossRef]
  44. Zuo, R.; Ai, Q.; Mai, K.; Xu, W.; Wang, J.; Xu, H.; Liu, Z.; Zhang, Y. Effects of dietary n-3 highly unsaturated fatty acids on growth, nonspecific immunity, expression of some immune related genes and disease resistance of large yellow croaker (Larmichthys crocea) following natural infestation of parasites (Cryptocaryon irritans). Fish Shellfish Immunol. 2012, 32, 249–258. [Google Scholar] [CrossRef]
  45. Gill, R.; Tsung, A.; Billiar, T. Linking oxidative stress to inflammation: Toll-like receptors. Free Radic. Biol. Med. 2010, 48, 1121–1132. [Google Scholar] [CrossRef]
  46. Henry, M.; Fountoulaki, E. Optimal dietary protein/lipid ratio for improved immune status of a newly cultivated Mediterranean fish species, the shi drum Umbrina cirrosa L. Fish Shellfish Immunol. 2014, 37, 215–219. [Google Scholar] [CrossRef]
  47. Kinsella, J.E.; Lokesh, B.R.; Broughton, S.; Whelan, J. Dietary polyunsaturated fatty acids and eicosanoids: Potential effects on the modulation of inflammatory and immune cells: An overview. Nutrition 1990, 6, 24–44. [Google Scholar]
  48. Siti, H.N.; Kamisah, Y.; Kamsiah, J. The role of oxidative stress, antioxidants and vascular inflammation in cardiovascular disease (a review). Vasc. Pharmacol. 2015, 71, 40–56. [Google Scholar] [CrossRef]
  49. Yang, Y.C.; Lii, C.K.; Wei, Y.L.; Li, C.C.; Lu, C.Y.; Liu, K.L.; Chen, H.W. Docosahexaenoic acid inhibition of inflammation is partially via cross-talk between Nrf2/heme oxygenase 1 and IKK/NF-κB pathways. J. Nutr. Biochem. 2013, 24, 204–212. [Google Scholar] [CrossRef]
  50. Nayak, M.; Saha, A.; Pradhan, A.; Samanta, M.; Mohanty, T.K.; Giri, S.S. Influence of dietary lipid levels on growth, nutrient utilization, tissue fatty acid composition and desaturase gene expression in silver barb (Puntius gonionotous) fingerlings. Comp. Biochem. Physiol. Part B Biochem. Mol. Biol. 2018, 226, 18–25. [Google Scholar] [CrossRef]
  51. Yaqoob, P.; Calder, P. Effects of dietary lipid manipulation upon inflammatory mediator production by murine macrophages. Cell. Immunol. 1995, 163, 120. [Google Scholar] [CrossRef]
  52. Fritsche, K.L.; Anderson, M.; Feng, C. Consumption of Eicosapentaenoic Acid and Docosahexaenoic Acid Impair Murine Interleukin-12 and Interferon-γ Production In Vivo. J. Infect. Dis. 2000, 182, S54–S61. [Google Scholar] [CrossRef]
  53. Mcmurray, D.N.; Jolly, C.A.; Chapkin, R.S. Effects of Dietary n-3 Fatty Acids on T Cell Activation and T Cell Receptor-Mediated Signaling in a Murine Model. J. Infect. Dis. 2000, 182, S103–S107. [Google Scholar] [CrossRef]
  54. Kugor, S.; Kugor, A.; Todorevi, M.; Torgersen, J.; Ruyter, B.; Krasnov, A. Exposure to lipopolysaccharide induces immune genes in cultured preadipocytes of Atlantic salmon. Fish Shellfish Immunol. 2010, 29, 817–824. [Google Scholar] [CrossRef]
  55. Wang, X.; Cheng, M.; Zhao, M.; Ge, A.; Guo, F.; Zhang, M.; Yang, Y.; Liu, L.; Yang, N. Differential effects of high-fat-diet rich in lard oil or soybean oil on osteopontin expression and inflammation of adipose tissue in diet-induced obese rats. Eur. J. Nutr. 2013, 52, 1181–1189. [Google Scholar] [CrossRef]
  56. Lall, S.; Milley, J.; Higgs, D.; Balfry, S. Dietary lipids, immune function and pathogenesis of disease in fish. In Proceedings of the 37th Eastern Nutrition Conference, Halifax, NS, Canada, 15–16 May 2001; Animal Nutrition Association of Canada: Ottawa, ON, Canada, 2001. Available online: https://www.researchgate.net/publication/237783350 (accessed on 1 September 2023).
  57. Wang, Z.; Liu, D.; Wang, F.; Liu, S.; Zhao, S.; Ling, E.; Hao, A. Saturated fatty acids activate microglia via Toll-like receptor 4/NF-κB signalling. Br. J. Nutr. 2012, 107, 229–241. [Google Scholar] [CrossRef]
  58. Wang, X. The mTOR Pathway in the Control of Protein Synthesis. Physiology 2006, 21, 362. [Google Scholar] [CrossRef]
  59. Skalli, A.; Hidalgo, M.C.; Abellán, E.; Arizcun, M.; Cardenete, G. Effects of the dietary protein/lipid ratio on growth and nutrient utilization in common dentex (Dentex dentex L.) at different growth stages. Aquaculture 2004, 235, 1–11. [Google Scholar] [CrossRef]
  60. Yi, J.; Zhu, J.; Wu, J.; Thompson, C.B.; Jiang, X. Oncogenic activation of PI3K-AKT-mTOR signaling suppresses ferroptosis via SREBP-mediated lipogenesis. Proc. Natl. Acad. Sci. USA 2017, 117, 31189–31197. [Google Scholar] [CrossRef]
  61. Du, Z.Y.; Liu, Y.J.; Tian, L.X.; Wang, J.T.; Wang, Y.; Liang, G.Y. Effect of dietary lipid level on growth, feed utilization and body composition by juvenile grass carp (Ctenopharyngodon idella). Aquac. Nutr. 2005, 11, 139–146. [Google Scholar] [CrossRef]
  62. Li, H.H.; Pan, Y.X.; Liu, L.; Li, Y.L.; Shen, Y.D. Effects of high-fat diet on muscle textural properties, antioxidant status and autophagy of Chinese soft-shelled turtle (Pelodiscus sinensis). Aquaculture 2019, 511, 734228. [Google Scholar] [CrossRef]
  63. Shu, X.; Fang, Z.; Guan, Y.; Chen, X.; Li, X. High levels of fatty acids inhibit β-casein synthesis through suppression of the JAK2/STAT5 and mTOR signaling pathways in mammary epithelial cells of cows with clinical ketosis. J. Dairy Res. 2020, 87, 212–219. [Google Scholar] [CrossRef] [PubMed]
  64. Yu, H.; Shan, L.; Li, L.; Zhang, Q.; Liu, D. Effect of dietary lipid levels on the anti-oxidant responses, initial immunity, and mTOR signaling in the liver of coho salmon (Oncorhynchus kisutch). Aquacult. Rep. 2022, 23, 101090. [Google Scholar] [CrossRef]
  65. Borges, P.; Valente, L.M.P.; Véron, V.; Dias, K.; Panserat, S.; Médale, F. High Dietary Lipid Level Is Associated with Persistent Hyperglycaemia and Downregulation of Muscle Akt-mTOR Pathway in Senegalese Sole (Solea senegalensis). PLoS ONE 2014, 9, e102196. [Google Scholar] [CrossRef] [PubMed]
Figure 1. Effect of dietary lipid supplementation on the expression level of tumor necrosis factor α (TNF-α, A), interleukin 1β (IL-1β, B), and interleukin 6 (IL-6, C) genes of juvenile tilapia, in which (■) indicates spleen, (□) head kidney, and (Fishes 08 00535 i001) liver. All the above data are mean ± SE (n = 3 tanks per condition). Different superscript letters in the figure indicate significant differences among the data (p < 0.05). The F-value of TNF-α in the spleen, head kidney, and liver are 23.647, 47.424, and 17.965, respectively. The F-value of IL-1β in the spleen, head kidney, and liver are 63.120, 39.355, and 17.616, respectively. The F-values of IL-6 in the spleen, head kidney, and liver are 73.451, 21.784, and 28.580, respectively. The p-values of TNF-α, IL-1β, and IL-6 in the spleen, head kidney, and liver are all 0.000.
Fishes 08 00535 g001aFishes 08 00535 g001b
Figure 2. Effect of dietary lipid supplementation on the expression level of phosphoinositide 3-kinase (PI3K, A), Akt protein kinase B (Akt, B), and mammalian target of rapamycin (mTOR, C) genes in the liver of juvenile tilapia. All the above data are mean ± SE (n = 3 tanks per condition). Different superscript letters in the figure indicate significant differences among the data (p < 0.05). The F-values of PI3K, Akt, and mTOR are 30.562, 52.493, and 32.518, respectively. the p-values of PI3K, Akt, and mTOR are all 0.000.
Fishes 08 00535 g002
Table 1. Composition of the experimental diets for juvenile tilapia (g/100 g of dried diet).
IngredientsLipid Levels (%)
0.353.356.359.3512.3515.35
Fish oil0.003.006.009.0012.0015.00
Casein33.0033.0033.0033.0033.0033.00
Dextrin51.5748.5745.5742.5739.5736.57
Gelatin5.005.005.005.005.005.00
Cellulose5.005.005.005.005.005.00
Vitamin mixture *1.001.001.001.001.001.00
Mineral mixture **3.003.003.003.003.003.00
Choline chloride0.300.300.300.300.300.30
Sodium chloride0.500.500.500.500.500.50
Adhesive0.500.500.500.500.500.50
Attractant0.010.010.010.010.010.01
Preservative0.100.100.100.100.100.10
Antioxidants0.020.020.020.020.020.02
Proximate composition (%)
Crude protein34.0034.0034.0034.0034.0034.00
Crude fat0.353.356.359.3512.3515.35
Ash2.362.332.182.962.642.73
Moisture9.369.489.139.229.549.11
Crude fiber5.345.345.345.345.345.34
Nitrogen-free extract48.5945.5043.0039.1336.1333.47
Gross energy (Mcal/kg)3.133.303.473.643.813.98
Notes: * Vitamins mixture (IU or mg/kg of dried feed): vitamin A 2500 IU; vitamin D3 1200 IU; vitamin K3 60 IU; folic acid 5 mg; vitamin B1 10 mg; vitamin B2 10 mg; vitamin B6 20 mg; vitamin B12 0.15 mg; niacin 40 mg; calcium pantothenate 20 mg; inositol 150 mg; Biotin 0.2 mg; vitamin C 150 mg; vitamin E 60 mg. ** Mineral mixture (mg/kg of dried feed): iron 15 mg; zinc 20 mg; manganese 2 mg; copper 1 mg; iodine 0.2 mg; selenium 0.05 mg; cobalt 0.25 mg; magnesium 0.06 mg; potassium 40 mg.
Table 2. Fatty acid composition in fish oil and formulated diets (g/100 g).
Fatty AcidFish OilLipid Levels (%)
0.353.356.359.3512.3515.35
C14:05.37 ± 0.150.47 ± 0.021.83 ± 0.062.51 ± 0.073.12 ± 0.064.12 ± 0.084.93 ± 0.10
C16:014.71 ± 0.6787.39 ± 1.8812.56 ± 0.6513.61 ± 0.3412.87 ± 0.6313.16 ± 0.2213.77 ± 0.56
C17:01.66 ± 0.030.08 ± 0.000.61 ± 0.010.81 ± 0.011.00 ± 0.011.15 ± 0.021.21 ± 0.01
C18:03.26 ± 0.110.45 ± 0.014.92 ± 0.104.45 ± 0.114.74 ± 0.064.23 ± 0.124.25 ± 0.05
∑SFAs 125.00 ± 0.7288.39 ± 2.1519.92 ± 0.6621.38 ± 0.4121.73 ± 0.4522.66 ± 0.3324.16 ± 0.57
C16:1n − 77.52 ± 0.120.08 ± 0.012.35 ± 0.033.29 ± 0.064.27 ± 0.075.19 ± 0.066.92 ± 0.11
C18:1n − 917.59 ± 0.340.63 ± 0.0219.58 ± 0.1318.74 ± 0.1617.73 ± 0.0817.46 ± 0.1116.52 ± 0.12
∑MUFAs 225.11 ± 0.360.71 ± 0.0221.93 ± 0.1122.03 ± 0.2122.00 ± 0.0722.65 ± 0.1223.44 ± 0.16
C20:2n − 90.44 ± 0.010.05 ± 0.000.39 ± 0.010.38 ± 0.010.36 ± 0.000.36 ± 0.010.35 ± 0.01
C18:2n − 68.50 ± 0.161.33 ± 0.0331.49 ± 0.8226.22 ± 0.7322.71 ± 0.5517.54 ± 0.4213.54 ± 0.33
C18:3n − 60.57 ± 0.010.36 ± 0.020.11 ± 0.000.15 ± 0.010.28 ± 0.010.37 ± 0.010.41 ± 0.02
C20:3n − 60.29 ± 0.010.00 ± 0.000.21 ± 0.000.25 ± 0.000.31 ± 0.020.30 ± 0.010.29 ± 0.01
C20:4n − 60.82 ± 0.020.00 ± 0.000.53 ± 0.010.62 ± 0.010.78 ± 0.020.93 ± 0.020.94 ± 0.01
C22:4n − 60.18 ± 0.010.00 ± 0.000.08 ± 0.000.14 ± 0.010.14 ± 0.000.13 ± 0.010.15 ± 0.01
∑n − 6 PUFAs 310.36 ± 0.171.69 ± 0.0332.42 ± 0.6627.38 ± 0.7424.22 ± 0.6119.27 ± 0.5315.33 ± 0.36
C18:3n − 31.47 ± 0.060.36 ± 0.023.56 ± 0.093.28 ± 0.062.43 ± 0.022.54 ± 0.042.70 ± 0.04
C20:5n − 315.32 ± 0.720.53 ± 0.028.14 ± 0.5610.61 ± 0.3811.58 ± 0.4413.86 ± 0.6515.20 ± 0.63
C22:5n − 32.75 ± 0.020.00 ± 0.000.91 ± 0.011.46 ± 0.031.92 ± 0.032.36 ± 0.042.64 ± 0.03
C22:6n − 310.34 ± 0.230.37 ± 0.025.51 ± 0.336.03 ± 0.267.18 ± 0.357.75 ± 0.248.24 ± 0.13
∑n − 3 PUFAs 429.88 ± 0.861.26 ± 0.0418.12 ± 0.8821.38 ± 0.6223.11 ± 0.7526.51 ± 0.6628.78 ± 0.91
∑n − 3 LC-PUFAs 528.41 ± 0.820.90 ± 0.0214.56 ± 0.7518.10 ± 0.5820.68 ± 0.6323.97 ± 0.6126.08 ± 0.78
∑PUFAs 640.24 ± 0.852.95 ± 0.0850.54 ± 0.9248.76 ± 0.6847.33 ± 0.3645.78 ± 0.7544.11 ± 0.28
n − 3/n − 62.88 ± 0.020.75 ± 0.010.56 ± 0.010.78 ± 0.010.95 ± 0.021.38 ± 0.031.88 ± 0.03
DHA 7 + EPA 825.66 ± 0.780.90 ± 0.0213.65 ± 0.6316.64 ± 0.4718.76 ± 0.6521.61 ± 0.5923.44 ± 0.48
DHA/EPA0.67 ± 0.010.70 ± 0.010.68 ± 0.000.57 ± 0.010.62 ± 0.000.56 ± 0.000.54 ± 0.00
∑FAI 990.35 ± 1.6192.05 ± 1.3292.39 ± 2.0892.17 ± 1.5391.06 ± 2.8591.09 ± 2.2291.71 ± 1.91
∑FANI 109.65 ± 1.617.95 ± 1.327.61 ± 2.087.83 ± 1.538.94 ± 2.858.91 ± 2.228.29 ± 1.91
Notes: 1 ∑SFAs: saturated fatty acids. 2 ∑MUFAs: monounsaturated fatty acids. 3 ∑n − 6 PUFAs: n − 6 polyunsaturated fatty acids. 4 ∑n − 3 PUFAs: n−3 polyunsaturated fatty acids. 5 ∑n − 3 LC-PUFAs: n − 3 long-chain polyunsaturated fatty acids. 6 ∑PUFAs: polyunsaturated fatty acids. 7 DHA: C22:6n − 3, docosahexaenoic acid. 8 EPA: C20:5n − 3, eicosapentaenoic acid. 9 ∑FAI: identified fatty acids. 10 ∑FANI: unidentified fatty acids.
Table 3. The primer sequence of detected genes for RT-qPCR.
Primer NamePrimer SequenceTmSize of ProductGenBank
TNF-α 1F: 5′-TCTGGAGTGGAGGAATGGTCAAGG-3′60 °C119 bpAY428948.1
R: 5′-TGAAGGACGCCTGGCTGTAGAC-3′
IL-1β 2F: 5′-ACAAGGATGACGACAAGCCAACC-3′60 °C147 bpKF747686.1
R: 5′-GGACAGACATGAGAGTGCTGATGC-3′
IL-6 3F: 5′-AGCCTTCAGCATCAGCGGAAAC-3′60 °C107 bpXM_019350387.2
R: 5′-GAAGCAGAGCGGCCAGCATC-3′
PI3K 4F: 5′-ACGGGCGGTGTGAGGATGG-3′60 °C127 bpXM_005463451.4
R: 5′-GACCTCTGACCTCCAACCTCTGAC-3′
Akt 5F: 5′-ACCCTCGTCCTCCCAGCAATC-3′60 °C135 bpXM_003447818.5
R: 5′-CTCCGTGGTCAGTCTTCAAAGGC-3′
Mtor 6F: 5′-TGACCATCCTCAACCTGCTTCC-3′60 °C123 bpXM_005454119.4
R: 5′-CCGTCCTCTCCTTCTCCTTCTTC-3′
β-actin 7F: 5′-AAGGACCTGTACGCCAACAC-3′60 °C196 bpKJ126772.1
R: 5′-ACATCTGCTGGAAGGTGGAC-3′
Notes: 1 TNF-α: tumor necrosis factor α; 2 IL-1β: interleukin 1β; 3 IL-6: interleukin 6; 4 PI3K: phosphatidylinositol 3 kinase; 5 Akt: Akt protein kinase B; 6 mTOR: mammalian target of rapamycin; 7 β-actin: internal reference gene.
Table 4. Effect of dietary lipid supplementation on the serum biochemical parameters of juvenile tilapia.
IndexLipids Levels (%)F-Valuep-Value
0.353.356.359.3512.3515.35
TP 1 (g/L)0.52 ± 0.01 e0.59 ± 0.01 d0.62 ± 0.01 cd0.66 ± 0.01 c0.72 ± 0.02 b0.78 ± 0.01 a53.1260.000
ALB 2 (g/L)0.17 ± 0.01 d0.21 ± 0.01 c0.24 ± 0.01 b0.25 ± 0.00 b0.28 ± 0.01 a0.30 ± 0.01 a38.3810.000
GLB 3 (g/L)0.35 ± 0.01 d0.39 ± 0.01 c0.39 ± 0.01 c0.41 ± 0.00 bc0.43 ± 0.02 b0.48 ± 0.01 a14.5710.000
GLU 4 (mmol/L)3.44 ± 0.10 e4.29 ± 0.11 d4.64 ± 0.05 cd4.96 ± 0.16 c5.37 ± 0.14 b5.76 ± 0.19 a49.6020.000
TG 5 (mmol/L)0.70 ± 0.05 d0.97 ± 0.05 c1.11 ± 0.03 c1.45 ± 0.15 b1.59 ± 0.09 ab1.78 ± 0.09 a23.6530.000
T-CHO 6 (mmol/L)3.35 ± 0.05 d4.03 ± 0.06 c4.12 ± 0.04 c4.37 ± 0.06 b4.49 ± 0.10 b4.90 ± 0.04 a75.5760.000
HDL 7 (mmol/L)1.81 ± 0.14 d2.37 ± 0.06 c2.80 ± 0.06 b2.91 ± 0.09 ab3.05 ± 0.06 ab3.17 ± 0.06 a36.5930.000
LDL 8 (mmol/L)0.78 ± 0.03 d1.04 ± 0.05 c1.13 ± 0.05 bc1.26 ± 0.05 b1.58 ± 0.09 a1.77 ± 0.07 a35.6510.000
HDL/LDL2.34 ± 0.20 ab2.30 ± 0.17 ab2.49 ± 0.06 a2.32 ± 0.05 ab1.94 ± 0.08 bc1.80 ± 0.08 c4.7220.013
AST 9 (U/L)175.56 ± 4.61 bc144.83 ± 7.11 de155.31 ± 5.91 cd165.01 ± 5.00 cd186.65 ± 3.78 ab202.63 ± 4.14 a16.4080.000
ALT 10 (U/L)54.74 ± 0.58 b49.06 ± 0.67 c47.56 ± 1.39 c49.16 ± 0.91 c58.91 ± 1.56 b74.75 ± 3.05 a41.4390.000
Notes: 1 TP: total protein; 2 ALB: albumin; 3 GLB: globulin; 4 GLU: glucose; 5 TG: triglyceride; 6 T-CHO: total cholesterol; 7 HDL: high-density lipoprotein; 8 LDL: low-density lipoprotein; 9 AST: aspartate aminotransferase; 10 ALT: alanine aminotransferase. All above data are mean ± SE (n = 3 tanks per condition), and different superscript letters in the same row indicate significant differences among the data (p < 0.05).
Table 5. Effect of dietary lipid supplementation on the antioxidant responses in the serum of juvenile tilapia.
IndexLipids Levels (%)F-Valuep-Value
0.353.356.359.3512.3515.35
SOD 1 (U/mL)144.06 ± 5.31 d165.60 ± 5.14 c180.56 ± 4.40 bc197.16 ± 5.18 a182.99 ± 4.71 ab174.28 ± 5.28 bc12.9400.000
CAT 2 (U/mL)9.45 ± 0.64 e14.22 ± 0.60 d16.67 ± 0.38 bc19.32 ± 0.31 a17.47 ± 0.38 b15.81 ± 0.53 c48.5720.000
GSH-Px 3 (U/mL)305.32 ± 5.89 e360.39 ± 13.35 d439.04 ± 9.00 ab458.49 ± 8.56 a425.48 ± 5.89 bc405.98 ± 5.76 c44.5680.000
T-AOC 4 (μmol/mL)5.33 ± 0.15 c6.68 ± 0.17 b7.21 ± 0.29 ab7.66 ± 0.32 a7.41 ± 0.29 ab6.91 ± 0.18 ab11.7300.000
MDA 5 (nmol/mL)7.34 ± 0.29 f9.50 ± 0.26 e10.84 ± 0.52 d12.13 ± 0.36 c13.53 ± 0.50 b15.43 ± 0.38 a52.8390.000
Notes: 1 SOD: superoxide dismutase; 2 CAT: catalase; 3 GSH-Px: glutathione peroxidase; 4 T-AOC: total antioxidant capacity; 5 MDA: malondialdehyde. All above data are mean ± SE (n = 3 tanks per condition), and different superscript letters in the same row indicate significant differences among the data (p < 0.05).
Table 6. Effect of dietary lipid supplementation on the antioxidant responses in the liver of juvenile tilapia.
IndexLipids Levels (%)F-Valuep-Value
0.353.356.359.3512.3515.35
SOD 1 (U/mg)160.66 ± 5.28 d182.44 ± 5.11 c197.22 ± 3.84 bc222.99 ± 4.73 a211.54 ± 6.19 ab199.41 ± 6.59 bc16.7770.000
CAT 2 (U/mg)19.95 ± 1.10 e26.93 ± 0.70 d35.97 ± 1.42 c53.09 ± 1.57 a48.36 ± 0.57 b36.24 ± 0.77 c131.9160.000
GSH-Px 3 (U/mg)857.15 ± 20.36 d1095.79 ± 17.19 c1284.13 ± 19.91 b1367.59 ± 28.69 a1263.74 ± 31.21 b1109.87 ± 17.67 c62.5390.000
T-AOC 4 (μmol/mg)10.22 ± 0.39 d14.33 ± 0.55 c18.77 ± 0.59 b21.53 ± 0.61 a20.23 ± 0.40 ab18.87 ± 0.32 b75.2940.000
MDA 5 (nmol/mg)3.15 ± 0.08 e4.40 ± 0.15 d4.72 ± 0.12 d5.33 ± 0.09 c6.15 ± 0.25 b7.34 ± 0.11 a102.2870.000
Notes: 1 SOD: superoxide dismutase; 2 CAT: catalase; 3 GSH-Px: glutathione peroxidase; 4 T-AOC: total antioxidant capacity; 5 MDA: malondialdehyde. All above data are mean ± SE (n = 3 tanks per condition), and different superscript letters in the same row indicate significant differences among the data (p < 0.05).
Table 7. Effect of dietary lipid supplementation on the non-specific immune parameters in the serum of juvenile tilapia.
IndexLipids Levels (%)F-Valuep-Value
0.353.356.359.3512.3515.35
LZM 1 (U/mL)868.93 ± 14.48 c1081.91 ± 42.01 b1273.17 ± 32.75 a1372.25 ± 23.84 a1270.46 ± 8.48 a1270.89 ± 30.83 a43.4440.000
ALP 2 (U/mL)27.95 ± 1.63 e39.71 ± 1.51 d45.46 ± 1.03 c50.82 ± 1.48 a48.63 ± 0.64 ab46.93 ± 0.88 bc135.3330.000
C3 3 (g/mL)0.85 ± 0.02 e0.98 ± 0.02 d1.11 ± 0.01 c1.20 ± 0.02 a1.17 ± 0.01 ab1.08 ± 0.02 bc49.0340.000
IgM 4 (mg/mL)261.89 ± 5.67 d309.51 ± 4.66 c366.40 ± 6.59 b409.35 ± 5.03 a400.43 ± 5.52 a366.06 ± 4.98 b107.7340.000
Notes: 1 LZM: lysozyme, 2 ALP: alkaline phosphatase, 3 C3: complement 3, 4 IgM: immunoglobulin M. All above data are mean ± SE (n = 3 tanks per condition), and different superscript letters in the same row indicate significant difference among the data (p < 0.05).
Disclaimer/Publisher’s Note: The statements, opinions and data contained in all publications are solely those of the individual author(s) and contributor(s) and not of MDPI and/or the editor(s). MDPI and/or the editor(s) disclaim responsibility for any injury to people or property resulting from any ideas, methods, instructions or products referred to in the content.

