Article

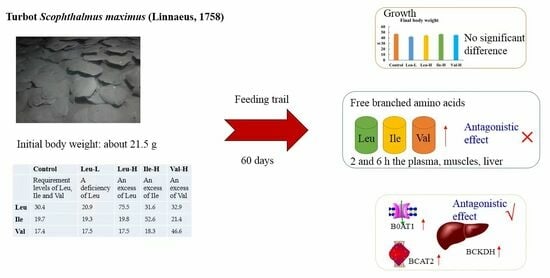
Response of Turbot Scophthalmus maximus (Linnaeus, 1758) to Imbalanced Branched-Chain Amino Acids in Diets

1
College of Fisheries and Life Science, Shanghai Ocean University, Shanghai 201306, China
2
Yellow Sea Fisheries Research Institute, Chinese Academy of Fishery Sciences, Qingdao 266071, China
3
Laboratory for Marine Fisheries Science and Food Production Processes, Laoshan Laboratory, Qingdao 266237, China
*
Author to whom correspondence should be addressed.
Fishes 2023, 8(11), 534; https://doi.org/10.3390/fishes8110534
Submission received: 4 October 2023 / Revised: 18 October 2023 / Accepted: 23 October 2023 / Published: 26 October 2023
(This article belongs to the Special Issue Application of Protein and Amino Acid in Aquaculture Feed)

Abstract

:
The aim of this study was to investigate the effects of imbalanced dietary BCAAs, especially Leu, on the growth and BCAA metabolism in turbot. A control diet was formulated by keeping optimum levels of Leu, Ile and Val. Four experimental diets were prepared by removing supplemental crystalline Leu (deficiency) or supplementing double the amount of Leu, Ile or Val (excess) in the control diet. The growth was not significantly decreased by an excess of Leu, Ile or Val. Fish fed an excess of any particular BCAA significantly increased its postprandial (2 and 6 h) concentration in the plasma, muscles, and liver, but did not decrease the other two BCAA concentrations. The expression of intestinal b0at1 was down-regulated by excessive dietary Leu, Ile or Val. For BCAA catabolism, the mRNA levels of bcat2 in the muscles as well as bckdha and bckdhb in the livers of the Leu-deficient group were the lowest among all the groups, but were up-regulated by excess dietary Leu, Ile or Val. In conclusion, in terms of growth, turbot had high plasticity to an excess of any particular BCAA. Meanwhile, the antagonistic effect caused by an excess of one BCAA were reflected in intestinal amino acid absorption and BCAA catabolism.
Key Contribution: In terms of growth, turbot had high plasticity to excess dietary BCAA. The antagonistic effect caused by an excess of a single BCAA was not observed in terms of growth and plasma- or tissue-free BCAAs, but was observed in the intestinal neutral amino acids transporters (b0at1) and the catabolism of BCAAs.

Graphical Abstract

1. Introduction

Branched-chain amino acids (BCAAs) consisting of leucine (Leu), Isoleucine (Ile) and Valine (Val) are important essential amino acids in fish [1]. They are mainly deposited in muscles and account for 18–20% of the total amino acids in animals [2,3]. Studies have shown that dietary supplementation with optimum levels of BCAAs could increase the growth and feed utilization in some fish species, such as red drum, Sciaenops ocellatus (Linnaeus, 1766) [1], Japanese flounder, Paralichthys olivaceus (Temminck and Schlegel, 1846) [4], golden pompano, Trachinotus ovatus (Linnaeus 1758) [5]. In addition, Leu, one of the BCAAs, plays a critical role in fish growth by promoting protein synthesis via the regulation of the mechanistic target of rapamycin (mTOR) signaling pathway [2,6,7]. Thus, BCAAs in feed formulation given to fish should attract more attention [8].
BCAAs share common transporters and enzymes for absorption and catabolism [9,10]. Because of this, the growth of terrestrial animals is inhibited by imbalanced BCAAs in feed due to the antagonistic effects between them [11,12]. In fish, some studies have also reported antagonism between the BCAAs, but it is controversial in different fish species whether antagonistic effects can impact fish growth. Castillo and Gatlin [13] found that compared to the control group, an excess (62.0 g/kg of dry diet) or a deficiency (9.0 g/kg of dry diet) of dietary Leu reduced the growth of red drum (its requirement was estimated at 16.0 g/kg of dry diet). In channel catfish, Ictalurus punctatus (Rafinesque, 1818), an excess (200% or 300% of Leu requirement) of Leu depressed the growth of the fish fed diets containing less Ile or Val (75% of Ile or Val requirement), but not those fed diets containing adequate amounts of other BCAAs (exceeding their respective requirements) [14]. In our previous study, various levels of dietary Leu had no adverse effect on the growth of tiger puffer, Takifugu rubripes (Temminck and Schlegel, 1850), but the antagonism of Valine to leucine was found in postprandial BCAA concentrations of plasma and muscle in fish fed the Leu-deficient diet, rather than in fish fed the excessive Leu diet [15]. In Japanese flounder, the concentrations of Leu and Val in the plasma were affected by graded levels of dietary Leu and Val, but there was no antagonistic effect between them [16].
Turbot, Scophthalmus maximus (Linnaeus, 1758), is a demersal flatfish species native to the northeast Atlantic Ocean, Baltic Sea, Mediterranean Sea and Black Sea [17], which were introduced to China in 1992 and became a marine carnivorous fish for aquaculture [18]. To date, the requirements of Leu, Ile and Val for turbot have not been determined based on growth performance, but estimated based on the relative proportion of whole-body essential amino acids [19]. Given that some protein feedstuffs (e.g., zein or corn gluten meal) used in aquafeeds can cause the imbalanced profile of BCAAs [20], the aforementioned studies indicated that it is necessary to better understand the potential antagonistic interactions of BCAAs in turbot [13]. With this in mind, the aim of this study was to investigate the potential effects of imbalanced dietary levels of BCAAs, especially Leu, on growth performance, the metabolism of BCAAs, and the TOR signaling pathway in turbot.

2. Materials and Methods

2.1. Experimental Diets

The control diet containing 500 g/kg of crude protein was formulated by adding with 100 g/kg of fish meal, 400 g/kg of peanut meal and 30 g/kg of gelatin as an intact protein source, as well as a premix of crystalline amino acids, while Leu, Ile and Val were supplemented based on their respective requirement levels estimated for turbot in another study by Kaushik [19]. Four experimental diets were formulated based on the control diet by removing supplemental crystalline Leu (a low level (deficiency) of dietary Leu, Leu-L) and supplementing excess (double) levels of dietary Leu (Leu-H), Ile (Ile-H) and Val (Val-H) (Table 1). Glutamic acid was used to keep isonitrogenous among all the experimental diets. All the ingredients were individually ground and gradually mixed based on the formulation of the diets. And then, the diets were produced by using our laboratory scale pelleter with a 3 mm die plate. After drying the samples in an oven at 55 °C for 8–10 h, they were stored in plastic bags at −20 °C. The amino acid compositions of all the diets are presented in Table 2.

2.2. Experimental Fish and Feeding Trial

Turbot were obtained from a commercial company (Shandong Kehe Ocean High Technology Co., Ltd., Weihai, China). And then, the fishes were transported via truck to Tianyuan Aquatic Co., Ltd. (Yantai, China) for the feeding trial. After an initial week of acclimation, 450 fishes of about 21.5 g were evenly stocked into 15, 200 L cylindrical fiberglass tanks (water volume: 120 L) configured in a flow-through aquaculture system. The flow rate of sea water was maintained at approximately 3 L/min. Five diets were randomly assigned to 15 tanks, with 3 replicates per treatment and 30 fishes per tank. The fishes were fed by hand using satiation measures twice daily (7:00 and 17:30) for the duration of the 60 day trial. The fishes were fed in sea water from a deep well, and the water temperature was kept at relatively stable temperature (15–17 °C). During the trial, the tanks were used during the natural photoperiod (from July to October 2021) of approximately 12 h light. The salinity value was 32, the pH value was 7.4–8.1, and the dissolved oxygen content was about 7 mg/L according to daily measurements.

2.3. Sample Collection and Growth Performance Indices

At the beginning of the trial, an initial fishes (six) were collected and stored at −20 °C for the analysis of whole-body composition. At the end of the trial, the fishes were then counted and batch-weighed after 24 h of starvation to evaluate their growth performance. And then, the fishes from each tank fed with an excess of the respective diets. Four fishes from each tank were anesthetized with tricaine methanesulfonate (MS222) (30 mg/L), and blood, liver and muscle samples were collected at 2, 6, and 24 h after refeeding. Blood samples were collected using heparinized needles through the caudal vein, centrifuged at 3000× g for 10 min, and stored at −80 °C for free amino acid analysis. After bleeding, the fishes were euthanized with an overdose of MS222 (300 mg/L) and dissected to obtain tissue samples, which were stored at −80 °C to determine the amino acid concentrations and gene expression (24 h after refeeding), respectively.

2.4. Analytical Methods

2.4.1. Proximate Composition and Amino Acid Concentrations

Proximate compositions, including crude protein, crude lipid, ash and moisture, were determined based on the AOAC procedures [21]. Crude protein (N × 6.25) was determined using the Kjeldahl method. Crude lipid was determined using the Soxhlet method. Ash was measured via incineration at 550 °C in a muffle furnace for 8 h. Moisture was determined after drying samples in an oven at 105 °C for 24 h.
The total amino acid concentrations of the diets were measured based on our previous study [22]. Briefly, lyophilized diets (about 20 mg of crude protein) were hydrolyzed in 6 mol/L HCl (15 mL) for 24 h at 110 °C (tryptophan is destroyed under this condition). The solution was diluted to 50 mL with deionized water. And then, 1 mL diluted solution was blown dry with a stream of nitrogen gas. The dried sample was dissolved with 0.02 mol/L HCl and determined using an L-8900 automatic amino acid analyzer (Hitachi, Tokyo, Japan).
Free amino acid concentrations were measured based on our previous study [15]. Briefly, plasma, lyophilized muscle and lyophilized liver samples were deproteinized with trichloroacetic acid (6%). The samples were then vortexed for 1 min, ultrasonically shaken for 30 min, and centrifuged at 10,000 r/min for 10 min. After being blown dry in nitrogen gas, the samples were dissolved with 0.02 mol/L HCl and determined with an automatic amino acid analyzer (Hitachi, Tokyo, Japan).

2.4.2. Gene Expression Analysis

Total RNA was extracted from the liver, muscle and middle intestine tissues. The cDNA templates were synthesized using the Evo M-MLV RT Mix Kit (Accurate, Changsha, China). Specific primers for target and reference genes were designed according to the sequences available in National Center for Biotechnology Information Gene database and synthesized by a commercial company (TsingKe, Beijing, China) (Table 2). The amplification efficiency for all the primers was kept ranging from 95% to 105%. The SYBR Green Premix Pro Taq HS qPCR Kit II (Accurate, Changsha, China) was used for a Quantitative Real Time-Polymerase Chain Reaction (qRT-PCR). The reaction system consists of 1 μL cDNA template, 5 μL SYBR Green Pro Taq HS Premix II, 0.2 μL forward primer (10 μM), 0.2 μL reverse primer (10 μM) and 3.6 μL sterilized water. The qRT-PCR program was as follows: a denaturation step at 95 °C for 30 s, followed by 40 cycles (95 °C for 5 s, 57 °C for 30 s and 72 °C for 30 s). A melting curve program (95 °C for 10 s, 65 °C for 60 s and 97 °C for 1 s) was performed using the quantitative thermal cycler (Roche LightCycler 96, Switzerland). Each sample was assayed in triplicate. The primer sequences are listed in Table 3. The target genes of this study include B0 amino acid transporters (b0at1 and b0at2), L type amino acid transporter (lat4), oligopeptide transporter 1 (pept1a and pept1b), mTOR pathway-related genes (mechanistic target of rapamycin, mtor; eukaryotic translation initiation factor 4E (eIF4E)-binding protein 1, 4e-bp1; ribosomal protein S6 kinase, s6ka, s6kb1a and s6kb1b), and BCAA catabolism-related genes (branched-chain amino transferase 2, bcat2; branched-chain α-keto acid dehydrogenase enzyme complex, bckdha and bckdhb; BCKDH kinase, bckdk). The reference genes include β-actin and elongation factor 1 alpha (ef1α). Gene expression was calculated using the 2−ΔΔCT method [23].

2.5. Statistical Analysis

Data were analyzed using SPSS 19.0 (SPSS Company, Chicago, IL, USA). Firstly, the normality and homoscedasticity of the data among all the treatments were evaluated using the Shapiro–Wilk test and the Levene’s test, respectively. And then, they were analyzed via one-way ANOVA and Tukey’s multiple comparison test. In this study, the statistical significance was set at p < 0.05.

3. Results

3.1. Growth Performance and Whole-Body Proximate Composition

The growth performance of the fished fed imbalanced BCAA diets is presented in Table 4. The survival rate ranged from 97.33% to 100%, with no statistical differences (p > 0.05). The final body weight in the control group was the highest value, which was 11.3% higher than that of the Leu-L group (p > 0.05). The specific growth and weight gain rates also showed similar trends with final body weight among all the groups. The feed efficiency and protein efficiency ratios in the Ile-H group were significantly higher than those of the Leu-L group (p < 0.05). The feed intake and protein productive values demonstrated no significant differences among the dietary treatments (p > 0.05).
The crude protein, crude lipid and moisture contents were not significantly affected by the imbalanced BCAA diets (p > 0.05). The ash content in the Leu-L group was significantly higher than that of fish fed with the Ile-H and Val-H diets (p < 0.05) (Table 5).

3.2. Free BCAA Concentrations of Plasma, Muscle and Liver Samples

The postprandial (2, 6 and 24 h after feeding) levels of free BCAAs in the plasma, muscle and liver samples are presented in Table 6, Table 7 and Table 8. When compared to fishes fed the control diet, the fishes fed an excess of Leu, Ile or Val at 2 and 6 h after feeding showed significantly higher concentrations (p < 0.05) of plasma-free Leu, Ile or Val, respectively. This result was also observed in the muscles and livers at both sampling points (2 and 6 h). In the plasma, muscles and livers, however, an excess of any particular BCAA in the Leu-H, Ile-H or Val-H diet did not significantly affect (p > 0.05) the other two BCAA concentrations, regardless of the sampling points (2, 6 and 24 h). On the other hand, the fishes fed less Leu (Leu-L) exhibited a significantly lower concentration (p < 0.05) of plasma or muscle Leu at 2 h after feeding compared with the fishes fed the control diet, but this trend weakened at 6 h after feeding and was not found in the liver. In addition, the fishes fed the Val-H diet showed a higher concentration of plasma Val at 24 h after feeding than those given the other treatments did (p < 0.05). The concentrations of liver Leu and Ile in the control group were numerically higher (p > 0.05) than those of the other groups, but were only significantly higher (p < 0.05) than those from the Ile-H group.

3.3. Gene Expression of Amino Acid and Peptide Transporters

The relative expressions of amino acid and peptide transporters in the middle intestines are shown in Figure 1. The b0at1 expression in the control treatment was numerically higher (p > 0.05) than that in any of the other groups, but statistical differences were only observed in the Ile group (p < 0.05). The b0at2 mRNA level in the fishes fed an excess of any particular BCAA (Leu-H, Ile-H or Val-H) was significantly higher (p < 0.05) than that in the fishes fed less Leu, but it was not significantly different (p > 0.05) compared with that of the fishes fed balanced BCAAs (control) in the diet. Additionally, the expression of lat4 was similar to that of peptide transporters (pept1a and pept1b), where the highest expression level was observed in the Leu-L group.

3.4. Related Gene Expression of BCAA Catabolism

The expression of genes (bcat2, bckdha, bckdha and bckdk) related to BCAA catabolism are shown in Figure 2. When compared to the control group, the expression of muscle bcat2 was up-regulated (p > 0.05) in the fishes fed an excess of Leu, Ile or Val and down-regulated (p > 0.05) in the fishes fed less Leu, but significant differences (p < 0.05) were only observed in the Ile group. The expressions of liver bckdha and bckdhb were affected by the dietary treatments, where their mRNA levels from the Leu-L group were significantly lower (p < 0.05) than those from the Leu-H treatment. However, the expression of liver bckdk was not significantly affected (p > 0.05) by the dietary treatments.

3.5. The Expression of Genes Related to mTOR Pathway in Muscles and Livers

The expression of genes related to the mTOR pathway in the muscles and livers are presented in Figure 3. In the livers, the relative expression of three s6k paralogs (s6ka, s6kb1a and s6kb1b) exhibited a similar trend among all the groups, where the highest mRNA level was observed in fishes fed an excess of Leu (Figure 3A). The fishes fed the control diet exhibited the highest mRNA level of liver 4e-bp1 among all the treatments, which was significantly higher (p < 0.05) than that of the Leu-L group.
In the muscles, the expression of mtor was the highest in the Leu-L group, which was significantly higher (p < 0.05) than that in the Leu-H treatment (Figure 3A). The lowest expression level of two s6k paralogs (s6ka and s6kb1a) was found in the fishes fed the control diet, which was significantly lower (p < 0.05) (s6ka) than those in the Leu-H and Val-H groups, as well as significantly lower (p < 0.05) (s6kb1a) than those in the Leu-H and Ile-H groups.

4. Discussion

Since BCAA requirements have not been determined for turbot to date, the optimum levels of Leu, Ile and Val determined in our present study were based on their respective requirements estimated as the amino acid composition of the whole body of turbot [19]. Castillo et al. [13] found that when the control diet contained BCAAs at the requirement levels, the concentrations of plasma BCAAs in red drum did not change at 1, 2, 4, and 6 h after feeding; nevertheless, when the experimental diet contained an excess of any particular BCAA, their postprandial concentrations in plasma were significantly higher than those of the control diet and continued to increase over time. Thus, they proposed that the variation in the postprandial BCAA concentrations in the plasma at different sampling points determined whether dietary BCAA levels could be used to evaluate the potential antagonism of BCAAs. According to our measurement of postprandial blood samples taken at 2 and 6 h after feeding, the changes in the plasma BCAAs at different levels of dietary BCAAs were consistent with the results of Castillo et al. [13]. It has been proved that dietary BCAA levels (deficiency, optimum and excess) in this study could be used to evaluate the potential antagonistic effects of BCAAs.
In terrestrial animals, BCAA antagonism showed that an excess of a single BCAA in their diets reduced the growth [9,24]. However, in fishes, there were no consistent results on the effects of BCAAs antagonism on growth [4,14,25]. In our present study on turbot, it was noticeable that an excess of either Leu, Ile or Val seemed to not impair the growth compared to that of the control group, although there was a non-statistically significant decrease in final body weight, weight gain and specific growth rates. Similarly, a study with tiger puffer did not find that excess single BCAAs in diets significantly depressed the growth of fishes [15]. It suggested that turbot had high plasticity in the utilization of excess dietary BCAAs for growth. In addition, in the present study, high levels of crystalline BCAAs were added to semi-purified diets to formulate an excess of BCAAs. If the growth impairment in the excess BCAA groups (Leu-H, Ile-H and Val-H) was not severe in the condition of this study, then the adverse effects of excess dietary BCAAs caused by some alternative protein feedstuffs on growth can be ignored in commercial feed. This is because the level of a single BCAA provided in semi-purified diets in this study far exceeded its maximum level caused by some alternative protein feedstuffs in commercial feed [15]. However, given that compared with the fishes fed the control diet, Leu deficiency resulted in a decrease of 11.3% in the final body weight, 11.0% in the feed efficiency ratio and 12.4% in the protein efficiency ratio, although no statistically significant difference was observed. Meanwhile, the feed efficiency and protein efficiency ratios in the fishes fed less Leu significantly decreased compared with those of the fishes fed an excess of Ile. Taken together, the effect of a Leu-deficient diet on turbot growth is not be disregarded. It was possible that a deficiency of Leu could significantly reduce growth of turbot by prolonging the duration of the feeding trial or by increasing the number of fishes in each tank to improving the statistical power, as was reported in red drum [1] and Indian major carp, Catla catla (Hamilton, 1822) [26]. However, this conclusion needs to be further verified in a subsequent study.
In addition to the effect on growth, the antagonism of BCAAs, especially the excessive intake of Leu, will lead to an increase in free Leu concentration in plasma or tissues and a decrease in the concentration of the other two free BCAAs, which has been observed in humans [27], pigs [24] and rats [28,29]. Similarly, it was found in rainbow trout, Oncorhynchus mykiss (Walbaum, 1792), that the concentrations of free Val and Ile in the plasma significantly decreased in the fishes fed an excess of Leu in their diet [20]. However, in our present study with turbot, feeding an excessive level of Leu, Ile or Val elevated the plasma, muscle and liver concentrations of Leu, Ile or Val, but did not affect the concentrations of the two other BCAAs. Similar results were not only found in tiger puffer of our previous study [15], but also in red drum [13], Japanese flounder [16] and even rainbow trout [30], where feeding an excessive amount of a single BCAA did not significantly depress the levels of the other two BCAAs in the plasma and tissues. The inconsistent results of plasma and tissue BCAA antagonism induced by excessive dietary BCAAs in different fish species might be related to the source of BCAA provided [13]. In the study of Yamamoto et al. [20], excessive amounts of Leu were derived from the intact protein (corn gluten meal), while in other studies, it was derived from crystalline amino acid. Different forms of dietary amino acids (intact protein or crystalline amino acid) presented asynchronous absorption [31], which may affect the phenomena of antagonistic effects of plasma- and tissue-free BCAAs caused by excessive BCAAs in diets [13]. However, on the other hand, the aforementioned studies showed that for most fish species, the antagonism of free BCAAs in the plasma and tissues would not present by adding an excess of one crystalline BCAA to the diets. Meanwhile, this conclusion was independent of not only the sampling time points, but also the duration of the feeding trial. This is because free BCAAs in the plasma in red drum were measured at four sampling time points (1, 2, 4 and 6 h after meal) for three feeding period (one time feeding, 30 days of feeding and 45 days of feeding) [13]. For turbot, although there is only one feeding period (8 weeks of feeding), they were measured at three sampling time points (2, 6 and 24 h after meal).
In general, since BCAAs have a similar structure, their antagonism is attributed to competitive inhibition in the absorption of the intestine caused by sharing common transporters [2,10]. BCAAs belong to neutral amino acids, which are transported in the apical membrane of the intestines via a broad variety of neutral amino acid transporters (b0at1) [32]. In the current study, the expression of b0at1 in the intestines of turbot was similar to its expression in tiger puffer, where compared with the control group, the mRNA level of b0at1 decreased after the excessive intake of BCAAs, especially after the excessive intake of Ile [15]. It suggested that an excess of one BCAA in diets would reduce the ability of b0at1 to transport neutral amino acids, thereby affecting the transport of the other two BCAAs [33,34]. From this point of view, an excess of one BCAA in diets would have a competitive antagonistic effect on the intestinal absorption of the other two BCAAs in turbot [15]. However, the present results of the plasma and tissues showed that the increase in one BCAA level did not decrease the concentrations of the other two BCAAs, which may be due to BCAA homeostasis in fishes. This hypothesis has been confirmed by the expression of intestinal b0at2. Similar to b0at1, b0at2 is a transporter of BCAAs and plays an important role in the homeostasis for BCAAs [35]. The increased expression of intestinal b0at2 in fishes fed an excess of any particular BCAA was to regulate the absorption of other two BCAAs, which may be the response of turbot to the imbalance of BCAAs caused by one excessive dietary BCAA. Meanwhile, it was supported by the expression of intestinal lat4 and pept1. Unlike b0at1, lat4 is expressed at the basolateral membrane of the intestine and shown to function as a uniporter for BCAAs, Phenylalanine and Methionine [36]. pept1 is a transporter for the absorption of dipeptides or tripeptides in the intestines [37]. The gene expression levels of lat4, pept1a and pept1b were up-regulated in turbot fed the Leu-deficient diet, which indicates that the increasing ability of amino acid and peptide transporters is to compensate for reduced Leu uptake in its free or di/tripeptide form [38]. Thus, the maintenance of homeostasis of BCAA in plasma and tissues was regulated by various of BCAA transporters and even peptide transporters.
In addition, the antagonistic effect among the BCAAs was due to the fact that they share the same enzymes for their catabolism [39]. The catabolism of BCAAs in fishes is similar to that in mammals, and there are two main steps [2]. The first step is a reversible transamination process, where all three BCAAs are converted to their branched-chain α-keto acids (BCKAs) by branched chain amino transferases (BCATs). Unlike most amino acids, the initial site of BCAA transamination is in muscles, and this process is mainly catalyzed by BCAT2. The second step is an irreversible reaction in liver, which involves the oxidative decarboxylation of the BCKAs catalyzed by branched-chain α-keto acid dehydrogenase (BCKDH) to form their branched-chain acyl-CoA esters [40]. Therefore, the related gene expression of BCAA catabolism could provide a valuable insight into the antagonism of BCAAs, complementing the understanding of the response of excessive dietary BCAAs in turbot [15]. In fact, both fish and pig studies suggested that the expression of genes involved in BCAA catabolism were affected by the levels of dietary BCAAs [12,41,42]. In this study, the expression levels of bcat2 in muscles as well as bckdha and bckdhb in livers of turbot fed the Leu-deficient diet were the lowest among all the groups, but their expression levels were up-regulated when fed excessive dietary BCAAs. This possibly indicates that the catabolism of BCAAs in turbot was enhanced by an excess of one BCAA in the diets. Considering that BCKA and BCKDH enzymes could simultaneously catalyze the transamination and oxidative decarboxylation of Leu, Ile and Val, it was theorized that feeding turbot an excessive amount of one BCAA may have antagonistic effects on the other two BCAAs.
The mTOR is a crucial regulator in protein synthesis through two key effectors, ribosomal protein S6 kinase 1 (S6K1) and eIF4E binding protein (4EBP) [43]. BCAAs, especially leucine, are involved in the regulation of mTOR signaling pathway, which has been observed in many fish species, such as blunt snout bream, Megalobrama amblycephala (Yih, 1955) [25,44,45], grass carp, Ctenopharyngodon idella (Valenciennes, 1844) [46], and gilthead sea bream, Sparus aurata, (Linnaeus, 1758) [47]. In those studies, the expression of genes related to the mTOR signaling pathway was affected by graded levels of dietary BCAA. In addition, Wang et al. [25] found that the antagonism between Leu and Ile may affect the expression of mtor and s6k1, where their expression level decreased at first, and then increased with the increase in dietary Isoleucine levels when blunt snout bream was fed an excess of Leu. However, in the current study, although dietary BCAA levels affected the expression of genes mtor, three s6k paralogs (s6ka, s6kb1a and s6kb1b), and/or 4e-bp1 in the livers and muscles, no obvious antagonistic effect was observed according to their expression. As was suggested by Wang et al. [25], it is possible that antagonistic effect between Leu and Ile gradually weakened observed by the expression of genes related to the mTOR signaling pathway when dietary Ile reached the requirement for blunt snout bream. In this study, although one dietary BCAA level was excessive, the other two BCAAs met the requirements for turbot [24]. Thus, future studies should investigate the antagonism of BCAAs when experimental diets contain a deficient level of BCAA.

5. Conclusions

The growth was not affected by an excess of any particular BCAA in diets, which indicated that turbot had high plasticity to excess dietary BCAAs. Meanwhile, when the other two BCAAs met the requirements for turbot, the antagonistic effect caused by an excess of one BCAA was not be observed in terms of growth, even in free BCAAs in the plasma and tissues, and the gene expression related to the mTOR signaling pathway in the liver and muscles. However, it was observed in the mRNA levels of the intestinal neutral amino acids transporter (b0at1) and the gene expression related to the catabolism of BCAAs. Ultimately, since these results were based on the dietary requirement of BCAA for optimum growth, further studies should be carried out in the case of BCAA deficiency in the diets of turbot.

Author Contributions

Y.W., M.L. and H.X. conceived and designed this study; Y.L., J.L. and L.W. accomplished the feeding trial and sampling process; data were analyzed by Y.W. and L.W.; Y.W., H.X., Q.M. and M.L. drafted and reviewed the manuscript. All authors reviewed and commented on the manuscript. All authors have read and agreed to the published version of the manuscript.

Funding

This research was supported by National Natural Science Foundation of China (31972803), Central Public-interest Scientific Institution Basal Research Fund, YSFRI, CAFS (20603022023021), the earmarked fund for China Agriculture Research System (CARS47-G15), and Central Public-interest Scientific Institution Basal Research Fund, CAFS (2020TD48).

Institutional Review Board Statement

The animal study protocol was approved by Institutional Animal Care and Use Committee of the Yellow Sea Fisheries Research Institute (approval code 352021076, approved on July).

Informed Consent Statement

Not applicable.

Data Availability Statement

Data are contained within the article.

Conflicts of Interest

The authors declare no conflict of interest.

References

  1. Castillo, S.; Gatlin, D.M. Dietary requirements for leucine, isoleucine and valine (branched-chain amino acids) by juvenile red drum Sciaenops ocellatus. Aquac. Nutr. 2018, 24, 1056–1065. [Google Scholar] [CrossRef]
  2. Ahmad, I.; Ahmed, I.; Fatma, S.; Peres, H. Role of branched-chain amino acids on growth, physiology and metabolism of different fish species: A review. Aquac. Nutr. 2021, 27, 1270–1289. [Google Scholar] [CrossRef]
  3. Li, P.; Mai, K.; Trushenski, J.; Wu, G. New developments in fish amino acid nutrition: Towards functional and environmentally oriented aquafeeds. Amino Acids 2009, 37, 43–53. [Google Scholar] [CrossRef]
  4. Wang, L.; Han, Y.; Jiang, Z.; Sun, M.; Si, B.; Chen, F.; Bao, N. Interactive effects of dietary leucine and isoleucine on growth, blood parameters, and amino acid profile of Japanese flounder Paralichthys olivaceus. Fish Physiol. Biochem. 2017, 43, 1265–1278. [Google Scholar] [CrossRef]
  5. Zhou, C.; Lin, H.; Huang, Z.; Wang, J.; Wang, Y.; Yu, W. Effects of dietary leucine levels on intestinal antioxidant status and immune response for juvenile golden pompano (Trachinotus ovatus) involved in Nrf2 and NF-κB signaling pathway. Fish Shellfish Immunol. 2020, 107, 336–345. [Google Scholar] [CrossRef]
  6. Zhou, Z.; Wang, X.; Wu, X.; Gao, Y.; Li, X.; Dong, Y.; Yao, W. Effects of dietary leucine levels on growth, feed utilization, neuro-endocrine growth axis and TOR-related signaling genes expression of juvenile hybrid grouper (Epinephelus fuscoguttatus ♀ × Epinephelus lanceolatus ♂). Aquaculture 2019, 504, 172–181. [Google Scholar] [CrossRef]
  7. Zou, T.; Cao, S.; Xu, W.; Han, D.; Liu, H.; Yang, Y.; Jin, J.; Zhu, X.; Xie, S. Effects of dietary leucine levels on growth, tissue protein content and relative expression of genes related to protein synthesis in juvenile gibel carp (Carassius auratus gibelio var. CAS III). Aquac. Res. 2018, 49, 2240–2248. [Google Scholar] [CrossRef]
  8. Furuya, W.M.; Cruz, T.P.D.; Gatlin III, D.M. Amino acid requirements for Nile tilapia: An update. Animals 2023, 13, 900. [Google Scholar] [CrossRef]
  9. Cemin, H.S.; Tokach, M.D.; Woodworth, J.C.; Dritz, S.S.; DeRouchey, J.M.; Goodband, R.D. Branched-chain amino acid interactions in growing pig diets. Transl. Anim. Sci. 2019, 3, 1246–1253. [Google Scholar] [CrossRef]
  10. Zhang, Z.; Monleon, D.; Verhamme, P.; Staessen, J.A. Branched-chain amino acids as critical switches in health and disease. Hypertension 2018, 72, 1012–1022. [Google Scholar] [CrossRef]
  11. Meyer, F.; Van Rensburg, C.J.; Gous, R.M. The response of weaned piglets to dietary valine and leucine. Animal 2017, 11, 1279–1286. [Google Scholar] [CrossRef] [PubMed]
  12. Wiltafsky, M.K.; Pfaffl, M.W.; Roth, F.X. The effects of branched-chain amino acid interactions on growth performance, blood metabolites, enzyme kinetics and transcriptomics in weaned pigs. Br. J. Nutr. 2010, 103, 964–976. [Google Scholar] [CrossRef] [PubMed]
  13. Castillo, S.; Gatlin, D.M. Imbalanced dietary levels of branched-chain amino acids affect growth performance and amino acid utilization of juvenile red drum Sciaenops ocellatus. Aquaculture 2018, 497, 17–23. [Google Scholar] [CrossRef]
  14. Robinson, E.H.; Poe, W.E.; Wilson, R.P. Effects of feeding diets containing an imbalance of branched-chain amino acids on fingerling channel catfish. Aquaculture 1984, 37, 51–62. [Google Scholar] [CrossRef]
  15. Wei, Y.; Sun, Z.; Duan, M.; Ma, Q.; Xu, H.; Liang, M. Responses to Graded Levels of Leucine and Branched-Chain Amino Acid Imbalance in Tiger Puffer Takifugu rubripes. Aquaculture 2022, 548, 737699. [Google Scholar] [CrossRef]
  16. Han, Y.; Han, R.; Koshio, S.; Ishikawa, M.; Yokoyama, S.; Gao, J. Interactive effects of dietary valine and leucine on two sizes of Japanese flounder Paralichthys olivaceus. Aquaculture 2014, 432, 130–138. [Google Scholar] [CrossRef]
  17. Prado, F.D.; Vera, M.; Hermida, M.; Blanco, A.; Bouza, C.; Maes, G.E.; Volckaert, F.A.M.; Martinez, P. Consortium AquaTrace. Tracing the genetic impact of farmed turbot Scophthalmus maximus on wild populations. Aquacult. Environ. Interac. 2018, 10, 447–463. [Google Scholar] [CrossRef]
  18. Ma, A.; Huang, Z.; Wang, X.; Xu, Y.; Guo, X. Identification of quantitative trait loci associated with upper temperature tolerance in turbot, Scophthalmus maximus. Sci. Rep. 2021, 11, 21920. [Google Scholar] [CrossRef]
  19. Kaushik, S.J. Whole body amino acid composition of European seabass (Dicentrarchus labrax), Gilthead seabream (Sparus aurata) and Turbot (Psetta maxima) with an estimation of their IAA requirement profiles. Aquat. Living Resour. 1998, 11, 355–358. [Google Scholar] [CrossRef]
  20. Yamamoto, T.; Shima, T.; Furuita, H. Antagonistic effects of branched-chain amino acids induced by excess protein-bound leucine in diets of rainbow trout (Oncorhynchus mykiss). Aquaculture 2004, 232, 539–550. [Google Scholar] [CrossRef]
  21. AOAC. Official Methods of Analysis, 16th ed.; AOAC: Arlington, VA, USA, 2016. [Google Scholar]
  22. Wei, Y.; Liang, M.; Xu, H.; Zheng, K. Taurine alone or in combination with fish protein hydrolysate affects growth performance, taurine transport and metabolism in juvenile turbot (Scophthalmus maximus L.). Aquac. Nutr. 2019, 25, 396–405. [Google Scholar] [CrossRef]
  23. Livak, K.J.; Schmittgen, T.D. Analysis of Relative Gene Expression Data Using Real-Time Quantitative PCR and the 2−ΔΔCT Method. Methods 2001, 25, 402–408. [Google Scholar] [CrossRef]
  24. Kwon, W.B.; Soto, J.A.; Stein, H.H. Effects on nitrogen balance and metabolism of branched-chain amino acids by growing pigs of supplementing isoleucine and valine to diets with adequate or excess concentrations of dietary leucine. J. Anim. Sci. 2020, 98, 1–10. [Google Scholar] [CrossRef]
  25. Wang, M.; Huang, Y.; Liu, W.; Xiao, K.; Wang, X.; Guo, H.; Zhang, Y.; Fan, J.; Li, X.; Jiang, G. Interactive effects of dietary leucine and isoleucine affect amino acid profile and metabolism through AKT/TOR signaling pathways in blunt snout bream (Megalobrama amblycephala). Fish Physiol. Biochem. 2022, 1–17. [Google Scholar] [CrossRef]
  26. Zehra, S.; Khan, M.A. Dietary leucine requirement of fingerling Catla catla (Hamilton) based on growth, feed conversion ratio, RNA/DNA ratio, leucine gain, blood indices and carcass composition. Aquacult. Int. 2015, 23, 577–595. [Google Scholar] [CrossRef]
  27. Matsumoto, T.; Nakamura, K.; Matsumoto, H.; Sakai, R.; Kuwahara, T.; Kadota, Y.; Kitaura, Y.; Sato, J.; Shimomura, Y. Bolus ingestion of individual branched-chain amino acids alters plasma amino acid profiles in young healthy men. Springerplus 2014, 3, 35. [Google Scholar] [CrossRef]
  28. Block, K.P.; Harper, A.E. Valine metabolism in vivo: Effects of high dietary levels of leucine and isoleucine. Metabolism 1984, 33, 559–566. [Google Scholar] [CrossRef]
  29. May, R.C.; Piepenbrock, N.; Kelly, R.A.; Mitch, W.E. Leucine-induced amino acid antagonism in rats: Muscle valine metabolism and growth impairment. J. Nutr. 1991, 121, 293–301. [Google Scholar] [CrossRef]
  30. Choo, P.; Smith, T.; Cho, C.; Ferguson, H. Dietary excesses of leucine influence growth and body composition of rainbow trout. J. Nutr. 1991, 121, 1932–1939. [Google Scholar] [CrossRef]
  31. Ambardekar, A.A.; Reigh, R.C.; Williams, M.B. Absorption of amino acids from intact dietary proteins and purified amino acid supplements follows different time-courses in channel catfish (Ictalurus punctatus). Aquaculture 2009, 291, 179–187. [Google Scholar] [CrossRef]
  32. Jando, J.; Camargo, S.M.; Herzog, B.; Verrey, F. Expression and regulation of the neutral amino acid transporter B0AT1 in rat small intestine. PLoS ONE 2017, 12, e0184845. [Google Scholar] [CrossRef] [PubMed]
  33. Liao, S.F.; Vanzant, E.S.; Harmon, D.L.; McLeod, K.R.; Boling, J.A.; Matthews, J.C. Ruminal and abomasal starch hydrolysate infusions selectively decrease the expression of cationic amino acid transporter mRNA by small intestinal epithelia of forage-fed beef steers. J. Dairy Sci. 2009, 92, 1124–1135. [Google Scholar] [CrossRef] [PubMed]
  34. Morales, A.; Barrera, M.A.; Araiza, A.B.; Zijlstra, R.T.; Bernal, H.; Cervantes, M. Effect of excess levels of lysine and leucine in wheat-based, amino acid-fortifed diets on the mRNA expression of two selected cationic amino acid transporters in pigs. J. Anim. Physiol. Anim. Nutr. 2013, 97, 263–270. [Google Scholar] [CrossRef] [PubMed]
  35. Hägglund, M.G.; Roshanbin, S.; Löfqvist, E.; Hellsten, S.V.; Nilsson, V.C.; Todkar, A.; Zhu, Y.; Stephansson, O.; Drgonova, J.; Uhl, G.R.; et al. B0AT2 (SLC6A15) is localized to neurons and astrocytes, and is involved in mediating the effect of leucine in the brain. PLoS ONE 2013, 8, e58651. [Google Scholar] [CrossRef] [PubMed]
  36. Guetg, A.; Mariotta, L.; Bock, L.; Herzog, B.; Fingerhut, R.; Camargo, S.M.; Verrey, F. Essential amino acid transporter Lat4 (Slc43a2) is required for mouse development. J. Physiol. 2015, 593, 1273–1289. [Google Scholar] [CrossRef]
  37. Verri, T.; Barca, A.; Pisani, P.; Piccinni, B.; Storelli, C.; Romano, A. Di-and tripeptide transport in vertebrates: The contribution of teleost fish models. J. Comp. Physiol. B 2017, 187, 395–462. [Google Scholar] [CrossRef] [PubMed]
  38. Javed, K.; Bröer, S. Mice lacking the intestinal and renal neutral amino acid transporter SLC6A19 demonstrate the relationship between dietary protein intake and amino acid malabsorption. Nutrients 2019, 11, 2024. [Google Scholar] [CrossRef]
  39. Brosnan, J.T.; Brosnan, M.E. Branched-chain amino acids: Enzyme and substrate regulation. J. Nutr. 2006, 136, 207S–211S. [Google Scholar] [CrossRef]
  40. Dimou, A.; Tsimihodimos, V.; Bairaktari, E. The critical role of the branched chain amino acids (BCAAs) catabolism-regulating enzymes, branched-chain aminotransferase (BCAT) and branched-chain α-keto acid dehydrogenase (BCKD), in human pathophysiology. Int. J. Mol. Sci. 2022, 23, 4022. [Google Scholar] [CrossRef]
  41. Comesana, S.; Velasco, C.; Conde-Sieira, M.; Míguez, J.M.; Soengas, J.L.; Morais, S. Feeding stimulation ability and central effects of intraperitoneal treatment of L-leucine, L-valine, and L-proline on amino acid sensing systems in rainbow trout: Implication in food intake control. Front. Physiol. 2018, 9, 1209. [Google Scholar] [CrossRef]
  42. Xu, Y.; Ma, X.; Wang, C.; Yuan, M.; Piao, X. Effects of dietary valine: Lysine ratio on the performance, amino acid composition of tissues and mRNA expression of genes involved in branched-chain amino acid metabolism of weaned piglets. Asian Austral. J. Anim. 2018, 31, 106. [Google Scholar] [CrossRef]
  43. Saxton, R.A.; Sabatini, D.M. mTOR signaling in growth, metabolism, and disease. Cell 2017, 168, 960–976. [Google Scholar] [CrossRef] [PubMed]
  44. Ren, M.; Habte-Tsion, H.M.; Liu, B.; Miao, L.; Ge, X.; Xie, J.; Liang, H.; Zhou, Q.; Pan, L. Dietary leucine level affects growth performance, whole body composition, plasma parameters and relative expression of TOR and TNF-α in juvenile blunt snout bream, Megalobrama amblycephala. Aquaculture 2015, 448, 162–168. [Google Scholar] [CrossRef]
  45. Ren, M.; Habte-Tsion, H.M.; Liu, B.; Miao, L.; Ge, X.; Xie, J.; Zhou, Q. Dietary isoleucine requirement of juvenile blunt snout bream, Megalobrama amblycephala. Aquacult. Nutr. 2017, 23, 322–330. [Google Scholar] [CrossRef]
  46. Feng, L.; Gan, L.; Jiang, W.; Wu, P.; Liu, Y.; Jiang, J.; Zhou, X. Gill structural integrity changes in fish deficient or excessive in dietary isoleucine: Towards the modulation of tight junction protein, inflammation, apoptosis and antioxidant defense via NF-κB, TOR and Nrf2 signaling pathways. Fish Shellfish Immun. 2017, 63, 127–138. [Google Scholar] [CrossRef] [PubMed]
  47. Garcia de la Serrana, D.; Mareco, E.A.; Vieira, V.L.; Power, D.M.; Johnston, I.A. Comparison of the transcriptional responses of skeletal muscle and bone to a flooding dose of leucine in the gilthead sea bream (Sparus aurata). Comp. Biochem. Physiol. B Biochem. Mol. Biol. 2016, 199, 50–57. [Google Scholar] [CrossRef] [PubMed]
Figure 1. Effects of imbalanced BCAAs on mRNA expression in middle intestines. (A) amino acid transporters; (B) peptide transporters. b0at1 (SLC6A19): B0 neutral amino acid transporter 1; b0at2 (SLC6A15): B0 neutral amino acid transporter 2; lat4 (SLC43A2): large neutral amino acids transporter small subunit 4, pept1, oligopeptide transporter 1. Data are presented as mean values ± standard error (n = 3). Bars with same letters are not significantly different according to Tukey’s test (p > 0.05).
Fishes 08 00534 g001
Figure 2. Related gene expression of branched-chain amino acid catabolism in fishes fed imbalanced BCAA diets. bcat2: branched-chain amino transferase; bckdh: branched-chain α-keto acid dehydrogenase enzyme complex; bckdk: bckdh kinase. Data are presented as mean values ± standard error (n = 3). Bars with same letters are not significantly different according to Tukey’s test (p > 0.05).
Fishes 08 00534 g002
Figure 3. Effects of imbalanced dietary BCAAs on mRNA expression of genes related to mtor pathway. (A) liver; (B) muscle. mtor, mechanistic target of rapamycin; s6k, ribosomal protein S6 kinase 1; 4e-bp1, eukaryotic translation initiation factor 4E (eIF4E)-binding protein 1. Data are presented as mean values ± standard error (n = 3). Bars with same letters are not significantly different according to Tukey’s test (p > 0.05).
Fishes 08 00534 g003
Table 1. Formulation and proximate composition of experimental diets (g/kg dry matter).
IngredientControlLeu-LLeu-HIle-HVal-H
Fish meal100.0100.0100.0100.0100.0
Peanut meal400.0400.0400.0400.0400.0
Gelatin30.030.030.030.030.0
Wheat meal180.0180.0180.0180.0180.0
Amino acid premix 185.285.285.285.285.2
Fish oil70.070.070.070.070.0
Lecithin20.020.020.020.020.0
Vitamin premix 210.010.010.010.010.0
Mineral premix 35.05.05.05.05.0
Vitamin C5.05.05.05.05.0
Ca(H2PO4)215.015.015.015.015.0
Choline chloride10.010.010.010.010.0
DMPT 45.05.05.05.05.0
Calcium propionate1.01.01.01.01.0
Ethoxyquin0.50.50.50.50.5
Leucine10.50.062.910.510.5
Isoleucine0.00.00.043.90.0
Valine0.00.00.00.034.0
Glutamic acid26.431.70.24.59.4
Glycine26.431.60.24.49.4
Proximate composition
Moisture92.076.076.162.576.9
Ash 60.962.061.961.962.3
Crude protein505.8510.7503.0494.1502.3
Crude lipid112.5113.3122.3116.0114.3
1 Amino acid premix (g/kg dry diet; all L-form amino acids unless otherwise indicated): Taurine, 8.5 g; Threonine, 4.9 g; D/L-Methionine, 14.8 g; Tyrosine, 5.2 g; Lysine, 11.7 g; Histidine, 0.9 g; Arginine, 6.2 g; Tryptophan, 0.7 g; Isoleucine, 9.3; Valine, 3.3; Aspartic acid, 9.8 g; Alanine, 10.0 g. Crystalline amino acids were purchased from Hebei Huayang Amino Acids Group Company Limited. 2 Mineral premix (g/kg premix): FeSO4·H2O, 112.7 g; ZnSO4·H2O, 45.2 g; MnSO4·H2O, 9.3 g; CuSO4·5H2O, 3.7 g; CoCl2·6H2O, 0.4 g; Na2SeO3, 0.1 g; Ca(IO3)2, 0.3 g. 3 Vitamin premix (IU or g/kg premix): Vitamin A acetate, 1,140,000 IU; Vitamin D3, 180,000 IU; DL-α-tocopherol acetate, 7.6 g; Menadione, 1.2 g; Thiamine nitrate, 0.93 g; Riboflavin, 1.35 g; Pyridoxine hydrochloride, 1.10 g; Cyanocobalamine, 0.0075 g; D-Calcium pantothenate, 4.5 g; Nicotinamide, 6.75 g; Folic acid, 0.465 g; D-biotin, 0.0475 g; Inositol, 10 g. 4 DMPT: dimethyl-β-propiothetin.
Table 2. Amino acid composition of experiment diets (g/kg dry matter).
ControlLeu-LLeu-HIle-HVal-H
Essential amino acid
Threonine14.214.914.814.415.6
Valine17.417.517.518.346.6
Methionine14.214.414.714.115.0
Isoleucine19.719.319.852.621.4
Leucine30.420.975.531.632.9
Phenylalanine17.116.317.618.220.5
Lysine26.426.026.426.828.5
Histidine8.68.79.79.610.6
Arginine43.942.350.648.151.0
Non-essential amino acid
Taurine11.512.111.913.313.6
Aspartic acid32.132.933.132.433.9
Serine13.114.414.013.514.7
Glutamic acid97.2103.075.577.085.6
Glycine46.551.024.827.133.5
Alanine19.419.919.518.820.3
Cystine3.53.93.24.24.4
Tyrosine14.113.714.514.215.7
Table 3. Primer sequences used for qRT-PCR.
GenePrimer Sequence (5′ to 3′)Product Size (bp)Accession Number 1
b0at1F: CCGGGACGATCATAAGGGTG
R: GTGAGCGGTTGTTGGTTTCC
144XM_035634786.2
b0at2F: GGCCGCTATGGAATCGGTTA
R: CGGGCTTACGATCACAGTCA
86XM_035642803.2
lat4F: CCCACAGATTTCCACCTGGG
R: AGGTAGCACCTCGTTTTGGG
164XM_035626052.2
pept1aF: TGGGCAGTAATCCAGTCACG
R: TGCCTTCTTGTGGCTTGGAA
246XM_035604255.1
pept1bF: CCAGTTCACCTTGGAGCCTT
R: GGGAGCCGTCCTGTAAACTC
116XM_035629795.2
bckdhaF: CAACACAGAGCCTTCCGAGT
R: TTCCTTGCCTGTCCATCACC
172XM_035623516.2
bckdhbF: TGAGGGAAGTGGCAAACA
R: CACAGACCCTGCTGATGG
234XM_035622988.1
bckdkF: TACGGCTGACATTAGCGACC
R: TGAGCGATTCGTACAGGCAG
109XM_035627139.2
bcat2F: CGATGATGTGACGGGGGTAA
R: GTCCGCGCTCAGATAACGTA
84XM_035614928.2
mtorF: CAGGCGGTACATTGGTCCTC
R: CTCCACACTTGGGCTACCTG
110XM_035644862.2
s6kaF: GGCGGACTACGATGCCTTAG
R: TGACCTCACTGCTAACGCTG
76XM_035649934.2
s6kb1aF: CAAGGGAACAGAGCAGAT
R: GAGGTCCACAATGAAAGG
235XM_035625497.2
s6kb1bF: GTGCAGGCTCATCCCTTCTT
R: TGGCTGGTGAACTTCGAGTC
131XM_035623426.2
4e-bp1F: CAGACGCCCCAAAATAACGC
R: ATCCTCGAGGCTGACTGTCT
104XM_035608367.2
β-actinF: GTAGGTGATGAAGCCCAGAGCA
R: CTGGGTCATCTTCTCCCTGT
204MT023044.1
ef1αF: TATTAACATCGTGGTCATTGG
R: CAGGCGTACTTGAAGGAG
153KU057926.1
Note: b0at1 (SLC6A19): B0 neutral amino acid transporter 1; b0at2 (SLC6A15): B0 neutral amino acid transporter 2; lat4 (SLC43A2): large neutral amino acids transporter small subunit 4, pept1 (SLC6A19), oligopeptide transporter 1; bcat2: branched-chain amino transferase; bckdh: branched-chain α-keto acid dehydrogenase enzyme complex; bckdk: bckdh kinase; mtor, mechanistic target of rapamycin; s6k, ribosomal protein S6 kinase; 4e-bp1, eukaryotic translation initiation factor 4E (eIF4E)-binding protein 1; ef1α, elongation factor 1 alpha. 1 NCBI: GenBank accession no.
Table 4. Growth performance and body condition indices of turbot fed imbalanced BCAA diets 1.
ControlLeu-LLeu-HIle-HVal-H
IBW (g)21.6 ± 0.121.5 ± 0.021.5 ± 0.121.5 ± 0.121.5 ± 0.0
FBW (g)46.9 ± 1.542.2 ± 1.544.4 ± 1.646.7 ± 1.045.2 ± 0.9
SR (%)98.7 ± 1.398.7 ± 1.397.3 ± 2.710098.7 ± 1.3
WG (%)117.8 ± 7.696.2 ± 7.0106.7 ± 6.7116.5 ± 5.3110.4 ± 4.3
SGR (%)1.29 ± 0.061.12 ± 0.061.21 ± 0.051.29 ± 0.041.24 ± 0.04
FI (%/d)1.12 ± 0.021.10 ± 0.031.04 ± 0.011.04 ± 0.031.04 ± 0.01
FE1.11 ± 0.03 ab1.00 ± 0.04 b1.12 ± 0.03 ab1.19 ± 0.05 a1.15 ± 0.04 ab
PER2.17 ± 0.09 ab1.93 ± 0.09 b2.20 ± 0.06 ab2.40 ± 0.10 a2.27 ± 0.07 ab
PPV (%)34.4 ± 1.232.8 ± 1.133.4 ± 1.438.6 ± 2.334.6 ± 1.1
Note: IBW: initial body weight; FBW: final body weight. Survival rate (SR) = (final fish number/initial fish number) × 100. Weight gain (WG) = (FBW − IBW/IBW) × 100. Specific growth rate (SGR) = [ln (FBW) − ln(IBW)]/feeding days × 100). Feed intake (FI) = total feed intake/[feeding days × (FBW + IBW)/2] × 100. Feed efficiency (FE) = body weight gain/dry feed intake. Protein efficiency ratio (PER) = (FBW − IBW)/protein intake. Protein productive value (PPV) = (final protein content − initial protein content)/protein intake × 100. 1 Values are presented as means ± standard error (n = 3). Values in the same row followed by different superscript letters are significantly different (p < 0.05) according to Tukey’s’ multiple comparison test.
Table 5. Whole-body composition of fish fed the experimental diets (g/kg dry matter) 1.
ControlLeu-LLeu-HIle-HVal-H
Moisture774.7 ± 3.2772.0 ± 6.9779.0 ± 2.1775.2 ± 2.6780.8 ± 0.1
Crude protein153.0 ± 1.5157.7 ± 4.3148.7 ± 1.0154.1 ± 2.3149.7 ± 0.6
Crude lipid26.1 ± 2.822.3 ± 2.124.3 ± 1.023.8 ± 0.423.0 ± 1.1
Ash37.2 ± 1.2 ab42.2 ± 1.9 a37.5 ± 0.9 ab36.7 ± 1.0 b36.7 ± 0.2 b
1 Values are presented as means ± standard error (n = 3). Values in the same row followed by different superscript letters are significantly different (p < 0.05) according to Tukey’s’ multiple comparison test.
Table 6. Free branched amino acids of plasma in turbot fed with imbalanced BCAA diets (µg/mL) 1.
ControlLeu-LLeu-HIle-HVal-H
2 h after feeding
Leu57.23 ± 4.39 c23.73 ± 3.37 d225.56 ± 7.58 a87.48 ± 5.95 b66.38 ± 1.95 bc
Ile36.40 ± 2.78 b47.20 ± 7.55 b31.90 ± 6.54 b194.57 ± 13.36 a46.62 ± 4.90 b
Val40.85 ± 2.49 b48.65 ± 6.13 b35.84 ± 5.51 b56.67 ± 7.79 b218.93 ± 10.10 a
6 h after feeding
Leu54.19 ± 9.39 b22.07 ± 5.24 b419.36 ± 50.74 a96.66 ± 17.10 b87.41 ± 3.64 b
Ile37.73 ± 7.74 b38.26 ± 5.89 b61.31 ± 10.03 b268.31 ± 16.73 a56.32 ± 2.18 b
Val40.54 ± 6.77 b49.35 ± 7.28 b60.39 ± 9.34 b69.57 ± 16.27 b280.91 ± 23.22 a
24 h after feeding
Leu10.42 ± 0.4211.13 ± 1.8319.34 ± 4.1610.79 ± 0.8013.89 ± 2.84
Ile5.64 ± 0.376.19 ± 1.025.30 ± 0.737.02 ± 0.327.50 ± 1.31
Val10.17 ± 0.69 b10.56 ± 1.04 b9.63 ± 0.88 b11.01 ± 0.19 b18.47 ± 3.23 a
1 Values are presented as means ± standard error (n = 3). Values in the same row followed by different superscript letters are significantly different (p < 0.05) according to Tukey’s’ multiple comparison test.
Table 7. Free branched amino acids of liver in turbot fed with imbalanced BCAA diets (µg/g) 1.
ControlLeu-LLeu-HIle-HVal-H
2 h after feeding
Leu740.38 ± 162.82 b932.79 ± 122.85 b1641.08 ± 87.89 a956.04 ± 128.30 b935.50 ± 82.50 b
Ile386.80 ± 78.12 b542.40 ± 95.65 b511.02 ± 37.59 b993.16 ± 57.98 a508.65 ± 46.65 b
Val631.12 ± 143.10 b962.63 ± 105.30 ab818.41 ± 56.92 ab835.97 ± 95.39 ab1279.68 ± 92.39 a
6 h after feeding
Leu646.81 ± 99.77 b707.05 ± 74.65 b1452.26 ± 151.05 a722.37 ± 150.68 b708.10 ± 62.01 b
Ile344.65 ± 62.65 b407.99 ± 34.29 b460.81 ± 84.68 b797.87 ± 85.03 a362.69 ± 34.73 b
Val611.17 ± 78.71 b809.13 ± 48.15 ab753.11 ± 87.08 ab606.43 ± 97.12 b985.93 ± 63.40 a
24 h after feeding
Leu1367.52 ± 127.98 a1054.28 ± 132.67 ab1270.64 ± 54.57 ab882.02 ± 73.18 b916.47 ± 95.77 ab
Ile657.02 ± 52.77 a495.51 ± 39.57 ab588.33 ± 18.92 ab432.07 ± 69.07 b441.64 ± 35.35 ab
Val1163.91 ± 84.20953.66 ± 98.731086.95 ± 47.05818.78 ± 72.68875.54 ± 73.43
1 Values are presented as means ± standard error (n = 3). Values in the same row followed by different superscript letters are significantly different (p < 0.05) according to Tukey’s’ multiple comparison test.
Table 8. Free branched amino acids of muscle in turbot fed with imbalanced BCAA diets(µg/g) 1.
ControlLeu-LLeu-HIle-HVal-H
2 h after feeding
Leu144.73 ± 4.69 b53.40 ± 20.18 c546.82 ± 22.54 a186.53 ± 14.14 b145.08 ± 9.57 b
Ile103.55 ± 5.92 b112.04 ± 11.20 b104.42 ± 4.97 b455.06 ± 13.59 a116.91 ± 6.95 b
Val1940.63 ± 116.78 b2124.21 ± 142.56 ab2050.21 ± 134.59 ab2137.86 ± 144.57 ab2605.17 ± 75.18 a
6 h after feeding
Leu169.94 ± 24.60 bc69.11 ± 6.75 c843.85 ± 32.81 a251.48 ± 19.02 b195.03 ± 17.17 b
Ile108.29 ± 14.72 b136.45 ± 6.51 b136.96 ± 12.41 b713.13 ± 25.11 a148.39 ± 19.90 b
Val2219.39 ± 308.48 ab2074.76 ± 281.96 ab1708.33 ± 229.77 b2754.15 ± 185.13 ab3098.80 ± 122.82 a
24 h after feeding
Leu69.30 ± 12.2474.11 ± 4.59114.88 ± 15.8470.53 ± 4.4791.67 ± 6.92
Ile48.99 ± 10.8250.36 ± 6.4281.72 ± 14.0478.35 ± 9.6967.39 ± 6.45
Val1772.95 ± 92.411996.23 ± 311.541705.03 ± 109.532316.37 ± 258.952451.37 ± 317.51
1 Values are presented as means ± standard error (n = 3). Values in the same row followed by different superscript letters are significantly different (p < 0.05) according to Tukey’s’ multiple comparison test.
Disclaimer/Publisher’s Note: The statements, opinions and data contained in all publications are solely those of the individual author(s) and contributor(s) and not of MDPI and/or the editor(s). MDPI and/or the editor(s) disclaim responsibility for any injury to people or property resulting from any ideas, methods, instructions or products referred to in the content.

