
Impacts of Long-Term Exposure to Ocean Acidification and Warming on Three-Spined Stickleback (Gasterosteus aculeatus) Growth and Reproduction

 , and
, and
Abstract
:
1. Introduction
2. Materials and Methods
2.1. Animals and Experimental Design
2.2. Non-Invasive Biometric Approaches
2.3. Final End-Points
2.3.1. Individual Physiological Indexes
2.3.2. Lipids Extraction and Analysis
2.3.3. RNA Extraction and Purification
2.3.4. RT-qPCR Analysis
2.3.5. Histological Assessment of the Gonadal Maturation Stage
2.3.6. Steroid Blood Analysis
2.3.7. Gamete Quality, Reproduction and Fertilisation Rate
3. Statistical Analysis
4. Results
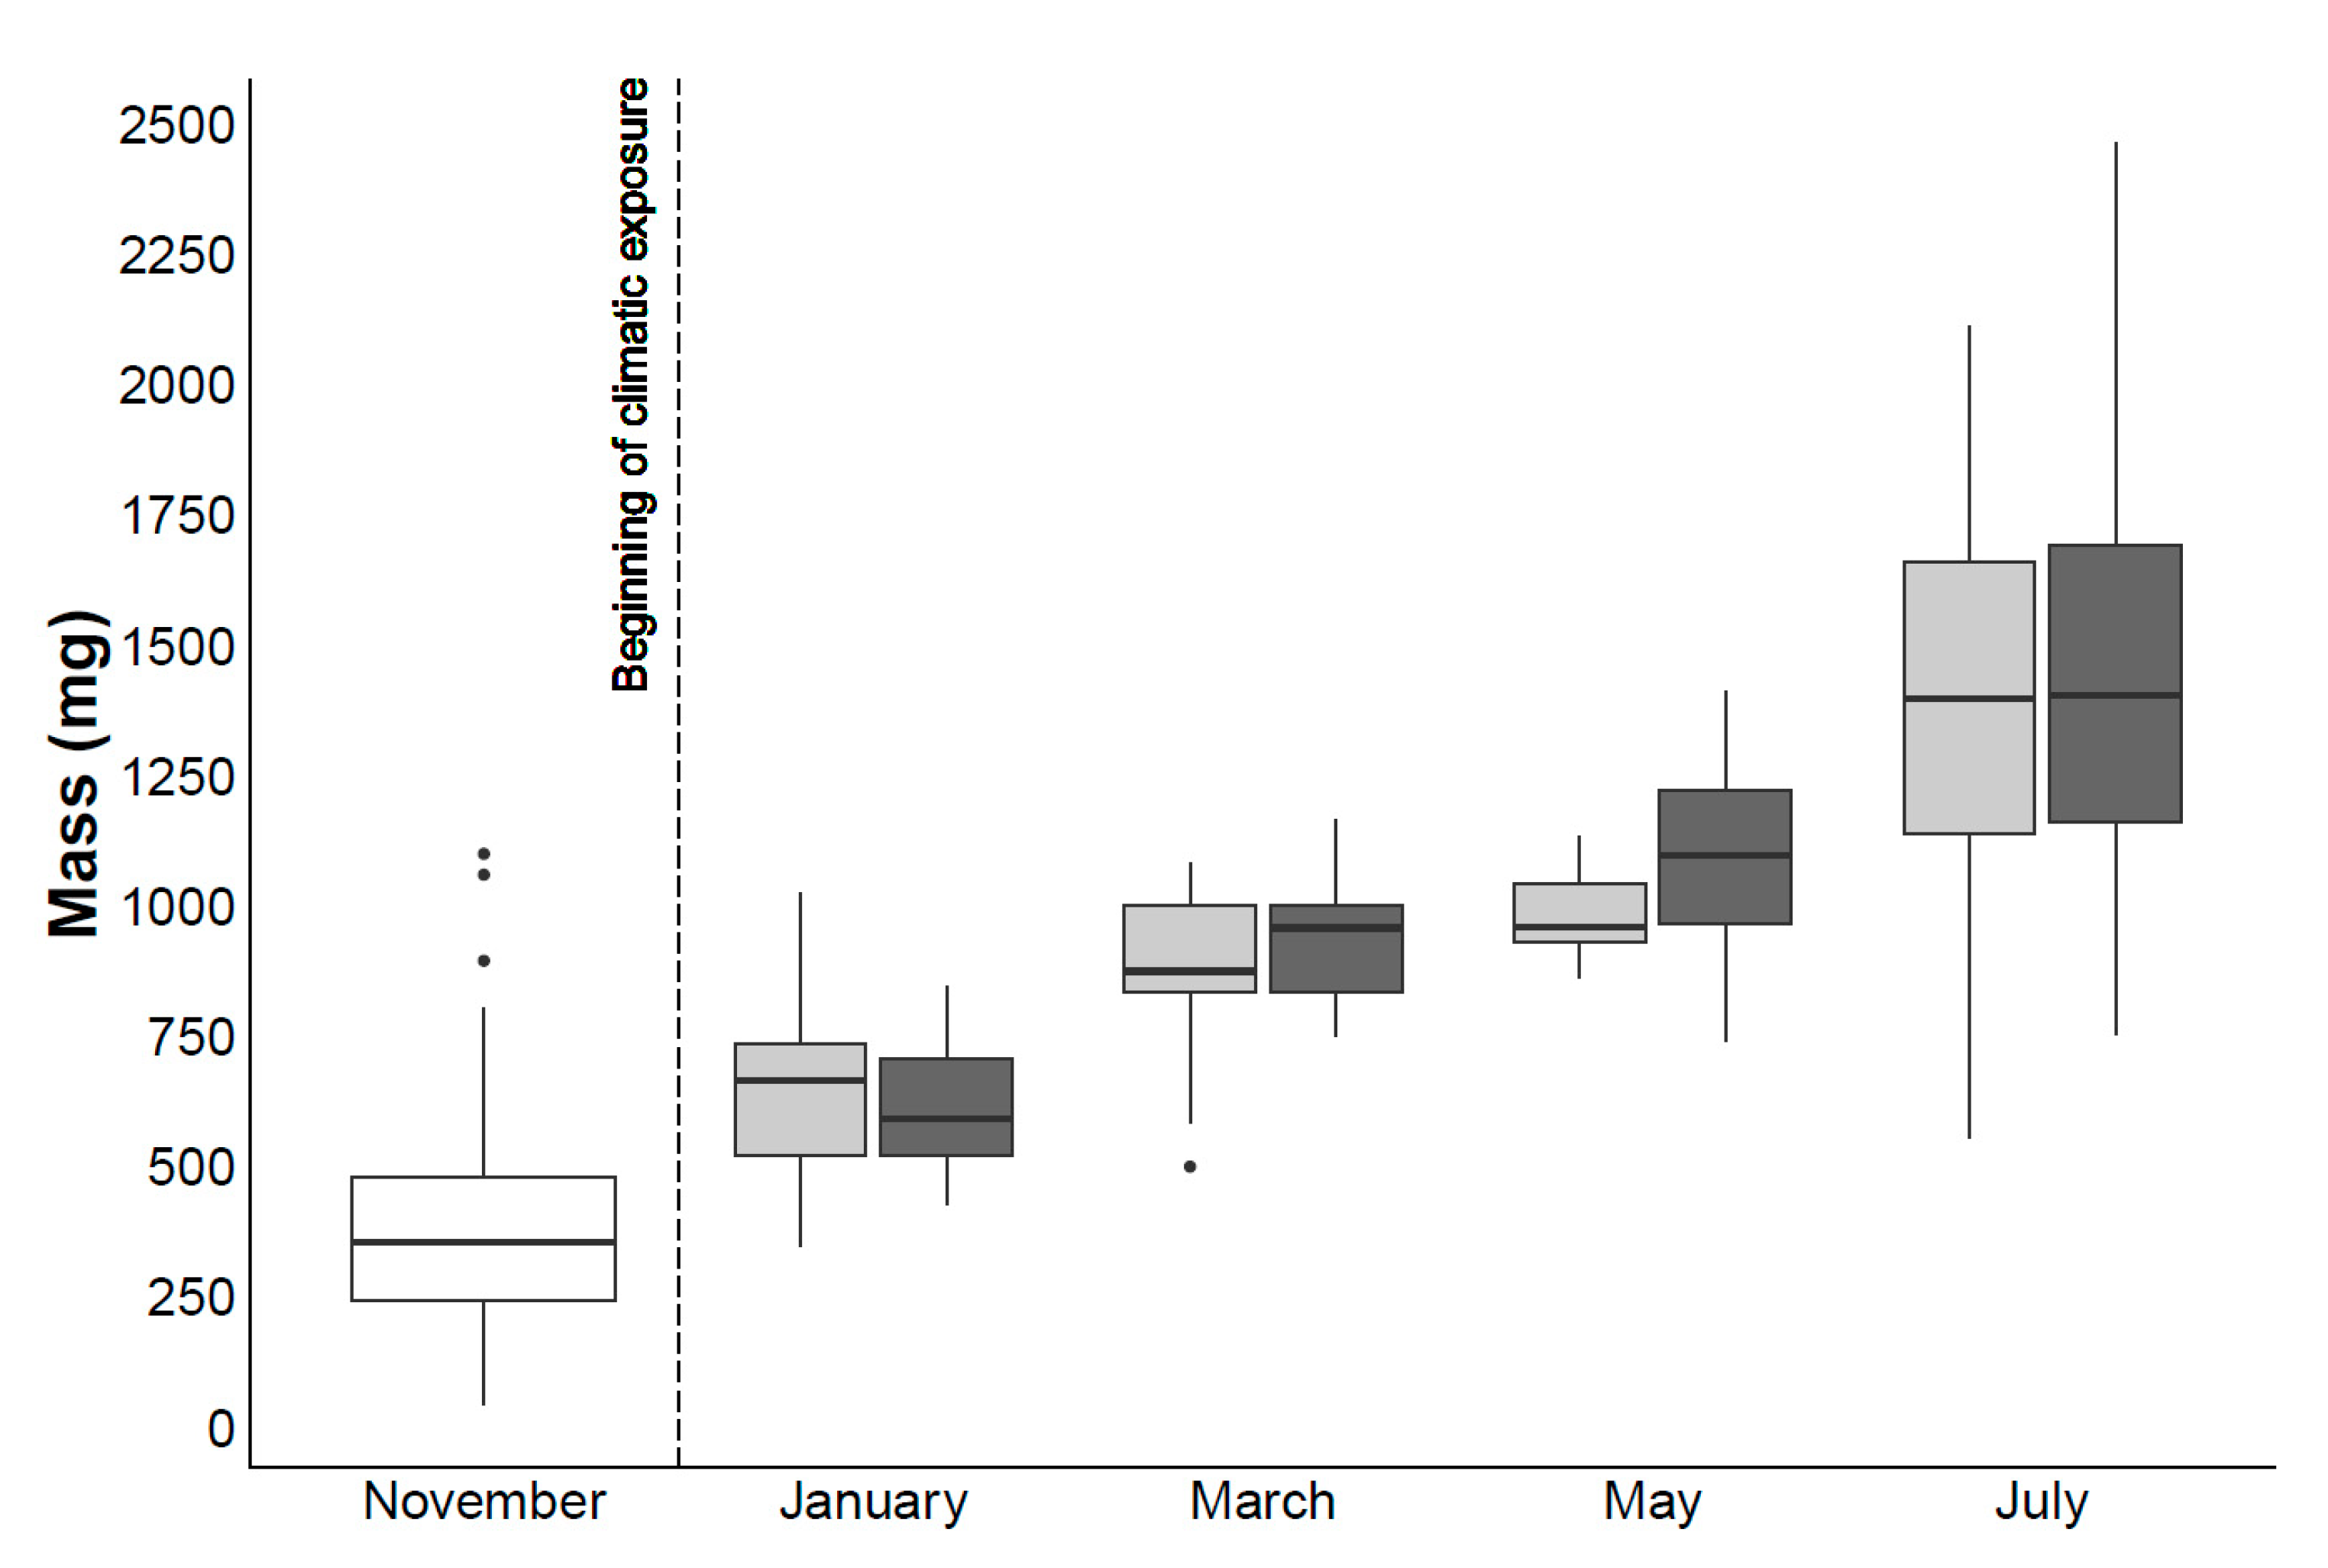
4.1. Mortality and Biometric Study
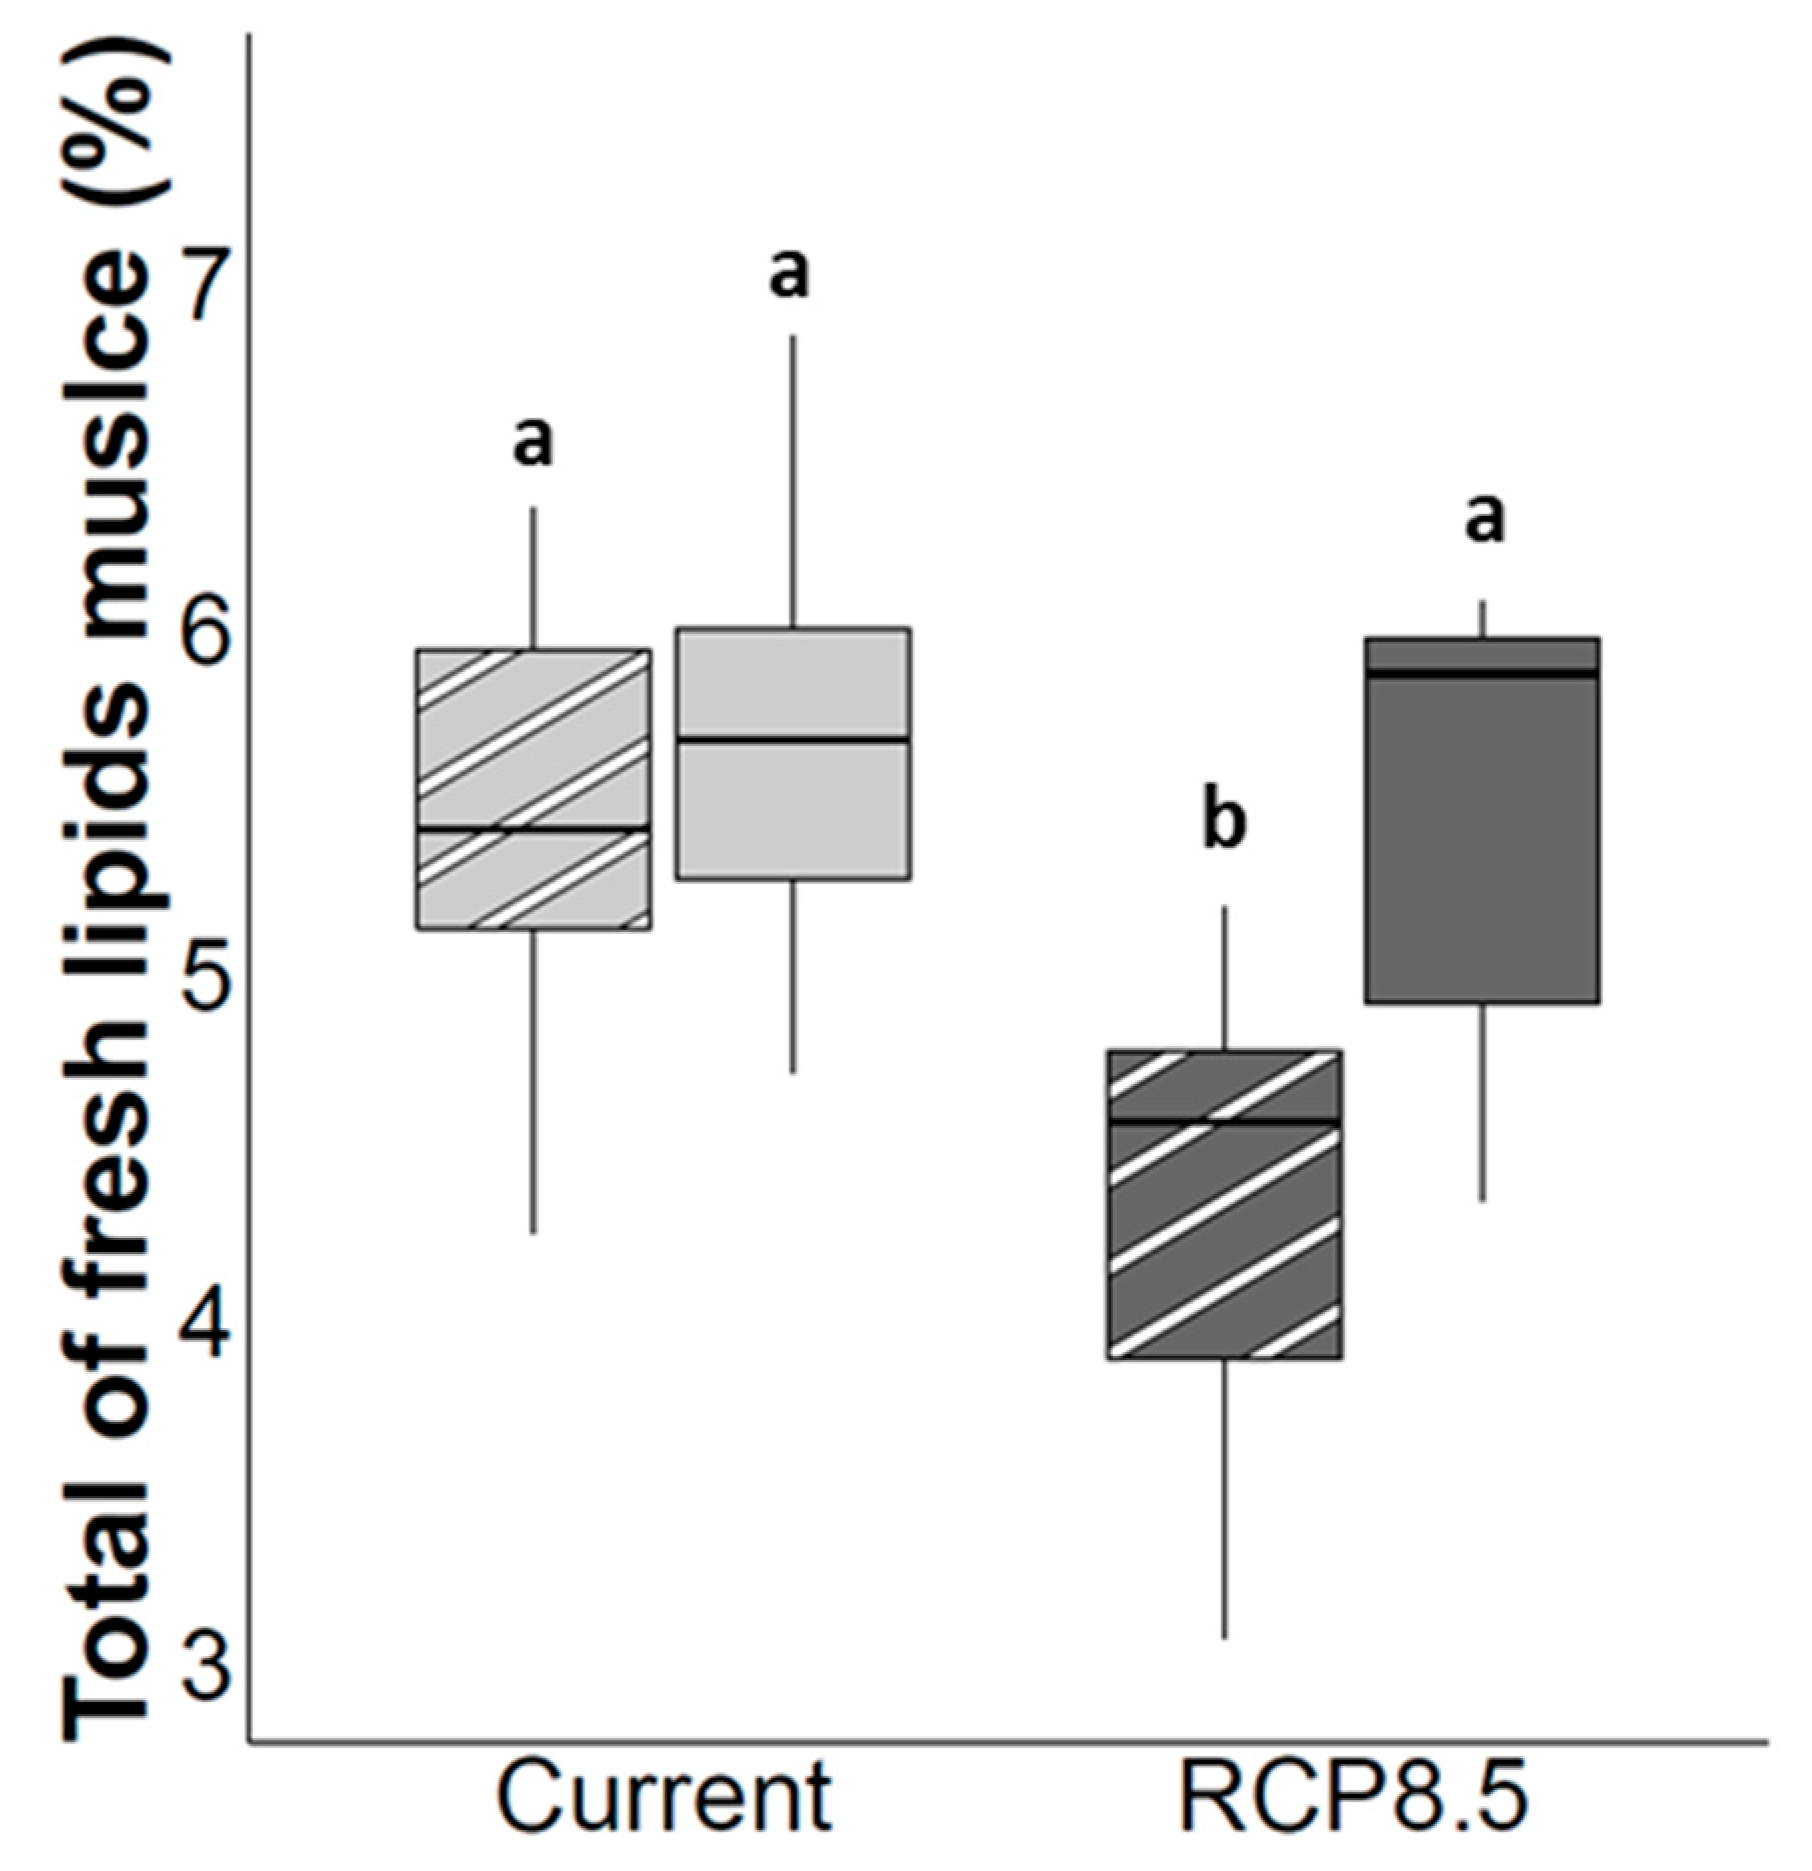
4.2. Muscle Lipids Storage
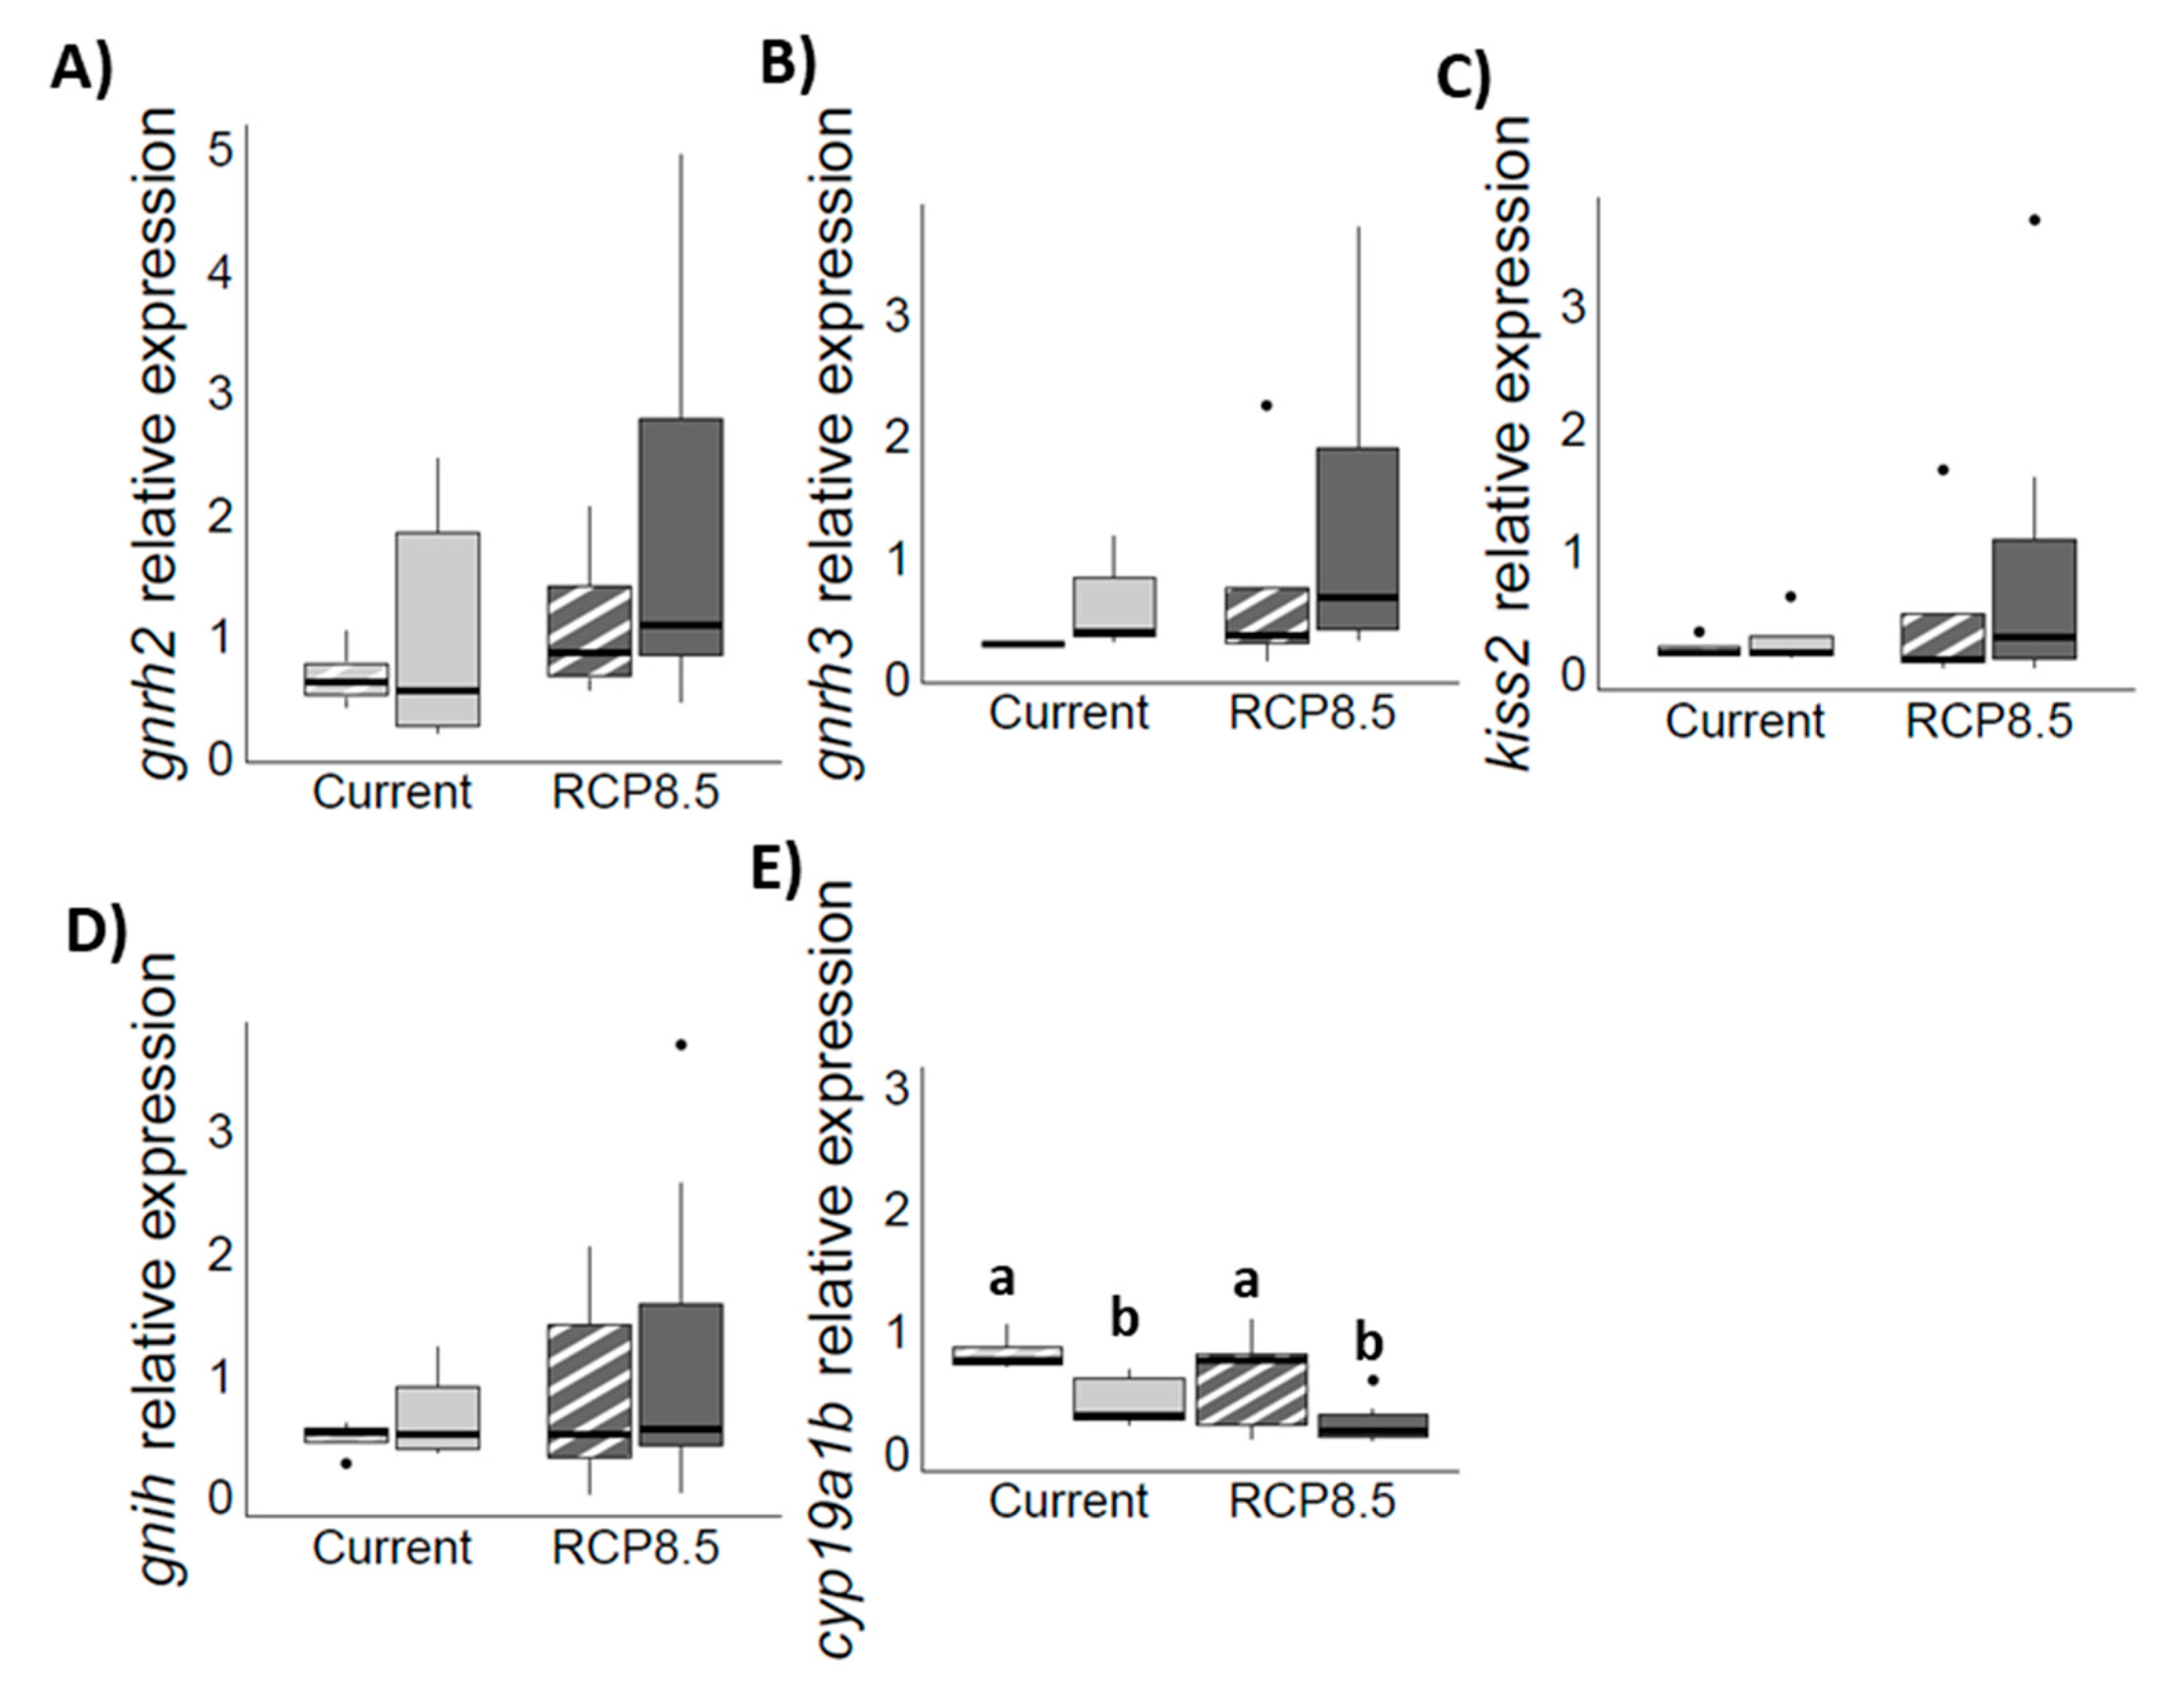
4.3. Genes Expression Profiles in the Brain
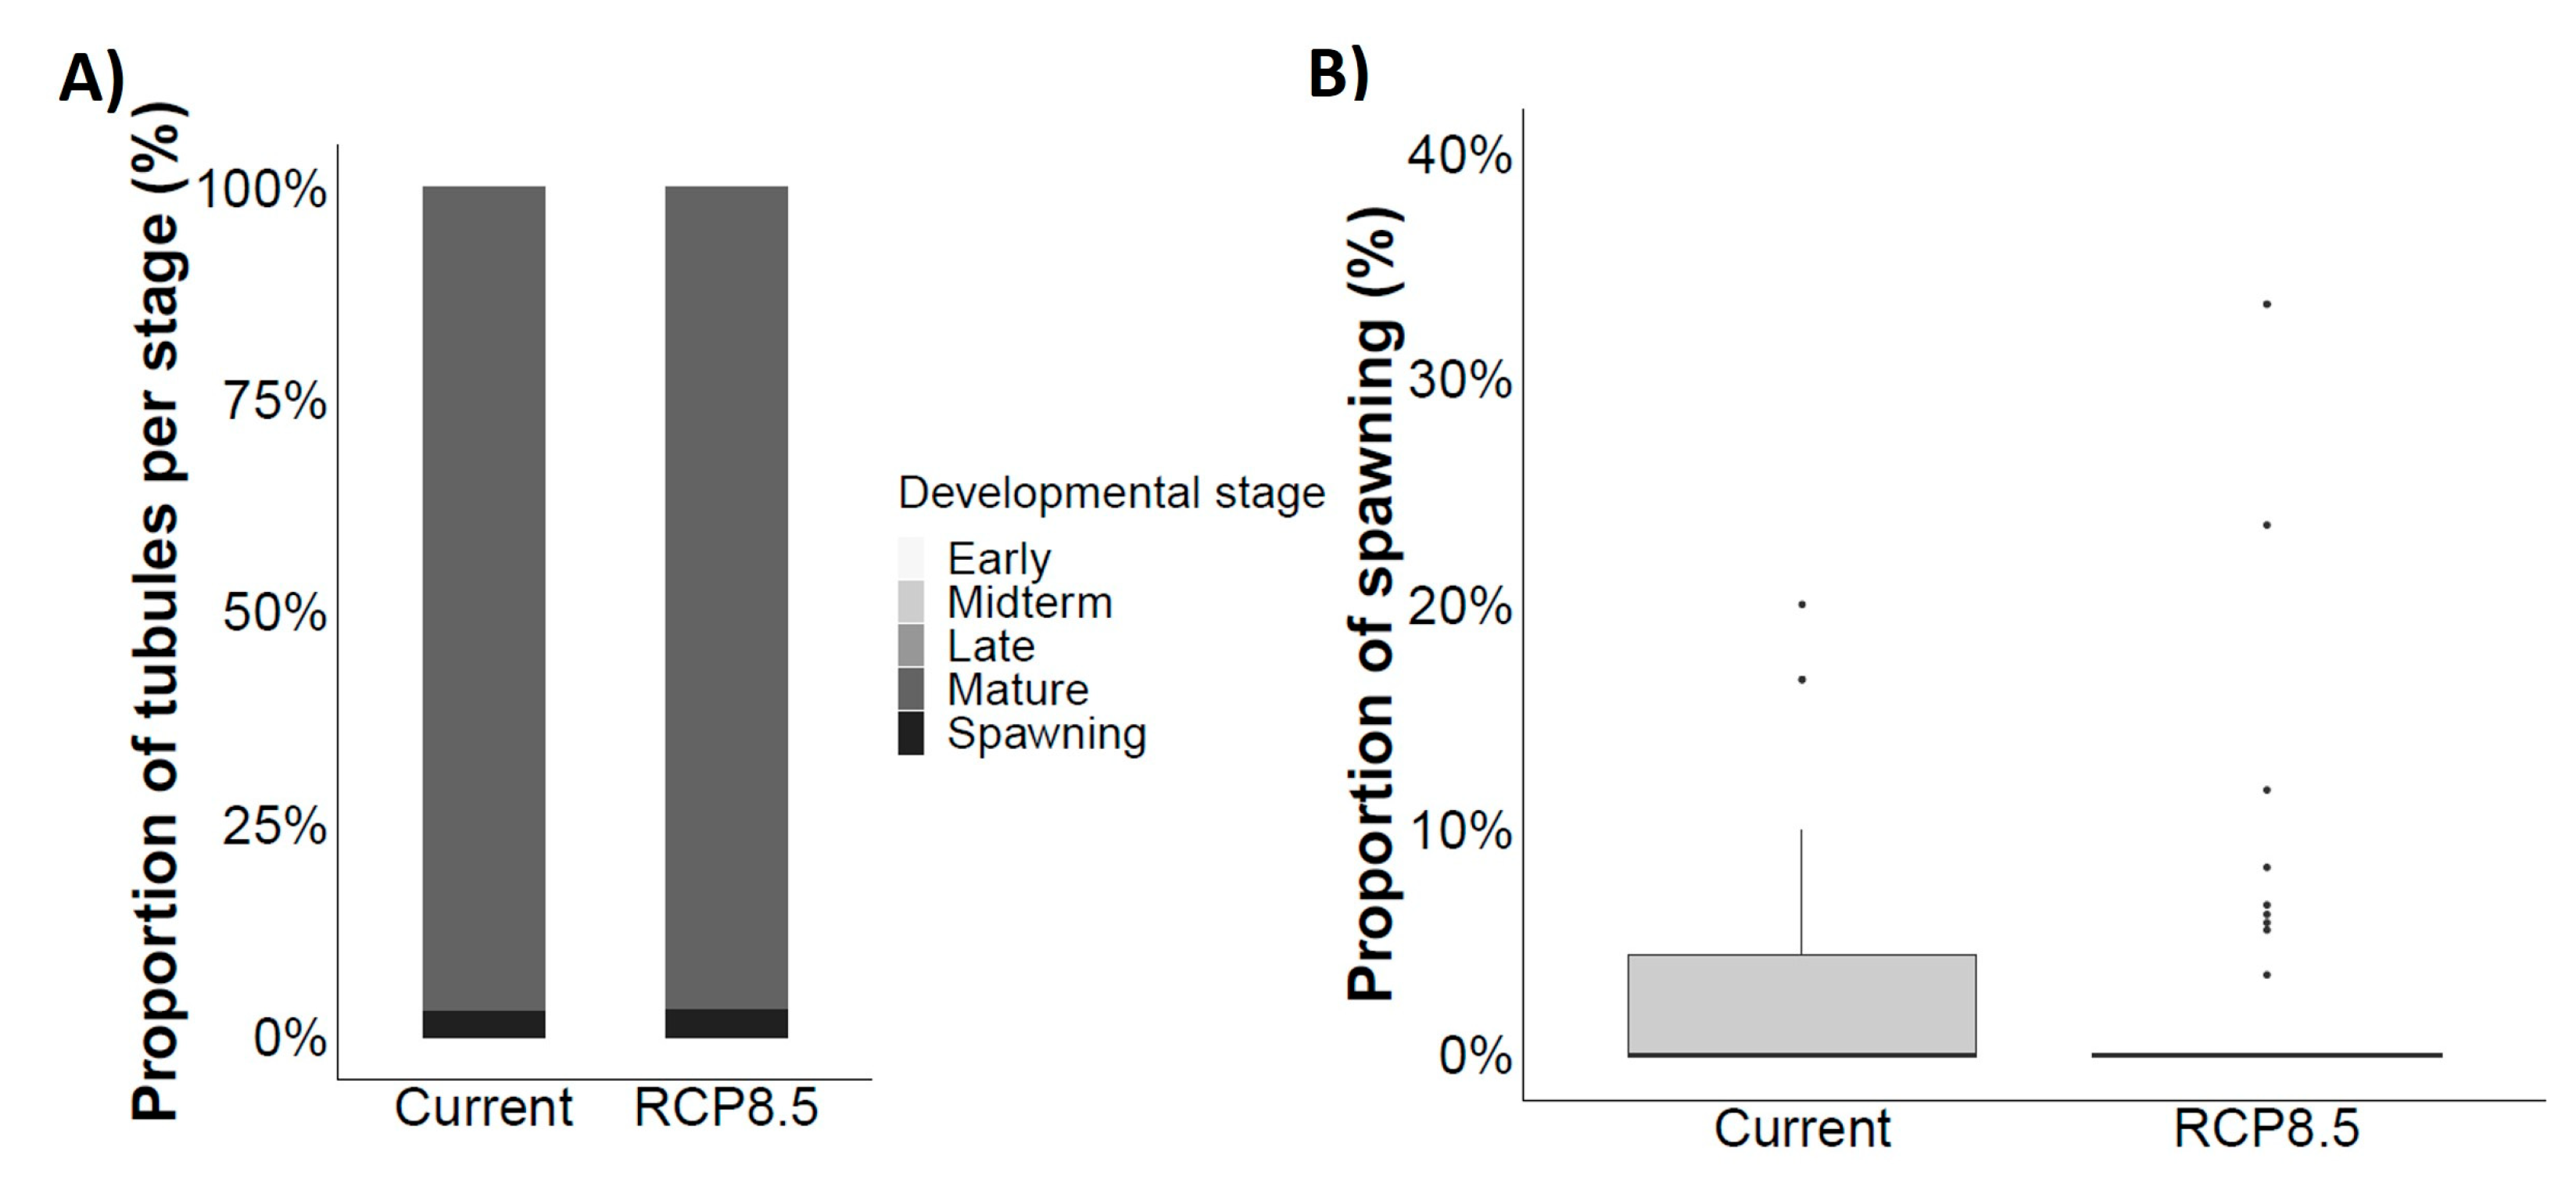
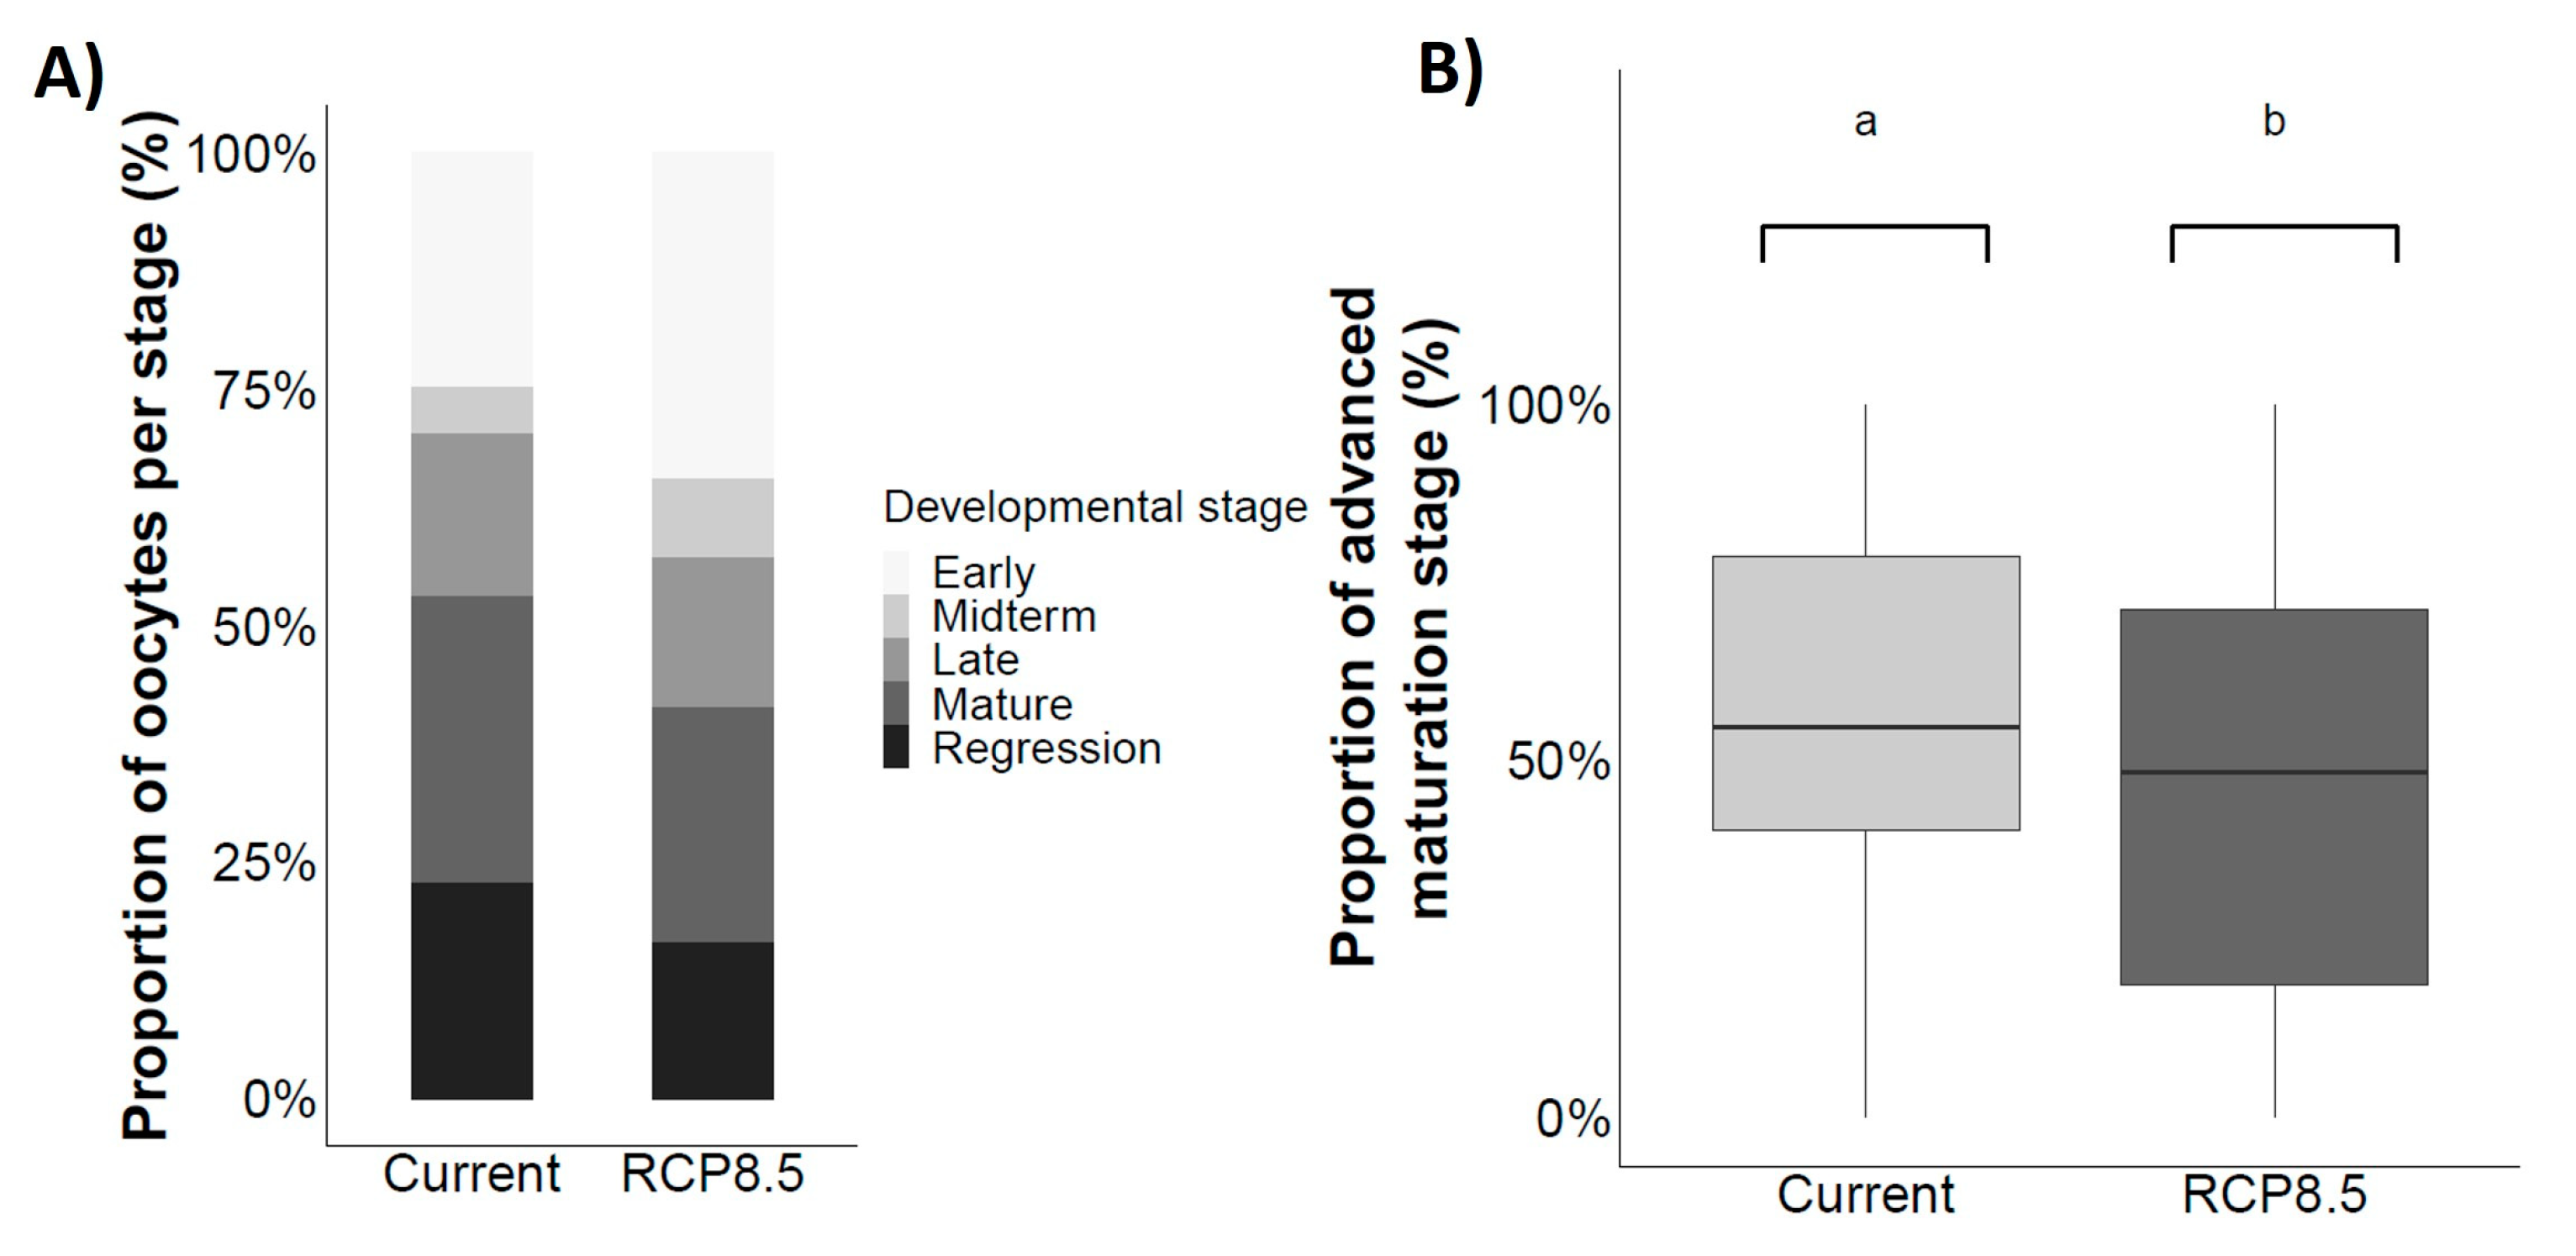
4.4. Gonad Maturation
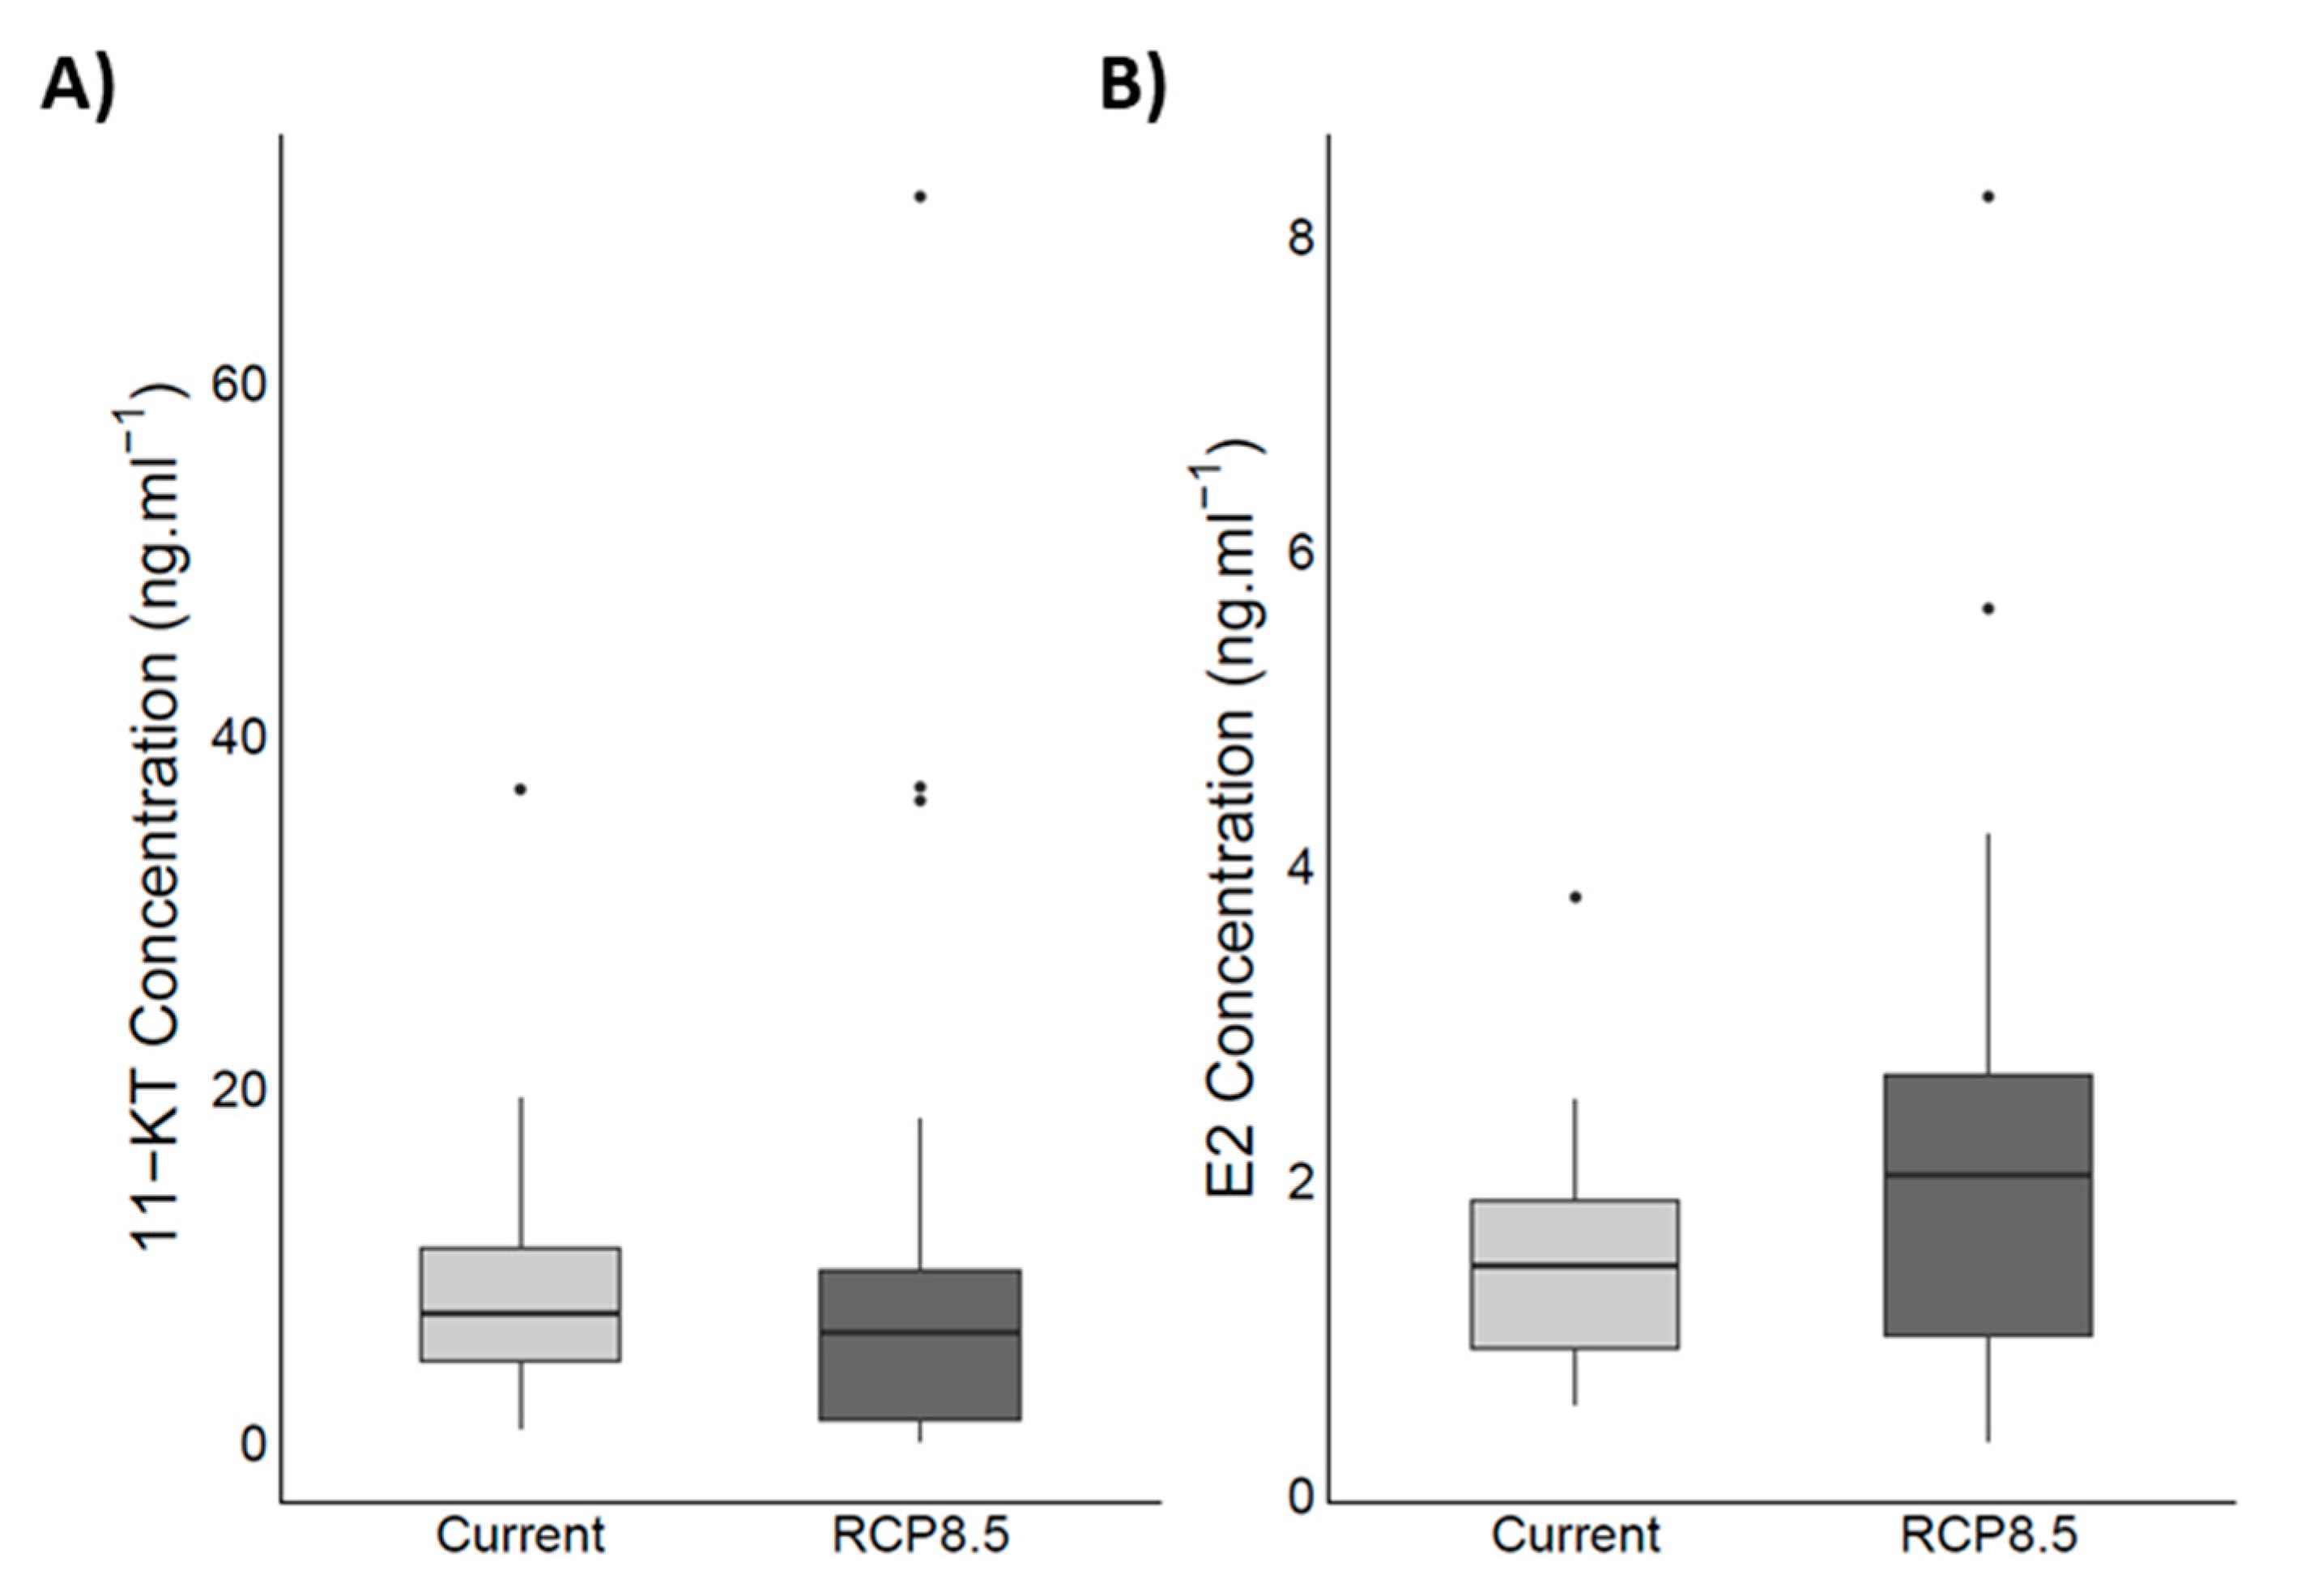
4.5. Steroid Hormones
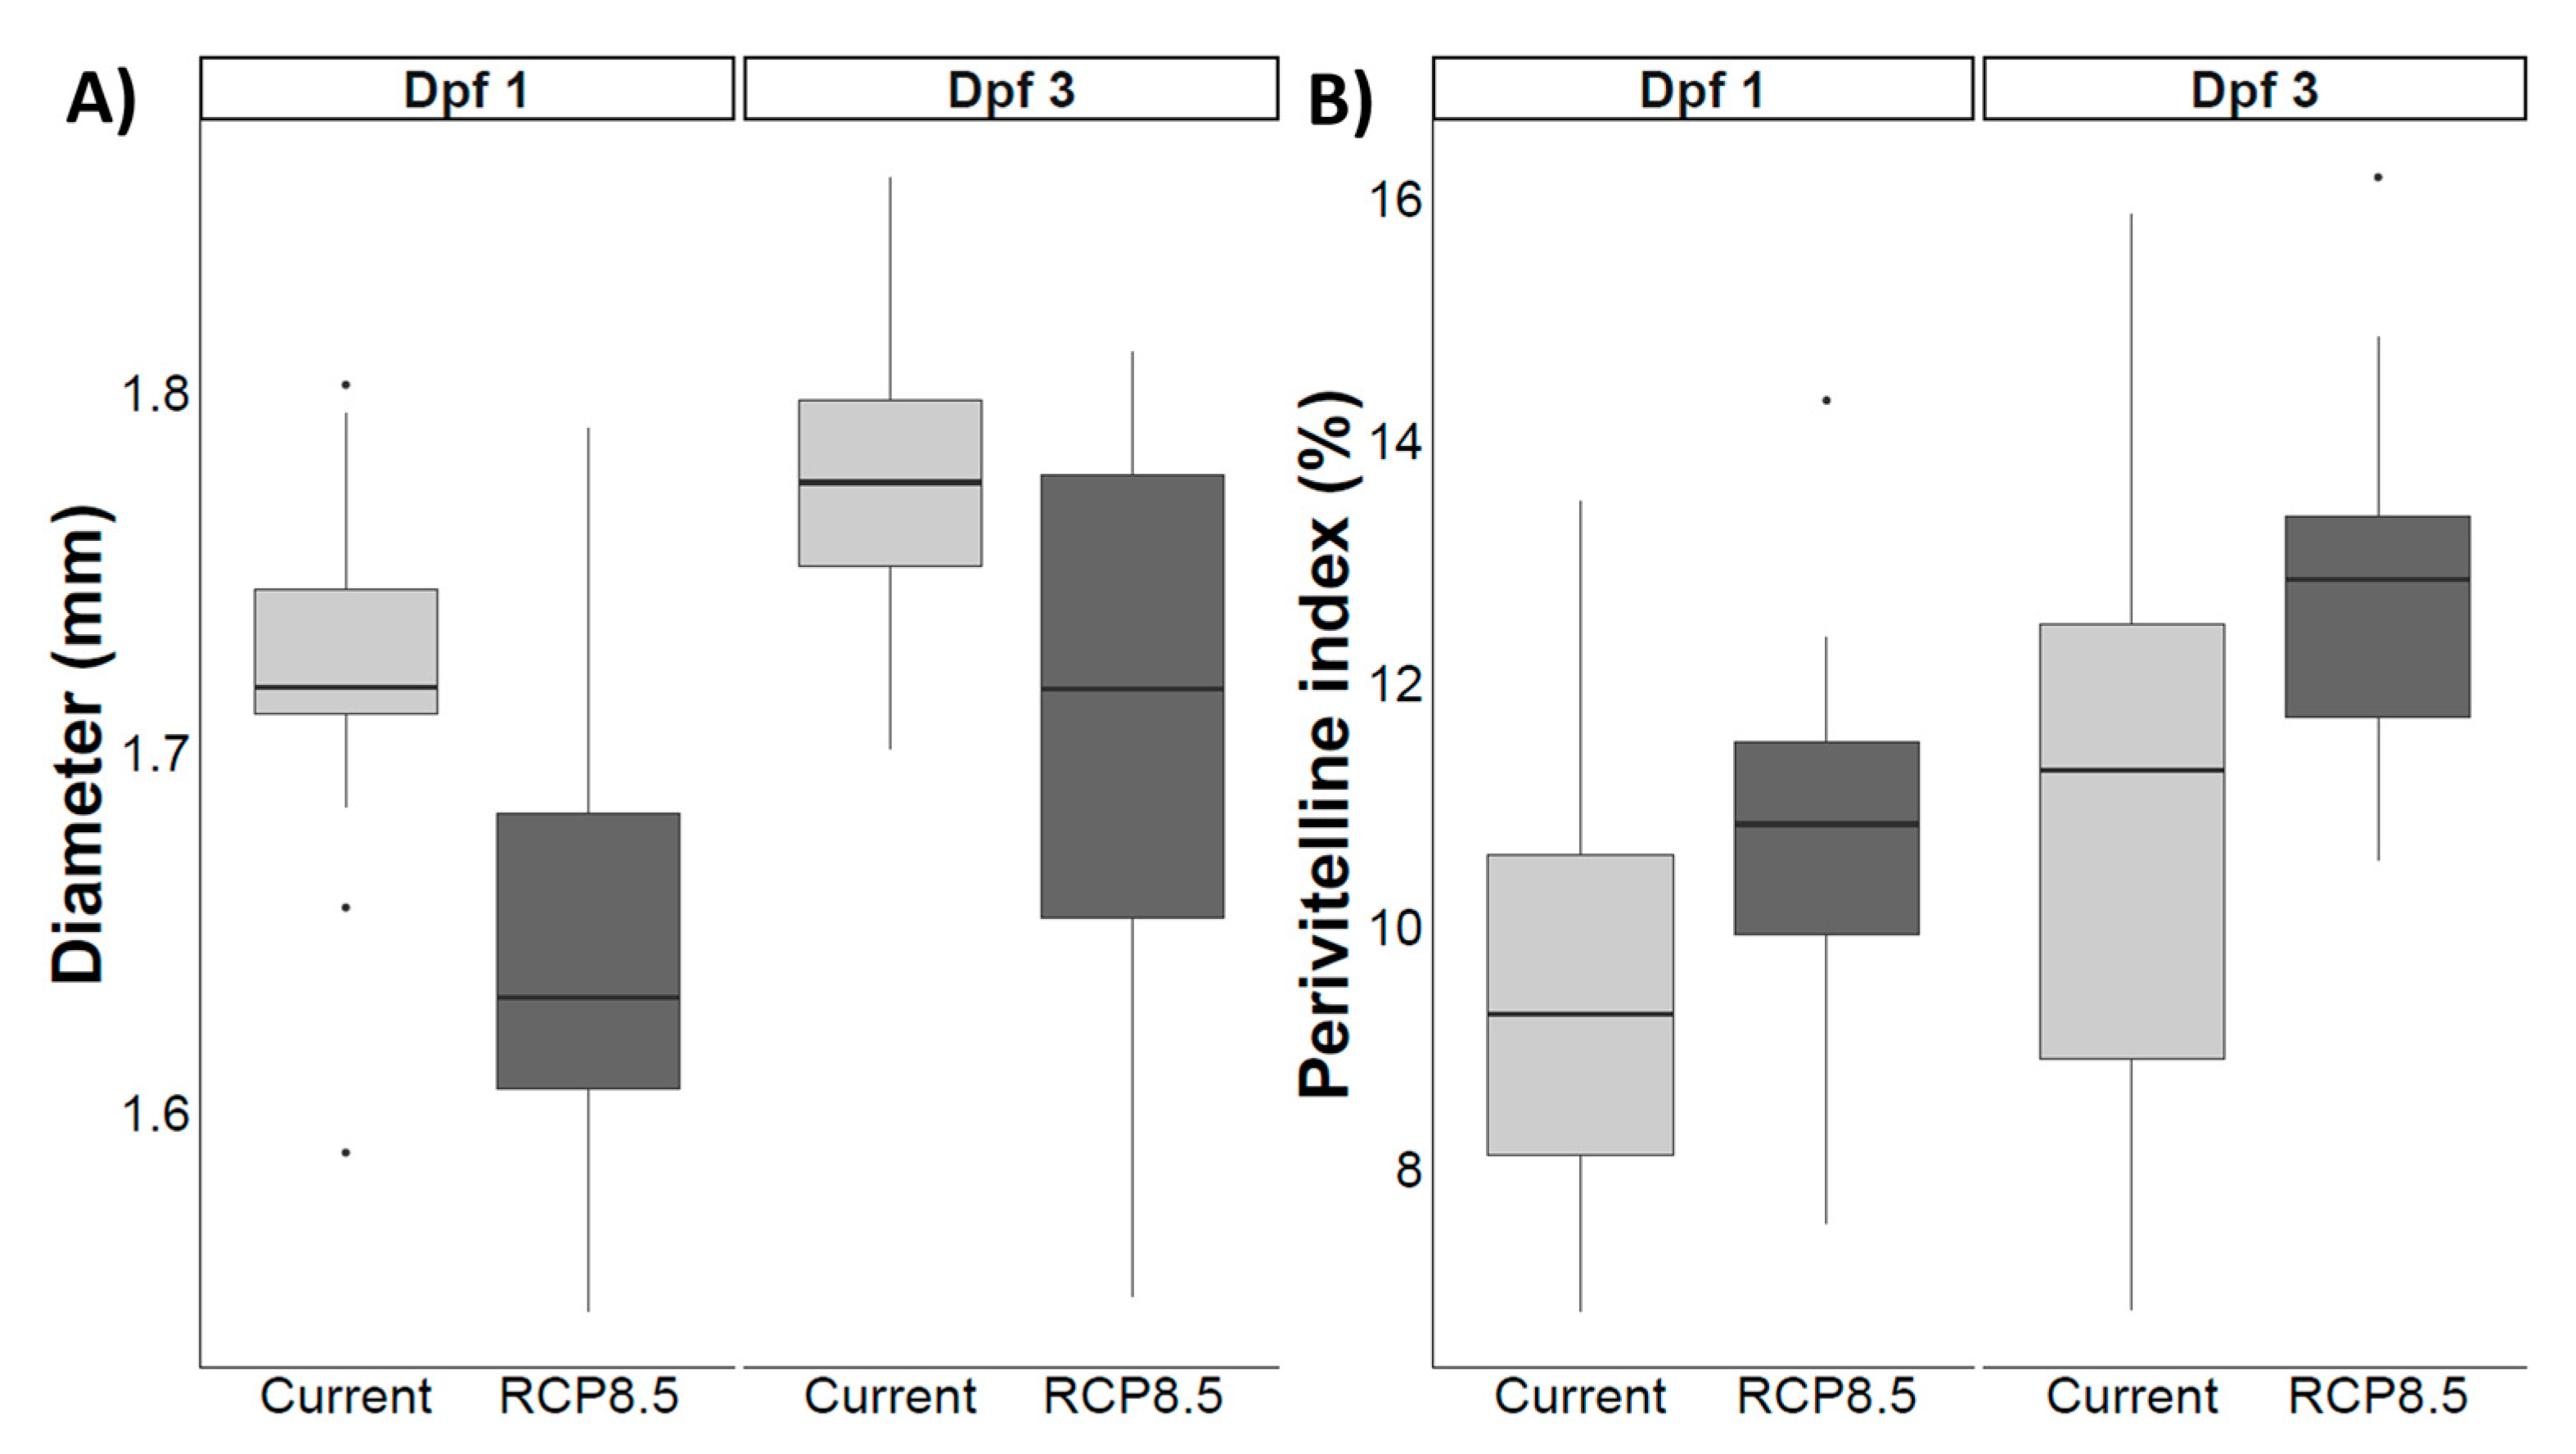
4.6. Reproductive Success
5. Discussion
6. Conclusions
Supplementary Materials
Author Contributions
Funding
Institutional Review Board Statement
Informed Consent Statement
Data Availability Statement
Acknowledgments
Conflicts of Interest
References
- Pörtner, H.-O.; Karl, D.M.; Boyd, P.W.; Cheung, W.W.L.; Lluch-Cota, S.E.; Nojiri, Y.; Schmidt, D.N.; Zavialov, P.O. Ocean Systems. In Climate Change 2014: Impacts, Adaptation, and Vulnerability. Part A: Global and Sectoral Aspects. Contribution of Working Group II to the Fifth Assessment Report of the Intergovernmental Panel on Climate Change; Field, C.B., Barros, V.R., Dokken, D.J., Mach, K.J., Mastrandrea, M.D., Bilir, T.E., Chatterjee, M., Ebi, K.L., Estrada, Y.O., Genova, R.C., et al., Eds.; Cambridge University Press: Cambridge, UK; New York, NY, USA, 2014; pp. 411–484. ISBN 978-1-107-41537-9. [Google Scholar]
- Kwiatkowski, L.; Torres, O.; Bopp, L.; Aumont, O.; Chamberlain, M.; Christian, J.R.; Dunne, J.P.; Gehlen, M.; Ilyina, T.; John, J.G.; et al. Twenty-First Century Ocean Warming, Acidification, Deoxygenation, and Upper-Ocean Nutrient and Primary Production Decline from CMIP6 Model Projections. Biogeosciences 2020, 17, 3439–3470. [Google Scholar] [CrossRef]
- Grorud-Colvert, K.; Sponaugle, S. Variability in Water Temperature Affects Trait-Mediated Survival of a Newly Settled Coral Reef Fish. Oecologia 2011, 165, 675–686. [Google Scholar] [CrossRef] [PubMed]
- Hermelink, B.; Wuertz, S.; Trubiroha, A.; Rennert, B.; Kloas, W.; Schulz, C. Influence of Temperature on Puberty and Maturation of Pikeperch, Sander Lucioperca. Gen. Comp. Endocrinol. 2011, 172, 282–292. [Google Scholar] [CrossRef] [PubMed]
- Tierney, K.B.; Patterson, D.A.; Kennedy, C.J. The Influence of Maternal Condition on Offspring Performance in Sockeye Salmon Oncorhynchus nerka. J. Fish. Biol. 2009, 75, 1244–1257. [Google Scholar] [CrossRef] [PubMed]
- Fry, F.E.J. The Effect of Environmental Factors on the Physiology of Fish. In Fish Physiology; Elsevier: Amsterdam, The Netherlands, 1971; Volume 6, pp. 1–98. ISBN 978-0-12-350406-7. [Google Scholar]
- Catalán, I.A.; Auch, D.; Kamermans, P.; Morales-Nin, B.; Angelopoulos, N.V.; Reglero, P.; Sandersfeld, T.; Peck, M.A. Critically Examining the Knowledge Base Required to Mechanistically Project Climate Impacts: A Case Study of Europe’s Fish and Shellfish. Fish. Fish. 2019, 20, 501–517. [Google Scholar] [CrossRef]
- Cominassi, L.; Moyano, M.; Claireaux, G.; Howald, S.; Mark, F.C.; Zambonino-Infante, J.-L.; Le Bayon, N.; Peck, M.A. Combined Effects of Ocean Acidification and Temperature on Larval and Juvenile Growth, Development and Swimming Performance of European Sea Bass (Dicentrarchus labrax). PLoS ONE 2019, 14, e0221283. [Google Scholar] [CrossRef]
- DeCourten, B.; Romney, A.; Brander, S. The Heat Is On: Complexities of Aquatic Endocrine Disruption in a Changing Global Climate. In Separation Science and Technology; Elsevier: Amsterdam, The Netherlands, 2019; Volume 11, pp. 13–49. ISBN 978-0-12-815730-5. [Google Scholar]
- Kim, S.-Y.; Metcalfe, N.B.; da Silva, A.; Velando, A. Thermal Conditions during Early Life Influence Seasonal Maternal Strategies in the Three-Spined Stickleback. BMC Ecol. 2017, 17, 34. [Google Scholar] [CrossRef]
- Oliveira, H.; Maulvault, A.L.; Castanho, S.; Repolho, T.; Valente, L.M.P.; Pousão-Ferreira, P.; Rosa, R.; Marques, A.; Anacleto, P. Lack of Detrimental Effects of Ocean Acidification and Warming on Proximate Composition, Fitness and Energy Budget of Juvenile Senegalese Sole (Solea senegalensis). Sci. Total Environ. 2023, 857, 159491. [Google Scholar] [CrossRef]
- Sampaio, E.; Santos, C.; Rosa, I.C.; Ferreira, V.; Pörtner, H.-O.; Duarte, C.M.; Levin, L.A.; Rosa, R. Impacts of Hypoxic Events Surpass Those of Future Ocean Warming and Acidification. Nat. Ecol. Evol. 2021, 5, 311–321. [Google Scholar] [CrossRef]
- Fenkes, M.; Fitzpatrick, J.L.; Ozolina, K.; Shiels, H.A.; Nudds, R.L. Sperm in Hot Water: Direct and Indirect Thermal Challenges Interact to Impact on Brown Trout Sperm Quality. J. Exp. Biol. 2017, 220, 2513–2520. [Google Scholar] [CrossRef]
- Lim, B.-S.; Kagawa, H.; Gen, K.; Okuzawa, K. Effects of Water Temperature on the Gonadal Development and Expression of Steroidogenic Enzymes in the Gonad of Juvenile Red Seabream, Pagrus major. Fish. Physiol. Biochem. 2003, 28, 161–162. [Google Scholar] [CrossRef]
- Pankhurst, N.W.; Purser, G.J.; Van Der Kraak, G.; Thomas, P.M.; Forteath, G.N.R. Effect of Holding Temperature on Ovulation, Egg Fertility, Plasma Levels of Reproductive Hormones and In Vitro Ovarian Steroidogenesis in the Rainbow Trout Oncorhynchus mykiss. Aquaculture 1996, 146, 277–290. [Google Scholar] [CrossRef]
- Elisio, M.; Chalde, T.; Miranda, L.A. Effects of Short Periods of Warm Water Fluctuations on Reproductive Endocrine Axis of the Pejerrey (Odontesthes bonariensis) Spawning. Comp. Biochem. Physiol. Part. A Mol. Integr. Physiol. 2012, 163, 47–55. [Google Scholar] [CrossRef] [PubMed]
- Anderson, K.; Pankhurst, N.; King, H.; Elizur, A. Effect of Thermal Challenge on the Expression of Genes Involved in Ovarian Steroidogenesis in Tasmanian Atlantic Salmon (Salmo salar). Aquaculture 2017, 479, 474–478. [Google Scholar] [CrossRef]
- Dionísio, G.; Campos, C.; Valente, L.M.P.; Conceição, L.E.C.; Cancela, M.L.; Gavaia, P.J. Effect of Egg Incubation Temperature on the Occurrence of Skeletal Deformities in Solea Senegalensis. J. Appl. Ichthyol. 2012, 28, 471–476. [Google Scholar] [CrossRef]
- Schulte, P.M.; Healy, T.M.; Fangue, N.A. Thermal Performance Curves, Phenotypic Plasticity, and the Time Scales of Temperature Exposure. Integr. Comp. Biol. 2011, 51, 691–702. [Google Scholar] [CrossRef]
- González, A.; Piferrer, F. Characterization of Aromatase Activity in the Sea Bass: Effects of Temperature and Different Catalytic Properties of Brain and Ovarian Homogenates and Microsomes. J. Exp. Zool. 2002, 293, 500–510. [Google Scholar] [CrossRef]
- Anderson, K.; Luckenbach, J.A.; Yamamoto, Y.; Elizur, A. Impacts of Fsh, Igf1, and High Temperature on the Expression of Genes Involved in Steroidogenesis, Cell Communication, and Apoptosis in Isolated Coho Salmon Previtellogenic Ovarian Follicles. Aquaculture 2019, 506, 60–69. [Google Scholar] [CrossRef]
- Anderson, K.; Swanson, P.; Pankhurst, N.; King, H.; Elizur, A. Effect of Thermal Challenge on Plasma Gonadotropin Levels and Ovarian Steroidogenesis in Female Maiden and Repeat Spawning Tasmanian Atlantic Salmon (Salmo salar). Aquaculture 2012, 334–337, 205–212. [Google Scholar] [CrossRef]
- Tenugu, S.; Pranoty, A.; Mamta, S.-K.; Senthilkumaran, B. Development and Organisation of Gonadal Steroidogenesis in Bony Fishes—A Review. Aquac. Fish. 2021, 6, 223–246. [Google Scholar] [CrossRef]
- Alix, M.; Kjesbu, O.S.; Anderson, K.C. From Gametogenesis to Spawning: How Climate-driven Warming Affects Teleost Reproductive Biology. J. Fish. Biol. 2020, 97, 607–632. [Google Scholar] [CrossRef] [PubMed]
- Servili, A.; Canario, A.V.M.; Mouchel, O.; Muñoz-Cueto, J.A. Climate Change Impacts on Fish Reproduction Are Mediated at Multiple Levels of the Brain-Pituitary-Gonad Axis. Gen. Comp. Endocrinol. 2020, 291, 113439. [Google Scholar] [CrossRef] [PubMed]
- Pörtner, H.O. Synergistic Effects of Temperature Extremes, Hypoxia, and Increases in CO 2 on Marine Animals: From Earth History to Global Change. J. Geophys. Res. 2005, 110, C09S10. [Google Scholar] [CrossRef]
- Nilsson, G.E.; Dixson, D.L.; Domenici, P.; McCormick, M.I.; Sørensen, C.; Watson, S.-A.; Munday, P.L. Near-Future Carbon Dioxide Levels Alter Fish Behaviour by Interfering with Neurotransmitter Function. Nat. Clim. Chang. 2012, 2, 201–204. [Google Scholar] [CrossRef]
- Tresguerres, M.; Hamilton, T.J. Acid–Base Physiology, Neurobiology and Behaviour in Relation to CO2-Induced Ocean Acidification. J. Exp. Biol. 2017, 220, 2136–2148. [Google Scholar] [CrossRef]
- Frommel, A.Y.; Maneja, R.; Lowe, D.; Malzahn, A.M.; Geffen, A.J.; Folkvord, A.; Piatkowski, U.; Reusch, T.B.H.; Clemmesen, C. Severe Tissue Damage in Atlantic Cod Larvae under Increasing Ocean Acidification. Nat. Clim. Chang. 2012, 2, 42–46. [Google Scholar] [CrossRef]
- Enzor, L.A.; Zippay, M.L.; Place, S.P. High Latitude Fish in a High CO2 World: Synergistic Effects of Elevated Temperature and Carbon Dioxide on the Metabolic Rates of Antarctic Notothenioids. Comp. Biochem. Physiol. Part A Mol. Integr. Physiol. 2013, 164, 154–161. [Google Scholar] [CrossRef]
- Pimentel, M.S.; Faleiro, F.; Marques, T.; Bispo, R.; Dionísio, G.; Faria, A.M.; Machado, J.; Peck, M.A.; Pörtner, H.; Pousão-Ferreira, P.; et al. Foraging Behaviour, Swimming Performance and Malformations of Early Stages of Commercially Important Fishes under Ocean Acidification and Warming. Clim. Chang. 2016, 137, 495–509. [Google Scholar] [CrossRef]
- Schade, F.M.; Clemmesen, C.; Mathias Wegner, K. Within- and Transgenerational Effects of Ocean Acidification on Life History of Marine Three-Spined Stickleback (Gasterosteus aculeatus). Mar. Biol. 2014, 161, 1667–1676. [Google Scholar] [CrossRef]
- Munday, P.L.; Welch, M.J.; Allan, B.J.M.; Watson, S.-A.; McMahon, S.J.; McCormick, M.I. Effects of Elevated CO2 on Predator Avoidance Behaviour by Reef Fishes Is Not Altered by Experimental Test Water. PeerJ 2016, 4, e2501. [Google Scholar] [CrossRef]
- Pimentel, M.S.; Faleiro, F.; Dionísio, G.; Repolho, T.; Pousão-Ferreira, P.; Machado, J.; Rosa, R. Defective Skeletogenesis and Oversized Otoliths in Fish Early Stages in a Changing Ocean. J. Exp. Biol. 2014, 217, 2062–2070. [Google Scholar] [CrossRef] [PubMed]
- Pimentel, M.S.; Faleiro, F.; Diniz, M.; Machado, J.; Pousão-Ferreira, P.; Peck, M.A.; Pörtner, H.O.; Rosa, R. Oxidative Stress and Digestive Enzyme Activity of Flatfish Larvae in a Changing Ocean. PLoS ONE 2015, 10, e0134082. [Google Scholar] [CrossRef] [PubMed]
- Dahlke, F.; Lucassen, M.; Bickmeyer, U.; Wohlrab, S.; Puvanendran, V.; Mortensen, A.; Chierici, M.; Pörtner, H.-O.; Storch, D. Fish Embryo Vulnerability to Combined Acidification and Warming Coincides with a Low Capacity for Homeostatic Regulation. J. Exp. Biol. 2020, 223, jeb212589. [Google Scholar] [CrossRef] [PubMed]
- Villalobos, C.; Love, B.A.; Olson, M.B. Ocean Acidification and Ocean Warming Effects on Pacific Herring (Clupea pallasi) Early Life Stages. Front. Mar. Sci. 2020, 7, 597899. [Google Scholar] [CrossRef]
- Pimentel, M.S.; Faleiro, F.; Machado, J.; Pousão-Ferreira, P.; Rosa, R. Seabream Larval Physiology under Ocean Warming and Acidification. Fishes 2020, 5, 1. [Google Scholar] [CrossRef]
- Wootton, R.J. A Functional Biology of Sticklebacks; Springer US: Boston, MA, 1984; ISBN 978-1-4615-8515-2. [Google Scholar]
- Blaker, E.; Sebire, M.; Ellis, T.; Katsiadaki, I. The Housing, Care, and Use of a Laboratory Three-Spined Stickleback Colony. In Laboratory Fish in Biomedical Research; Elsevier: Amsterdam, The Netherlands, 2022; pp. 349–371. ISBN 978-0-12-821099-4. [Google Scholar]
- Biology of the Three-Spined Stickleback; Ostlund-Nilsson, S.; Mayer, I.; Huntingford, F.A. (Eds.) CRC Press: Boca Raton, FL, USA, 2006; ISBN 978-0-429-12283-5. [Google Scholar]
- Jones, F.C.; Grabherr, M.G.; Chan, Y.F.; Russell, P.; Mauceli, E.; Johnson, J.; Swofford, R.; Pirun, M.; Zody, M.C.; White, S.; et al. The Genomic Basis of Adaptive Evolution in Threespine Sticklebacks. Nature 2012, 484, 55–61. [Google Scholar] [CrossRef]
- Kingsley, D.M.; Zhu, B.; Osoegawa, K.; de Jong, P.; Schein, J.; Marra, M.; Peichel, C.; Amemiya, C.; Schluter, D.; Balabhadra, S.; et al. New Genomic Tools for Molecular Studies of Evolutionary Change in Threespine Sticklebacks. Behav. 2004, 141, 1331–1344. [Google Scholar] [CrossRef]
- Guderley, H.; Lavoie, B.A.; Dubois, N. The Interaction among Age, Thermal Acclimation and Growth Rate in Determining Muscle Metabolic Capacities and Tissue Masses in the Threespine Stickleback, Gasterosteus aculeatus. Fish. Physiol. Biochem. 1994, 13, 419–431. [Google Scholar] [CrossRef]
- Glippa, O.; Brutemark, A.; Johnson, J.; Spilling, K.; Candolin, U.; Engström-Öst, J. Early Development of the Threespine Stickleback in Relation to Water PH. Front. Mar. Sci. 2017, 4, 427. [Google Scholar] [CrossRef]
- Shama, L.N.S. Bet Hedging in a Warming Ocean: Predictability of Maternal Environment Shapes Offspring Size Variation in Marine Sticklebacks. Glob. Chang. Biol. 2015, 21, 4387–4400. [Google Scholar] [CrossRef]
- Shama, L.N.S. The Mean and Variance of Climate Change in the Oceans: Hidden Evolutionary Potential under Stochastic Environmental Variability in Marine Sticklebacks. Sci. Rep. 2017, 7, 8889. [Google Scholar] [CrossRef] [PubMed]
- Kim, S.-Y.; Costa, M.M.; Esteve-Codina, A.; Velando, A. Transcriptional Mechanisms Underlying Life-History Responses to Climate Change in the Three-Spined Stickleback. Evol. Appl. 2017, 10, 718–730. [Google Scholar] [CrossRef] [PubMed]
- Gidden, M.J.; Riahi, K.; Smith, S.J.; Fujimori, S.; Luderer, G.; Kriegler, E.; van Vuuren, D.P.; van den Berg, M.; Feng, L.; Klein, D.; et al. Global Emissions Pathways under Different Socioeconomic Scenarios for Use in CMIP6: A Dataset of Harmonized Emissions Trajectories through the End of the Century. Geosci. Model. Dev. 2019, 12, 1443–1475. [Google Scholar] [CrossRef]
- Meinshausen, M.; Nicholls, Z.R.J.; Lewis, J.; Gidden, M.J.; Vogel, E.; Freund, M.; Beyerle, U.; Gessner, C.; Nauels, A.; Bauer, N.; et al. The Shared Socio-Economic Pathway (SSP) Greenhouse Gas Concentrations and Their Extensions to 2500. Geosci. Model Dev. 2020, 13, 3571–3605. [Google Scholar] [CrossRef]
- Cohen-Rengifo, M.; Danion, M.; Gonzalez, A.-A.; Bégout, M.-L.; Cormier, A.; Noël, C.; Cabon, J.; Vitré, T.; Mark, F.C.; Mazurais, D. The Extensive Transgenerational Transcriptomic Effects of Ocean Acidification on the Olfactory Epithelium of a Marine Fish Are Associated with a Better Viral Resistance. BMC Genom. 2022, 23, 448. [Google Scholar] [CrossRef]
- Anderson, D.H.; Robinson, R.J. Rapid Electrometric Determination of Alkalinity of Sea Water Using Glass Electrode. Ind. Eng. Chem. Anal. Ed. 1946, 18, 767–769. [Google Scholar] [CrossRef]
- Strickland, J.D.H.; Parsons, T.R. A Practical Handbook of Seawater Analysis, 2nd ed.; Fisheries Research Board of Canada: Ottawa, ON, Canada, 1972. [Google Scholar] [CrossRef]
- Lewis, E.; Wallace, D.W.R. MS Excel Program Developed for CO2 System Calculations; Carbon Dioxide Information Analysis Center (CDIAC), Environmental Sciences Division: Oak Ridge, TN, USA, 2012. [Google Scholar]
- Mehrbach, C.; Culberson, C.H.; Hawley, J.E.; Pytkowicx, R.M. Measurement of the Apparent Dissociation Constants of Carbonic Acid in Seawater at Atmospheric Pressure. Limnol. Oceanogr. 1973, 18, 897–907. [Google Scholar] [CrossRef]
- Dickson, A.G.; Millero, F.J. A Comparison of the Equilibrium Constants for the Dissociation of Carbonic Acid in Seawater Media. Deep. Sea Res. Part A Oceanogr. Res. Pap. 1987, 34, 1733–1743. [Google Scholar] [CrossRef]
- Xie, C.; Li, Q.; Han, G.; Liu, H.; Yang, J.; Li, J. Stable Isotope Dilution Assay for the Accurate Determination of Tricaine in Fish Samples by HPLC–MS–MS. Biomed. Chromatogr. 2019, 33, e4512. [Google Scholar] [CrossRef]
- Schneider, C.A.; Rasband, W.S.; Eliceiri, K.W. NIH Image to ImageJ: 25 Years of Image Analysis. Nat. Methods 2012, 9, 671–675. [Google Scholar] [CrossRef]
- Cominassi, L.; Moyano, M.; Claireaux, G.; Howald, S.; Mark, F.C.; Zambonino-Infante, J.-L.; Peck, M.A. Food Availability Modulates the Combined Effects of Ocean Acidification and Warming on Fish Growth. Sci. Rep. 2020, 10, 2338. [Google Scholar] [CrossRef] [PubMed]
- Iwama, G.K.; Tautz, A.F. A Simple Growth Model for Salmonids in Hatcheries. Can. J. Fish. Aquat. Sci. 1981, 38, 649–656. [Google Scholar] [CrossRef]
- Hani, Y.M.I.; Turies, C.; Palluel, O.; Delahaut, L.; Bado-Nilles, A.; Geffard, A.; Dedourge-Geffard, O.; Porcher, J.-M. Effects of a Chronic Exposure to Different Water Temperatures and/or to an Environmental Cadmium Concentration on the Reproduction of the Threespine Stickleback (Gasterosteus aculeatus). Ecotoxicol. Environ. Saf. 2019, 174, 48–57. [Google Scholar] [CrossRef] [PubMed]
- Folch, J.; Lees, M.; Sloane Stanley, G.H. A Simple Method for the Isolation and Purification of Total Lipides from Animal Tissues. J. Biol. Chem. 1957, 226, 497–509. [Google Scholar] [CrossRef] [PubMed]
- Untergasser, A.; Nijveen, H.; Rao, X.; Bisseling, T.; Geurts, R.; Leunissen, J.A.M. Primer3Plus, an Enhanced Web Interface to Primer3. Nucleic Acids Res. 2007, 35, W71–W74. [Google Scholar] [CrossRef]
- Sokolowska, E.; Kulczykowska, E. Annual Reproductive Cycle in Two Free Living Populations of Three-Spined Stickleback (Gasterosteus aculeatus L.): Patterns of Ovarian and Testicular Development. Oceanologia 2006, 48, 103–124. [Google Scholar]
- Furin, C.G.; von Hippel, F.A.; Postlethwait, J.H.; Buck, C.L.; Cresko, W.A.; O’Hara, T.M. Developmental Timing of Sodium Perchlorate Exposure Alters Angiogenesis, Thyroid Follicle Proliferation and Sexual Maturation in Stickleback. Gen. Comp. Endocrinol. 2015, 219, 24–35. [Google Scholar] [CrossRef]
- Gardell, A.M.; Dillon, D.M.; Smayda, L.C.; von Hippel, F.A.; Cresko, W.A.; Postlethwait, J.H.; Buck, C.L. Perchlorate Exposure Does Not Modulate Temporal Variation of Whole-Body Thyroid and Androgen Hormone Content in Threespine Stickleback. Gen. Comp. Endocrinol. 2015, 219, 45–52. [Google Scholar] [CrossRef]
- Kitano, J.; Kakioka, R.; Ishikawa, A.; Toyoda, A.; Kusakabe, M. Differences in the Contributions of Sex Linkage and Androgen Regulation to Sex-biased Gene Expression in Juvenile and Adult Sticklebacks. J. Evol. Biol. 2020, 33, 1129–1138. [Google Scholar] [CrossRef]
- R Core Team R: A Language and Environment for Statistical Computing 2018, Vienna, Austria. Available online: https://www.R-project.org/ (accessed on 30 September 2023).
- Holm, S. A Simple Sequentially Rejective Multiple Test Procedure. Scand. J. Stat. 1979, 6, 65–70. [Google Scholar]
- Venables, W.N.; Ripley, B.D. Modern Applied Statistics with S; Statistics and Computing; Springer: New York, NY, USA, 2002; ISBN 978-1-4419-3008-8. [Google Scholar]
- Leloutre, C.; Péry, A.R.R.; Porcher, J.-M.; Beaudouin, R. A Bioenergetics Model of the Entire Life Cycle of the Three-Spined Stickleback, Gasterosteus aculeatus. Ecol. Freshw. Fish. 2018, 27, 116–127. [Google Scholar] [CrossRef]
- Hani, Y.M.I.; Turies, C.; Palluel, O.; Delahaut, L.; Gaillet, V.; Bado-nilles, A.; Porcher, J.-M.; Geffard, A.; Dedourge-geffard, O. Effects of Chronic Exposure to Cadmium and Temperature, Alone or Combined, on the Threespine Stickleback (Gasterosteus aculeatus): Interest of Digestive Enzymes as Biomarkers. Aquat. Toxicol. 2018, 199, 252–262. [Google Scholar] [CrossRef] [PubMed]
- Grøtan, K.; Østbye, K.; Taugbøl, A.; Vøllestad, L.A. No Short-Term Effect of Salinity on Oxygen Consumption in Threespine Stickleback (Gasterosteus aculeatus) from Fresh, Brackish, and Salt Water. Can. J. Zool. 2012, 90, 1386–1393. [Google Scholar] [CrossRef]
- Esbaugh, A.J. Physiological Implications of Ocean Acidification for Marine Fish: Emerging Patterns and New Insights. J. Comp. Physiol. B 2018, 188, 1–13. [Google Scholar] [CrossRef] [PubMed]
- Baag, S.; Mandal, S. Combined Effects of Ocean Warming and Acidification on Marine Fish and Shellfish: A Molecule to Ecosystem Perspective. Sci. Total Environ. 2022, 802, 149807. [Google Scholar] [CrossRef] [PubMed]
- Gräns, A.; Jutfelt, F.; Sandblom, E.; Jönsson, E.; Wiklander, K.; Seth, H.; Olsson, C.; Dupont, S.; Ortega-Martinez, O.; Einarsdottir, I.; et al. Aerobic Scope Fails to Explain the Detrimental Effects on Growth Resulting from Warming and Elevated CO2 in Atlantic Halibut. J. Exp. Biol. 2014, 217, 711–717. [Google Scholar] [CrossRef] [PubMed]
- Pistevos, J.C.A.; Nagelkerken, I.; Rossi, T.; Olmos, M.; Connell, S.D. Ocean Acidification and Global Warming Impair Shark Hunting Behaviour and Growth. Sci. Rep. 2015, 5, 16293. [Google Scholar] [CrossRef] [PubMed]
- Heuer, R.M.; Grosell, M. Physiological Impacts of Elevated Carbon Dioxide and Ocean Acidification on Fish. Am. J. Physiol. -Regul. Integr. Comp. Physiol. 2014, 307, R1061–R1084. [Google Scholar] [CrossRef]
- Heuer, R.M.; Grosell, M. Elevated CO2 Increases Energetic Cost and Ion Movement in the Marine Fish Intestine. Sci. Rep. 2016, 6, 34480. [Google Scholar] [CrossRef]
- Munday, P.; Crawley, N.; Nilsson, G. Interacting Effects of Elevated Temperature and Ocean Acidification on the Aerobic Performance of Coral Reef Fishes. Mar. Ecol. Prog. Ser. 2009, 388, 235–242. [Google Scholar] [CrossRef]
- Concannon, C.A.; Cross, E.L.; Jones, L.F.; Murray, C.S.; Matassa, C.M.; McBride, R.S.; Baumann, H. Temperature-Dependent Effects on Fecundity in a Serial Broadcast Spawning Fish after Whole-Life High CO2 Exposure. ICES J. Mar. Sci. 2021, 78, 3724–3734. [Google Scholar] [CrossRef]
- Gobler, C.J.; Merlo, L.R.; Morrell, B.K.; Griffith, A.W. Temperature, Acidification, and Food Supply Interact to Negatively Affect the Growth and Survival of the Forage Fish, Menidia Beryllina (Inland Silverside), and Cyprinodon Variegatus (Sheepshead Minnow). Front. Mar. Sci. 2018, 5, 86. [Google Scholar] [CrossRef]
- Murray, C.; Baumann, H. You Better Repeat It: Complex CO2 × Temperature Effects in Atlantic Silverside Offspring Revealed by Serial Experimentation. Diversity 2018, 10, 69. [Google Scholar] [CrossRef]
- Tocher, D.R. Metabolism and Functions of Lipids and Fatty Acids in Teleost Fish. Rev. Fish. Sci. 2003, 11, 107–184. [Google Scholar] [CrossRef]
- Craig, S.R.; MacKenzie, D.S.; Jones, G.; Gatlin, D.M. Seasonal Changes in the Reproductive Condition and Body Composition of Free-Ranging Red Drum, Sciaenops ocellatus. Aquaculture 2000, 190, 89–102. [Google Scholar] [CrossRef]
- Wootton, R.J.; Fletcher, D.A. Effect of Spawning Number and Ration on Reproductive Performance of the Batch-Spawning Three-Spined Stickleback Gasterosteus aculeatus. J. Fish. Biol. 2009, 75, 618–629. [Google Scholar] [CrossRef]
- Wootton, R.J. Energy Cost of Egg Production and Environmental Determinants of Fecundity in Teleost Fishes. Symp. Zool. Soc. Lond. 1979, 44, 133–155. [Google Scholar]
- Baker, J.A.; Wund, M.A.; Heins, D.C.; King, R.W.; Reyes, M.L.; Foster, S.A. Life-History Plasticity in Female Threespine Stickleback. Heredity 2015, 115, 322–334. [Google Scholar] [CrossRef] [PubMed]
- Madsen, T.; Shine, R. The Adjustment of Reproductive Threshold to Prey Abundance in a Capital Breeder. J. Anim. Ecol. 1999, 68, 571–580. [Google Scholar] [CrossRef]
- Asch, R.G.; Stock, C.A.; Sarmiento, J.L. Climate Change Impacts on Mismatches between Phytoplankton Blooms and Fish Spawning Phenology. Glob. Chang. Biol. 2019, 25, 2544–2559. [Google Scholar] [CrossRef] [PubMed]
- Cohen, J.M.; Lajeunesse, M.J.; Rohr, J.R. A Global Synthesis of Animal Phenological Responses to Climate Change. Nat. Clim. Chang. 2018, 8, 224–228. [Google Scholar] [CrossRef]
- Durant, J.; Hjermann, D.; Falkenhaug, T.; Gifford, D.; Naustvoll, L.; Sullivan, B.; Beaugrand, G.; Stenseth, N. Extension of the Match-Mismatch Hypothesis to Predator-Controlled Systems. Mar. Ecol. Prog. Ser. 2013, 474, 43–52. [Google Scholar] [CrossRef]
- Shama, L.N.S.; Wegner, K.M. Grandparental Effects in Marine Sticklebacks: Transgenerational Plasticity across Multiple Generations. J. Evol. Biol. 2014, 27, 2297–2307. [Google Scholar] [CrossRef] [PubMed]
- Fuxjäger, L.; Wanzenböck, S.; Ringler, E.; Wegner, K.M.; Ahnelt, H.; Shama, L.N.S. Within-Generation and Transgenerational Plasticity of Mate Choice in Oceanic Stickleback under Climate Change. Phil. Trans. R. Soc. B 2019, 374, 20180183. [Google Scholar] [CrossRef]
- Farmer, T.M.; Marschall, E.A.; Dabrowski, K.; Ludsin, S.A. Short Winters Threaten Temperate Fish Populations. Nat. Commun. 2015, 6, 7724. [Google Scholar] [CrossRef]
- Tanaka, H.; Nakagawa, T.; Yokota, T.; Chimura, M.; Yamashita, Y.; Funamoto, T. Effects of Spawning Temperature on the Reproductive Characteristics of Walleye Pollock Gadus chalcogrammus. Fish. Sci. 2019, 85, 901–911. [Google Scholar] [CrossRef]
- Chambers, R.C. Environmental Influences on Egg and Propagule Sizes in Marine Fishes. In Early Life History and Recruitment in Fish Populations; Chambers, R.C., Trippel, E.A., Eds.; Chapman & Hall Fish and Fisheries Series; Springer: Dordrecht, The Netherlands, 1997; pp. 63–102. ISBN 978-94-009-1439-1. [Google Scholar]
- Sganga, D.E.; Dahlke, F.T.; Sørensen, S.R.; Butts, I.A.E.; Tomkiewicz, J.; Mazurais, D.; Servili, A.; Bertolini, F.; Politis, S.N. CO2 Induced Seawater Acidification Impacts Survival and Development of European Eel Embryos. PLoS ONE 2022, 17, e0267228. [Google Scholar] [CrossRef]
- Vézina, D.; Guderley, H. Anatomic and Enzymatic Responses of the Three-Spined Stickleback, Gasterosteus aculeatus to Thermal Acclimation and Acclimatization. J. Exp. Zool. 1991, 258, 277–287. [Google Scholar] [CrossRef]
- Jakobsson, S.; Borg, B.; Haux, C.; Hyllner, S.J. An 11-Ketotestosterone Induced Kidney-Secreted Protein: The Nest Building Glue from Male Three-Spined Stickleback, Gasterosteus aculeatus. Fish. Physiol. Biochem. 1999, 20, 79–85. [Google Scholar] [CrossRef]
- Alavi, S.; Cosson, J. Sperm Motility in Fishes. (II) Effects of Ions and Osmolality: A Review. Cell Biol. Int. 2006, 30, 1–14. [Google Scholar] [CrossRef]
- Magnotti, C.; Figueroa, E.; Farias, J.G.; Merino, O.; Valdebenito, I.; Oliveira, R.P.S.; Cerqueira, V. Sperm Characteristics of Wild and Captive Lebranche Mullet Mugil Liza (Valenciennes, 1836), Subjected to Sperm Activation in Different PH and Salinity Conditions. Anim. Reprod. Sci. 2018, 192, 164–170. [Google Scholar] [CrossRef] [PubMed]
- Roufidou, C.; Schmitz, M.; Mayer, I.; Sebire, M.; Katsiadaki, I.; Shao, Y.T.; Borg, B. Hormonal Changes over the Spawning Cycle in the Female Three-Spined Stickleback, Gasterosteus aculeatus. Gen. Comp. Endocrinol. 2017, 257, 97–105. [Google Scholar] [CrossRef]
- Roufidou, C.; Sebire, M.; Katsiadaki, I.; Mustafa, A.; Schmitz, M.; Mayer, I.; Shao, Y.T.; Borg, B. Overripening of Eggs and Changes in Reproductive Hormones in the Threespine Stickleback. Evol. Ecol. Res. 2016, 17, 317–329. [Google Scholar]
- Shao, Y.T.; Roufidou, C.; Chung, P.C.; Borg, B. Changes in Kisspeptin, GnRH, and Gonadotropin MRNA Levels in Male Threespine Stickleback (Gasterosteus aculeatus) during Photoperiod-Induced Sexual Maturation. Evol. Ecol. Res. 2019, 20, 317–329. [Google Scholar]
- Shao, Y.T.; Tseng, Y.C.; Chang, C.-H.; Yan, H.Y.; Hwang, P.P.; Borg, B. GnRH MRNA Levels in Male Three-Spined Sticklebacks, Gasterosteus aculeatus, under Different Reproductive Conditions. Comp. Biochem. Physiol. Part A Mol. Integr. Physiol. 2015, 180, 6–17. [Google Scholar] [CrossRef]
- Zohar, Y.; Muñoz-Cueto, J.A.; Elizur, A.; Kah, O. Neuroendocrinology of Reproduction in Teleost Fish. Gen. Comp. Endocrinol. 2010, 165, 438–455. [Google Scholar] [CrossRef]
- Bock, S.L.; Chow, M.I.; Forsgren, K.L.; Lema, S.C. Widespread Alterations to Hypothalamic-Pituitary-Gonadal (HPG) Axis Signaling Underlie High Temperature Reproductive Inhibition in the Eurythermal Sheepshead Minnow (Cyprinodon variegatus). Mol. Cell. Endocrinol. 2021, 537, 111447. [Google Scholar] [CrossRef]
- Pigliucci, M. Evolution of Phenotypic Plasticity: Where Are We Going Now? Trends Ecol. Evol. 2005, 20, 481–486. [Google Scholar] [CrossRef] [PubMed]
- Scheiner, S.M. Genetics and Evolution of Phenotypic Plasticity. Annu. Rev. Ecol. Syst. 1993, 24, 35–68. [Google Scholar] [CrossRef]
- Souza, M.L.; Duarte, A.A.; Lovato, M.B.; Fagundes, M.; Valladares, F.; Lemos-Filho, J.P. Climatic Factors Shaping Intraspecific Leaf Trait Variation of a Neotropical Tree along a Rainfall Gradient. PLoS ONE 2018, 13, e0208512. [Google Scholar] [CrossRef]
- Bonamour, S.; Chevin, L.-M.; Charmantier, A.; Teplitsky, C. Phenotypic Plasticity in Response to Climate Change: The Importance of Cue Variation. Phil. Trans. R. Soc. B 2019, 374, 20180178. [Google Scholar] [CrossRef] [PubMed]
- Crozier, L.G.; Hendry, A.P.; Lawson, P.W.; Quinn, T.P.; Mantua, N.J.; Battin, J.; Shaw, R.G.; Huey, R.B. Potential Responses to Climate Change in Organisms with Complex Life Histories: Evolution and Plasticity in Pacific Salmon. Evol. Appl. 2008, 1, 252–270. [Google Scholar] [CrossRef] [PubMed]
- Metcalfe, N.B.; Monaghan, P. Compensation for a Bad Start: Grow Now, Pay Later? Trends Ecol. Evol. 2001, 16, 254–260. [Google Scholar] [CrossRef]
- West-Eberhard, M.J. Developmental Plasticity and Evolution; OUP USA: New York, NY, USA, 2003; ISBN 978-0-19-512235-0. [Google Scholar]
- Fellous, A.; Wegner, K.M.; John, U.; Mark, F.C.; Shama, L.N.S. Windows of Opportunity: Ocean Warming Shapes Temperature-Sensitive Epigenetic Reprogramming and Gene Expression across Gametogenesis and Embryogenesis in Marine Stickleback. Glob. Chang. Biol. 2022, 28, 54–71. [Google Scholar] [CrossRef]
- O’Dea, R.E.; Lagisz, M.; Hendry, A.P.; Nakagawa, S. Developmental Temperature Affects Phenotypic Means and Variability: A Meta-analysis of Fish Data. Fish. Fish. 2019, 20, 1005–1022. [Google Scholar] [CrossRef]
- Rodriguez-Dominguez, A.; Connell, S.D.; Coni, E.O.C.; Sasaki, M.; Booth, D.J.; Nagelkerken, I. Phenotypic Responses in Fish Behaviour Narrow as Climate Ramps Up. Clim. Chang. 2022, 171, 19. [Google Scholar] [CrossRef]
- Gunderson, A.R.; Stillman, J.H. Plasticity in Thermal Tolerance Has Limited Potential to Buffer Ectotherms from Global Warming. Proc. R. Soc. B Biol. Sci. 2015, 282, 20150401. [Google Scholar] [CrossRef]


| Rearing Scenarios | Salinity (‰) | O2 (%) | Temperature (°C) | pH Total | TA (µmol·kgsw−1) | pCO2 (µatm) | |
|---|---|---|---|---|---|---|---|
| Min | Max | ||||||
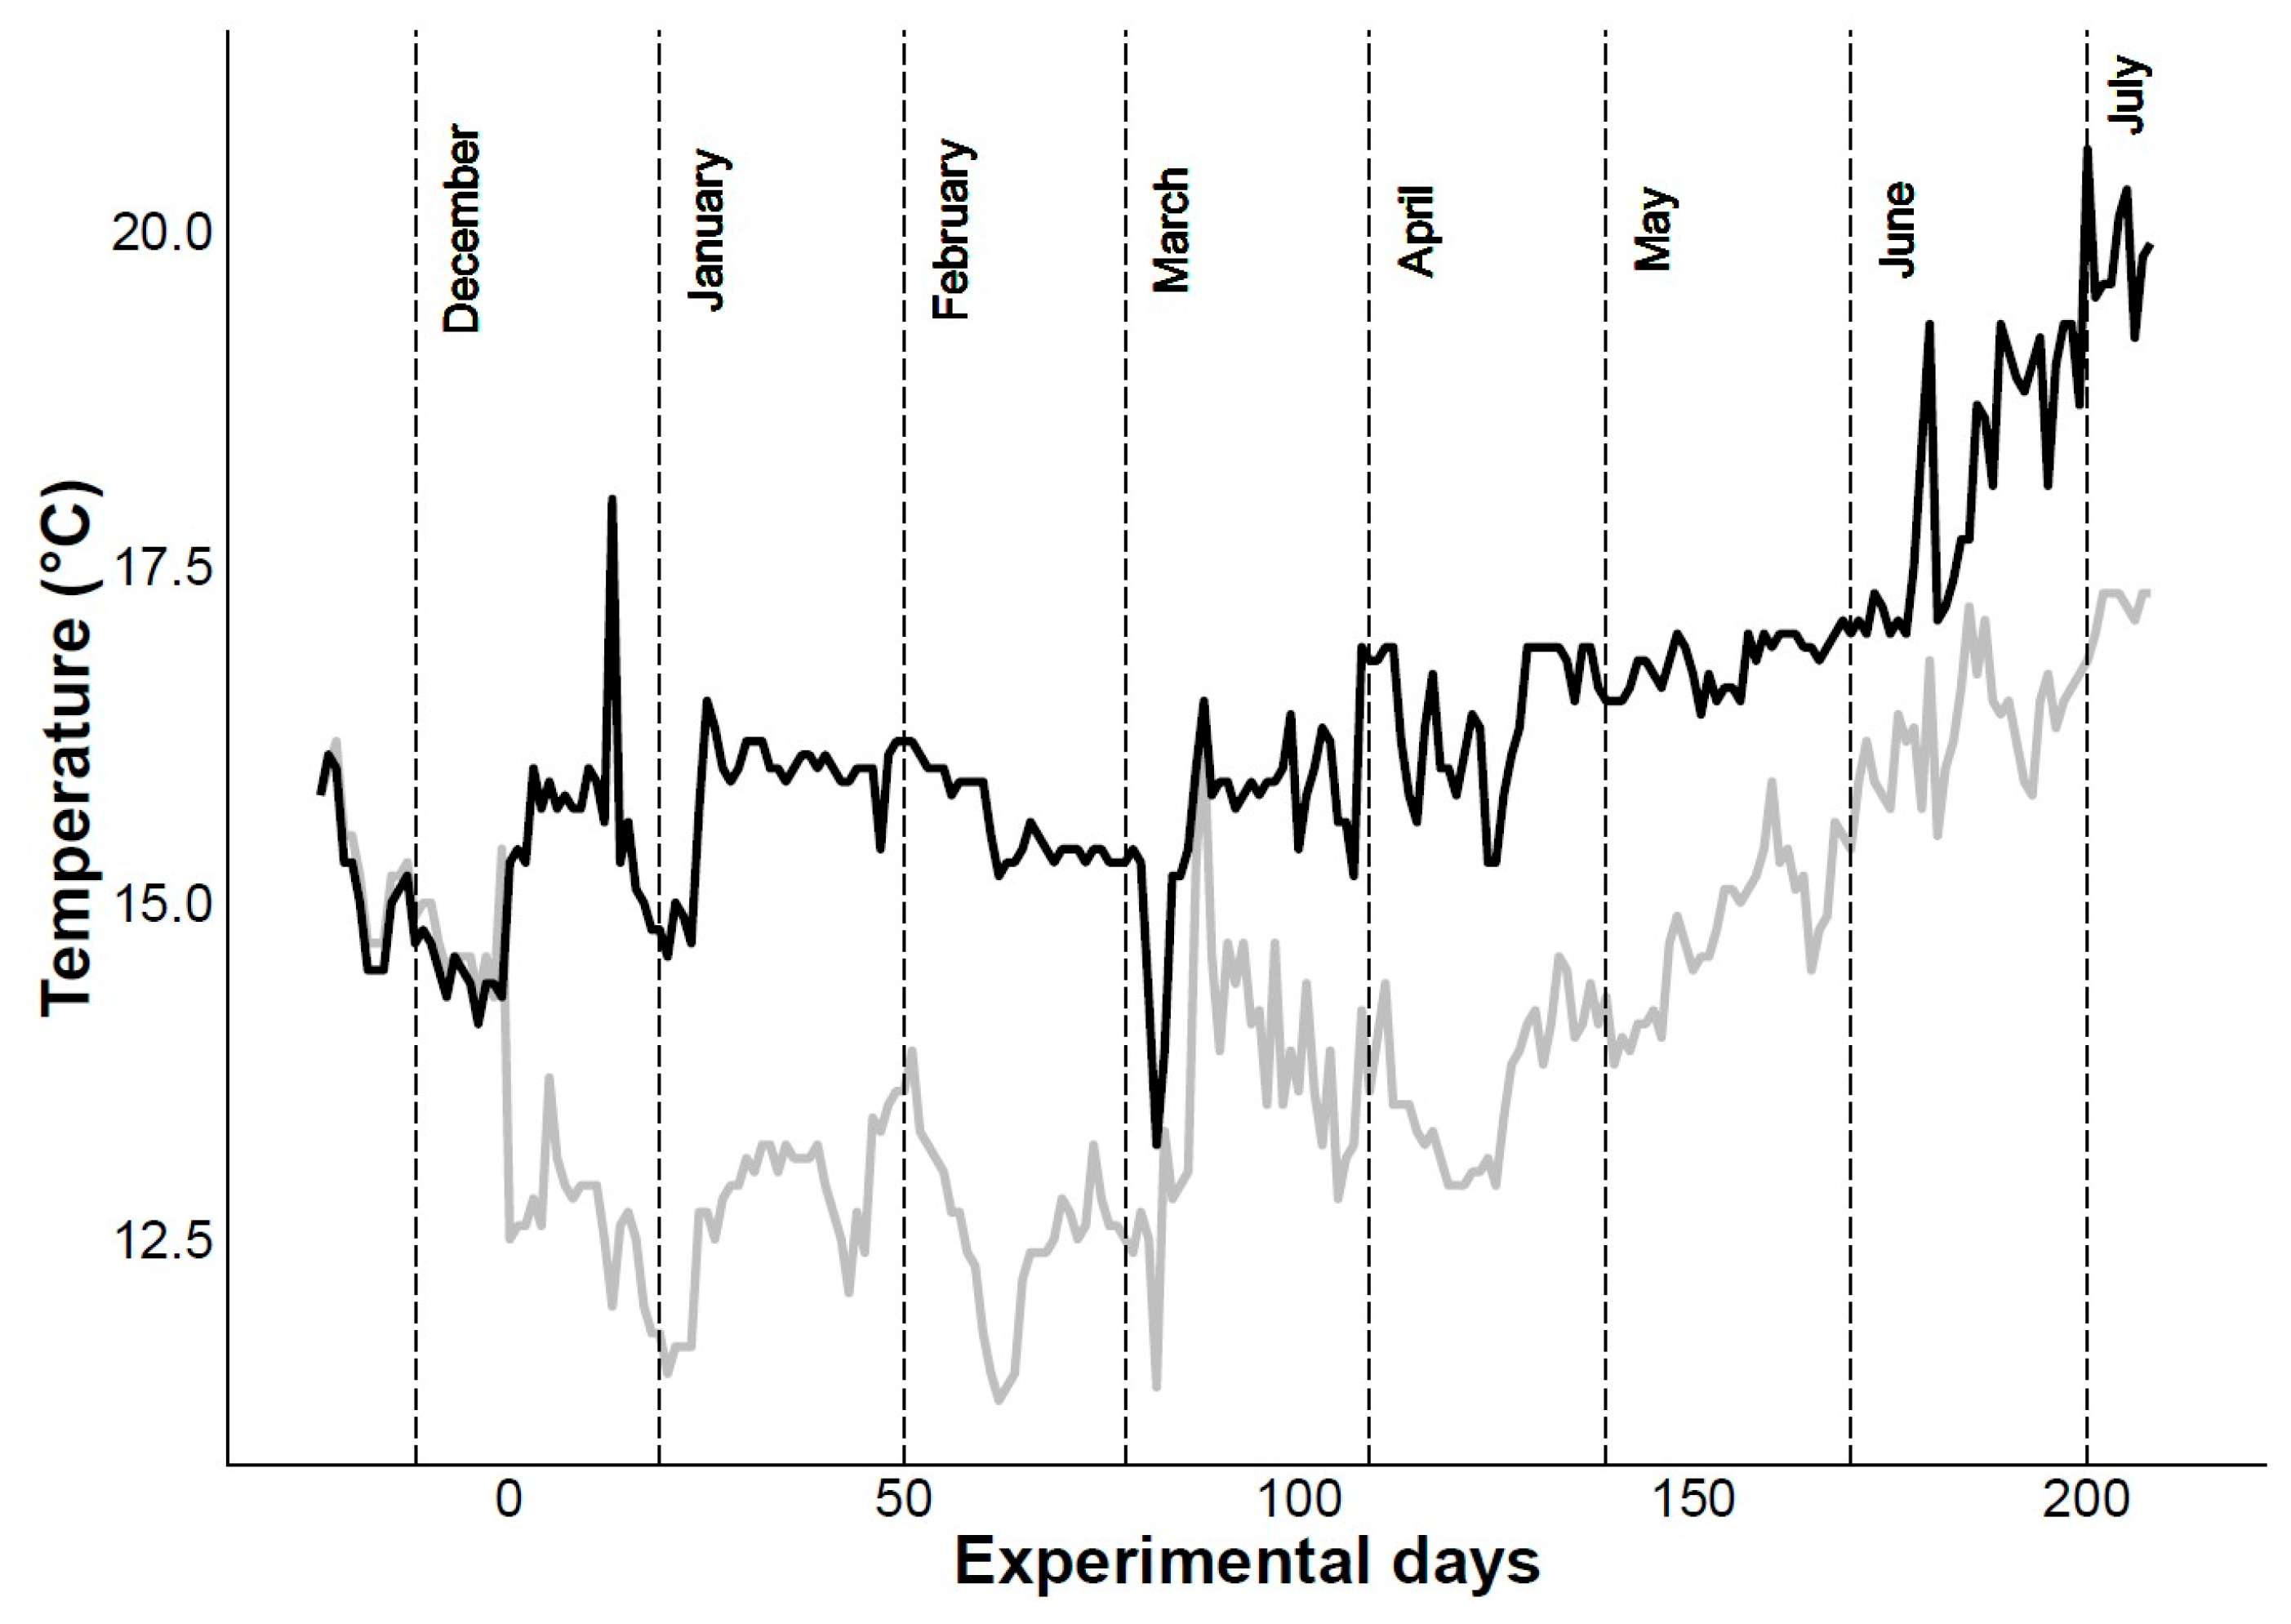
| Current | 32.70 ± 0.98 | 96.54 ± 4.49 | 11.90 | 17.90 | 7.95 ± 0.06 | 2184.07 ± 86.59 | 527.78 ± 135.91 |
| RCP8.5 | 32.79 ± 0.99 | 96.67 ± 3.82 | 15.40 | 20.30 | 7.53 ± 0.05 | 2193.56 ± 138.72 | 1509.03 ± 265.52 |
| Gene Symbol | Forward Primer | Reverse Primer | GenBank Accession Number |
|---|---|---|---|
| RPL8 | 5′GTGAAGGACATCATCCACGA3′ | 5′CTCCTCCACACAGCAGATGA3′ | ENSGACT00000002668.1 |
| RPL13A | 5′CGCCCTACGACAAGAGGAAG3′ | 5′CTCTGCCACCTTGGTCAACT3′ | ENSGACT00000012382.1 |
| GNRH2 | 5′TGTGTTGGAGCTCAGCTGTC3′ | 5′CTCTGGCTAAGGCATCCAAA3′ | ENSGACT00000011943.1 |
| GNRH3 | 5′GTTGGTGGTCCAGGTCACTC3′ | 5′CTCTCTTGGGTCTGGGCACT3′ | ENSGACT00000012668.1 |
| CYP19A1B | 5′ATACCCGGTCCGTGCTTCT3′ | 5′CCCGAATCTGGCTGTGTAGT3′ | ENSGACT00000007929.1 |
| KISS2 | 5′GGGTCAGTTCTTTCTACGCTCA3′ | 5′AATGTAGCGTTTCCCAAAGC3′ | KT202354.1 |
| GNIH | 5′AGAGCTTCCGCATACTCTCG3′ | 5′ATGTTGTGGGTCGAACTGGT3′ | KT202315.1 |
| Mortality (%) | Standard Length (mm) | Mass (g) | |||||
|---|---|---|---|---|---|---|---|
| Mean ± S.D. | Min | Max | Mean ± S.D. | Min | Max | ||
| Current | 24.0 | 40.5 ± 5.8 | 22.1 | 55.0 | 1.4 ± 0.3 | 0.6 | 2.1 |
| RCP8.5 | 31.8 * | 41.3 ± 6.2 | 25.3 | 51.0 | 1.4 ± 0.4 | 0.8 | 2.5 |
| Sex | Standard Length (mm) | Mass (g) | Kcorr | GSI | HSI | KSI | |
|---|---|---|---|---|---|---|---|
| Current | ♀ | 45.0 ± 3.3 | 1.5 ± 0.2 | 1.4 ± 0.2 | 14.6 ± 7.4 | 4.9 ± 0.7 | 0.4 ± 0.3 |
| ♂ | 44.5 ± 2.4 | 1.3 ± 0.2 | 1.4 ± 0.1 | 0.6 ± 0.2 | 3.6 ± 0.7 | 2.8 ± 1.0 | |
| RCP8.5 | ♀ | 47.5 ± 2.1 | 1.6 ± 0.2 | 1.3 ± 0.1 | 11.1 ± 7.6 | 5.1 ± 1.8 | 0.4 ± 0.2 |
| ♂ | 44.9 ± 1.9 | 1.3 ± 0.2 | 1.4 ± 0.2 | 0.8 ± 0.5 | 4.4 ± 1.9 | 1.7 ± 0.7 |
| Current | RCP8.5 | |
|---|---|---|
| Spermatozoa concentration (107 cells/mL) | 1.68 ± 1.25 | 1.62 ± 1.08 |
| Spermatozoa mortality (%) | 7.45 ± 2.70 | 5.81 ± 4.03 |
Disclaimer/Publisher’s Note: The statements, opinions and data contained in all publications are solely those of the individual author(s) and contributor(s) and not of MDPI and/or the editor(s). MDPI and/or the editor(s) disclaim responsibility for any injury to people or property resulting from any ideas, methods, instructions or products referred to in the content. |
© 2023 by the authors. Licensee MDPI, Basel, Switzerland. This article is an open access article distributed under the terms and conditions of the Creative Commons Attribution (CC BY) license (https://creativecommons.org/licenses/by/4.0/).
Share and Cite
Devergne, J.; Loizeau, V.; Lebigre, C.; Bado-Nilles, A.; Collet, S.; Mouchel, O.; Iaria, U.; Le Gall, M.-M.; Madec, L.; Turiès, C.; et al. Impacts of Long-Term Exposure to Ocean Acidification and Warming on Three-Spined Stickleback (Gasterosteus aculeatus) Growth and Reproduction. Fishes 2023, 8, 523. https://doi.org/10.3390/fishes8100523
Devergne J, Loizeau V, Lebigre C, Bado-Nilles A, Collet S, Mouchel O, Iaria U, Le Gall M-M, Madec L, Turiès C, et al. Impacts of Long-Term Exposure to Ocean Acidification and Warming on Three-Spined Stickleback (Gasterosteus aculeatus) Growth and Reproduction. Fishes. 2023; 8(10):523. https://doi.org/10.3390/fishes8100523
Chicago/Turabian StyleDevergne, Jimmy, Véronique Loizeau, Christophe Lebigre, Anne Bado-Nilles, Sophie Collet, Olivier Mouchel, Ugo Iaria, Marie-Madeleine Le Gall, Lauriane Madec, Cyril Turiès, and et al. 2023. "Impacts of Long-Term Exposure to Ocean Acidification and Warming on Three-Spined Stickleback (Gasterosteus aculeatus) Growth and Reproduction" Fishes 8, no. 10: 523. https://doi.org/10.3390/fishes8100523
APA StyleDevergne, J., Loizeau, V., Lebigre, C., Bado-Nilles, A., Collet, S., Mouchel, O., Iaria, U., Le Gall, M.-M., Madec, L., Turiès, C., & Servili, A. (2023). Impacts of Long-Term Exposure to Ocean Acidification and Warming on Three-Spined Stickleback (Gasterosteus aculeatus) Growth and Reproduction. Fishes, 8(10), 523. https://doi.org/10.3390/fishes8100523