Article

Effects of Seasonal Photoperiod on Growth, Lipid Metabolism, and Antioxidant Response in the Huanghe Carp (Cyprinus carpio haematopterus)

1
Wuxi Fisheries College, Nanjing Agricultural University, Wuxi 214081, China
2
Key Laboratory of Freshwater Fisheries and Germplasm Resources Utilization, Ministry of Agriculture and Rural Affairs, Freshwater Fisheries Research Center, Chinese Academy of Fishery Sciences, Wuxi 214081, China
*
Author to whom correspondence should be addressed.
Fishes 2023, 8(12), 595; https://doi.org/10.3390/fishes8120595
Submission received: 16 October 2023 / Revised: 28 November 2023 / Accepted: 29 November 2023 / Published: 1 December 2023

Abstract

:
Photoperiod is one of the most important environmental cues for organisms, and it plays a crucial role in regulating feeding, behavior, growth, and metabolism. However, seasonal photoperiods are often overlooked in carp culture or experiments, with a poorly understood effect on lipid metabolism and oxidative stress in fish. To explore the effects of seasonal photoperiods, we exposed Huanghe carp (Cyprinus carpio haematopterus) to summer photoperiod (14 h light:10 h dark) and winter photoperiod (10 h light:14 h dark) daylight conditions in an eight-week experiment. Our results suggested that the winter photoperiod significantly increased the liver TG level as well as the transcript levels of genes related to lipid synthesis, indicating that the lipid metabolism in Huanghe carp liver was enhanced compared to summer photoperiod conditions, and that lipid deposition may be responsible for the increase in body weight level and hepatosomatic index. Additionally, MDA, GSH, GSH-PX, and T-AOC levels were significantly elevated in the liver of fish under the winter photoperiod, suggesting that Huanghe carp responded to winter photoperiod exposure-induced oxidative stress in the liver by enhancing the antioxidant response. Based on transcriptome analysis, the winter photoperiod activated hepatic autophagy response and the FOXO signaling pathway in Huanghe carp. Combined with the correlation analysis, the Huanghe carp maintains the physiological health of the liver by activating the FOXO signaling pathway-mediated cell cycle regulation and autophagy response in response to oxidative stress during winter photoperiod exposure. Our study provides the first evidence for the physiological regulation of the liver in Huanghe carp under seasonal photoperiod stimulation.
Key Contribution: Winter photoperiod affected lipid metabolism in the liver of the Huanghe carp (Cyprinus carpio haematopterus) and caused oxidative stress, inducing autophagy and cell cycle alterations via the FOXO signaling pathway.

1. Introduction

Light is one of the most important external and ecological factors in ecosystems. Most animals inhabit highly rhythmic environments characterized by daily or annual light cycles [1], and they have evolved a circadian clock to adapt to a periodically changing environment [2]. Photoperiod is considered to be an important cue for circadian rhythms [3]. As an abiotic factor, light affects the growth performance and survival of aquatic organisms through feeding, behavior, and energy metabolism [4,5]. It has been suggested that long-day photoperiod stimulates feeding to enhance hepatic lipid metabolism and promote growth in the juvenile gibel carp (Carassius auratus) [6]. Under the influence of photoperiod, there are seasonal changes in the activities of enzymes related to lipid metabolism in yellowtail Seriola quinqueradiata [7]. The above results suggested that photoperiod as a zeitgeber directly or indirectly mediates lipid metabolism in fish. Alterations in lipid metabolism may cause oxidative stress. Excessive oxidative stress impairs the aquatic antioxidant system and affects fish health. There is evidence that photoperiod induces liver oxidative stress in aquatic animals [6,8]. Therefore, it is important to emphasize the effects of photoperiod on aquatic species in artificial aquaculture systems.
Forkhead box O (FOXO) transcription factors mediate insulin and growth factors affecting a variety of physiological functions including cell proliferation, apoptosis, metabolism, and stress responses [9]. Studies in mammals have shown that FOXO proteins regulate the cell cycle and enhance resistance to oxidative stress [10]. In aquaculture, there is a growing body of research on the response of FOXO to environmental factor stresses. For example, it has been shown that FOXO is altered in response to acute hypoxic stress [11,12]. A study of heat tolerance in aquaculture fish suggested that FOXO signaling and circadian cycle may be involved in heat tolerance mechanisms [13]. High salinity enriched the FOXO signaling pathway in the spleen of Luciobarbus capito (L. capito) to enhance antioxidant capacity and immunity [14]. High temperature stress inhibits apoptosis by regulating the expression of FOXO target genes associated with apoptosis, which mediates liver injury in tsinling lenok trout (Brachymystax lenok tsinlingensis) [15]. Some studies have also demonstrated that FOXO1 plays a key role in autophagy regulation and can upregulate the expression of autophagy-related genes [16]. FOXO signaling plays an important role in a study of photoperiodic effects on uterine metabolism in the golden hamster (Mesocricetus auratus), where photoperiod regulates uterine function-related seasonality through redox/metabolic homeostasis [17]. However, whether FOXO is involved and the role played under photoperiod-induced physiological changes in carp has not been studied.
Common carp (Cyprinus carpio) is one of the most widely distributed and popular freshwater fish in the world [18]. A carp species called Huanghe carp (Cyprinus carpio haematopterus) is popular among consumers because of its historical and cultural nature. We have utilized selective breeding to develop a new fast-growing Huanghe r carp line based on the traditional Huanghe carp line [19,20]. As temperature, physical activity, and diet may be variable between seasons, the contribution of photoperiod is difficult to isolate. Therefore, the effects of photoperiod are often overlooked in carp culture or experiments. Electric lighting fundamentally altered the relationship between the endogenous circadian rhythm of the animal and the external environment, similar to the seasonal photoperiods [21,22]. How constant seasonal photoperiods influence physiological homeostasis has not been examined. Because the difference in photoperiod between summer and winter is the largest under natural conditions, we set up summer and winter photoperiod duration conditions to explore the effects of seasonal light on the new strain of Huanghe carp. On this basis, enzyme and mRNA levels of indicators related to lipid metabolism, oxidative stress, and autophagy were quantified. The aim was to investigate the effects of seasonal photoperiod on lipid metabolism and oxidative stress and to explore the potential association with the growth of Huanghe carp.

2. Materials and Methods

2.1. Animals and Experimental Design

A total of 120 juvenile Huanghe carp of similar proportions (6.5 ± 1.5 g), were provided by Freshwater Fisheries Research Center, Chinese Academy of Fishery Sciences, Wuxi, China. Prior to the experiment, the fish were maintained in a recirculating water system for 4 weeks to 14.5 ± 3 g to acclimatize to the experimental conditions. The juveniles were fed twice a day (8:00, 17:00) with the compound feed (crude protein level 35 percent, crude fat level 3 percent, Ningbo Tech-Bank Co., Ltd, Ningbo, China), and food debris was cleaned daily. Throughout the experiment, the temperature was maintained at 24–28 °C, dissolved oxygen > 6 mg L−1, and pH 7.2–7.8. Feeding was discontinued for 24 h before being used for dissecting. The use of animals in this study was approved by the Animal Care and Use Committee of Nanjing Agricultural University (Nanjing, China) [Permit Number: SYXK (Su) 2017-0007].
The fish were randomly divided into two groups. The control group was kept under a summer light cycle (Con) (14 h light:10 h dark) and the short photoperiod group (SP) was kept under a winter pattern photoperiod (10 h light:14 h dark). There were three replicates per group. Each tank was equipped with a white light–emitting diode (LED) suspended above the bucket. To avoid interference, each tank was covered with a black opaque barrier. Throughout the experiment, we measured light intensity at 800 ± 20 luxes using a digital lux meter made by Aladdin Biochemical Technology Co., Ltd. (Shanghai, China). After 8 weeks of feeding, both groups of fish were sampled at the same time point during the daytime activity time of the carp. The fish were euthanized and anesthetized with MS-222 (100 mg L−1) and weighed and measured for body length, body width, and body thickness. The fish were dissected and the livers were weighed. For performing RNA-seq, liver samples were collected immediately, frozen in liquid nitrogen, and stored in an −80 °C refrigerator. Another portion of the liver sample was collected, homogenized (1 g of tissue in 9 mL of 0.9% saline), and centrifuged at 2500 rpm for 10 min at 4 °C. The supernatant was taken, which was used for the determination of biochemical parameters.

2.2. Liver Tissue Biochemical Parameters

Commercial enzyme-linked immunosorbent assay kits (Nanjing Jiancheng Bioengineering Institute, Nanjing, China) were used to detect a variety of biochemical parameters in the liver tissue samples, including total protein (TP), triglycerides (TG), total cholesterol (T-CHO), low-density lipoprotein cholesterol (LDL-C), high-density lipoprotein cholesterol (HDL-C), malondialdehyde (MDA), catalase (CAT), total superoxide dismutase (T-SOD), glutathione (GSH), glutathione peroxidase (GSH-PX), and total antioxidant capacity (T-AOC). In detail, the TP was determined by the kosmochromate blue method (Category No: A045-2). The TG and T-CHO were determined by the GPO-PAP enzyme method (Category No: A110-1-1 and A111-1-1), respectively. The LDL-C and HDL-C were determined by the microplate method (Category No: A113-1-1 and A112-1-1), respectively. The MDA content was determined by the thibabituric acid (TBA) method (Category No: A003-1-1). The MDA in the degradation products of the peroxidized lipids can be condensed with thiobarbituric acid (TBA) to form a red product, with a maximum absorption peak at 532 nm. The CAT content was determined by the ammonium molybdate method (Category No: A007-1-1). The reaction of the catalase decomposition of H2O2 can be rapidly terminated by adding ammonium molybdate, and the remaining H2O2 interacts with the ammonium molybdate to produce a yellow complex, the change of which was measured at 405 nm. The T-SOD content was determined by the xanthine oxidase method (Category No: A001-1-1), which generates superoxide anion radicals (O2) through the reaction system of xanthine and xanthine oxidase, the latter oxidizing hydroxylamine to form nitrite, which takes on a purplish-red color in the presence of a color developer, and its absorbance is measured. When the measured sample contains SOD, then the superoxide anion radical has a specific inhibitory effect, so that the formation of nitrite is reduced, and the absorbance value of the colorimetric tube is lower than the absorbance value of the control tube. GSH-PX promotes the reaction of H2O2 with GSH to form H2O and oxidized glutathione (GSSG), and the activity of GSH-PX can be expressed by the rate of its enzymatic reaction (Category No: A005-1-1). GSH reacts with dithiobinitrobenzoic acid (DTNB) to produce a yellow compound, and the GSH content is determined quantitatively by colorimetry at 405 nm (Category No: A006-2-1). The T-AOC content was determined by the ABTS method (Category No: A015-2-1). ABTS is oxidized to green ABTS+ under the action of appropriate antioxidants; the production of ABTS+ will be inhibited in the presence of antioxidants; and the T-AOC of the samples can be determined and calculated by measuring the absorbance of ABTS+ at 405 nm.

2.3. Transcriptome Assembly and Differential Expression Gene (DEGs) Analysis

RNA was extracted from the liver tissue of six Huanghe carp using standard extraction methods. The high-quality RNA samples were used to construct sequencing libraries. Differentially expressed genes (DEGs) were identified, and the expression level of each RNA transcript was calculated according to the Reads Per Kilobase Million (RPKM) method. Differential expression analysis was performed using DESeq2 software (v1.20.0). Gene Ontology (GO) and Kyoto Encyclopedia of Genes and Genomes (KEGG) databases were performed on the DEGs for enrichment analysis using clusterProfiler software (v3.8.1). p < 0.05 was considered statistically significant.

2.4. RNA Extraction and Quantitative Real-Time PCR

After sampling, the liver samples were quick-frozen in liquid nitrogen and then transferred to a −80 °C refrigerator for storage. The liver total RNA of the Huanghe carp was extracted with the TRIzol reagent (Vazyme Biotechnology Co., LTD., Nanjing, China), and the OD260/OD280 ratio was measured by a NanoPhotometer® N50 (Implen, München, Germany) at 1.8–2.0. A little amount of RNA was taken and run on 1% agarose gel electrophoresis to check its integrity. The cDNA was synthesized using 1 μg of the extracted RNA by HiScript Ⅲ RT SuperMix for qPCR (+gDNA wiper) kit (Vazyme). Quantitative real-time PCR (qPCR) was carried out by the ChamQ Universal SYBR qPCR Master Mix (Vazyme) in a Thermal Cycler Dice Real Time System TP800 system. qPCR was performed in a 20 μL reaction system. The reaction mixture was incubated for 40 cycles at 95 °C for 5 s and 59–62 °C for 1 min. In the experiment, GAPDH was selected as a reference gene [20]. The relative expression of the target gene was calculated using the 2−ΔΔCT method [23]. The primers (Table 1) for RT-qPCR were designed based on the sequences obtained in the RNA-seq and were synthesized by Shanghai exsyn-bio Technology Co., Ltd. (Shanghai, China).

2.5. Correlation Analysis

Pairwise comparisons of FOXO, autophagy, and cell cycle–related genes are shown, with a color gradient denoting the Spearman’s correlation coefficients. Mantel test was performed to analyze the correlation between antioxidant parameters and FOXO and autophagy-related genes. Edge width corresponds to Mantel’s r statistic for the corresponding distance correlations, and edge color denotes the statistical significance. The above programs were performed using R v4.1.1 (https://www.r-project.org (accessed on 10 September 2023)). p < 0.05 was the threshold of significance.

2.6. Statistical Analysis

Statistical analysis was performed using IBM SPSS Statistics for Windows, version 27.0. The Student’s t-test was used to test the significance between the Con and SP groups. The data are expressed as mean ± standard error (SEM) unless otherwise stated. For all the analyses, p < 0.05 was considered statistically significant.

3. Results

3.1. Effects of Seasonal Photoperiod on the Growth Performance of Huanghe Carp

In this paper, we evaluated whether a seasonal photoperiod affected the growth performance of Huanghe carp, and the results are shown in Table 2. The winter photoperiod (SP) significantly increased final body weight (p = 0.048), but other growth indicators including body length, body width, body thickness, and condition factor did not differ considerably. In addition, the hepatosomatic index (HSI) was significantly elevated under the winter photoperiod (p = 0.021). Therefore, we hypothesized that winter photoperiod–induced weight gain in Haunghe carp was related to liver alteration.

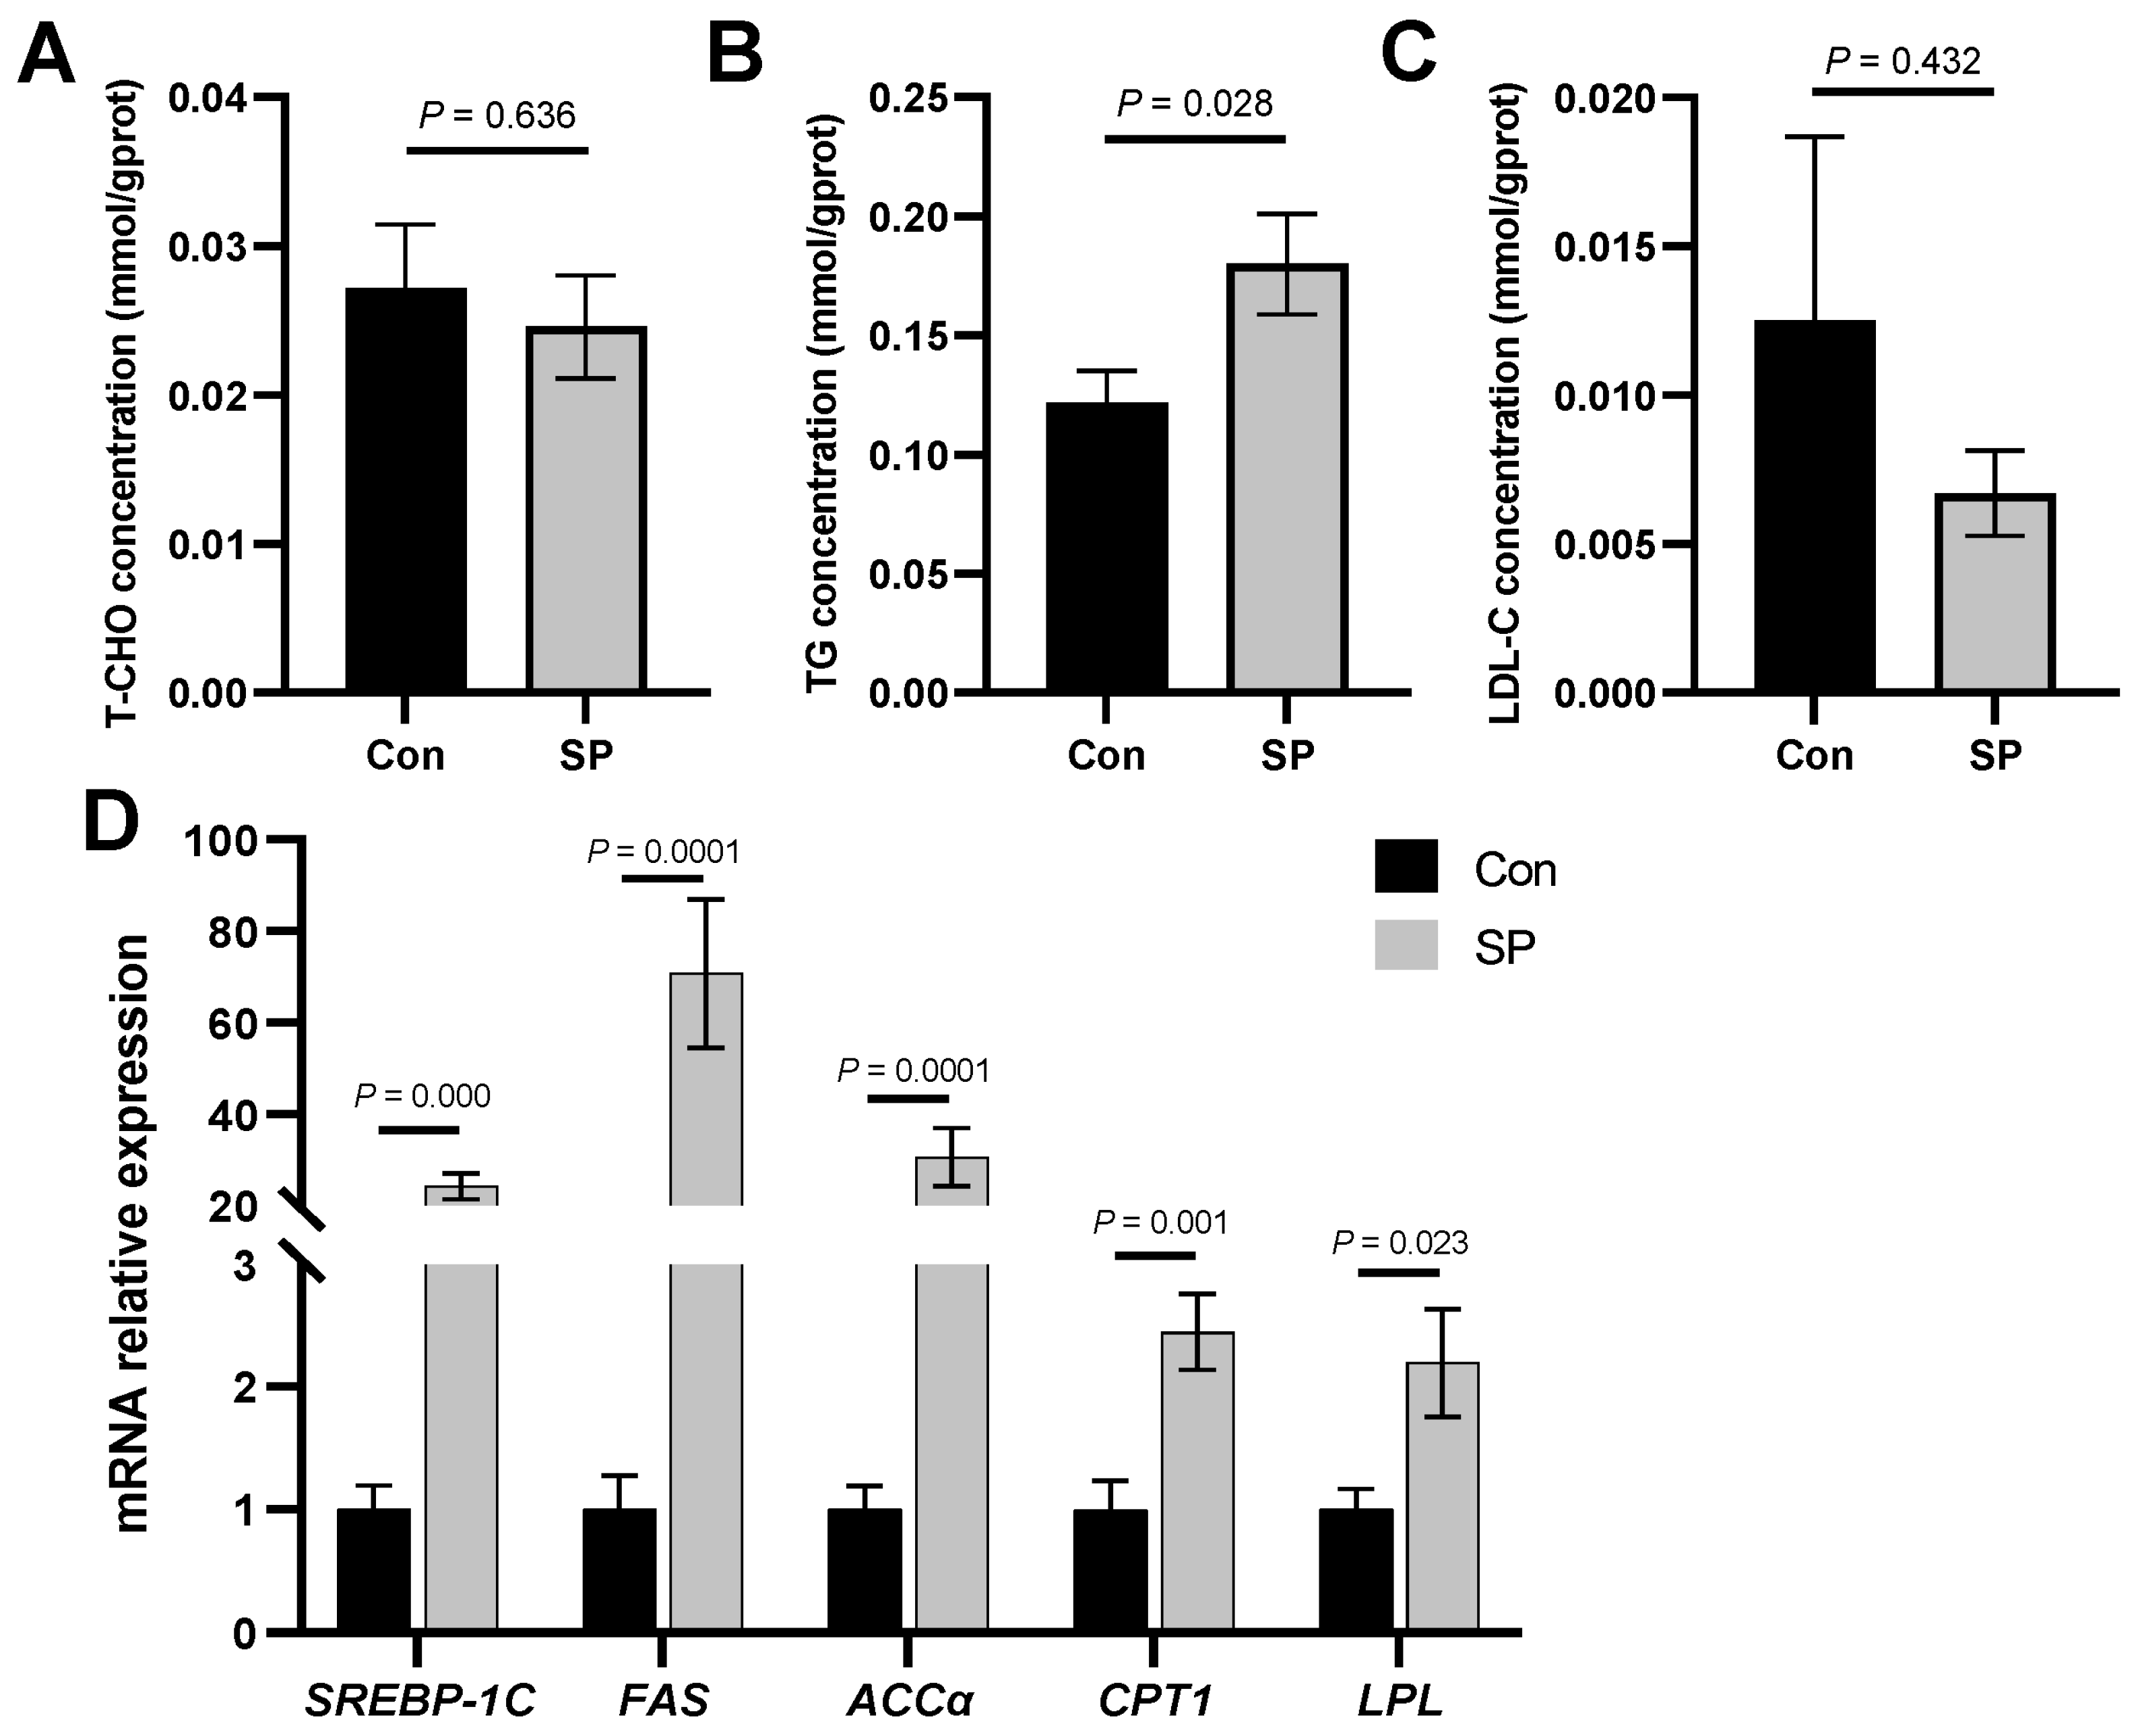
3.2. Alterations in Lipid Metabolism during Seasonal Photoperiods

The liver is the hub of the lipid metabolism. We sought to explore changes in lipid metabolism in the liver to explain weight gain. The winter photoperiod significantly enhanced TG levels compared to the summer photoperiod (Con) (Figure 1B; p = 0.028). T-CHO and LDL-C levels did not change dramatically (Figure 1A,C). In addition, we measured gene expression to assess the effects of seasonal photoperiods on lipid metabolism. The winter photoperiod enhanced the transcript levels of the lipid synthesis-related genes sterol regulatory element binding protein-1C (SREBP-1C), fatty acid synthase (FAS), and acetyl CoA carboxylase alpha (ACCα), while the mRNA levels of fatty acid oxidation carnitine O-palmitoyltransferase 1 (CPT1) and the lipid hydrolysis-related gene lipoprotein lipase (LPL) were also significantly increased (Figure 1D; p < 0.05). The above results suggest that the winter photoperiod enhanced lipid metabolism to induce lipid accumulation, which may explain the increase in body weight.

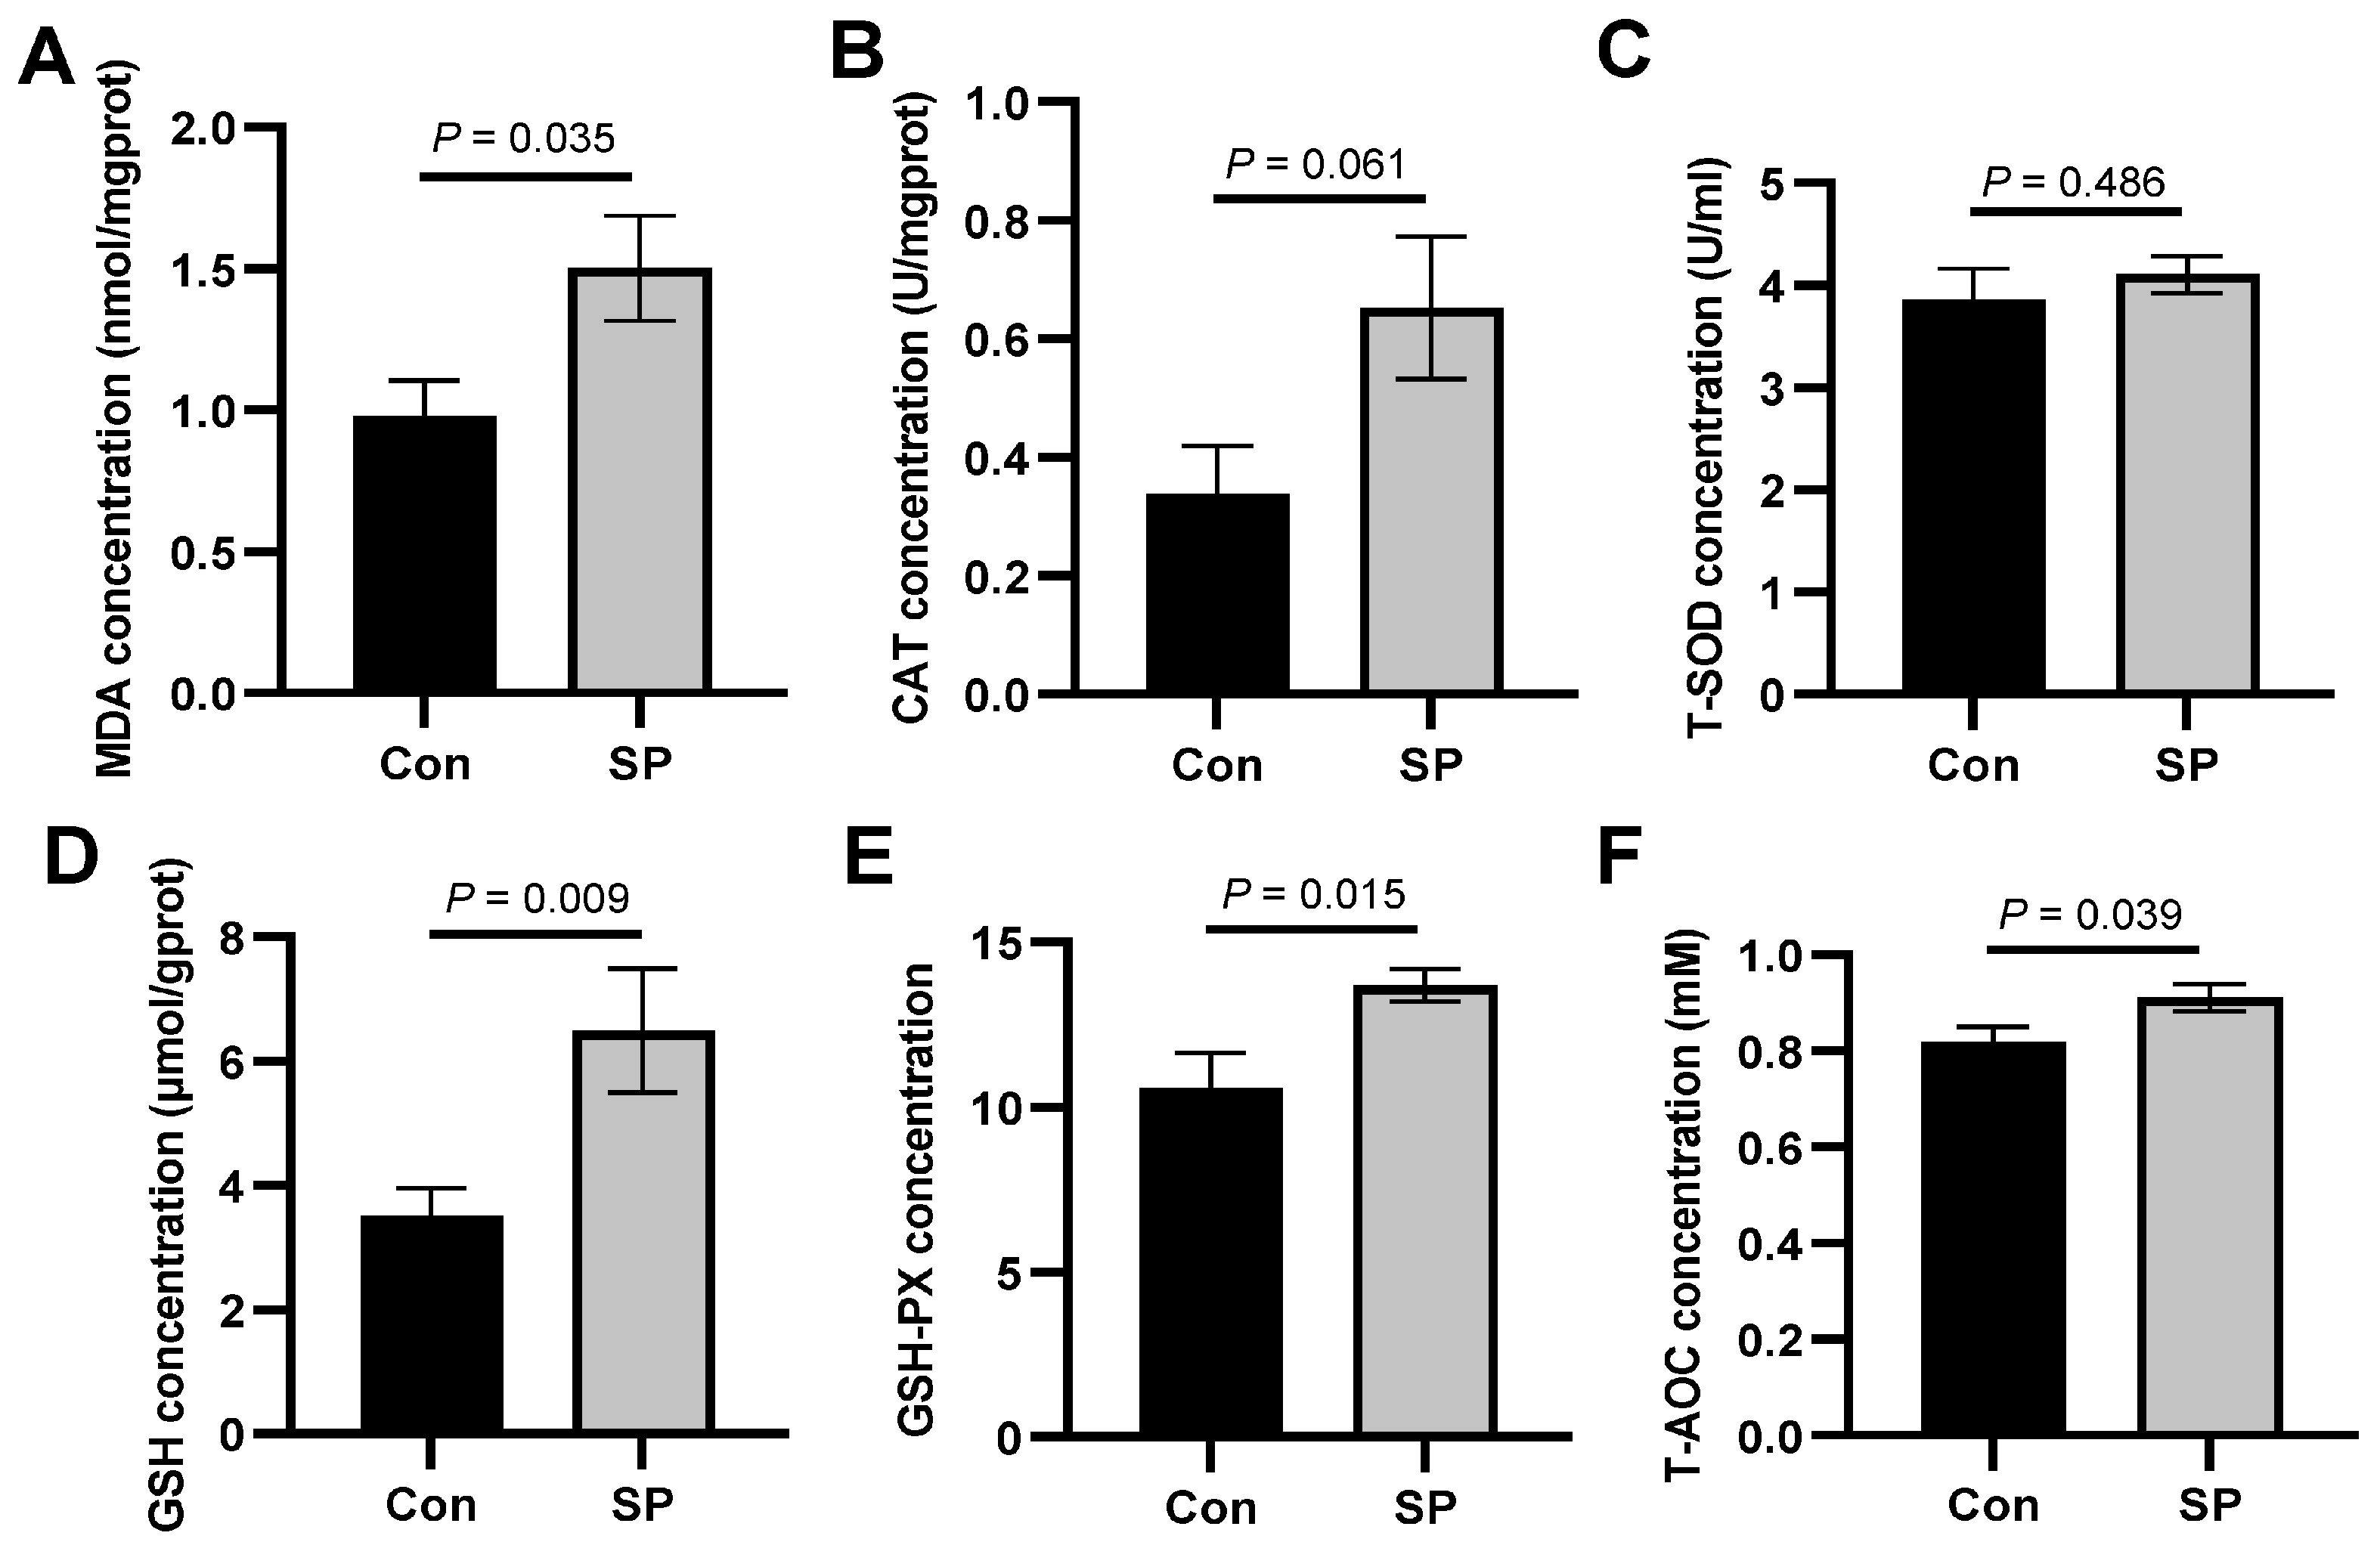
3.3. Influence of Photoperiod on Oxidative Stress in the Liver of the Huanghe Carp

The deposition of lipids in the liver is one of the physiological contributors to oxidative stress. The winter photoperiod activated the intestinal antioxidant system of the Huanghe carp. Relative to the control group, the levels of MDA increased under winter photoperiod exposure (Figure 2A; p = 0.035). The activities of GSH, GSH-PX, and T-AOC were also markedly elevated in the liver (Figure 2D–F; p < 0.05). Moreover, no significant alterations were found in the activities of CAT and T-SOD after the photoperiodic changes (Figure 2B,C).

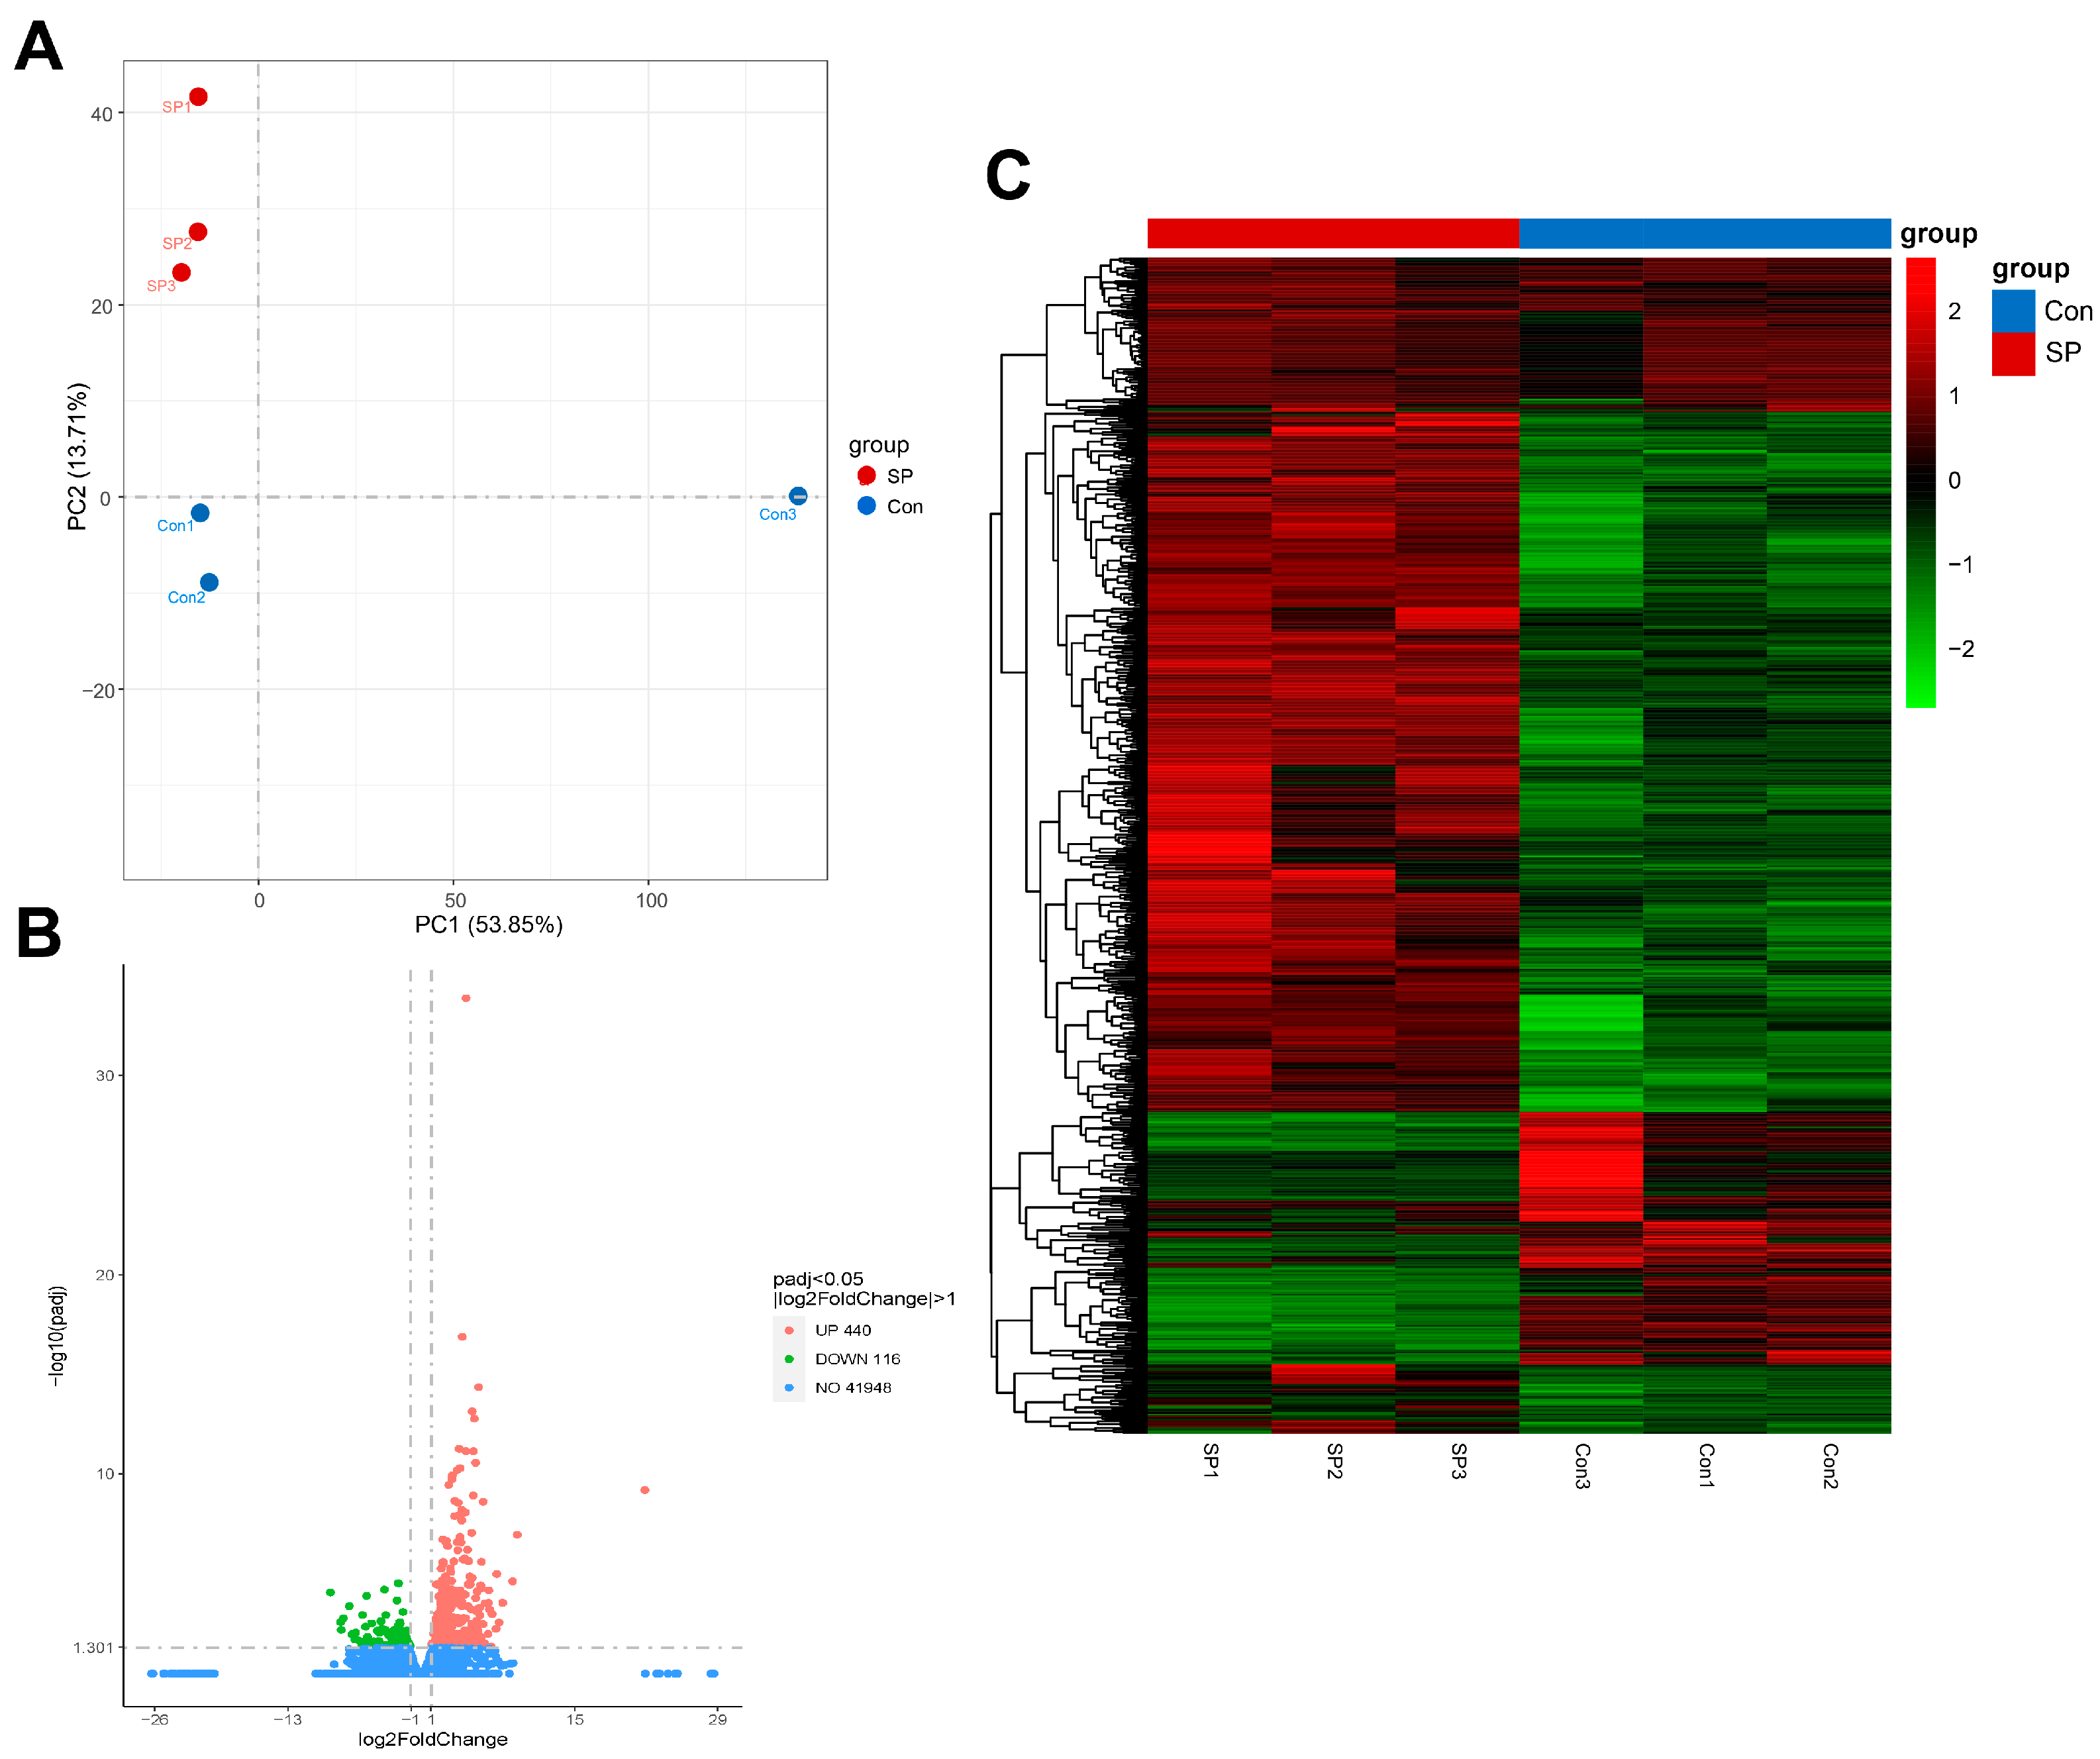
3.4. Quality of Library Sequencing and Differential Gene Expression in Liver

To further investigate the effects of seasonal photoperiodic changes on the liver, transcriptomes were utilized to evaluate differences in gene expression. A total of 265,802,786 raw reads were retained, including 133,156,312 in the control group and 132,646,474 reads in the SP group, respectively, which were deposited to the National Center for Biotechnology Information (NCBI) with the accession number of PRJNA889451. The Q20 and Q30 were ensured to be >97.07% and 92.14%, respectively. The GC content occupied 47.33–48.19% of the libraries. After quality control of the sequences for each sample, the comparison yielded a total of 219,353,838 (105,782,275 in the Con and 113,571,563 in the SP group, respectively) reads, of which 81.66–87.76% aligned with the reference transcriptome. The uniquely mapped reads were 29,918,503–34,530,992, above 76.16% to 80.2% of the uniquely mapped rate (Table 3). The above results verified that the library sequencing quality met the requirements of differentially expressed gene (DEG) analysis.
Repeatability between samples was assessed by principal component analysis (PCA). The PCA diagram showed that the scatter points corresponding to the three samples in the SP group clustered together within the group, indicating that the sample data were similar, and there was good discrimination between the groups (Figure 3A). The number of DEGs is shown in Figure 3B. Compared with the control group, the liver of fish under the winter photoperiod exhibited 556 DEGs, of which 440 DEGs were upregulated and 116 DEGs were downregulated. To demonstrate more clearly the variations in DEGs, these DEGs were clustered into different subgroups according to their expression levels in the heatmap (Figure 3C).

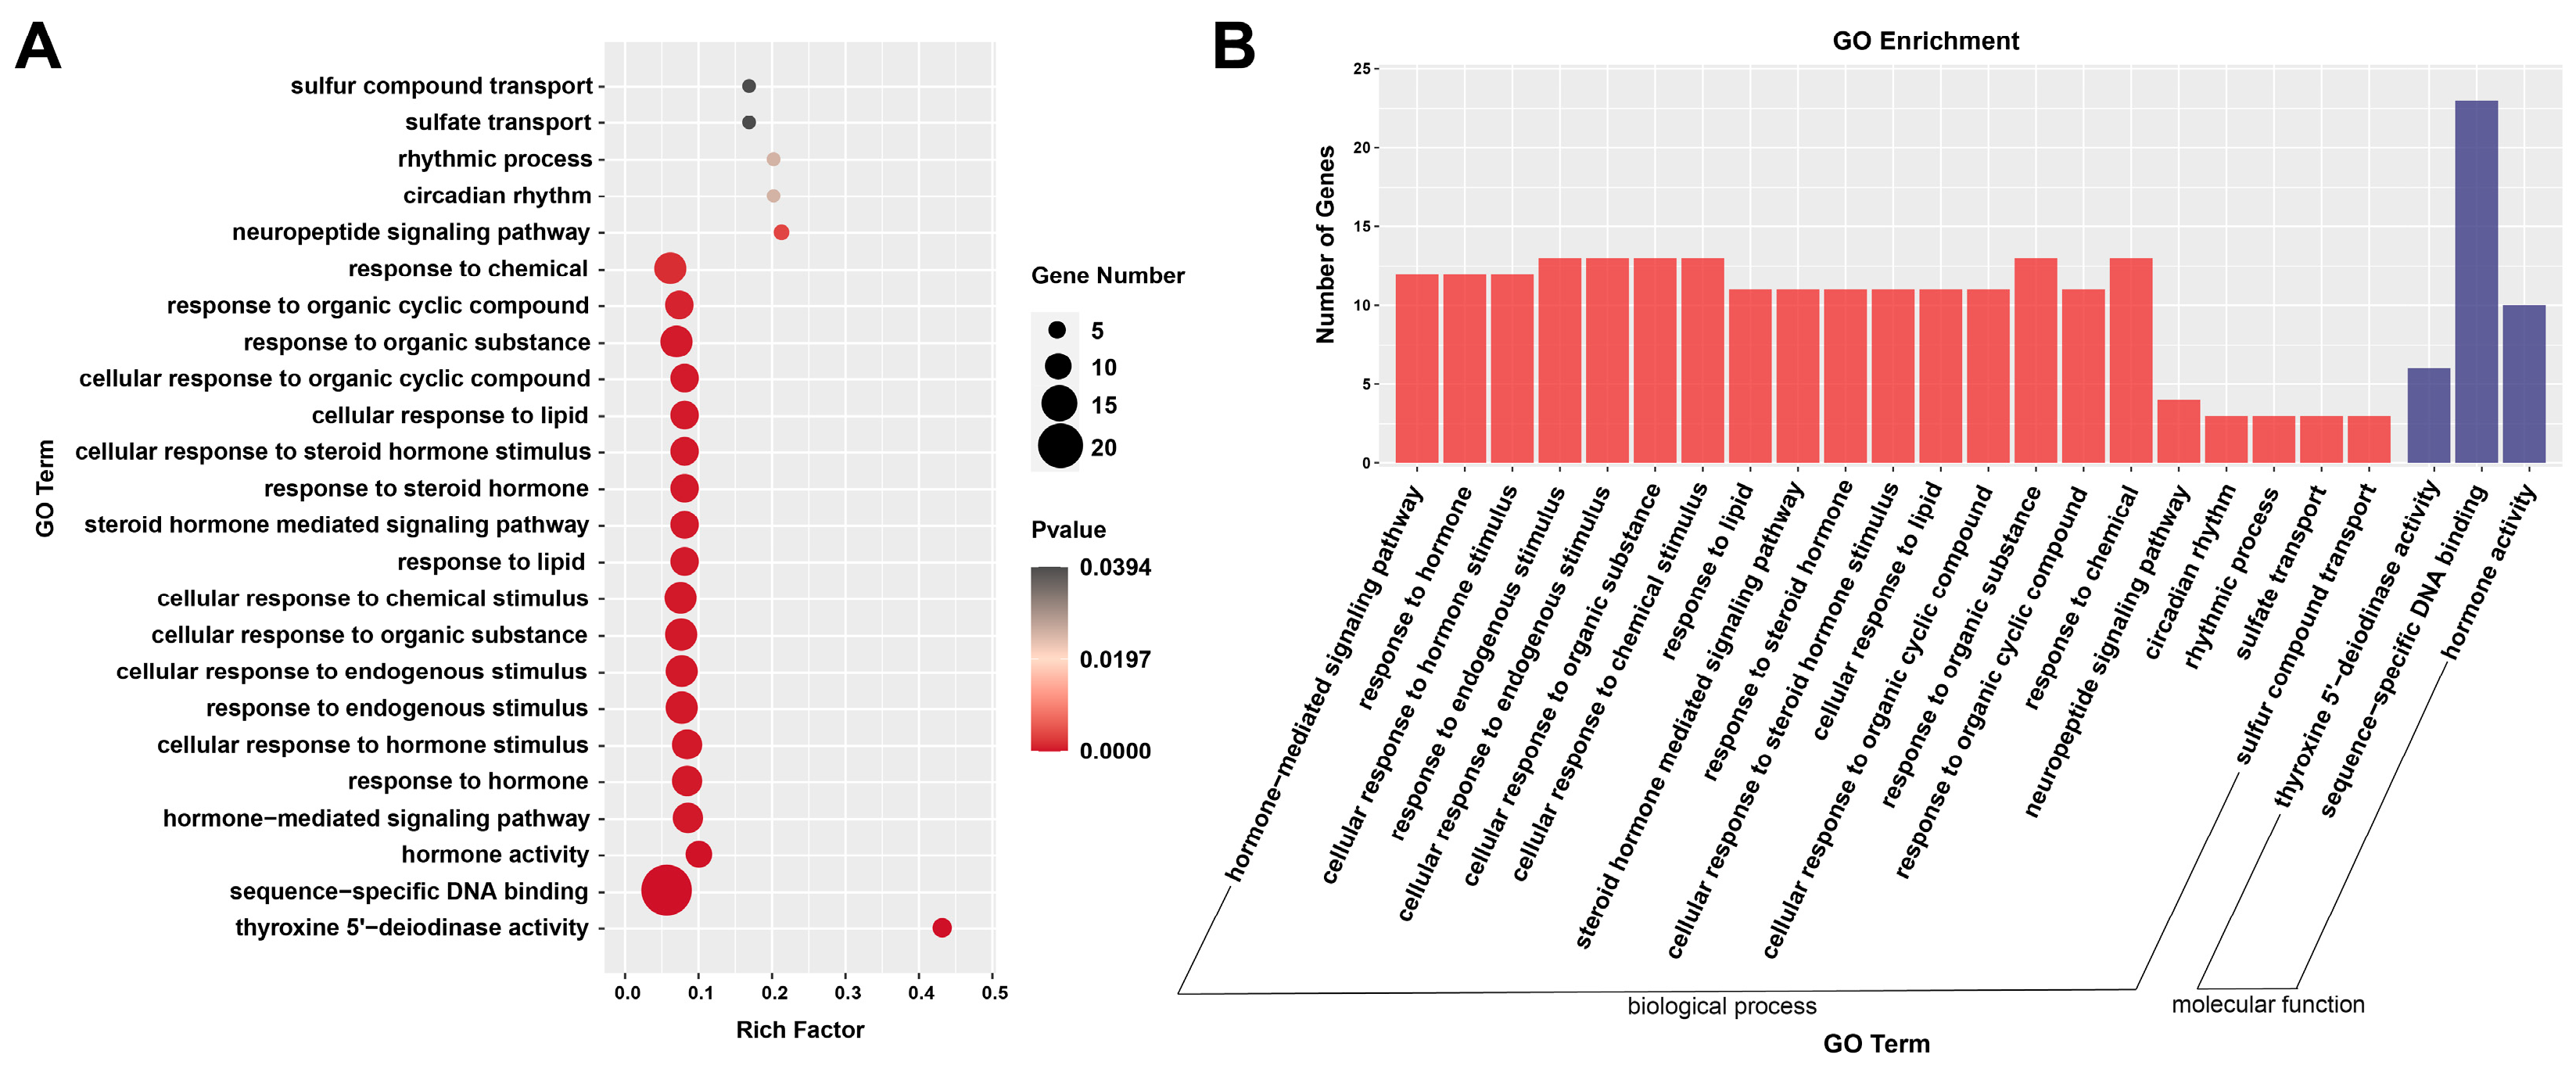
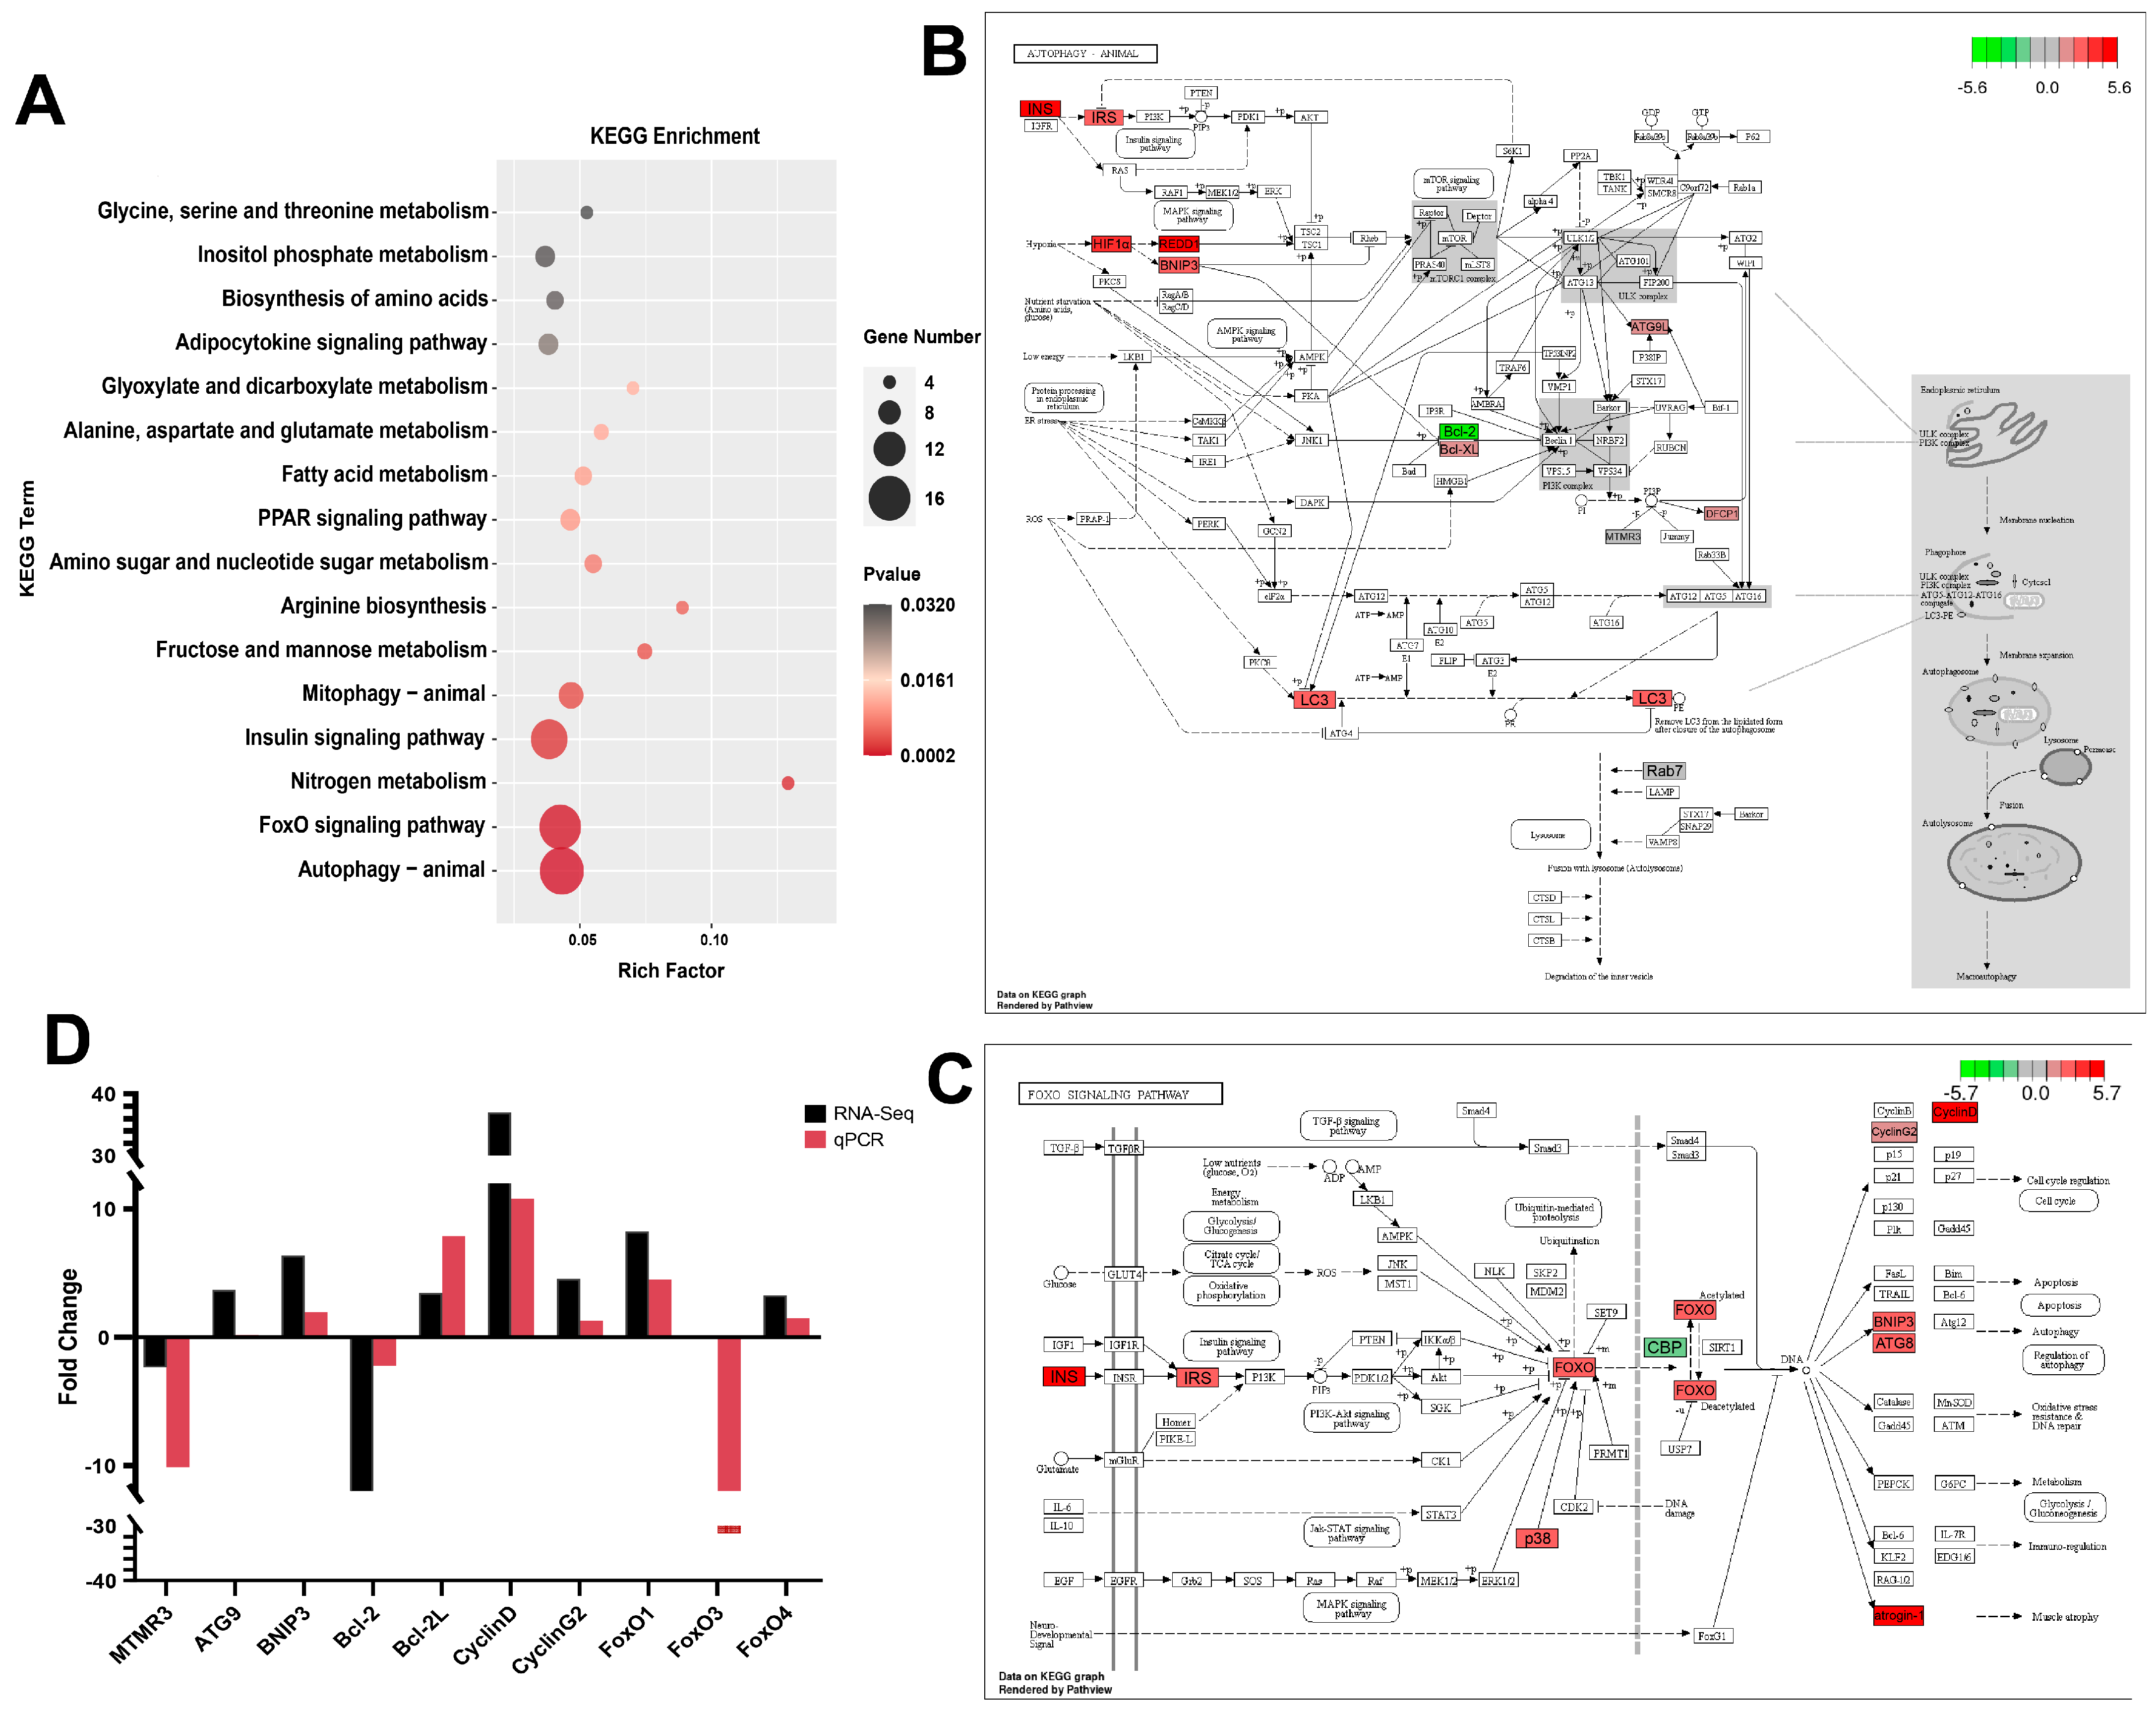
3.5. Functional Analysis by GO Enrichment and KEGG Enrichment

GO enrichment demonstrates differential terms mainly associated with metabolic, stress and signaling aspects (Figure 4A). To cluster these significant DEGs, GO terms with categories such as molecular function (MF), biological process (BP), and cellular component (CC) were performed to reveal the molecular characterization of these DEGs. Unexpectedly, CC-related terms were not significant (Figure 4B). Metabolism-related pathways mainly included ‘response to lipid’, ‘steroid-hormone-mediated signaling pathway’, ‘cellular response to steroid hormone stimulus’, ‘cellular response to lipid’, ‘cellular response to organic cyclic compound’, ‘response to organic substance’, and ‘response to chemical substance’. GO terms such as ‘hormone-mediated signaling pathway’, ‘cellular response to hormone stimulus’, ‘response to endogenous stimulus’, ‘cellular response to organic substance’, and ‘cellular response to chemical stimulus’ are related to stress. Some other GO terms are involved in signaling, such as ‘neuropeptide signaling pathway’, ‘circadian rhythm’, ‘rhythmic process’, and ‘sulfate transport’.
According to the KEGG function annotations, a total of 16 significantly enriched pathways were identified (Figure 5A, p < 0.05). The top two significantly enriched KEGG pathways were ‘autophagy–animal’ (ccar04140) and ‘FOXO signaling pathway’ (ccar04068). Transcriptome results suggest that winter photoperiod exposure augmented the autophagy response and FOXO signaling pathway in the carp liver (Figure 5B,C). Additionally, lipid-metabolism-related pathways including the ‘PPAR signaling pathway’, ‘fatty acid metabolism’, ‘adipocytokine signaling pathway’, and ‘inositol phosphate metabolism’ were significantly enriched. KEGG pathways associated with amino acid metabolism including ‘arginine biosynthesis’, ‘alanine, aspartate and glutamate metabolism’, ‘biosynthesis of amino acids’, and ‘glycine, serine and threonine metabolism’ were also significantly enriched.

3.6. Data Validation by qPCR

The genes related to autophagy, FOXO, and cell cycle were selected for verification (Figure 5D). The results showed that all the candidate genes in qPCR verification agreed with the results of the RNA-Seq technology. In brief, the gene expression levels of autophagy-related protein 9 (ATG9), B-cell lymphoma-2 like 1 (BCL2L1) (also known as BCL-XL), BCL2 interacting protein 3 (BNIP3), CYCLIND, CYCLING2, forkhead box O1 (FOXO1), and forkhead box O4 (FOXO4) were significantly up-regulated in the liver of the Huanghe carp under winter photoperiod exposure, while myotubularin-related protein 3 (MTMR3), B-cell lymphoma-2 (BCL2), and forkhead box O3 (FOXO3) were significantly down-regulated. Altogether, the qPCR results of the above genes confirmed the accuracy of the RNA-Seq data.

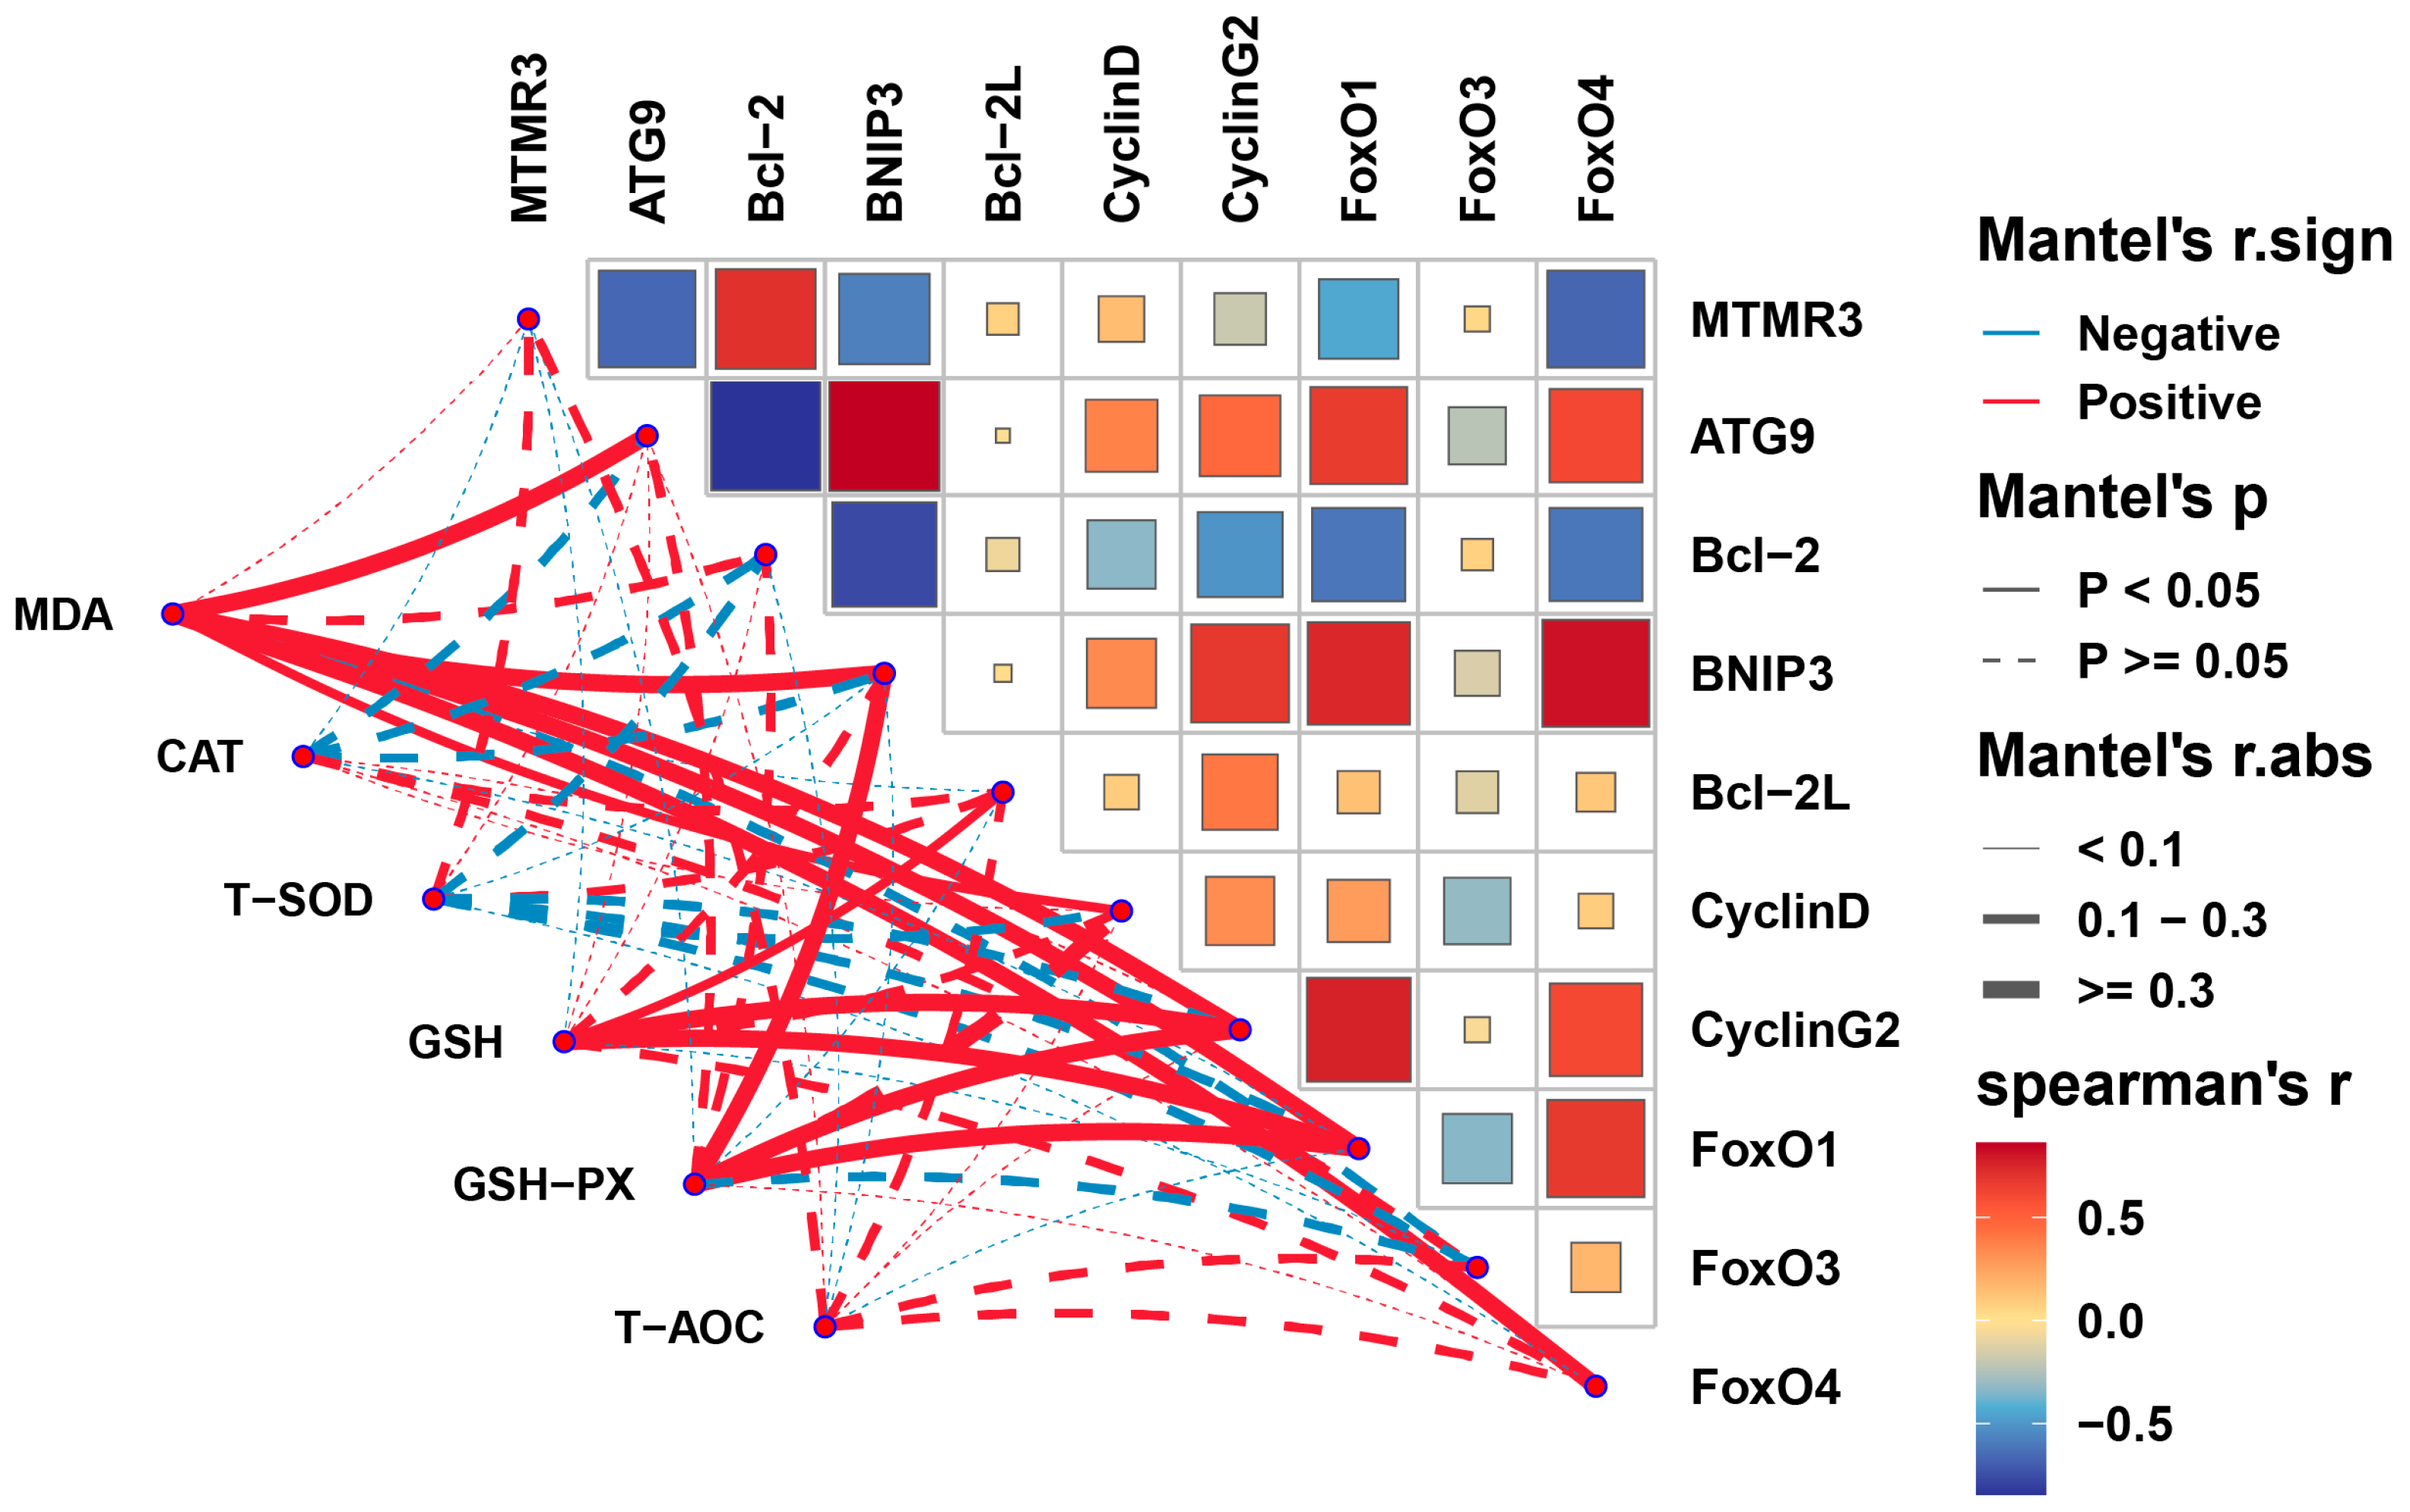
3.7. Correlation Analysis between Antioxidant Parameters and Key Genes

Correlation analysis was used to determine the relationship between antioxidant parameters and key genes. As shown in Figure 6, CYCLING2 and FOXO1 showed significant positive correlations with MDA, GSH, and GSH-PX, respectively. In addition, MDA was also significantly positively correlated with ATG9, BNIP3, and FOXO4. Additionally, intergene correlation analysis identified FOXO1 and FOXO4 as positively correlated with autophagy-related genes including ATG9 and BNIP3 as well as cell cycle CYCLING2.

4. Discussion

There are many indications that seasonal cycles affect fish health. The main clues to seasonality are changes in temperature and day length [24]. Some researchers have suggested that photoperiod is a more reliable cue in predicting seasonal changes [25]. We intervened and controlled for this factor to explore how seasonal photoperiod affects fish physiology. In this study, Huanghe carp stimulated by the winter photoperiod gained significantly more weight than the control group with the same feeding strategy in both groups, but there was no difference in other morphometric indicators, such as body length. Thus, we do not conclude that the winter photoperiod promoted Huanghe carp growth. Meanwhile, the increase in HSI under the winter photoperiod implied that the liver is a key organ in response to photoperiodic changes. As the most important metabolic organ in aquatic animals, the liver is susceptible to the influence of the external environment, which induces changes in lipid metabolism resulting in metabolic disorders and damaging aquatic animal health.
Few studies have elucidated changes in lipid metabolism in fish during different seasonal photoperiods. Visceral fat accumulated by male estuarine fish (Menidia beryllina) under short-light (light duration of 9.5 h) exposure was significantly higher compared to long-light (light duration of 15 h) exposure [26]. In the present study, the expression levels of liver lipogenic genes (SREBP-1C, FAS, and ACCα) were significantly up-regulated under winter photoperiod conditions in Huanghe carp. As an important transcription factor, sterol regulatory element binding protein-1C (SREBP-1C) is involved in encoding and catalyzing enzymes in the fatty acid and TG synthesis pathways, such as fatty acid synthase (FAS) and acetyl coenzyme A carboxylase alpha (ACCα) [27]. Over-expression of SREBP1C may lead to liver TG accumulation [28]. In a study of mud crab Scylla paramamosain juveniles, crabs reared under constant darkness had significantly higher TG and TC levels compared to natural photoperiods, and lipogenesis-related genes such as fatty acid synthase, sterol regulatory element binding protein-1, and acetyl-CoA carboxylase in the crab were up-regulated [4]. In our study, TG was significantly increased under the winter photoperiod. The high mRNA expression levels of lipogenesis-related enzymes and transcription factors suggested that the winter photoperiod promoted lipid synthesis and accumulation in Huanghe carp. Lipoprotein lipase (LPL) catalyzed the hydrolysis of chylomicron particles and triacylglycerol present in very low-density lipoprotein (VLDL) [29]. In the present study, the liver gene expression level of LPL was elevated under winter photoperiod exposure. As a rate-limiting enzyme for fatty acid β-oxidation, the liver gene carnitine O-palmitoyltransferase 1 (CPT1) showed the same trend [30]. The present study indicated that exposure to the winter photoperiod simultaneously promoted lipogenesis, lipolysis, and oxidation. The large increase in TG indicated liver fat accumulation in the Huanghe carp, which may be one of the important reasons for high body weights after prolonged exposure to winter photoperiods.
Accumulation of fat is one of the causes of induced oxidative stress in the liver. In our study, antioxidant-related enzyme activities (T-AOC, GSH-Px, and GSH) were elevated under winter photoperiodic exposure. Similarly, Wei et al. found that total antioxidant capacity, superoxide dismutase, and glutathione peroxidase were the highest in the liver of juvenile gibel carp (Carassius auratus) in the short-day-length groups [6]. This is in accordance with our findings. T-AOC can be used as a comprehensive measure of an organism’s antioxidant capacity. GSH-Px and GSH are readily induced by oxidative stress and enzyme activity levels, which can be used to quantify oxidative stress [31,32,33]. Organisms respond to oxidative damage by coordinating stress responses. Increased levels of antioxidant components in the liver are a crucial part of the oxidative stress response. Winter photoperiod exposure induced oxidative stress in the liver of the Huanghe carp with a significant increase in MDA, which is a product of lipid peroxidation [34]. GSH-Px, an important peroxidative catabolic enzyme, showed significantly higher activity in carp exposed to the winter photoperiod as compared to the control group, probably due to the effect of winter photoperiod exposure on the cellular function of carp, which synthesizes a large amount of GSH-PX to protect cellular structure and function from the effects and damage of oxidants [35]. Evidence supports the protective role of the lysosomal system, considered as one of the targets of reactive oxygen species, which prevents oxidative damage through autophagy [36]. Thus, activation of the autophagy pathway may occur during oxidative stress. Under normal conditions, autophagy in teleosts plays an important role in maintaining cellular homeostasis through complex and diverse molecular mechanisms [37]. Mild oxidative stress can induce the autophagy pathway to initiate cell survival and repair mechanisms [38]. There is evidence that environmental conditions such as hypoxia affect cell survival and physiological functions by triggering oxidative stress-induced autophagy [39]. Studies have shown that autophagy levels in hamster epididymis were significantly increased by short-term sunlight exposure [40]. Similar results were found in the present study. This study suggested that autophagy-related genes including BNIP3, BCL2, BCL2L1, GABARAPL1, ATG9, and MTMR3 were induced at the transcriptional level in response to prolonged stimulation of the winter photoperiod. This reflected the possibility that autophagy is induced as a survival response to oxidative stress.
It has been shown that external stimuli regulate the expression of FOXO target genes associated with apoptosis [15]. In response to stress or photoperiodic stimuli, FOXO proteins undergo post-translational modification (PTM) in the NLS and NES structural domains and are translocated from the cytoplasm to the nucleus to regulate the expression of a range of genes. FOXO transcription factors have been demonstrated to be involved in oxidative stress resistance and regulation of metabolic homeostasis [41]. Another study suggested that the FOXO signaling pathway may be involved in temperature acclimation in tiger grouper and Jinhu grouper [42]. The FOXO signaling pathway in the Huanghe carp liver in this study was significantly up-regulated in response to winter photoperiod stimulation. Activation of FOXO1 disrupts mitochondrial metabolism and lipid metabolism via the heme oxygenase1/sirtuin1/Ppargc1α pathway [43,44]. Overexpression of FOXO contributes to the accumulation of hepatic lipids. FOXO1 improves β-cell proliferation by inducing CyclinD1 expression and stimulates antioxidant mechanisms to prevent β-cell failure upon oxidative damage [45]. In contrast, CyclinG2, an unconventional cyclin and a direct target of FOXO proteins, causes blockage of the G2/M phase. Meanwhile, there is growing evidence that FOXO acts as a transcription factor that binds to promoter regions and transactivates the expression of autophagy genes, or regulates autophagic activity to induce autophagy by directly interacting with autophagy proteins in the cytoplasm as well as through epigenetic mechanisms [46]. Autophagy is a process that utilizes lysosomes to degrade its cytoplasmic proteins and damaged organelles, preventing cellular damage and thus maintaining health. This process is an important mechanism for cell survival, growth, and development and for the maintenance of homeostasis in the body [47]. Xiong et al. found that the autophagy-related gene Atg14, which is regulated by the FOXO transcription factor and circadian rhythms, plays an important role in hepatic lipid homeostasis [48]. There is also evidence that some other autophagy genes such as Bnip3 and Gabarapl1 are rhythmically regulated through C/EBPβ [49], which is consistent with our results.

5. Conclusions

In conclusion, the short photoperiod (winter photoperiod) disrupted liver lipid metabolism and oxidative stress in Huanghe carp. The significant increase in the final body weight and hemoglobin index of Huanghe carp under winter photoperiod conditions compared with summer photoperiod conditions was attributed to the fact that the winter photoperiod promotes lipid metabolism and induces hepatic fat deposition. The increase in lipids might be the cause of oxidative stress in the liver caused by the winter photoperiod. Genes regulated by the FOXO signaling pathway were up-regulated in the liver under a short photoperiod, which might be a result of FOXO mediating the expression of cell cycle proteins to stimulate antioxidant mechanisms in response to stress. Meanwhile, FOXO mediated autophagic response in response to oxidative stress under winter light. Our results have limitations for demonstrating that the FOXO signaling pathway is fundamentally quantitatively altered in the liver, and thus we would like to validate the role of the FOXO signaling pathway in photoperiodic changes with additional experiments. The present study provided evidence for changes in lipid metabolism and oxidative stress response in the liver of Huanghe carp under seasonal photoperiodic stimulation. Nevertheless, whether light cycles are the causative factor for lipid metabolism dysregulation is unknown to us. The above results emphasized the importance of light in fish culture for the physiological regulation of fish, and provided a theoretical basis for optimizing feeding protocols or environmental conditions to improve the artificial culture of Huanghe carp.

Author Contributions

Conceptualization, data curation, Y.T., W.W. and S.S.; methodology, investigation, P.D.; software, validation, J.L.; writing—original draft preparation, W.W.; writing—review and editing, Y.T. and S.S.; visualization, supervision, W.F. and C.Z.; project administration, funding acquisition, Y.T. All authors have read and agreed to the published version of the manuscript.

Funding

This study was supported by the earmarked fund for CARS (CARS-45), National Key Research and Development Program (2022YFF0608203), Central Public-interest Scientific Institution Basal Research Fund, CAFS (2020TD37, 2023XT0303).

Institutional Review Board Statement

The treatment of animals in this study was approved by the Animal Care and Use Committee of Nanjing Agricultural University (Nanjing, China) (SYXK (Su) 2017-0007).

Data Availability Statement

The data presented in this study are available on request.

Acknowledgments

The authors would like to thanks the faculty and students of the Aquatic Genetic Laboratory, Freshwater Fisheries Research Center of Chinese Academy of Fishery Sciences for their assistance during the research process. In addition, the authors gratefully acknowledge Jianxiang Chen of Nanjing Agricultural University for assistance during the experiments and writing.

Conflicts of Interest

The authors declare no conflict of interest.

References

  1. Villamizar, N.; Blanco-Vives, B.; Migaud, H.; Davie, A.; Carboni, S.; Sánchez-Vázquez, F.J. Effects of light during early larval development of some aquacultured teleosts: A review. Aquaculture 2011, 315, 86–94. [Google Scholar] [CrossRef]
  2. Reebs, S.G. Sensory Systems, Perception, and Learning| Circadian Rhythms in Fish. In Encyclopedia of Fish Physiology; Farrell, A.P., Ed.; Academic Press: San Diego, CA, USA, 2011; pp. 736–743. [Google Scholar]
  3. Bromage, N.; Porter, M.; Randall, C. The environmental regulation of maturation in farmed finfish with special reference to the role of photoperiod and melatonin. Aquaculture 2001, 197, 63–98. [Google Scholar] [CrossRef]
  4. Chen, S.; Liu, J.; Shi, C.; Migaud, H.; Ye, Y.; Song, C.; Mu, C.; Ren, Z.; Wang, C. Effect of photoperiod on growth, survival, and lipid metabolism of mud crab Scylla paramamosain juveniles. Aquaculture 2023, 567, 739279. [Google Scholar] [CrossRef]
  5. Fu, X.; Zou, Z.; Zhu, J.; Xiao, W.; Li, D.; Yu, J.; Chen, B.; Yang, H. Effects of different photoperiods on growth performance, daily rhythm of growth axis-related genes, and hormones in Nile tilapia (Oreochromis niloticus). Aquaculture 2022, 553, 738071. [Google Scholar] [CrossRef]
  6. Wei, H.; Cai, W.J.; Liu, H.K.; Han, D.; Zhu, X.M.; Yang, Y.X.; Jin, J.Y.; Xie, S.Q. Effects of photoperiod on growth, lipid metabolism and oxidative stress of juvenile gibel carp (Carassius auratus). J. Photochem. Photobiol. B Biol. 2019, 198, 111552. [Google Scholar] [CrossRef] [PubMed]
  7. Fukada, H.; Yabuki, H.; Miura, C.; Miura, T.; Kato, K. Regulation of lipid metabolism by water temperature and photoperiod in yellowtail Seriola quinqueradiata. Fish Sci. 2023, 89, 1–12. [Google Scholar] [CrossRef]
  8. Malinovskyi, O.; Rahimnejad, S.; Stejskal, V.; Boňko, D.; Stara, A.; Velíšek, J.; Policar, T. Effects of different photoperiods on growth performance and health status of largemouth bass (Micropterus salmoides) juveniles. Aquaculture 2021, 548, 737631. [Google Scholar] [CrossRef]
  9. Hosaka, T.; Biggs, W.H.; Tieu, D.; Boyer, A.D.; Varki, N.M.; Cavenee, W.K.; Arden, K.C. Disruption of forkhead transcription factor (FOXO) family members in mice reveals their functional diversification. Proc. Natl. Acad. Sci. USA 2004, 101, 2975–2980. [Google Scholar] [CrossRef]
  10. Barthel, A.; Schmoll, D.; Unterman, T.G. FoxO proteins in insulin action and metabolism. Trends Endocrinol. Metab. 2005, 16, 183–189. [Google Scholar] [CrossRef]
  11. Chen, G.; Pang, M.; Yu, X.; Wang, J.; Tong, J. Transcriptome sequencing provides insights into the mechanism of hypoxia adaption in bighead carp (Hypophthalmichthys nobilis). Comp. Biochem. Phys. D Genom. Proteom. 2021, 40, 100891. [Google Scholar] [CrossRef]
  12. Wu, S.; Huang, J.; Li, Y.; Pan, Y. Dynamic and systemic regulatory mechanisms in rainbow trout (Oncorhynchus mykiss) in response to acute hypoxia and reoxygenation stress. Aquaculture 2023, 572, 739540. [Google Scholar] [CrossRef]
  13. Blödorn, E.B.; Domingues, W.B.; Nunes, L.S.; Komninou, E.R.; Pinhal, D.; Campos, V.F. MicroRNA roles and their potential use as selection tool to cold tolerance of domesticated teleostean species: A systematic review. Aquaculture 2021, 540, 736747. [Google Scholar] [CrossRef]
  14. Shang, X.; Xu, W.; Zhang, Y.; Sun, Q.; Li, Z.; Geng, L.; Teng, X. Transcriptome analysis revealed the mechanism of Luciobarbus capito (L. capito) adapting high salinity: Antioxidant capacity, heat shock proteins, immunity. Mar. Pollut. Bull. 2023, 192, 115017. [Google Scholar] [CrossRef] [PubMed]
  15. Ma, F.; Zhao, L.; Ma, R.; Wang, J.; Du, L. FoxO signaling and mitochondria-related apoptosis pathways mediate tsinling lenok trout (Brachymystax lenok tsinlingensis) liver injury under high temperature stress. Int. J. Biol. Macromol. 2023, 251, 126404. [Google Scholar] [CrossRef] [PubMed]
  16. Shen, M.; Cao, Y.; Jiang, Y.; Wei, Y.; Liu, H. Melatonin protects mouse granulosa cells against oxidative damage by inhibiting FOXO1-mediated autophagy: Implication of an antioxidation-independent mechanism. Redox. Biol. 2018, 18, 138–157. [Google Scholar] [CrossRef]
  17. Pal, S.; Haldar, C.; Verma, R. Impact of photoperiod on uterine redox/inflammatory and metabolic status of golden hamster, Mesocricetus auratus. J. Exp. Zool. A Ecol. Integr. Physiol. 2022, 337, 812–822. [Google Scholar] [CrossRef] [PubMed]
  18. Rahman, M.M. Role of common carp (Cyprinus carpio) in aquaculture production systems. Front. Life Sci. 2015, 8, 399–410. [Google Scholar] [CrossRef]
  19. Su, S.; Li, H.; Du, F.; Zhang, C.; Li, X.; Jing, X.; Liu, L.; Li, Z.; Yang, X.; Xu, P.; et al. Combined QTL and Genome Scan Analyses with the Help of 2b-RAD Identify Growth-Associated Genetic Markers in a New Fast-Growing Carp Strain. Front. Genet. 2018, 9, 592. [Google Scholar] [CrossRef]
  20. Zhang, C.; Su, S.; Li, X.; Li, B.; Yang, B.; Zhu, J.; Wang, W. Comparative transcriptomics identifies genes differentially expressed in the intestine of a new fast-growing strain of common carp with higher unsaturated fatty acid content in muscle. PLoS ONE 2018, 13, e0206615. [Google Scholar] [CrossRef]
  21. Bradshaw, W.E.; Holzapfel, C.M. Light, time, and the physiology of biotic response to rapid climate change in animals. Annu. Rev. Physiol. 2010, 72, 147–166. [Google Scholar] [CrossRef]
  22. Karatsoreos, I.N.; Bhagat, S.M.; Bloss, E.B.; Morrison, J.H.; McEwen, B.S. Disruption of circadian clocks has ramifications for metabolism, brain, and behavior. Proc. Natl. Acad. Sci. USA 2011, 108, 1657–1662. [Google Scholar] [CrossRef] [PubMed]
  23. Livak, K.J.; Schmittgen, T.D. Analysis of relative gene expression data using real-time quantitative PCR and the 2(-Delta Delta C(T)) Method. Methods 2001, 25, 402–408. [Google Scholar] [CrossRef] [PubMed]
  24. Bowden, T.J.; Thompson, K.D.; Morgan, A.L.; Gratacap, R.M.; Nikoskelainen, S. Seasonal variation and the immune response: A fish perspective. Fish Shellfish Immunol. 2007, 22, 695–706. [Google Scholar] [CrossRef] [PubMed]
  25. Nelson, R.; Demas, G.; Klein, S.; Kriegsfeld, L.; Bronson, F. Seasonal Patterns of Stress, Immune Function, and Disease; Cambridge University Press: Cambridge, UK, 2002. [Google Scholar]
  26. Huber, M.; Bengtson, D.A. Effects of photoperiod and temperature on the regulation of the onset of maturation in the estuarine fish Menidia beryllina (Cope) (Atherinidae). J. Exp. Mar. Biol. Ecol. 1999, 240, 285–302. [Google Scholar] [CrossRef]
  27. Deng, X.; Dong, Q.; Bridges, D.; Raghow, R.; Park, E.A.; Elam, M.B. Docosahexaenoic acid inhibits proteolytic processing of sterol regulatory element-binding protein-1c (SREBP-1c) via activation of AMP-activated kinase. Biochim. Biophys. Acta 2015, 1851, 1521–1529. [Google Scholar] [CrossRef] [PubMed]
  28. Li, D.; Guo, L.; Deng, B.; Li, M.; Yang, T.; Yang, F.; Yang, Z. Long non-coding RNA HR1 participates in the expression of SREBP-1c through phosphorylation of the PDK1/AKT/FoxO1 pathway. Mol. Med. Rep. 2018, 18, 2850–2856. [Google Scholar] [CrossRef] [PubMed]
  29. Chen, Y.; Wu, X.; Lai, J.; Liu, Y.; Song, M.; Li, F.; Gong, Q. Characterization of two lipid metabolism-associated genes and their expression profiles under different feeding conditions in Acipenser dabryanus. Aquac. Rep. 2021, 21, 100780. [Google Scholar] [CrossRef]
  30. Liu, K.; Liu, H.; Chi, S.; Dong, X.; Yang, Q.; Tan, B. Effects of different dietary lipid sources on growth performance, body composition and lipid metabolism-related enzymes and genes of juvenile golden pompano. Trachinotus ovatus. Aquac. Res. 2018, 49, 717–725. [Google Scholar] [CrossRef]
  31. Van der Oost, R.; Beyer, J.; Vermeulen, N.P. Fish bioaccumulation and biomarkers in environmental risk assessment: A review. Environ. Toxicol. Pharmacol. 2003, 13, 57–149. [Google Scholar] [CrossRef]
  32. Olsvik, P.A.; Kristensen, T.; Waagbø, R.; Rosseland, B.O.; Tollefsen, K.E.; Baeverfjord, G.; Berntssen, M.H. mRNA expression of antioxidant enzymes (SOD, CAT and GSH-Px) and lipid peroxidative stress in liver of Atlantic salmon (Salmo salar) exposed to hyperoxic water during smoltification. Comp. Biochem. Physiol. C Toxicol. Pharmacol. 2005, 141, 314–323. [Google Scholar] [CrossRef]
  33. Singhal, S.S.; Singh, S.P.; Singhal, P.; Horne, D.; Singhal, J.; Awasthi, S. Antioxidant role of glutathione S-transferases: 4-Hydroxynonenal, a key molecule in stress-mediated signaling. Toxicol. Appl. Pharmacol. 2015, 289, 361–370. [Google Scholar] [CrossRef] [PubMed]
  34. Chen, J.; Xu, P.; Wen, H.; Xue, M.; Wang, Q.; He, J.; He, C.; Su, S.; Li, J.; Yu, F.; et al. Hypothermia-mediated oxidative stress induces immunosuppression, morphological impairment and cell fate disorder in the intestine of freshwater drum, Aplodinotus grunniens. Aquaculture 2023, 575, 739805. [Google Scholar] [CrossRef]
  35. Ma, H.; Wei, P.; Li, X.; Liu, S.; Tian, Y.; Zhang, Q.; Liu, Y. Effects of photoperiod on growth, digestive, metabolic and non-special immunity enzymes of Takifugu rubripes larvae. Aquaculture 2021, 542, 736840. [Google Scholar] [CrossRef]
  36. Kiffin, R.; Bandyopadhyay, U.; Cuervo, A.M. Oxidative stress and autophagy. Antioxid. Redox Signal. 2006, 8, 152–162. [Google Scholar] [CrossRef]
  37. Zhou, Z.; He, Y.; Wang, S.; Wang, Y.; Shan, P.; Li, P. Autophagy regulation in teleost fish: A double-edged sword. Aquaculture 2022, 558, 738369. [Google Scholar] [CrossRef]
  38. Jia, R.; Du, J.; Cao, L.; Feng, W.; He, Q.; Xu, P.; Yin, G. Immune, inflammatory, autophagic and DNA damage responses to long-term H2O2 exposure in different tissues of common carp (Cyprinus carpio). Sci. Total Environ. 2020, 757, 143831. [Google Scholar] [CrossRef] [PubMed]
  39. Chen, K.; Shi, L.; Liu, H.; Wang, H. Hypoxia activates autophagy by Akt/FoxO1 pathway in fish cells. Aquac. Fish. 2023. [Google Scholar] [CrossRef]
  40. Mou, J.; Xu, J.; Wang, Z.; Wang, C.; Yang, X.; Wang, X.; Xue, H.; Wu, M.; Xu, L. Effects of photoperiod on morphology and function in testis and epididymis of Cricetulus barabensis. J. Cell. Physiol. 2021, 236, 2109–2125. [Google Scholar] [CrossRef]
  41. Gao, L.; Yuan, Z.; Zhou, T.; Yang, Y.; Gao, D.; Dunham, R.; Liu, Z. FOXO genes in channel catfish and their response after bacterial infection. Dev. Comp. Immunol. 2019, 97, 38–44. [Google Scholar] [CrossRef]
  42. Duan, P.; Tian, Y.; Li, Z.; Chen, S.; Li, L.; Wang, X.; Wang, L.; Liu, Y.; Zhai, J.; Li, W.; et al. Comparative transcriptome analysis of hybrid Jinhu grouper (Epinephelus fuscoguttatus ♀ × Epinephelus tukula ♂) and Epinephelus fuscoguttatus under temperature stress. Aquaculture 2024, 578, 740037. [Google Scholar] [CrossRef]
  43. Cheng, Z.; Guo, S.; Copps, K.; Dong, X.; Kollipara, R.; Rodgers, J.T.; Depinho, R.A.; Puigserver, P.; White, M.F. Foxo1 integrates insulin signaling with mitochondrial function in the liver. Nat. Med. 2009, 15, 1307–1311. [Google Scholar] [CrossRef] [PubMed]
  44. Cheng, Z.; White, M.F. Targeting Forkhead box O1 from the concept to metabolic diseases: Lessons from mouse models. Antioxid. Redox Signal. 2011, 14, 649–661. [Google Scholar] [CrossRef] [PubMed]
  45. Kitamura, Y.I.; Kitamura, T.; Kruse, J.P.; Raum, J.C.; Stein, R.; Gu, W.; Accili, D. FoxO1 protects against pancreatic beta cell failure through NeuroD and MafA induction. Cell Metab. 2005, 2, 153–163. [Google Scholar] [CrossRef] [PubMed]
  46. Cheng, Z. The FoxO-Autophagy Axis in Health and Disease. Trends Endocrinol. Metab. 2019, 30, 658–671. [Google Scholar] [CrossRef] [PubMed]
  47. Xia, X.; Wang, X.; Qin, W.; Jiang, J.; Cheng, L. Emerging regulatory mechanisms and functions of autophagy in fish. Aquaculture 2019, 11, 734212. [Google Scholar] [CrossRef]
  48. Xiong, X.; Tao, R.; DePinho, R.A.; Dong, X.C. The autophagy-related gene 14 (Atg14) is regulated by forkhead box O transcription factors and circadian rhythms and plays a critical role in hepatic autophagy and lipid metabolism. J. Biol. Chem. 2012, 287, 39107–39114. [Google Scholar] [CrossRef]
  49. Ma, D.; Panda, S.; Lin, J.D. Temporal orchestration of circadian autophagy rhythm by C/EBPβ. EMBO J. 2011, 30, 4642–4651. [Google Scholar] [CrossRef]
Figure 1. Influence of winter photoperiod on hepatic lipid metabolism in Huanghe carp. (A) Total cholesterol (T-CHO) content; (B) triglyceride (TG) content; (C) low-density lipoprotein cholesterol (LDL-C) content; (D) gene expression of sterol regulatory element binding protein-1C (SREBP-1C), fatty acid synthase (FAS), acetyl CoA carboxylase alpha (ACCα), carnitine O-palmitoyltransferase 1 (CPT1), and lipoprotein lipase (LPL). Results were expressed as mean ± SEM, n = 9.
Fishes 08 00595 g001
Figure 2. Winter photoperiod exposure induces oxidative stress in the intestine of Huanghe carp. (A) malondialdehyde (MDA) content; (B) catalase (CAT) content; (C) total superoxide dismutase (T-SOD) content; (D) glutathione (GSH) content; (E) glutathione peroxidase (GSH-PX) content; (F) total antioxidant capacity (T-AOC) level. Results were expressed as mean ± SEM, n = 9.
Fishes 08 00595 g002
Figure 3. Preliminary analysis of transcriptome between SP and Con. (A) Principal component analysis (PCA) for the correlation among samples. (B) Volcano plots of DEGs. Green dots represent down-regulated expressed genes; red dots represent genes that are up-regulated; blue dots represent genes that are not differentially expressed. The abscissa represents the differential expression multiple; the ordinate represents the significance of the gene difference. (C) Hierarchical clustering of DEGs. Red indicates relatively high expression, and green indicates relatively low expression.
Fishes 08 00595 g003
Figure 4. GO annotations analysis of the DEGs. (A) Scatter plot showed the GO Term among all DEGs detected in the liver of Huanghe carp with different photoperiods. The horizontal axis showed the rich factor and the vertical axis showed the GO term, respectively. The dot size presented the number of DEGs in each GO term. (B) Histogram diagram of GO enrichment analysis. The colors in the bar chart represent biological processes (BP) and molecular functions (MF), and the numbers of significant putative DEGs are shown on the x-axis.
Fishes 08 00595 g004
Figure 5. Significantly enriched KEGG pathways. (A) KEGG enrichment analysis scatter plot representing pathways of significant DEGs for seasonal photoperiodic changes in Huanghe carp. (B) Color pathway of the autophagy–animal. (C) Color pathway of the FOXO signaling pathway. The purple and red background color in the pathway represents the down-regulated and up-regulated genes, respectively. (D) Gene expressions of myotubularin-related protein 3 (MTMR3), autophagy-related protein 9 (ATG9), B-cell lymphoma-2 (BCL2), BCL2 interacting protein 3 (BNIP3), B-cell lymphoma-2 like 1 (BCL2L1) (also known as BCL-XL), CYCLIND, CYCLING2, forkhead box O1 (FOXO1), forkhead box O3 (FOXO3), and forkhead box O4 (FOXO4).
Fishes 08 00595 g005
Figure 6. Correlation analysis between antioxidant parameters and FOXO and autophagy-related genes in the liver of Huanghe carp. Red indicates positive correlations, and blue indicates negative correlations; dashed line indicates p ≥ 0.05, and solid line indicates p < 0.05.
Fishes 08 00595 g006
Table 1. Primers used for qPCR.
GenePrimer Sequence (5′−3′)Fragment Length (bp)
SREBP1CF: GCCTGCTTCACTTCACTACT137
R: CCAGTCCTCATCCACAAA
FASF: GTGTACGCCACCGCCTATTA104
R: ATAGCAATAGCGGCCTGTCC
ACCαF: AGACCGTATCTACAGGCACT107
R: GCATCTTATGGTTGGCAC
CPT1F: TGACCTACAGTTGAGCCG196
R: AATCATGCCCATAGAGGG
LPLF: GACAATGGCACAGAATGG190
R: ACATACCCGTAACCGTCC
ATG9F: ACAAGCGTGGAGGGAACCGT184
R: AGGGACCAACATCGAGCA
BNIP3F: ACGGGAATCCAGCAGTAG162
R: ATCCTTGCGACAGCCTCAG
BCL2F: AGCGGCTTTATCAGTCGG162
R: CACAAACGGTCCCTCCAA
BCL2L1F: CGCATCGTGGGACTGTTT241
R: TCATTCCAGCCAGCAACC
CYCLINDF: GCGGCTACACTGAACTCT210
R: GCTGGCTCTTTCCTCTTCAA
CYCLING2F: TCTTCGGTTACAGCACTCAG142
R: TCTTCTTTGGTCACTCGG
MTMR3F: GGAGGGCACTAAATGGTT178
R: GATGGTCCTGTAGAAGGGA
FOXO1F: ACGAACTTGGCGACTCTG183
R: CCACTGATGGGTTCTTAGG
FOXO3F: ACGCCTGGGGAAACTATT200
R: GACAAAGCGACTGTGGAG
FOXO4F: CCACCGAGGAAGATAAACAC161
R: GATCAGGTCTGCGTAGGA
GAPDHF: CCGTTCATGCTATCACAGCTACACA310
R: GTGGATACCACCTGGTCCTCTG
Table 2. Growth performance of Huanghe carp under winter photoperiod exposure.
ConSP
Final body weight (g)55.44 ± 2.0962.39 ± 2.75 *
Body length (cm)13.08 ± 0.2113.55 ± 0.20
Body width (mm)42.24 ± 0.6042.97 ± 0.74
Body thickness (mm)22.84 ± 0.3523.77 ± 0.45
Hepatosomatic index (HSI) (%)1.53 ± 0.041.68 ± 0.05 *
Condition factor (CF) (g/cm3)0.026 ± 0.000.025 ± 0.00
* p < 0.05
Table 3. Illumina sequencing and mapping statistics of the liver transcriptome of Huanghe carp.
Con-1Con-2Con-3SP-1SP-2SP-3
Raw reads46,576,53641,233,31645,346,46044,230,21445,064,92443,351,336
Clean reads44,365,18439,283,25243,104,33643,551,72444,496,13642,217,336
Q20 (%)97.1397.0797.4597.9497.9397.56
Q30 (%)92.2192.1493.0193.9394.0493.07
GC content (%)48.1947.6147.3348.0947.4847.75
Total mapped37,300,12932,077,64336,404,50338,222,06438,312,66737,036,832
Mapping rate (%)84.0881.6684.4687.7686.187.73
Uniquely mapped34,006,88729,918,50334,285,32934,530,99235,449,12133,857,504
Uniquely mapped rate (%)76.6576.1679.5479.2979.6780.2
Disclaimer/Publisher’s Note: The statements, opinions and data contained in all publications are solely those of the individual author(s) and contributor(s) and not of MDPI and/or the editor(s). MDPI and/or the editor(s) disclaim responsibility for any injury to people or property resulting from any ideas, methods, instructions or products referred to in the content.

