Article

The Effects of Different Carbon Sources on Water Quality, Growth Performance, Hematology, Immune, and Antioxidant Status in Cultured Nile Tilapia with Biofloc Technology

1
Department of Molecular Biology and Genetics, Shaheed Benazir Bhutto University Shaheed Benazirabad, Sindh 67450, Pakistan
2
Department of Zoology, University of Sargodha, Sargodha 40100, Pakistan
3
Department of Zoology, Shah Abdul Latif University, Khairpur Mirs 66020, Pakistan
4
Department of Veterinary Sciences, University of Messina, Via Palatuccisnc, 98168 Messina, Italy
5
Institute of Molecular Biology and Biotechnology, University of Lahore Sargodha Campus, Sargodha 40100, Pakistan
6
Department of Zoology, Islamia College University, Peshawar 25120, Pakistan
*
Author to whom correspondence should be addressed.
Fishes 2023, 8(10), 512; https://doi.org/10.3390/fishes8100512
Submission received: 20 August 2023 / Revised: 4 October 2023 / Accepted: 12 October 2023 / Published: 14 October 2023
(This article belongs to the Special Issue Integrated Aquaculture and Monoculture of Low-Trophic Species)

Abstract

:
The biofloc technology system (BFT) is considered to be one of the sustainable aquaculture systems, which is based on the principle of nutrient recycling with the addition of a carbon source to give dominance to heterotrophic microorganisms. The objective of this study was to evaluate the effect of sugar cane molasses and tapioca flour as carbon sources on the water quality, growth, hematology, immune status, and non-specific antioxidant status of Oreochromis juveniles. Methodologically, the experiment was carried out for 10 weeks on 225 juvenile Nile tilapia with initial body weights of 47.0 ± 1.3 g that were randomly distributed in 09 tanks (1000 L) with a stocking density of 25 tilapias per tank; the treatments were: BFT + SM (S molasses), BFT + TF tapioca flour (TF), and a control with no carbon source added. The control group was fed 100% feed, while the BFT experimental groups were fed microbial flocs along with 75% feed. The results revealed that the water quality parameters were affected by the carbon sources, but were adequate for normal fish welfare, and the biofloc volume was higher (28.94) with the TF carbon source. The growth performance, such as weight gain (98.61), survival (99.01), and improved feed conversion ratio (FCR) (1.69), was recorded in BFT + TF. Significant improvements in WBCs, HCT, HB, lymphocytes, plasma proteins, albumin, and non-specific immune factors (lysozyme activity, immunoglobulins levels, and ACH50) were observed in biofloc-reared fish with tapioca flour as the carbon source compared to the control and sugarcane molasses groups. Moreover, significant increases in catalase (CAT) and superoxide dismutase (SOD) were found in the biofloc-reared fish with different carbon sources. In conclusion, the use of BFT + TF was found to affect improving the water quality, growth, hematology, immunity, and antioxidant status of juvenile Tilapia.
Key Contribution: Tapioca meal effect as a carbon source improved the water quality parameters, growth, blood profile, immunity, and antioxidant status in juvenile Tilapia cultured in biofloc technology with tapioca meal.

Graphical Abstract

1. Introduction

A major requirement for meeting the current fish protein demand for human consumption is the intensification of aquaculture [1]. Increasing the rearing density of fish increases the productivity per unit area [2]. A limited ability to control pathogens poses a major challenge to production intensification [3]. Sustainability in feed management is also considered to be a major component in intensifying any aquatic organism’s production [4]. In addition, a sustainable cultural system that does not pollute the environment and utilizes limited natural resources is needed [5]. Such an ecological aquaculture system is biofloc technology, which ensures sustainable feed management. This system provides a high yield with limited water exchange [6]. The advantage includes maintaining a high C/N ratio; therefore, the microbial community can take up ammonium and enhance the management of health and biosecurity with a limited exchange of water [4].
The biofloc culture system assembles various suspended organic particles with useful microorganisms involved with polymeric extracellular substance, making it a heterogeneous system [7]. It is possible to increase the carbon ratio of the feed by adding various organic carbonaceous sources such as tapioca, glucose, corn, wheat, acetate, glycerol, and molasses, etc., to the aquaculture system or by altering the feed composition by adding additional organic carbon sources [8]. The organic carbon source significantly influences the composition of flocs, specifically, the kind of storage polymer used and its amount [9]. Tilapia and Litopenaeus vannamei were successfully farmed using biofloc technology, which substantiated to be better in terms of feed efficacy and water than traditional methods [5]. In the biofloc system, the type of carbon source used affects its management, nutritional value, microbial community, and the biofloc system organisms [8]. Wei et al. [10] described that adding diverse carbonaceous sources may influence the NH4 elimination process, and simpler carbon sources (such as glucose and sucrose) may eradicate ammonia more rapidly than more complex carbon sources such as starch. Aquatic organisms have been treated with microorganisms and their cell components to enhance their immunity, growth, disease resistance, and antioxidant status [11]. Several bioactive compounds are present in bioflocs, such as polysaccharides, chlorophyll, fat-soluble vitamins, taurine, carotenoids, and phytosterols [12,13]. It is widely recognized that several microorganisms and their metabolites present in biofloc are immune-stimulants, which enhance immunity and are protective against several diseases [14]. Furthermore, bacterial species are typically linked with suspended particles in biofloc, facilitating with exogenous digestive enzymes and additional nutrients, thereby contributing to bacterial growth and survival [5]. Many studies have been conducted by utilizing several sources of carbons and their effects on several species cultured in biofloc technology, such as tapioca and plant starch for Pelteobagrus vachelli [8], Longan powder for Nile tilapia [9], and wheat bran and molasses for Litopenaeus vannamei [12]. Additional research is required to clarify the effects of various carbon sources on the water quality, growth, immunity, and stress response of species. The current study used tapioca flour (TF) and sugarcane molasses (SM), the best alternatives to the exhausted sources, which are readily available.
Globally, tilapia farming has increased in popularity and is the second-most farmed fish species [4]. It has a high growth rate and is a stress-tolerant species. Moreover, it is still under investigation to assess the effects of different carbon sources on the water quality, fish growth, haematology, immunity, and antioxidant status of biofloc-reared species. Therefore, the current research work was intended to assess the effect of various carbon sources (sugarcane molasses and tapioca flour) on the water characteristics, growth, hematology, and non-specific immune and antioxidant status of juvenile Oreochromis niloticus for the duration of 10 weeks.

2. Materials and Methods

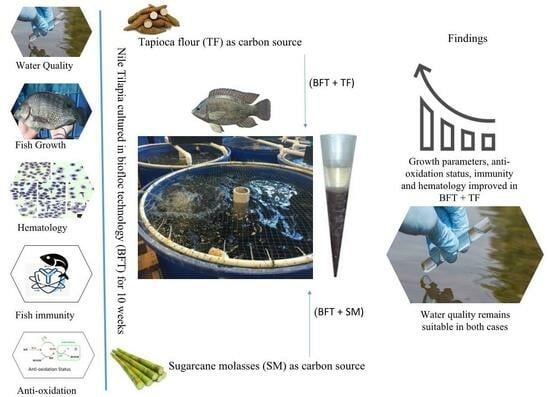
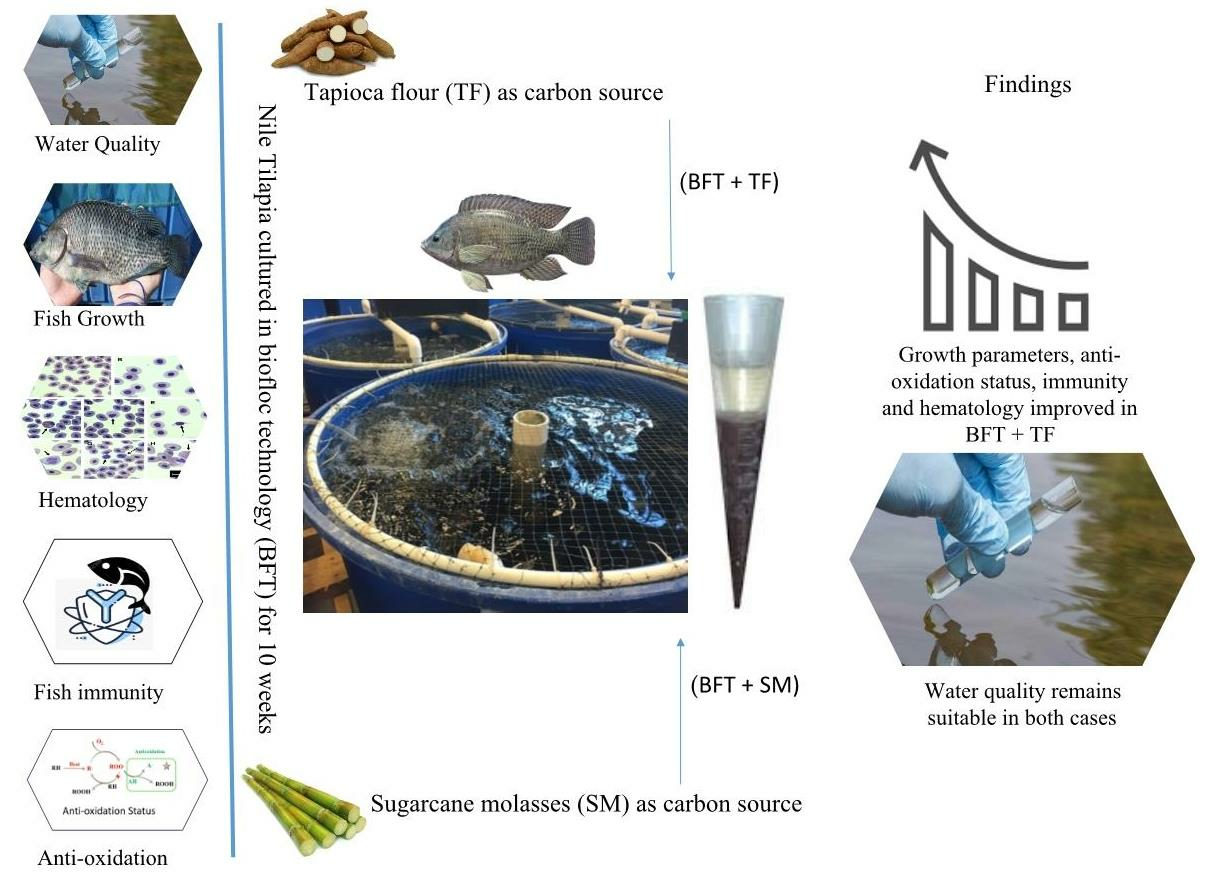
2.1. Experimental Design

The research was performed in the Research Laboratory of Zoology, University of Lahore, Pakistan. Before the experiment began, 225 juvenile Nile tilapia with initial body weights of (27.0 ± 1.3 g) were collected from the local fish hatchery. The collected fish were acclimatized (indoor) for 14 days in a rectangular tank of a 2000 L volume. During this duration, commercial feed (Supreme Company, Lahore, Pakistan) at 3% of their body weight was provided three times daily (7:00, 12:00, and 17:00) under a light/dark period (12/12 h). According to a proximate analysis, the feed consisted of crude protein level (32%), ash (6.9%), and lipid (4.3%). A continuous aeration system (1.5 hp blower) was installed in the tank, and the temperature of the culture water was maintained using an electric heater at 27.0 ± 1 °C.
In the second stage of the study, a total of three treatments were designed, each with three replicates in 09 rectangular tanks (1000 L vol). The initial stocking density of the fish was 25 fish/tank, 1.3 kg/m3, and body weight (47.0 ± 1.3 g). The experimental period of the study was 10 weeks. The control group was set in flow through a system with 30% water exchange on a daily basis and the fish of the control group were fed on commercial feed with 3% of their body weight [15]. However, the fish groups of the biofloc technology fed on bacterial flocs and commercial feed (75% daily feeding) with zero exchange of water [16]. The treatment protocols for the control and BFT groups were control: FT/30% water replacement, T1: BFT + SM, and T2: BFT + TF.
Fresh well water (salinity 15 ppt) was first added to all of the tanks prior to the start of the experiment. The concentrated biofloc (100 mL) was added to the BFT treatment groups from the old biofloc tanks. In addition, the C:N ratio of the BFT tanks was maintained at 15 [17] by a daily addition of the carbon sources two hours after feeding. In order to produce microbial flocs stock, 200 L of first-stage effluent was transferred into four conoid tanks and the total ammonium nitrogen (TAN) was estimated. Various carbon sources, including sugarcane molasses (SM) and tapioca flour (TF), were added to the tanks grounded on the calculation of Avnimelech [18], who presumed that 20 g of carbon source is necessary to transform 1 g of TAN. A biofloc was developed by adding carbonaceous materials to BFT tanks at a carbon-to-nitrogen ratio of 15 [17]. The carbon source amounts were calculated based on their characteristics [17]. Detail is given in Table 1 and Table 2. The carbonated resources were weighed, tipped into 1-l plastic containers, and mixed thoroughly with the water of the culture tank. They were then dispersed consistently throughout the surface of the tank to promote the biofloc’s growth. The continuous aerations were maintained and the experiment was conducted under 12 h darkness and 12 h light.

2.2. Analysis of Water Quality

The dissolve oxygen (DO) and water temperature were calculated daily in situ using an aquarium digital thermometer and DO meter (Jenway, London, UK). The pH values were measured after every three days using a pH meter (Beckman model-72). The salinity was measured with the help of an instrument (HQ30D Multi Meter HACH). Before feeding, ammonia (NH4+-N), nitrite nitrogen (NO2−-N), and nitrate nitrogen (NO3−-N) were sampled. An ammonia electrode (Model IS-570-NH3, Germany) was used to measure the unionized ammonia (NH4+-N) on a weekly basis. The total suspended solids (TSS) were estimated with the help of a TSS-meter (TSS) (HM-COM-80). Nitrite nitrogen (NO2−-N) and nitrate nitrogen (NO3−-N) were determined weekly by using a freshwater ‘master test kit’. An Imhoff cone was used to measure the volume of the biofloc, where the biofloc volume was recorded after 30 min of sedimentation of one liter of water in each BFT tank [18]; the number of observations was, therefore, 30 treatment−1.

2.3. Growth Performance and Survival

The parameters, including the weight gain percentage (wt. gain %), survival rate, feed conversion ratio (FCR), and feed intake, were studied to determine the fish growth performance. From each group, n = 10 samples were studied biweekly.
Wt. gain (%) = 100 × (Wf − Wi/Wi)
where Wf is the final weight and Wi is the initial weight; feed intake (g diet kg−1 fish) = total weight of feed provided (g)/kg of fish; FCR = the total feed intake (g)/weight gain (g); and survival (%) = 100 × (final fish number/initial stocked number)

2.4. Blood Sampling

At the termination of the experiment, blood samples were collected from the healthy fish with no sign of infection. The fish (n = 5) from each group were anaesthetized by using clove oil (50 mg clove oil L−1) [19] and the blood was drained from the caudal vein through a sterile syringe. Half (50%) of each blood sample was stored at 4 °C in an aqueous solution containing heparin (anticoagulant) and then used immediately to determine the hematological parameters. The other half of the blood was permitted to centrifuge at 1075× g for 10 min at 4 °C to acquire plasma. Further, for a biochemical and immunological assay analysis, the samples were stored at −80 °C.

2.5. Hematological Parameters

A Neubauer hemocytometer was used to count the White Blood Cells (WBC) and Red Blood Cells (RBCs) after dilution with phosphate-buffered saline. A hematocrit (HCT) determination was achieved by centrifuging the complete blood in heparinized microhematocrit capillary tubes for ten minutes at 3500× g. A cyanohemoglobin method was used to measure the haemoglobin (HB) concentration [20]. Giemsa-stained smears were used to determine the differential leucocyte count [21].

2.6. Humoral Non-Specific Immune Parameters

The determination of the total protein in the fish plasma samples was conducted through Biuret’s method, as described by Gornall et al. [22]. The bromocresol green method [23] was used to estimate Albumin, and the globulin was determined as the change between the total albumin and protein.
Furthermore, the lysozyme activity was measured through a turbidimetric assay with some modification. Plasma aliquots of 25 µL were added to Micrococcus lysodeikticus (1 mL suspension) [24]. This suspension was prepared using 0.05 M of sodium phosphate buffer. The absorbance of the spectrophotometer (Spectrophotometer PD-303 UV, APEL, Japan) was set at 670 nm after 30 s and 180 s. The quantity of protein was estimated with the help of the micro protein determination technique, while the total immunoglobin was estimated by following Siwicki and Anderson [24]. With the help of a 12% polyethylene glycol solution, molecules of Ig were precipitated and the difference between before and after was considered as the Ig concentration.
To determine the alternative complement activity (ACH50), the RBC of sheep were used as the target, and, at 540 nm wavelength, the absorbance of the lysed cells was measured with the help of a spectrophotometer [25]. The ACH50 was determined for each treated group by measuring the volume of plasma producing 50% hemolysis as follows:
ACH50 (unit mL−1) = 1/Y × (reciprocal of the plasma dilution)
where Y is the amount of plasma (mL) giving 50% lysis.

2.7. Antioxidant Parameters

The catalase activity (CAT) was determined following the protocol of Luck [26]. Briefly, a plasma sample of 10 µL was added to 1.24 mL of buffer (freshly prepared) containing 50 µL (H2O2) and 10 mL−1 of sodium–potassium phosphate buffer (0.15 M and pH 7). A change in absorbance was noted after 20 s (A1) and after 80 s (A2) of incubation at 240 nm against air. The catalase value was calculated as A1-A2/0.0008.
Superoxide dismutase (SOD) was calculated following Pedrajas et al.’s [27] method. Briefly, a plasma sample of 20 µL was added to 945 µL of sodium carbonate buffer (0.05 M and pH 10) and 42 µL of epinephrine (30 mmol L−1 dissolved by adding 30 µL of HCL). The auto-oxidation of the epinephrine to adrenochrome inhibition was estimated at 480 nm after 30 and 80 s in an alkaline environment. In total, 40 µL of epinephrine and 960 µL of sodium carbonate buffer were used to prepare the control group.
The inhibition (%) = 100 − [(∆A control − ∆A sample/∆A control) × 100]
SOD activity in plasma (U/mL) = % inhibition × 3.75

2.8. Statistical Analysis

A one-way ANOVA was used to statistically analyze the findings, and means were compared through a Duncan multiple range test at a significance level of 0.05. SPSS version 22.0 was used for the data analysis.

3. Results

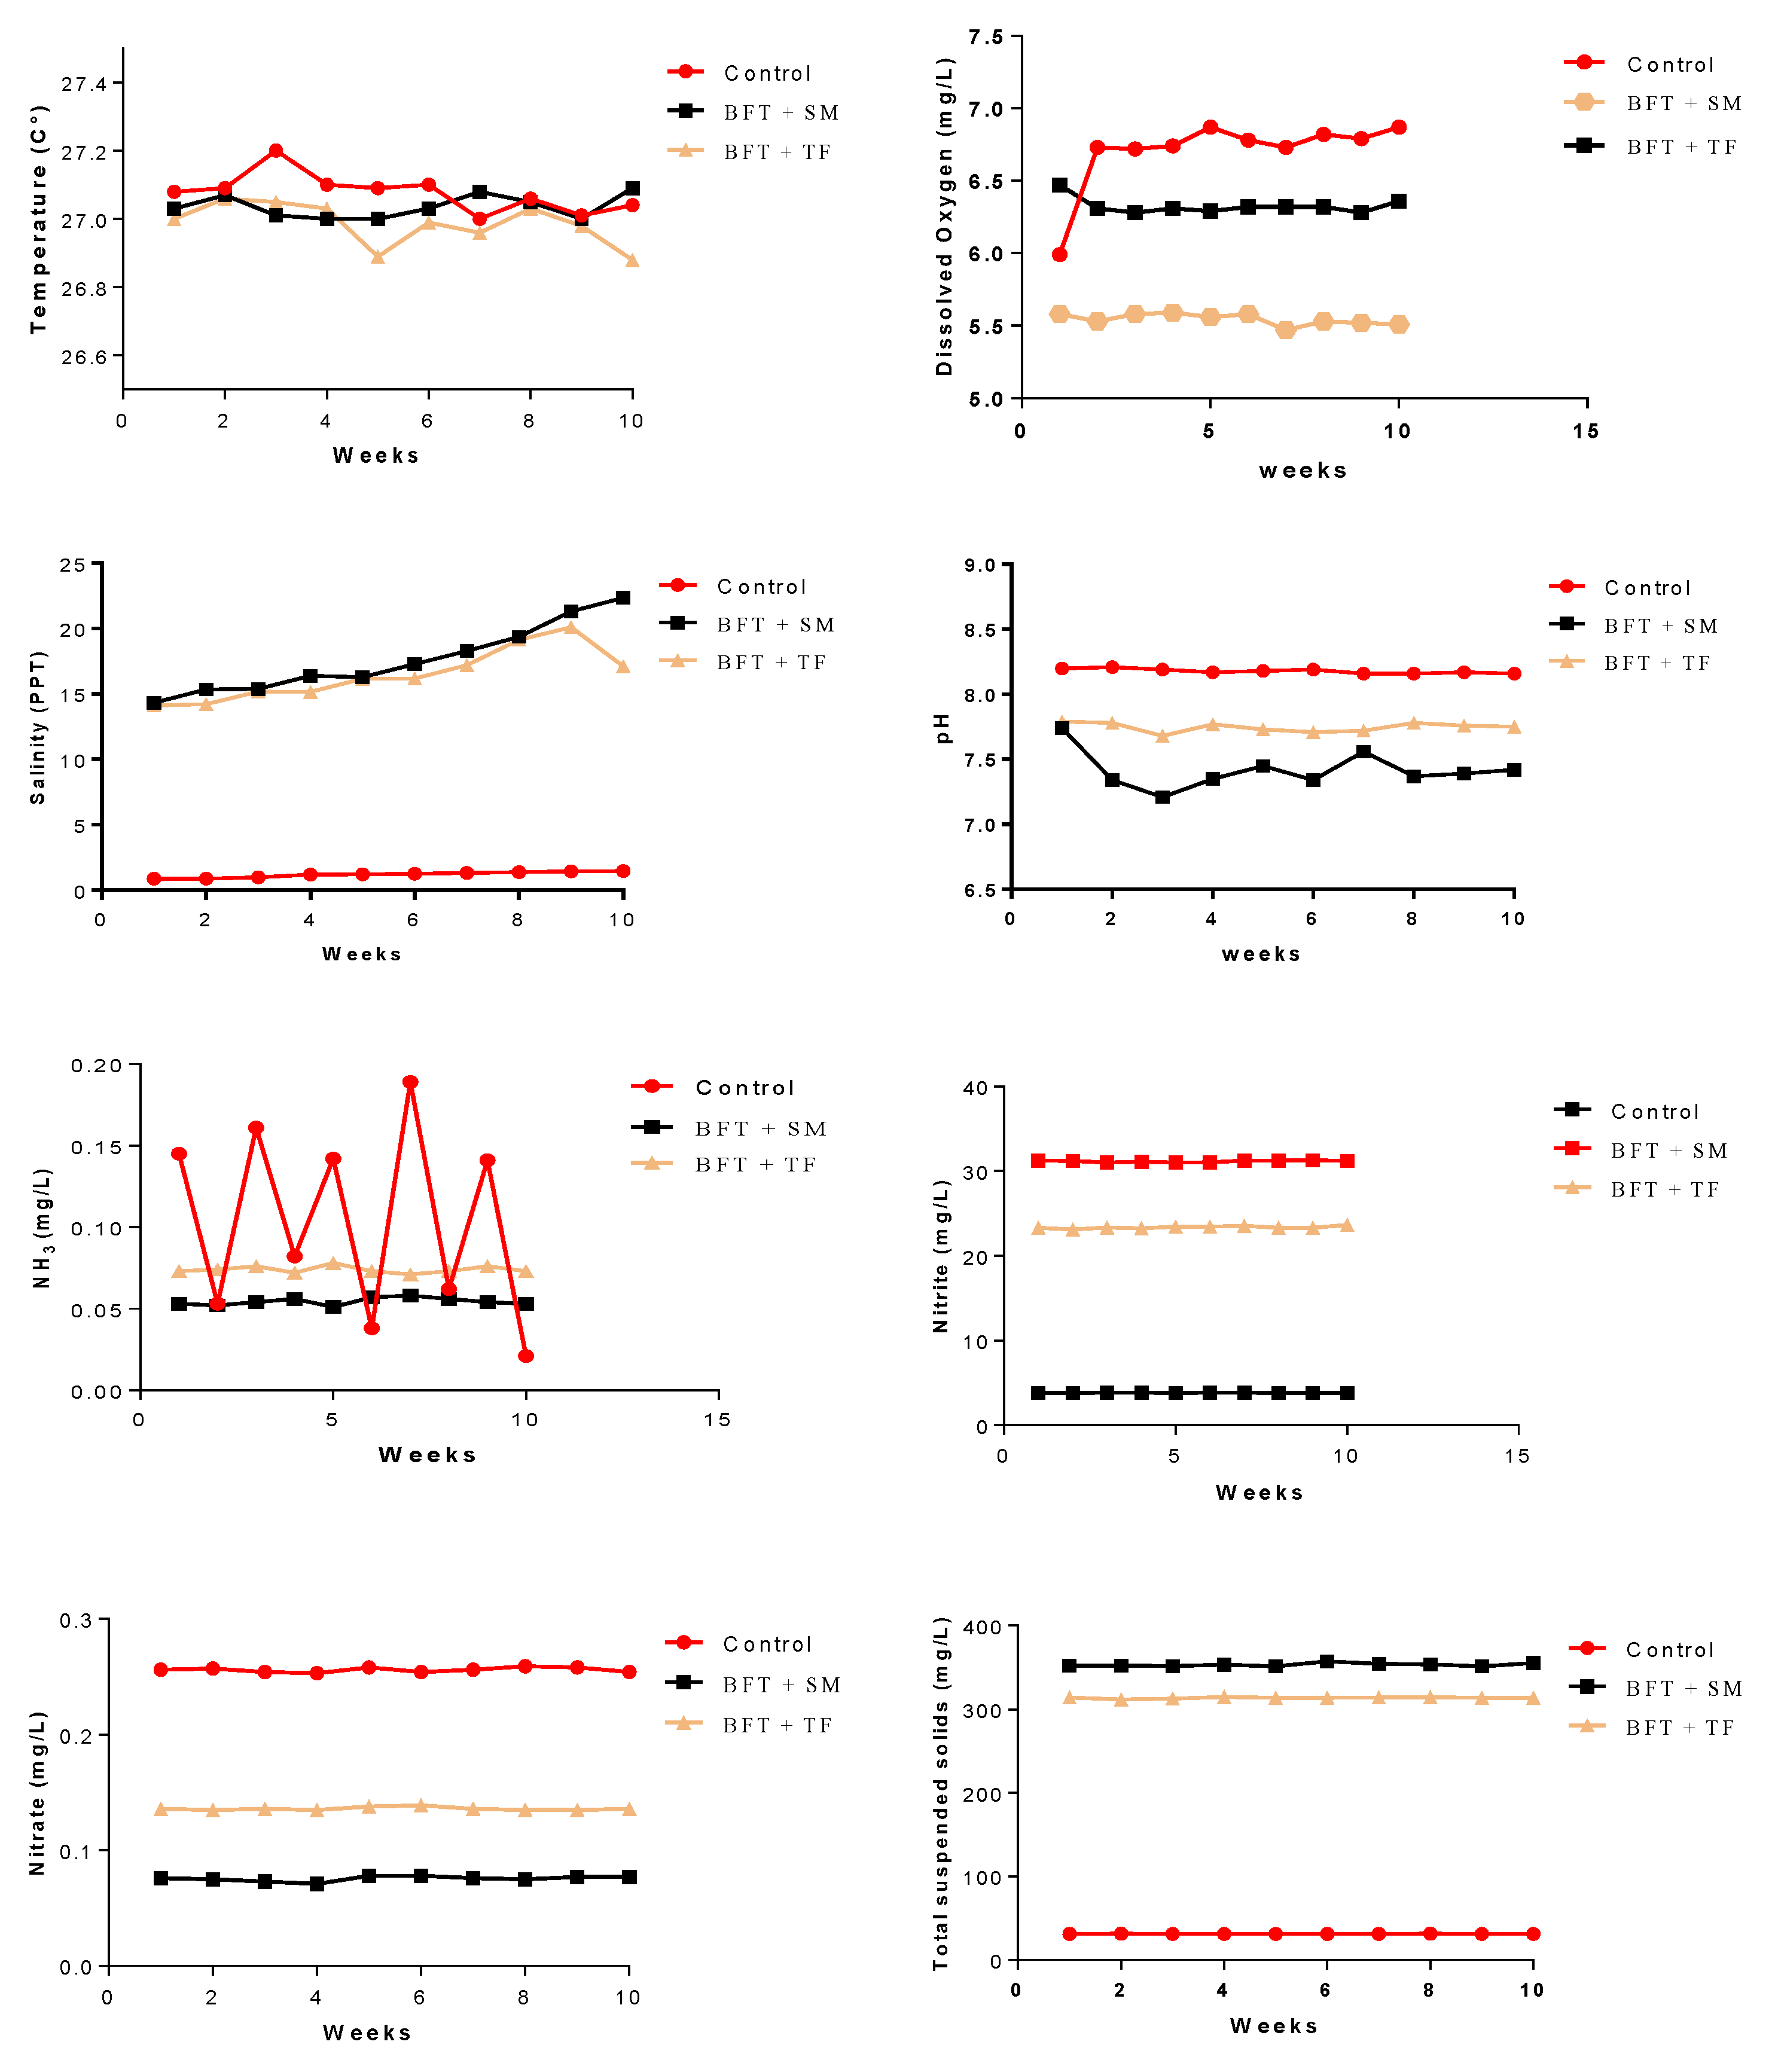
3.1. Water Quality Characteristics

Detailed findings of the different water quality parameters are depicted in Table 3. After the data analysis, the water quality parameters (DO, pH, salinity, NH3, nitrite, nitrate, TSS, and biofloc volume) were significantly (p < 0.05) different. A lower DO level (5.58 mg/L) and pH (7.32) was observed in the BFT + SM group as compared to other groups. The changes in the water quality parameters and biofloc volume of tank water affected by different carbon sources for the 10-weeks experimental trial are depicted in Figure 1.

3.2. Fish Growth Performance

The results of the fish growth performance fed on different carbon sources (SM and TF) raised in biofloc tanks and the control group are given in Table 4. Significantly higher (p < 0.05) effects of biofloc technology with a carbon source (BFT + TF) were recorded in the fish weight gain as compared to the control and other group (BFT + SM). The feed intake was significantly greater (p < 0.05) in both the treated groups (BFT + TF and BFT + SM) than in the control group. The best FCR was found in the biofloc fish group with a carbon source (BFT + TF). The survival rate ranged from 95% to 99%, but, overall, the survival rate was also higher in the biofloc fish with the TF carbon source.

3.3. Hematological Parameters

The fish hematological parameters, including (WBCs, HCT, and HB), were significantly higher (p < 0.05) in the fish reared in BFT + TF as compared to the other treated group (BFT + SM) and control (Table 5). This means the TF carbon source had a greater effect on the WBCs, HCT, and HB. The RBCs and monocyte values revealed no significant difference (p > 0.05) in both the carbon-treated and the control groups. However, the neutrophils value was significantly higher in the control group as compared to the experimental groups (Table 5).

3.4. Humoral Non-Specific Immune Parameters

The values of the total protein, humoral innate immunity, and albumin (lysozyme, immunoglobulin, and ACH50) increased significantly (p < 0.05) in the fish group reared in BFT with the TF carbon source compared to the control and other treated group (Table 6). The value of globulin revealed no significant difference (p > 0.05) between the treated groups (BFT + SM and BFT + TF), but significantly higher (p < 0.05) results compared to the control group.

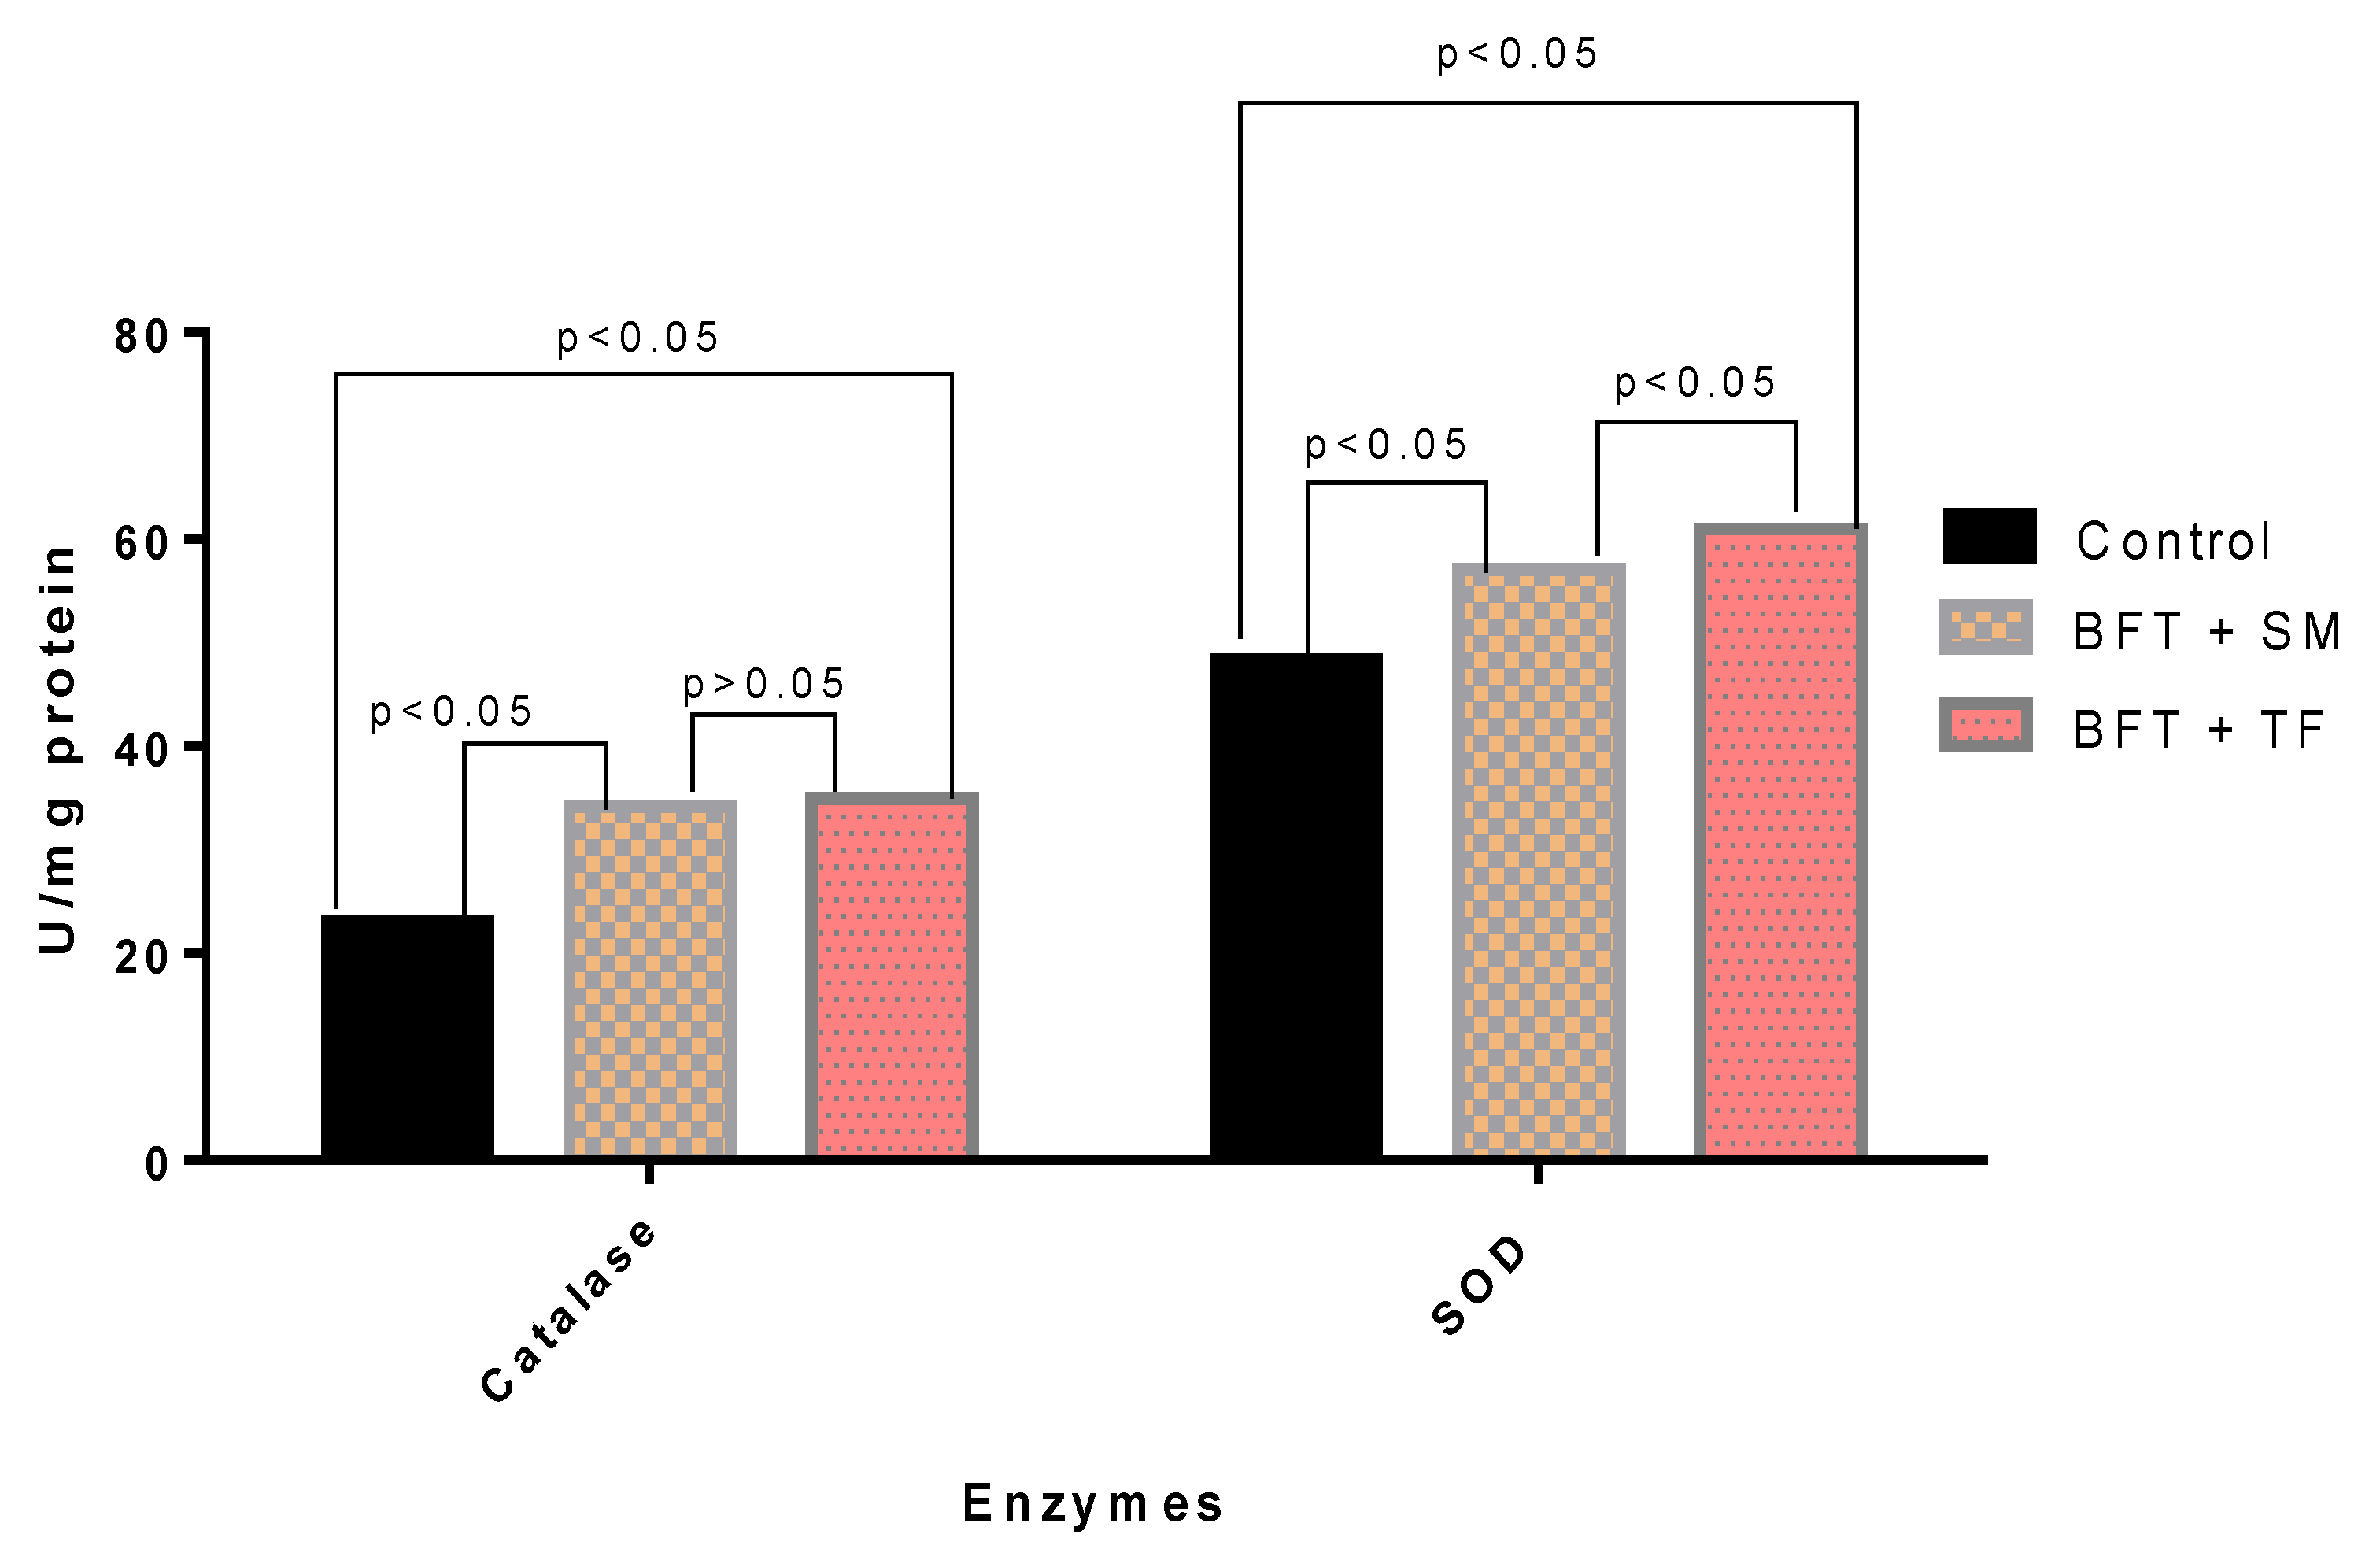
3.5. Antioxidant Enzymatic Activities

From the current study, it was found that different carbon sources significantly affected (p < 0.05) the catalase (CAT) and superoxide dismutase (SAD) (Figure 2). However, higher enzymatic activities were obtained with BFT + TP than in the other groups.

4. Discussion

The composite carbon source in biofloc can enhance the nutritional value of the bacterial species in the system, which can further serve as an additional source of food for fish. Thus, it can play a significant role in the improvement of body weight. This study evaluated different carbon sources for O. niloticus reared in a biofloc system, and the results of the present research revealed that the rearing of juvenile Nile Tilapia in a biofloc system with variant carbon sources affects the water quality characteristics, growth performance, blood profile, non-specific immune response, and antioxidant status in no water exchange. Aquatic animals depend mainly on water quality to maintain their health and limit growth [28]. The water quality parameters (temperature, DO, pH, nitrite, nitrate, NH3, and TSS) observed in the present investigation were in the appropriate range, suitable for biofloc fish farming. The present study’s findings are according to the water parameters reported by other studies [29,30]. Moreover, temperature is an essential factor affecting the formation and composition of biofloc [31] and is appropriate in the present research work. The decrease in microbial activity within the flocs led to deflocculation at lower temperatures (4 °C) than at higher temperatures (18–20 °C) [32]. According to Krishna and Van Loosdrecht [33], stable microbial flocs might be obtained at a temperature of (25–25 °C). In this study, the temperature range for both treatments was 27.01, slightly higher than the optimum level. The current research work also revealed a significant difference in the dissolved oxygen (DO) and pH levels in the control and treated groups. However, a lower DO level and pH were recorded in the BFT + SM group. This may have been due to higher respiration by the heterotrophic microbial community. As a result of the oxygen consumption by microbes and CO2 emission, H2CO3 is produced in a limited water exchange system, reducing pH levels [2,10]. The DO level influences the structure of aerobic flocs due to its role in the metabolic activity of cells [34]. According to Martins et al. [35], filamentous bacteria were more numerous than zoogloeal bacteria at DO levels (less or equal to 1.02 mg/L). The floc volume index increases with DO levels above 3.5 mg/L [36,37]. The floc volume observed in the current study for the tapioca meal with biofloc was 28.94 at 6.31 mg/L DO level. The physiological function of tilapia is not adversely affected by pH 4.0–8.5 [38]. In this study, the pH value was 8.21 (control), (7.32) BFT + SM, and (7.78) BFT + TF. The treated groups had lower levels of nitrite and ammonia combined with higher levels of nitrate, which showed a greater bacteria abundance that oxidized nitrite and ammonia compared to the control group [39]. In addition, the control treatment involved constant water exchange, so lower levels of nitrogen compounds were expected in this treatment. According to Xu et al. [40], a change in TSS concentrations over time can serve as an indicator of the development of biofloc in aquaculture systems, which is consistent with the findings of the current study. A lower TSS in the current study was recorded in the control group compared to the treatment groups. It has been reported that, during 14 weeks of raising Labeo rohita fingerlings, the highest TSS level (1.32840 mg/L) was recorded in a biofloc system [41]. Similarly, Azim and Little [42] observed the same observations for tilapia. However, in the current research, the TSS level did not exceed 351.7 mg/L. A TSS value higher than 1000 mg/L impacts the tilapia’s health.
Additionally, biofloc microorganisms contribute to sustaining the water parameters, fecal waste, and uneaten feed metabolism, and, thus, decrease the nitrogenous compounds, particularly nitrite and NH3 [43]. There is, however, an association between the reduction in ammonia concentrations and the development and formation of microbes in the biofloc [6]. According to Soliman and Abdel-Tawwab [29], the carbon source in biofloc technology improves microbial diversity, particularly ammonia-oxidizing bacteria, which decreases the NH3 concentration. In current study, there was no evident variation in the nitrite and nitrate levels, which indicated that heterotrophic uptake was the key ammonia removal path in the system, and this is consistent with the studies that have been explained before. The biofloc volume recorded in the current study was appropriate for tilapia production [15].
Earlier studies have shown that, due to probiotic properties, the biofloc technology system increases fish growth performance and FCR [4,37,44,45]. Similarly, the current study results show that BFT with different carbon sources improves the fish growth performance more than the control. The BFT with TF significantly increased the fish growth and provided the best FCR. This shows that microbial floc with BFT + TF acts as a supplementary diet source that provides extra protein, vitamins, minerals, and polyunsaturated fatty acids [9,29,37]. The TF contain more than 90% carbohydrates, which might show better results for microbial growth as compared to SM. In biofloc technology, the FCR should be close to one, as reported in several studies such as Khanjani et al. [39], who observed an FCR of 0.99 while using starch as a carbon source in biofloc technology for Nile tilapia fingerlings. Similar findings were obtained by García-Ríos et al. [46] for cultured Nile tilapia fingerlings. However, in this study, the FCR value was found to be higher. This might have been due to the short experimental duration. The biofloc system represents a suitable environment for fish growth and feed utilization without affecting the water quality or survival of the fish, which revealed the significant effects of biofloc on fish growth, as reported by previous studies findings [12,43,47]. The carbon source is effective for the growth performance of reared species because it enhances the floc production, including its chemical composition and volume, and can also store different bioactive compounds (carotenoids, extracellular enzymes, polymers, and phytosterols [43,48]. Biofloc-reared fish such as rohu (Labeo roita) and tilapia (Oreochromis niloticus) have previously shown a better growth performance [49,50], which is according to the findings of the present study. The feed comprising different ingredients represents the major production cost in commercial aquaculture; as a result, improving the efficiency of fish nutrition is a key priority. Therefore, applying the BFT system to intensive tilapia culture can be advantageous.
Hematological parameters are essential for understanding abnormalities due to health status [51,52]. The findings of the current study showed that the WBCs, HCT, HB, and lymphocytes were largely affected by the carbon sources and their values were greater in BFT + TF than the other groups. The increased number of WBCs was due to lymphocytes. Fish health is closely associated with the number of leukocytes, which play a significant role in innate immunity during inflammation [53]. According to Mansour and Esteban [15], different carbon sources improve the number of WBCs, HB, and HCT in biofloc-cultured O. niloticus, which agrees with the current study’s findings. According to the findings of many studies, stress, environmental conditions, carbon source type or amount, aquaculture system, microbial diversity, disease, and feeding treatment affect the blood profile of cultured fish [4,54,55,56].
It has been established that innate immunity is connected to increased levels of plasma proteins, albumin, and globulin, representing the significant proteins in plasma [57]. In the current study, all these proteins were significantly affected by the carbon sources and were higher in BFT + TF. Besides this, the lysozyme, immunoglobulin, and ACH50 levels were significantly higher in the fish cultured in biofloc technology with tapioca flour as a carbon source. The notable increase in these parameters is consistent with the findings of Mansour and Esteban [15]. They used wheat flour and rice bran as carbon sources for biofloc-cultured tilapia. Tapioca flour (TF) contains essential minerals such as iron and potassium. Besides this, it is also considered to be a good source of vitamin B, such as riboflavin (B2) and Niacin (B3) [58]. Vitamin B, potassium, and iron have long been known for their roles in immunity [59]. Therefore, an increase in the immunity of the fish reared in biofloc with tapioca flour can be linked to its nutritional value.
Moreover, Verma et al. [60] found that tapioca flour (TF) as a carbon source significantly increased the plasma proteins, globulin, and immunoglobulin levels in Labeo rohita reared in biofloc technology. Similar findings were revealed in the current study. The lysozyme produced by fish leukocytes causes bacterial cell wall lysis, which stimulates the complement system and facilitates the phagocytosis of many pathogens [61]. The complement activity plays a vital role in teleost’s antibacterial defense mechanism [62]. Researchers might investigate in future studies whether the increases in the immune parameters are associated with improved defenses against disease or stressful situations.
The antioxidant status in the present study was also greater in the fish reared in the BFT with tapioca as a carbon source compared to the BFT with sugarcane molasses and control groups. In particular, the biofloc treatment significantly increased the activity of the CAT and SOD enzymes. The increased activity of antioxidants in the case of tapioca may be linked to the antioxidants present in this plant. Several studies have suggested that all possible tapioca extracts show significantly higher antioxidant activity [63,64]. The present research was according to the findings of other studies [15,18,45]. CAT and SOD are enzymes that prevent the oxidation of lipids. The catalytic reaction of SOD produces hydrogen peroxide from superoxide anion and is further decomposed by CAT to oxygen and water to prevent lipid peroxidation [65]. The increased SOD and CAT activity levels in the present study may be attributed to enhanced fish well-being and decreased oxidative stress.

5. Conclusions

In conclusion, the current study revealed that biofloc technology with different carbon sources (SM and TF) significantly increased the water quality, growth performance, blood profile, non-specific immunity, and antioxidant status of O. niloticus compared to the control group. The use of TF appeared to be more appropriate for the rearing of O. niloticus in biofloc than SM. Besides the other carbon sources, the current study’s findings encourage biofloc fish farmers to consider TF as a carbon source for better results, because the BFT system was identified as an environmentally friendly alternative. This study provides new insight for future studies that can consider using TF as a carbon source on a larger scale with a long duration. This will enable us to understand better TF’s effect on fish health and final yield.

Author Contributions

K.H.R. and S.S.H.: conceptualization, and investigation; J.A.U. and S.A.: data curation, and formal analysis; M.U. and A.I.B.: writing—original draft; S.A. and Khayyam Khayyam.: sampling, supervision and methodology; F.F. and Khalid Khan.: review and editing; S.N. and S.S.H.: funding, supervision and editing. Everyone involved in the manuscript has reviewed and approved it. All authors have read and agreed to the published version of the manuscript.

Funding

This study was not supported by external funding.

Institutional Review Board Statement

The current research work was sanctioned by the “Advanced Research Board of the Department of Zoology, The University of Lahore, sub campus Sargodha Punjab, Pakistan” under the trial registration number (UOLS/FSH/0652) and the study was conducted according to the ethical deliberation of the European Legislation (Animal rights).

Data Availability Statement

Datasets from this study will be available upon reasonable request from the corresponding author.

Acknowledgments

We are pleased to express our gratitude to all the staff members of the Department of Zoology at the University of Sargodha (Pakistan) for their efforts and support during the experiment’s planning and statistical analysis.

Conflicts of Interest

The authors have not disclosed any conflict of interest.

References

  1. Tahergorabi, R.; Matak, K.E.; Jaczynski, J. Fish protein isolate: Development of functional foods with nutraceutical ingredients. J. Funct. Foods 2015, 18, 746–756. [Google Scholar] [CrossRef]
  2. Boyd, C.E.; D’Abramo, L.R.; Glencross, B.D.; Huyben, D.C.; Juarez, L.M.; Lockwood, G.S.; McNevin, A.A.; Tacon, A.G.; Teletchea, F.; Tomasso, J.R., Jr.; et al. Achieving sustainable aquaculture: Historical and current perspectives and future needs and challenges. J. World Aquac. Soc. 2020, 51, 578–633. [Google Scholar] [CrossRef]
  3. Ching, J.J.; Shuib, A.S.; Abdullah, N.; Majid, N.A.; Taufek, N.M.; Sutra, J.; Azmai, M.N.A. Hot water extract of Pleurotus pulmonarius stalk waste enhances innate immune response and immune-related gene expression in red hybrid tilapia Oreochromis sp. following challenge with pathogen-associated molecular patterns. Fish Shellfish Immunol. 2021, 116, 61–73. [Google Scholar] [CrossRef] [PubMed]
  4. Habib, S.S.; Batool, A.I.; Rehman, M.F.U.; Naz, S. Comparative analysis of the haemato-biochemical parameters and growth characteristics of Oreochromis niloticus (Nile tilapia) cultured under different feed and habitats (biofloc technology and earthen pond system). Aquac. Res. 2022, 53, 6184–6192. [Google Scholar] [CrossRef]
  5. Khanjani, M.H.; Sharifinia, M. Biofloc technology as a promising tool to improve aquaculture production. Rev. Aquac. 2020, 12, 1836–1850. [Google Scholar] [CrossRef]
  6. Khanjani, M.H.; Sharifinia, M.; Hajirezaee, S. Recent progress towards the application of biofloc technology for tilapia farming. Aquaculture 2022, 552, 738021. [Google Scholar] [CrossRef]
  7. Vethathirri, R.S.; Santillan, E.; Wuertz, S. Microbial community-based protein production from wastewater for animal feed applications. Bioresou. Technol. 2021, 341, 125723. [Google Scholar] [CrossRef]
  8. Deng, M.; Chen, J.; Gou, J.; Hou, J.; Li, D.; He, X. The effect of different carbon sources on water quality, microbial community and structure of biofloc systems. Aquaculture 2018, 482, 103–110. [Google Scholar] [CrossRef]
  9. Li, J.; Liu, G.; Li, C.; Deng, Y.; Tadda, M.A.; Lan, L.; Zhu, S.; Liu, D. Effects of different solid carbon sources on water quality, biofloc quality and gut microbiota of Nile tilapia (Oreochromis niloticus) larvae. Aquaculture 2018, 495, 919–931. [Google Scholar] [CrossRef]
  10. Wei, Y.; Liao, S.A.; Wang, A.L. The effect of different carbon sources on the nutritional composition, microbial community and structure of bioflocs. Aquaculture 2016, 465, 88–93. [Google Scholar] [CrossRef]
  11. Rohani, M.F.; Islam, S.M.; Hossain, M.K.; Ferdous, Z.; Siddik, M.A.; Nuruzzaman, M.; Padeniya, U.; Brown, C.; Shahjahan, M. Probiotics, prebiotics and synbiotics improved the functionality of aquafeed: Upgrading growth, reproduction, immunity and disease resistance in fish. Fish Immunol. 2022, 120, 569–589. [Google Scholar] [CrossRef] [PubMed]
  12. Zhao, D.; Pan, L.; Huang, F.; Wang, C.; Xu, W. Effects of different carbon sources on bioactive compound production of biofloc, immune response, antioxidant level, and growth performance of Litopenaeus vannamei in zero-water exchange culture tanks. J. World Aquac. Soc. 2016, 47, 566–576. [Google Scholar] [CrossRef]
  13. Elayaraja, S.; Mabrok, M.; Algammal, A.; Sabitha, E.; Rajeswari, M.V.; Zágoršek, K.; Ye, Z.; Zhu, S.; Rodkhum, C. Potential influence of jaggery-based biofloc technology at different C: N ratios on water quality, growth performance, innate immunity, immune-related genes expression profiles, and disease resistance against Aeromonas hydrophila in Nile tilapia (Oreochromis niloticus). Fish Shellfish Immunol. 2020, 107, 118–128. [Google Scholar] [PubMed]
  14. Khanjani, M.H.; Sharifinia, M.; Emerenciano, M.G.C. A detailed look at the impacts of biofloc on immunological and hematological parameters and improving resistance to diseases. Fish Shellfish Immunol. 2023, 137, 108796. [Google Scholar] [CrossRef] [PubMed]
  15. Mansour, A.T.; Esteban, M.Á. Effects of carbon sources and plant protein levels in a biofloc system on growth performance, and the immune and antioxidant status of Nile tilapia (Oreochromis niloticus). Fish Shellfish Immunol. 2017, 64, 202–209. [Google Scholar] [CrossRef]
  16. Bakhshi, F.; Najdegerami, E.H.; Manaffar, R.; Tokmechi, A.; Rahmani Farah, K.; Shalizar Jalali, A. Growth performance, haematology, antioxidant status, immune response and histology of common carp (Cyprinus carpio L.) fed biofloc grown on different carbon sources. Aquac. Res. 2018, 49, 393–403. [Google Scholar] [CrossRef]
  17. Avnimelech, Y. Biofloc Technology: A Practical Guide Book, 3rd ed.; World Aquaculture Society: San Diego, CA, USA, 2009. [Google Scholar]
  18. Avnimelech, Y. Carbon/nitrogen ratio as a control element in aquaculture systems. Aquaculture 1999, 176, 227–235. [Google Scholar] [CrossRef]
  19. Habib, S.S.; Naz, S.; Batool, A.I.; Rehman, F.U.; Ullah, M.; Kesbiç, O.S.; Maricchiolo, G.; Fazio, F. Effect of Different Anaesthetics on Hematology and Blood Biochemistry of Labeo rohita. Aquac. Stud. 2023, 24, AQUAST1195. [Google Scholar] [CrossRef]
  20. Goldenfarb, P.B.; Bowyer, F.P.; Hall, E.; Brosious, E. Reproducibility in the hematology laboratory: The microhematocrit determination. Am. J. Clin. Pathol. 1971, 56, 35–39. [Google Scholar] [CrossRef]
  21. Schütt, D.A.; Lehmann, J.; Goerlich, R.; Hamers, R. Haematology of swordtail, Xiphophorus helleri. I: Blood parameters and light microscopy of blood cells. J. Appl. Ichthyol. 1997, 13, 83–89. [Google Scholar] [CrossRef]
  22. Gornall, A.G.; Bardawill, C.J.; David, M.M. Determination of serum proteins by means of the biuret reaction. J. Biol. Chem. 1949, 177, 751–766. [Google Scholar] [CrossRef]
  23. Doumas, B.T.; Watson, W.A.; Biggs, H.G. Albumin standards and the measurement of serum albumin with bromcresol green. Clin. Chim. Acta 1971, 31, 87–96. [Google Scholar] [CrossRef]
  24. Siwicki, A.K.; Anderson, D.P. Nonspecific Defence Mechanisms Assay in Fish: II. Potential Killing Activity of Neutrophils and Macrophages, Lysozyme Activity in Serum and Organs. In Disease Diagnosis and Prevention Methods; Siwicki, A.K., Anderson, D.P., Waluga, J., Eds.; Wydawnictwo Instytutu Rybactwa Strodladowego: Olsztyn, Poland, 1993; pp. 105–111. [Google Scholar]
  25. Sun, S.; Ye, J.; Chen, J.; Wang, Y.; Chen, L. Effect of dietary fish oil replacement by rapeseed oil on the growth, fatty acid composition and serum non-specific immunity response of fingerling black carp, Mylopharyngodon piceus. Aquac. Nutr. 2011, 17, 441–450. [Google Scholar]
  26. Luck, H. Catalase. In Method of Enzymatic Analysis; Bergmayer, M.V., Ed.; Verlag Chemic/Academic Press: New York, NY, USA, 1974; p. 885. [Google Scholar]
  27. Pedrajas, J.R.; Peinado, J.; Lopez-Barea, J. Oxidative stress in fish exposed to model xenobiotics. Oxidatively modified forms of Cu, Zn-superoxide dismutase as potential biomarkers. Chem. Biol. Interact. 1995, 98, 267–282. [Google Scholar] [PubMed]
  28. El-Sayed, A.F.M. Use of biofloc technology in shrimp aquaculture: A comprehensive review, with emphasis on the last decade. Rev. Aquac. 2021, 13, 676–705. [Google Scholar]
  29. Soliman, A.M.; Abdel-Tawwab, M. Effects of different carbon sources on water quality, biofloc quality, and the productivity of Nile tilapia reared in biofloc-based ponds. Ann. Anim. Sci. 2022, 22, 1281–1289. [Google Scholar]
  30. Khanjani, M.H.; Alizadeh, M.; Sharifinia, M. Effects of different carbon sources on water quality, biofloc quality, and growth performance of Nile tilapia (Oreochromis niloticus) fingerlings in a heterotrophic culture system. Aquac. Int. 2021, 29, 307–321. [Google Scholar]
  31. Hostins, B.; Braga, A.; Lopes, D.L.; Wasielesky, W.; Poersch, L.H. Effect of temperature on nursery and compensatory growth of pink shrimp Farfantepenaeus brasiliensis reared in a super-intensive biofloc system. Aquac. Eng. 2015, 66, 62–67. [Google Scholar]
  32. Wilen, B.M.; Nielsen, J.L.; Keiding, K.; Nielsen, P.H. Influence of microbial activity on the stability of activated sludge flocs. Colloids Surf. B Biointerfaces 2000, 18, 145–156. [Google Scholar]
  33. Krishna, C.; Van Loosdrecht, M.C.M. Effect of temperature on storage polymers and settleability of activated sludge. Water Res. 1999, 33, 2374–2382. [Google Scholar]
  34. De Schryver, P.; Crab, R.; Defoirdt, T.; Boon, N.; Verstraete, W. The basics of bio-flocs technology: The added value for aquaculture. Aquaculture 2008, 277, 125–137. [Google Scholar]
  35. Martins, A.M.P.; Heijnen, J.J.; van Loosdrecht, M.C.M. Effect of dissolved oxygen concentration on sludge settleability. Appl. Microbiol. Biotechnol. 2003, 62, 586–593. [Google Scholar]
  36. Shamsuddin, M.; Hossain, M.B.; Rahman, M.; Kawla, M.S.; Shufol, M.B.A.; Rashid, M.M.; Asadujjaman, M.; Rakib, M.R.J. Application of Biofloc Technology for the culture of Heteropneustes fossilis (Bloch) in Bangladesh: Stocking density, floc volume, growth performance, and profitability. Aquac. Int. 2022, 30, 1047–1070. [Google Scholar]
  37. Luo, G.; Gao, Q.; Wang, C.; Liu, W.; Sun, D.; Li, L.; Tan, H. Growth, digestive activity, welfare, and partial cost-effectiveness of genetically improved farmed tilapia (Oreochromis niloticus) cultured in a recirculating aquaculture system and an indoor biofloc system. Aquaculture 2014, 422, 1–7. [Google Scholar]
  38. Mustapha, M.K.; Atolagbe, S.D. Tolerance level of different life stages of Nile tilapia Oreochromis niloticus (Linnaeus, 1758) to low pH and acidified waters. J. Basic Appl. Zool. 2018, 79, 1–6. [Google Scholar]
  39. Khanjani, M.H.; Alizadeh, M.; Mohammadi, M.; Sarsangi Aliabad, H. Biofloc system applied to Nile tilapia (Oreochromis niloticus) farming using different carbon sources: Growth performance, carcass analysis, digestive and hepatic enzyme activity. Iran. J. Fish. Sci. 2021, 20, 490–513. [Google Scholar]
  40. Xu, W.J.; Morris, T.C.; Samocha, T.M. Effects of C/N ratio on biofloc development, water quality, and performance of Litopenaeus vannamei juveniles in a biofloc-based, high-density, zero-exchange, outdoor tank system. Aquaculture 2016, 453, 169–175. [Google Scholar]
  41. Kamilya, D.; Debbarma, M.; Pal, P.; Kheti, B.; Sarkar, S.; Singh, S.T. Biofloc technology application in indoor culture of Labeo rohita (Hamilton, 1822) fingerlings: The effects on inorganic nitrogen control, growth and immunity. Chemosphere 2017, 182, 8–14. [Google Scholar]
  42. Azim, M.E.; Little, D.C. The biofloc technology (BFT) in indoor tanks: Water quality, biofloc composition, and growth and welfare of Nile tilapia (Oreochromis niloticus). Aquaculture 2008, 283, 29–35. [Google Scholar]
  43. Wang, G.; Yu, E.; Xie, J.; Yu, D.; Li, Z.; Luo, W.; Qiu, L.; Zheng, Z. Effect of C/N ratio on water quality in zero-water exchange tanks and the biofloc supplementation in feed on the growth performance of crucian carp, Carassius auratus. Aquaculture 2015, 443, 98–104. [Google Scholar]
  44. Adineh, H.; Naderi, M.; Hamidi, M.K.; Harsij, M. Biofloc technology improves growth, innate immune responses, oxidative status, and resistance to acute stress in common carp (Cyprinus carpio) under high stocking density. Fish Shellfish Immunol. 2019, 95, 440–448. [Google Scholar] [CrossRef]
  45. Long, L.; Yang, J.; Li, Y.; Guan, C.; Wu, F. Effect of biofloc technology on growth, digestive enzyme activity, hematology, and immune response of genetically improved farmed tilapia (Oreochromis niloticus). Aquaculture 2015, 448, 135–141. [Google Scholar] [CrossRef]
  46. García-Ríos, L.; Miranda-Baeza, A.; Coelho-Emerenciano, M.G.; Huerta-Rábago, J.A.; Osuna-Amarillas, P. Biofloc technology (BFT) applied to tilapia fingerlings production using different carbon sources: Emphasis on commercial applicatons. Aquaculture 2019, 502, 26–31. [Google Scholar] [CrossRef]
  47. Arnold, S.J.; Coman, F.E.; Jackson, C.J.; Groves, S.A. High-intensity, zero water-exchange production of juvenile tiger shrimp, Penaeus monodon: An evaluation of artificial substrates and stocking density. Aquaculture 2009, 293, 42–48. [Google Scholar] [CrossRef]
  48. Kishawy, A.T.; Sewid, A.H.; Nada, H.S.; Kamel, M.A.; El-Mandrawy, S.A.; Abdelhakim, T.M.; El-Murr, A.E.I.; Nahhas, N.E.; Hozzein, W.N.; Ibrahim, D. Mannanoligosaccharides as a carbon source in Biofloc boost dietary plant protein and water quality, growth, immunity and Aeromonas hydrophila resistance in Nile tilapia (Oreochromis niloticus). Animals 2020, 10, 1724. [Google Scholar] [CrossRef]
  49. Mahanand, S.S.; Moulick, S.; Rao, P.S. Water quality and growth of Rohu, Labeo rohita, in a biofloc system. J. Appl. Aquac. 2013, 25, 121–131. [Google Scholar] [CrossRef]
  50. Crab, R.; Kochva, M.; Verstraete, W.; Avnimelech, Y. Bio-flocs technology application in over-wintering of tilapia. Aquac. Eng. 2009, 40, 105–112. [Google Scholar] [CrossRef]
  51. Habib, S.S.; Naz, S.; Khalid, S.; Kanwal, R.; Ameer, I.; Khan, S.N.A.; Rehman, A.U.; Kousar, M.; Khan, S.U.; Nazir, N. Effect of white button mushroom (Agaricus bisporus) on immunity and haematological parameters of Oreochromis niloticus. Pak. J. Zool. 2022, 54, 785–790. [Google Scholar] [CrossRef]
  52. Amenyogbe, E.; Yang, E.J.; Xie, R.T.; Huang, J.S.; Chen, G. Influences of indigenous isolates Pantoea agglomerans RCS2 on growth, proximate analysis, haematological parameters, digestive enzyme activities, serum biochemical parameters, antioxidants activities, intestinal morphology, disease resistance, and molecular immune response in juvenile’s cobia fish (Rachycentron canadum). Aquaculture 2022, 551, 737942. [Google Scholar]
  53. Rebl, A.; Goldammer, T. Under control: The innate immunity of fish from the inhibitors’ perspective. Fish Shellfish Immunol. 2018, 77, 328–349. [Google Scholar] [CrossRef]
  54. Habib, S.S.; Naz, S.; Nawaz, S.; Ameer, I.; Khatoon, A.; Rehman, H.U.; Jawad, S.M.; Ali, H. Comparative analysis of hematological parameters of some farmed and wild fish species. Pak. J. Zool. 2021, 54, 591–598. [Google Scholar] [CrossRef]
  55. Habib, S.S.; Fazio, F.; Naz, S.; Arfuso, F.; Piccione, G.; Rehman, H.U.; Achakzai, W.M.; Uddin, M.N.; Rind, K.H.; Rind, N.A. Seasonal variations in haematological parameters and body composition of Labeo rohita (Rohu) and Cirrhinus mrigala (Mrigal carp) in River Indus, District Dera Ismail Khan, Pakistan. Turk. J. Fish. Aquat. Sci. 2021, 21, 435–441. [Google Scholar] [CrossRef] [PubMed]
  56. Burgos-Aceves, M.A.; Lionetti, L.; Faggio, C. Multidisciplinary haematology as prognostic device in environmental and xenobiotic stress-induced response in fish. Sci. Total Environ. 2019, 670, 1170–1183. [Google Scholar] [CrossRef] [PubMed]
  57. Akrami, R.; Gharaei, A.; Mansour, M.R.; Galeshi, A. Effects of dietary onion (Allium cepa) powder on growth, innate immune response and hemato–biochemical parameters of beluga (Huso huso Linnaeus, 1754) juvenile. Fish Shellfish Immunol. 2015, 45, 828–834. [Google Scholar] [CrossRef]
  58. Chinnadurai, V.; Viswanathan, P.; Kalimuthu, K.; Vanitha, A.; Ranjitha, V.; Pugazhendhi, A. Comparative studies of phytochemical analysis and pharmacological activities of wild and micropropagated plant ethanol extracts of Manihot esculenta. Biocatal. Agric. Biotechnol. 2019, 19, 101166. [Google Scholar] [CrossRef]
  59. Chirra, M.; Newton, H.S.; Gawali, V.S.; Wise-Draper, T.M.; Chimote, A.A.; Conforti, L. How the potassium channel response of T lymphocytes to the tumor microenvironment shapes antitumor immunity. Cancers 2022, 14, 3564. [Google Scholar] [CrossRef]
  60. Verma, A.K.; Rani, A.B.; Rathore, G.; Saharan, N.; Gora, A.H. Growth, non-specific immunity and disease resistance of Labeo rohita against Aeromonas hydrophila in biofloc systems using different carbon sources. Aquaculture 2016, 457, 61–67. [Google Scholar]
  61. de Mello, M.M.M.; de Faria, C.D.F.P.; Zanuzzo, F.S.; Urbinati, E.C. β-glucan modulates cortisol levels in stressed pacu (Piaractus mesopotamicus) inoculated with heat-killed Aeromonas hydrophila. Fish Shellfish Immunol. 2019, 93, 1076–1083. [Google Scholar] [CrossRef]
  62. Uribe, C.; Folch, H.; Enríquez, R.; Moran, G.J.V.M. Innate and adaptive immunity in teleost fish: A review. Vet. Med. 2011, 56, 486. [Google Scholar] [CrossRef]
  63. Omar, N.F.; Hassan, S.A.; Yusoff, U.K.; Abdullah, N.A.P.; Wahab, P.E.M.; Sinniah, U.R. Phenolics, flavonoids, antioxidant activity and cyanogenic glycosides of organic and mineral-base fertilized cassava tubers. Molecules 2012, 17, 2378–2387. [Google Scholar] [CrossRef]
  64. Homayouni, H.; Kavoosi, G.; Nassiri, S.M. Physicochemical, antioxidant and antibacterial properties of dispersion made from tapioca and gelatinized tapioca starch incorporated with carvacrol. LWT 2017, 77, 503–509. [Google Scholar] [CrossRef]
  65. El-Beltagi, H.S.; Mohamed, H.I. Reactive oxygen species, lipid peroxidation and antioxidative defense mechanism. Not. Bot. Horti Agrobot. Cluj-Napoca 2013, 41, 44–57. [Google Scholar] [CrossRef]
Figure 1. Variation in physicochemical parameters and biofloc volume of tanks water stocked by O. niloticus under biofloc system with different carbon sources for 10 weeks.
Fishes 08 00512 g001
Figure 2. Antioxidant enzymes activities of juvenile O. niloticus (Nile tilapia) cultured in biofloc tanks with different carbon sources for 10 weeks.
Fishes 08 00512 g002
Table 1. Proximate investigation of the commercial fish feed and experimental flour utilized in experimental period.
CompositionFish FeedSugarcane MolassesTapioca Flour
Crude protein (% dw)32 ± 1.04.76 ± 0.1210.78 ± 0.12
Dry matter (%)84 ± 1.053.12 ± 0.3890.13 ± 0.17
Crude lipid (% dw)4.3 ± 1.00.2 ± 0.042.56 ± 0.02
Ash (% dw)6.9 ± 1.07.87 ± 0.124.32 ± 0.05
Fiber (% dw)1.8 ± 1.00.38 ± 0.066.12 ± 0.14
Carbohydrate (% dw)26 ± 1.038.31 ± 0.2165.21 ± 0.14
Table 2. Quantity of fish feed and carbon sources used in the research period.
Organic MaterialsDaily Added (Grams)
Fish feed (32% protein)16.1
Sugarcane molasses9.8
Tapioca flour8.6
C:N ratio15:1
Table 3. Water quality parameters of juvenile O. niloticus (Nile tilapia) raised in biofloc tanks with different carbon sources for 10 weeks.
ParametersControlBFT + SMBFT + TF
Water temperature (°C)26.99 ± 0.2327.01 ± 0.1827.01 ± 0.11
Dissolved oxygen (mg L−1)6.97 ± 0.073 a5.58 ± 0.083 c6.31 ± 0.073 b
pH8.21 ± 0.057 a7.32 ± 0.075 c7.78 ± 0.054 b
Salinity (PPT)1.47 ± 0.61 b20.32 ± 11.21 a18.11 ± 13.13 a
Unionized ammonia (mg L−1)0.145 ± 0.016 a 0.052 ± 0.026 b0.072 ± 0.025 ab
Nitrite (mg L−1)0.256 ± 0.021 a0.076 ± 0.017 b0.136 ± 0.023 b
Nitrate (mg L−1)3.81 ± 0.95 b31.24 ± 4.62 a23.33 ± 4.31 a
Total suspended solids (mg L−1)31.3 ± 5.27 b351.7 ± 70.44 a314.6 ± 62.67 a
Biofloc volume (mL)0.84 ± 0.13 c18.47 ± 2.87 b28.94 ± 4.12 a
Note: Significant difference is indicated with different superscripts on the mean in the same row (p < 0.05).
Table 4. Growth performance of juvenile O. niloticus (Nile tilapia) cultured in biofloc tanks with different carbon sources for 10 weeks.
ParametersControlBFT + SMBFT + TF
Weight gain (%)66.03 ± 2.82 c87.15 ± 1.92 b98.61 ± 3.71 a
Feed intake (g kg fish−1)1001.21 ± 36.03 a867.37 ± 23.17 b869.31 ± 25.21 b
Feed conversion ratio (FCR)2.35 ± 0.16 a1.79 ± 0.06 b1.69 ± 0.07 c
Survival (%)95.83 ± 1.5497.65 ± 1.0299.01 ± 0.32
Note: Significant difference is indicated with different superscripts on the mean in the same row (p < 0.05).
Table 5. Hematological parameters of juvenile O. niloticus (Nile tilapia) cultured in biofloc tanks with different carbon sources for 10 weeks.
Hematological ParametersControlBFT + SMBFT + TF
RBCs (106/μL)1.32 ± 0.121.31 ± 0.111.33 ± 0.21
WBCs (103/μL)27.41 ± 1.15 c32.21 ± 1.23 b37.43 ± 1.51 a
Hematocrit (%)27.21 ± 0.39 c33.11 ± 0.42 b35.13 ± 0.46 a
Haemoglobin (%)7.88 ± 0.32 c9.03 ± 0.21 b11.54 ± 0.25 a
Lymphocytes (%)30.65 ± 0.84 c34.52 ± 0.21 b37.32 ± 0.24 a
Monocytes (%)4.00 ± 0.214.88 ± 0.334.68 ± 0.31
Neutrophils (%)62.49 ± 0.82 a58.62 ± 0.61 b56.16 ± 0.32 c
Note: Significant difference is indicated with different superscripts on the mean in the same row (p < 0.05).
Table 6. Non-specific immune parameters of juvenile O. niloticus (Nile tilapia) cultured in biofloc tanks with different carbon sources for 10 weeks.
ParametersControlBFT + SMBFT + TF
Globulin (g × dL−1)1.45 ± 0.07 b1.86 ± 0.04 a1.93 ± 0.04 a
Total protein (g × dL−1)3.57 ± 0.05 c3.84 ± 0.06 b4.18 ± 0.08 a
Albumin (g × dL−1)2.25 ± 0.02 c2.31 ± 0.04 b2.42 ± 0.04 a
Lysozyme (U × mg−1 protein)24.00 ± 2.01 c28.65 ± 1.42 b31.43 ± 1.38 a
Immunoglobulin (mg × dL−1)2.25 ± 0.16 c3.02 ± 0.06 b3.19 ± 0.08 a
ACH50 (U × mL−1)18.85 ± 1.71 c30.28 ± 1.03 b37.12 ± 1.65 a
Note: Significant difference is indicated with different superscripts on the mean in the same row (p < 0.05).
Disclaimer/Publisher’s Note: The statements, opinions and data contained in all publications are solely those of the individual author(s) and contributor(s) and not of MDPI and/or the editor(s). MDPI and/or the editor(s) disclaim responsibility for any injury to people or property resulting from any ideas, methods, instructions or products referred to in the content.

