Article

Comparison of Artificial Feed and Natural Food by the Growth and Blood Biochemistry in Chinese Sturgeon Acipenser sinensis

1
International Research Center for Marine Biosciences, College of Fisheries and Life Science at Shanghai Ocean University, Ministry of Science and Technology, Shanghai 200090, China
2
Key Laboratory of Exploration and Utilization of Aquatic Genetic Resources, Ministry of Education, Shanghai Ocean University, Shanghai 200090, China
3
Shanghai Aquatic Wildlife Research Center, Shanghai 200092, China
4
Key Laboratory of East China Sea & Oceanic Fishery Resources Exploitation and Utilization, Scientific Observing and Experimental Station of Fisheries Resources and Environment of East China Sea and Yangtze Estuary, East China Sea Fisheries Research Institute, Chinese Academy of Fishery Sciences, Shanghai 200090, China
*
Authors to whom correspondence should be addressed.
These authors contributed equally to this work.
Fishes 2023, 8(1), 45; https://doi.org/10.3390/fishes8010045
Submission received: 4 December 2022 / Revised: 6 January 2023 / Accepted: 7 January 2023 / Published: 10 January 2023
(This article belongs to the Special Issue Fish Nutrition and Physiology)

Abstract

:
As an endangered animal species, the Chinese sturgeon (Acipenser sinensis) has been artificially cultured during recent years. In the present experiment, the performance of a common formulated feed and a mixed natural feed on the growth and blood physiology of Chinese sturgeon were compared during one year of indoor culture. In terms of specific growth rate, the formulated diet group showed a higher value (4.2%) compared with the natural food group (−1.8%) during one year of indoor culture. Alanine aminotransferase activities of the sturgeons in formulated diet group was significantly higher than that in the natural food group throughout whole experiment period (p < 0.05). The total protein albumin, albumin and globulin contents of the natural food group were significantly higher than that of the formulated diet group in February and May (p < 0.05). The C-reactive protein contents of the formulated diet group were significantly higher than that of natural food group in May and August (p < 0.05). The activities of total cholesterol, high-density cholesterol, and low-density cholesterol were significantly higher in the natural food group than those in the formulated diet group (p < 0.05). The activities of triglycerides were significantly higher in the natural food group than those in the formulated diet group in February and May (p < 0.05). Almost half of the biochemical indicators examined show significant seasonal fluctuations, indicating that seasons have a substantial impact on the Chinese sturgeon. Overall, these results indicate that natural food exerted a positive impact on physiological indicators compared to the formulated diet.

Graphical Abstract

1. Introduction

The Chinese sturgeon (Acipenser sinensis) was a large anadromous species in China [1]. In the 1970s, the Yangtze River had more than 10,000 Chinese sturgeon breeding populations, but by the 1980s, that number had decreased to 2176, then to 363 in 2000, and afterward to 57 in 2010 [2,3]. The Chinese sturgeon has been now classified as critically endangered by the International Union for Conservation of Nature (IUCN), and listed in Appendix II of the Convention on International Trade in Endangered Species of Wild Fauna and Flora (CITES) [4]. In 2012, a full captive breeding experiment of Chinese sturgeon was successfully conducted [5]. As the scale of artificial conservation of Chinese sturgeon continues to expand, the quantity and quality of natural feed cannot be guaranteed, and artificial formulated diet must be used. Healthy aquaculture requires a supply of feeds that meet nutritional requirements. The Chinese sturgeon is an omnivorous fish that feeds mainly on pelagic and demersal fish, followed by crustaceans and mollusks [6].
Faced with the absence of specific data on the nutritional requirements and utilization of Chinese sturgeon [7,8,9], more attention is required through research for the management and conservation. Artificial feeds for the sturgeon family were used in the captive breeding of Chinese sturgeon, but they cannot fully meet their specific physiological needs. The main sturgeon feeds on the market were Tianbang brand, Shengsuo brand, Jianma brand. Tianbang brand sturgeon feed is more in compliance with the nutritional requirements of Chinese sturgeon. Some studies have demonstrated that unbalanced feed nutrition can directly lead to the development of nutritional diseases such as fatty liver, enteritis, and nutritional anemia [10,11,12]. As feed, chilled fish can accelerate the growth rate of aquatic animals [13,14]. Natural foods are attractive, palatable, and easily digested with balanced nutrition [15]. In a previous study, the SGR values of juvenile Chinese sturgeon fed with formulated diets were significantly lower than those fed with water earthworms [16]. Systematic studies are needed for optimizing the nutritional requirements and main ingredients of formulated diets for Chinese sturgeon.
Available sturgeon diets provide the normal survival of most sturgeon, but there were variances in the energy, protein, lipid, carbohydrate, vitamin, and mineral requirements and utilizations of different sturgeons. The optimization of dietary requirement of Chinese sturgeon was an urgent demand from aquaculture departments. Growth performance and feed utilization have been used as a useful tool for aquaculture species feed formulation and feed optimization [17].
Under defined environmental conditions and treatments, fish blood can provide a comprehensive picture of the endocrine, immune, reproductive, and genetic functions of fish [18,19]. Blood collection was the common sample collection method for health monitoring of captive-bred Chinese sturgeon, which has the advantage of rapid, efficient, and minimally invasive [20]. In recent years, blood parameters have been often measured so as to determine the health status in many fish [21]. Li et al. (2017) found that weight gain and special growth rate of the hybrid Siniperca chuatsi fed live baits were significantly higher than those of fish fed artificial feeds [22]. However, the special Chinese sturgeon feeds have not been developed yet in the domestic markets, whereas no investigations on the effects of formulated feed on growth, lipid metabolism, and immune function of Chinese sturgeons have been documented. Studies on the effects of seasonal changes on Chinese sturgeons are still scarce, with only a few reports on the reduction or cessation of feeding by Chinese sturgeons at high temperatures. Male Chinese sturgeon showed negative specific growth rates from spring to fall, whereas females had positive specific growth rates [23]. In the present experiment, the effects of a common formulated feed and a mixed natural feed on the blood physiology and effects of seasonal changes on behavioral and morphological aspects of Chinese sturgeon were compared. Our work provides scientific data to support the development of high-quality formulated diets that meet the indoor aquaculture of Chinese sturgeon.

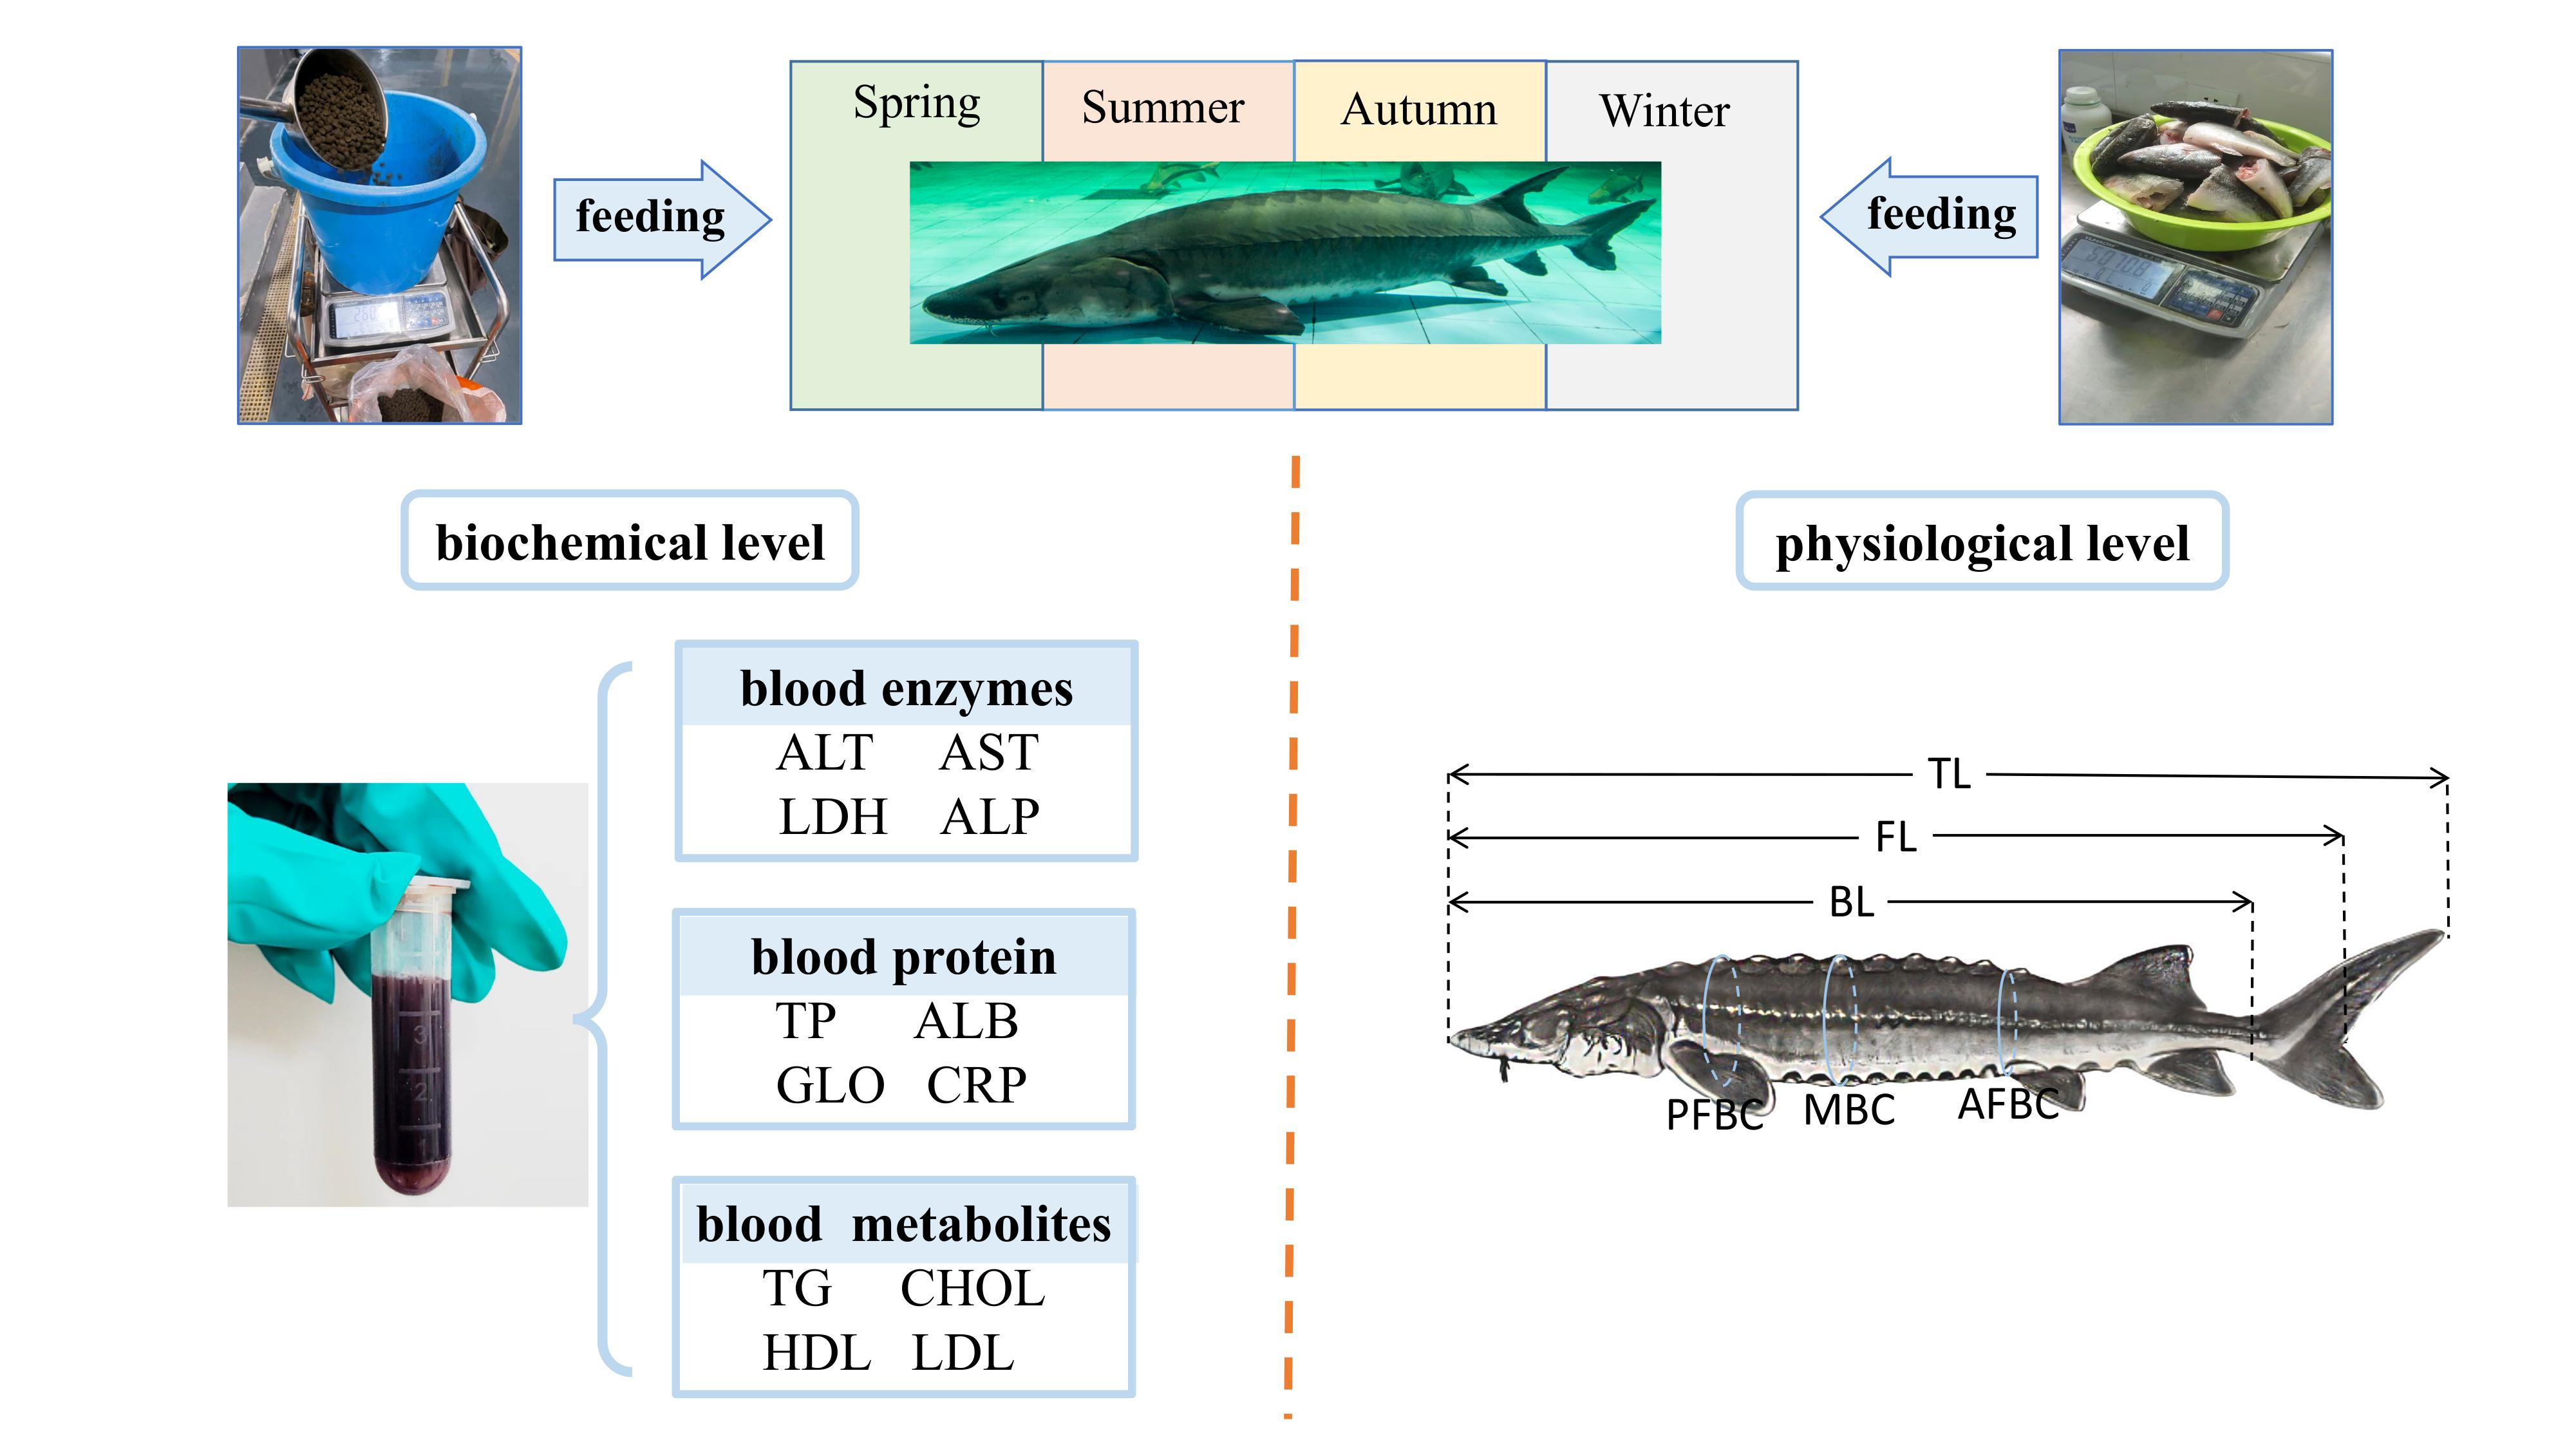
2. Materials and Methods

2.1. Experimental Fish

The experimental site located in the Shanghai Aquatic Wildlife Conservation and Research Center (Shanghai, China). Sturgeons were raised in four concrete ponds (long: 8 m, wide: 8 m, deep: 1.8 m), each contained 14 fish. As an endangered animal species, experimental samples are restricted. The Chinese sturgeon is a large fish, requiring a large amount of bait. The natural food is too expensive for the one-year experimental cycle, so the number of fish in natural food group was less. A total of 56 numbers of fish were randomly stocked in 2 treatments, with 14 fish in a natural food group and 42 fish in a formulated diet group. All experimental sturgeons were captive-bred offspring (F1) and above 15 years old. The experimental fish were tagged by PIT RF markers, in order to track their growth and physiology. The experimental period lasted one year, according to the seasonal changes of the aquaculture site, spring (February to April), summer (May to July), fall (August to October), and winter (November to January), and all experimental fish were sampled in February, May, August, and November.

2.2. Feeding Management

Before the start of the experiment, an area in the pond was selected as a fixed feeding place. Filtered groundwater continuously flowed into and out of the tank, and oxygen was supplied using in situ-water oxygenator (NR-A212 type, Ranrong Shanghai, China). Water temperature and dissolved oxygen were measured with HQ30d portable dissolved oxygen meter (Hach, Loveland, CO, USA). Ammonia-N and nitrite were measured with Nova 60 and the accompanying reagent kit (Merck, Darmstadt, Germany). Water conditions were maintained as follows, temperature: 20.7 ± 4.18 °C, dissolved oxygen: 7.88 ± 0.48 mg/L. The annual ammonia-N content (0.01–0.15) mg/L and nitrite content (0.01–0.09) mg/L meet the “GB 11607-1989 Fishery Water Quality Standards” in China. During the feeding trial, the fish were under natural photoperiod conditions.

2.3. Experimental Diet

The experiment was started in January. Chinese sturgeons were fed at regular intervals, three times a day at 7:00, 13:00 and 19:00 at a rate of 1% of their body weight. Feeding was dynamically adjusted according to the amount of food intake. Crucian carp (Carassius auratus) and largemouth bass (Micropterus salmoides) were used as natural food and sterilized with 3% brine for 15–20 min before feeding. The whole crucian carp (50–150 g) and small pieces of largemouth bass (250–500 g). Natural food was fed to sturgeons in the natural food treatment, and the remaining fresh bait was collected after 30 min. The sturgeons were fed with equivalent formulated sturgeon diet by Ningbo Tianbang Feed Co., Ltd. (Zhejiang, China), in which the crude protein was not less than 40%. Formulated diet were fed to sturgeons in the formulated diet treatment, and the remaining formulated diet was fished out after 30 min (Table 1).
Main ingredients of formula diet: Fish meal; Soya bean meal; Wheat flour; Fish oil; Vitamin premix; Mineral premix; Soybean phospholipid oil; phosphate etc. The contents and concentration are not disclosed as it contains commercially relevant information.
Muscle composition of natural foods (by wet weight); the composition of formulated diet (dry matter) [24,25].

2.4. Blood Sample Collection and Pre-Treatment

To avoid effects of feeding on blood physiological and biochemical indicators, experimental fish were stopped feeding 24 h before sample collection. Capture of Chinese sturgeons requires tools such as snares, drag nets, and stretchers. In order to reduce the stress, the capture of Chinese sturgeon was controlled within a short time out of water. Sturgeons were captured and placed on a stretcher, with their ventral side upward, head submerged in water to ensure normal breathing. Blood samples were collected using a 10-mL unheparinized syringe from the caudal vein. Blood samples were collected from each fish and immediately packed into 2 mL centrifuge tubes and allowed to clot at room temperature for 4 h. Blood samples were clotted at 4 °C and centrifuged at 4000× g for 10 min using a benchtop microfuge (Microfuge 22R, Backman, CA, USA). The supernatant was transferred to centrifuge tubes and sealed. All treated serum samples were stored at 2–8 °C under refrigeration. Within 24 h, biochemical indexes were detected.

2.5. Serum Biochemical Index Test

Routine biochemical indicators, including alanine aminotransferase (ALT, IFCC International Federation of Clinical Chemistry rate method), aspartate aminotransferase (AST, IFCC rate method), lactate dehydrogenase (LDH, IFCC rate method), alkaline phosphatase (ALP, AMP 2-Amino-2-Methyl-1-Propanol buffer method), total protein (TP, biuret method), albumin (ALB, bromocresol green method), globulin (GLO, immunoturbidimetric method), triglycerides (TG, GPO-PAP glycerol phosphate oxidase-p-aminophenazone method), cholesterol (CHOL, COD-PAP method), high-density lipoprotein cholesterol (HDL, direct method), low-density lipoprotein cholesterol (LDL, direct method), and C-reactive protein (CRP, immunoturbidimetric method) contents in serum, were determined using Rittal Selectra E fully automated biochemical analyzer (Vital Scientific, Dieren, Netherlands) under 37 °C. Calibration standards and quality control products were Randox reagents (Randox Laboratories Ltd. Ardmore, Crumlin, UK) and test kits by Shanghai Deacon Biotechnology Co., Ltd. (Shanghai, China).

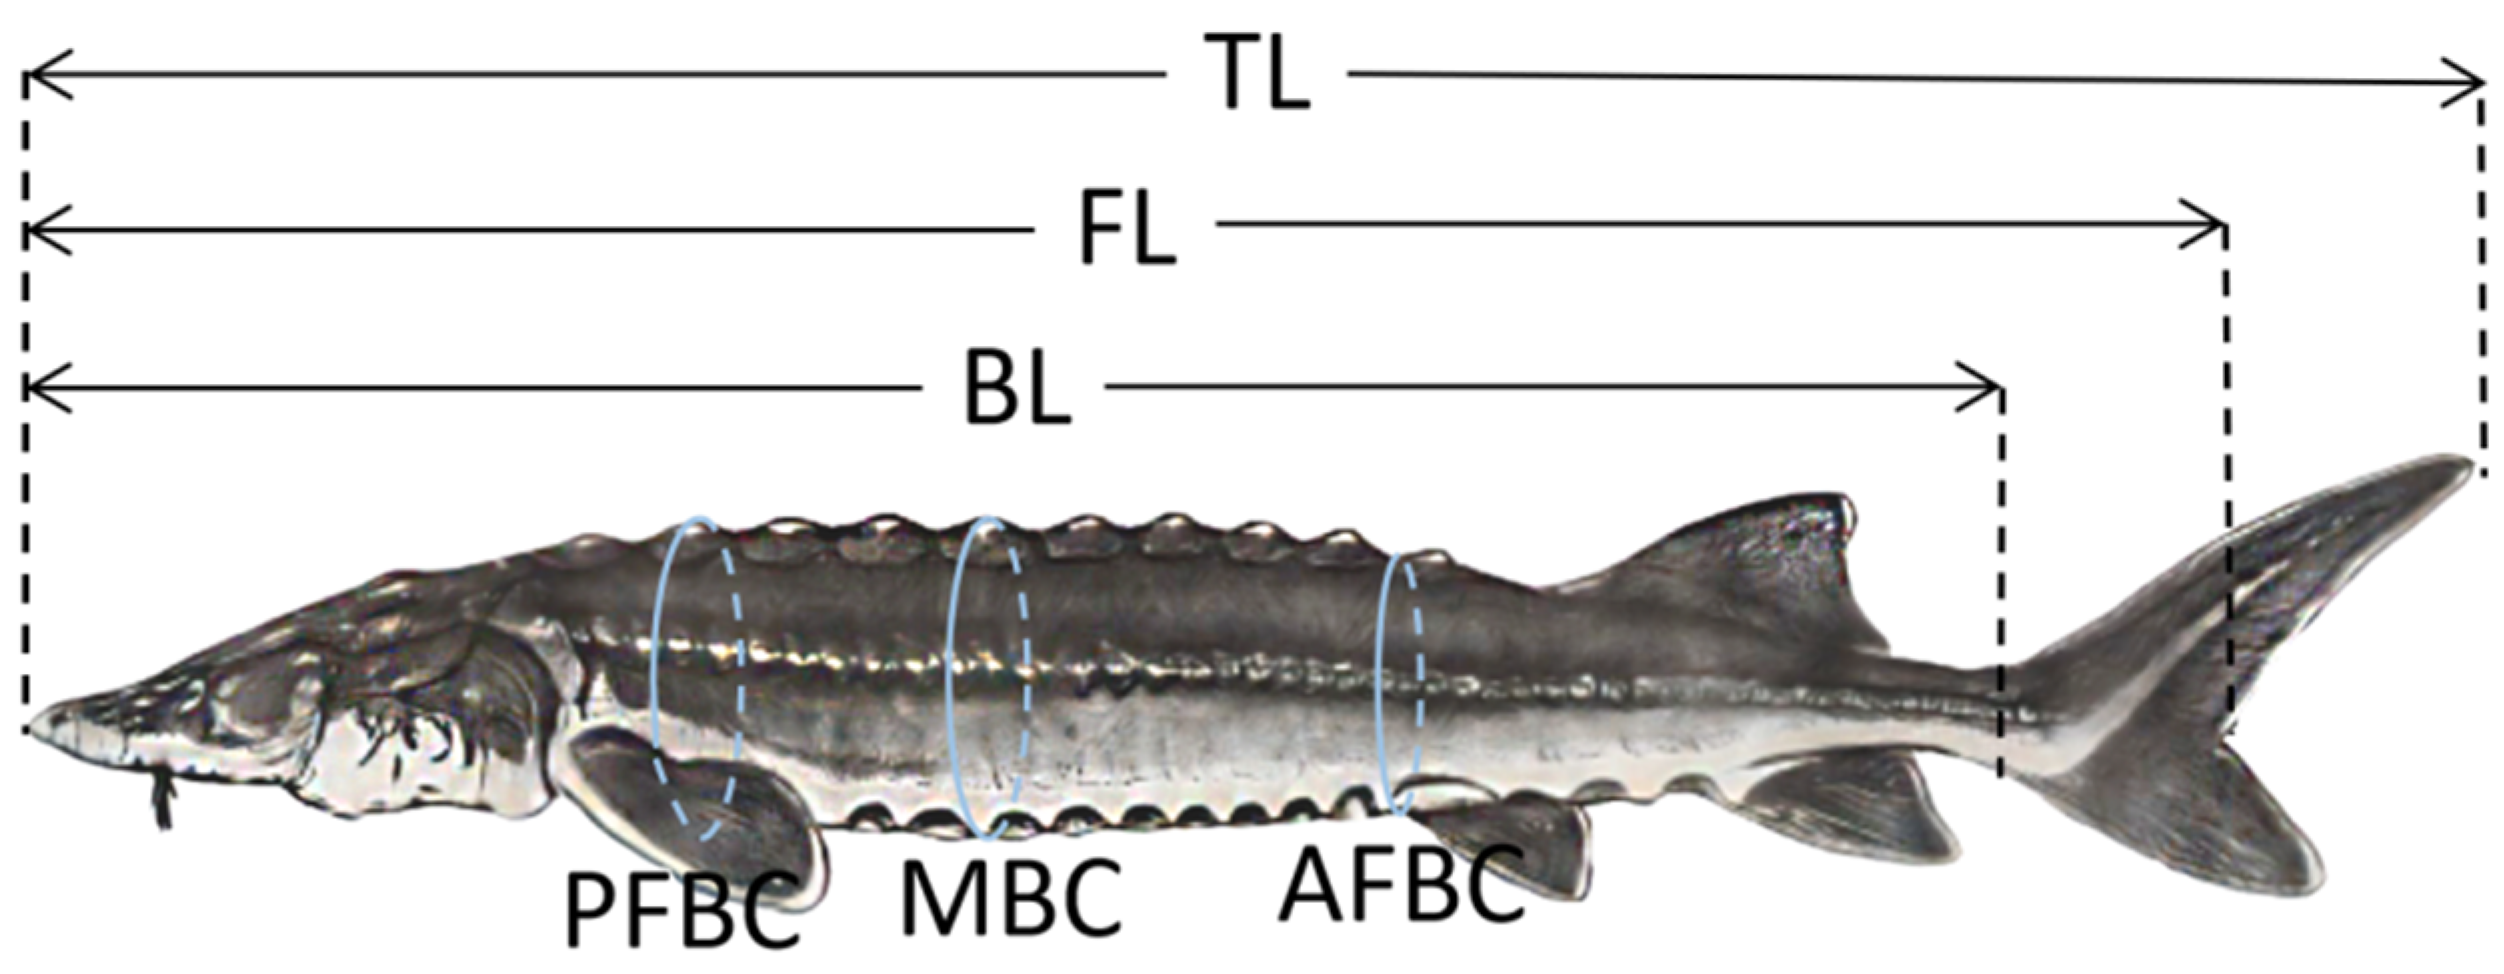
2.6. Growth Performance

During the experimental period, the experimental fish were examined for growth each season, and body weight and growth-related indexes such as total length (TL), fork length (FL), body length (BL), pectoral fin body circumference (PFBC), maximum body circumference (MBC), and abdominal fin body circumference (AFBC) (with a weight accuracy of 0.1 kg and a length accuracy of 1 cm) were measured (Figure 1). Specific growth rates (SGR) and total length specific growth rate (SGRL) were used to assess morphological growth information based on measurement data from February.
SGR (%) = 100 × (ln Wfinalln Winitial)/t
SGRL (%) = 100 × (ln TLfinalln TLinitial)/t
where, W is body weight (g), TL is total length (mm), and t is study duration (days).

2.7. Statistical Analysis

The data were expressed as mean ± standard deviation (SD). Normal distribution and homogeneity of variances were checked with the Levene’s test and Shapiro–Wilk test, respectively. Two-way ANOVA was applied to examine the significant differences due to the feed type, time, and their interaction. If there was a significant interaction between the feed type and season, t-test was used to analyze the effects of different feed types on Chinese sturgeon indexes in the same season, and a repeated measures ANOVA was used to detect same feed type the difference between each index in different seasons, followed by the post hoc Duncan’s multiple range test. Biplot of principal component analysis (PCA) was performed on the biochemical indicators by using Origin 2021. Statistical significance was determined at p < 0.05. All the data were statistically analyzed using SPSS Software (ver. 26.0) and data were plotted by Origin (ver. 2021) and GraphPad Prism (ver. 9.3), respectively.2.8. Ethics Statement
The study was conducted in accordance with the Declaration of Helsinki and approved by the Shanghai Ocean University Animal Care and Use Committee with approval number SHOU-2021-118.

3. Results

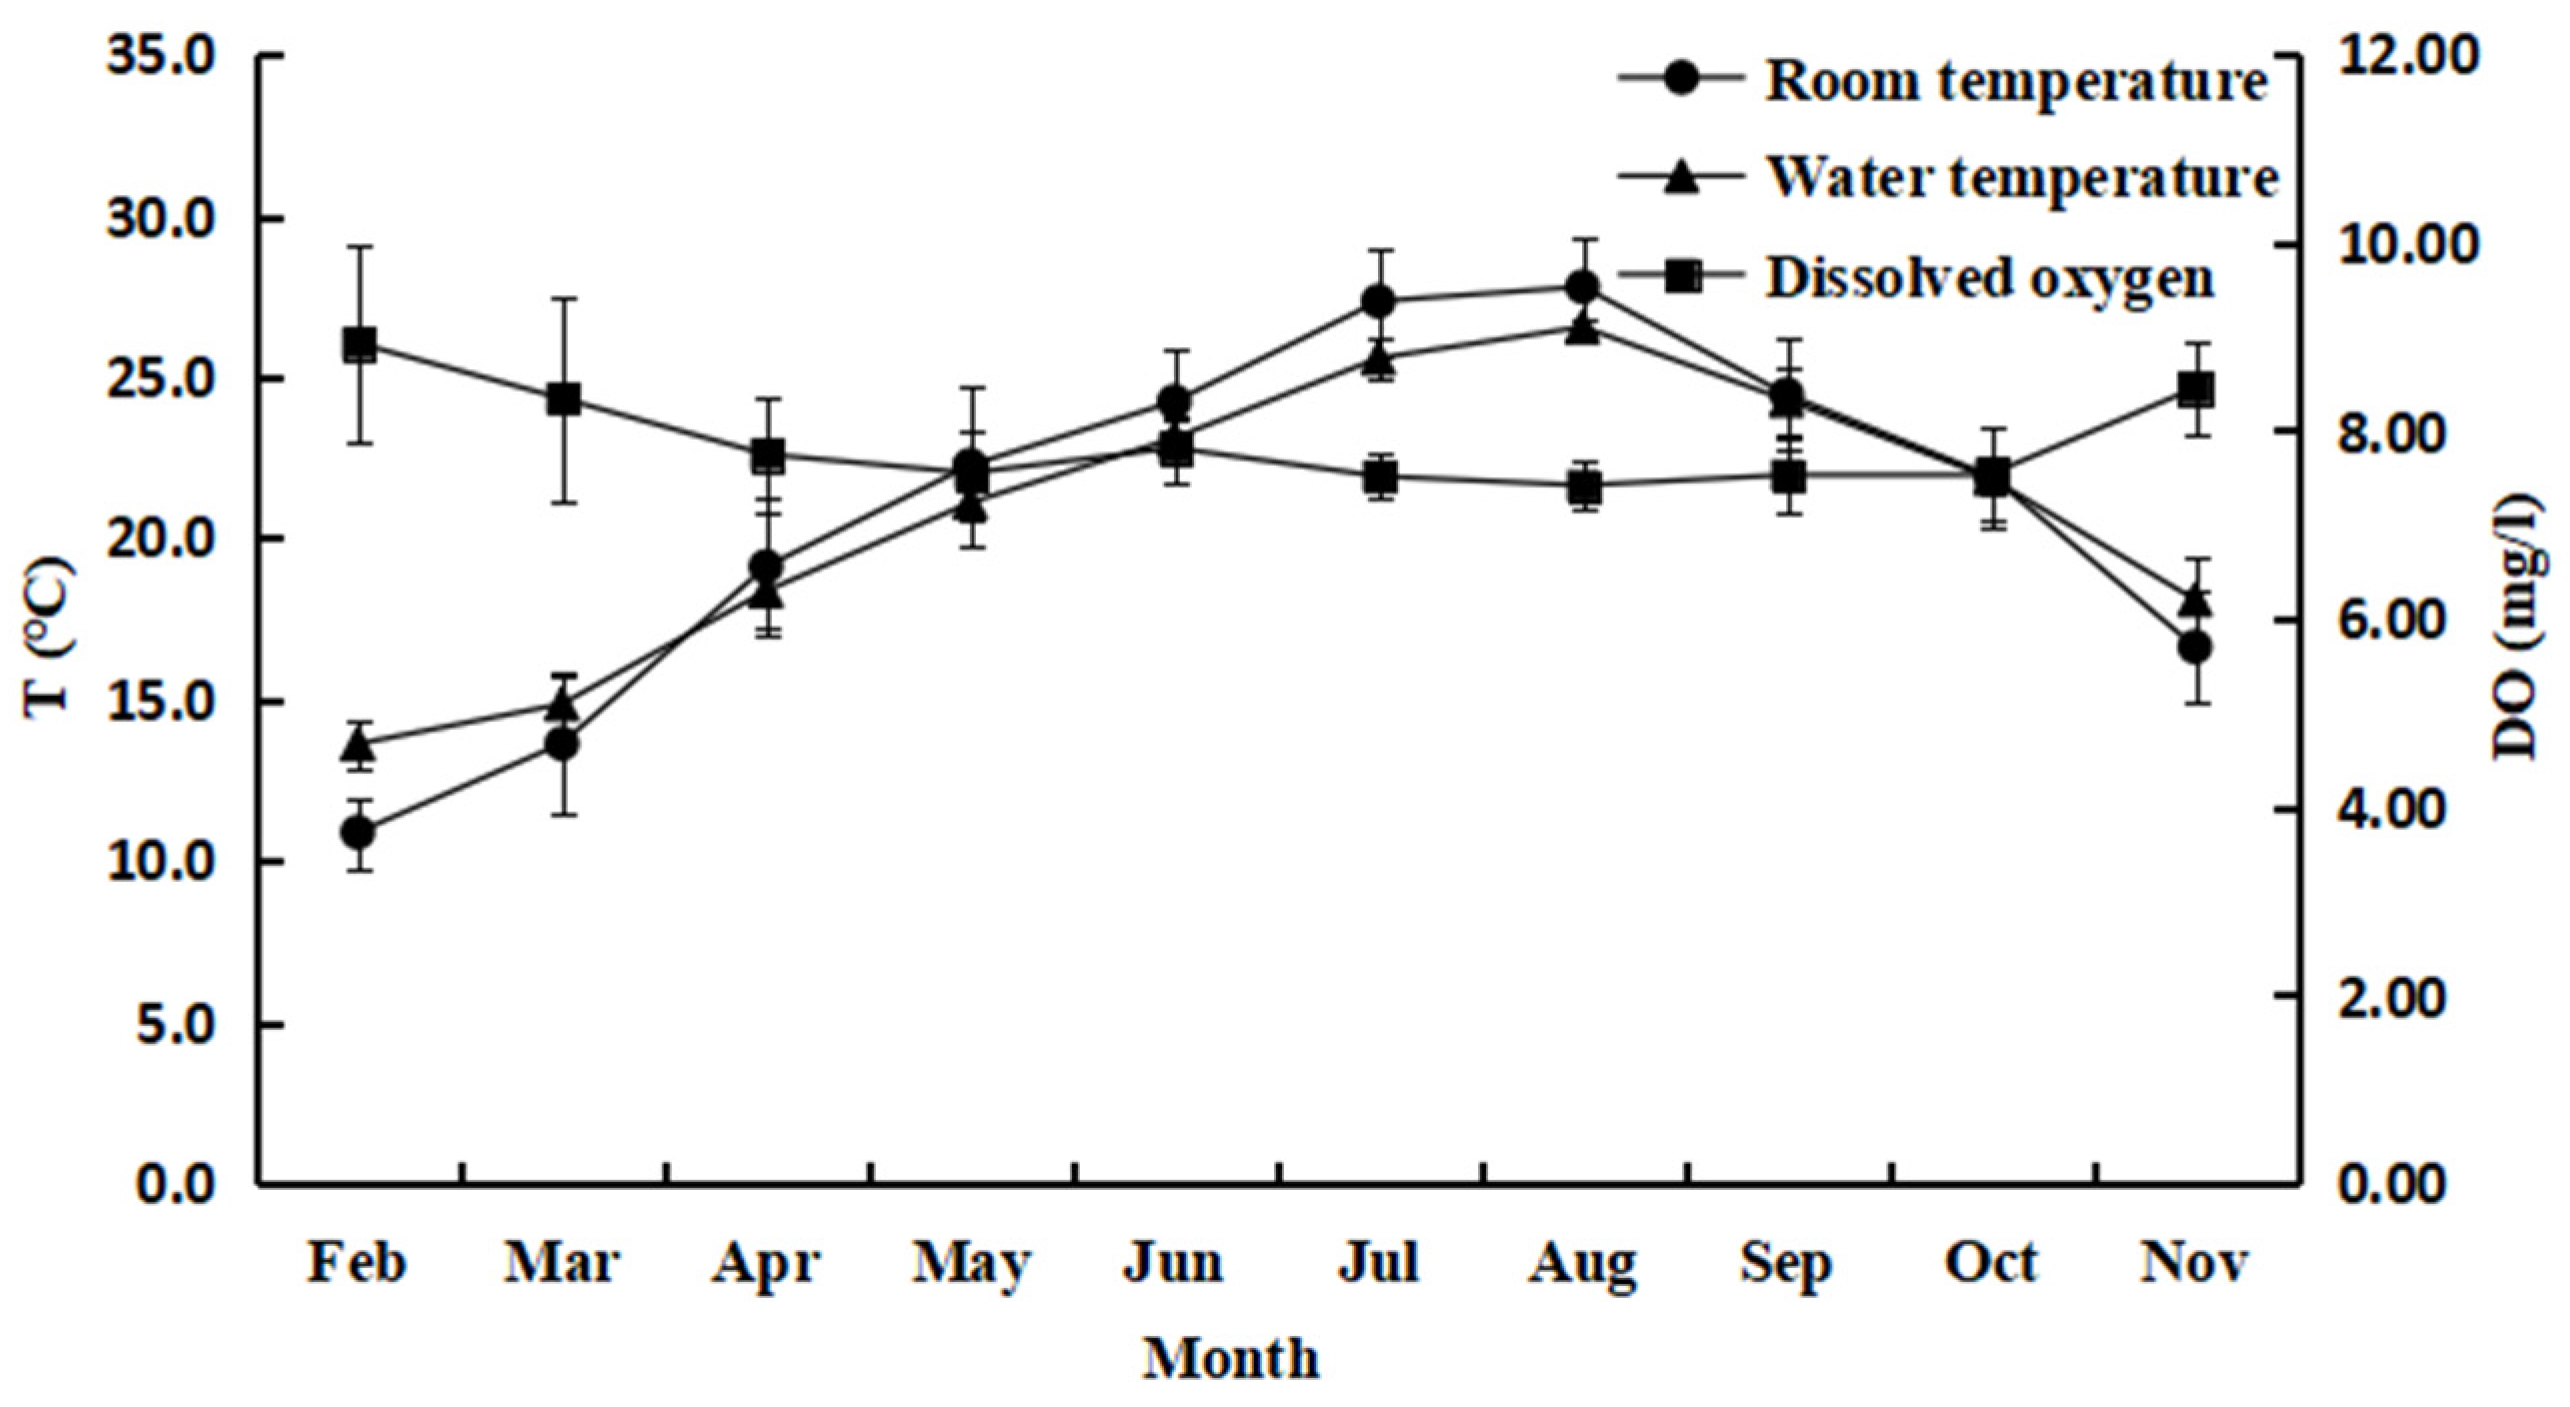
3.1. Changes in Water Quality

During the experiment, monthly mean water temperature ranged from 13.6 to 26.5 °C, and dissolved oxygen from 7.42 to 8.93 mg/L. In particular, the mean water temperature of the indoor tank increased slowly from February (13.6 °C) to reach a peak in August (26.5 °C), and then decreased to November (18.1 °C) (Figure 2).

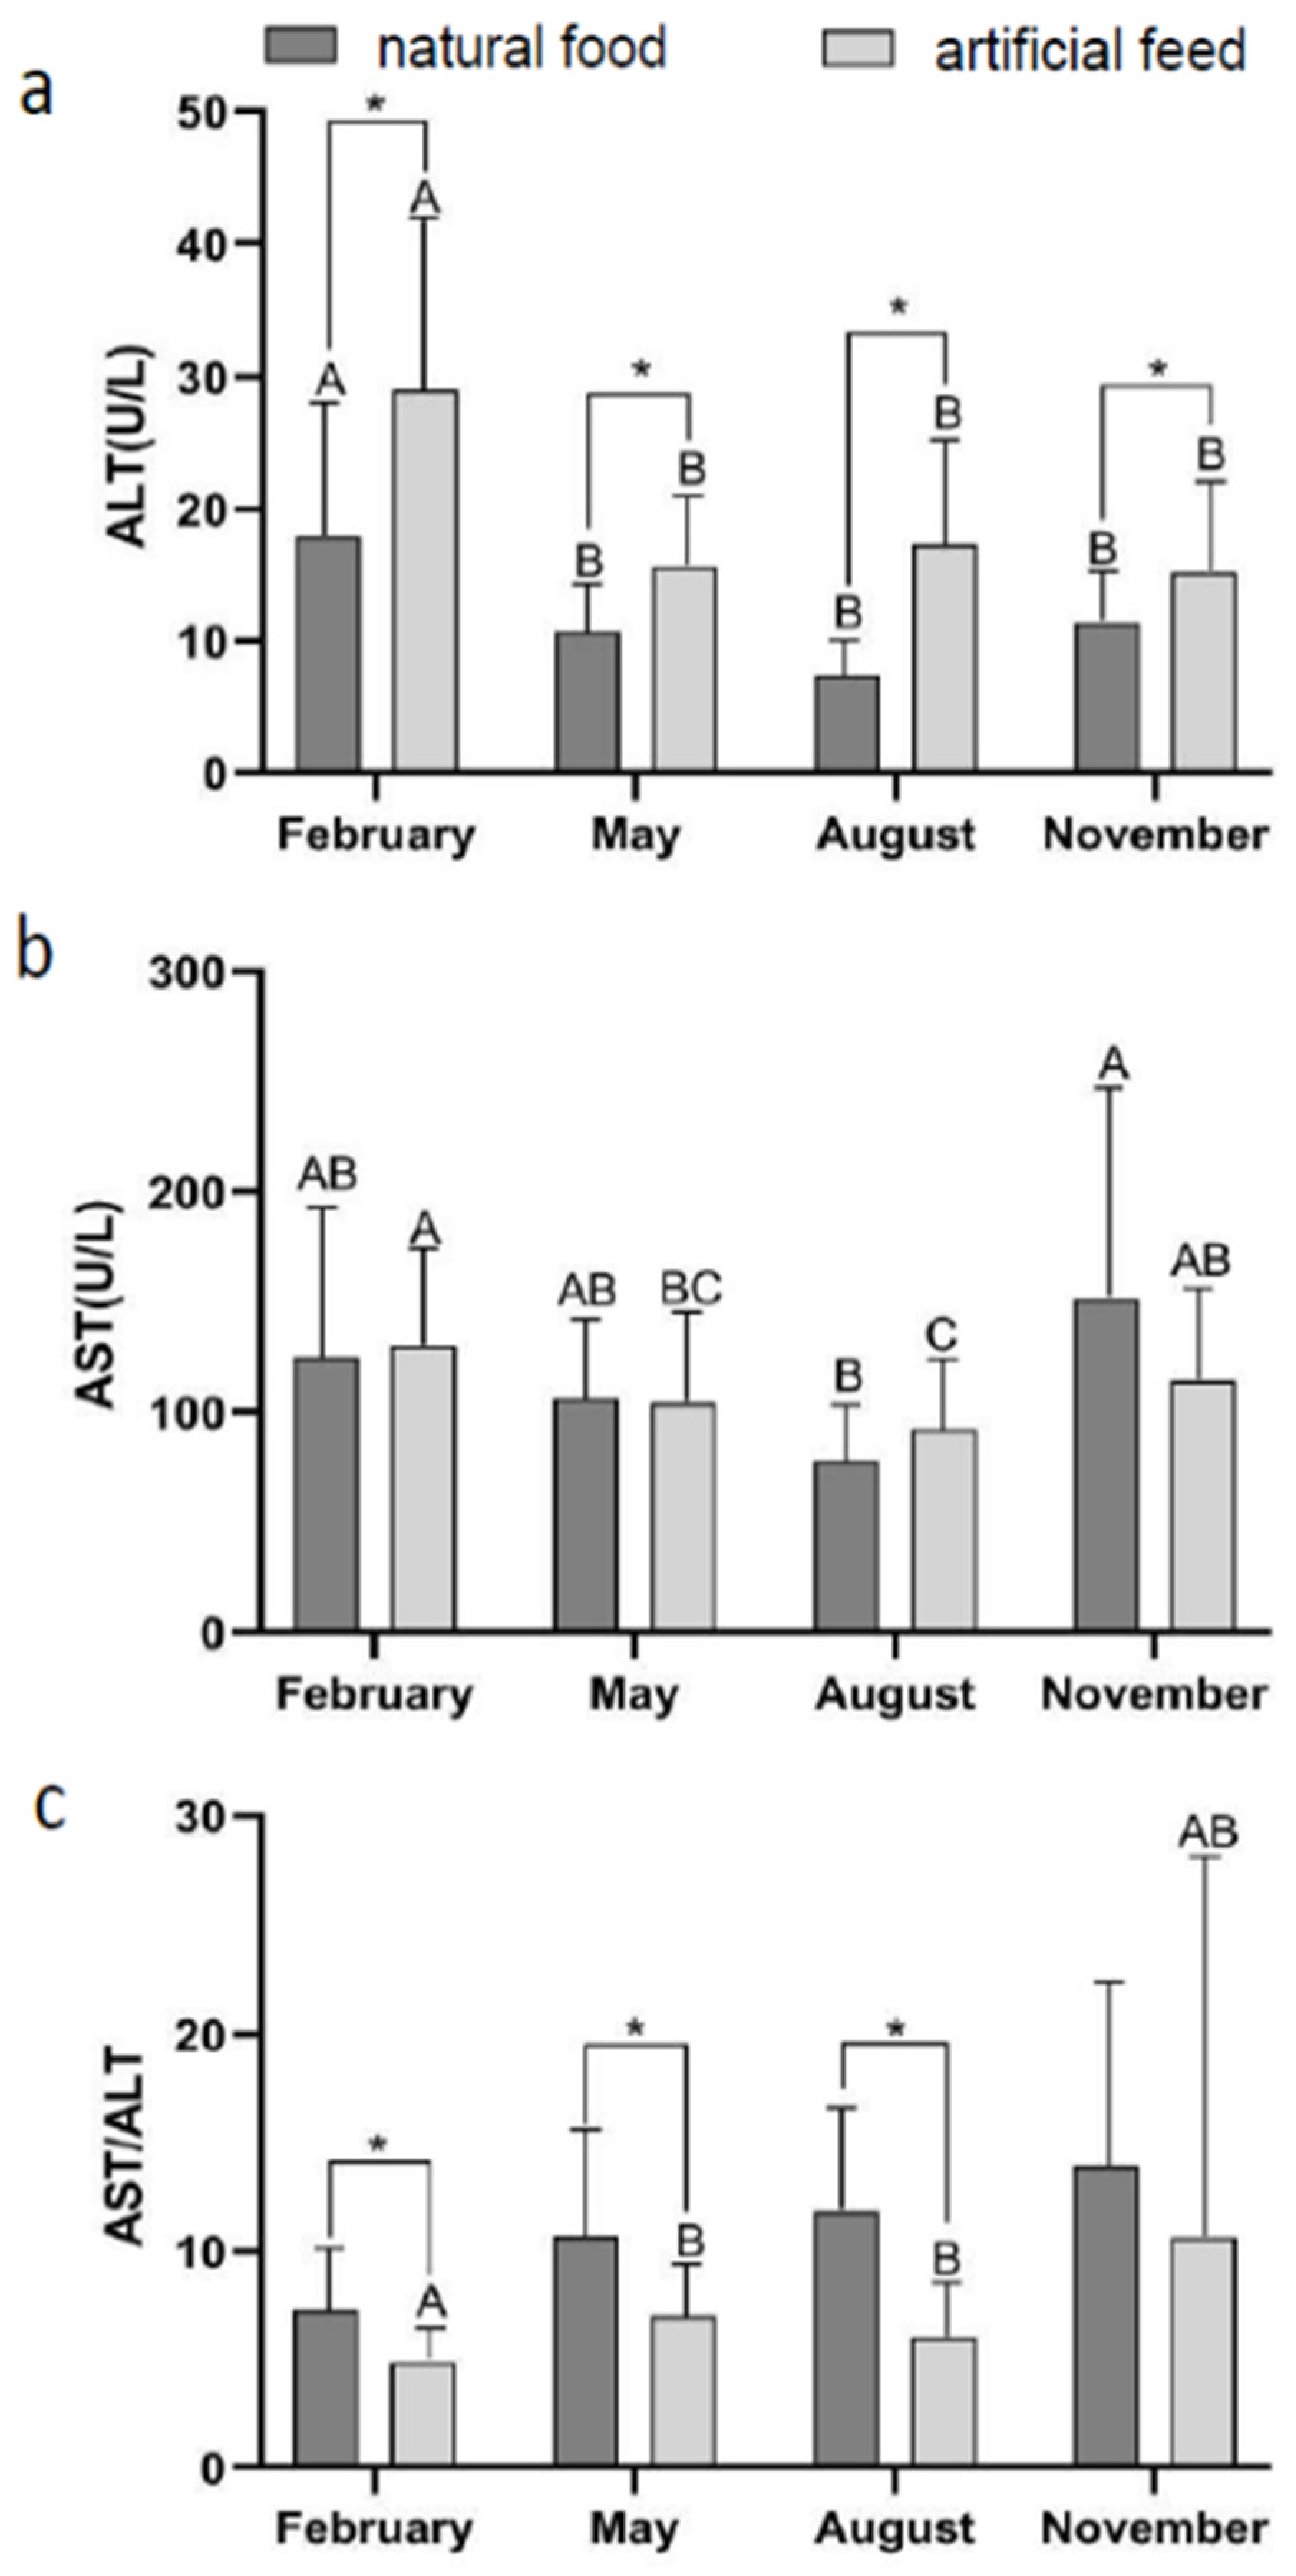
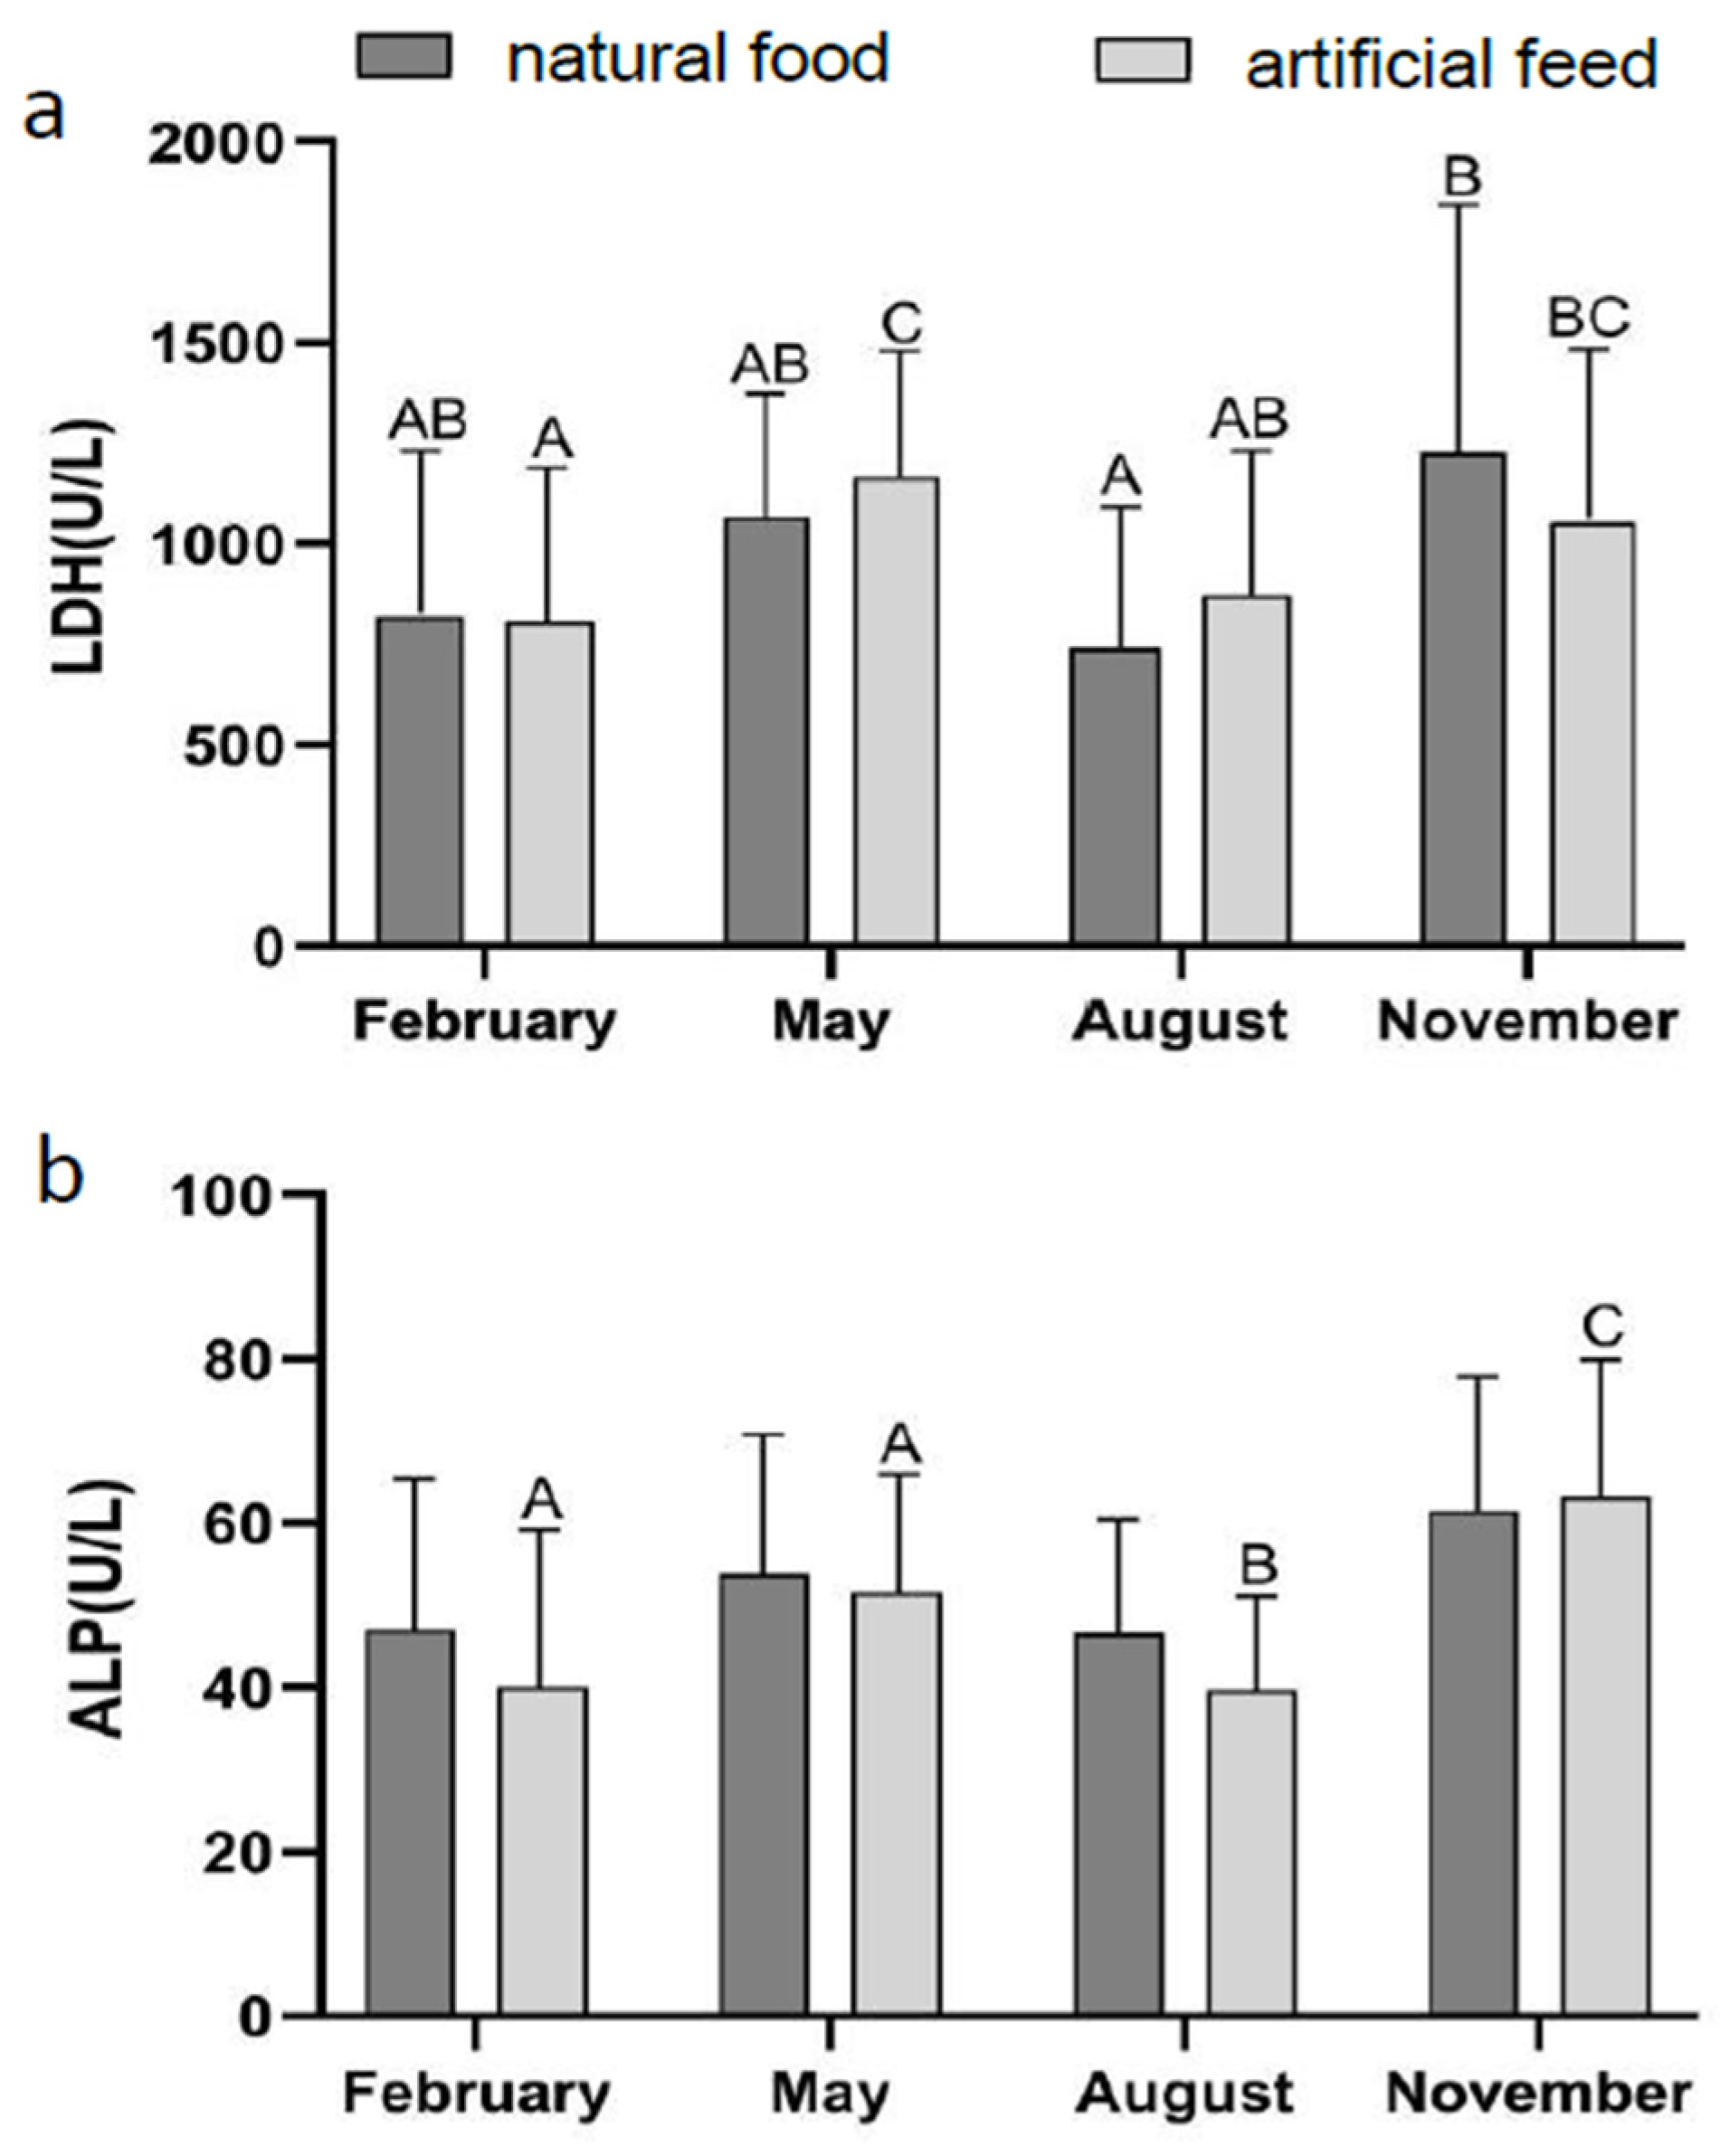
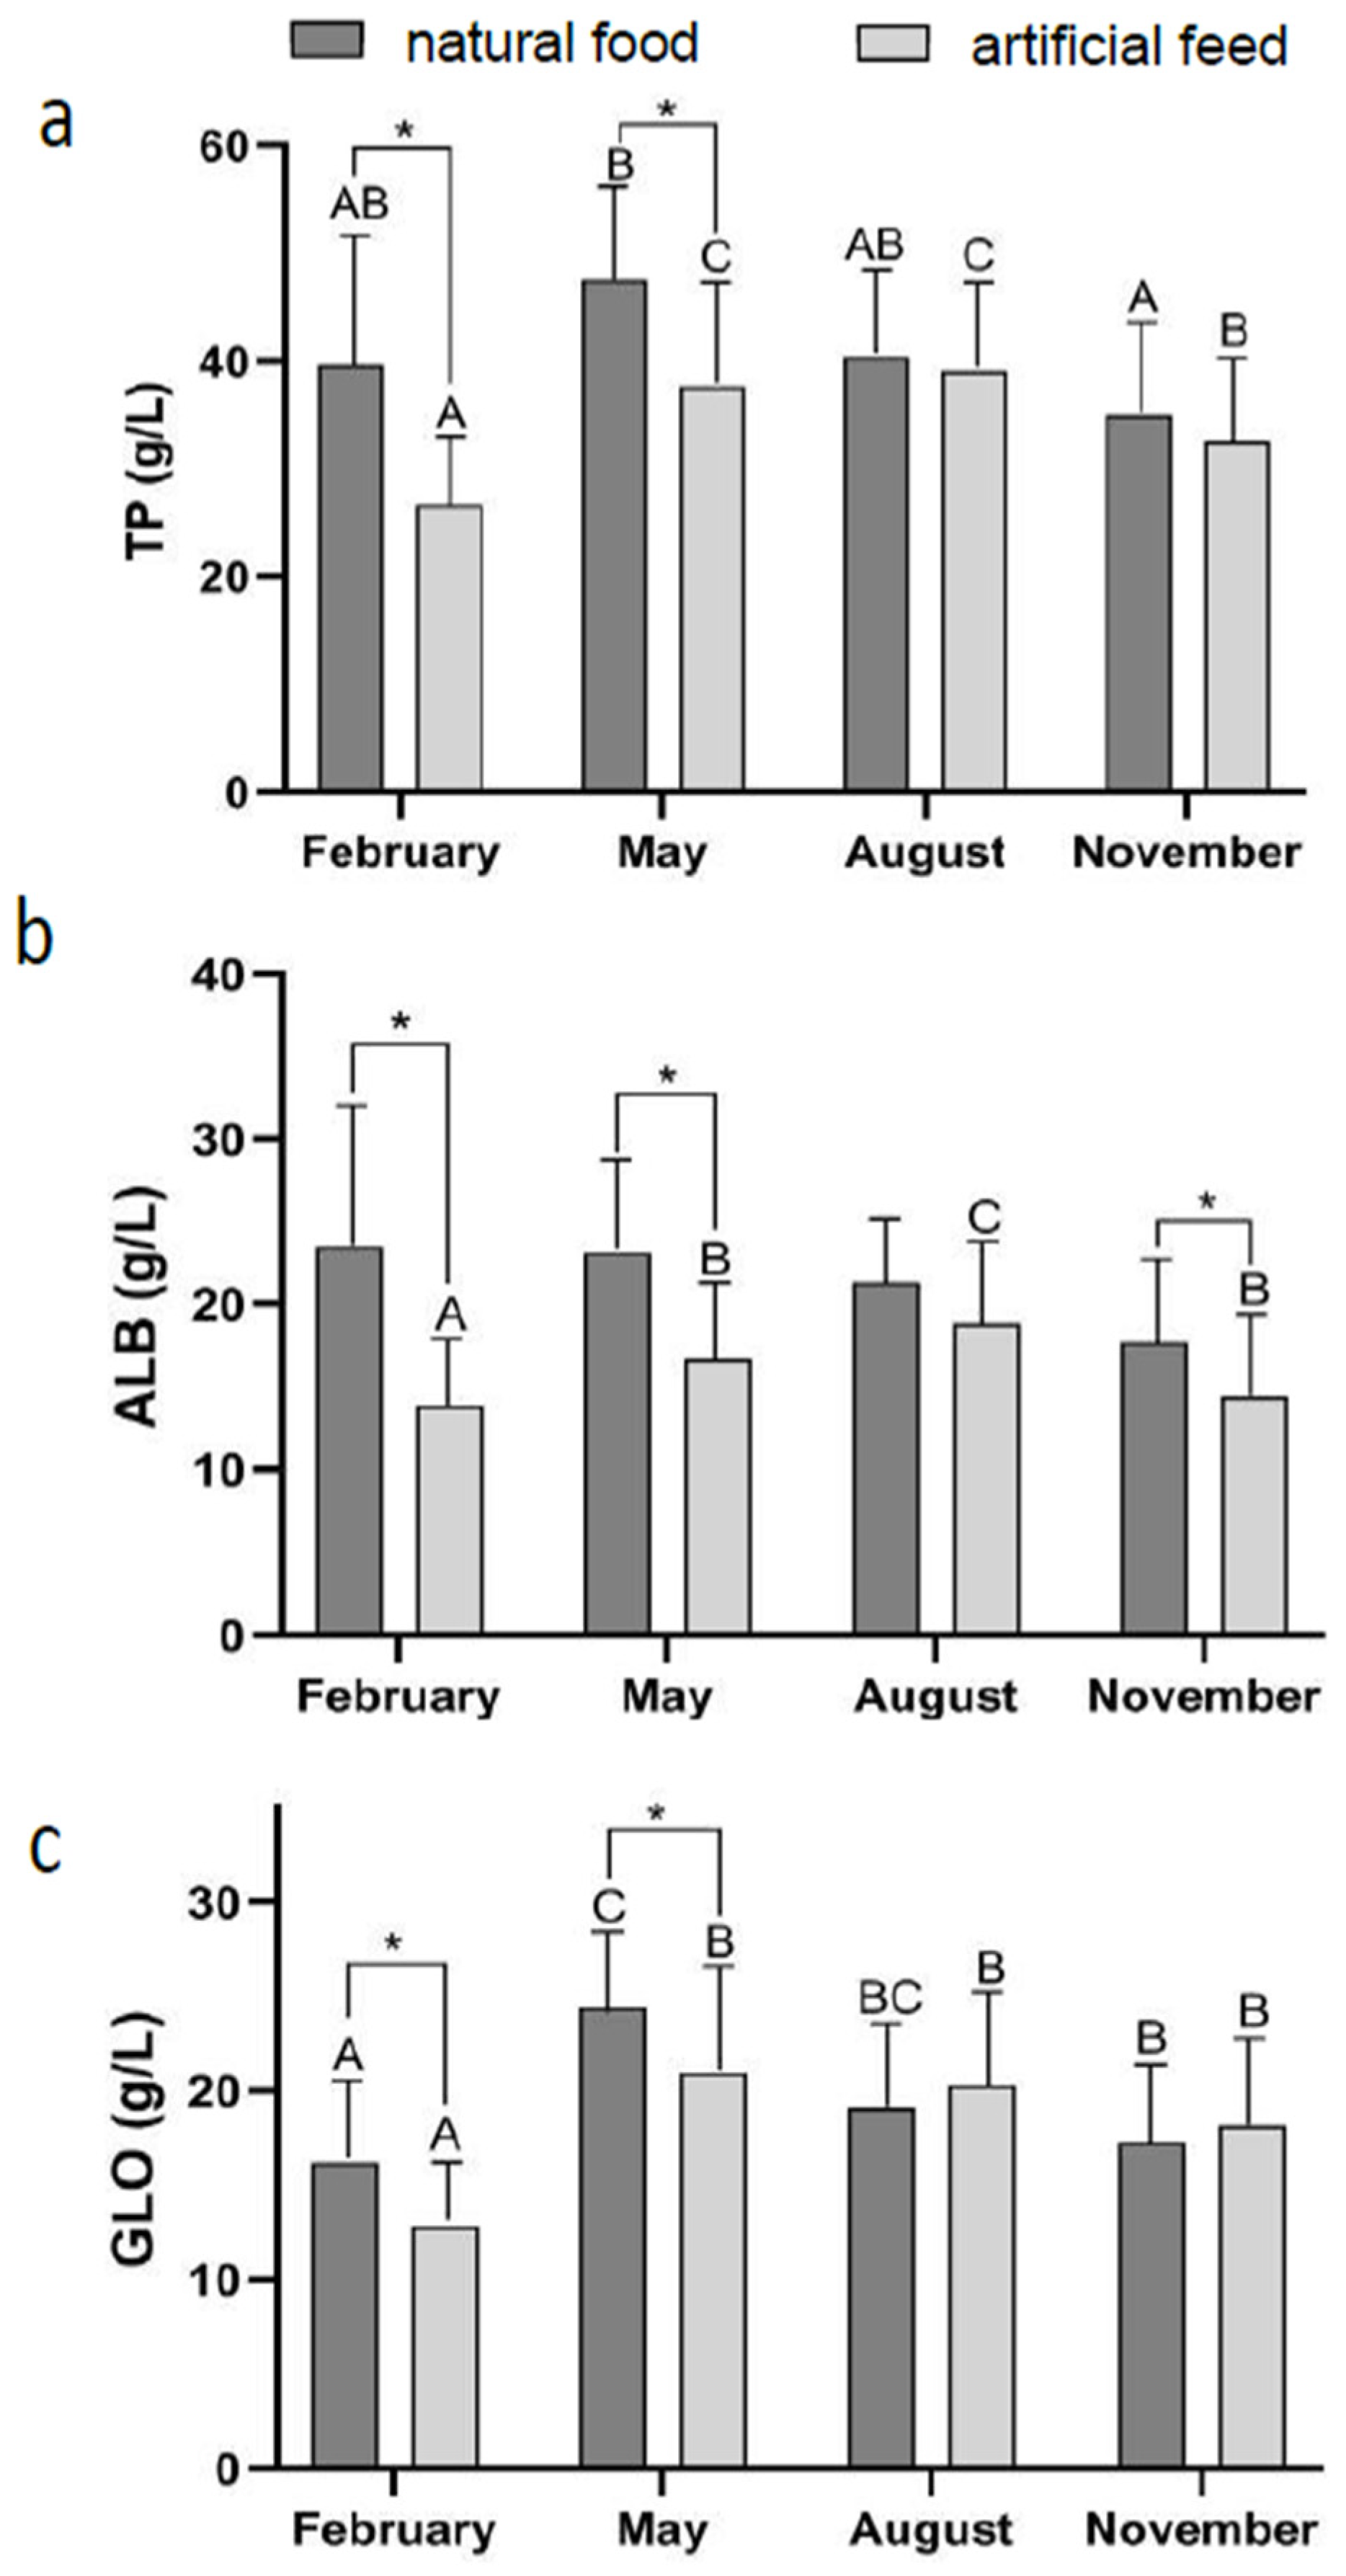
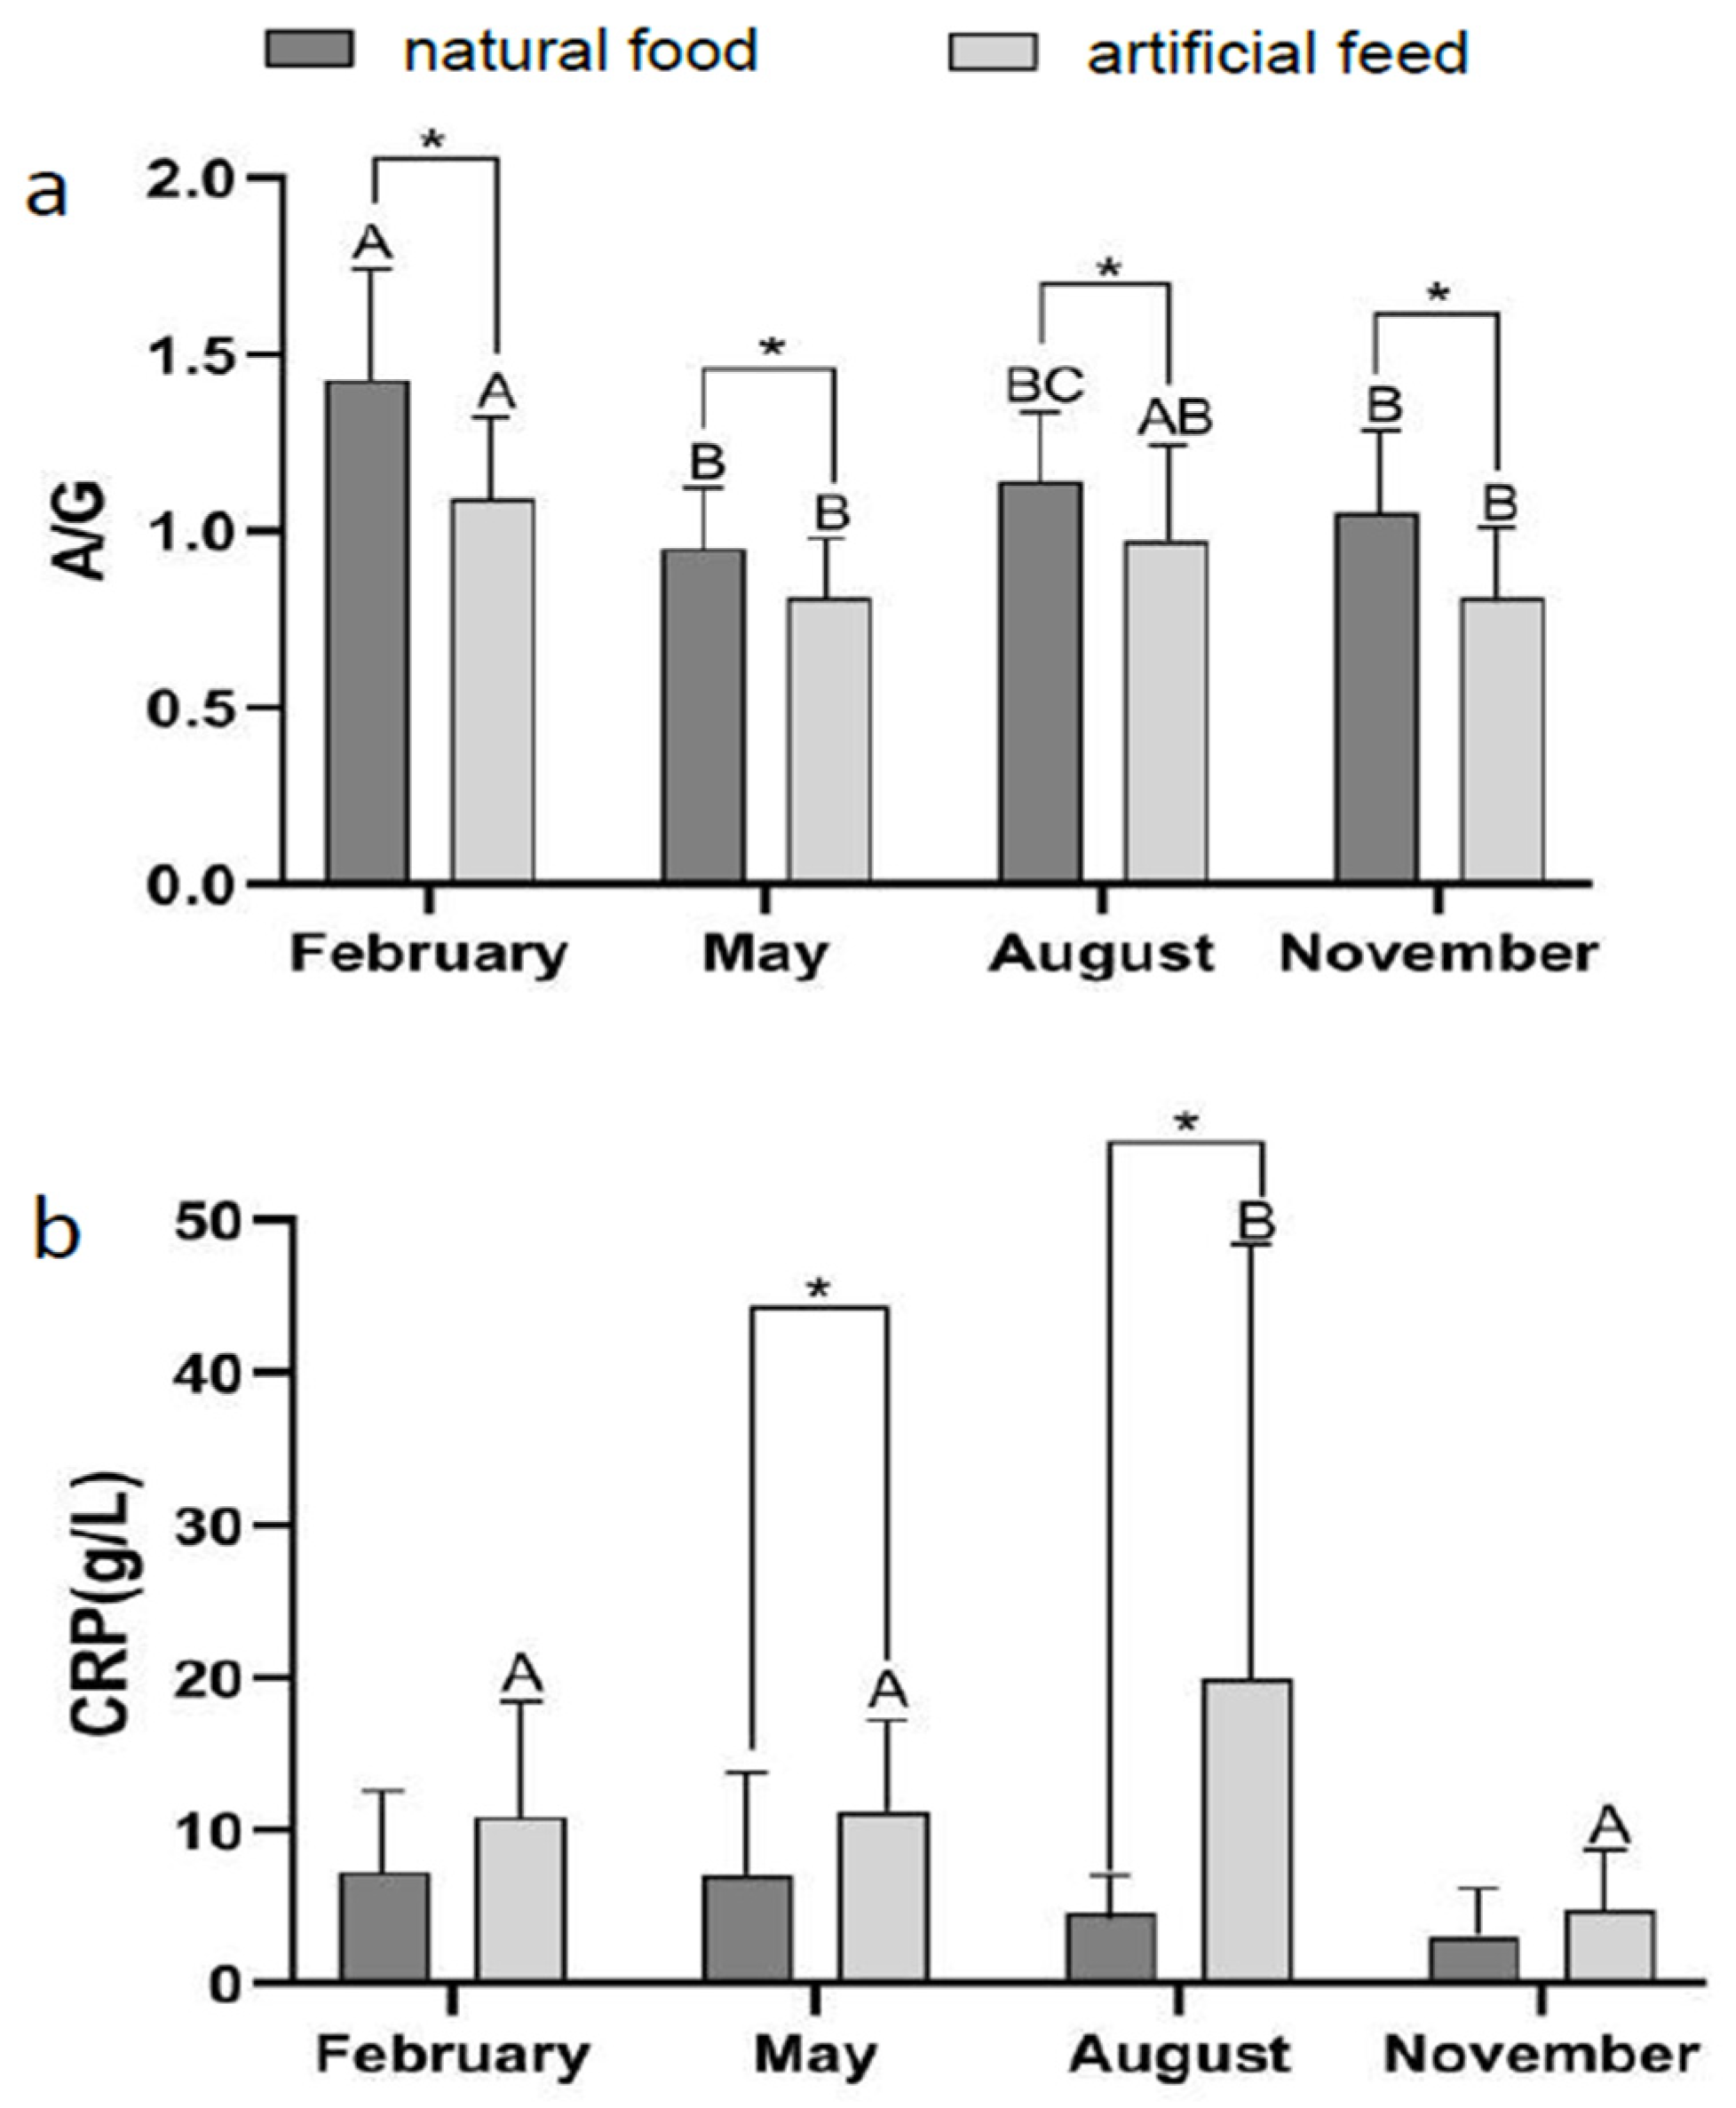
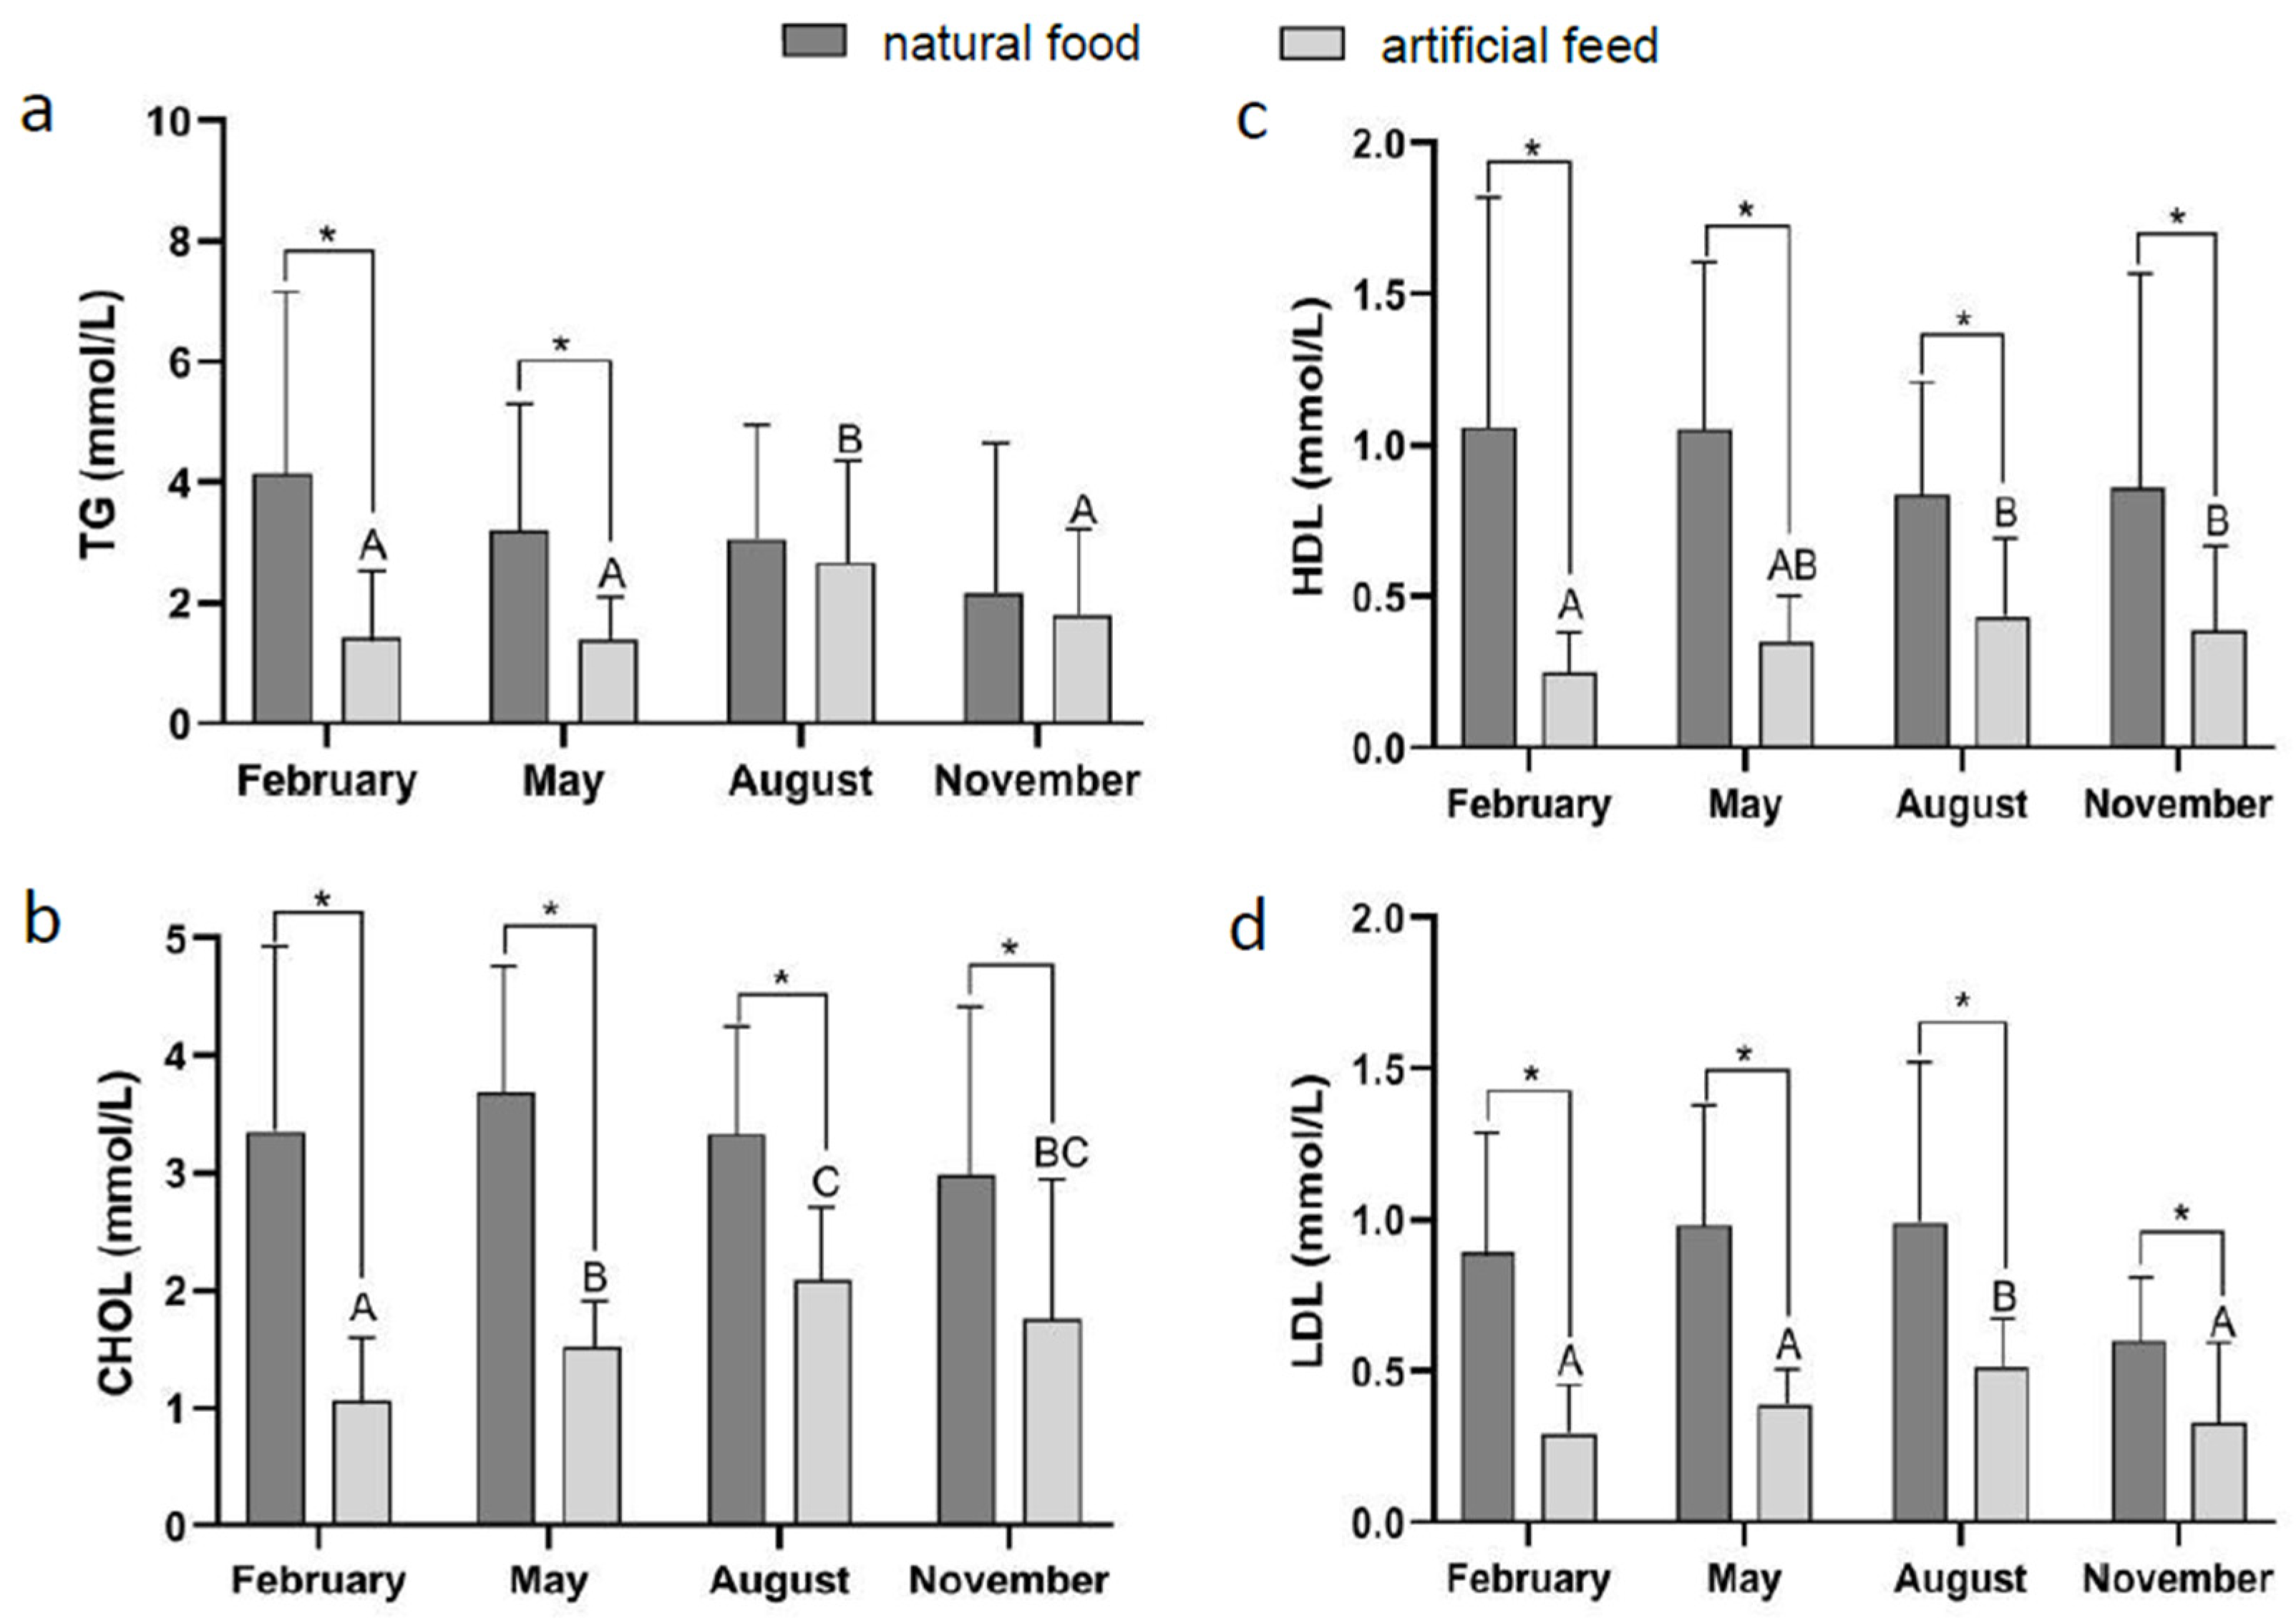
3.2. Effect of Diet Type and Seasons on Blood Physiological Indicators

During the experiment, ALT content was significantly affected by feed type and season (p < 0.05), but their interaction had no significant effect on ALT content (Table S1). However, ALT of the formulated diet group was significantly higher than that of natural food group (p < 0.05). ALT was significantly higher in February than other months in both natural food group and formulated diet group (p < 0.05) (Figure 3a). During the experiment, AST content was significantly affected by season (p < 0.05), but their feed type and season interaction had no significant effect on AST content (Table S1). Both AST started a downward trend from February and reached the lowest values in August (Figure 3b). During the experiment, (AST/ALT) ratio was significantly affected by feed type and season (p < 0.05), but their interaction had no significant effect on AST/ALT (Table S1). The transaminase (AST: ALT) ratio of both feed types appeared to be comparable (p < 0.05). The AST:ALT ratio in February, May, and August was significantly higher in natural food than formulated diet (p < 0.05). This ratio demonstrated a decreasing trend with increasing time (Figure 3c).
During the experiment, LDH and ALP content was significantly affected by season (p < 0.05), while the interaction between feed type and season had no significant effect on LDH and ALP content (Table S1). However, a significant increase (p < 0.05) in LDH from February to May was registered in formulated diet groups. The LDH content in natural food groups reached the maximum in November (Figure 4a). Feed type did not significantly affect ALP levels throughout whole experiment period (p > 0.05). The ALP value of both feed types increased in February to May. Subsequently, the ALP level decreased in August, but peaked with an increase for the natural food group and formulated diet group, respectively, in November (Figure 4b).
During the experiment, TP, ALB, and GLO content was significantly affected by feed type, season, and their interaction (p < 0.05, Table S1). TP, ALB, and GLO contents in February and May were significantly higher in natural food group than that of formulated diet group (p < 0.05). The lowest level of TP and GLO was observed in February with formulated diet, which was significantly lower than those in other months (p < 0.05). The TP and GLO values in formulated diet group declined after increasing from February to May (Figure 5a,c). Natural food did not significantly affect ALB levels throughout whole experiment period. The ALB values in formulated diet group increased from February to August, which reached their maximum in August. ALB was significantly higher in August than other months in formulated diet group (p < 0.05) (Figure 5b).
During the experiment, (ALB: GLO) ratio and CRP content was significantly affected by feed type and season (p < 0.05), but their interaction had no significant effect on (ALB: GLO) ratio and CRP content (Table S1). Both feed types illustrated significant difference in the albumin to globulin ratio (ALB: GLO) (Figure 6a). In May and August, the CRP level of the formulated diet group was significantly higher than that of the natural food group (p < 0.05). CRP level was significantly higher in August than in other months under formulated diet feeding (p < 0.05) (Figure 6b).
During the experiment, TG and LDL content was significantly affected by feed type, season, and their interaction; CHOL and HDL content was significantly affected by feed type and their interaction (p < 0.05, Table S1). During the whole experiment period, CHOL, HDL, and LDL levels were significantly higher in natural food group than that of formulated diet group (p < 0.05). There was no significant change in the TG, CHOL, HDL, and LDL levels in natural food group (p > 0.05). In February and May, TG content of the formulated diet group was significantly higher than that of the natural food group (p < 0.05) (Figure 7a). When formulated diet was fed, the content of TG, CHOL, HDL, and LDL reached the maximum in August (Figure 7).

3.3. Effect of Diet Type on Growth

There were no significant changes in the TL, FL, BL, MBC, and body weight in natural food group (p > 0.05). In February, PFBC of the natural food group was significantly higher than that in other months (p < 0.05, Table 2). When natural food was fed, AFBC reached the minimum in November (Table 2). There were no significant changes in the BL and body weight in formulated diet group (p > 0.05). When formulated diet was fed, FL, PFBC, MBC, and AFBC in the formulated diet group declined from February to May, which reached their minimum in May (Table 3). In terms of SGR, the formulated diet group showed a higher value (4.2%) compared with the natural food group (−1.8%) during one year of indoor culture. Both groups showed negative SGRL throughout whole experiment period (Table 4).

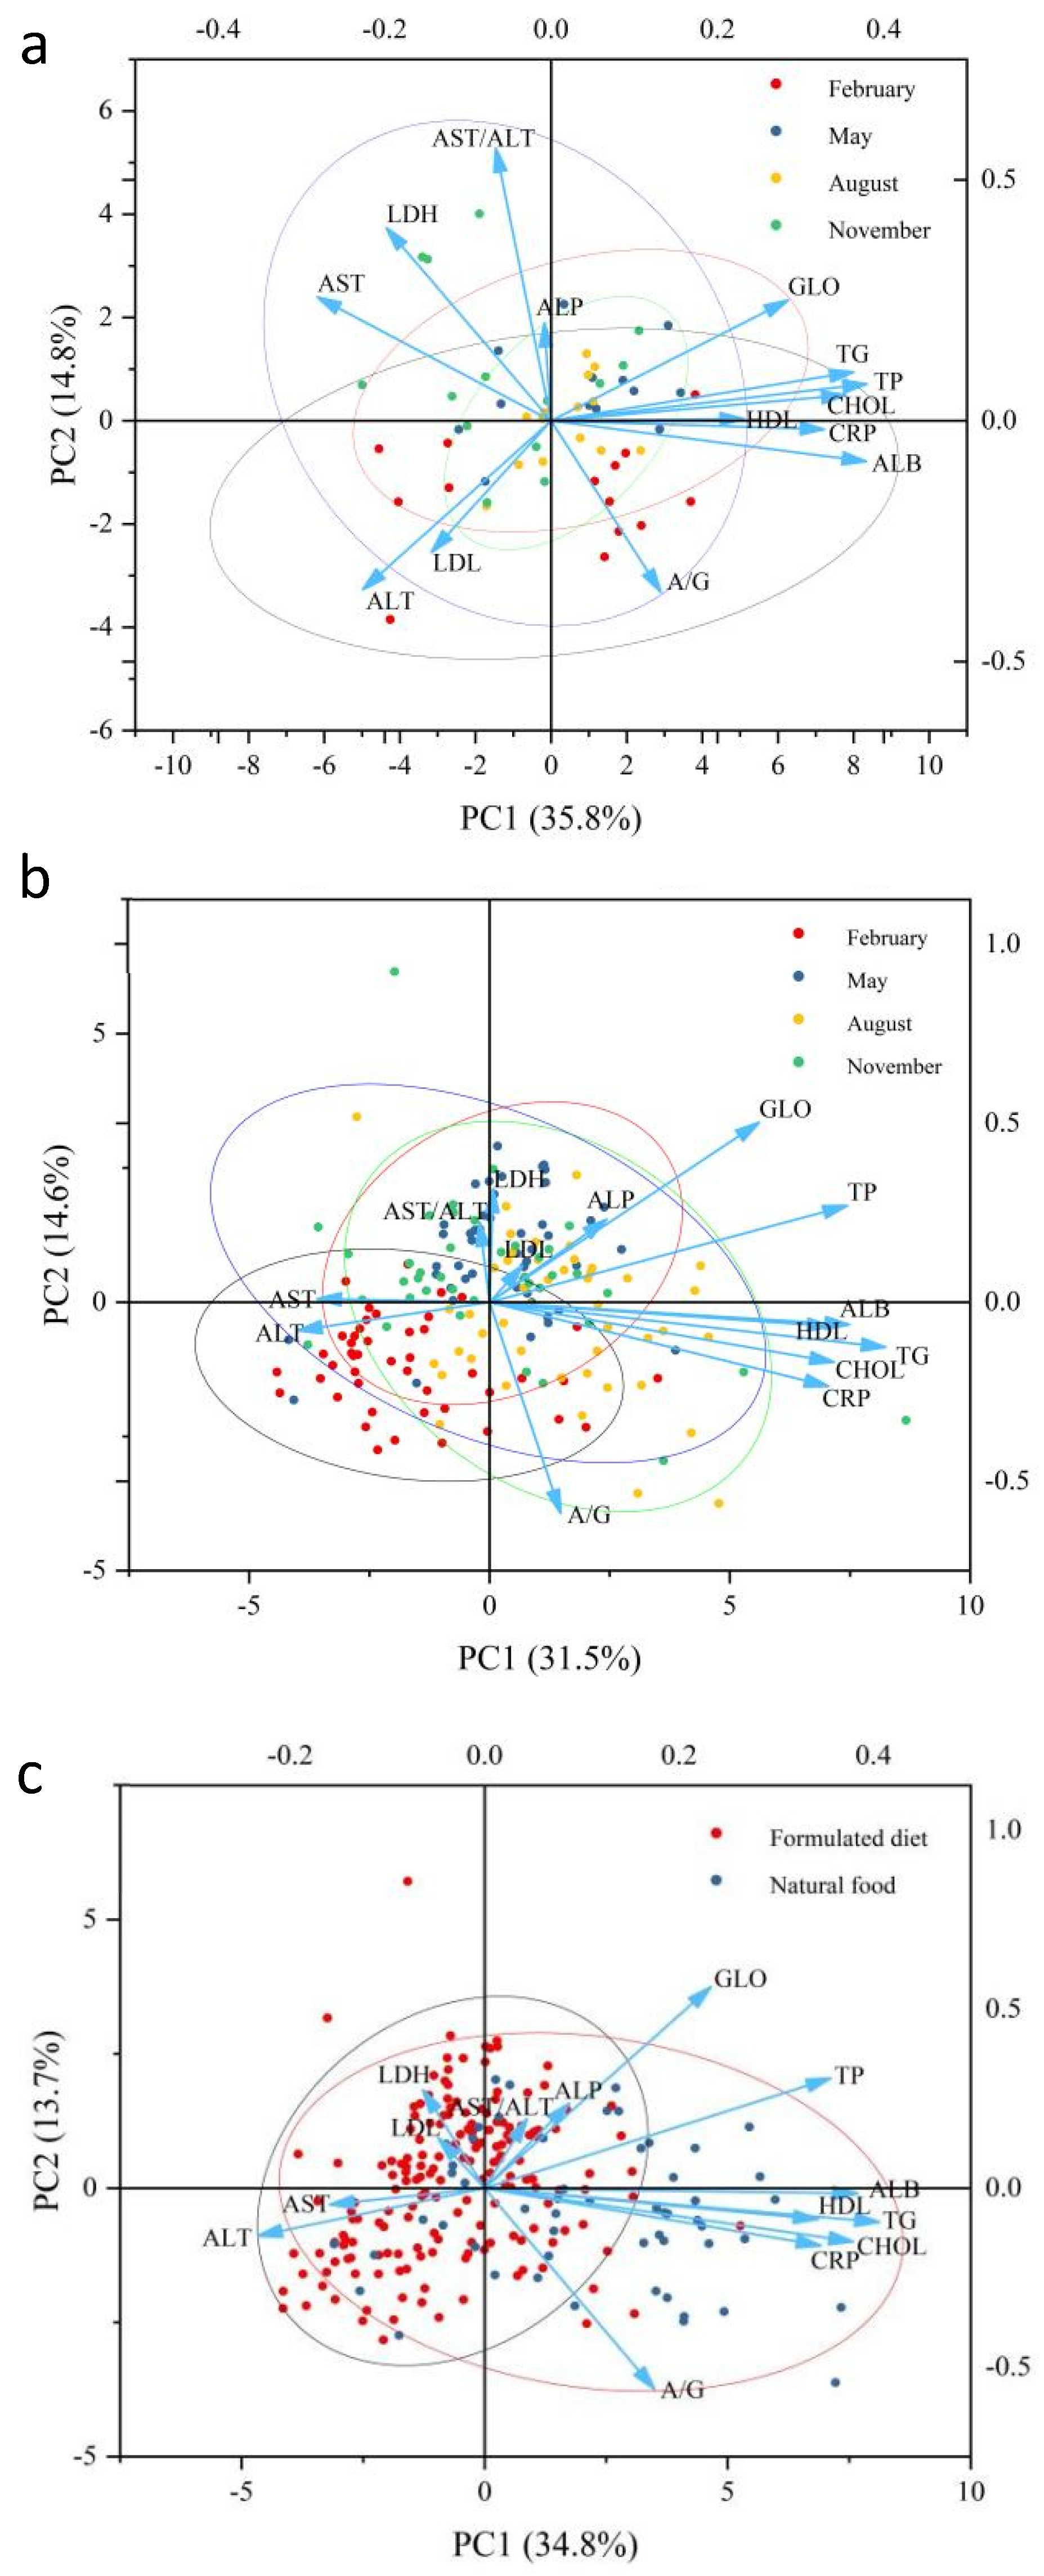
3.4. Principal Component Analysis and Correlation Analysis

When natural food was fed, PCA results showed that the two principal components accounted for 50.6% of the total components. PC1 accounted for 35.8% and PC2 accounted for 14.8%. The axis of PC1 separated the different time points (February, May, August, and November). PC1 was mostly influenced by parameters of AST activity, ALT activity, ALB content, and TP content. PC2 was mostly influenced by ALT activity, A/G and AST/ALT (Figure 8a). When formulated diet was fed, principal component analysis results showed that the two principal components accounted for 46.1% of the total components. PC1 accounts for 31.5% of the total variance. This axis separated the time points (February, May, August, and November). PC1 was mostly influenced by parameters of AST activity, ALT activity, TG content, and TP content. PC2 accounts for 14.6% of the total variance, which was mostly influenced by LDH activity, A/G and GLO content (Figure 8b).
PC1 and PC2 represent 48.5% of the total variance. PC1 explained 34.8% of the overall variance. This axis represented the reaction of natural food group and formulated diet group. PC1 was mostly influenced by parameters of ALT activity and TG content. While the PC2 explained 13.7% of the total variance, which was mostly influenced by TG content, A/G and GLO content (Figure 8c).

4. Discussion

The growth performance of fish feeding on natural food was superior to that of formulated diets such as in Clown Knife (Notopterus chitala) [17], and Greater Amberjack (Seriola dumerili) [27]. In disagreement with previous reports, formulated diet group showed better growth performance in comparison with natural food group in this study.
In terms of specific growth rate, the formulated diet group showed a higher value (4.2%) compared with the natural food group (−1.8%) during one year of indoor culture. In a previous study, the SGR values of juvenile Chinese sturgeon fed with formulated diets were significantly lower than those of fed with water earthworms [16]. We speculate that there are significant differences in the nutritional requirements of Chinese sturgeon at different ages. Nutritional composition and ratio of diets play important roles in fish growth [28,29,30]. As the scale of artificial conservation of Chinese sturgeon continues to expand, quantity and quality of natural feed cannot be guaranteed, and an artificially formulated diet must be used. This requires a detailed study of nutritional requirements of Chinese sturgeon and formulation of a quality-formulated diet suitable for its growth, thus providing a guarantee for aquaculture of Chinese sturgeon. In the current captive breeding process of Chinese sturgeon, we can feed a mixture of natural foods and formula diets in different proportions with feed additives. In a previous study, the addition of appropriate olive leaf extract to the feed improved growth performance and health of the common carp (Cyprinus carpio) [31].
This study found that Chinese sturgeon could be fed formulated diets, the growth was significantly higher compared with the natural foods. On the one hand, the formulated diet contained ≥40% dry matter crude protein and ≥12% dry matter crude lipid. Nutritional composition and ratio of diets may be optimal for the growth of Chinese sturgeon. On the other hand, pellet feed was easier to digest than natural food. In this study, both groups showed negative body length specific growth rate. Previous studies have shown that the average body length of Chinese sturgeon at all ages does not increase regularly according to age but rather decreases at some ages [26].
Various biochemical indicators in serum can rapidly reflect health status of tissues and metabolic functions of body. In clinical settings, levels of ALT, AST, and ALP activities were established as indicators of liver damage [32,33]. Aminotransferases were universally present in living organisms and mainly catalyze transfer of amino acids to keto acids [34], allowing for interconversion between carbohydrate and protein metabolism based on demand [35]. When hepatocyte damage occurs, ALT and AST were released into extracellular area of blood, causing level of transaminase activity in serum to increase [36]. Significant increases in ALT and AST activities indicate enhanced transaminase processes and reflect considered general indicators of tissue damage in Tiger Puffer (Takifugu rubripes) [37]. Roychowdhury et al. (2020) also observed increasing levels of ALT and AST activities caused confirming disturbance in hepatic panel [38]. Observed AST and ALP concentrations were notably higher during the spring/summer period and at their lowest levels in autumn/winter in black scorpionfish (Scorpaena porcus) [39]. In the present study, ALT activity of Chinese sturgeon in formulated diet group was significantly higher than that of natural food group. Formulated diet negatively affected liver function based on the change of enzymes. However, feed types did not significantly affect AST levels. The levels of AST started a downward trend in February and reached their lowest values in August, and AST enzyme activity showed an opposite trend to the change in water temperature. The influence of water temperature on enzyme activities in fish blood is primary therefore, activities of AST varied depending on the influence of seasons. On the one hand, the AST/ALT ratio was commonly employed as biomarker in clinical medicine. In humans, this ratio was an obvious indicator of liver dysfunction, while ratio greater than 1 indicates a significantly damaged liver. On the other hand, this ratio increases or decreases under different stressful conditions in fish [40,41]. In the present study, transaminase (AST: ALT) ratio in natural food group was significantly higher than that of formulated diet group. The transaminase ratio was much greater than 1 for both feed types. In our analysis we find (AST: ALT) ratio cannot accurately reflect Chinese sturgeon health status.
Blood was a major carrier of lipids which bathes tissues and organs in the entire body and functions as a liquid highway for lipids from different tissues [42]. Plasma lipid fractions are composed of cholesterol esters, triglycerides, phospholipid, and free fatty acids [43]. The experimental results demonstrated that content of fat metabolism indexes was higher in natural food group than in formulated diet group. Crucian carp diet contained 10.32% wet weight crude lipid and largemouth bass diet 6.32% wet weight crude lipid. Formulated diet contained ≥12% dry matter crude lipid. Although the fat content of the formulated diet was greater than that of natural food, content of fat metabolism indexes was higher in natural food group than in formulated diet group. The main explanation for this could be the uneven content and ratio of fatty acids in formulated diet. Sontakke et al. (2019) observed that Notopterus chitala fed with different diets were separated based on their fatty acid composition, which was clearly influenced by different feeding regimes [17]. This may be due to increase in free fatty acids in sturgeon fed with natural food, which increases CHOL and TG levels in serum. Within cells and plasma, triglycerides represent the primary form of storage and transport of fatty acids. The liver is central organ for fatty acid metabolism, and fatty acids are accumulated in liver by hepatocellular uptake from plasma [44]. The increase in TG content indicates an increase in internal supply and storage of energy. In February and May, TG content of formulated diet group was significantly higher than that of natural food group. These intrinsic changes may be an adaptation to increased extrinsic food conversion rate and feeding level. During the whole experiment period, there was no significant change in the TG, CHOL, HDL, LDL levels in natural food group. The effect of feeding natural food on lipid metabolism indicators fluctuated less. Yun et al. (2021) revealed that moderate cholesterol was helpful for turbot (Scophthalmus maximus L.) fed high plant protein diets to get significantly better growth rate without negative effects [45]. In the formulated diet, the content of TG and CHOL was higher in August than in other months. TG and CHOL increased in correlation with the spawning period of the investigated species (August–November). In the reproduction period of Chinese sturgeon, we can increase the feeding of natural food. The experimental results demonstrated that content of HDL and LDL was higher in natural food group than in formulated diet group. HDL-C and LDL-C in serum were responsible for cholesterol transport in body. HDL-C transports cholesterol from peripheral tissues to liver for biliary excretion and has the effect of reducing excess cholesterol in blood [46]. LDL-C transports cholesterol from the liver to peripheral tissues for utilization [47]. During the whole experiment period, CHOL, HDL, and LDL levels were significantly higher in natural food group than that of formulated diet group. We found seasonal trends in cholesterol in both types of feeds consistent with HDL and LDL. The CHOL, HDL, and LDL values in formulated diet group increased from February to August, which reached their maximum in August. Subsequently, the CHOL, HDL, and LDL decreased. Wallaert and Babin (1994) have shown that the season and reproductive cycle are the two main factors affecting basal lipid and lipoprotein levels in trout [48]. These seasonal changes could be influenced by an endogenous biological clock that has an independent effect on plasma lipid and lipoprotein levels. For the demonstration of a self-sustaining annual LDL cycle, more research is required.
Serum proteins are commonly used as an indicator of fish health and immune status. TP is composed of ALB and GLO [49]. Total serum globulin level was measured to assess general specific immunity. ALB and GLO ensure a healthy system and function as plasma carriers [50]. Healthy fish can maintain hemoprotein at normal levels. Brook trout (Salvelinus fontinalis) infection with flavus resulted in significant decrease in TP content in serum [51]. The addition of appropriate amounts of taurine to feed and significant increase in TP, ALB, and GLO levels in blood after feeding fish are thought to reflect a strong innate immunity [52]. With dietary protein level increase in large-size grouper (Epinephelus coioides), its TP content rises rapidly [53]. In this study, TP, ALB, and GLO contents in February and May were significantly higher in natural food group than that of formulated diet group, indicating natural food enhanced the immunity and promotes growth of sturgeon. The total serum protein content reflects the absorption and metabolism of proteins in body. When body is supplemented with nutrients, metabolism is accelerated and protein synthesis is vigorous. The formulated diets reduced protein absorption capacity of sturgeon and adversely affected nutritional status. The TP and GLO levels in the formulated diet group increased from February to May, reaching their maximum in May, following which they steadily decreased. TP and GLO concentration varied among seasons and increased in spring after a long period of cessation of food intake. The ALB value increased with the body weight of the fish and showed the same degree of variation as TP in formulated diet group. Similar to our findings, IHUŢ et al. (2020) obtained higher TP and ALB values as the body weight of fish increased [54]. ALB:GLB ratio is an index used to track changes in plasma or serum composition. A/G changes significantly in fish diseases and can be used as an indicator of health status. Serum samples of Persian Sturgeon (Acipenser persicus) and Stellate Sturgeon (Acipenser stellatusin) in the wild were analyzed and found that the ALB:GLB ratio of the two species was 0.05 to 0.65 and 0.18 to 0.52 [55], respectively. In the present study, both feed types illustrated significant difference in the ALB:GLO ratio, which was significantly higher in natural food group than in formulated diet group. Lopez et al. (2015) observed that when totoaba (Totoaba macdonaldi) was fed soy protein concentrate [56], its ALB: GLO ratio decreased. In this study, the ALB:GLO ratio in natural food group was higher than 1.0 from and low level was registered in formulated diet group, implying a probable inflammatory process in formulated diet group. The levels of ALB:GLO ratio in formulated diet group started a downward trend in February and reached their lowest values in May. The current findings show that probable liver function deterioration occurred in the formulated diet group as summer temperatures rose. Increased blood protein levels were associated with enhanced feed and protein utilization [57]. Extra hepatic production of CRP was observed from vascular smooth muscle cells [58]. CRP increased distinctly in plasma concentration when organism was infected or tissue damaged [59]. CRP can help detect infection status and chronic stress in fish [60]. In this study, CRP level of formulated diet group was significantly higher than that of natural food group in May and August. CRP level of formulated diet group in August with the maximum value reaching 20, indicating that the liver function of Chinese sturgeons was significantly impaired. Chinese sturgeon reared at water temperature of 26.5 °C in August showed significantly higher CRP levels in formulated diet group than those other months. Similarly, Rainbow trout (Oncorhynchus mykiss) reared at water temperature of 16.5–19.5 °C showed significantly higher CRP levels than those reared at 13 °C [61]. During the whole experiment period, natural food group illustrated no significant change in CRP level, and CRP presents in very trace amount. In the plasma of healthy fish, CRP is present in a very small amount.
To integrate the changes of time points (February, May, August, and November) and biochemical indicators with different feed types, PCA was used to distinguish the combinatorial effects as a function of principal components. From PCA results, positive and negative correlations among different measured variables were observed.

5. Conclusions

In conclusion, formulated diets were found to adversely affect the physiology of captive Chinese sturgeons. Plasma ALT and CRP levels of formulated diet group increased distinctly, indicating that the liver function of Chinese sturgeons was impaired. Through analysis of innate immune indicators, such as serum TP, ALB, and GLO, we conclude that natural foods enhance immune function. Natural foods also had an effect on lipid metabolism parameters, including CHOL, HDL, LDL, and TG, indicating that natural foods increase the internal supply and storage of energy. Almost half of the analyzed biochemical indicators show significant seasonal patterns, so the results clearly show that seasons have a pronounced effect on the Chinese sturgeon. Future work can focus on the optimization of the formula and the development of feed additives.

Supplementary Materials

The following supporting information can be downloaded at: https://www.mdpi.com/article/10.3390/fishes8010045/s1, Table S1: Summary of two-way ANOVA results on effects of feed type and season on the biochemical indicators of Acipenser sinensis.

Author Contributions

All authors contributed to the study conception and design. Methodology, Validation, Formal analysis, Writing—original draft, Writing—review and editing and Visualization were performed by Y.Z. and J.L. Writing—review and editing were performed by J.X., H.F. and Y.W. Conceptualization, Funding acquisition, Project administration, Supervision, Writing—review and editing were performed by P.Z. and M.H. All authors have read and agreed to the published version of the manuscript.

Funding

This project was supported by Shanghai Agriculture Applied Technology Development Program, China (Grant No.X20180109).

Institutional Review Board Statement

The study was conducted in accordance with the Declaration of Helsinki and approved by the Shanghai Ocean University Animal Care and Use Committee with approval number SHOU-2021-118. The number of collected animals in our study was kept as low as possible, and the manipulation was painless and fast.

Informed Consent Statement

Not applicable.

Data Availability Statement

All data generated during this study are included in this published article.

Conflicts of Interest

The authors have no relevant financial or non-financial interests to disclose.

References

  1. Huang, Z.L.; Wang, L.H. Yangtze Dams Increasingly Threaten the Survival of the Chinese Sturgeon. Curr. Biol. 2018, 28, 3640–3647. [Google Scholar] [CrossRef]
  2. Chen, Y.S.; Qu, X.; Xiong, F.Y.; Lu, Y.; Wang, L.Z.; Hughes, R.M. Challenges to saving China’s freshwater biodiversity: Fishery exploitation and landscape pressures. Ambio 2020, 49, 926–938. [Google Scholar] [CrossRef] [PubMed]
  3. Xie, P. Can we save the disappearing sturgeons in the Yangtze River. J. Lake. Sci. 2020, 32, 899–914. (In Chinese) [Google Scholar]
  4. Zhou, X.F.; Chen, L.; Yang, J.; Wu, H.Q. Chinese sturgeon needs urgent rescue. Science 2020, 370, 1175. [Google Scholar] [CrossRef]
  5. Wei, Q.W.; Li, L.X.; Du, H.; Zhang, X.Y.; Xiong, W.; Zhang, H.; Shen, L.; Wu, J.M.; Zhang, S.H.; Wang, C.Y.; et al. Research on technology for controlled propagation of cultured Chinese sturgeon (Acipenser sinensis). J. Fish. Sci. China 2013, 20, 1–11. (In Chinese) [Google Scholar]
  6. Sun, L.T.; Zhao, F.; Wang, S.K.; Wang, Y.; Yang, G.; Zhuang, P. Growth and feeding ecology of juvenile Chinese sturgeon, Acipenser sinensis, in the Yangtze Estuary. J. Appl. Ichthyol. 2019, 35, 47–53. [Google Scholar] [CrossRef] [Green Version]
  7. Xiao, H.; Cui, Y.B.; Hung, S.S.O.; Zhu, X.M.; Zou, Z.J.; Xie, S.Q. Growth of juvenile Chinese sturgeon Acipenser sinensis fed live and formulated diets. N. Am. J. Aquac. 1999, 61, 184–188. [Google Scholar] [CrossRef]
  8. Hung, S.S.O. Recent advances in sturgeon nutrition. Anim. Nutr. 2017, 3, 191–204. [Google Scholar] [CrossRef]
  9. Wu, J.P.; Yang, D.Q.; Du, H.; Yu, T.; Luo, J.; Xu, Q.Q.; Zhu, J.Q.; Wei, Q.W. The influence of dietary arachidonic acid on growth, fatty acid profile and sex steroid hormones of F2 generation Chinese sturgeon (Acipenser sinensis). Aquac. Rep. 2021, 21, e100818. [Google Scholar] [CrossRef]
  10. Kals, J.; Blonk, R.J.W.; Palstra, A.P.; Sobotta, T.K.; Mongile, F.; Schneider, O.; Planas, J.V.; Schrama, J.W.; Verreth, J.A.J. Feeding ragworm (Nereis virens Sars) to common sole (Solea solea L.) alleviates nutritional anaemia and stimulates growth. Aquac. Res. 2017, 48, 752–759. [Google Scholar] [CrossRef]
  11. Roh, H.; Park, J.; Kim, A.; Kim, N.; Lee, Y.; Kim, B.S.; Vijayan, J.; Lee, M.K.; Park, C.I.; Kim, D. Overfeeding-Induced Obesity Could Cause Potential Immuno-Physiological Disorders in Rainbow Trout (Oncorhynchus mykiss). Animals 2020, 10, e1499. [Google Scholar] [CrossRef]
  12. Wu, N.; Xu, X.; Wang, B.; Li, X.M.; Cheng, Y.Y.; Li, M.; Xia, X.Q.; Zhang, Y.A. Anti-foodborne enteritis effect of galantamine potentially via acetylcholine anti-inflammatory pathway in fish. Fish Shellfish. Immunol. 2020, 97, 204–215. [Google Scholar] [CrossRef] [PubMed]
  13. Zhao, H.H.; Xia, J.G.; Zhang, X.; He, X.G.; Li, L.; Tang, R.; Chi, W.; Li, D.P. Diet Affects Muscle Quality and Growth Traits of Grass Carp (Ctenopharyngodon idellus): A Comparison Between Grass and Artificial Feed. Front. Physiol. 2018, 9, 283. [Google Scholar] [CrossRef] [PubMed]
  14. Meyer, H.A.; Chipps, S.R.; Graeb, B.D.; Klumb, R.A. Growth, food consumption, and energy status of juvenile pallid sturgeon fed natural or artificial diets. J. Fish Wildl. Manag. 2016, 7, 388–396. [Google Scholar] [CrossRef] [Green Version]
  15. Lee, L.Y.; Normaiyudin, N.A.; Wong, S.C.; Shu-Chien, A.C.; Rahmah, S.; Jaya-Ram, A. First description of mantis shrimp, Miyakella nepa (Latreille, 1828), feeding preference behaviour in captive conditions. Aquac. Rep. 2022, 22, e100969. [Google Scholar] [CrossRef]
  16. Deng, X.; Cui, Y.; Hung, S.S.O. Initial trials with feeding of Chinese sturgeon (Acipenser sinensis) larvae on artificial diet. Acta Hydrobiol. Sin. 1998, 22, 189–191. [Google Scholar]
  17. Sontakke, R.; Chaturvedi, C.S.; Saharan, N.; Tiwari, V.K.; Haridas, H.; Rani, A.M.B. Growth response, digestive enzyme activity and stress enzyme status in early stages of an endangered fish, Notopterus chitala (Hamilton, 1822) fed with live feed and formulated diet. Aquaculture 2019, 510, 182–190. [Google Scholar] [CrossRef]
  18. Ramesh, M.; Thilagavathi, T.; Rathika, R.; Poopal, R.K. Antioxidant status, biochemical, and hematological responses in a cultivable fish Cirrhinus mrigala exposed to an aquaculture antibiotic Sulfamethazine. Aquaculture 2018, 491, 10–19. [Google Scholar] [CrossRef]
  19. Seibel, H.; Bassmann, B.; Rebl, A. Blood Will Tell: What Hematological Analyses Can Reveal About Fish Welfare. Front. Vet. Sci. 2021, 8, e616955. [Google Scholar] [CrossRef]
  20. Fazio, F. Fish hematology analysis as an important tool of aquaculture: A review. Aquaculture 2019, 500, 237–242. [Google Scholar] [CrossRef]
  21. Lulijwa, R.; Young, T.; Symonds, J.E.; Walker, S.P.; Delorme, N.J.; Alfaro, A.C. Uncoupling Thermotolerance and Growth Performance in Chinook Salmon: Blood Biochemistry and Immune Capacity. Metabolites 2021, 11, e547. [Google Scholar] [CrossRef] [PubMed]
  22. Li, Y.; Li, J.Z.; Lu, J.T.; Li, Z.; Shi, S.C.; Liu, Z.J. Effects of live and artificial feeds on the growth, digestion, immunity and intestinal microflora of mandarin fish hybrid (Siniperca chuatsi× Siniperca scherzeri). Aquac. Res. 2017, 48, 4479–4485. [Google Scholar] [CrossRef]
  23. Zheng, Y.P.; Zhang, Y.; Xie, Z.; Shin, P.K.S.; Xu, J.N.; Fan, H.Y.; Zhuang, P.; Hu, M.H.; Wang, Y.J. Seasonal Changes of Growth, Immune Parameters and Liver Function in Wild Chinese Sturgeons Under Indoor Conditions: Implication for Artificial Rearing. Front. Physiol. 2022, 13, 894729. [Google Scholar] [CrossRef]
  24. Chen, M.H.; Sun, Y.Y.; Kong, C.M.; Tang, H.J.; Gan, L. Effect of dietary phosphorus levels on growth and body composition of crucian carp, Carassius auratus under indoor and outdoor experiments. Aquac. Nutr. 2017, 23, 702–709. [Google Scholar] [CrossRef]
  25. Harimana, Y.; Tang, X.; Xu, P.; Xu, G.C.; Karangwa, E.; Zhang, K.; Sun, Y.J.; Li, Y.R.; Ma, S.H.; Uriho, A.; et al. Effect of long-term moderate exercise on muscle cellularity and texture, antioxidant activities, tissue composition, freshness indicators and flavor characteristics in largemouth bass (Micropterus salmoides). Aquaculture 2019, 510, 100–108. [Google Scholar] [CrossRef]
  26. Chen, X.H. Biology and Resources of Acipenseriformes Fishes; China Ocean Press: Beijing, China, 2007. (In Chinese) [Google Scholar]
  27. Roo, J.; Hernandez-Cruz, C.M.; Mesa-Rodriguez, A.; Fernandez-Palacios, H.; Izquierdo, M.S. Effect of increasing n-3 HUFA content in enriched Artemia on growth, survival and skeleton anomalies occurrence of greater amberjack Seriola dumerili larvae. Aquaculture 2019, 500, 651–659. [Google Scholar] [CrossRef]
  28. Kokou, F.; Henry, M.; Nikoloudaki, C.; Kounna, C.; Vasilaki, A.; Fountoulaki, E. Optimum protein-to-lipid ratio requirement of the juvenile shi drum (Umbrina cirrosa) as estimated by nutritional and histological parameters. Aquac. Nutr. 2019, 25, 444–455. [Google Scholar] [CrossRef]
  29. Liu, H.; Yang, J.J.; Dong, X.H.; Tan, B.P.; Zhang, S.; Chi, S.Y.; Yang, Q.H.; Liu, H.Y.; Yang, Y.Z. Effects of different dietary carbohydrate-to-lipid ratios on growth, plasma biochemical indexes, digestive and immune enzymes activities of juvenile orange-spotted grouper Epinephelus coioides. Aquac. Res. 2020, 51, 4152–4164. [Google Scholar] [CrossRef]
  30. Azimi, A.; Shekarabi, S.P.H.; Paknejad, H.; Harsij, M.; Khorshidi, Z.; Zolfaghari, M.; Hatami, A.S.; Dawood, M.A.O.; Mazloumi, N.; Zakariaee, H. Various carbon/nitrogen ratios in a biofloc-based rearing system of common carp (Cyprinus carpio) fingerlings: Effect on growth performance, immune response, and serum biochemistry. Aquaculture 2022, 548, e737622. [Google Scholar] [CrossRef]
  31. Sokooti, R.; Chelemal Dezfoulnejad, M.; Javaheri Baboli, M. Effects of olive leaf extract (Olea europaea Leecino) on growth, haematological parameters, immune system and carcass composition in common carp (Cyprinus carpio). Aquac. Res. 2021, 52, 2415–2423. [Google Scholar] [CrossRef]
  32. Reshma, K.J.; Sumithra, T.G.; Vishnu, B.; Jyothi, R.; Kumar, R.R.; Pootholathil, S.; Sanil, N.K. Indexing serum biochemical attributes of Lutjanus argentimaculatus (Forsskal, 1775) to instrument in health assessment. Aquac. Res. 2020, 51, 2590–2602. [Google Scholar] [CrossRef]
  33. Kim, S.Y.; Park, C.; Kim, M.Y.; Ji, S.Y.; Hwangbo, H.; Lee, H.; Hong, S.H.; Han, M.H.; Jeong, J.W.; Kim, G.Y.; et al. ROS-Mediated Anti-Tumor Effect of Coptidis Rhizoma against Human Hepatocellular Carcinoma Hep3B Cells and Xenografts. Int. J. Mol. Sci. 2021, 22, e4797. [Google Scholar] [CrossRef]
  34. Meton, I.; Mediavilla, D.; Caseras, A.; Canto, E.; Fernandez, F.; Baanante, I.V. Effect of diet composition and ration size on key enzyme activities of glycolysis-gluconeogenesis, the pentose phosphate pathway and amino acid metabolism in liver of gilthead sea bream (Sparus aurata). Br. J. Nutr. 1999, 82, 223–232. [Google Scholar] [CrossRef]
  35. Silva, A.L.N.; Rodrigues, R.A.; Siqueira, M.S.; Farias, K.N.N.; Kuibida, K.V.; Franco-Belussi, L.; Fernandes, C.E. Transaminase profile and hepatic histopathological traits in Piaractus mesopotamicus exposed to insecticide Diflubenzuron. Environ. Sci. Pollut. Res. 2021, 28, 22002–22010. [Google Scholar] [CrossRef]
  36. Ozer, J.; Ratner, M.; Shaw, M.; Bailey, W.; Schomaker, S. The current state of serum biomarkers of hepatotoxicity. Toxicology 2008, 245, 194–205. [Google Scholar] [CrossRef] [PubMed]
  37. Gao, X.Q.; Fei, F.; Huo, H.H.; Huang, B.; Meng, X.S.; Zhang, T.; Liu, B.L. Impact of nitrite exposure on plasma biochemical parameters and immune-related responses in Takifugu rubripes. Aquat. Toxicol. 2020, 218, e105362. [Google Scholar] [CrossRef]
  38. Roychowdhury, P.; Aftabuddin, M.; Pati, M.K. Thermal stress altered growth performance and metabolism and induced anaemia and liver disorder in Labeo rohita. Aquac. Res. 2020, 51, 1406–1414. [Google Scholar] [CrossRef]
  39. Ferri, J.; Matic-Skoko, S.; Coz-Rakovac, R.; Strunjak-Perovic, I.; Ljubic, B.B.; Popovic, N.T. Assessment of Fish Health: Seasonal Variations in Blood Parameters of the Widely Spread Mediterranean Scorpaenid Species, Scorpaena porcus. Appl. Sci. 2022, 12, e4106. [Google Scholar] [CrossRef]
  40. Nyblom, H.; Bjornsson, E.; Simren, M.; Aldenborg, F.; Almer, S.; Olsson, R. The AST/ALT ratio as an indicator of cirrhosis in patients with PBC. Liver Int. 2006, 26, 840–845. [Google Scholar] [CrossRef]
  41. Bonifacio, A.F.; Cazenave, J.; Bacchetta, C.; Ballesteros, M.L.; Bistoni, M.D.; Ame, M.V.; Bertrand, L.; Hued, A.C. Alterations in the general condition, biochemical parameters and locomotor activity in Cnesterodon decemmaculatus exposed to commercial formulations of chlorpyrifos, glyphosate and their mixtures. Ecol. Indic. 2016, 67, 88–97. [Google Scholar] [CrossRef]
  42. Zhu, T.; Corraze, G.; Plagnes-Juan, E.; Quillet, E.; Dupont-Nivet, M.; Skiba-Cassy, S. Regulation of genes related to cholesterol metabolism in rainbow trout (Oncorhynchus mykiss) fed a plant-based diet. Am. J. Physiol. Regul. Integr. Comp. Physiol. 2018, 314, R58–R70. [Google Scholar] [CrossRef]
  43. Chen, Y.F.; Miura, Y.; Sakurai, T.; Chen, Z.; Shrestha, R.; Kato, S.; Okada, E.; Ukawa, S.; Nakagawa, T.; Nakamura, K.; et al. Comparison of dimension reduction methods on fatty acids food source study. Sci. Rep. 2021, 11, e18748. [Google Scholar] [CrossRef]
  44. Alves-Bezerra, M.; Cohen, D.E. Triglyceride Metabolism in the Liver. Compr. Physiol. 2018, 8, 1–22. [Google Scholar] [CrossRef]
  45. Yun, B.A.; Mai, K.S.; Zhang, W.B.; Xu, W. Effects of dietary cholesterol on growth performance, feed intake and cholesterol metabolism in juvenile turbot (Scophthalmus maximus L.) fed high plant protein diets. Aquaculture 2011, 319, 105–110. [Google Scholar] [CrossRef]
  46. Lewis, G.F.; Rader, D.J. New insights into the regulation of HDL metabolism and reverse cholesterol transport. Circ. Res. 2005, 96, 1221–1232. [Google Scholar] [CrossRef] [Green Version]
  47. Kudinov, V.A.; Alekseeva, O.Y.; Torkhovskaya, T.I.; Baskaev, K.K.; Artyushev, R.I.; Saburina, I.N.; Markin, S.S. High-Density Lipoproteins as Homeostatic Nanoparticles of Blood Plasma. Int. J. Mol. Sci. 2020, 21, e8737. [Google Scholar] [CrossRef]
  48. Wallaert, C.; Babin, P.J. Age-related, sex-related, and seasonal changes of plasma lipoprotein concentrations in trout. J. Lipid Res. 1994, 35, 1619–1633. [Google Scholar] [CrossRef]
  49. AtallahBenson, L.; Merly, L.; Cray, C.; Hammerschlag, N. Serum Protein Analysis of Nurse Sharks. J. Aquat. Anim. Health. 2020, 32, 77–82. [Google Scholar] [CrossRef]
  50. Kari, Z.A.; Kabir, M.A.; Mat, K.; Rusli, N.D.; Razab, M.; Ariff, N.; Edinur, H.A.; Rahim, M.Z.A.; Pati, S.; Dawood, M.A.O.; et al. The possibility of replacing fish meal with fermented soy pulp on the growth performance, blood biochemistry, liver, and intestinal morphology of African catfish (Clarias gariepinus). Aquac. Rep. 2021, 21, e100815. [Google Scholar] [CrossRef]
  51. Rehulka, J.; Minarik, B. Blood parameters in brook trout Salvelinus fontinalis (Mitchill, 1815), affected by columnaris disease. Aquac. Res. 2007, 38, 1182–1197. [Google Scholar] [CrossRef]
  52. Adeshina, I.; Abdel-Tawwab, M. Dietary taurine incorporation to high plant protein-based diets improved growth, biochemical, immunity, and antioxidants biomarkers of African catfish, Clarias gariepinus (B.). Fish Physiol. Biochem. 2020, 46, 1323–1335. [Google Scholar] [CrossRef]
  53. Yan, X.B.; Yang, J.J.; Dong, X.H.; Tan, B.P.; Zhang, S.; Chi, S.Y.; Yang, Q.H.; Liu, H.Y.; Yang, Y.Z. The optimal dietary protein level of large-size grouper Epinephelus coioides. Aquac. Nutr. 2020, 26, 705–714. [Google Scholar] [CrossRef]
  54. Ihut, A.; Raducu, C.; Cocan, D.; Munteanu, C.; Luca, I.T.; Uiuiu, P.; Latiu, C.; Rus, V.; Miresan, V. Seasonal variation of blood biomarkers in huchen, Hucho hucho (Actinopterygii: Salmoniformes: Salmonidae) reared in captivity. Acta Ichthyol. Piscat. 2020, 50, 381–390. [Google Scholar] [CrossRef]
  55. Asadi, F.; Hallajian, A.; Asadian, P.; Shahriari, A.; Pourkabir, M. Serum lipid, free fatty acid, and proteins in juvenile sturgeons: Acipenser persicus and Acipenser stellatus. Comp. Clin. Path. 2009, 18, 287–289. [Google Scholar] [CrossRef]
  56. Lopez, L.M.; Flores-Ibarra, M.; Banuelos-Vargas, I.; Galaviz, M.A.; True, C.D. Effect of fishmeal replacement by soy protein concentrate with taurine supplementation on growth performance, hematological and biochemical status, and liver histology of totoaba juveniles (Totoaba macdonaldi). Fish Physiol. Biochem. 2015, 41, 921–936. [Google Scholar] [CrossRef]
  57. Shekarabi, S.P.H.; Javarsiani, L.; Mehrgan, M.S.; Dawood, M.A.O.; Adel, M. Growth performance, blood biochemistry profile, and immune response of rainbow trout (Oncorhynchus mykiss) fed dietary Persian shallot (Allium stipitatum) powder. Aquaculture 2022, 548, e737627. [Google Scholar] [CrossRef]
  58. Roy, S.; Kumar, V.; Kumar, V.; Behera, B.K. Acute Phase Proteins and their Potential Role as an Indicator for Fish Health and in Diagnosis of Fish Diseases. Protein Pept. Lett. 2017, 24, 78–89. [Google Scholar] [CrossRef]
  59. Lee, P.T.; Bird, S.; Zou, J.; Martin, S.A.M. Phylogeny and expression analysis of C-reactive protein (CRP) and serum amyloid-P (SAP) like genes reveal two distinct groups in fish. Fish Shellfish. Immunol. 2017, 65, 42–51. [Google Scholar] [CrossRef] [Green Version]
  60. Aversa-Marnai, M.; Castellano, M.; Quartiani, I.; Conijesky, D.; Perretta, A.; Villarino, A.; Silva-Alvarez, V.; Ferreira, A.M. Different response of Acipenser gueldenstaedtii CRP/SAP and SAA to bacterial challenge and chronic thermal stress sheds light on the innate immune system of sturgeons. Fish Shellfish. Immunol. 2022, 121, 404–417. [Google Scholar] [CrossRef]
  61. Hiroshi, K.; Yuji, M.; Yoshiaki, T.; Youchang, L.; Tadashi, I.; Shinobu, W. Changes of C-reactive protein levels in rainbow trout (Oncorhynchus mykiss) sera after exposure to anti-ectoparasitic chemicals used in aquaculture. Fish Shellfish. Immunol. 2004, 16, 589–597. [Google Scholar] [CrossRef]
Figure 1. Measurement diagram of main growth indexes of Chinese sturgeon (Chen, 2007) [26]. Total length (TL); Fork length (FL); Body length (BL); Measurement position of pectoral fin body circumference (PFBC); Measurement position of Maximum body circumference (MBC); Measurement position of abdominal fin body circumference (AFBC).
Fishes 08 00045 g001
Figure 2. The changes of room temperature, water temperature, and dissolved oxygen (Mean ± SD).
Fishes 08 00045 g002
Figure 3. Variation of metabolic enzyme (a) ALT, (b) AST, and (c) AST/ALT activities between months under two feeds. * indicates significant difference between different dietary groups, different letters represent significant difference between different sampling months for the same diet, p < 0.05.
Fishes 08 00045 g003
Figure 4. Variation of metabolic enzyme (a) LDH and (b) ALP activities between months under two feeds. Different letters represent significant difference between different sampling months for the same diet, p < 0.05.
Fishes 08 00045 g004
Figure 5. Variation of protein (a) TP, (b) ALB, and (c) GLO content between months under two feeds. * indicates significant difference between different dietary groups, different letters represent significant difference between different sampling months for the same diet, p < 0.05.
Fishes 08 00045 g005
Figure 6. Variation of protein (a) A/G and (b) CRP content between months under two feeds. * indicates significant difference between different dietary groups, different letters represent significant difference between different sampling months for the same diet, p < 0.05.
Fishes 08 00045 g006
Figure 7. Variation of metabolites (a) TG, (b) CHOL, (c) HDL, and (d) LDL between months under two feeds. * indicates significant difference between different dietary groups, different letters represent significant difference between different sampling months for the same diet, p < 0.05.
Fishes 08 00045 g007
Figure 8. Biplot originating from principal component analysis integrates all measured variables (ALT, AST, LDH, ALP, TP, ALB, GLO, TG, CHOL, HDL, LDL, and CRP) for (a) natural food groups, (b) formulated diet groups at four time points (: February, : May, : August, : November). and (c) two styles of feeds (: natural food, : formulated diet).
Fishes 08 00045 g008
Table 1. The composition of natural food and formulated diet (% matter).
IngredientDiet Treatment
Crucian Carp DietLargemouth Bass DietFormulated Diet
Crude protein15.03 ± 0.1618.19 ± 1.51≥40
Crude lipid10.32 ± 0.266.32 ± 0.83≥12
Ash3.57 ± 0.031.01 ± 0.02≤18
Moisture67.00 ± 0.3784.59 ± 0.21≤12
Table 2. The effects of seasonal changes on morphological (Natural food group).
GroupsNatural Food
FebruaryMayAugustNovember
TL (cm)248.8 ± 18.4 A244.1 ± 19.0 A245.3 ± 17.5 A240.3 ± 18.9 A
FL (cm)224.3 ± 17.1 A219.3 ± 17.3 A222.8 ± 16.0 A219.8 ± 16.0 A
BL (cm)201.6 ± 15.2 A199.3 ± 15.3 A200.3 ± 15.0 A199.3 ± 14.2 A
PFBC (cm)107.8 ± 9.2 A98.6 ± 6.9 B99.4 ± 8.3 B98.8 ± 9.7 B
MBC (cm)116.1 ± 10.7 A109.8 ± 9.8 A107.4 ± 10.6 A106.4 ± 10.8 A
AFBC (cm)98 ± 11.2 B91.8 ± 9.5 AB89.5 ± 9.1 A86.3 ± 9.7 A
Body weight (kg)115.2 ± 28.9 A112.4 ± 28.4 A110.4 ± 26.7 A110.4 ± 27.4 A
The same capital letter represents, and there was no significant difference at different times (p < 0.05).
Table 3. The effects of seasonal changes on morphological (Formulated diet group).
GroupsFormulated Diet
FebruaryMayAugustNovember
TL (cm)214 ± 16.0 A212.4 ± 15.9 B211.7 ± 15.3 A210.8 ± 16.4 A
FL (cm)194 ± 14.8 A185.9 ± 14.2 B191.7 ± 14.2 AB193.2 ± 14.3 AB
BL (cm)174.2 ± 13.6 A168.6 ± 12.9 A171.6 ± 12.8 A171.9 ± 18.5 A
PFBC (cm)88.6 ± 6.1 C82.0 ± 6.6 A83.8 ± 6.4 AB85.8 ± 7.4 BC
MBC (cm)92.7 ± 7.2 B86.4 ± 6.9 A88.8 ± 7.0 A90.0 ± 7.9 AB
AFBC (cm)75.7 ± 5.3 A70.4 ± 6.0 B72.4 ± 5.7 BC73.8 ± 6.8 AC
Body weight (kg)60.1 ± 12.1 A61.2 ± 13.0 A63.5 ± 13.4 A65.9 ± 17.8 A
The same capital letter represents, and there was no significant difference at different times (p < 0.05).
Table 4. The effects of natural and formulated feeds on the growth of Chinese sturgeon.
DietNatural FoodFormulated Diet
Initial weight (kg)115.2 ± 28.960.1 ± 12.1
Final weight (kg)110.4 ± 27.465.9 ± 17.8
Initial TL (cm)248.8 ± 18.4214 ± 16.0
Final TL (cm)240.3 ± 18.9210.8 ± 16.39
SGR(%)−1.84.2
SGRL(%)−1.47−0.63
Disclaimer/Publisher’s Note: The statements, opinions and data contained in all publications are solely those of the individual author(s) and contributor(s) and not of MDPI and/or the editor(s). MDPI and/or the editor(s) disclaim responsibility for any injury to people or property resulting from any ideas, methods, instructions or products referred to in the content.

