Competition between Invasive Ruffe (Gymnocephalus cernua) and Native Yellow Perch (Perca flavescens) in Experimental Mesocosms


Abstract
1. Introduction
2. Results
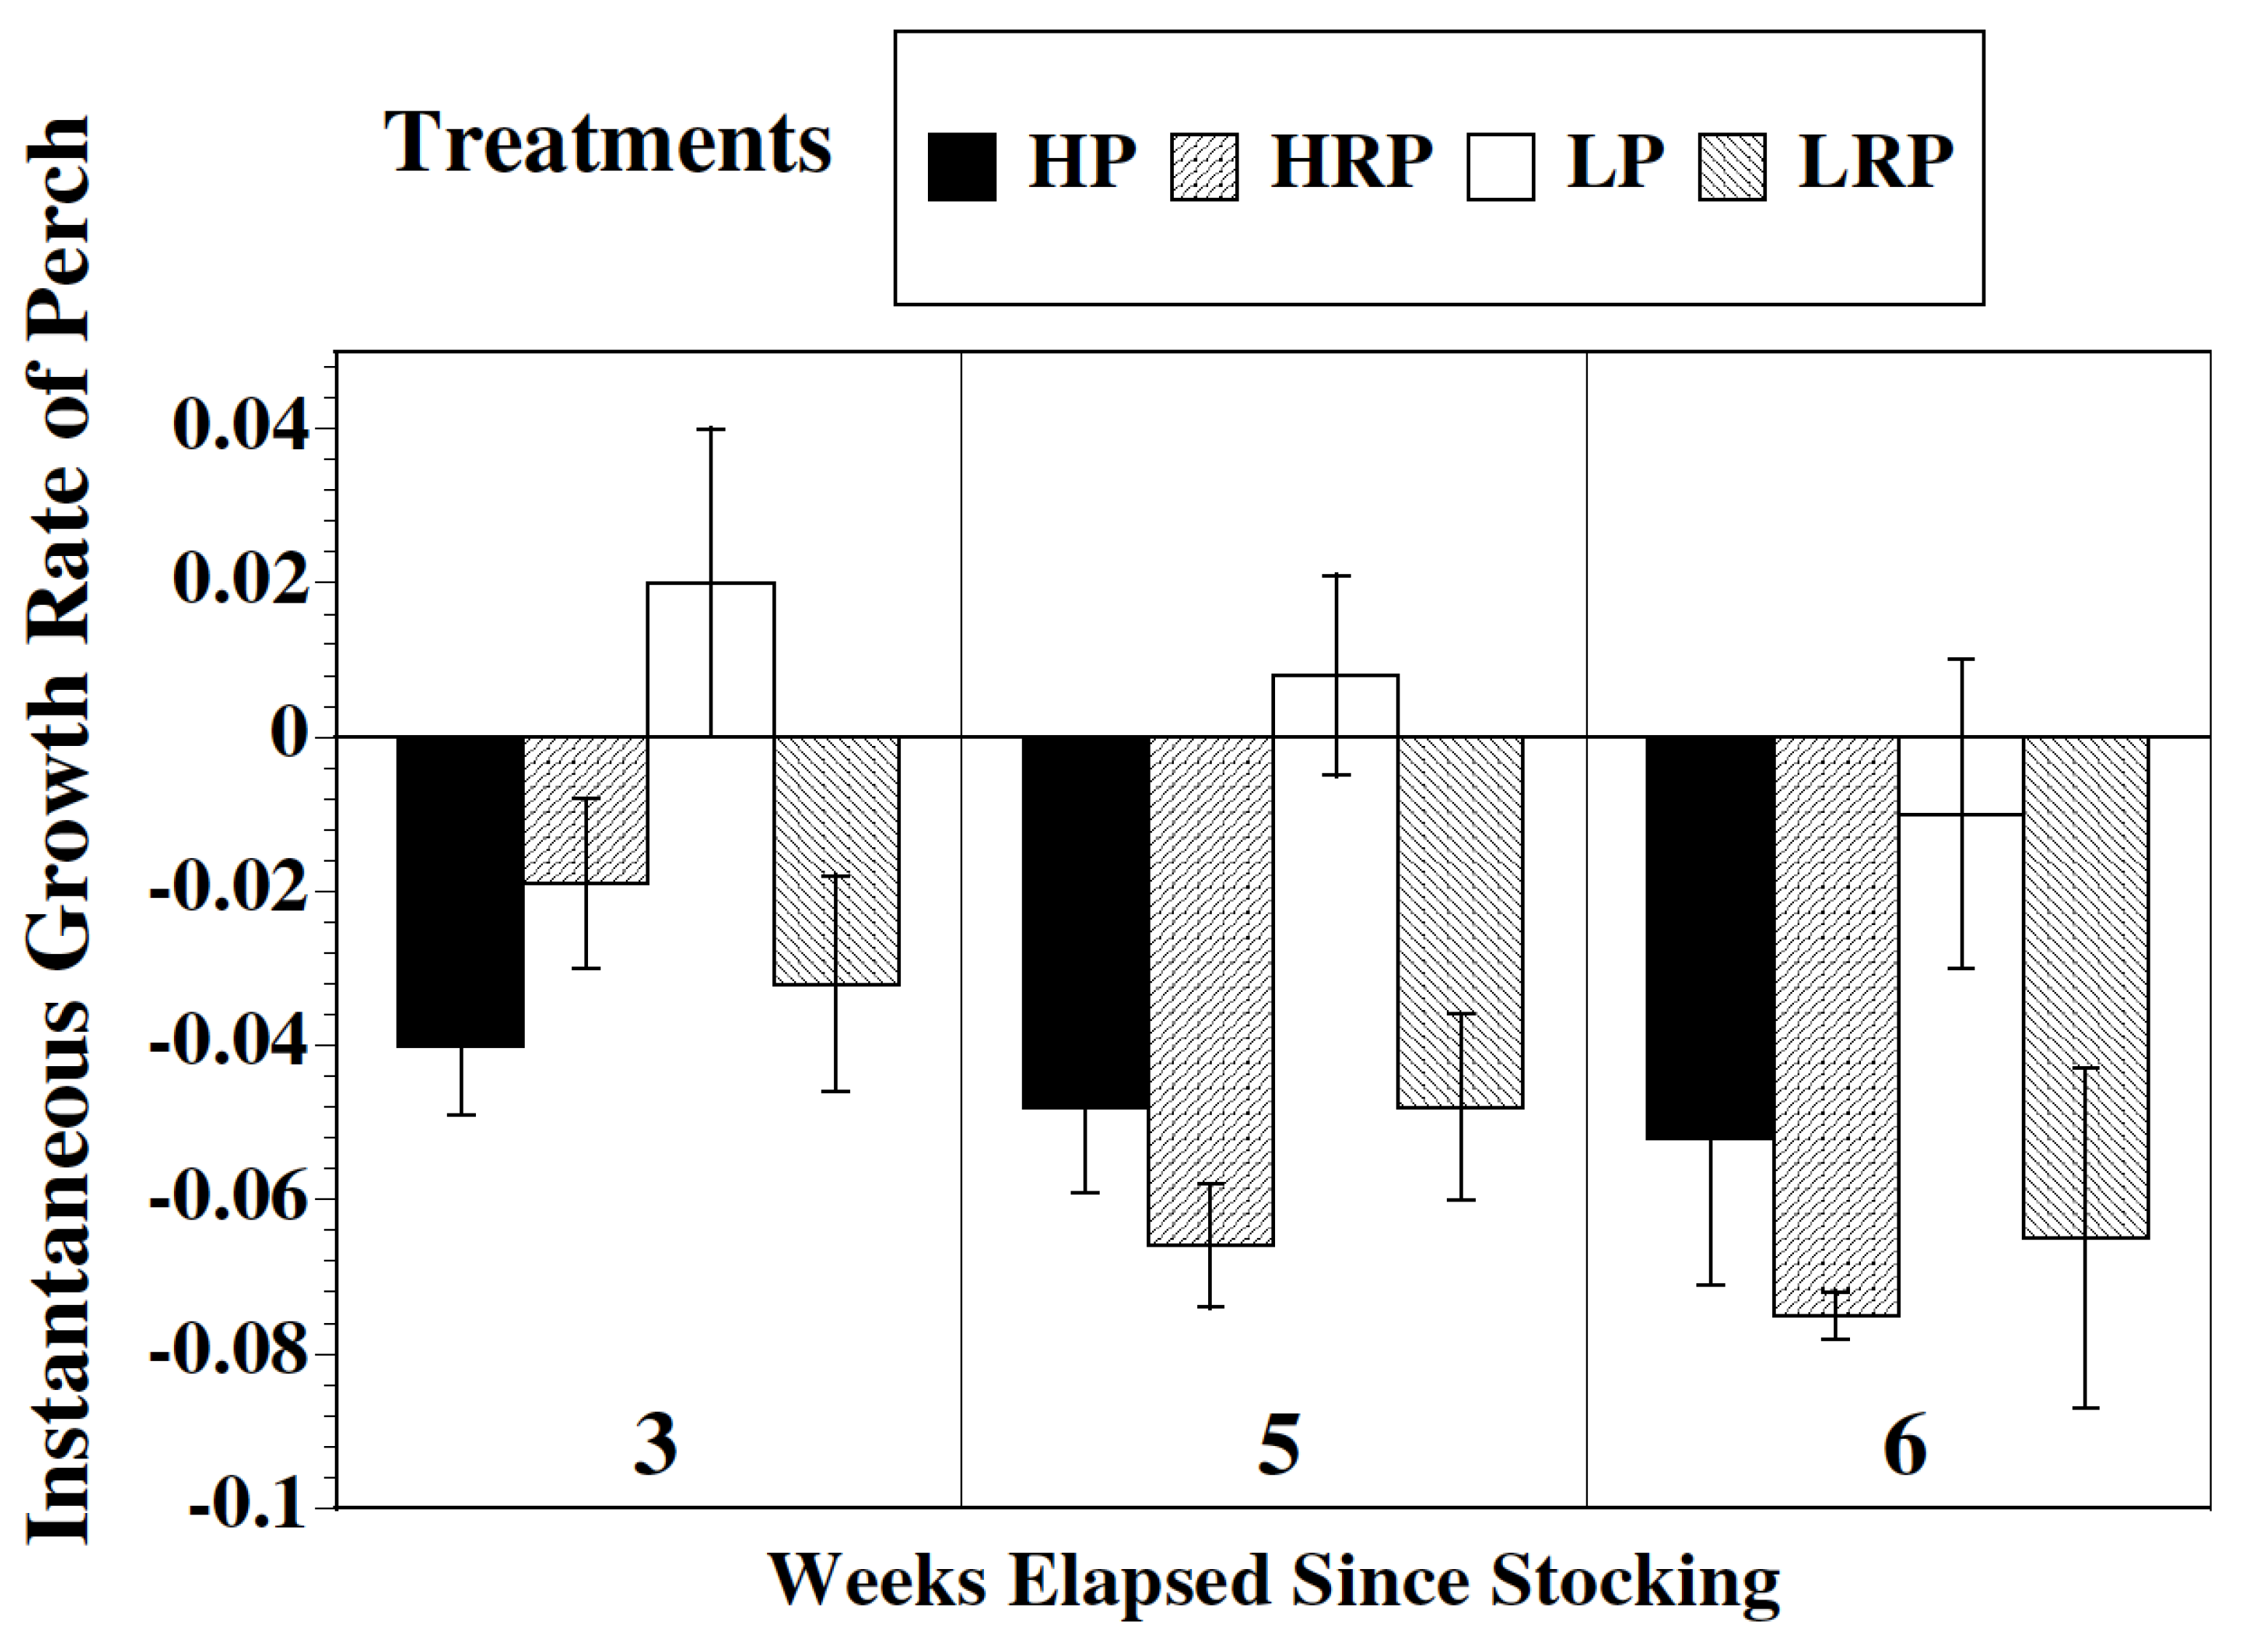
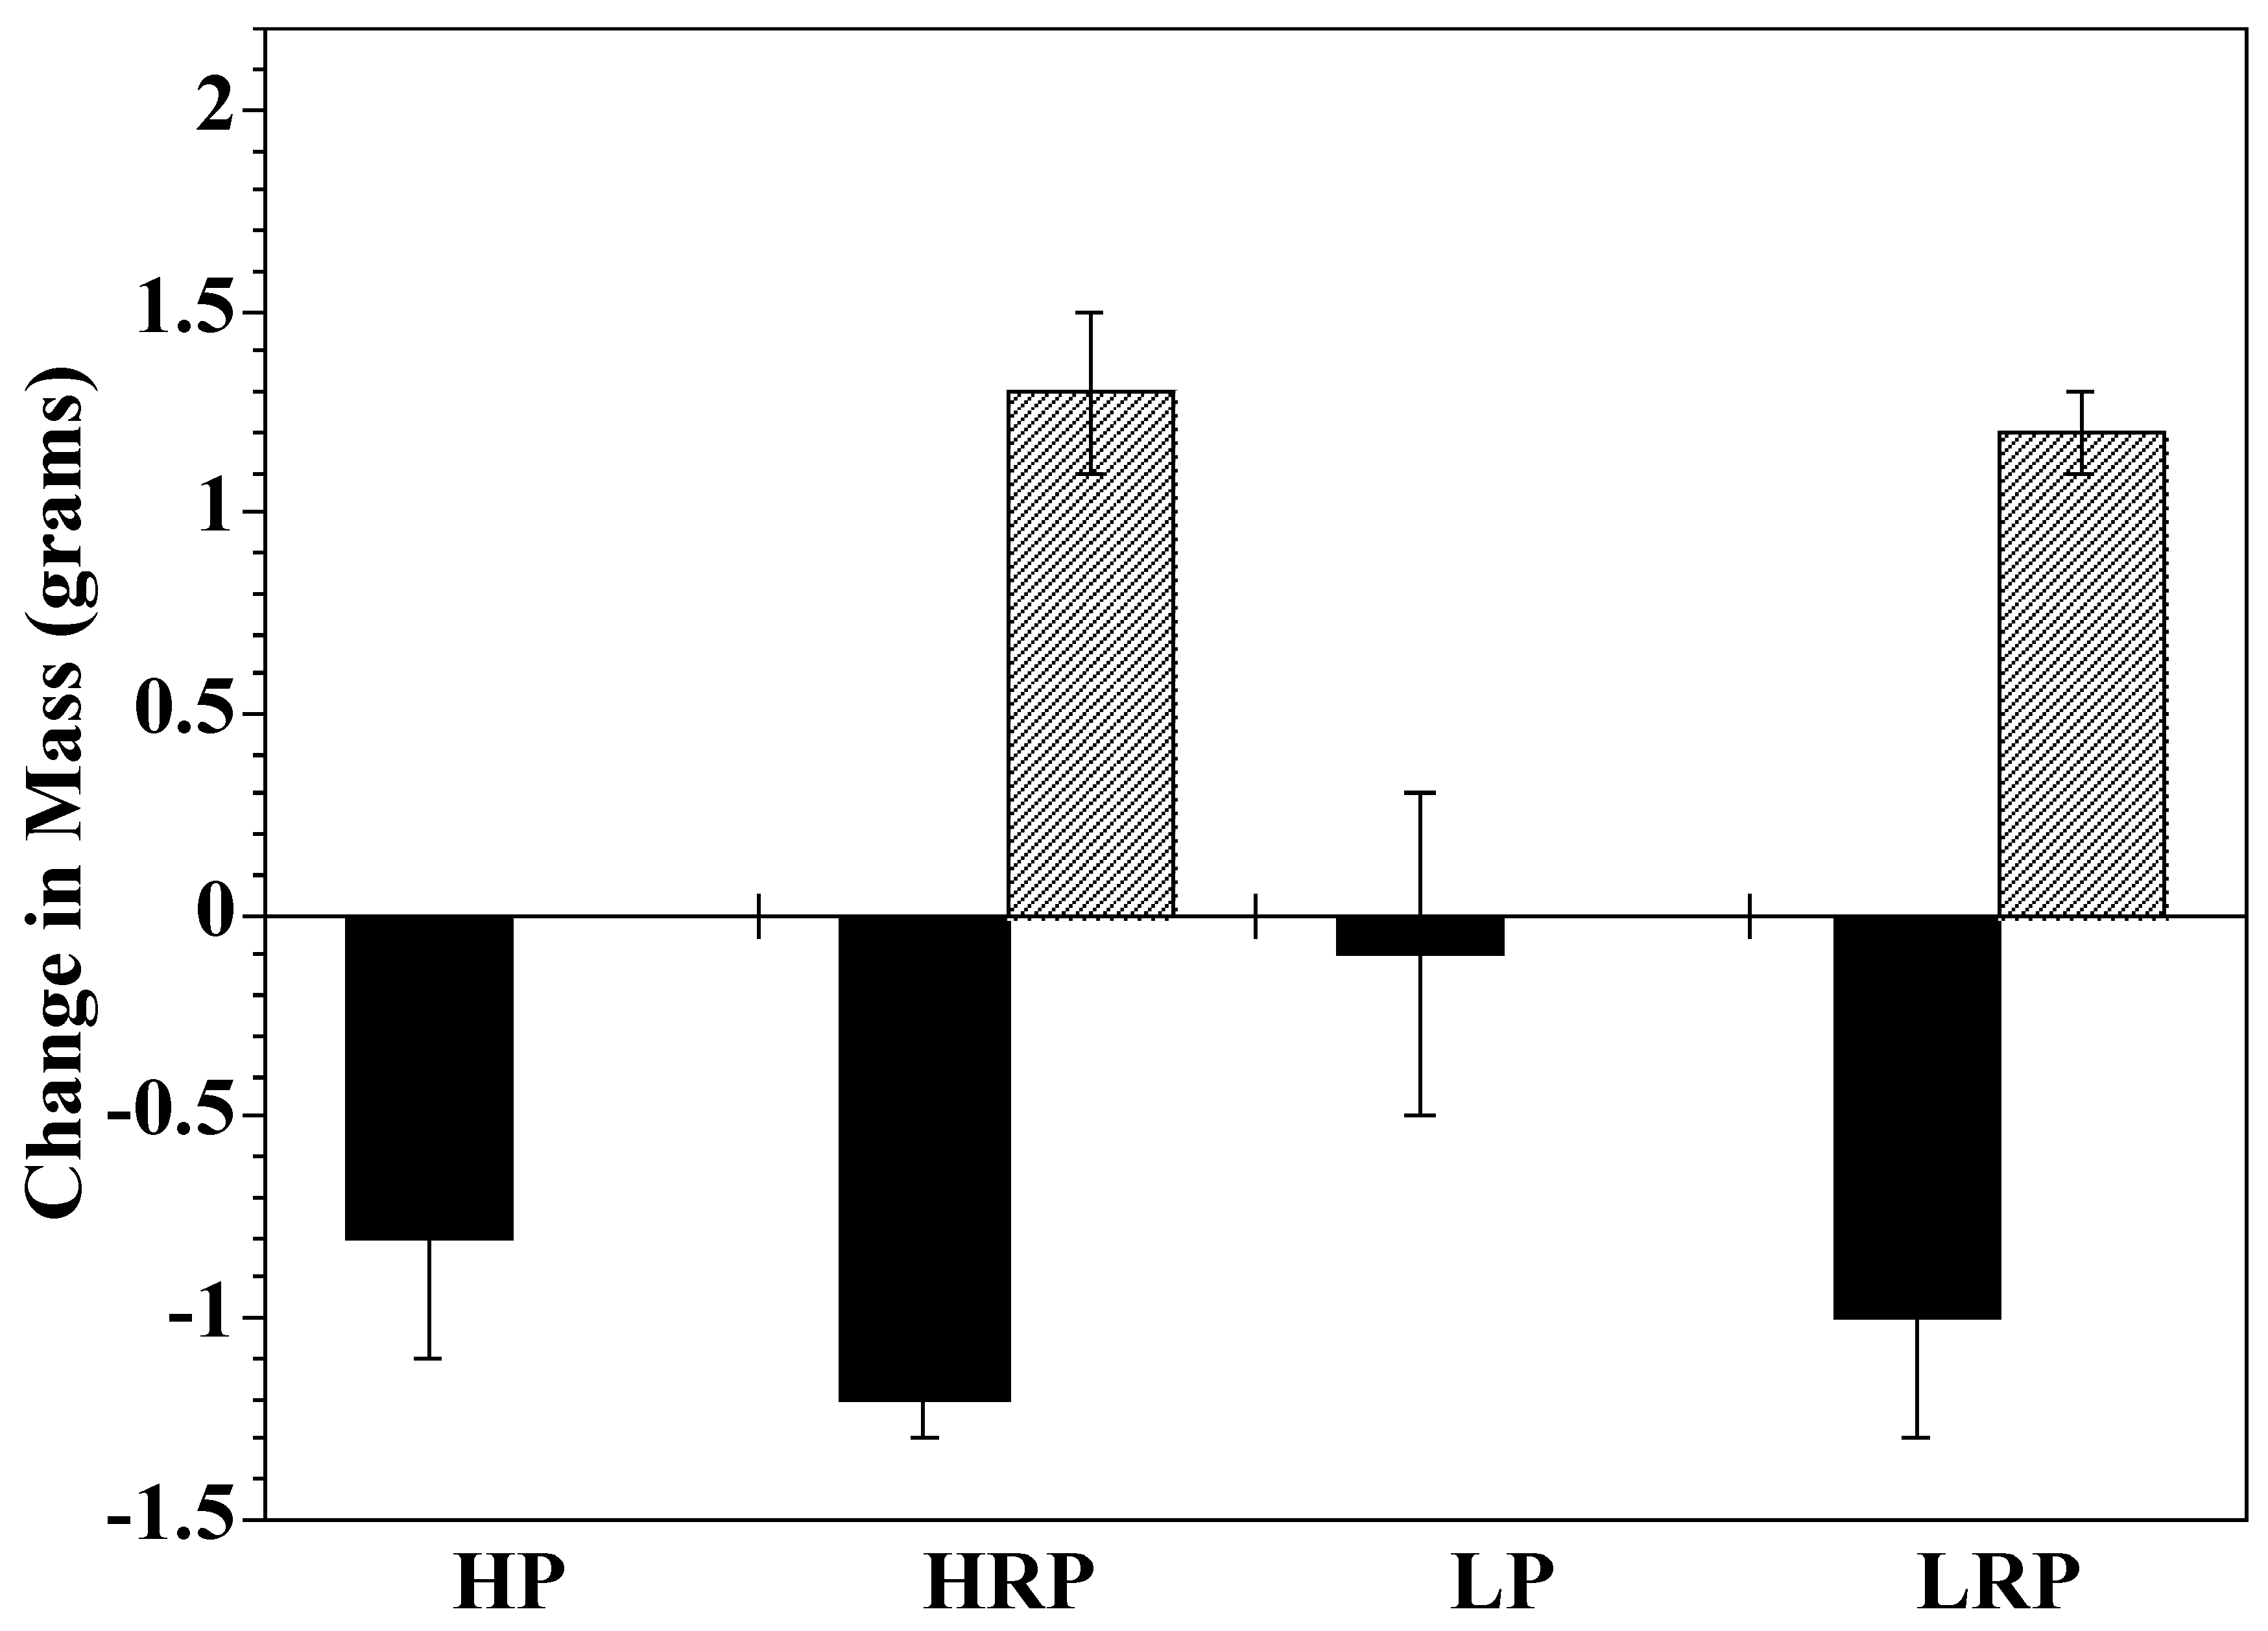
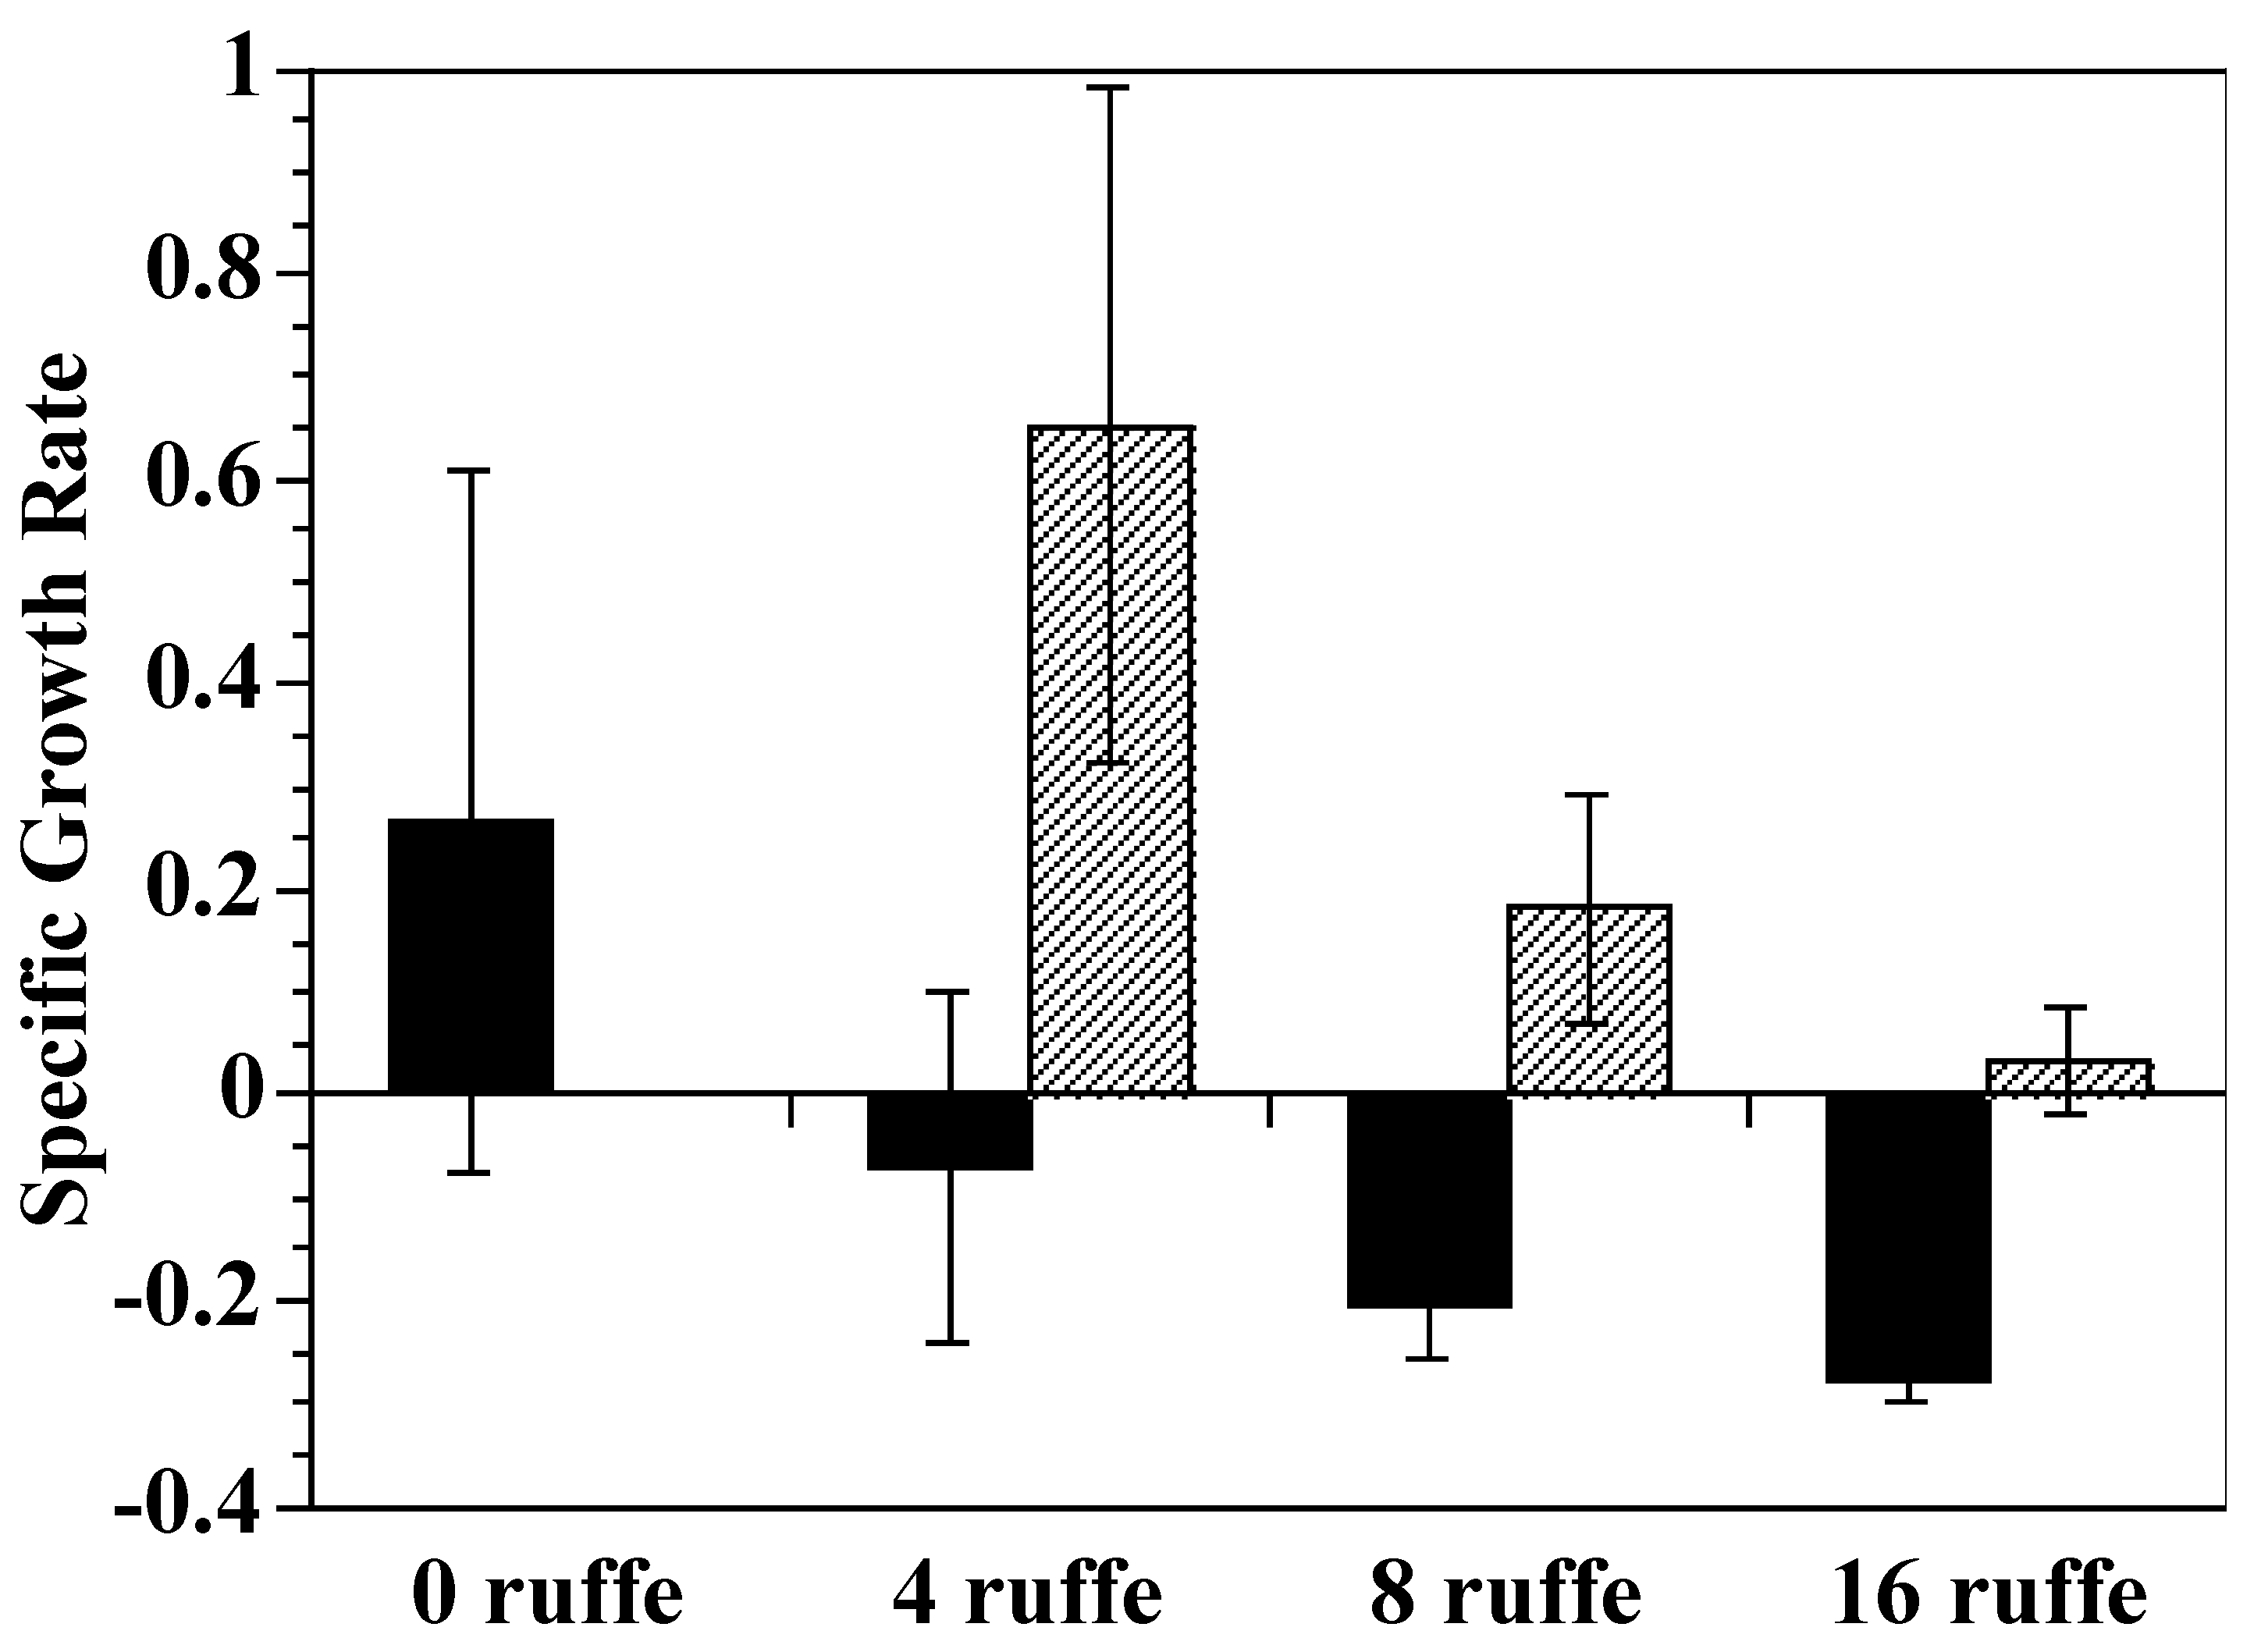
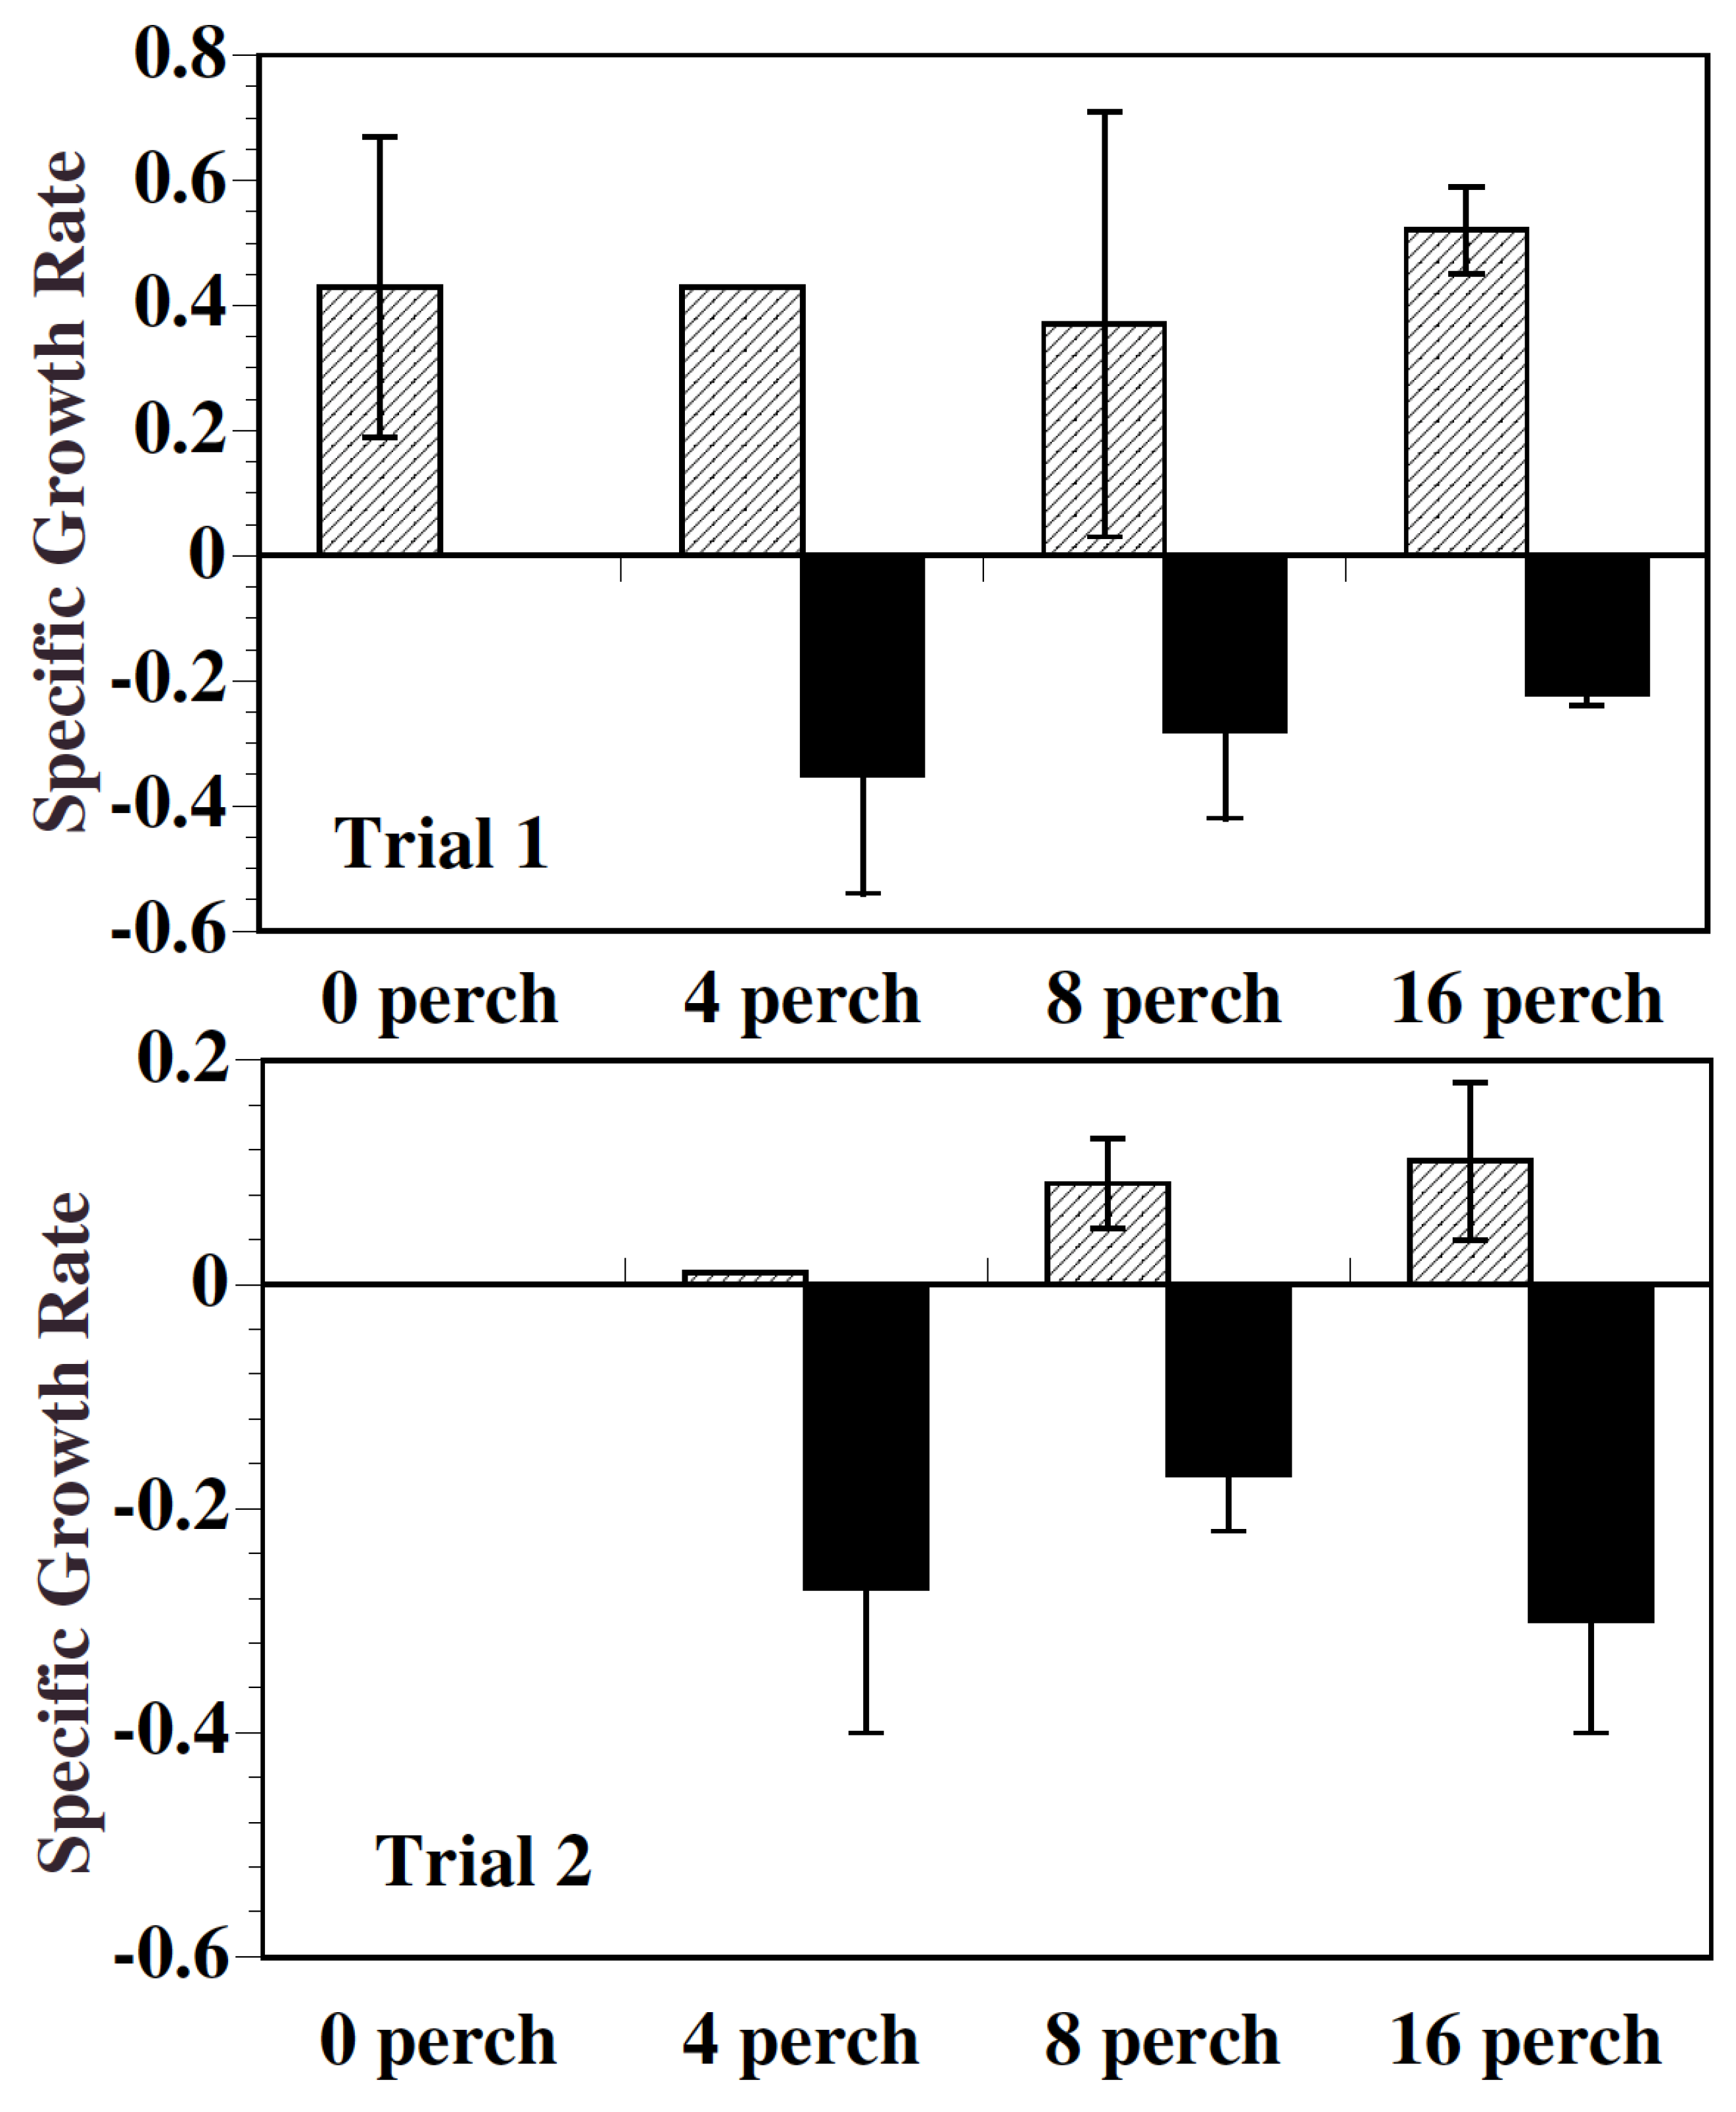
2.1. Growth
2.2. Diet
2.3. Food Consumption
3. Discussion
3.1. Growth
3.2. Diet and Consumption
3.3. Competitive Mechanisms and their Implications
4. Materials and Methods
4.1. General Procedures
4.2. Ruffe and Fish Density Experiment Design and Analysis
4.3. Ruffe and Perch Density Gradient Experiment Design and Analysis
4.4. Bioenergetics Modeling
Supplementary Materials
Author Contributions
Funding
Acknowledgments
Conflicts of Interest
References
- Pratt, D.M.; Blust, W.H.; Selgeby, J.H. Ruffe, Gymnocephalus cernua: Newly introduced in North America. Can. J. Fish. Aquat. Sci. 1992, 49, 1616–1618. [Google Scholar] [CrossRef]
- Stepien, C.A.; Brown, J.E.; Neilson, M.E.; Tumeo, M.A. Genetic diversity of invasive species in the great lakes versus their eurasian source populations: Insights for risk analysis. Risk Anal. 2005, 25, 1043–1060. [Google Scholar] [CrossRef] [PubMed]
- Stepien, C.A. Genetic change versus stasis over the time course of invasions: Trajectories of two concurrent, allopatric introductions of the Eurasian ruffe. Aquat. Invasions 2018, 13, 537–552. [Google Scholar] [CrossRef]
- Bronte, C.R.; Evrard, L.M.; Brown, W.P.; Mayo, K.R.; Edwards, A.J. Fish community changes in the St. Louis river estuary, lake superior, 1989–1996: Is it ruffe or population dynamics? J. Great Lakes Res. 1998, 24, 309–318. [Google Scholar] [CrossRef]
- Ogle, D.H.; Selgeby, J.H.; Saving, J.E.; Newman, R.; Henry, M.G. Predation on ruffe by native fishes of the St. Louis river estuary, Lake Superior, 1989–1991. N. Am. J. Fish. Manag. 1996, 16, 115–123. [Google Scholar] [CrossRef]
- Gutsch, M.; Hoffman, J.C. A review of Ruffe (Gymnocephalus cernua) life history in its native versus non-native range. Rev. Fish. Biol. Fish. 2016, 26, 213–233. [Google Scholar] [CrossRef]
- Tucker, A.J.; Chadderton, W.L.; Jerde, C.L.; Renshaw, M.A.; Uy, K.; Gantz, C.; Mahon, A.R.; Bowen, A.; Strakosh, T.; Bossenbroek, J.M.; et al. A sensitive environmental DNA (eDNA) assay leads to new insights on Ruffe (Gymnocephalus cernua) spread in North America. Biol. Invasions 2016, 18, 3205–3222. [Google Scholar] [CrossRef]
- Hölker, F.; Thiel, R. Biology of Ruffe (Gymnocephalus cernuus (L.))—A review of selected aspects from European literature. J. Great Lakes Res. 1998, 24, 186–204. [Google Scholar] [CrossRef]
- Bergman, E. Effects of roach Rutilus rutilus on Two Percids, Perca fluviatilis and Gymnocephalus cernua: Importance of species interactions for diet shifts. Oikos 1990, 57, 241. [Google Scholar] [CrossRef]
- Jamet, J.-L. Feeding activity of adult roach (Rutilus rutilus (L.)), perch (Perca fluviatilis L.) and ruffe (Gymnocephalus cernuus (L.)) in eutrophic Lake Aydat (France). Aquat. Sci. 1994, 56, 376–387. [Google Scholar] [CrossRef]
- Ogle, D.H.; Selgeby, J.H.; Newman, R.; Henry, M.G. Diet and feeding periodicity of Ruffe in the St. Louis River estuary, Lake Superior. Trans. Am. Fish. Soc. 1995, 124, 356–369. [Google Scholar] [CrossRef]
- Ogle, D.H. A synopsis of the biology and life history of Ruffe. J. Great Lakes Res. 1998, 24, 170–185. [Google Scholar] [CrossRef]
- Savino, J.F.; Kolar, C.S. Competition between Nonindigenous Ruffe and Native Yellow Perch in Laboratory Studies. Trans. Am. Fish. Soc. 1996, 125, 562–571. [Google Scholar] [CrossRef]
- Sierszen, M.E.; Keough, J.R.; Hagley, C.A. Trophic analysis of Ruffe (Gymnocephalus cernuus) and White Perch (Morone americana) in a Lake Superior coastal food web, using stable isotope techniques. J. Great Lakes Res. 1996, 22, 436–443. [Google Scholar] [CrossRef]
- Fullerton, A.H.; Lamberti, G.A.; Lodge, D.M.; Berg, M.B. Prey Preferences of Eurasian Ruffe and Yellow Perch: Comparison of laboratory results with composition of Great Lakes Benthos. J. Great Lakes Res. 1998, 24, 319–328. [Google Scholar] [CrossRef]
- Fullerton, A.H.; Lamberti, G.A. A comparison of habitat use and habitat-specific feeding efficiency by Eurasian ruffe (Gymnocephalus cernuus) and yellow perch (Perca flavescens). Ecol. Freshw. Fish. 2006, 15, 1–9. [Google Scholar] [CrossRef]
- Schleuter, D.; Eckmann, R. Competition between perch (Perca fluviatilis) and ruffe (Gymnocephalus cernuus): The advantage of turning night into day. Freshw. Biol. 2006, 51, 287–297. [Google Scholar] [CrossRef]
- Janssen, J. Comparison of response distance to prey via the lateral line in the Ruffe and Yellow Perch. J. Fish. Biol. 1997, 51, 921–930. [Google Scholar] [CrossRef]
- Fullerton, A.H.; Lamberti, G.A.; Lodge, D.M.; Goetz, F.W. Potential for resource competition between Eurasian Ruffe and Yellow Perch: Growth and RNA responses in laboratory experiments. Trans. Am. Fish. Soc. 2000, 129, 1331–1339. [Google Scholar] [CrossRef]
- Savino, J.F.; Kostich, M.J. Aggressive and foraging behavioral interactions among Ruffe. Environ. Boil. Fishes 2000, 57, 337–345. [Google Scholar] [CrossRef]
- Henson, F.G.; Newman, R.M. Effect of temperature on growth at ration and gastric evacuation rate of ruffe (Gymnocephalus cernuus L.). Trans. Am. Fish. Soc. 2000, 129, 552–560. [Google Scholar] [CrossRef]
- Bauer, C.R.; Bobeldyk, A.M.; Lamberti, G.A. Predicting habitat use and trophic interactions of Eurasian ruffe, round gobies, and zebra mussels in nearshore areas of the Great Lakes. Biol. Invasions 2006, 9, 667–678. [Google Scholar] [CrossRef]
- Bergman, E.; Greenberg, L.A. Competition between a Planktivore, a Benthivore, and a species with ontogenetic diet shifts. Ecology 1994, 75, 1233–1245. [Google Scholar] [CrossRef]
- Leigh, P. Benefits and costs of the Ruffe control program for the Great Lakes fishery. J. Great Lakes Res. 1998, 24, 351–360. [Google Scholar] [CrossRef]
- US Fish and Wildife Service (USFWS). Ruffe (Gymnocephalus cernua) Ecological Risk Screening Summary; US Fish and Wildlife Service, 2015. Available online: https://www.fws.gov/fisheries/ANS/erss/highrisk/Gymnocephalus-cernua-ERSS-revision-June%202015.pdf (accessed on 9 August 2020).
- Grippo, M.; Hlohowskyj, I.; Fox, L.; Herman, B.; Pothoff, J.; Yoe, C.; Hayse, J. Aquatic nuisance species in the Great Lakes and Mississippi River Basin-A risk assessment in support of GLMRIS. Environ. Manag. 2016, 59, 154–173. [Google Scholar] [CrossRef] [PubMed]
- Zhang, H.; Rutherford, E.S.; Mason, D.M.; Wittmann, M.E.; Lodge, D.M.; Zhu, X.; Johnson, T.B.; Tucker, A. Modeling potential impacts of three benthic invasive species on the Lake Erie food web. Biol. Invasions 2019, 21, 1697–1719. [Google Scholar] [CrossRef]
- Schoener, T.W. Field Experiments on interspecific competition. Am. Nat. 1983, 122, 240–285. [Google Scholar] [CrossRef]
- Hanson, J.M.; Leggett, W.C. Experimental and field evidence for inter-and intraspecific competition in two freshwater fishes. Can. J. Fish. Aquat. Sci. 1985, 42, 280–286. [Google Scholar] [CrossRef]
- Hanson, J.M.; Leggett, W.C. Effect of competition between two freshwater fishes on prey consumption and abundance. Can. J. Fish. Aquat. Sci. 1986, 43, 1363–1372. [Google Scholar] [CrossRef]
- Gozlan, R.E.; Britton, J.R.; Cowx, I.; Copp, G.H. Current knowledge on non-native freshwater fish introductions. J. Fish. Biol. 2010, 76, 751–786. [Google Scholar] [CrossRef]
- Ricciardi, A.; Hoopes, M.F.; Marchetti, M.P.; Lockwood, J.L. Progress toward understanding the ecological impacts of nonnative species. Ecol. Monogr. 2013, 83, 263–282. [Google Scholar] [CrossRef]
- Britton, J.R.; Ruiz-Navarro, A.; Verreycken, H.; Amat-Trigo, F. Trophic consequences of introduced species: Comparative impacts of increased interspecific versus intraspecific competitive interactions. Funct. Ecol. 2017, 32, 486–495. [Google Scholar] [CrossRef] [PubMed]
- Britton, J.R. Empirical predictions of the trophic consequences of non-native freshwater fishes: A synthesis of approaches and invasion impacts. Turkish J. Fish. Aquat. Sci. 2019, 19, 529–539. [Google Scholar] [CrossRef]
- Leino, J.R.; Mensinger, A.F. The benthic fish assemblage of the soft-bottom community of the Duluth-Superior Harbor before and after round goby invasion (1989–2011). J. Great Lakes Res. 2016, 42, 829–836. [Google Scholar] [CrossRef]
- Peterson, G.S.; Hoffman, J.C.; Trebitz, A.S.; West, C.W.; Kelly, J.R. Establishment patterns of non-native fishes: Lessons from the Duluth-Superior harbor and lower St. Louis River, an invasion-prone Great Lakes coastal ecosystem. J. Great Lakes Res. 2011, 37, 349–358. [Google Scholar] [CrossRef]
- Mayer, C.M.; VanDeValk, A.J.; Forney, J.L.; Rudstam, L.G.; Mills, E. Response of Yellow Perch (Perca flavescens) in Oneida Lake, New York, to the establishment of Zebra Mussels (Dreissena polymorpha). Can. J. Fish. Aquat. Sci. 2000, 57, 742–754. [Google Scholar] [CrossRef]
- Dieterich, A.; Baumgartner, D.; Eckmann, R. Competition for food between Eurasian perch (Perca fluviatilis L.) and Ruffe (Gymnocephalus cernuus (L.)) over different substrate types. Ecol. Freshw. Fish. 2004, 13, 236–244. [Google Scholar] [CrossRef]
- AubinHorth, N.; Gingras, J.; Boisclair, D. Comparison of activity rates of 1 + yellow perch (Perca flavescens) from populations of contrasting growth rates using underwater video observations. Can. J. Fish. Aquat. Sci. 1999, 56, 1122–1132. [Google Scholar] [CrossRef]
- Cobb, S.E.; Watzin, M.C. Trophic interactions between Yellow Perch (Perca flavescens) and their benthic prey in a littoral zone community. Can. J. Fish. Aquat. Sci. 1998, 55, 28–36. [Google Scholar] [CrossRef]
- Brazner, J.C.; Tanner, D.K.; Jensen, D.A.; Lemke, A. Relative abundance and distribution of Ruffe (Gymnocephalus cernuus) in a Lake Superior Coastal Wetland Fish Assemblage. J. Great Lakes Res. 1998, 24, 293–303. [Google Scholar] [CrossRef]
- Gutsch, M. The Rise and Fall of the Ruffe (Gymnocephalus cernua) Empire in Lake Superior. Ph.D. Dissertation, University of Minnesota, Duluth, MN, USA, 2017; 207p. [Google Scholar]
- Gunderson, J.L.; Klepinger, M.R.; Bronte, C.R.; Marsden, J.E. Overview of the International Symposium on Eurasian Ruffe (Gymnocephalus cernuus) biology, impacts, and control. J. Great Lakes Res. 1998, 24, 165–169. [Google Scholar] [CrossRef]
- Mayo, K.R.; Selgeby, J.H.; McDonald, M.E. A bioenergetics modeling evaluation of top-down control of Ruffe in the St. Louis River, Western Lake Superior. J. Great Lakes Res. 1998, 24, 329–342. [Google Scholar] [CrossRef]
- Czypinski, G.D.; Ogle, D.H. Evaluating the physical removal of Ruffe (Gymnocephalus cernuus) with bottom trawling. J. Freshw. Ecol. 2011, 26, 441–443. [Google Scholar] [CrossRef]
- Drake, J.M. Risk analysis for species introductions: Forecasting population growth of Eurasian Ruffe (Gymnocephalus cernuus). Can. J. Fish. Aquat. Sci. 2005, 62, 1053–1059. [Google Scholar] [CrossRef][Green Version]
- Drake, J.M.; Lodge, D.M. Forecasting potential distributions of nonindigenous species with a genetic algorithm. Fisheries 2006, 31, 9–16. [Google Scholar] [CrossRef]
- Volta, P.; Jeppesen, E.; Campi, B.; Sala, P.; Emmrich, M.; Winfield, I. The population biology and life history traits of Eurasian Ruffe (Gymnocephalus cernuus (L.), Pisces: Percidae) introduced into eutrophic and oligotrophic lakes in Northern Italy. J. Limnol. 2013, 72, 22. [Google Scholar] [CrossRef]
- Watson, S.B.; Miller, C.; Arhonditsis, G.; Boyer, G.L.; Carmichael, W.; Charlton, M.N.; Confesor, R.; DePew, D.C.; Höök, T.O.; Ludsin, S.A.; et al. The re-eutrophication of Lake Erie: Harmful algal blooms and hypoxia. Harmful Algae 2016, 56, 44–66. [Google Scholar] [CrossRef] [PubMed]
- Sandridge, P.T.; Thorp, J.H.; Covich, A.P. Ecology and classification of North American freshwater invertebrates. J. N. Am. Benthol. Soc. 1991, 10, 466–467. [Google Scholar] [CrossRef]
- Smock, L.A. Relationships between body size and biomass of aquatic insects. Freshw. Biol. 1980, 10, 375–383. [Google Scholar] [CrossRef]
- Rosen, R.A. Length-dry weight relationships of some freshwater zooplankton a. J. Freshw. Ecol. 1981, 1, 225–229. [Google Scholar] [CrossRef]
- Litvak, M.K.; Hansell, R.I.C. Investigation of food habit and niche relationships in a cyprinid community. Can. J. Zool. 1990, 68, 1873–1879. [Google Scholar] [CrossRef]
- Henson, F.G. Competition between Ruffe (Gymnocephalus cernuus) and Yellow Perch (Perca flavescens) and the Influence of Temperature on Growth and Gastric Evacuation of Ruffe. Master’s Thesis, University of Minnesota, St. Paul, MN, USA, 1999. [Google Scholar]
- Maceina, M.J.; Bettoli, P.W.; Devries, D.R. Use of a split-plot analysis of variance design for repeated-measures fishery data. Fisheries 1994, 19, 14–20. [Google Scholar] [CrossRef]
- Busacker, G.P.; Adelman, I.R.; Goolish, E.M. Growth. In Methods for Fish Biology; Schreck, C.B., Moyle, P.B., Eds.; American Fisheries Society: Bethesda, MD, USA, 1990; pp. 363–387. [Google Scholar]
- Hanson, P.C.; Johnson, T.B.; Schindler, D.E.; Kitchell, J.F. Fish. Bioenergetics 3.0; University of Wisconsin Center for Limnology and University of Wisconsin Sea Grant Institute: Madison, WI, USA, 1997. [Google Scholar]
- Kitchell, J.F.; Stewart, D.J.; Weininger, D. Applications of a bioenergetics model to Yellow Perch (Perca flavescens) and Walleye (Stizostedion vitreum vitreum). J. Fish. Res. Board Can. 1977, 34, 1922–1935. [Google Scholar] [CrossRef]
- Schaeffer, J.S.; Haas, R.C.; Diana, J.S.; Breck, J.E. Field test of two energetic models for Yellow Perch. Trans. Am. Fish. Soc. 1999, 128, 414–435. [Google Scholar] [CrossRef]


| Treatment | 28 Perch | 14 Perch 14 Ruffe | 14 Perch | 7 Perch 7 Ruffe |
|---|---|---|---|---|
| Perch DR % | 2.09 (0.12) | 1.95 (0.14) | 2.35 (0.15) | 1.69 (0.12) |
| Perch IC (g) | 0.32 (0.02) | 0.30 (0.02) | 0.39 (0.03) | 0.27 (0.02) |
| Perch TC (g) | 9.02 (0.57) | 4.21 (0.28) | 5.41 (0.37) | 1.87 (0.11) |
| Ruffe DR % | 6.05 (0.56) | 5.47 (0.36) | ||
| Ruffe IC (g) | 0.63 (0.05) | 0.55 (0.06) | ||
| Ruffe TC (g) | 8.77 (0.68) | 3.88 (0.43) | ||
| Ruffe + Perch TC (g) | 9.02 (0.57) | 12.98 (0.71) | 5.41 (0.37) | 5.75 (0.51) |
| 11 August–15 September | |||||||
| Treatment | 0R8P | 4R8P | 8R8P | 16R8P | 8R0P | 8R4P | 8R16P |
| Ruffe DR % | 12.44 | 7.70 | 4.33 | 8.36 | 8.36 | 9.28 | |
| SE | 5.00 | 3.42 | 0.87 | 2.45 | 0.00 | 0.71 | |
| Ruffe IC (g) | 0.93 | 0.66 | 0.33 | 0.64 | 0.68 | 0.84 | |
| SE | 0.41 | 0.32 | 0.08 | 0.18 | 0.02 | 0.05 | |
| Ruffe TC (g) | 3.71 | 5.29 | 5.35 | 5.14 | 5.47 | 6.73 | |
| SE | 1.66 | 2.53 | 1.30 | 1.43 | 0.18 | 0.39 | |
| Perch DR % | 5.23 | 3.99 | 3.17 | 3.13 | 2.87 | 3.23 | |
| SE | 0.98 | 0.86 | 0.23 | 0.16 | 0.19 | 0.03 | |
| Perch IC (g) | 0.60 | 0.29 | 0.34 | 0.33 | 0.38 | 0.37 | |
| SE | 0.04 | 0.04 | 0.08 | 0.07 | 0.17 | 0.01 | |
| Perch TC (g) | 4.77 | 2.35 | 2.69 | 2.62 | 1.54 | 5.88 | |
| SE | 0.31 | 0.30 | 0.65 | 0.58 | 0.66 | 0.21 | |
| Total C (g) | 4.77 | 6.06 | 7.98 | 7.97 | 5.14 | 7.00 | 12.61 |
| SE | 0.31 | 1.95 | 3.18 | 1.89 | 1.43 | 0.48 | 0.18 |
| 22 September–28 October | |||||||
| Treatment | 0R8P | 4R8P | 8R8P | 16R8P | 8R0P | 8R4P | 8R16P |
| Ruffe DR % | 5.43 | 3.28 | 2.67 | 2.47 | 3.44 | ||
| SE | - | 0.42 | - | 0.00 | 0.66 | ||
| Ruffe IC (g) | 0.54 | 0.25 | 0.18 | 0.19 | 0.25 | ||
| SE | - | 0.04 | - | 0.02 | 0.06 | ||
| Ruffe TC (g) | 2.17 | 2.03 | 2.95 | 1.50 | 1.97 | ||
| SE | - | 0.32 | - | 0.16 | 0.46 | ||
| Perch DR % | 1.59 | 2.08 | 1.84 | 1.61 | 1.50 | 1.53 | |
| SE | - | - | 0.12 | 0.11 | 0.33 | 0.23 | |
| Perch IC (g) | 0.14 | 0.18 | 0.18 | 0.16 | 0.18 | 0.15 | |
| SE | - | - | 0.01 | 0.01 | 0.04 | 0.02 | |
| Perch TC (g) | 1.15 | 1.45 | 1.46 | 1.30 | 0.72 | 2.45 | |
| SE | - | - | 0.12 | 0.04 | 0.15 | 0.39 | |
| Total C (g) | 1.15 | 3.62 | 3.49 | 4.25 | 2.22 | 4.42 | |
| SE | - | - | 0.28 | - | 0.01 | 0.85 | |
| Treatments | High Perch Alone | High Perch and Ruffe | Low Perch Alone | Low Perch and Ruffe |
|---|---|---|---|---|
| Species Numbers | 0R 28P | 14R 14P | 0R 14P | 7R 7P |
| Ruffe (g) | 152 ± 15 | 74 ± 7 | ||
| Perch (g) | 435 ± 12 | 226 ± 30 | 229 ± 25 | 116 ± 10 |
| Increasing Ruffe | ||||
| Species Numbers | 0R 8P | 4R 8P | 8R 8P | 16R 8P |
| Ruffe (g) | 29 ± 18 | 60 ± 5 | 118 ± 18 | |
| Perch (g) | 82 ± 50 | 64 ± 32 | 85 ± 25 | 87 ± 45 |
| Increasing Perch | ||||
| Species Numbers | 0P 8R | 4P 8R | 8P 8R | 16P 8R |
| Perch (g) | 53 ± 36 | 85 ± 25 | 179 ± 28 | |
| Ruffe (g) | 58 ± 11 | 61 ± 11 | 60 ± 5 | 60 ± 12 |
Publisher’s Note: MDPI stays neutral with regard to jurisdictional claims in published maps and institutional affiliations. |
© 2020 by the authors. Licensee MDPI, Basel, Switzerland. This article is an open access article distributed under the terms and conditions of the Creative Commons Attribution (CC BY) license (http://creativecommons.org/licenses/by/4.0/).
Share and Cite
Newman, R.M.; Henson, F.G.; Richards, C. Competition between Invasive Ruffe (Gymnocephalus cernua) and Native Yellow Perch (Perca flavescens) in Experimental Mesocosms. Fishes 2020, 5, 33. https://doi.org/10.3390/fishes5040033
Newman RM, Henson FG, Richards C. Competition between Invasive Ruffe (Gymnocephalus cernua) and Native Yellow Perch (Perca flavescens) in Experimental Mesocosms. Fishes. 2020; 5(4):33. https://doi.org/10.3390/fishes5040033
Chicago/Turabian StyleNewman, Raymond M., Fred G. Henson, and Carl Richards. 2020. "Competition between Invasive Ruffe (Gymnocephalus cernua) and Native Yellow Perch (Perca flavescens) in Experimental Mesocosms" Fishes 5, no. 4: 33. https://doi.org/10.3390/fishes5040033
APA StyleNewman, R. M., Henson, F. G., & Richards, C. (2020). Competition between Invasive Ruffe (Gymnocephalus cernua) and Native Yellow Perch (Perca flavescens) in Experimental Mesocosms. Fishes, 5(4), 33. https://doi.org/10.3390/fishes5040033