Abstract
Sustained exercise in aquaculture is known to improve the health and growth of finfish. Implementing exercise regimes has become an increasing focus in aquaculture practice. This study examined the relationship between the preferred swimming speed (Upref) and the optimal swimming speed (Uopt) in rainbow trout (Oncorhynchus mykiss) under non-migratory conditions typical of aquaculture environments. Using a circular raceway, rainbow trout were allowed to swim voluntarily to determine Upref. Uopt was measured using a forced-swimming test in a swim tunnel respirometer. Experiments were conducted at three temperatures (10 °C, 15 °C, and 20 °C). The results revealed a significant difference between Upref (1.18 ± 0.14, 1.17 ± 0.19, and 1.24 ± 0.15 BL s−1, respectively) and Uopt (1.4 ± 0.19, 1.5 ± 0.15, and 1.6 ± 0.24 BL s−1, respectively) across all temperatures. Aerobic scope was greatest at 15 °C (3.8), consistent with the species’ thermal range. Notably, swimming at Upref required 18–22% less energy than Uopt, suggesting that Upref is more suitable for aquaculture systems. This study introduces a minimally invasive and stress-free method for determining Upref and provides insights that can optimize flow regimes in aquaculture tanks, improving both energy efficiency and fish welfare.
Keywords:
preferred swimming speed; optimal swimming speed; swim tunnel respirometry; exercise; rainbow trout; aquaculture; temperature Key Contribution:
The present study demonstrated a novel system for testing the preferred swimming speed. In addition, the results showed that rainbow trout prefer to swim at a slower speed than the optimal swimming speed at three different temperatures.
1. Introduction
Swimming of fishes is fundamentally connected to biological processes such as early development, maturation, reproduction, and growth. Some species have adapted to take on long-distance migration between feeding and breeding grounds [1,2]. Many fish species have developed swimming techniques that demand minimal energetic cost and are optimized to take on long-distance migrations. Understanding these swimming dynamics and physiological traits is of great interest when we look towards domestication and industrialization of fish for aquaculture [3].
Exercising fish has been shown to improve cardiac performance, disease tolerance, and growth efficiency [4,5,6,7]. However, to implement exercise regimes in tanks or raceways in Recirculated Aquaculture Systems (RAS), a broader understanding of teleost fish species’ swimming energetics is needed. Teleost fish in their natural environment show a great variety of locomotive strategies while feeding, migrating, and breeding [3]. Fish in aquaculture, however, are not subject to the same natural exposure in their swimming patterns. To translate these naturally evolved swimming capabilities into aquaculture, studies have characterized and described the swimming capabilities of fish. These swimming capabilities can be characterized into different stages: sustained swimming, where the fish can swim without fatigue, relying solely on aerobic red musculature; prolonged swimming, where fatigue occurs after a period of time, powered by both red musculature and some white glycolytic musculature; and burst swimming, which involves short, intense sprints that can only be maintained for brief periods, primarily powered by anaerobic white musculature [1,8,9].
Studies that have implemented flow regimes into RAS have shown improved growth and reduced stress in many salmonid species such as rainbow trout (Oncorhynchus mykiss), Arctic charr (Salvelinus alpinus), and Atlantic salmon (Salmo salar) [10,11,12,13]. Even for non-salmonid species, such as gilthead seabream (Sparus aurata) and yellowtail kingfish (Seriola lalandi) [14,15], sustained exercise has shown growth improvement and disease reduction. These studies have suggested that the water velocity implemented in sustained exercise regimes should be at a fish species’ optimal swimming speed (Uopt). Optimal swimming speed is the speed at which the metabolic rate is lowest per distance covered. Optimal swimming speed can also be described as the minimal cost of transport (COTmin), which is the least amount of energy used to move a given mass a certain distance [16], whereas preferred swimming speed (Upref) refers to the speed at which fish choose to swim during voluntary activities, reflecting their performance for routine behaviors. It is influenced by factors such as environmental conditions and metabolic rate, and is typically a small speed range in both flowing and still water. Upref is an important measure of fish behavior, energy efficiency, and ecological performance, and is used in various studies, including those related to aquaculture and migration [9].
The present study examined the relationship between preferred swimming speed (Upref) and optimal swimming speed (Uopt) in rainbow trout at different temperatures, with a focus on non-migratory conditions typical of aquaculture environments. Specifically, the present study investigated if the optimal swimming speed (Uopt) reflects the preferred swimming speed (Upref) in rainbow trout. The study aimed to determine rainbow trout Uopt using swim tunnel respirometry [17] and further determine the Upref. Rainbow trout was used as a model species, due to its extensive appearance in fish physiology literature. The three experimental temperatures (10, 15, and 20 °C) were chosen, as they can each represent the lower, optimal, and upper thermal thresholds when studying the physiological performance of rainbow trout, and this is also consistent with previous research on the species [18]. This study demonstrates a new approach by implementing a circular raceway with consistent flow, different from other studies [9,19] that investigated volitional swimming.
2. Materials and Methods
2.1. Experimental Design
This study investigated the relationship between preferred swimming speed (Upref) and optimal swimming speed (Uopt) in rainbow trout under different temperature conditions (10, 15, and 20 °C). All experiments agreed with the EU Directive 2010/63/EU for animal experiments and were performed with permission from the Danish Animal Experiments Inspectorate (License number: 2018-15-0201-01466). Two experimental setups were used: a circular raceway for volitional swimming (Figure 1) and a swim tunnel respirometer for forced-swimming tests (Figure 2). The experiments aimed to measure Upref in a minimally invasive environment and compare it with Uopt, determined through a traditional forced-swimming respirometry method. The temperatures of the groups were selected as 20 for higher than optimal temperature and two temperatures lower than this. Holding and experimenting on the species, being easier at the lab below the optimum than above it, as the system water was 10. The specific values are represented in other literature as well, enabling comparison to other metrics.
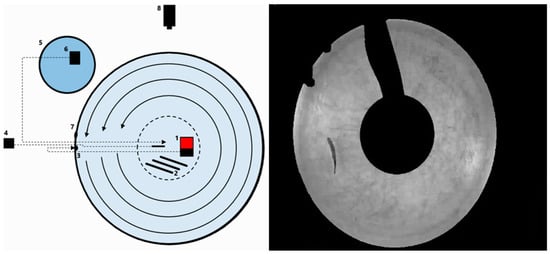
Figure 1.
Experimental setup for preferred swimming speed. (Left): Illustration of the setup of the preferred swimming speed experiment: (1) Large submersible pump; (2) rod heaters; (3) water inlet; (4) thermometer; (5) exterior tank with cold water; (6) small pump; (7) water outlet; (8) video camera. (Right): Screenshot from actual experiment; the black parts are masked areas where the software does not track the fish due to presence of equipment between fish and camera.
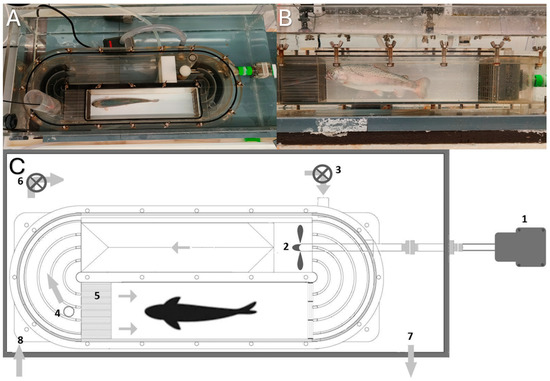
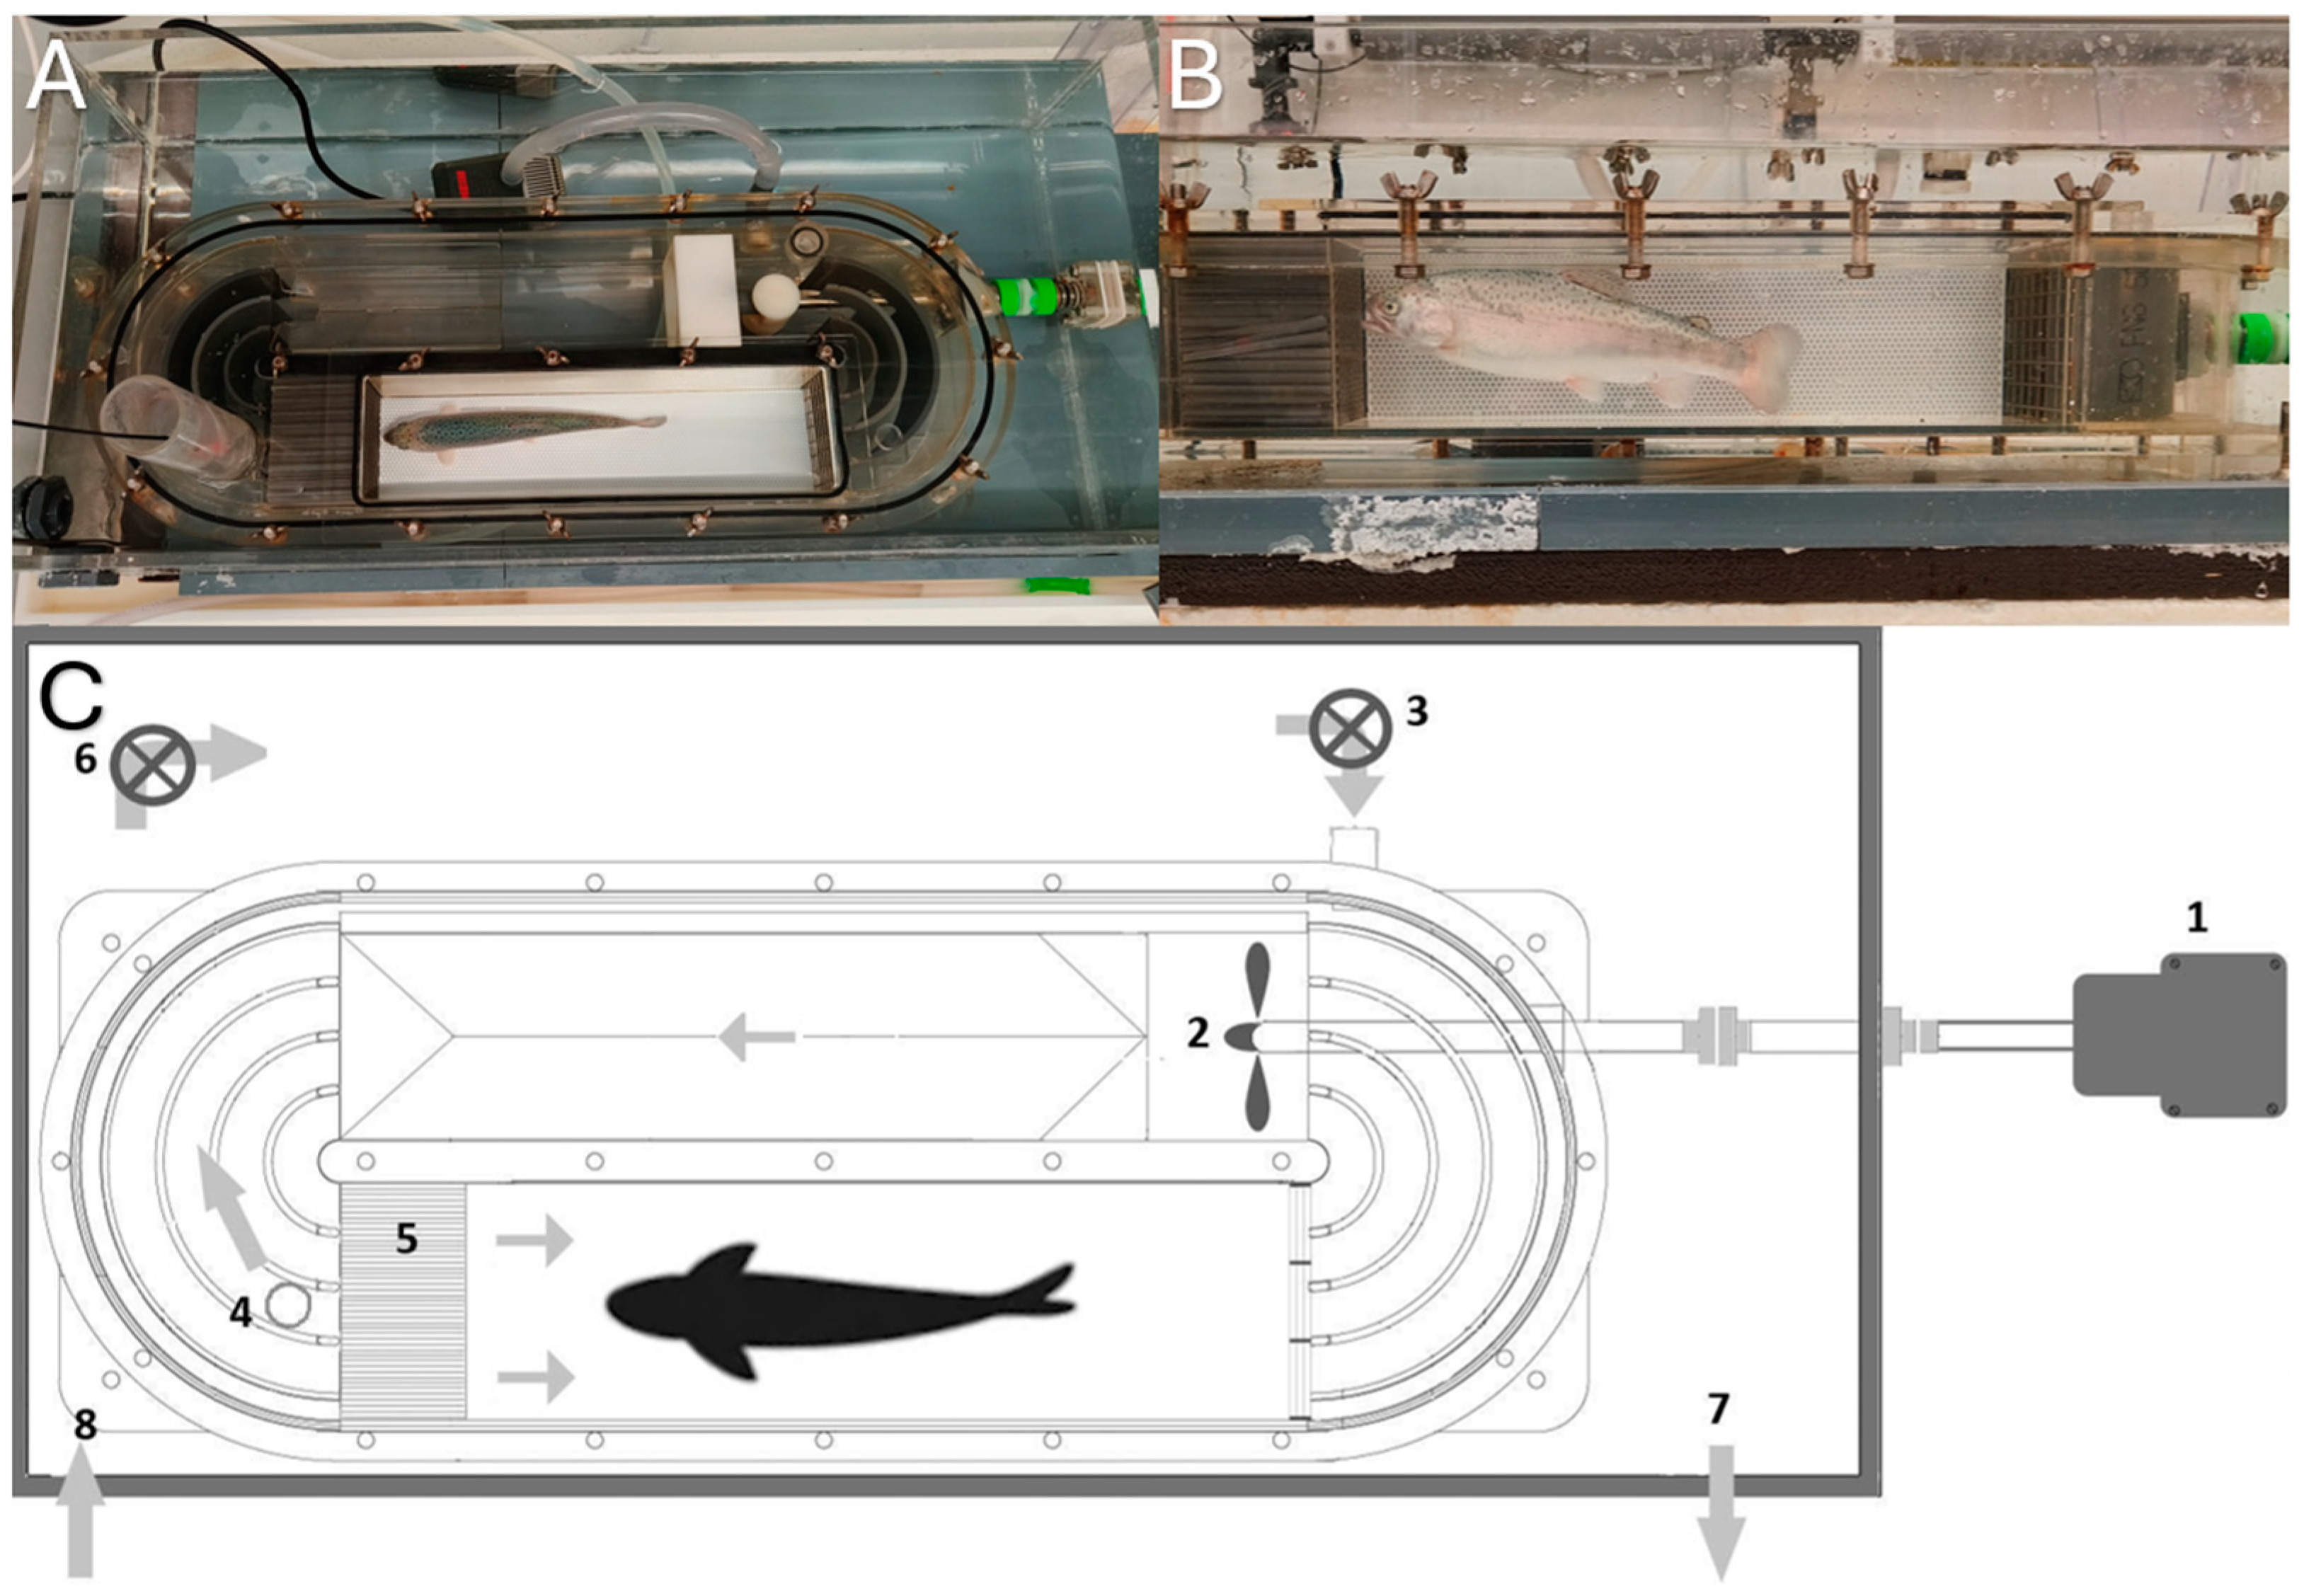
Figure 2.
Swim tunnel. (A) Side view. (B) Top view. (C) Diagram of the swim tunnel: (1) Motor; (2) propeller; (3) pump to exchange water in the swim tunnel; (4) chimney for water outlet + fiber optic oxygen meter; (5) honeycomb (for laminar flow); (6) recirculation pump; (7) outlet from tank to water reservoir; (8) inlet to tank from water reservoir.
2.2. Fish Husbandry
Rainbow trout, acquired from FREA Solutions, (n = 31, body length (fork), 24.5 ± 0.9 cm, wet mass 175.5 ± 20.1 g, ± SD) (Table 1), were housed in controlled lab conditions with the water temperature maintained at the experimental levels (10, 15, or 20 °C). Fish were fasted for 72 h prior to experiments to reduce postprandial effects. Salinity was kept at 30–33‰, and oxygen saturation was maintained at above 95%. All fish had been acclimated to seawater prior to experimentation.

Table 1.
Fish size measurements of the three treatment groups.
2.3. Flow Calibration and Validation
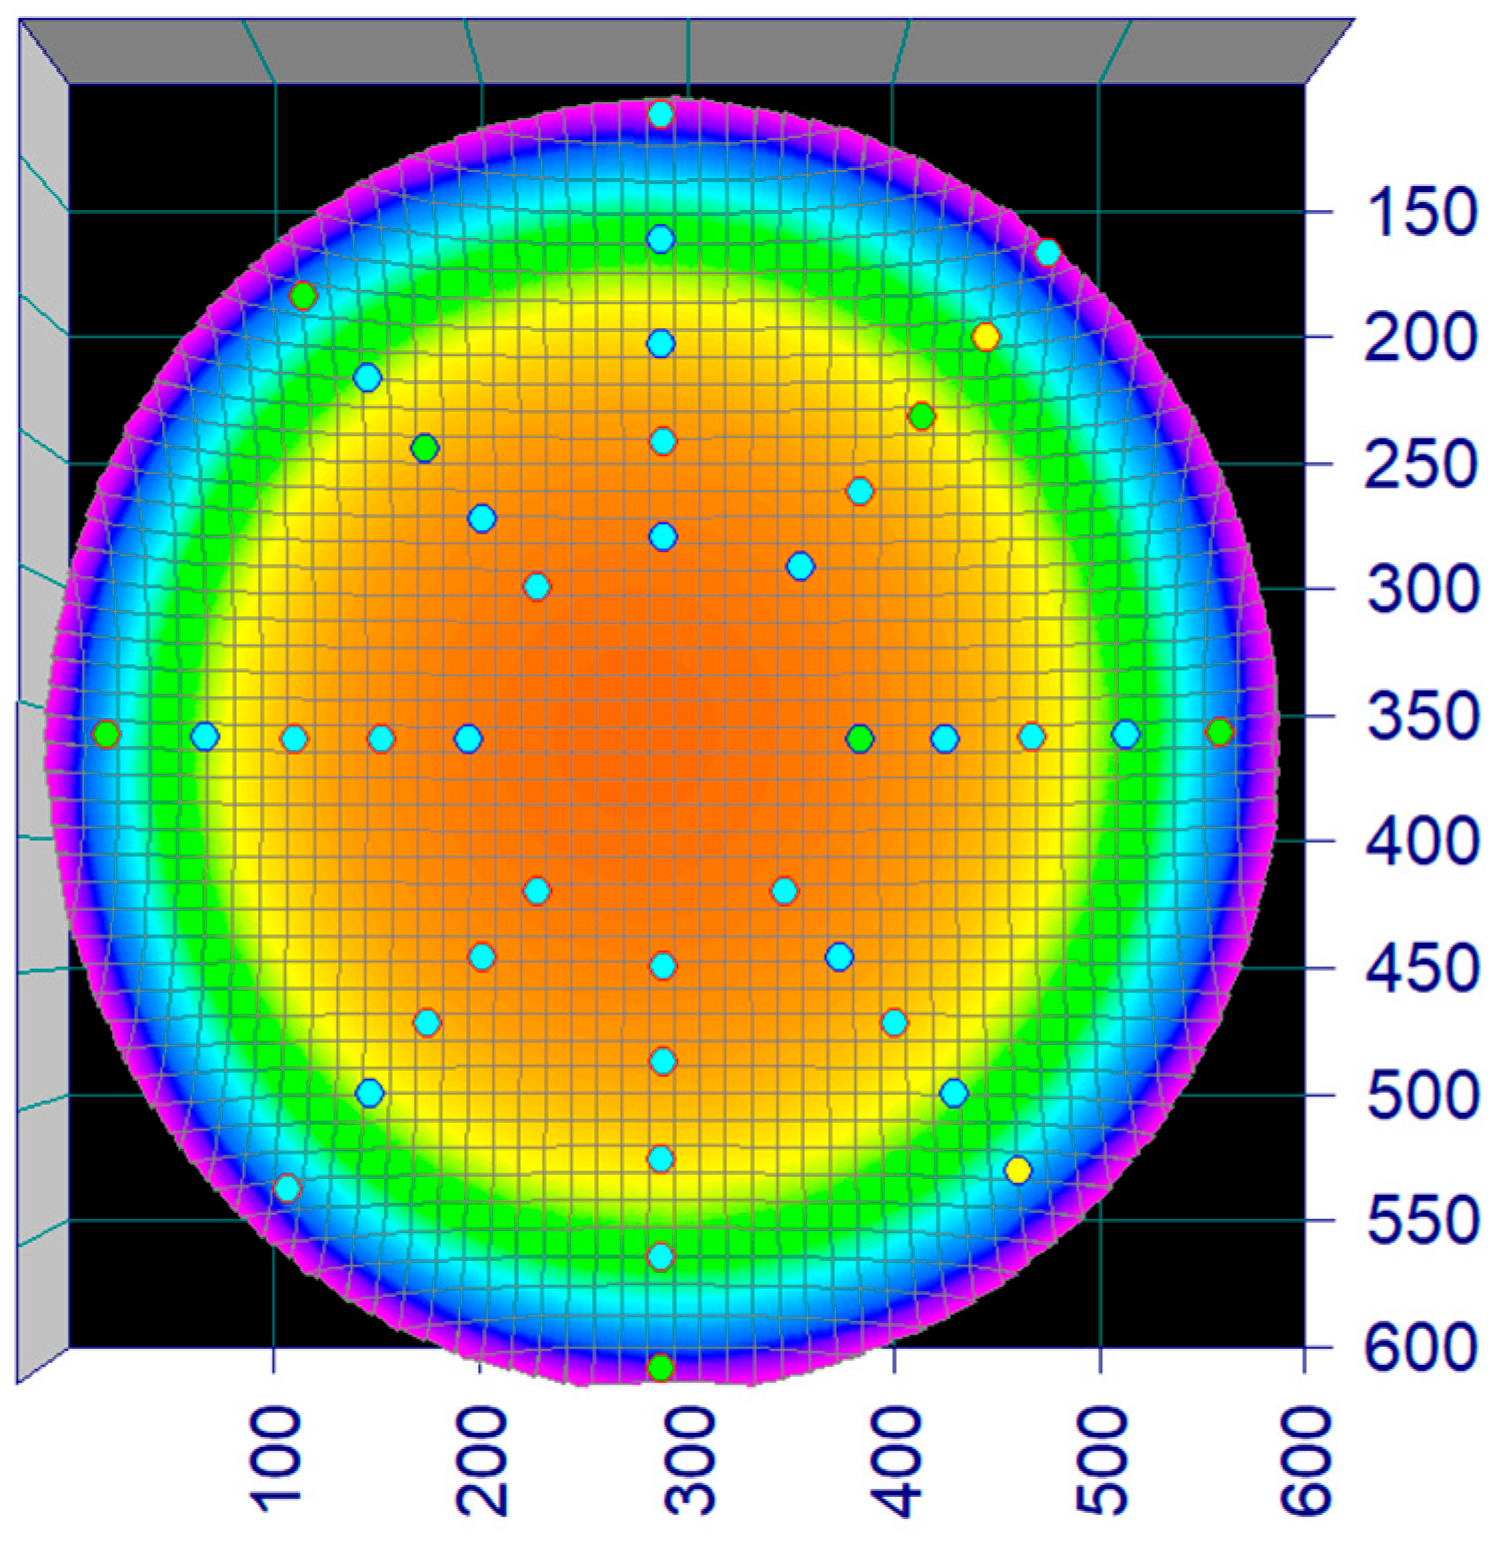
The flow rate in the circular raceway (Figure 1) was mapped using a flow probe (Hoentzsch vane wheel) at 40 predetermined points across four transects (c.f. Figure 3). The flow rates at the 40 positions were used to make a 3D model and an equation in TableCurve3Dv4 describing the flow rate (z) at any position (x,y) of the tank and regression constants (a–g) (Equation (1)) (Illustrated in Figure 3 and Figure 4).
z = (a + b × x + c × y)/(1 + d × x + e × x2 + f × y + g × y2)

Figure 3.
Screenshot, flow profile. The heat map illustrates the water velocity in the circular raceway as measured and regressed as a surface. The dots represent the 40 points that were measured with a flow probe and used to fit the flow profile in TableCurve3Dv4.

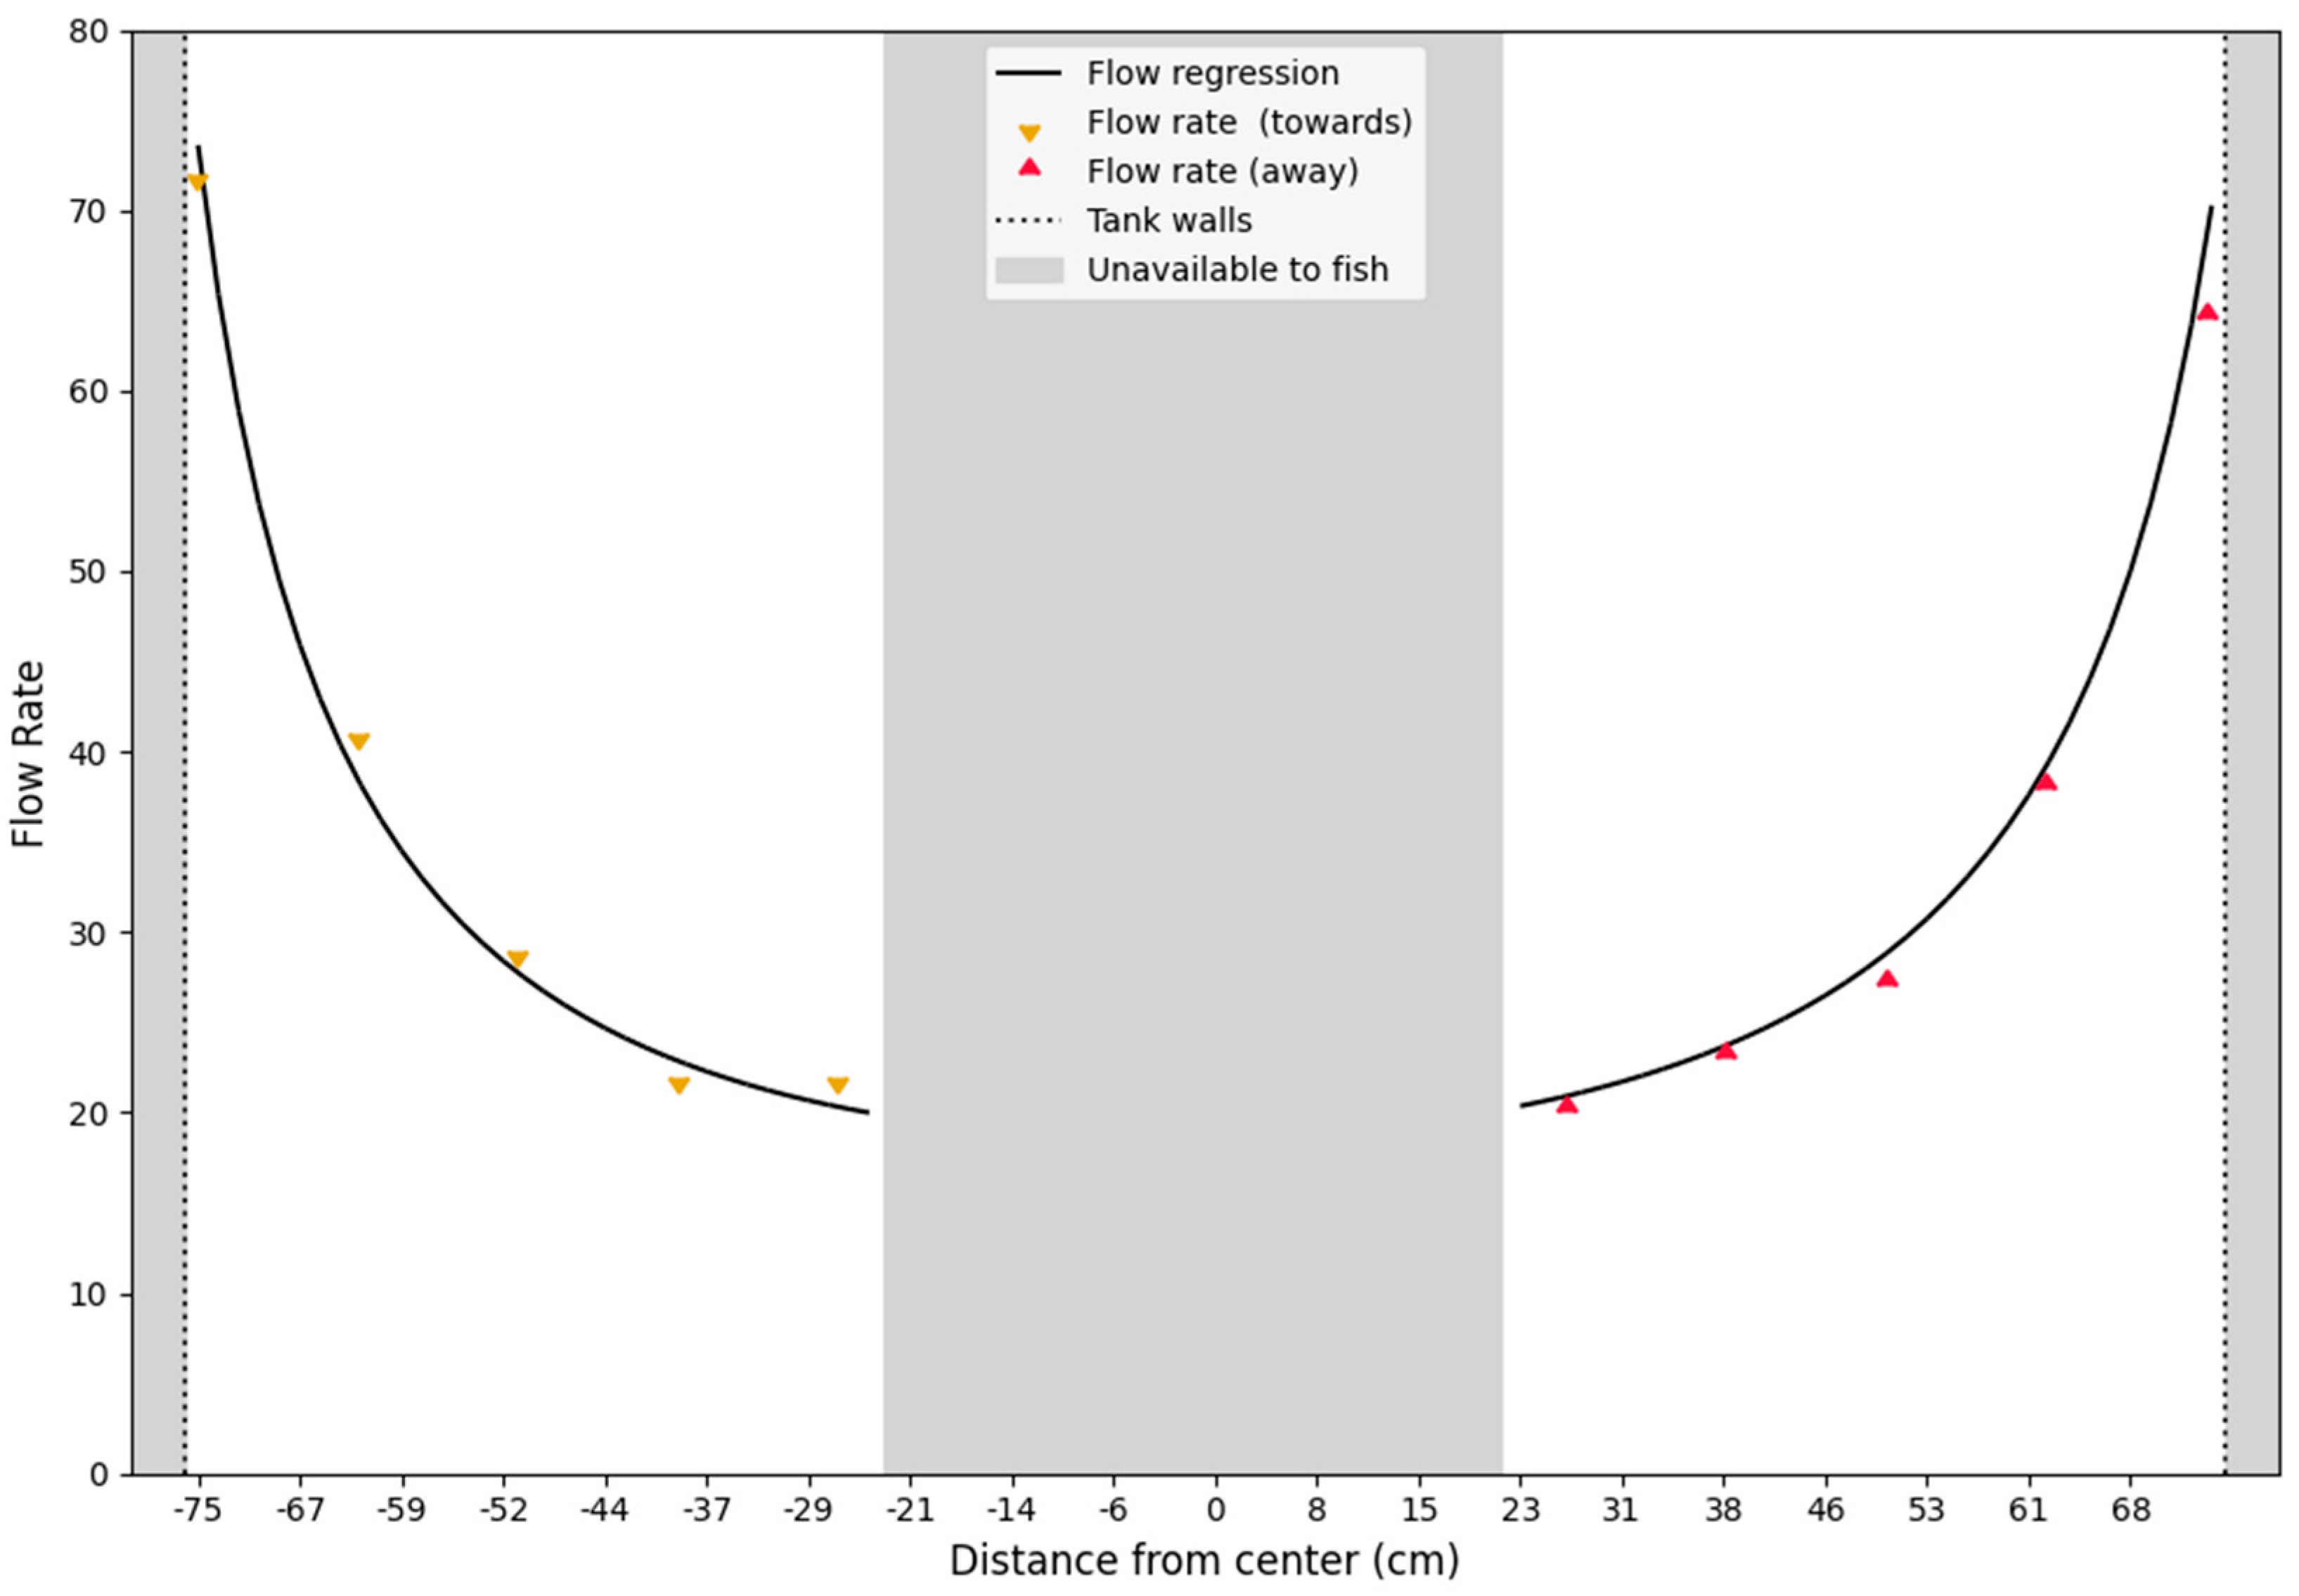
Figure 4.
Transect of the flow profile. The plot illustrates a transect of the water velocity in the circular raceway. The triangles are the measured points (colors indicate difference in direction of flow). Grayed out areas are inaccessible to the fish, because the pump sump is in the center and walls of the setup to the left and right. The non-linear relationship indicates a sharp increase in speed towards the walls of the tank, making very small XY translations of the fish result in large differences in swimming speeds.
Similarly, water velocity in the swim tunnel was calibrated in Loligo Systems AutoResp. A flow probe (Hoentzsch vane wheel) was used to calibrate the motor voltage output to the accurate water velocity, and the solid blocking effect was corrected for each fish’s trial [20].
2.4. Preferred Swimming Speed (Upref)
We report swimming speeds in body lengths per second (BL s−1), where body length was determined as fork length. To measure Upref, fish were introduced into a circular raceway system that allowed volitional swimming. The raceway consisted of a circular outer tank (diameter: 150 cm) and an inner circular perforated tank (diameter: 56 cm), creating a 47-centimeter-wide circular swimming section. The water depth in the swimming section was 20 cm. Consistent circular flow was achieved using a submersible pump (AL-KO Drain 7500 L h−1 classic) in the inner tank that recirculated water to a vertical tube perforated at the submerged end, pointing tangentially along the wall at the edge of the outer tank wall (Figure 1). To maintain a constant temperature and steady supply of new water, three 500 W titanium rod heaters constantly heated the water. Aeration ensured oxygen saturation, and the supply of new seawater ensured that salinity was not increased by evaporation. Temperature regulation was achieved via a thermosensitive switch (Sonoff TH R3/Elite), which controlled a water pump (Eheim Universal Pump 1048) connected to an adjacent tank with 10 °C seawater, set to trigger ON when the water temperature exceeded a set threshold and OFF when it fell back below the respective experimental temperatures (10, 15, or 20 °C).
Fish were acclimated to the raceway for 18–20 h before data acquisition. A video camera mounted above the raceway continuously recorded fish position and movement for six hours at 25 frames per second, using commercial video surveillance software (H264 WebCam). Post-recording analysis was conducted using SwisTrack (Ver 4.2 2023, user guide available in Supplementary Materials) software to derive all x, y positions from the trials of each fish. Then, Upref was determined using Equation (1).
The water flow at the location where the fish preferred to position themselves is circular in nature in the experimental setup, meaning that the fish are not swimming as if in a straight line. The curvature of the water flow causes an increase in the drag factor and forces the fish to increase its effort. The increased effort, corresponding to a higher swimming speed, can be accounted for by using the correction formula (Equation (2)) for swimming speed, as used in He and Wardle (1988) [21,22]. The correction factor for straight-line swimming is graphically illustrated in Figure 5.
Us/Uv = [1 + (2(Kw/Df0.33)/Cd × L/R)2 (Df/Dw + Km)2]1/5.6
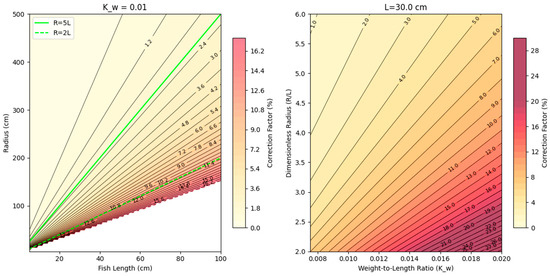
Figure 5.
Correction factor for straight-line swimming. (Left): Correction factor for difference fish lengths (x) and turning radii (y); green lines represent R = 5*L and R = 2*L for reference. (Right): y-axis is the ratio of turning to fish length, and x-axis is the weight to length ratio; increasing numbers indicate a more plump fish—i.e., having more mass per length. Based on Equation (2).
Upref was determined by taking the median of the swimming speed values in BL s−1, as distributions were multimodal. Note that the numbers obtained were median and IQR, c.f. Figure 6, average and standard deviation estimates, of the mode of highest frequency, which were completed by equating the mean of that distribution to the median and calculating SD for the mode as interquartile range divided by 1.35.

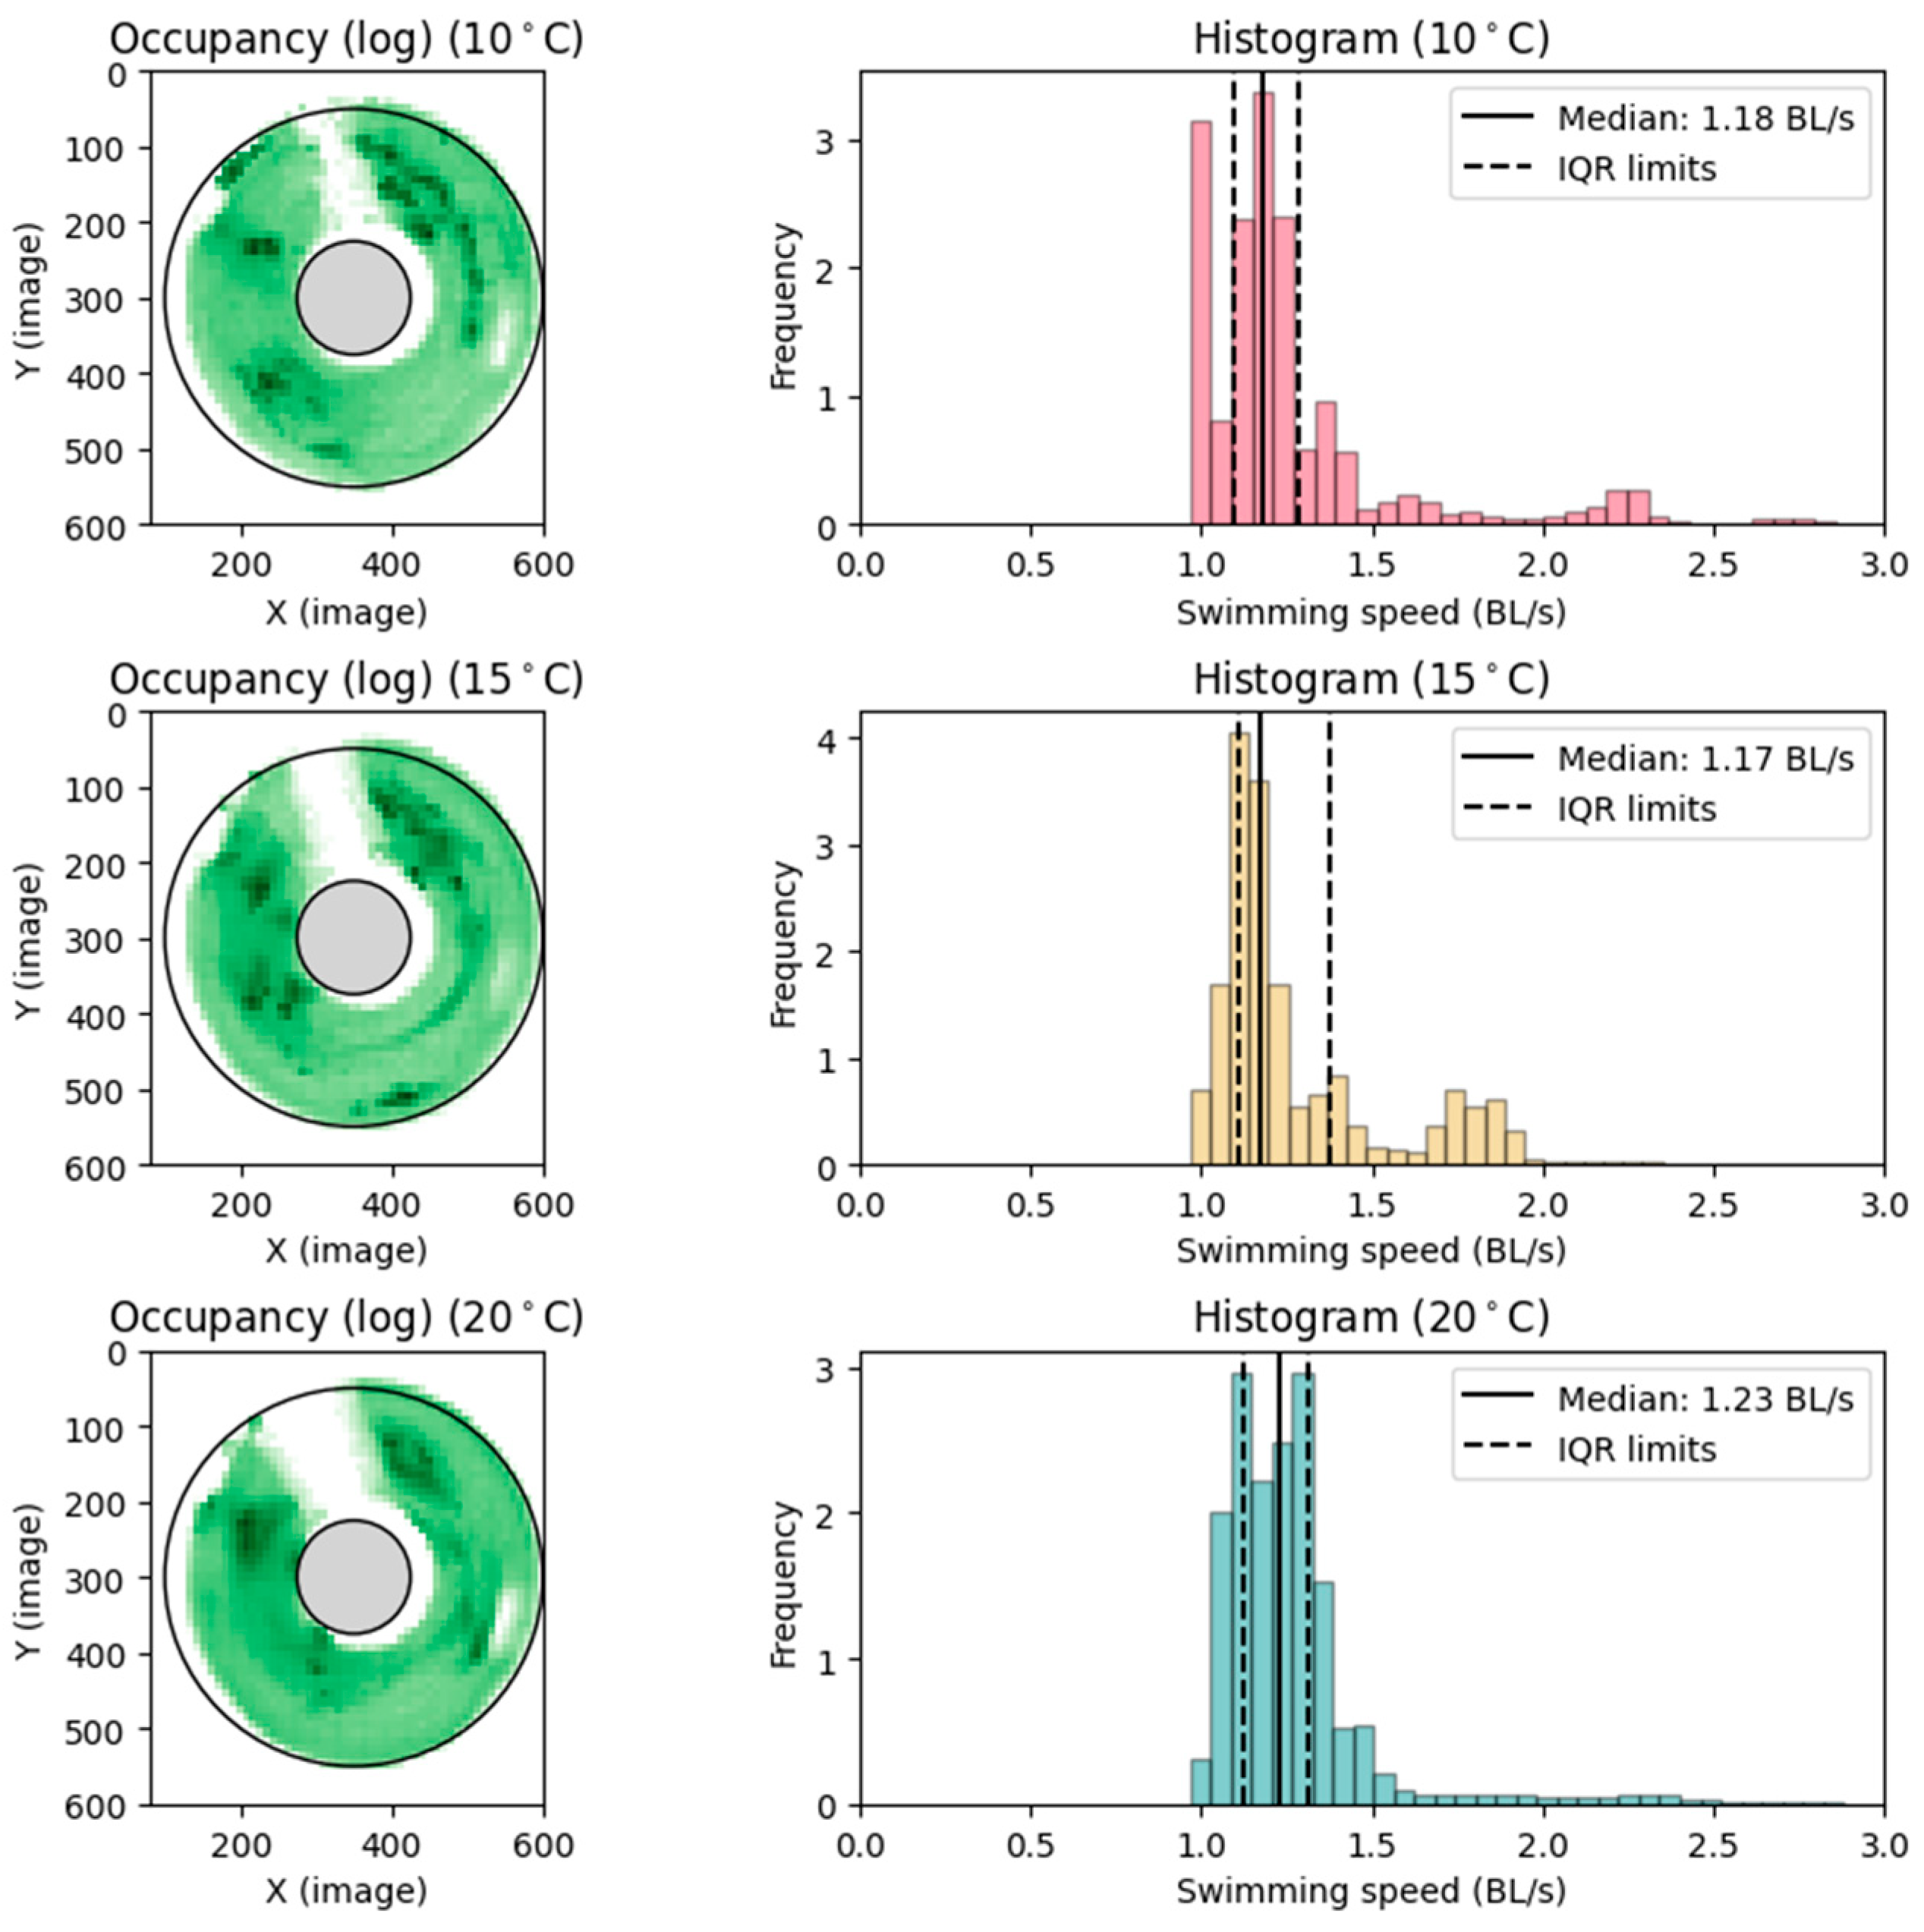
Figure 6.
Preferred swimming speed. Observations from preferred swimming speed setup. (Left): Heatmap, log transformed for clarity, of the most occupied positions in the circular raceway throughout the trial periods. Darker colors indicate more occupancy. (Right): Histogram showing the frequency of swimming speeds (U), corrected to straight-line swimming.
2.5. Optimal Swimming Speed (Uopt)
After completing the Upref trials, fish were transferred to a swim tunnel respirometer (31.5 L Steffensen type) to measure swimming energetics (Figure 2; 3D model available at: a360.co/4g3OsFW). The fish were introduced to the swim tunnel at a swimming speed of 0.5 BL s−1 for 12–16 h prior to the swimming test, in order to ensure acclimation to the new environment and reaching a baseline oxygen consumption (MO2). Following the acclimation period, oxygen consumption rate was measured with gradually increasing swimming speeds by 0.5 BL s−1 increments every three measurement cycles. The MO2 was determined by 10 min intervals consisting of 240 s flush, 60 s wait, and 300 s measure-periods. Measurements were executed at 0.5, 1.0, 1.5, 2.0, and 2.5 BL s−1 for each fish.
Trials continued until fish reached fatigue, defined as touching the back grid of the tunnel three consecutive times or ceasing forward motion. The relationship between swimming speed and MO2 was fitted to the following exponential function:
where a and b are constants, and U is fish swimming speed. Uopt was calculated as the speed with the least cost of transport (COT):
MO2 = a × e (b × U)
Uopt = b−1
Critical swimming speed (Upref) was determined as in Steinhausen et al. (2005). Lastly, standard metabolic rate (SMR), which is the minimal energy expenditure required for self-maintenance, was found by extrapolating Equation (3) back to x = 0 [23].
2.6. Data Analysis
Normality and variance homogeneity of the observed data of Upref, Uopt, Ucrit, and standard metabolic rate in each thermal treatment group (10, 15, and 20 °C) was determined by performing a Shapiro–Wilks test (α = 0.05). Once all necessary conditions were fulfilled, a statistical test was conducted on the following data.
A one-way ANOVA was conducted to assess any statistical differences (α = 0.05) between temperature treatment groups Upref, Uopt, and Ucrit, followed by post-hoc comparisons (Tukey’s honestly significant difference test (α = 0.05)).
The difference between Upref and Uopt in the same treatment group (10, 15, and 20 °C) was determined by a paired t-test (α = 0.05), to assure all requirements were fulfilled; a Levene’s F-test was performed to test for equality in variance beforehand.
3. Results
3.1. Preferred Swimming Speed
After the introduction to the swimming section in the circular raceway, the fish spent 10–60 min exploring the new environment and then settled into a preferred position. The fish carried on in the same position for most of the measuring period. Upref was determined for each thermal acclimation treatment group (10, 15, and 20 °C) (Figure 6), averaging volitional preferred swimming speeds of 1.18 ± 0.14, 1.17 ± 0.19, and 1.24 ± 0.15 BL s−1, ± SD, respectively (Table 2).
Table 2.
Results from the preferred swimming speed and the swimming respirometer experiments of the three treatment groups.
Statistical analysis showed no significant effect of temperature in preferred swimming speed between treatment groups (one-way ANOVA, p = 0.62). As the statistical test resulted in a large p-value, showing little to no variance in between the treatment groups, no further analysis was performed.
3.2. Energetics and Optimal Swimming Speed
The fish spent 10–30 min settling into the new environment and began swimming steadily at 0.5 BL s−1. After 1–2 h, the fish reached a steady oxygen consumption (MO2: mg O2 kg−1 h−1). The MO2 @ 0.5 BL s−1 of each treatment group (10, 15, and 20 °C) was determined post-experiment, and the average of each group was 62.3 ± 4.9, 99.2 ± 12.5, and 195.2 ± 30.9 mg O2 kg−1 h−1, ± SD, respectively. From the MO2 measurements, the average SMR was found by extrapolating back to 0 BL s−1 for each treatment group; 44.70, 65.70, and 130.90 mg O2 kg−1 h−1, respectively. Active metabolic rate (AMR) was determined as the highest MO2 measurement from the swimming respirometer trial; 188.9 ± 44, 386.0 ± 72.7, and 550.6 ± 171.2 mg O2 kg−1 h−1, ± SD, respectively.
Lastly, the Fractional Aerobic Scope (AS) was determined for each treatment group (10, 15, and 20 °C), as AMR divided by SMR; AS: 3.0 ± 0.6,3.8 ± 1.1, and 2.8 ± 0.7, ± SD, respectively. The Q10 values between the treatment groups of the determined MO2 @ 0.5 BL s−1 were Q10 = 2.5 between 10 °C and 15 °C, 3.1 between 15 °C and 20 °C, and 3.8 between 10 °C and 20 °C. Statistical analysis showed a significant difference between the MO2 @ 0.5 BL s−1 in the three groups (one-way ANOVA, p = 0.055). A further post-hoc (Tukey’s HSD) test showed significant differences among all groups.
The Uopt for each treatment group (10, 15, and 20 °C) was 1.4 ± 0.19, 1.5 ± 0.15, and 1.6 ± 0.24 BL s−1, ± SD, respectively. The statistical analysis showed no significant difference between the three groups (one-way ANOVA, p = 0.057). As the p-value was only slightly above the significance level, a further post-hoc (Tukey’s HSD) showed a significant difference between the Uopt at 10 °C and 20 °C (p = 0.046).
Furthermore, the Ucrit results for each treatment group (10, 15, and 20 °C) were 2.1 ± 0.35, 2.6 ± 0.05, and 2.4 ± 0.42 BL s−1, ± SD, respectively. Statistical analysis showed significant differences between groups (one-way ANOVA, p = 0.19). A further post-hoc (Tukey’s HSD) test showed a significant difference between treatment groups 10 °C and 15 °C, and treatment groups 10 °C and 20 °C (p = 0.009 and p = 0.049, respectively). All results from the swimming respirometry trials are presented in Table 2 and graphically illustrated in Figure 7.
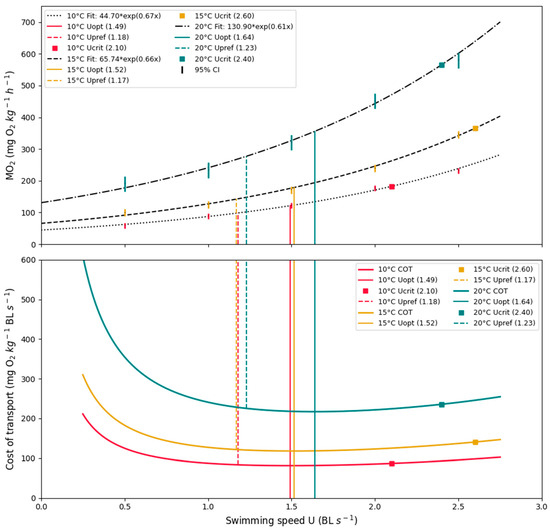
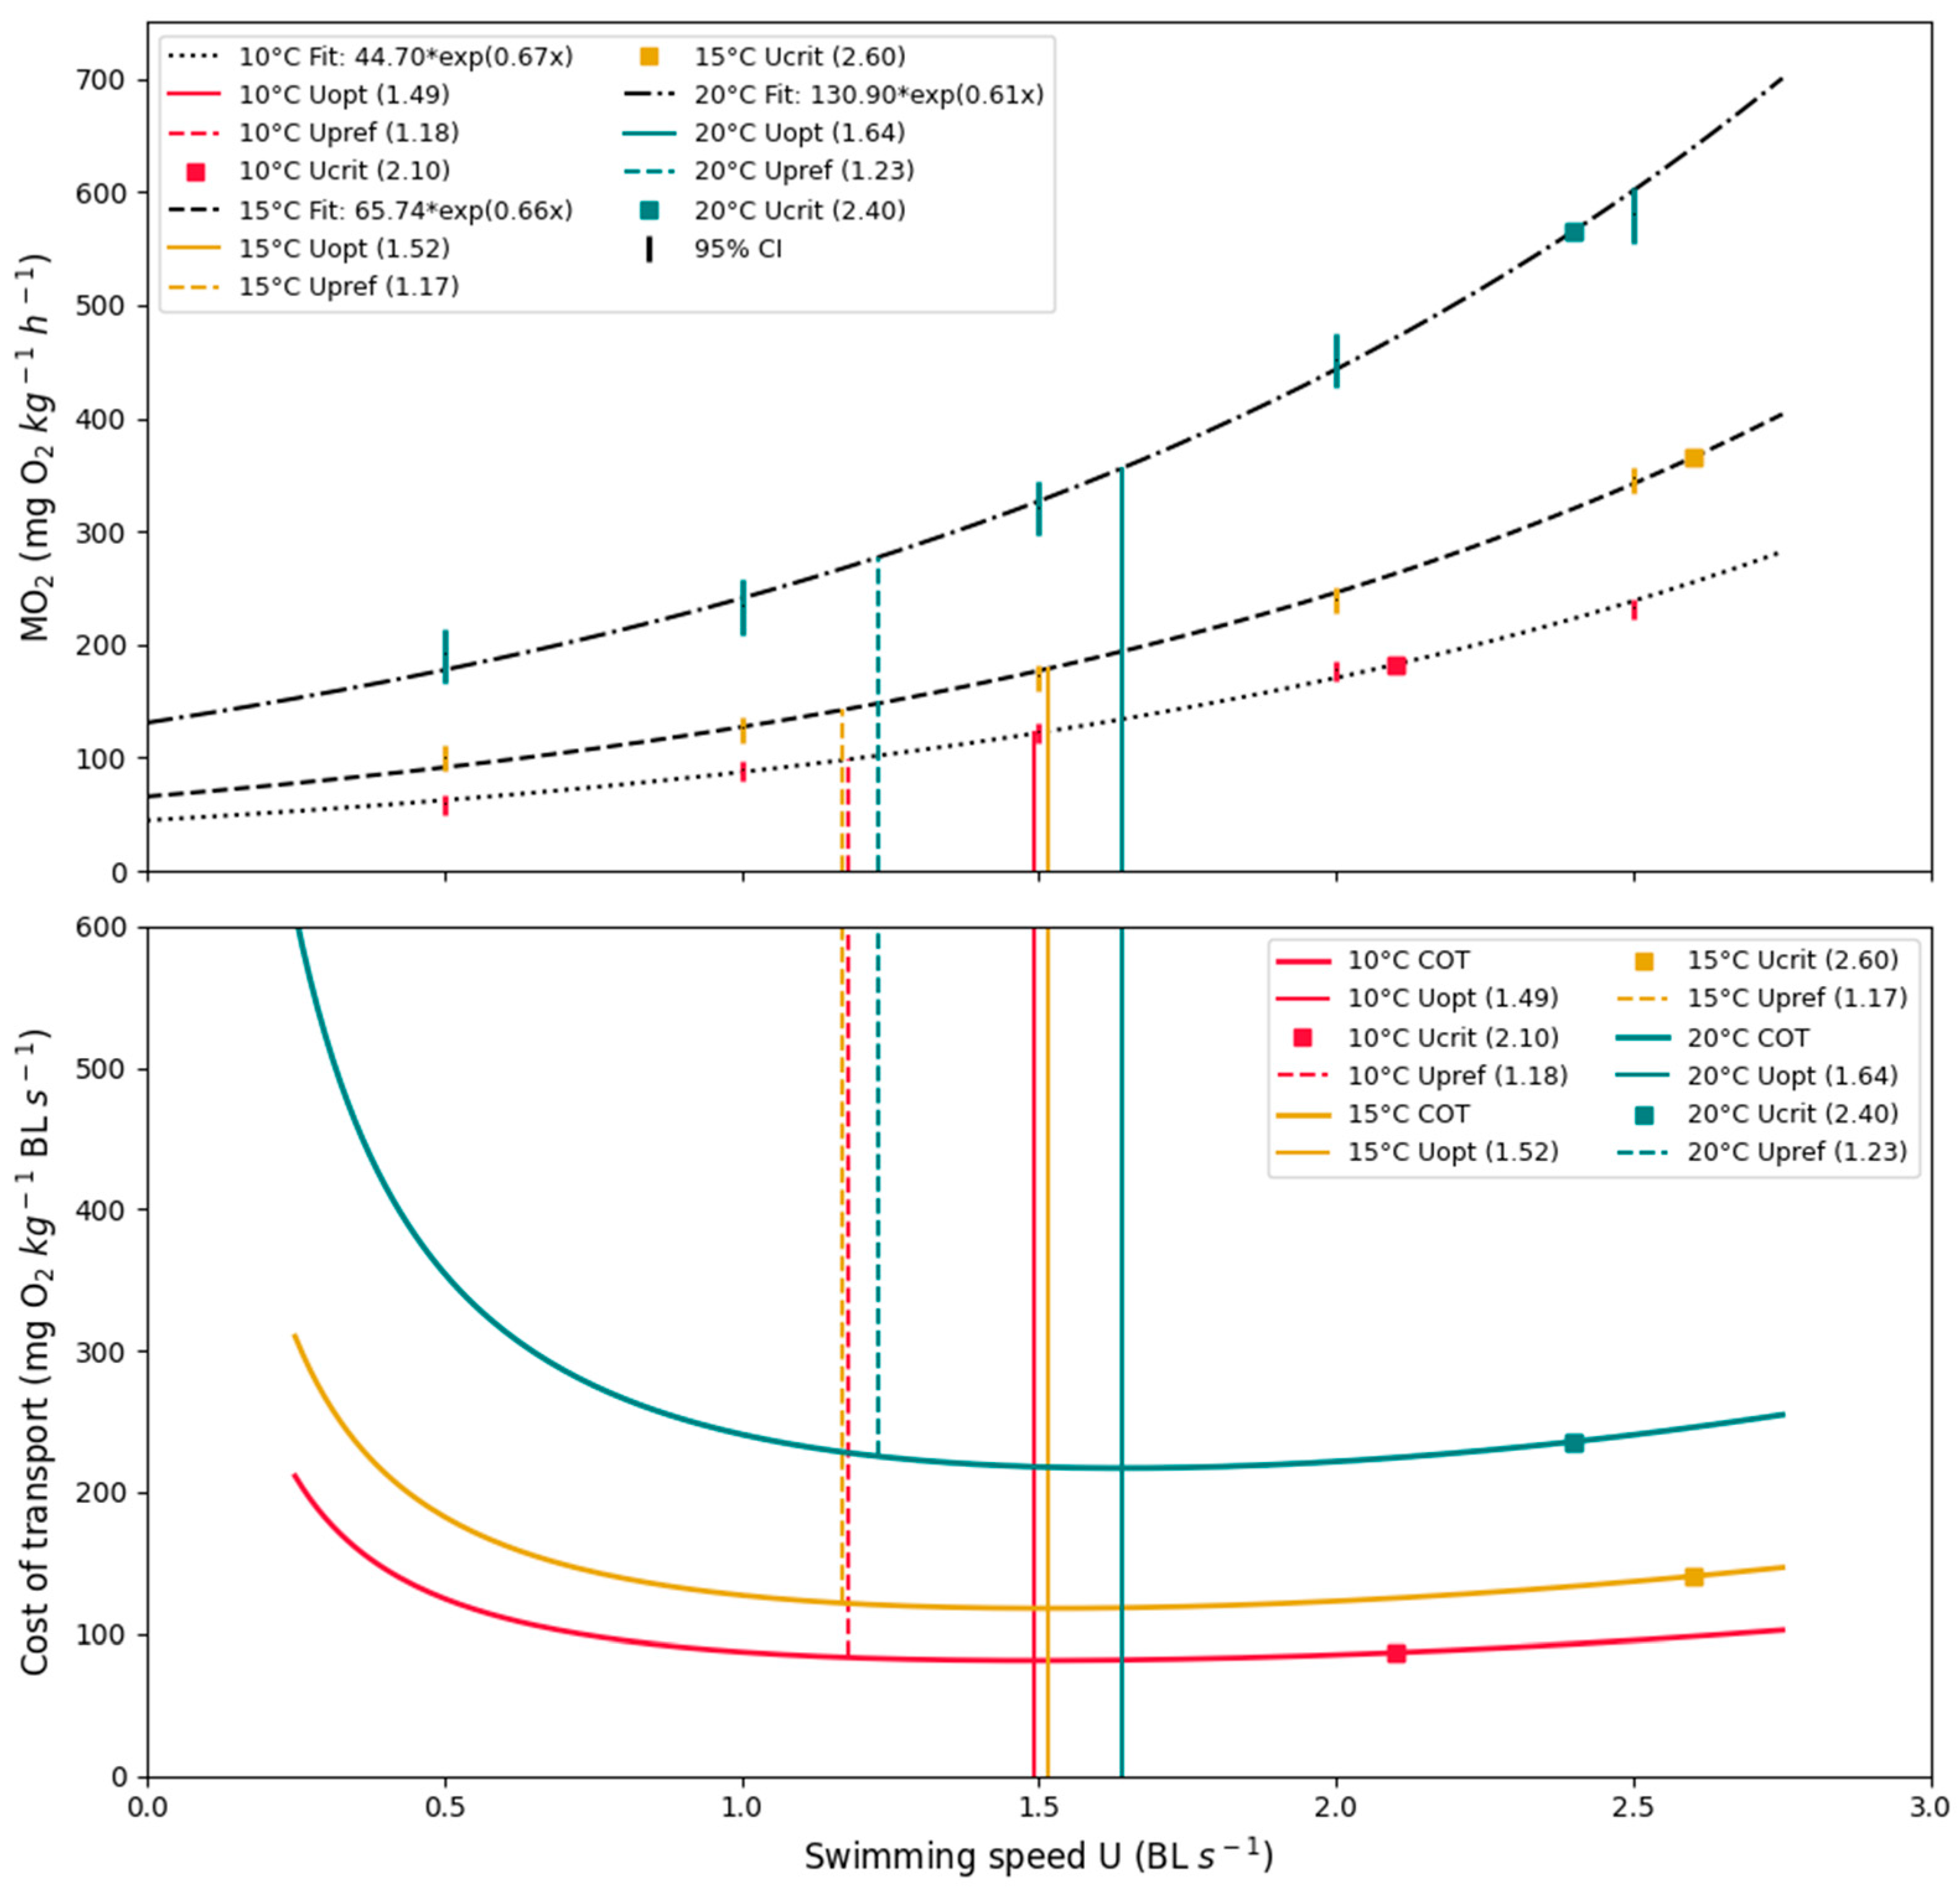
Figure 7.
MO2 and COT. Results from all three treatment groups. (Upper): Average oxygen consumption fitted as an exponential regression. (Lower): Average cost of transport at a given swimming speed. Vertical lines illustrate optimal swimming speed (Uopt) and critical swimming speed (Ucrit) calculated from the MO2 measurements. Colored areas indicate the range of the observed preferred swimming (Upref).
3.3. Cost of Transport
The average COTmin for each temperature (10, 15, and 20 °C) was 83.4 ± 9.3, 118.8 ± 14.7, and 210.7 ± 23.4 mg O2 kg−1 BL s−1, ± SD, respectively. The statistical test revealed a significant difference in COTmin between thermal groups (one-way ANOVA, p = 1.781 × 10⁻¹³. A further post-hoc (Tukey’s HSD) test revealed a significant difference among all groups (Figure 7, lower).
3.4. Comparison of Swimming Speeds
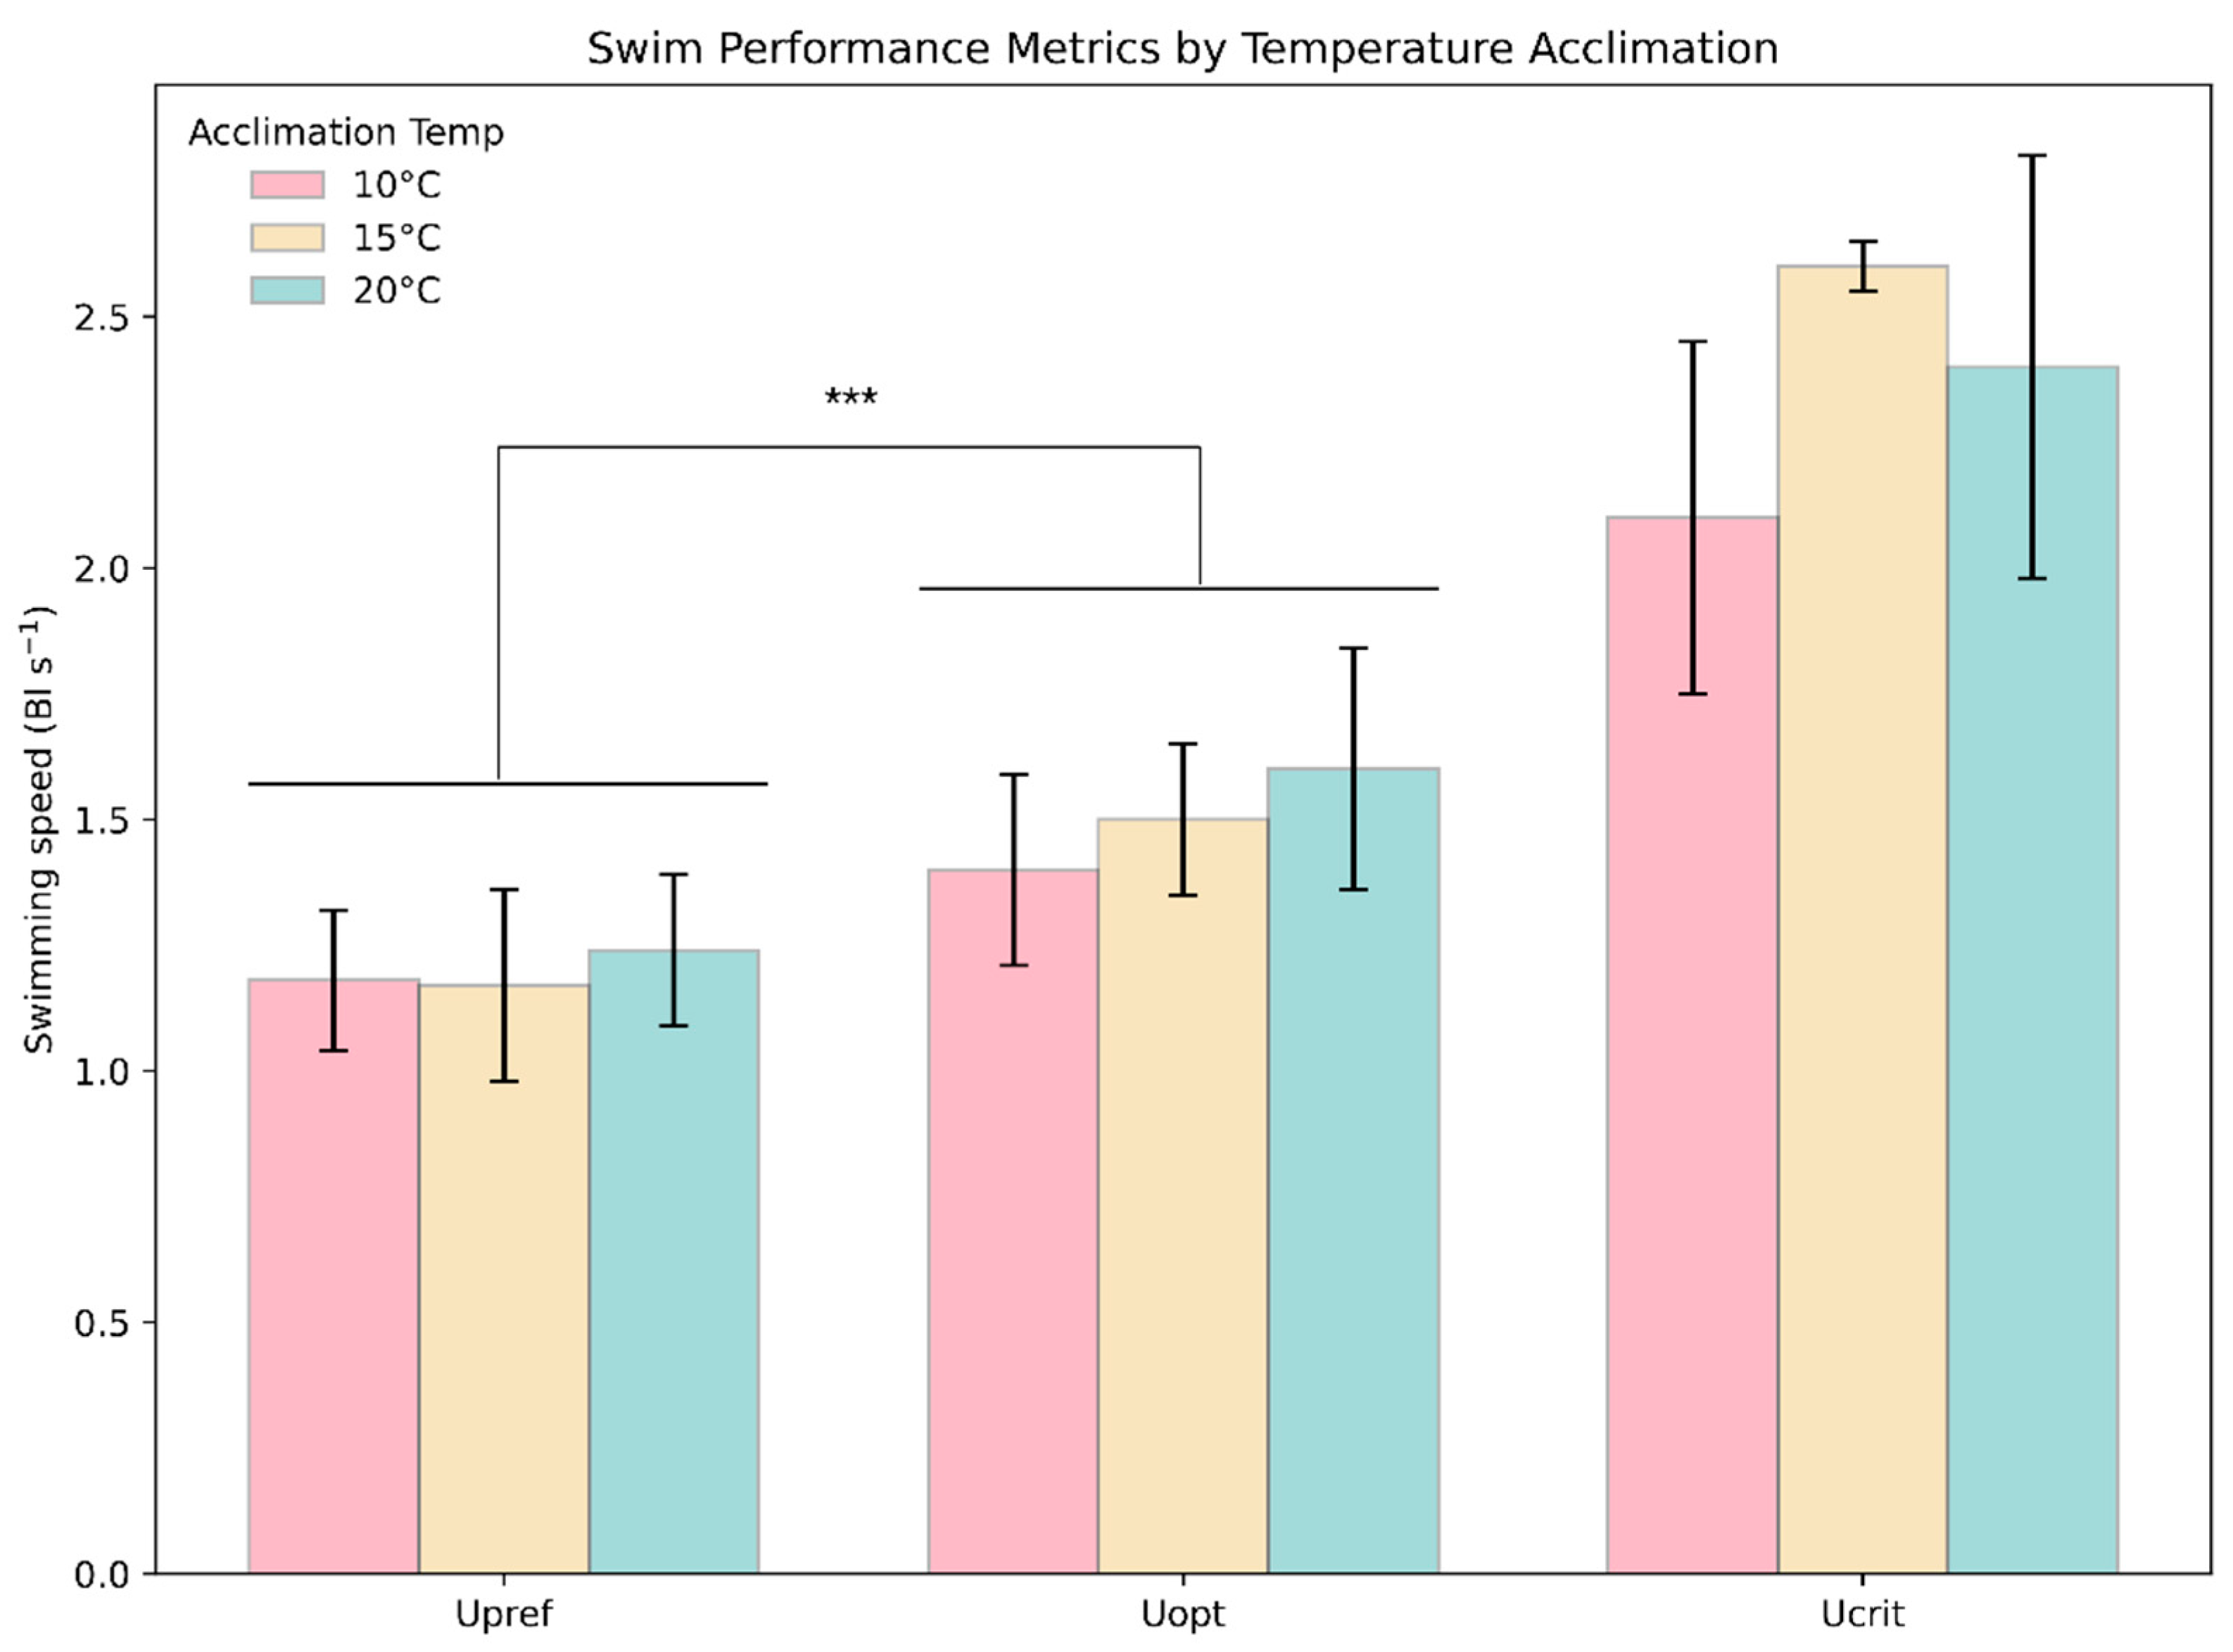
Homogeneity across all groups of the Upref and Uopt experiments was tested and showed no significant difference in variance (Levene’s, F = 1.13, p = 0.3576). A significant difference between Upref and Uopt across all treatment groups (T: −4.260, p = 0.00027) was determined (Figure 8).
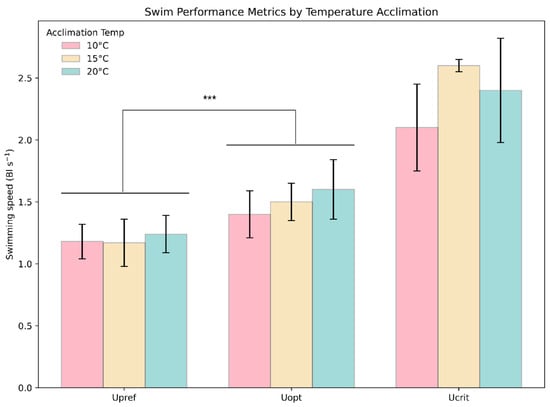
Figure 8.
Comparison of swimming speed metrics. The plot depicts the average observed Upref, Uopt, and Ucrit for each acclimation temperature group. The whiskers are 1 SD, and colors represent the groups. The *** above the bars indicates a statistically significant (*** = p ≤ 0.001) difference between groups.
The oxygen consumption swimming at Upref was 18.9, 20.4, and 22.1% lower than swimming at Uopt at 10, 15, and 20 °C, respectively.
4. Discussion
The present study aimed to deepen our understanding of rainbow trout swimming energetics by examining how their preferred swimming speed (Upref) relates to the optimal swimming speed (Uopt). Prior efforts often relied on forced-swimming trials to determine Uopt for aquaculture conditions, assuming that fish would naturally prefer this energetically optimal speed. Our findings challenge this assumption. Despite changes in metabolic rates and aerobic scope with temperature, the chosen Upref remained near 1.2 BL s−1 across all tested temperatures (10, 15, and 20 °C), while Uopt was consistently and significantly higher (1.4–1.6 BL s−1). This discrepancy suggests that rainbow trout should be swimming at Upref rather than Uopt in aquaculture environments. In addition, swimming at Upref is 18–22% less energetically costly than swimming at Uopt.
These results differ from the conclusions on a study on brook charr Salvelinus fontinalis [9], where preferred and optimal speeds were identical at 15 °C, but the authors reported large variance in the results. It appears from the distribution of Upref that a larger amount of time was spent at the two categories below Uopt than at the two at Uopt and just above ([9] Figure 3). Thus, using a different analytical approach by Tudorache et al. [9] could have led to the same conclusion as ours, that Upref is below Uopt.
This conclusion is in contrast to the conventional thinking in terms of minimizing cost per distance traveled. Our cost of transport (COT) analysis further shows that small deviations from Uopt (e.g., at 10 and 15 °C) do not drastically alter the cost of transport, making it less critical for fish to fine-tune their speed to a strict physiologically forced optimum.
Metabolic rates (SMR, AMR) and aerobic scope were temperature dependent. SMR increased with temperature, yielding Q10 values (2.5–3.8) similar to those found elsewhere [24,25]. Aerobic scope was largest at 15 °C, aligning with the known temperature range (15.8–17 °C) for rainbow trout and with the highest Ucrit observed [26,27]. This matches previous findings that maximal aerobic capacity occurs around this temperature [28]. Similar ranges in Uopt (1–2 BL s−1) have been reported for other salmonid species [29,30], and ~1.5 BL s−1 has previously been recommended for growth in aquaculture. However, due to spontaneous locomotor activity, actual swimming speeds vary widely from 0.5 to 3.0 BL s−1 [31,32,33].
Conventional forced-swimming methods significantly constrain fish movement, limiting their ability to exhibit natural swimming behaviors. In contrast, the circular raceway used in this study provides a more natural and less restrictive environment. While boundary effects on fish swimming may exist in the raceway, these effects are minimized by its continuous design, allowing the fish to swim without encountering abrupt barriers. This setup better allows for spontaneous locomotor behavior and enables studying effects on fishes using a more top–down perspective.
Lastly, the comparison between the results from the preferred swimming speed (Upref) and the forced swimming speed (Uopt) showcase that in aquaculture settings, rainbow trout are more inclined to swim at Upref instead of Uopt, as swimming at Upref is 18–22% more energy efficient. The results also suggest that minor variations from Uopt do not significantly impact the cost of transport, suggesting that strict adherence to Uopt is not crucial for energy efficiency.
5. Conclusions
Unlike forced-swimming tests, this method for determining Upref was less invasive, allowing fish to swim voluntarily in a circular raceway, mimicking aquaculture conditions.
Temperature significantly influenced metabolic rates and aerobic scope, with SMR and AMR increasing at higher temperatures, yet Upref remained consistent (~1.2 BL s−1) across 10, 15, and 20 °C. Uopt varied slightly (1.4–1.6 BL s−1) and was consistently higher than Upref. Swimming at Upref reduced energy costs by 18–22% compared to Uopt, making it an advantageous choice for aquaculture systems aiming to improve growth efficiency and fish welfare.
Supplementary Materials
The following supporting information can be downloaded at: https://www.mdpi.com/article/10.3390/fishes10020064/s1, Swistrack step by step guide.
Author Contributions
Conceptualization, Ó.a.F.M., L.E.J.A., M.B.S.S., H.B. and J.F.S.; methodology, Ó.a.F.M., L.E.J.A., M.B.S.S. and J.F.S.; software, Ó.a.F.M., L.E.J.A., M.B.S.S. and J.F.S.; validation, Ó.a.F.M., L.E.J.A., M.B.S.S. and J.F.S.; formal analysis, Ó.a.F.M., L.E.J.A., M.B.S.S. and J.F.S.; data curation, Ó.a.F.M. and M.B.S.S.; writing—original draft preparation, Ó.a.F.M. and H.B.; writing—review and editing, Ó.a.F.M., L.E.J.A., M.B.S.S., H.B. and J.F.S.; visualization, Ó.a.F.M., L.E.J.A., M.B.S.S. and J.F.S.; funding acquisition, H.B. and J.F.S. All authors have read and agreed to the published version of the manuscript.
Funding
This research was funded by the Green Growth and Development program (GUDP) under the Danish Ministry of Food, Agriculture, and Fisheries through the project “GUDP FITFISH”, Project No. 34009-16-1168. In addition, funding from the University of Copenhagen was obtained.
Institutional Review Board Statement
All fish experiments agreed with the EU Directive 2010/63/EU for animal experiments and were performed with permission from the Danish Animal Experiments Inspectorate (License number: 2018-15-0201-01466).
Informed Consent Statement
Not applicable.
Data Availability Statement
Available upon request.
Acknowledgments
All fish were generously donated by FREA Solutions, a Danish aquaculture company based in Sdr. Felding, Jutland. In addition, Thomas Lochmatter is acknowledged for making an updated version of SwisTrack in 2023 and reviewing our guide.
Conflicts of Interest
The authors declare no conflicts of interest.
References
- Brett, J.R. The swimming energetics of salmon. Sci. Am. 1965, 213, 80–87. [Google Scholar] [CrossRef]
- Videler, J.J. Fish Swimming; Springer Science & Business Media: Dordrecht, The Netherlands, 1993; p. 260. ISBN 978-0-412-40860-1. [Google Scholar]
- Palstra, A.P.; Planas, J.V. Fish under exercise. Fish Physiol. Biochem. 2011, 37, 259–272. [Google Scholar] [CrossRef] [PubMed]
- Anttila, K.; Järvilehto, M.; Mänttäri, S. The swimming performance of brown trout and whitefish: The effects of exercise on Ca2+ handling and oxidative capacity of swimming muscles. J. Comp. Physiol. B 2008, 178, 465–475. [Google Scholar] [CrossRef] [PubMed]
- Castro, V.; Grisdale-Helland, B.; Jørgensen, S.M.; Helgerud, J.; Claireaux, G.; Farrell, A.P.; Krasnov, A.; Helland, S.J.; Takle, H. Disease resistance is related to inherent swimming performance in Atlantic salmon. BMC Physiol. 2013, 13, 1. [Google Scholar] [CrossRef]
- Nilsen, A.; Hagen, Ø.; Johnsen, C.A.; Prytz, H.; Zhou, B.; Nielsen, K.V.; Bjørnevik, M. The importance of exercise: Increased water velocity improves growth of Atlantic salmon in closed cages. Aquaculture 2019, 501, 537–546. [Google Scholar] [CrossRef]
- Ytrestøyl, T.; Takle, H.; Kolarevic, J.; Calabrese, S.; Timmerhaus, G.; Rosseland, B.O.; Teien, H.C.; Nilsen, T.O.; Handeland, S.O.; Stefansson, S.O.; et al. Performance and welfare of Atlantic salmon, Salmo salar L. post-smolts in recirculating aquaculture systems: Importance of salinity and water velocity. J. World Aquac. Soc. 2020, 51, 373–392. [Google Scholar] [CrossRef]
- Beamish, F.W. Swimming capacity. In Fish Physiology; Academic Press: Cambridge, MA, USA, 1978; Volume 7, pp. 101–187. [Google Scholar] [CrossRef]
- Tudorache, C.; O’Keefe, R.A.; Benfey, T.J. Optimal swimming speeds reflect preferred swimming speeds of brook charr (Salvelinus fontinalis Mitchill, 1874). Fish Physiol. Biochem. 2011, 37, 307–315. [Google Scholar] [CrossRef]
- Houlihan, D.F.; Laurent, P. Effects of exercise training on the performance, growth, and protein turnover of rainbow trout (Salmo gairdneri). Can. J. Fish. Aquat. Sci. 1987, 44, 1614–1621. [Google Scholar] [CrossRef]
- Christiansen, J.S.; Ringø, E.; Jobling, M. Effects of sustained exercise on growth and body composition of first-feeding fry of Arctic charr, Salvelinus alpinus (L.). Aquaculture 1989, 79, 329–335. [Google Scholar] [CrossRef]
- Grünbaum, T.; Cloutier, R.; Le Francois, N.R. Positive effects of exposure to increased water velocity on growth of newly hatched Arctic charr, Salvelinus alpinus L. Aquac. Res. 2008, 39, 106–110. [Google Scholar] [CrossRef]
- Castro, V.; Grisdale-Helland, B.; Helland, S.J.; Kristensen, T.; Jørgensen, S.M.; Helgerud, J.; Claireaux, G.; Farrell, A.P.; Krasnov, A.; Takle, H. Aerobic training stimulates growth and promotes disease resistance in Atlantic salmon (Salmo salar). Comp. Biochem. Physiol. Part A Mol. Integr. Physiol. 2011, 160, 278–290. [Google Scholar] [CrossRef] [PubMed]
- Ibarz, A.; Felip, O.; Fernández-Borràs, J.; Martín-Pérez, M.; Blasco, J.; Torrella, J.R. Sustained swimming improves muscle growth and cellularity in gilthead sea bream. J. Comp. Physiol. B 2011, 181, 209–217. [Google Scholar] [CrossRef]
- Palstra, A.P.; Mes, D.; Kusters, K.; Roques, J.A.; Flik, G.; Kloet, K.; Blonk, R.J. Forced sustained swimming exercise at optimal speed enhances growth of juvenile yellowtail kingfish (Seriola lalandi). Front. Physiol. 2015, 5, 506. [Google Scholar] [CrossRef]
- Tucker, V.A.; Catlett, R. Energetic cost of locomotion in animals. Read. Anim. Energetics 1973, 34, 109. [Google Scholar] [CrossRef] [PubMed]
- Steffensen, J.F.; Johansen, K.; Bushnell, P.G. An automated swimming respirometer. Comp. Biochem. Physiol. Part A Physiol. 1984, 79, 437–440. [Google Scholar] [CrossRef]
- Myrick, C.A.; Cech, J.J. Temperature influences on California rainbow trout physiological performance. Fish Physiol. Biochem. 2000, 22, 245–254. [Google Scholar] [CrossRef]
- Prescott, L.A.; Symonds, J.E.; Walker, S.P.; Miller, M.R.; Swift, L.; Herbert, N.A.; Semmens, J.M.; Carter, C.G. The mismatch between swimming speeds and flow regimes when optimizing exercise regimes to improve Chinook salmon, Oncorhynchus tshawytscha, performance. Aquaculture 2024, 585, 740705. [Google Scholar] [CrossRef]
- Kline, R.J.; Parkyn, D.C.; Murie, D.J. Empirical modelling of solid-blocking effect in a Blazka respirometer for gag, a large demersal reef fish. Adv. Zool. Bot. 2015, 3, 193–202. [Google Scholar] [CrossRef]
- He, P.; Wardle, C.S. Endurance at intermediate swimming speeds of Atlantic mackerel, Scomber scombrus L.; herring, Clupea harengus L.; and saithe, Pollachius virens L. J. Fish Biol. 1988, 33, 255–266. [Google Scholar] [CrossRef]
- Weihs, D. Effects of swimming path curvature on the energetics of fish motion. Fish. Bull. 1981, 79, 171, LCCN: 72625459. [Google Scholar]
- Steinhausen, M.F.; Steffensen, J.F.; Andersen, N.G. Tail beat frequency as a predictor of swimming speed and oxygen consumption of saithe (Pollachius virens) and whiting (Merlangius merlangus) during forced swimming. Mar. Biol. 2005, 148, 197–204. [Google Scholar] [CrossRef]
- Schurmann, H.; Steffensen, J.F. Effects of temperature, hypoxia and activity on the metabolism of juvenile Atlantic cod. J. Fish Biol. 1997, 50, 1166–1180. [Google Scholar] [CrossRef]
- Christensen, E.A.; Svendsen, M.B.; Steffensen, J.F. The combined effect of body size and temperature on oxygen consumption rates and the size-dependency of preferred temperature in European perch Perca fluviatilis. J. Fish Biol. 2020, 97, 794–803. [Google Scholar] [CrossRef] [PubMed]
- Schurmann, H.; Steffensen, J.F.; Lomholt, J.P. The influence of hypoxia on the preferred temperature of rainbow trout Oncorhynchus mykiss. J. Exp. Biol. 1991, 157, 75–86. [Google Scholar] [CrossRef]
- Chen, Z.; Snow, M.; Lawrence, C.S.; Church, A.R.; Narum, S.R.; Devlin, R.H.; Farrell, A.P. Selection for upper thermal tolerance in rainbow trout (Oncorhynchus mykiss Walbaum). J. Exp. Biol. 2015, 218, 803–812. [Google Scholar] [CrossRef]
- Thorarensen, H.; Gallaugher, P.; Farrell, A.P. Cardiac output in swimming rainbow trout, Oncorhynchus mykiss, acclimated to seawater. Physiol. Zool. 1996, 69, 139–153. [Google Scholar] [CrossRef]
- Brett, J.R. The respiratory metabolism and swimming performance of young sockeye salmon. J. Fish. Board Can. 1964, 21, 1183–1226. [Google Scholar] [CrossRef]
- Webb, P.W. The swimming energetics of trout: I. Thrust and power output at cruising speeds. J. Exp. Biol. 1971, 55, 489–520. [Google Scholar] [CrossRef]
- Davison, W.; Goldspink, G. The effect of prolonged exercise on the lateral musculature of the brown trout (Salmo trutta). J. Exp. Biol. 1977, 70, 1–12. [Google Scholar] [CrossRef]
- Cooke, S.J.; Chandroo, K.P.; Beddow, T.A.; Moccia, R.D.; McKinley, R.S. Swimming activity and energetic expenditure of captive rainbow trout (Oncorhynchus mykiss) estimated by electromyogram telemetry. Aquac. Res. 2000, 31, 495–505. [Google Scholar] [CrossRef]
- Thorstad, E.; Kland, F.; Finstad, B.; Sivertsgrd, R.; Bjorn, P.; McKinleyd, R. Migration speeds and orientation of Atlantic salmon and sea trout post-smolts in a Norwegian fjord system. Environ. Biol. Fishes 2004, 71, 305–311. [Google Scholar] [CrossRef]


Disclaimer/Publisher’s Note: The statements, opinions and data contained in all publications are solely those of the individual author(s) and contributor(s) and not of MDPI and/or the editor(s). MDPI and/or the editor(s) disclaim responsibility for any injury to people or property resulting from any ideas, methods, instructions or products referred to in the content. |
© 2025 by the authors. Licensee MDPI, Basel, Switzerland. This article is an open access article distributed under the terms and conditions of the Creative Commons Attribution (CC BY) license (https://creativecommons.org/licenses/by/4.0/).