Article

Genomic Structure and Hybridization Patterns of Brown Trout (Salmo trutta L.) in the Aosta Valley Using ddRAD-seq, mtDNA-CR, and LDH-C1* Markers


by
Edo D’Agaro
1,*,
Pierpaolo Gibertoni
2 and
Stefano Esposito
2
1
Department of Agricultural, Food, Environmental and Animal Sciences (Di4A), University of Udine, Via delle Scienze 206, 33100 Udine, Italy
2
Mediterranean Trout Research Group, Via Porali 1/A, Collagna, 42037 Reggio Emilia, Italy
*
Author to whom correspondence should be addressed.
Fishes 2025, 10(11), 578; https://doi.org/10.3390/fishes10110578
Submission received: 7 May 2025 / Revised: 3 November 2025 / Accepted: 3 November 2025 / Published: 10 November 2025
(This article belongs to the Special Issue Conservation and Population Genetics of Fishes)

Abstract

The aim of this research was to characterize the genetic structure of brown trout species complex populations in nine river basins in the Aosta Valley and neighbouring regions in northern Italy. We used a combined analysis of nuclear lactate dehydrogenase (LDH-C1*), mitochondrial DNA-CR (control region) (mtDNA-CR) sequences and ddRAD-seq-generated single-nucleotide polymorphism. In this way, we estimated the degree of hybridization of wild populations with the Atlantic-derived hatchery lineage. The results of the genetic analyses showed a complex genetic structure with different levels of introgression at the respective sampling sites. The mitochondrial lineages (Atlantic (AT), Mediterranean (ME), Adriatic (AD), and Marmoratus (MA)) were present with varying percentages across the sampling sites. Data analysis using the Admixture v.1.3.0 software allowed the identification of four distinctive cluster units in the Aosta Valley. For the Vertosan River, we identified a distinct native population and a level of hybridization close to zero. In terms of conservation, this population with a distinct native lineage represents a high priority for protection and serves as a reservoir for the entire western north Italian alpine zone. Some interventions to support conservation actions within the study area can be envisaged.
Key Contribution: We used a combined analysis of the mtDNA-CR, nuclear LDH-C1* and ddRAD-seq to study the genetic structure of Italian brown trout populations. The results of the genetic analyses showed complex genetic structures in the studied area. Thanks to ddRAD-seq method, we identified four distinct cluster units. In this way, we increased the number of markers (SNPs), greatly increasing the robustness and precision of estimates of various parameters traditionally used in conservation genetics. In the Aosta Valley, we identified a new native population in the Vertosan river. This population with a distinct native lineage represents a high priority for protection and can serve as a reservoir for the entire western north Italian alpine zone.

1. Introduction

The brown trout (Salmo trutta L.) is one of most important salmonid species in Europe. The term “Salmo trutta complex” refers to the high level of genetic and phenotypic variability and the difficulty of taxonomic classification of brown trout. This species shows great genetic diversification within its evolutionary history. In Italy, intensive stocking with domesticated strains of brown trout of Atlantic origin has been done for decades, increasing the density of local populations, particularly for sport fishing. In recent years, however, numerous genetic analyses conducted on brown trout in Italy have shown a high level of introgression of the Atlantic lineage into populations of native background [1,2,3].
In brown trout, fragments of the non-coding mitochondrial control region (mtDNA-CR) [4], nuclear LDH-C1* gene, and various microsatellite arrays have been commonly used to assess genetic diversity across populations [5,6,7,8,9,10]. According to Bernatchez [4], the mtDNA-CR discriminates seven main clusters: Danubian (DA), Atlantic (AT), Marmoratus (MA), Adriatic (AD), Mediterranean (ME), Duero (DU), and Tigris (TI) [4,11]. These seven lineages are considered evolutionarily significant units (ESUs), making it possible to implement ESU-based management programs. Of these, the ME, AD, AT, and MA lineages are the most relevant in the Alpine and Italian contexts. The ME line is typical of brown trout living in western south Europe, such as Italy, Spain, southern France and Corsica, and represents brown trout that probably survived the glaciations in refuges of the western Mediterranean basin. Notably, ME haplotypes have been documented in some north Italian waters connected to France [1,4]. The AD lineage is associated with brown trout from the Adriatic Sea drainages (historically on the Italian and Balkan sides of the Adriatic). The AD lineage includes the genetic stock of Salmo ghigii (used in recent literature) as well as the marble trout’s (Salmo trutta marmoratus) maternal lineage. The MA lineage refers to a genetic variant of the marble trout, endemic to northern Italy and adjacent regions, which has a distinctive appearance and historically dominates lower-elevation rivers [7]. The endemic lake trout of Lake Garda (Salmo carpio, or Garda “carpione”) carries unique haplotypes with a small contribution from the MA lineage [12].
In Italy, the original occurrence of the ME and AD lineages in the Alpine area has long been debated. Over the last 30 years, some authors have indicated the ME and AD lineages as the only native populations in the Alpine area, while other authors have indicated S. trutta marmoratus (MA) as the only native lineage [13]. The original range of brown trout has been indicated as the northern part of the Apennines and the Alpine area. Splendiani et al. [2] confirmed the native character of brown trout populations in the south-western Alps and indicated that the Cottian and Maritime Alps acted as a dispersal corridor from the Tyrrhenian Sea to the French side. A contact zone with marble trout has been established in that area. Polgar et al. [14] proposed several distribution scenarios in the Po Valley before the last glacial period. The Po Valley is the largest region in Italy, and the Po River, which has its source near Mount Monviso on the French border, flows for 652 km from the Alps to the Adriatic Sea, and is joined by several rivers through various regions (Piemonte, Valle d’Aosta, Liguria, Lombardia and Emilia Romagna). According to D’Agaro et al. [15], the entire Po Valley basin can be considered as a potential dispersal area for the ME and AD brown trout lineages. Splendiani et al. [1] conducted studies on DNA museum samples collected in northern Italy before the start of stocking activities with the AT lineage. The results showed the presence at that time of ME and AD haplotypes (e.g., from a museum sample dated 1876 of the ME lineage from Lake Moncenisio).
The aim of this study was to increase the knowledge on brown trout living in the western north Italian Alps. For the genetic analysis, the mtDNA-CR (to identify the ME, AD, AT, and MA lineages), the nuclear LDH-C1* marker (to discriminate between the diagnostic alleles: *90, AT lineage and *100, ME lineage) and ddRAD-seq were used. Thanks to ddRAD-seq, it is, now possible to achieve very high marker densities (using SNPs). Increasing the number of markers greatly increases the robustness and precision of estimates of various parameters traditionally used in conservation genetics. The high number of markers available also allows the identification of outlier loci whose genetic distance parameters deviate significantly from the rest of the genome. These outliers may reflect genomic regions involved in local adaptation. They are classically distinguished by high levels of genetic differentiation between populations living in different habitats [16,17]. Thus, the main objective of the study was the genetic characterization of brown trout populations from the Aosta Valley and bordering regions (Piemonte, Liguria, and Lombardia) in order to identify non-hybrid native brown trouts. In a previous study, Magris et al. [18] used the same method (ddRAD-seq) for the genetic characterization of several brown trout samples from all over Italy. In the present work, samples from the two studies were analyzed together.

2. Materials and Methods

2.1. Sample Collection

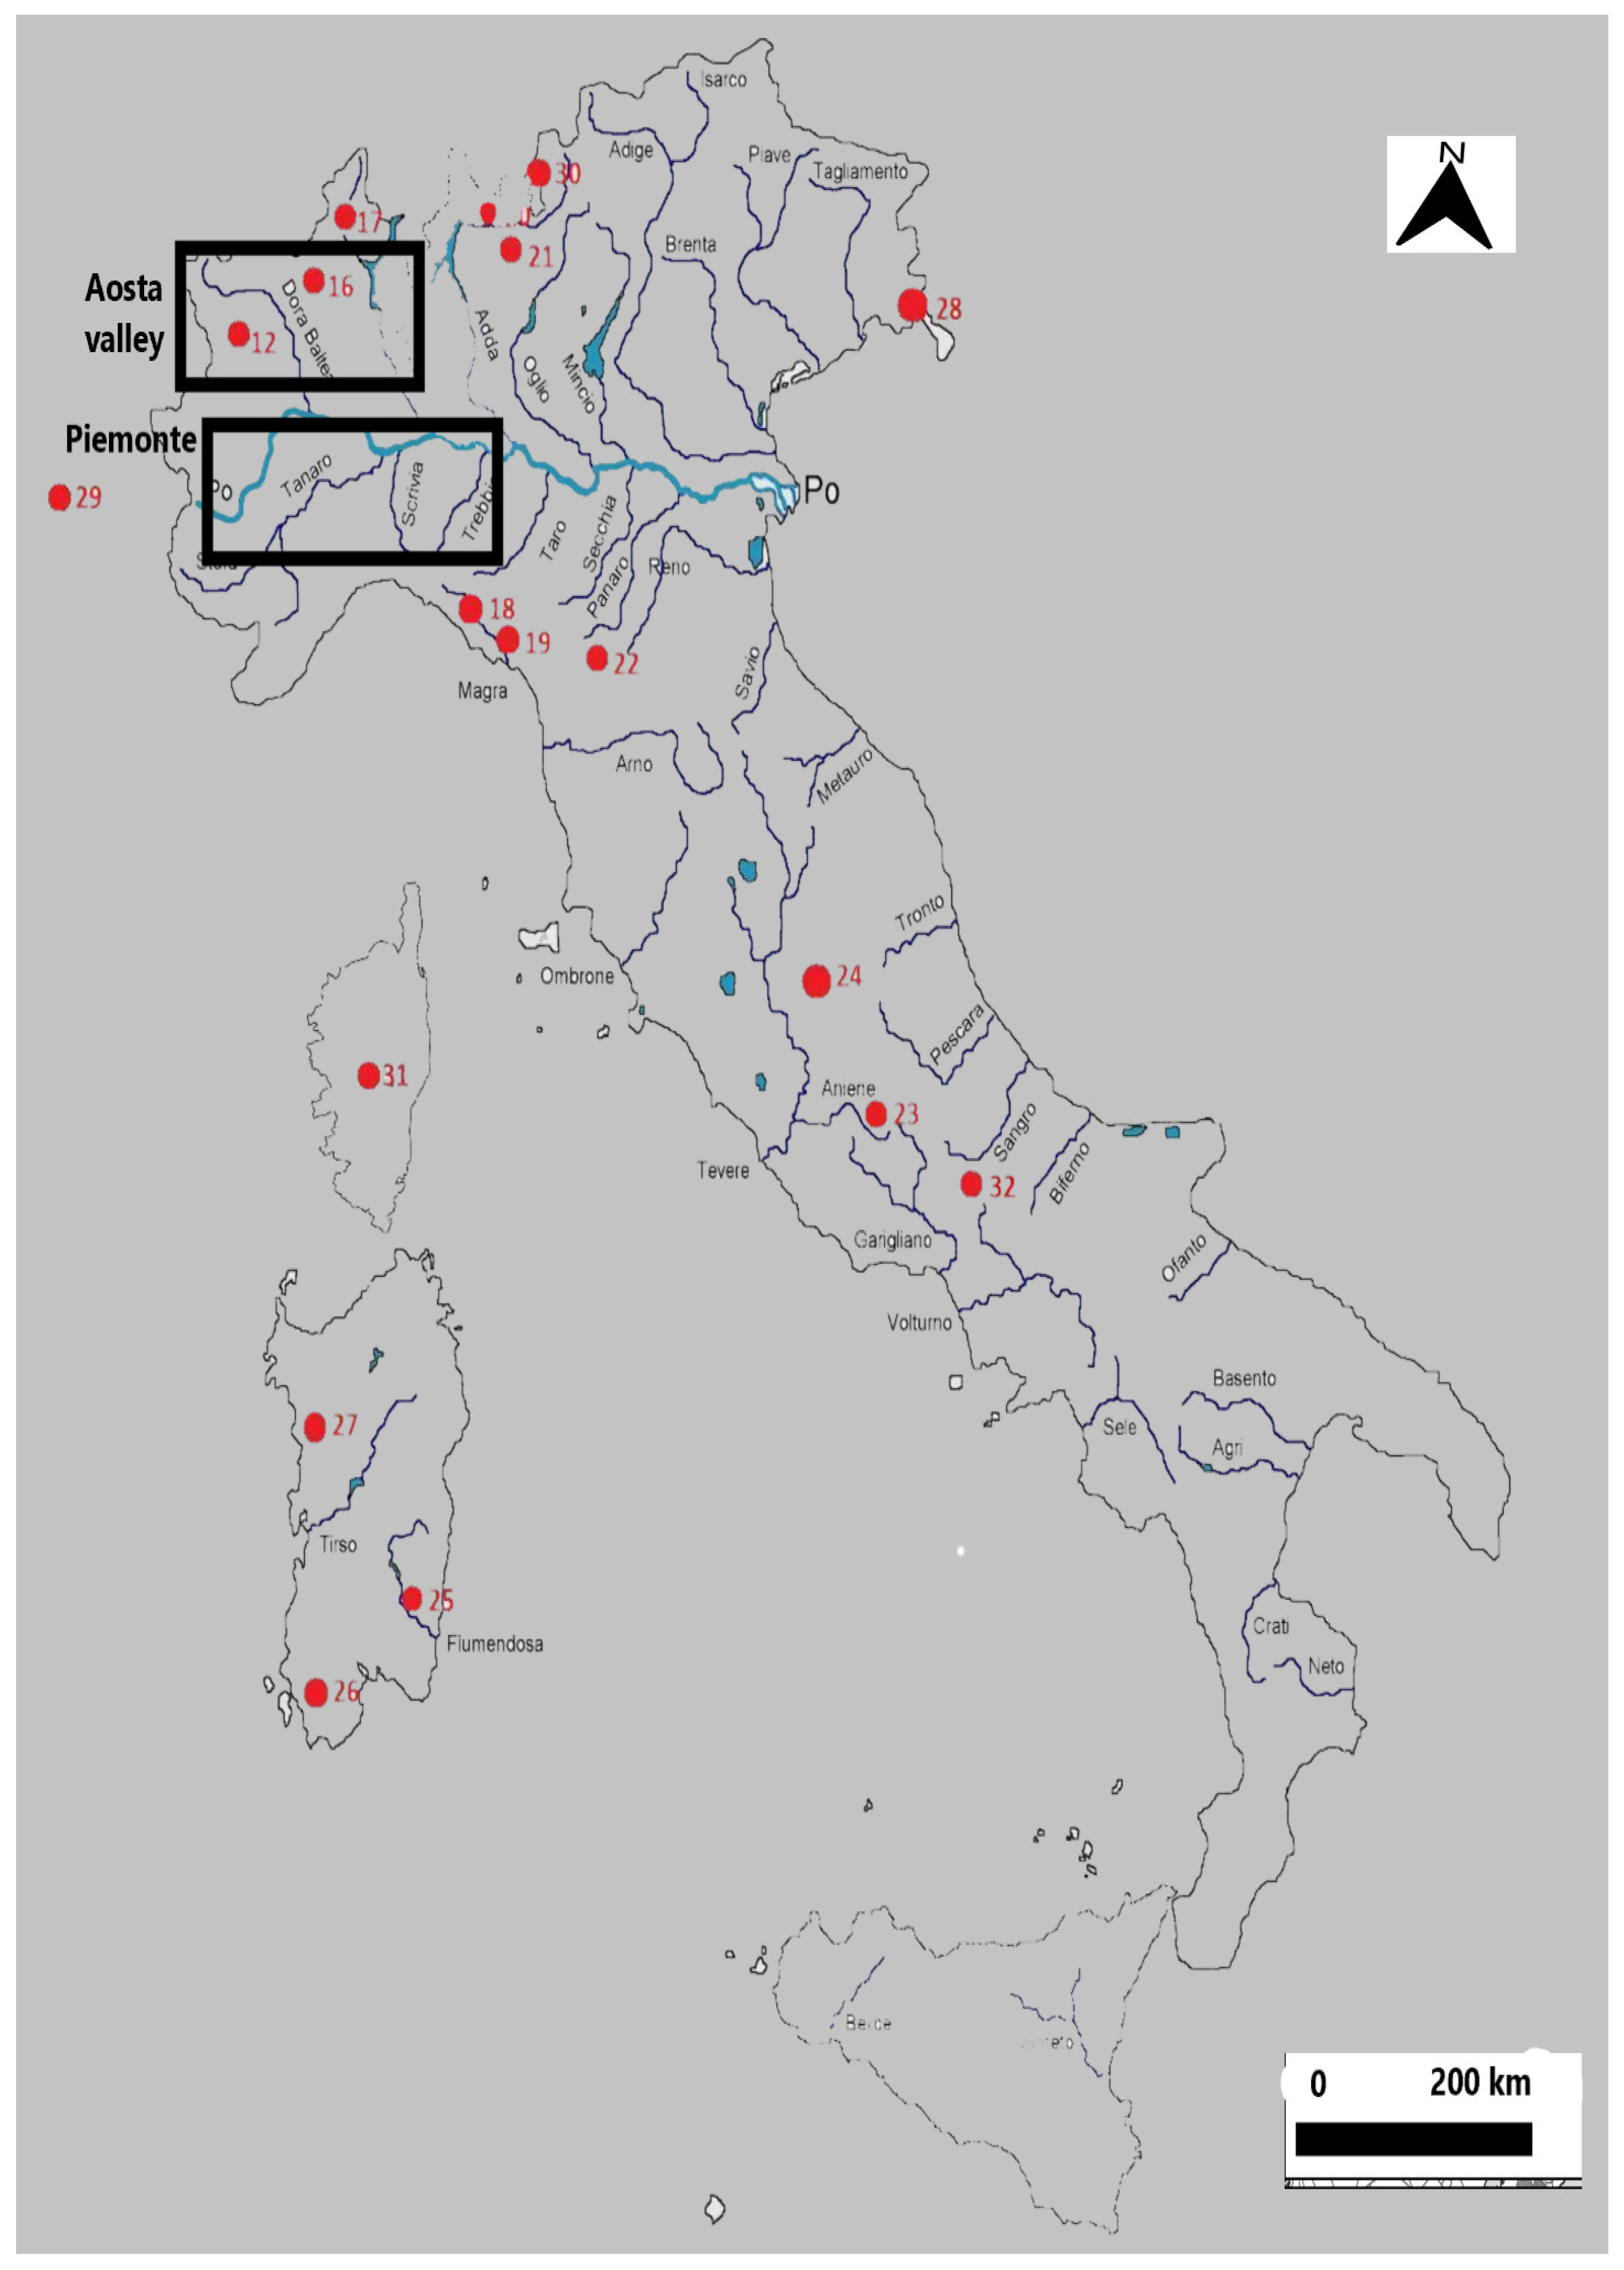
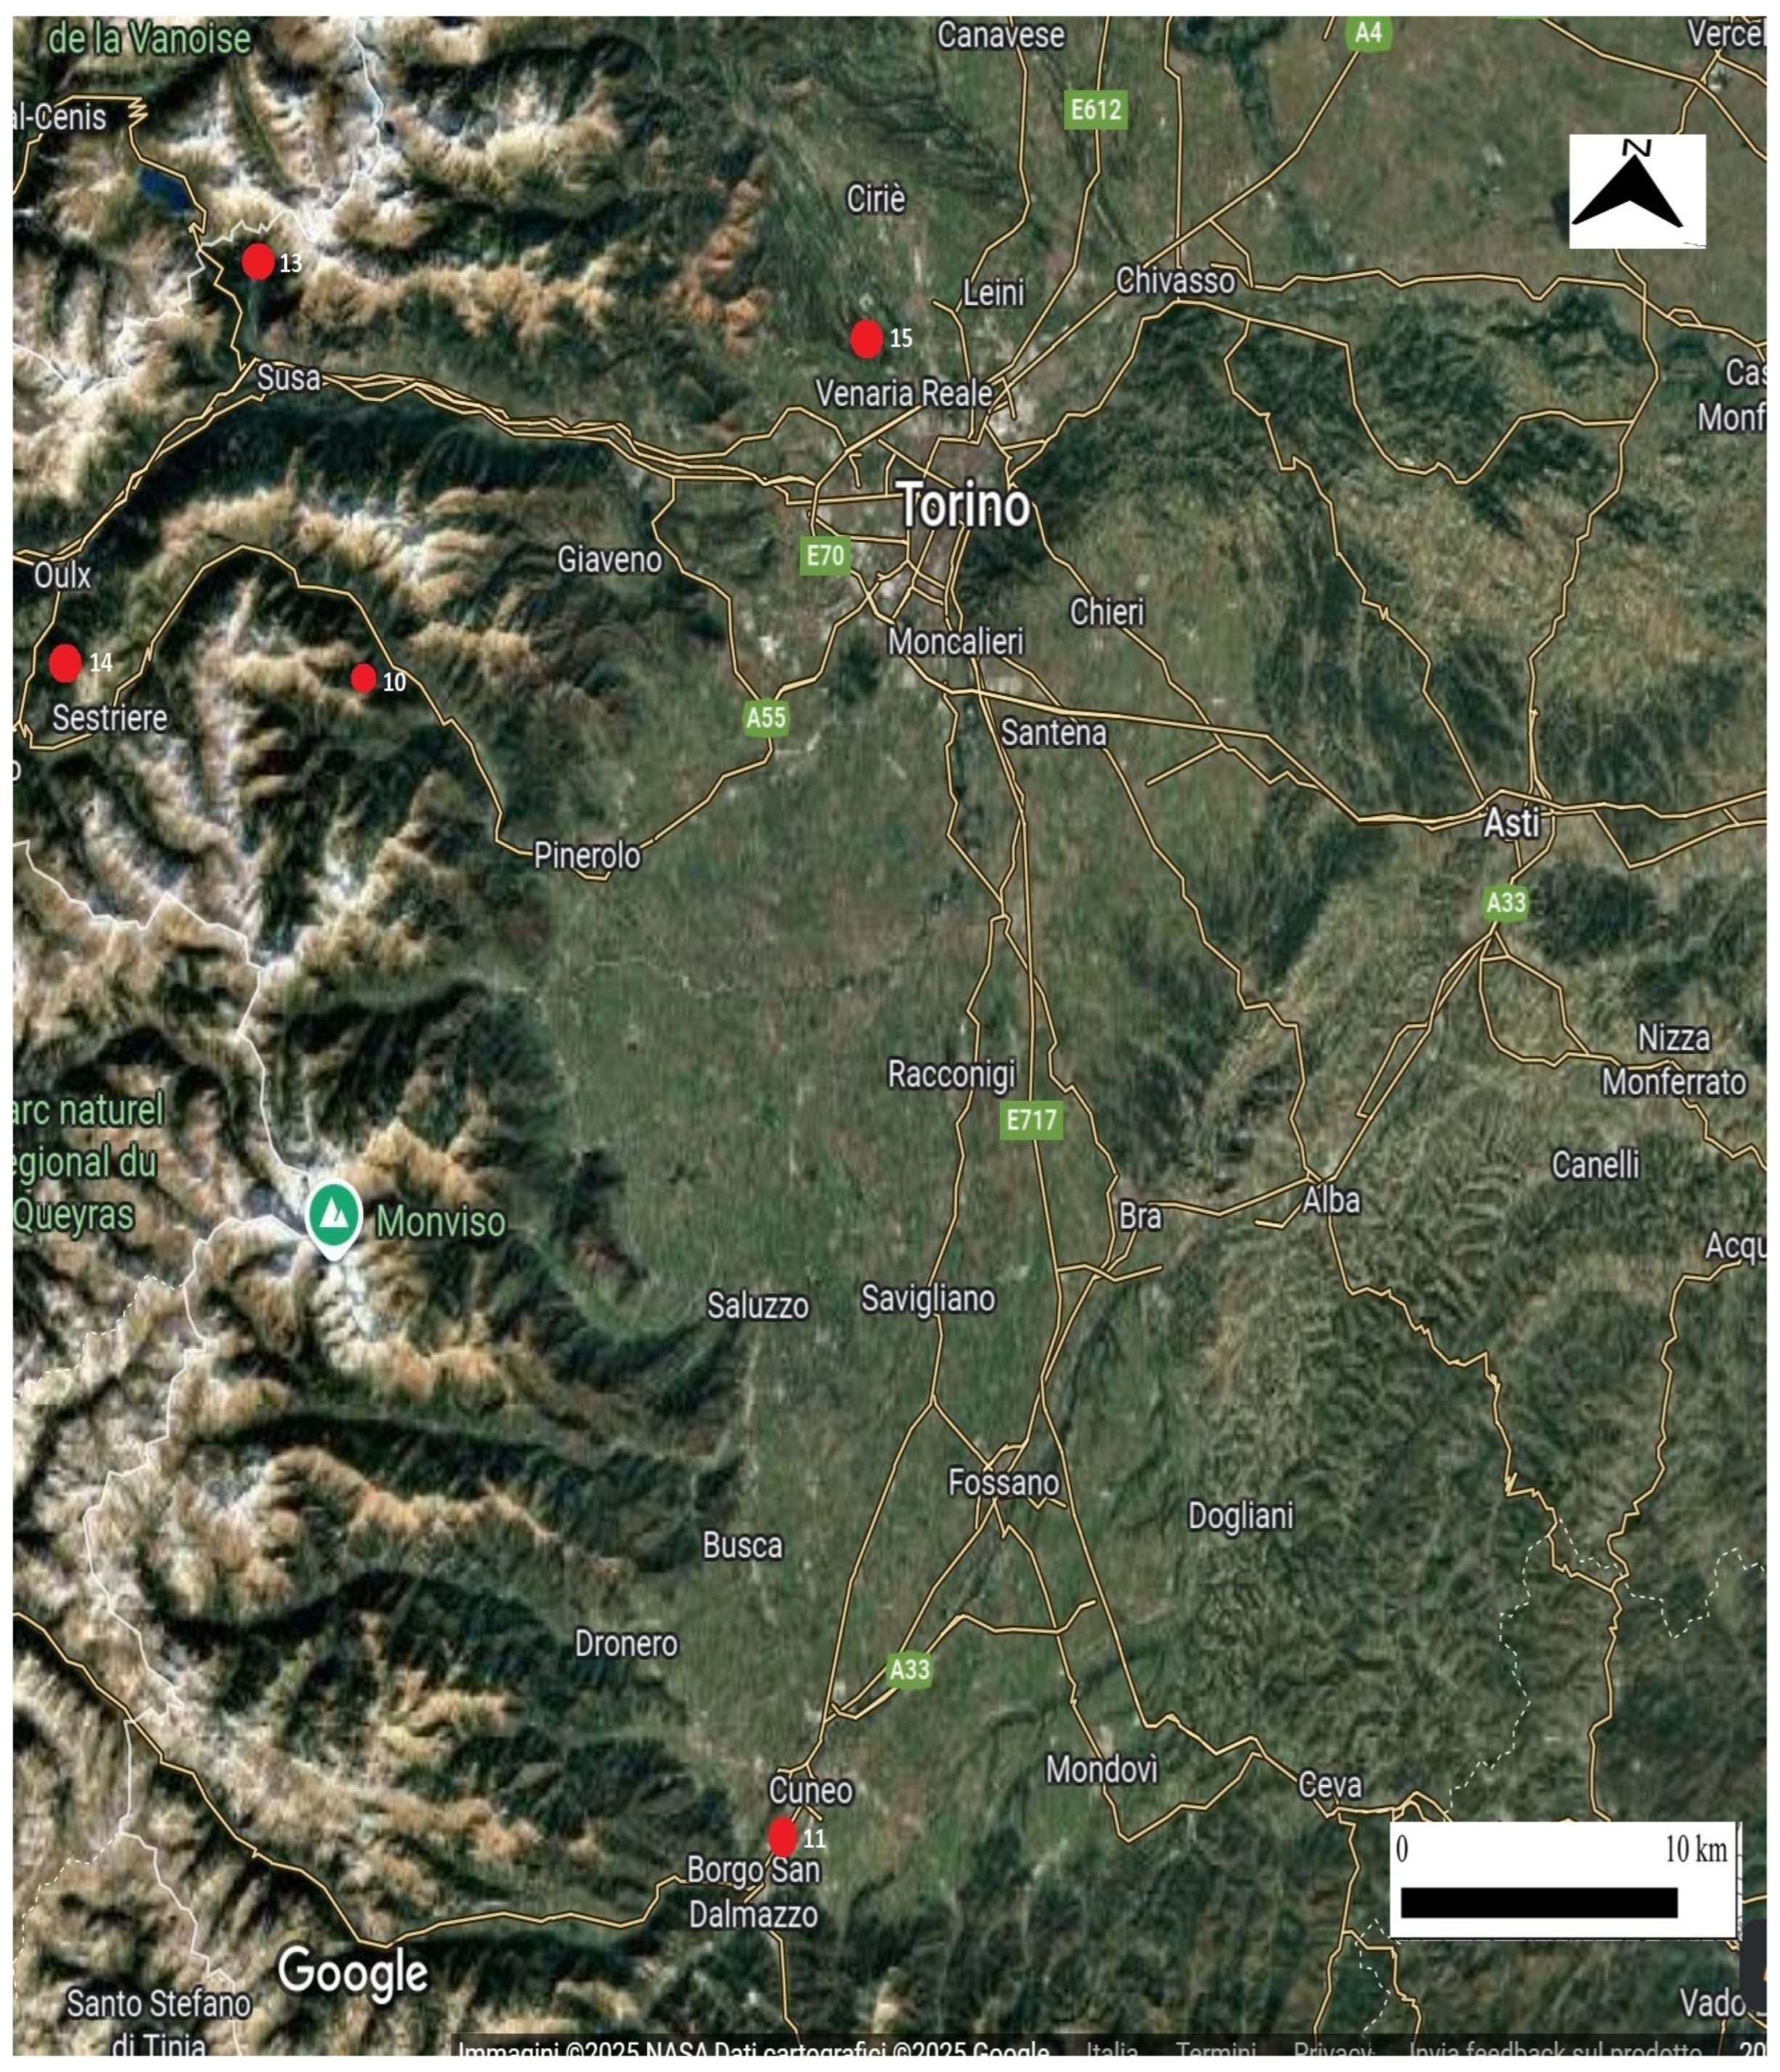
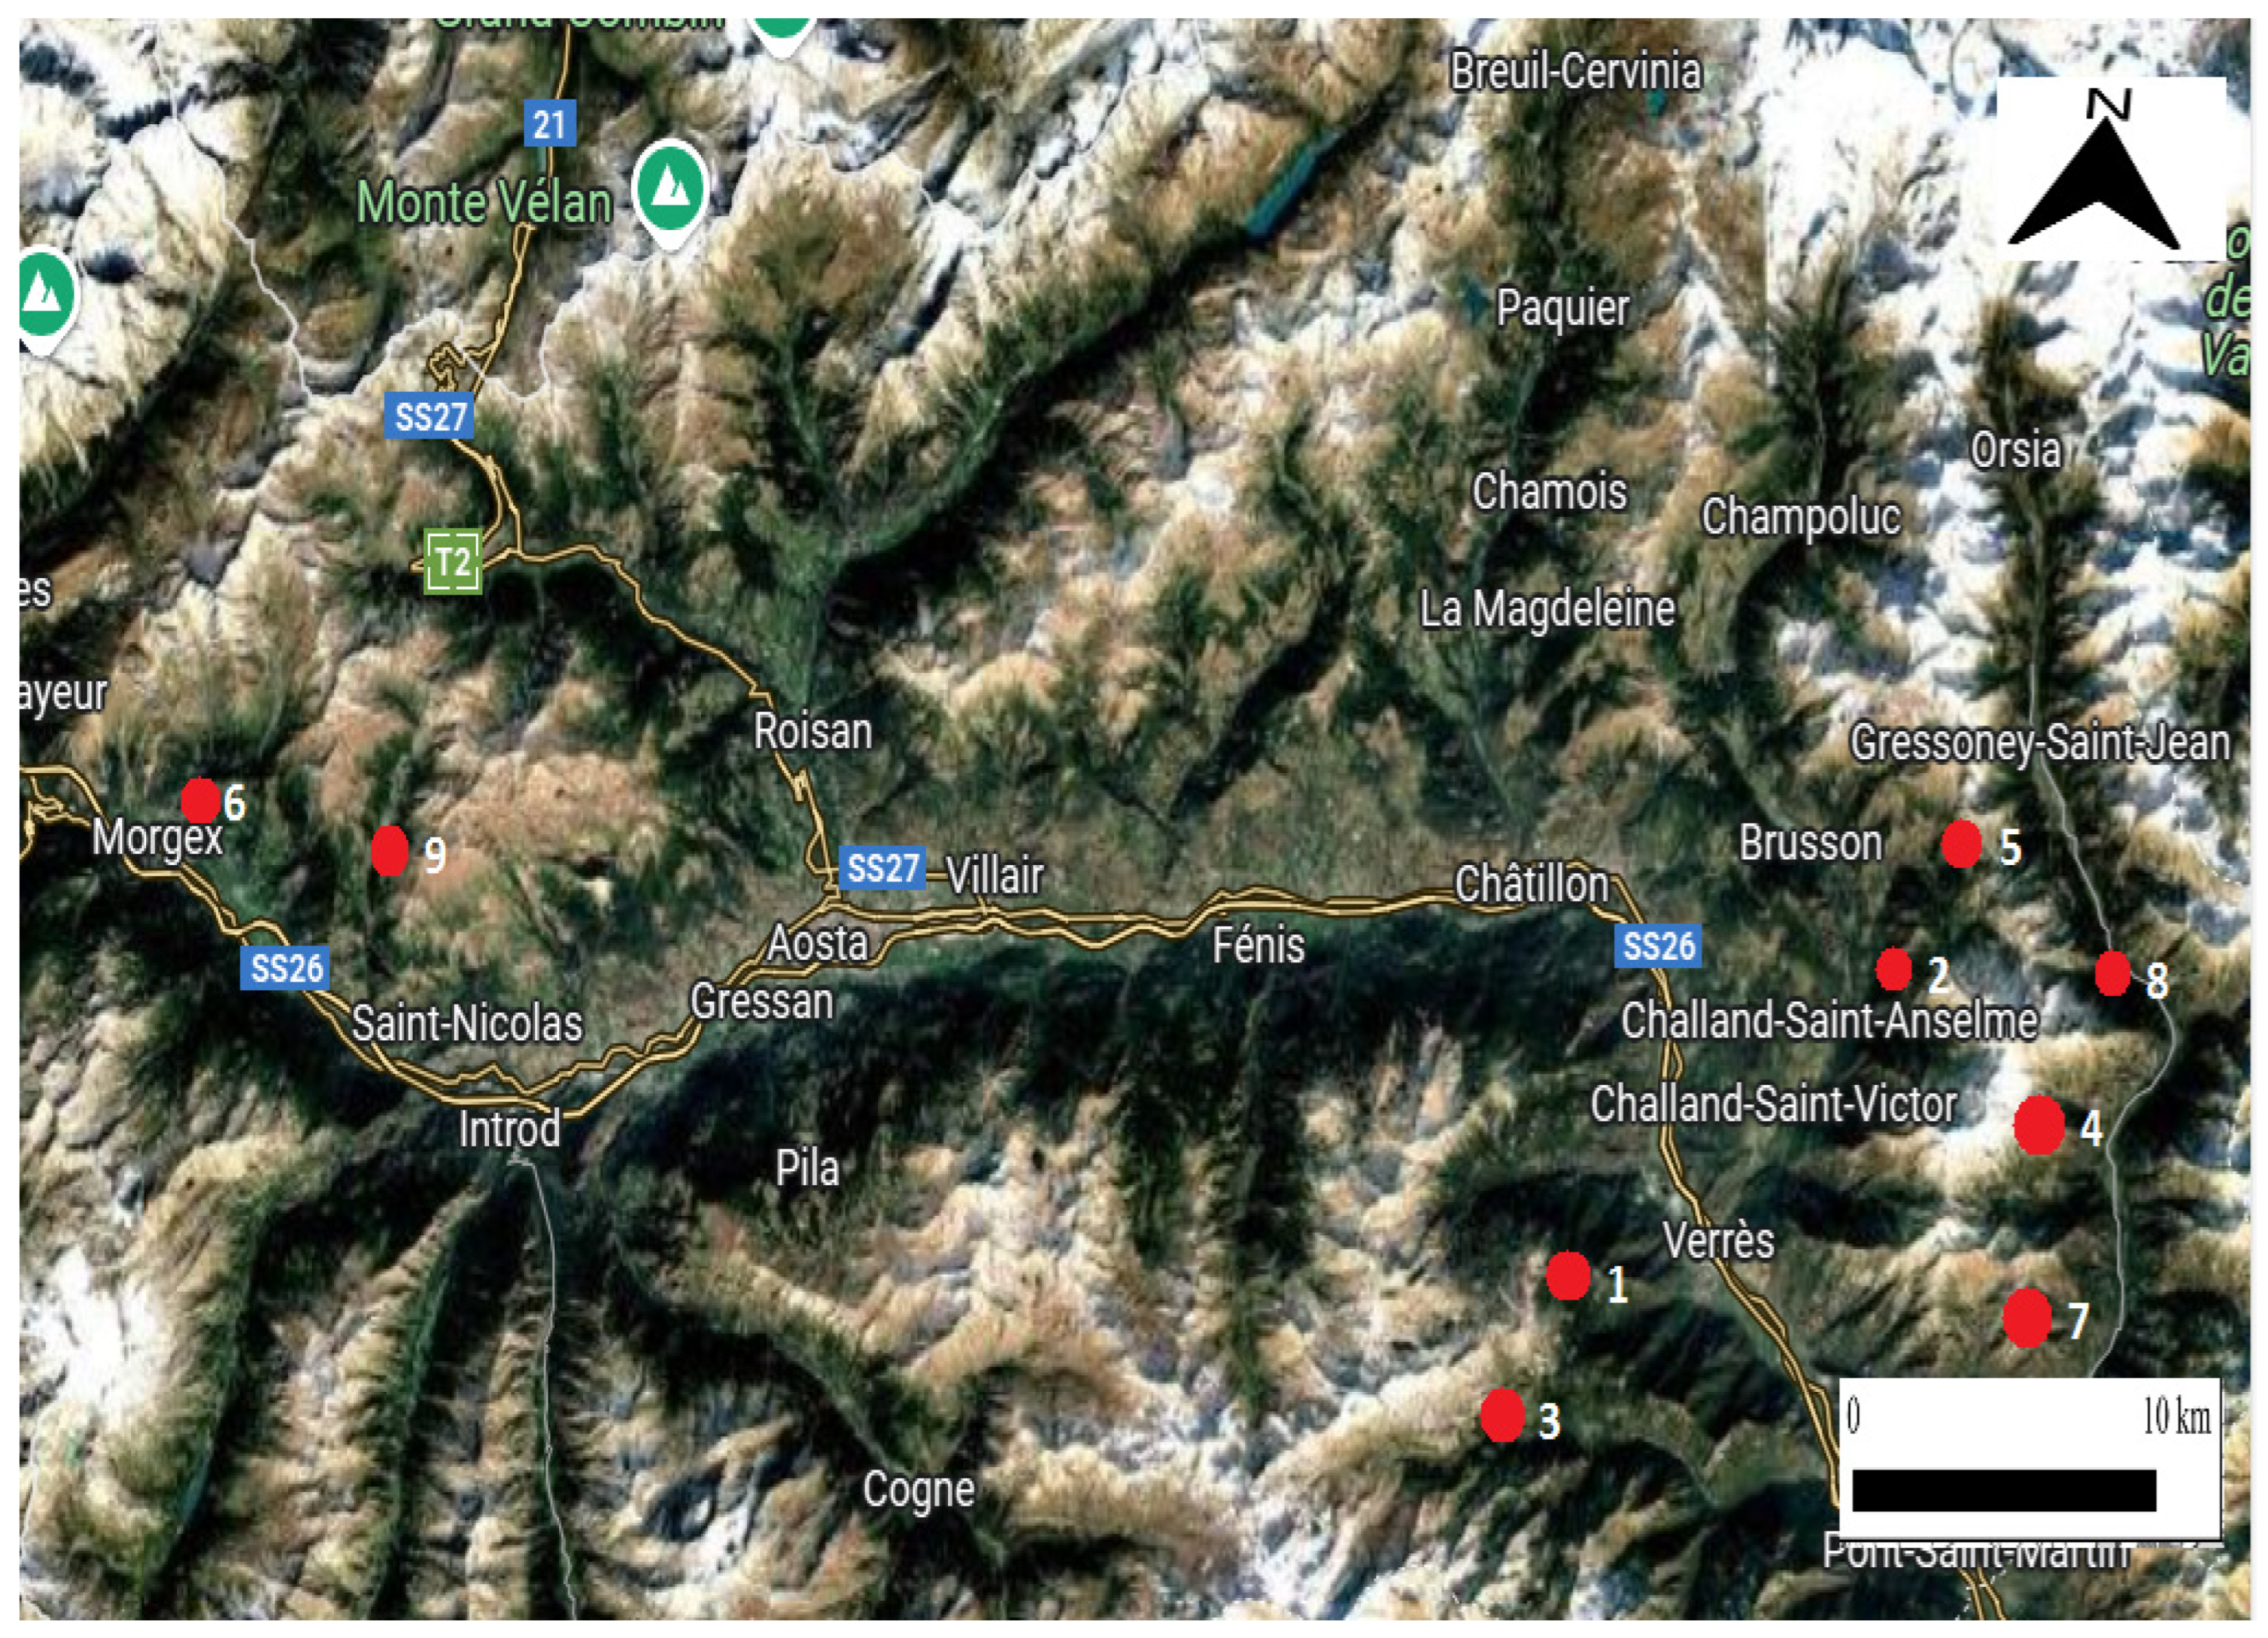
The objective of the present study was to analyze a representative sample of all the wild populations of the Aosta Valley (Italy) and nearby regions (Piemonte, Liguria and Lombardia) and assess their possible origin. In the period between October and December 2024, the nine main watercourses of the Aosta Valley region with an additional eight locations from Piemonte, two from Liguria, and two from Lombardia were sampled by electrofishing. Sampling activities were carried out in different parts of the river to obtain a representative sample of the entire watercourse. In all the locations, at least twenty individuals were sampled at each location. Figure 1, Figure 2 and Figure 3 show the sampling locations for all of Italy, the Piemonte region, and the Aosta Valley, respectively.
In Table 1 are listed all the sampling sites used in the present study.
A small fin clip was taken from the individuals sampled and preserved in 95% ethyl alcohol at −20 °C. After taking the fin clip, each individual was immediately released at the catch site. Samples of individuals (ten fish from each sampling site) were selected for ddRAD-seq analysis.

2.2. Genetic Analysis

2.2.1. DNA Extraction

DNA extraction was performed with the MagAttract HMW DNA kit (Qiagen, Hilden, Germany) according to the manufactures’ protocols.

2.2.2. mtDNA-CR and Nuclear LDH-C1*

The mtDNA gene (992 bp) was amplified with primers L19 and HN20 [4]. PCR conditions were as follow: 94 °C for 5 min; 35 cycles at 94 °C for 30 s; 50 °C for 30 s and 72 °C for 1 min; extension at 72 °C for 10 min. Sequencing was performed with the ABI Prism 3130 instrument (Applied Biosystems, Carlsbad, CA, USA). The sequences obtained were aligned using Clustal W software (Mega v.12.1). CR haplotypes were identified with DNASP v.6 [19] software and assigned to the AD, MA, ME and AT lineages by phylogenetic analysis. The HKY + I + G model, estimated with J-ModelTest v.3.7 software, was used for the phylogenetic analysis [19]. 1000 bootstrap replicates were used to calculate the confidence values of the nodes. All models used in this analysis are described in more detail in the work of Antognazza et al. [3]. Phylogenetic relationships among populations were inferred using the Neighbor-Net method in SplitsTree v. 4 [20]. The options for this software were: Network, Neighbor-Net, Draw.
The PCR conditions for the LDH-C1* gene (440 bp) were as follow: volume: 50 uL; dNTP: 0.2 mM; MgCl2: 1.5 mM; primers: 100 ng each; thermocycling: 5 min at 95 °C; 30 cycles 1 min at 95 °C; 1 min at 60 °C; 1 min at 72 °C; extension 10 min at 72 °C. The amplicons were digested with the enzyme BseLI (Fermentas Inc., Burlington, ON, Canada) and the fragments obtained were separated using an agarose gel (discrimination between the diagnostic alleles: *90, AT lineage and *100, ME lineage) [21].
The LDH-C1* and mtDNA-CR methods were used only for samples from the Aosta Valley region and neighbouring regions.

2.2.3. ddRAD Sequencing Analysis

ddRAD sequencing was performed at IGA Technology Services S.r.l. (Udine, Italy). The ddRAD libraries were obtained according to the manufacturer’s instructions. Genomic DNA was digested with SbfI and SphI enzymes and an agarose gel was used to separate the DNA fragments (size selection range: 200–500 bp). Paired-end sequences (2 × 150 bp) were obtained using the Novaseq6000 instrument (Illumina, San Diego, CA, USA). Stacks v2.0 and Admixture v.1.3.0 were used to analyze ddRAD-seq data and study the structure of populations and the probable number of clusters, K. For each individual, the software Admixture calculates the probability Q that it belongs to each of the K populations [22]. Genetic analyses are based on comparing ddRAD-seq data from the populations analyzed with domestic reference lines (AT, ME, MA). The same software and procedures were used to analyze the first set of data collected in an earlier study by Magris et al. [18]. All methods are described in detail (see also additional files) by Magris et al. [18]. Samples of one hundred and ninety-two individuals were selected for ddRAD-seq analysis. Furthermore, samples collected and analyzed (n = 96) in a previous study [18] (Molise, Sardegna, Corsica (France), Lake Garda and Friuli Venezia Giulia) were merged for a broader comparison.

3. Results

3.1. Population Structure

Table 2 shows a summary of the results obtained in the Aosta Valley for the mtDNA-CR, LDH-C1* and ddRAD-seq (Q quantifies the admixture proportion from the AT lineage) analysis. Sequencing of the mtDNA-CR gene identified eight different haplotypes (MEcs1; ADrh1; ADporh1; ADcs1; MA-S1; MA-S2; MA-S3; MA-S4; Masl1). LDH-C1* analysis confirmed the presence of the *90 allele from the AT lineage.
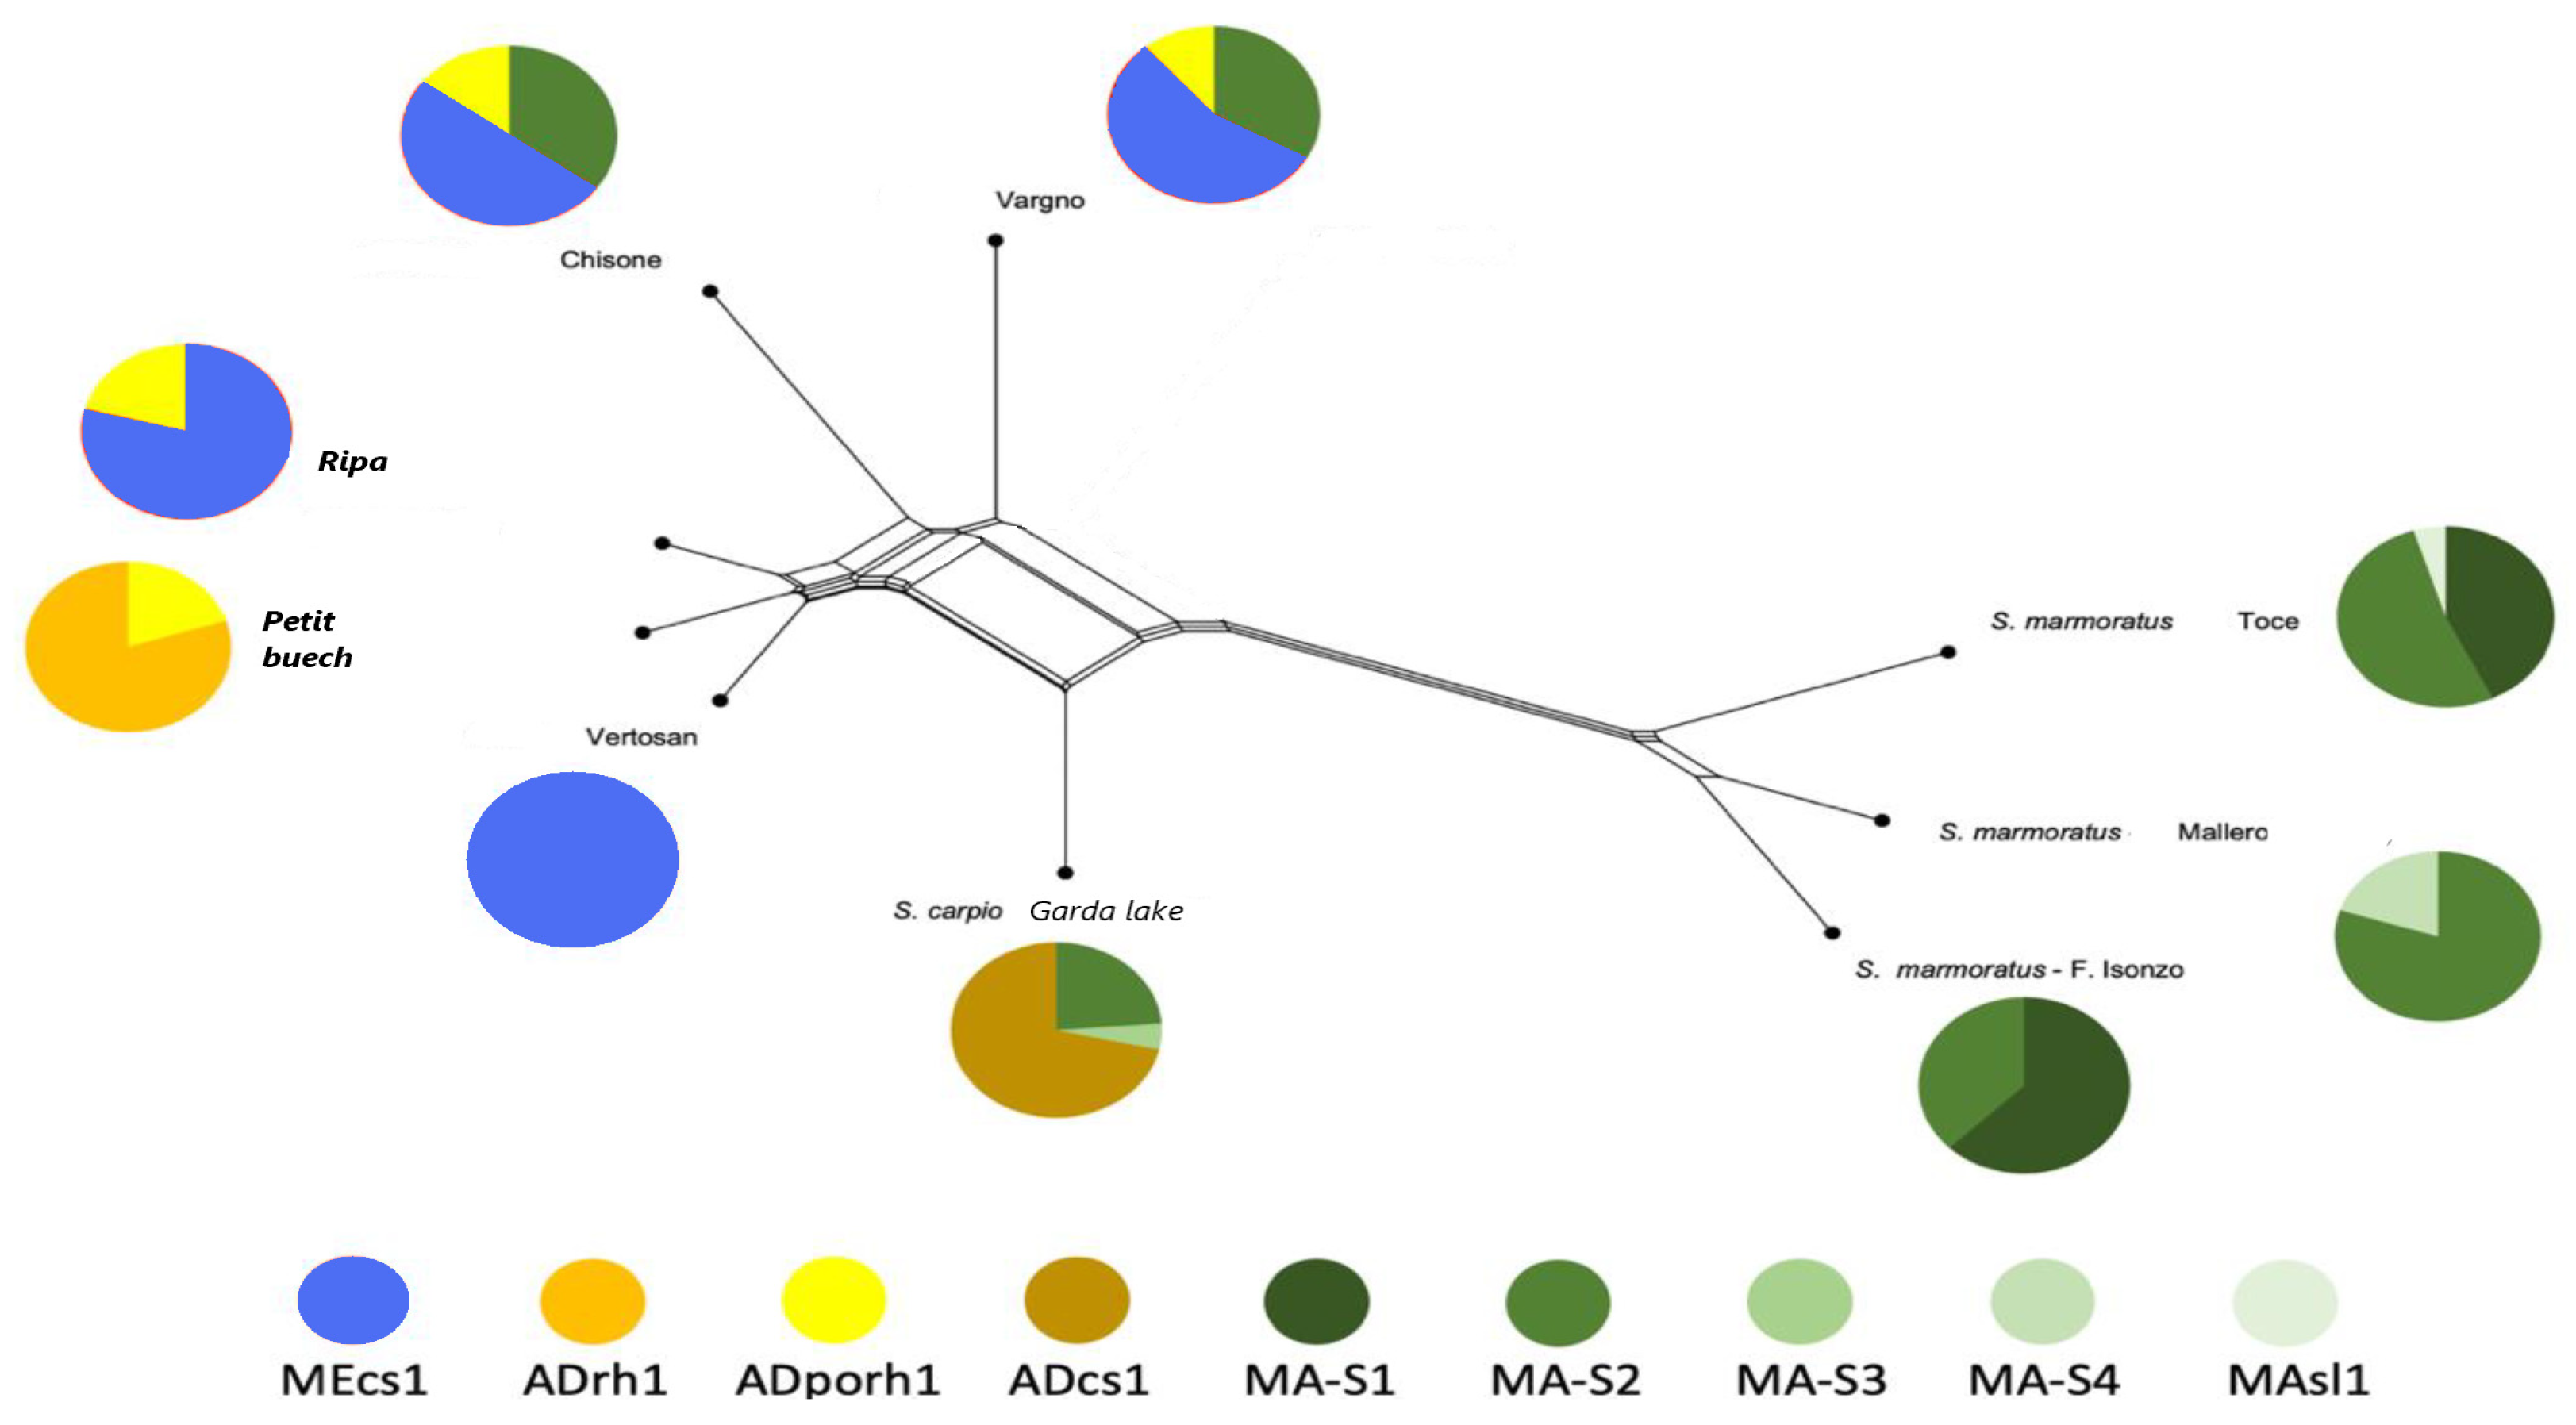
Figure 4 shows a graph obtained with the Neighbour Net method of a representative selection of the brown trout complex populations living across the Alpine area.
Figure 4 shows that populations from Vertosan (site: 9), Ripa (site: 14) and Petit Buech Buëch (France) (site: 29) rivers are located at the opposite end from the marble trout from the Central and Eastern Alps. Specimens of Chisone (site: 10), Crest (site: 3) and Vargno (site: 8) rivers are arranged along intermediate nodes between these two extremes. The intermediate position in the phylogenetic network of the S. carpio from the Garda Lake, support the hypothesis of the hybrid origin of this differentiated and isolated form. Populations in intermediate positions in the network show a variable percentage of MA haplotypes.

3.2. ddRAD-seq Analysis

A total of 973,900,734 sequences were obtained; 19,222,079 was the maximum number of demultiplexed sequences per sample, and the average number was 10,144,799. In total, 263,198 SNPs passed the filtering criteria and were identified across the 40 chromosomes of Salmo trutta. All samples achieved excellent qualitative values. After merging with the samples analyzed by Magris et al. [18], the total group consisted of 288 individuals with 93,678 SNPs.
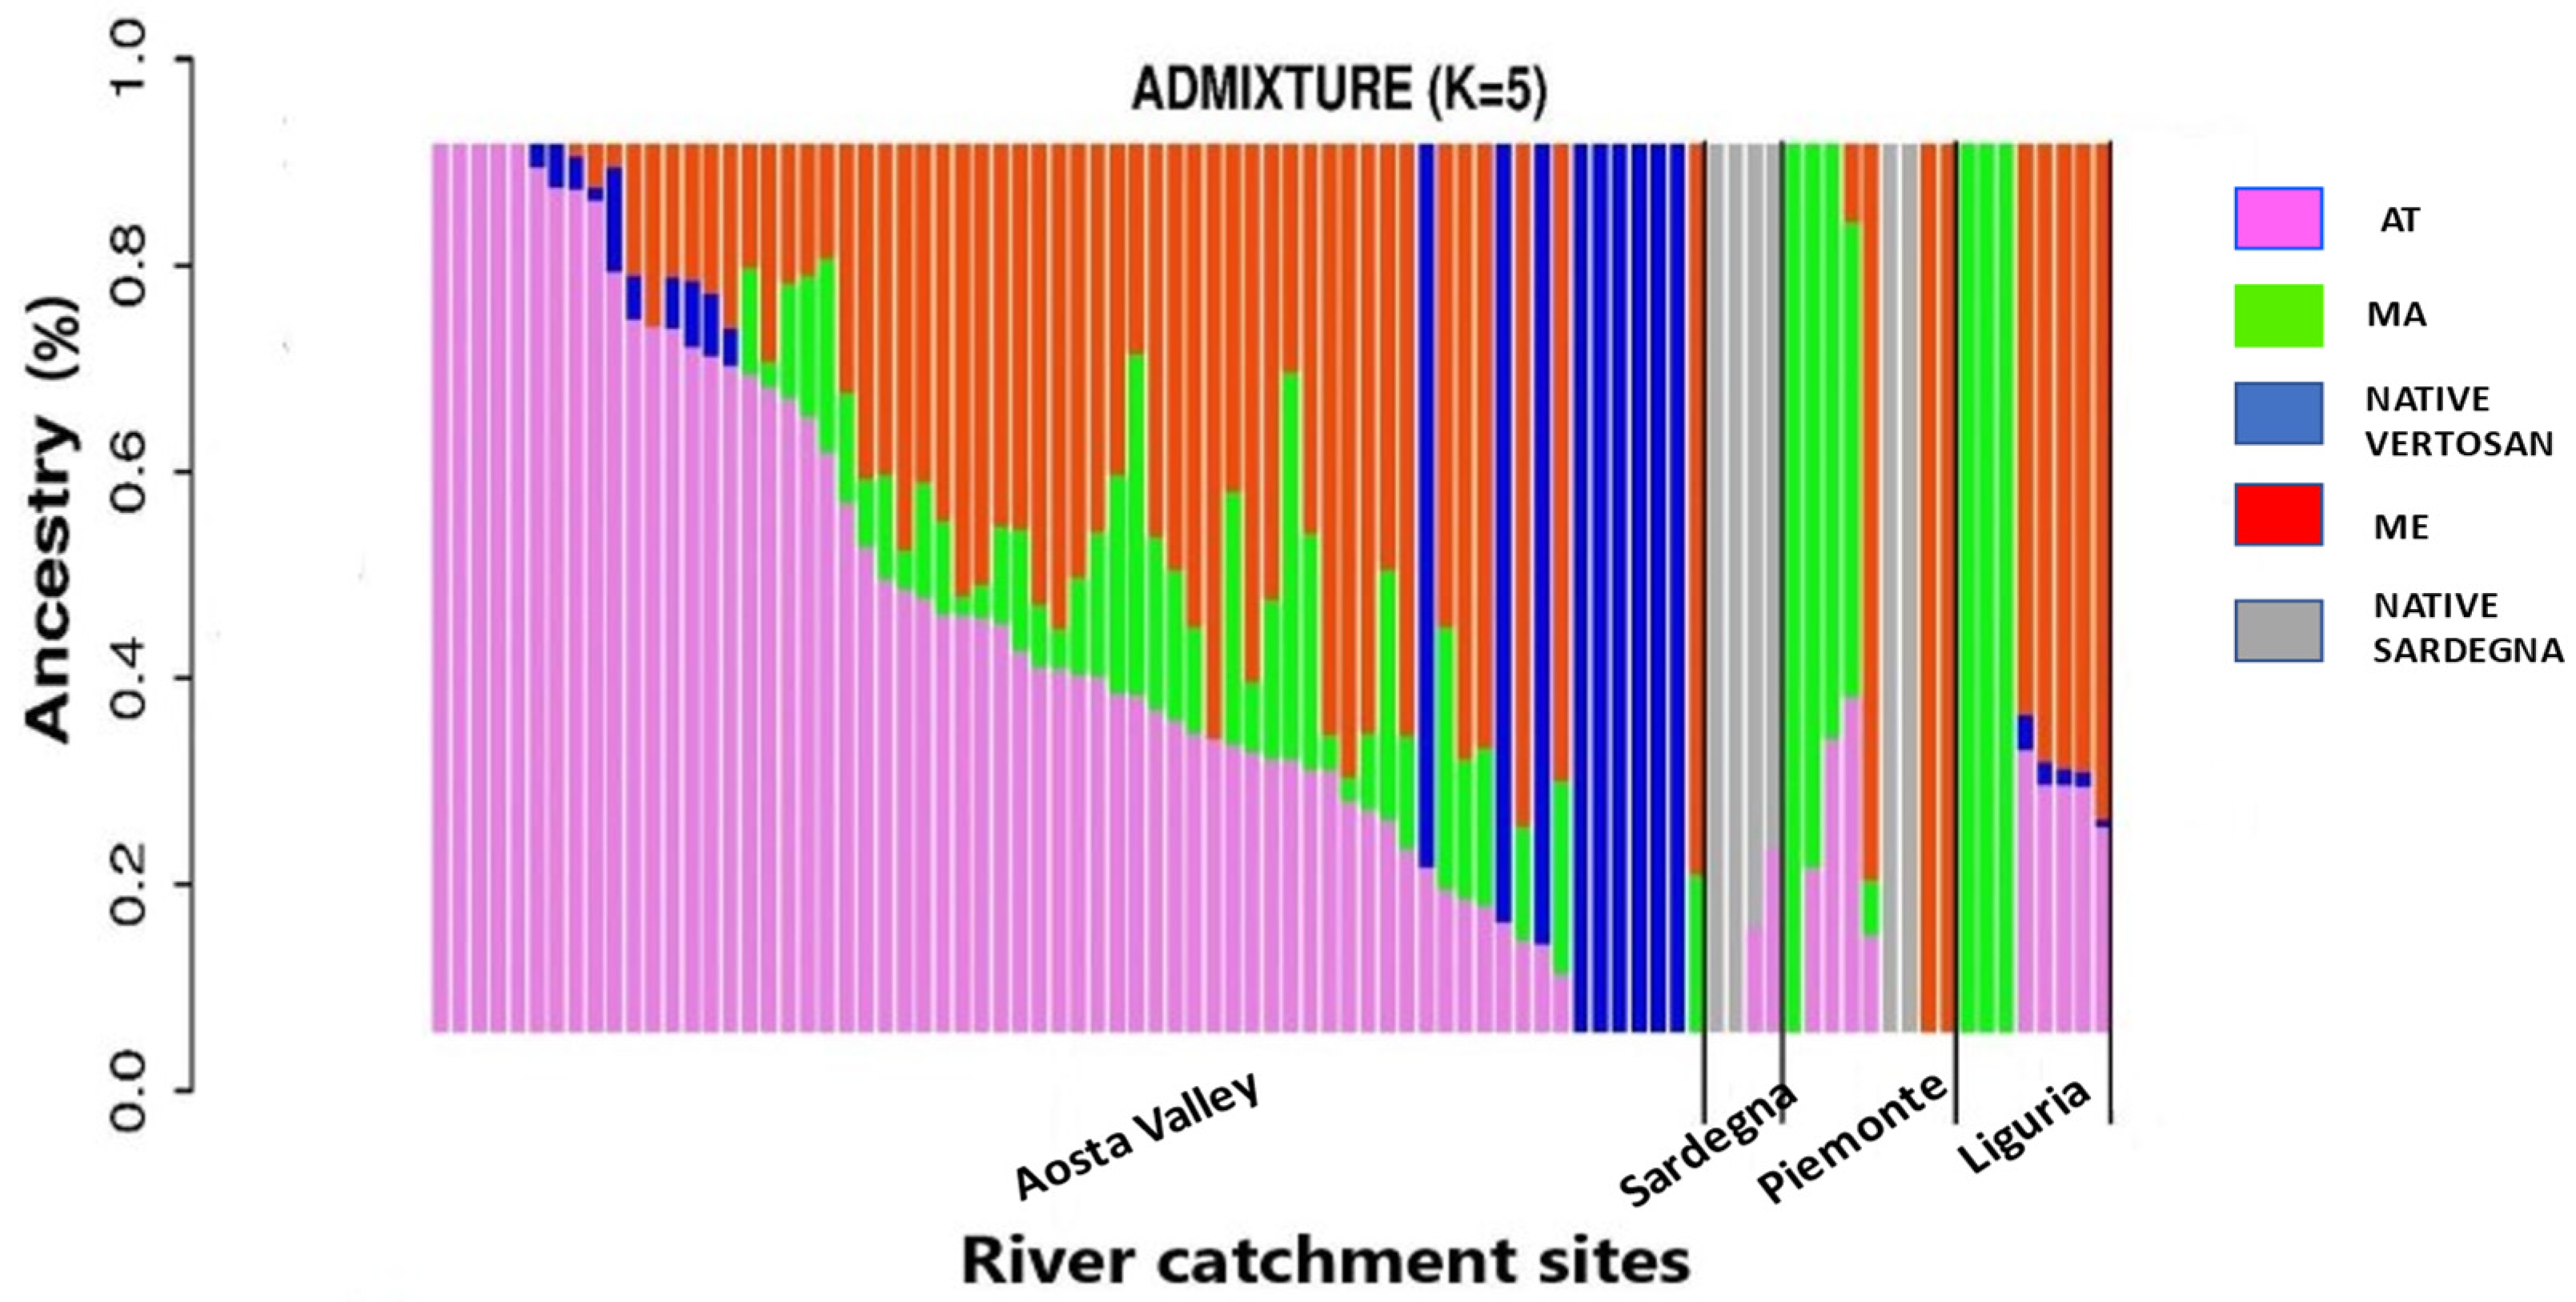
The number of clusters that best support the populations studied in the Aosta Valley and neighbouring regions was K = 5. The number of clusters (K) was chosen based on the Cross Validation Error (CVE), selecting the value of K matching the lowest CVE. Comparing samples from the Aosta Valley, fish from Vargno (site: 8), Stuba (site: 7), Graines (site: 5), Giassit (site: 4), Ayasse (site: 1) and Crest (site: 3) populations showed intermediate levels of hybridization with the AT lineage while the Vertosan (site: 9) population showed a distinct native cluster and a level of hybridization close to zero. The Vertosan (site: 9) river in the Aosta Valley was the only site with a zero introgression level (Q = 0.04) and the Morgex (site: 6) site showed the highest value (Q = 0.96). The results obtained by ddRAD-seq analysis confirmed those obtained on the individual mtDNA-CR and LDH-C1* genes. Genetic traces of the MA lineage were found in almost all samples from the Aosta Valley, with varying percentages. Specimens from Vargno (site: 8) and Stuba (site: 7) rivers showed more than 30% of MA lineage. Hybridization with the AT lineage was confirmed also in the Piemonte, Liguria, and Apennines areas [18]. The result of the hybridization of marble trout populations with the AT lineage indicates that stocking activity is probably taking place also in typically marble trout areas. The samples from the present study and those described by Magris et al. [18] were analyzed together to expand the analysis to the entire country. In Figure 5, results of the genetic analysis were grouped according to the different Italian regions.
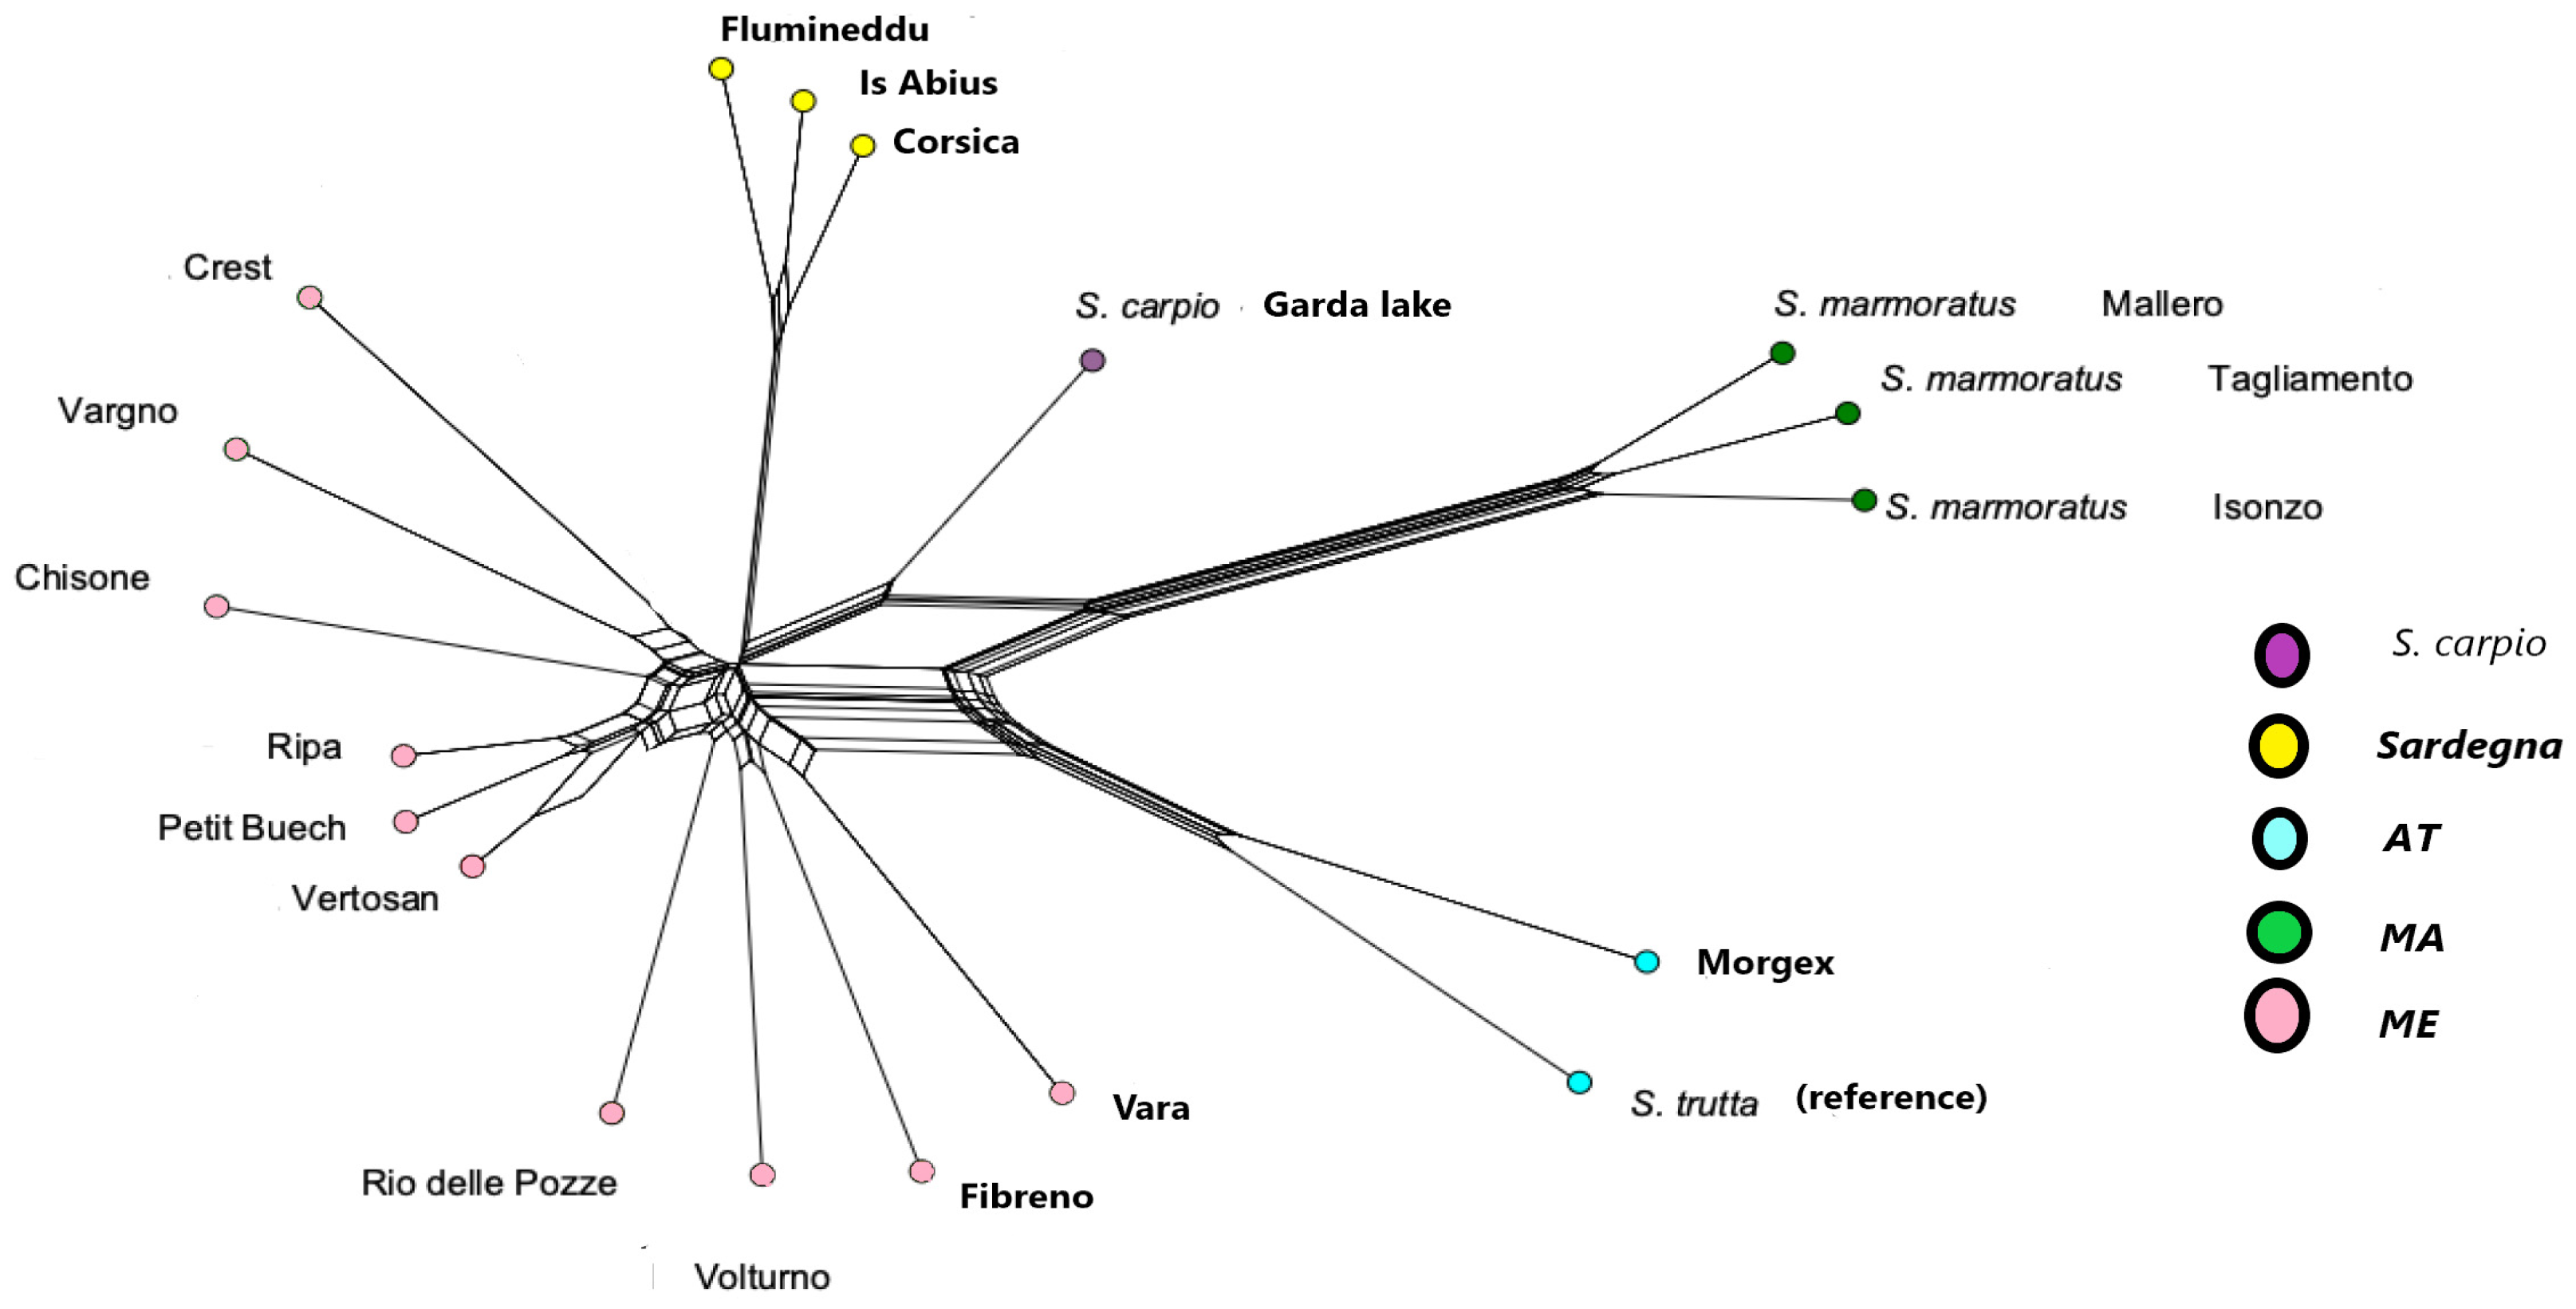
A phylogenetic tree elaborated from the broader dataset (ddRAD-seq data) that also includes the Apennines (Rio delle Pozze (site: 22) and Fibreno (site: 23)) areas, Sardegna (Flumineddu (site: 25), Is Albius (site: 26)), S. carpio, MA and AT lineage groups is shown in Figure 6. The phylogenetic tree with five clearly separated lineages (Atlantic lineage, S. marmoratus, S. carpio, Sardegna lineage, and Mediterranean lineage). Notably, the Atlantic lineage is highly distant from the Sardegna lineage, and the Mediterranean lineage is divided into two main groups: one on the left (Aosta Valley and neighboring regions) and one on the right, which includes the populations of mainland Italy that are closer to the Atlantic lineage.

4. Discussion

MtDNA-CR has been used for many years to identify the lineage of particular brown trout populations [23]. Early studies by Giuffra et al. [11] revealed that brown trouts in the Po River basin of Italy carry haplotypes of the ME and AT lineages. Giuffra et al. [11] identified distinct mtDNA haplotypes in brown trout from northern Italy corresponding to the AD and ME lineages. Mitochondrial haplotyping remains a cornerstone in detecting remnant native brown trout populations. Nuclear markers like the LDH-C1* locus may provide a simple indicator of genetic differentiation between Atlantic and Mediterranean brown trout. Recently, Splendiani et al. [2] combined mtDNA data with LDH-C1* genotypes to confirm that brown trout in the western south Alps carry the Mediterranean-specific allele. Similarly, in the 1990s, allozyme studies noted distinct allele patterns in Alpine brown trout, reflecting limited gene flow between native and introduced stocks [8]. New techniques such as ddRAD-seq allow researchers to obtain thousands of single-nucleotide polymorphism markers to be analyzed simultaneously. This high number of markers is a very effective and precise method for estimating the level of hybridization at the individual level [22]. Numerous studies have used this technique in conservation and management studies of different species, especially for non-model species [23]. In this way, it is possible to determine the level of hybridization between different ecotypes or lineages [24]. Splendiani et al. [2] carried out a comprehensive genetic survey in the western south Alps (spanning from the Italian and French sides). By examining LDH-C1* and mtDNA-CR markers, they confirmed that the ME lineage of brown trout in the Italian western south Alps are native, showing haplotypes distinct from the Atlantic stocks.
Results of the present study showed a considerable degree of introgression by the Atlantic lineage of domestic origin into almost all sampled populations, excluding fish in the Vertosan river (site: 9). A low hybridization index indicates that the Vertosan river population (site: 9) has maintained very high genetic integrity with minimal introgression by the AT lineage and shows unique local adaptations [1]. In terms of conservation, this population with a distinct native lineage represents a high priority for protection and could serve as a reservoir population for restocking the entire western north alpine zone. In summary, the maintenance of this population is fundamental to the long-term maintenance of the species. In this study, results confirm the findings of other research conducted over the past thirty years [15]. The stocking of the main rivers in the Alpine regions with populations of AT lineage resulted in the genetic erosion of the native populations. However, the genetic structure of brown trout populations in the Aosta Valley and neighbouring regions is consistent with what has been found in other western Alpine basins [2]. In light of the possible dispersal dynamics of brown trout and recent findings acquired by several research groups in recent years [1,2,3], it is, thus, believed that there are still some nuclei of native brown trout in the Aosta Valley and Sardegna that require active safeguard efforts and genetically informed future management practices.
In light of recent studies [2,15,24] which confirm the native character of brown trout in the Alpine area (from Liguria to Lake Garda), it is reasonable to infer that originally the Po Valley consisted of a dynamic and varied group of populations with different genetic and ecological characteristics, which, today have largely disappeared. Throughout the 1990s and 2000s, researchers tried to determine whether brown trout bearing Mediterranean haplotypes in regions like the Po basin and Alpine lakes were relics of post-glacial colonization or if they had been translocated from elsewhere (such as France or Italy’s Apennine streams). The south-western Alps (Cottian and Maritime Alps on the Italy–France border) emerged as a critical refugial zone for the Mediterranean trout. In this region, including rivers like the upper Dora Riparia, Chisone (site:10), Stura di Lanzo (site: 15), upper Po, and others, researchers have discovered viable native populations of Mediterranean brown trout persisting alongside the marble trout [6]. These brown trouts belong to the Italian Adriatic/Mediterranean lineages (historically termed Salmo ghigii by some authors) and show a distinctive elevational segregation from marble trout [25]. Genetic surveys found that ME and AD haplotypes occur predominantly in higher-elevation streams (1000–2000 m elevation) of the south-west Alps, whereas MA haplotypes dominate in the lower elevations (0–1000 m).
On a broad geographical scale, several hypotheses have been proposed for the taxonomic classification and evolution over time of populations of the Salmo trutta complex from the southern European range. In northern Italy, one hypothesis is that postglacial recolonization may have occurred from different refugia with different lineages. Based on this hypothesis, after the Last Glacial Maximum (LGM), brown trout populations recolonized suitable alpine streams in the western north Alpine region. In many European countries, at a local level, high genetic differentiation between populations has been observed. These differences are also due to the homing behaviour of brown trout and the possible presence of artificial barriers, both of which reduce gene flow. It should be noted that little is known about the relationships between resident and anadromous populations. Thus, in such a dynamic context, at the contact areas between the Alpine and the Apennine mountains, river catchments could have promoted the exchange of genetic material in both directions. Splendiani et al. [1] reconstructed the post-glacial colonization history: during the last glaciation and the following deglaciation, this region served as a one-way corridor for brown trout dispersal from east to west. During the LGM, much of the higher Alps was ice-covered and un-inhabitable for fish. Native trout survived in refugia at the periphery, for example, in rivers south of the Alps (in the Padania plain), in the Liguria coastal streams, and in some large lake basins that remained ice-free (like parts of Lake Maggiore and Lake Garda). This means that as glaciers receded, brown trout that had survived in refugia on the Adriatic/Padanian side (perhaps in the Po basin or northern Apennines) expanded westward through the alpine foothills into what is now the French Alpine region. This scenario directly refutes the older “French origin” hypothesis. For Polgar et al. [14], the main factors that would have limited the dispersion of the Mediterranean brown trout after the LGM would be the total coverage of the main valleys by glaciers and the distance from the glacial refuges. The MEcs1 mitochondrial haplotype was found in the Vertosan (site: 9) (Aosta Valley) and Chisone (site: 10) and Ripa (site: 14) (Piemonte) populations. A possible hypothesis is that the MEcs1 haplotype reached the Liguria basins from Piemonte. However, the hypothesis that the MEcs1 haplotype originated from a marine colonization of Liguria also appears equally valid and probable, given its distribution in Vara (site: 19), Serchio, and Corsica (site: 31) rivers [1,2]. The area of the western Alps is characterized by a considerable asymmetry, with the Po Valley slope being significantly steeper than the transalpine slope. It is not surprising, therefore, that the MEcsl haplotype may also have arrived in the Po basins through a river-capture process, not uncommon during the Quaternary period. Further, we cannot exclude the possibility that the ME haplotype may also have arrived from the Liguria basins, given the presence of the MEcs1 haplotype in the populations of the Baracca river, a tributary of the Orba (Liguria-Piemonte Apennines, Tanaro basin) and Sansobbia (Liguria-Piemonte Apennines, Liguria sea basin) rivers [2]. A museum specimen from the Lerca, a tributary of the Leirone river (Cogoleto, Genoa, Liguria sea basin) also shows a haplotype that can be ascribed to MEcs-1. According to Splendiani et al. [2], a corridor existed in remote times that would have transferred the Adriatic ADporh1 haplotype (typically associated with the Cuneo Po Valley populations) to the French catchment areas. It is presumable, therefore, that the western Alps acted as a bi-directional corridor for gene flow between Mediterranean lineages of the Po basin and those of the Rhone basins. According to Antognazza et al. [3], plans aimed at preserving local genetic lines are urgently needed to avoid the complete impoverishment of the original biodiversity of the Alpine area. It is, therefore, advisable that active management of fish stocks should be directed towards the preservation of native local forms. It is also important that the marble trout should be subject to maximum protection by means of appropriate fishing regulations and by increasing efforts to protect its critical habitats. Worthy of mention are, for example, the marble trout conservation projects, one of which is underway in the Dora Baltea basin in the Aosta Valley. Logically, careful management of fish stocks must also pass through an assessment of the habitat suitability of each river. New introductions, even of native species, should be accompanied by an assessment of the impacts on other native species. Furthermore, the implementation of ‘buffer zones’ limiting the possibility of hybridization between species, forced by human activities, is reasonable [14].

5. Conclusions

The combined use of the markers mtDNA-CR (allowing characterization of the AT, AD, ME, and MA lineages), LDH-C1* (allowing identification of the diagnostic *90 and *100 alleles) and ddRAD-seq analysis allowed us to obtain an efficient and reliable analysis of the genetic structure of brown trout populations in the Aosta Valley and nearby regions. The three genetic methods used in this study agree regarding the level of hybridization with the Atlantic lineage. In particular, the ddRAD-seq technique made it possible to obtain a very high density of SNP markers with an increase in the robustness and precision of estimates of various parameters traditionally used in conservation genetics (e.g., hybridization level).
The results of the present study highlight a composite genetic structure of the brown trout populations in the Aosta Valley, with the presence of different mitochondrial lineages (ME, AD, AT and MA lineages) and different hydridization levels within the different sampling sites. For the Vertosan river, a distinct new native population was identified with a hybridization level close to zero.
From a practical point of view, the following protocol could be used in future brown trout improvement plans:
(1)
Use of the diagnostic marker LCH-C1* for preliminary screening and in situations of limited budgets;
(2)
Use of the ddRAD-seq technique for more in-depth analysis.
The most important result of this work is the identification, for the first time in Italy, of two native populations (Aosta Valley and Sardegna), with a hybridization rate close to zero.

Author Contributions

Conceptualization, E.D., P.G. and S.E.; formal analysis, E.D., P.G. and S.E.; investigation, E.D., P.G. and S.E.; writing—original draft preparation, E.D., P.G. and S.E.; writing—review and editing, E.D., P.G. and S.E.; supervision, E.D., P.G. and S.E.; funding acquisition, E.D., P.G. and S.E. All authors have read and agreed to the published version of the manuscript.

Funding

This work was supported by the START-UP 2018 grant from the University of Udine (project GENSAL) to Michele Morgante.

Institutional Review Board Statement

The animal study protocol was approved by the Institutional Review Board of Animal Ethic Committee (Organismo Preposto al Benessere degli Animali) of the University of Udine (Approval Number: 20/2024.and date of approval: 11 March 2024). All procedures involving animals were carried out by trained staff in strict accordance with EU legal frameworks relating to the protection of animals used for scientific purposes (Directive 2010/63/EU).

Data Availability Statement

The original contributions presented in this study are included in the article. Further inquiries can be directed to the corresponding author.

Conflicts of Interest

The authors declare no conflicts of interest.

References

  1. Splendiani, A.; Fioravanti, T.; Giovannotti, M.; Olivieri, L.; Ruggeri, P.; Cerioni, P.N.; Vanni, S.; Enrichetti, F.; Barucchi, V.C. Museum samples could help to reconstruct the original distribution of Salmo trutta complex in Italy. J. Fish Biol. 2017, 90, 2443–2451. [Google Scholar] [CrossRef]
  2. Splendiani, A.; Berrebi, P.; Tougard, C.; Righi, T.; Reynaud, N.; Fioravanti, T.; Lo Conte, P.; Delmastro, G.B.; Baltieri, M.; Ciuffardi, L.; et al. The role of the south-western Alps as a unidirectional corridor for Mediterranean brown trout (Salmo trutta complex) lineages. Biol. J. Linn. Soc. 2020, 131, 909–926. [Google Scholar] [CrossRef]
  3. Antognazza, C.M.; Palandaćić, A.; Delmastro, G.B.; Crosa, G.; Zaccara, S. Current and historical genetic variability of native brown trout populations in a southern Alpine ecosystem: Implications for future management. Fishes 2023, 8, 411. [Google Scholar] [CrossRef]
  4. Bernatchez, L. The evolutionary history of brown trout (Salmo trutta L.) inferred from phylogeographic, nested clade, and mismatch analyses of mitochondrial DNA variation. Evolution 2001, 55, 351–379. [Google Scholar] [CrossRef] [PubMed]
  5. Berrebi, P. Three brown trout Salmo trutta lineages in Corsica described through allozyme variation. J. Fish Biol. 2015, 86, 60–73. [Google Scholar] [PubMed]
  6. Berrebi, P.; Barucchi, V.C.; Splendiani, A.; Muracciole, S.; Sabatini, A.; Palmas, F.; Tougard, C.; Arculeo, M.; Maric, S. Brown trout (Salmo trutta L.) high genetic diversity around the Tyrrhenian Sea as revealed by nuclear and mitochondrial markers. Hydrobiologia 2019, 826, 209–231. [Google Scholar] [CrossRef]
  7. Berrebi, P.; Horvath, Á.; Splendiani, A.; Palm, S.; Berna’s, R. Genetic diversity of domestic brown trout stocks in Europe. Aquaculture 2021, 544, 737043. [Google Scholar] [CrossRef]
  8. Giuffra, E.; Bernatchez, L.; Guyomard, R. Mitochondrial control region and protein coding genes sequence variation among phenotypic forms of brown trout (Salmo trutta) from northern Italy. Mol. Ecol. 1994, 3, 161–171. [Google Scholar] [CrossRef]
  9. Gratton, P.; Allegrucci, G.; Sbordoni, V.; Gandolfi, A. The evolutionary jigsaw puzzle of the surviving trout (Salmo trutta L. complex) diversity in the Italian region. A multilocus Bayesian approach. Mol. Phylogenetics Evol. 2014, 79, 292–304. [Google Scholar] [CrossRef] [PubMed]
  10. Snoj, A.; Marić, S.; Bajec, S.S.; Berrebi, P.; Janjani, S.; Schöffmann, J. Phylogeographic structure and demographic patterns of brown trout in North-West Africa. Mol. Phylogenetics Evol. 2011, 61, 203–211. [Google Scholar] [CrossRef]
  11. Tougard, C.; Justy, F.; Guinand, B.; Douzery, E.J.P.; Berrebi, P. Salmo macrostigma (Teleostei, Salmonidae): Nothing more than a brown trout (S. trutta) lineage? J. Fish Biol. 2018, 93, 302–310. [Google Scholar] [CrossRef] [PubMed]
  12. Fumagalli, L.; Snoj, A.; Jesensek, D.; Balloux, F.; Jug, T.; Duron, O.; Brossier, F.; Crivelli, A.J.; Berrebi, P. Extreme genetic differentiation among the remnant populations of marble trout (Salmo marmoratus) in Slovenia. Mol. Ecol. 2002, 12, 2711–2716. [Google Scholar] [CrossRef] [PubMed]
  13. Meraner, A.; Gandolfi, A. Genetics of the genus Salmo in Italy: Evolutionary history, population structure, molecular ecology and conservationof brown trout. In Brown Trout: Biology, Ecology and Management; Lobón-Cerviá, J., Sanz, N., Eds.; John Wiley & Sons Ltd.: Hoboken, NJ, USA, 2018; pp. 65–102. [Google Scholar]
  14. Polgar, G.; Iaia, M.; Righi, T.; Volta, P. The Italian Alpine and Subalpine trout: Taxonomy, evolution, and conservation. Biology 2022, 11, 576. [Google Scholar] [CrossRef]
  15. D’Agaro, E.; Gibertoni, P.; Marroni, F.; Messina, M.; Tibaldi, E.; Esposito, S. Genetic and phenotypic characteristics of the Salmo trutta complex in Italy. Appl. Sci. 2022, 12, 3219. [Google Scholar] [CrossRef]
  16. Lecaudey, L.A.; Schliewen, U.K.; Osinov, A.G.; Taylor, E.B.; Bernatchez, L.; Weiss, S.J. Inferring phylogenetic structure, hybridization and divergence times within Salmonindae (Teleostei: Salmonidae) using RAD-sequencing. Mol. Phylogenet. Evol. 2018, 124, 82–99. [Google Scholar] [CrossRef] [PubMed]
  17. Lemopoulos, A.; Prokkola, J.M.; Uusi-Heikkilä, S.; Vasemägi, A.; Huusko, A.; Hyvärinen, P.; Koljonen, M.; Koskiniemi, J.; Vainikka, A. Comparing RADseq and microsatellites for estimating genetic diversity and relatedness. Implications for brown trout conservation. Ecol. Evol. 2019, 9, 2106–2120. [Google Scholar] [CrossRef] [PubMed]
  18. Magris, G.; Marroni, F.; D’Agaro, E.; Vischi, M.; Chiabà, C.; Scaglione, D.; Kijas, J.; Messina, M.; Tibaldi, E.; Morgante, M. ddRAD-seq reveals the genetic structure and detects signals of selection in Italian brown trout. Genet. Sel. Evol. 2022, 54, 8. [Google Scholar] [CrossRef]
  19. Rozas, J.; Ferrer-Mata, A.; Sánchez-DelBarrio, J.C.; Guirao-Rico, S.; Librado, P.; Ramos-Onsins, S.E.; Sánchez-Gracia, A. DnaSP 6: DNA sequence polymorphism analysis of large datasets. Mol. Biol. Evol. 2017, 34, 3299–3302. [Google Scholar] [CrossRef]
  20. Bryant, D.; Huson, H. NeighborNet: Improved algorithms and implementation. Front. Bioinform. 2023, 3, 1178600. [Google Scholar] [CrossRef]
  21. McMeel, O.M.; Hoey, E.M.; Ferguson, A. Partial nucleotide sequences, and routine typing by polymerase chain reaction-restriction fragment length polymorphism, of the brown trout (Salmo trutta) lactate dehydrogenase, LDH-C1*90 and *100 alleles. Mol. Ecol. 2001, 10, 29–34. [Google Scholar] [CrossRef]
  22. Rochette, N.C.; Rivera-Colon, A.G.; Catchen, J.M. Stacks 2: Analytical methods for paired-end sequencing improve RADseq-based population genomics. Mol. Ecol. 2019, 28, 4737–4754. [Google Scholar] [CrossRef] [PubMed]
  23. Secci-Petretto, G.; Englmaier, G.K.; Weiss, S.J.; Antonov, A.; Persat, H.; Denys, G.P.J.; Schenekar, T.; Romanov, V.I.; Taylor, E.B.; Froufe, E. Evaluating a species phylogeny using ddRAD SNPs: Cyto-nuclear discordance and introgression in the salmonid genus Thymallus (Salmonidae). Mol. Phylogenet. Evol. 2023, 178, 107654. [Google Scholar] [CrossRef]
  24. Segherloo, I.H.; Freyhof, J.; Berrebi, P.; Ferchaud, A.L.; Geiger, M.; Laroche, J.; Bernatchez, L. A genomic perspective on an old question: Salmo trout or Salmo trutta (Teleostei: Salmonidae)? Mol. Phylogenet. Evol. 2021, 162, 107204. [Google Scholar] [CrossRef] [PubMed]
  25. Schuler, J.; Bezault, E.; Seehausen, O. Parallel divergent adaptation along replicated altitudinal gradients in Alpine trout. BMC Evol. Biol. 2012, 12, 210. [Google Scholar] [CrossRef] [PubMed]
Figure 1. Map of Italy, where brown trout populations were sampled. 12—Loana; 16—Toce; 17—Ovesca; 18—Chiusola; 19—Vara; 20—Mallero; 21—Samolaco; 22—Rio delle pozze; 23—Fibreno; 24—Santa susanna; 25—Flumineddu; 26—Is Albius; 27—Temo, 28—Isonzo; 29—Petit Buëch (France); 30—Poschiavo (Switzerland); 31—Corsica (F); 32—Volturno.
Fishes 10 00578 g001
Figure 2. Map of the Piemonte region where brown trout were sampled. 10—Chisone; 11—Gesso; 13—Ovarda; 14—Ripa; 15—Stura di Lanzo.
Fishes 10 00578 g002
Figure 3. Map of the Aosta Valley where brown trout were sampled. 1—Ayasse; 2—Chasten; 3—Crest; 4—Giassit; 5—Graines; 6—Morgex; 7—Stuba; 8—Vargno; 9—Vertosan.
Fishes 10 00578 g003
Figure 4. Neighbour Net graph of a representative selection of the brown trout complex populations living across the Alpine area. Mitochondrial haplotype (mtDNA-CR) membership (ME, AD, MA lineages) and relative frequency in each population are shown (pie charts).
Fishes 10 00578 g004
Figure 5. Q values (% of ancestry) specimen trout from different regions of Italy obtained with the Admixture software (ddRAD-seq data) using the smallest cross validation error. Each vertical line represents an individual. The coloured bars (height) indicate the probability of that individual being assigned to a particular ancestry lineage for each of K = 5 groups: AT domestic lineage (lilac), ME + AD domestic lineage (red), marmoratus domestic lineage (green) and native wild (blue, Vertonan), native wild (grey, Sardegna).
Fishes 10 00578 g005
Figure 6. Phylogeny of the brown trout complex populations (purple: S. carpio, yellow: Sardegna, light blue: AT, green: MA and pink: ME lineages) living across the Alpine, Apennine and Sardegna areas.
Fishes 10 00578 g006
Table 1. List of sampling sites of brown trout and geographic features.
RegionRiver CatchmentGenetic AnalysisStudyLon °
(N)
Lat °
(E)
Aosta Valley(1) AyasseddRAD; mtDNA-CR; LDH-C1*present45°62′04.11″7°64′02.98″
Aosta Valley(2) ChastenddRAD; mtDNA-CR; LDH-C1*present45°71′04.84″7°76′09.63″
Aosta Valley(3) CrestddRAD; mtDNA-CR; LDH-C1*present45°83’03.17″7°74’01.63″
Aosta Valley(4) GiassitddRAD; mtDNA-CR; LDH-C1*present45°16’92.69″7°72’07.17″
Aosta Valley(5) GrainesddRAD; mtDNA-CR; LDH-C1*present45°74’04.99″7°72’09.10″
Aosta Valley(6) MorgexddRAD; mtDNA-CR; LDH-C1*present45°75’04.35″7°75’03.39”
Aosta Valley(7) StubaddRAD; mtDNA-CR; LDH-C1*present45°47’70.10″7°34’03.39″
Aosta Valley(8) VargnoddRAD; mtDNA-CR; LDH-C1*present45°64′07.41″7°91′01.48″
Aosta Valley(9) VertosanddRAD; mtDNA-CR; LDH-C1*present45°74′05.23″7°52′02.07″
Piemonte(10) ChisoneddRAD; mtDNA-CR; LDH-C1*present44°49′01.81″7°20′08.13″
Piemonte(11) GessoddRADpresent44°36′09.06″7°52′07.55″
Piemonte(12) LoanaddRADpresent44°11′07.35″8°22′01.82″
Piemonte(13) OvardaddRADpresent44°63′07.15″8°64′03.43″
Piemonte(14) RipaddRAD; mtDNA-CR; LDH-C1*present44°94′06.40″6°84′02.47″
Piemonte(15) Stura di LanzoddRADpresent44°58′06.23″7°78′09.60″
Piemonte(16) ToceddRAD; mtDNA-CR; LDH-C1*[18]46°11′03.66″8°35′09.92″
Piemonte(17) OvescaddRADpresent46°10′00.30″8°00′06.21″
Liguria(18) ChiusoladdRADpresent44°33′07.09″9°70′01.78″
Liguria(19) VaraddRADpresent44°25′02.27″9°72′07.61″
Lombardia(20) MalleroddRAD; mtDNA-CR; LDH-C1*present46°16′01.64″9°84′08.77″
Lombardia(21) SamolacoddRADpresent46°25′07.10″9°38′0.11″
Emilia Romagna(22) Rio delle pozzeddRADpresent46°26′03.89″8°67′09.20″
Lazio(23) FibrenoddRAD[18]41°70′03.91″13°62′08.54″
Lazio(24) Santa SusannaddRAD[18]42°50′06.20″12°87′08.17″
Sardegna(25) FluminedduddRAD[18]39°54′06.19″9°38′04.50″
Sardegna(26) Is AlbiusddRAD[18]39°21′08.69″8°82′03.94″
Sardegna(27) TemoddRAD[18]40°39′05.33″8°53′07.01″
Friuli Venezia Giulia(28) Isonzo-TagliamentoddRAD[18]46°24′42.56″13°32′6.79″
France(29) Petit BuëchddRAD; mtDNA-CR; LDH-C1*present44°56′03.51″5°91′02.61″
Switzerland(30) PoschiavoddRADpresent46°32′04.47″10°06′08.10″
Corsica (F)(31) AscoddRAD[18]42°45′04.25″9°03′09.04″
Molise(32) VolturnoddRAD[18]41°34′00.28″14°30.0317″
Samples from the neighbouring regions Emilia Romagna (Rio delle Pozze (site: 22)), France (Petit Buëch, (site: 29)) and Switzerland (Poschiavo (site: 30)) were included, as well as samples from a previous study [18]: Garda Lake (Salmo carpio), Appenines area (sites: 18, 19, 21), Sardegna (sites: 25, 26, 27), Molise (site: 32), Corsica (F) (site: 31) and the reference AT, ME and MA lineages (site: 28).
Table 2. Results of Mt DNA-CR, LDH-C1* and ddRAD-seq analysis in the Aosta Valley.
River CatchmentMt DNA-CR
Haplotypes 1
LDH-C1*
Genotypes 2
ddRAD-seq
(Q)
Admixture Proportion
from the AT Ancestry
MorgexAT (100%)*90/*90 (100%)-0.96
AyasseAD (40%)/AT (30%)/MA (30%)*90/*100(71%)*90/*90 (29%)0.36
ChastenAT (100%)*90/*90(100%)-0.91
CrestAD (60%)/AT (20%)/MA (20%)*90/*100(79%)*90/*90 (21%)0.25
GiassitAT (60%)/AD (40%)*90/*100(45%)*90/*90 (55%)0.61
GrainesME (50%)/AT (40%)/MA (10)*90/*100(49%)*90/*90 (51%)0.40
StubaAT (50%)/AD (30%)/MA (10%)*90/*100(53%)*90/*90 (47%)0.53
VargnoME (50%)/AT (40%)/MA (10%)*90/*100(60%)*90/*90 (40%)0.46
VertosanME (100%)*100/*100(100%) -0.04
1 frequency of the haplotypes: AT = Atlantic; AD = Adriatic; ME = Mediterranean; MA = Marmoratus; 2 frequency of the genotypes: *90/*90 = AT; *100/*100 = ME; *90/*100 = hybrid.
Disclaimer/Publisher’s Note: The statements, opinions and data contained in all publications are solely those of the individual author(s) and contributor(s) and not of MDPI and/or the editor(s). MDPI and/or the editor(s) disclaim responsibility for any injury to people or property resulting from any ideas, methods, instructions or products referred to in the content.