
Contrast-Enhanced CT Texture Analysis in Colon Cancer: Correlation with Genetic Markers

 ,
,  , ,
, , 
 ,
, 
Abstract
1. Introduction
2. Materials and Methods
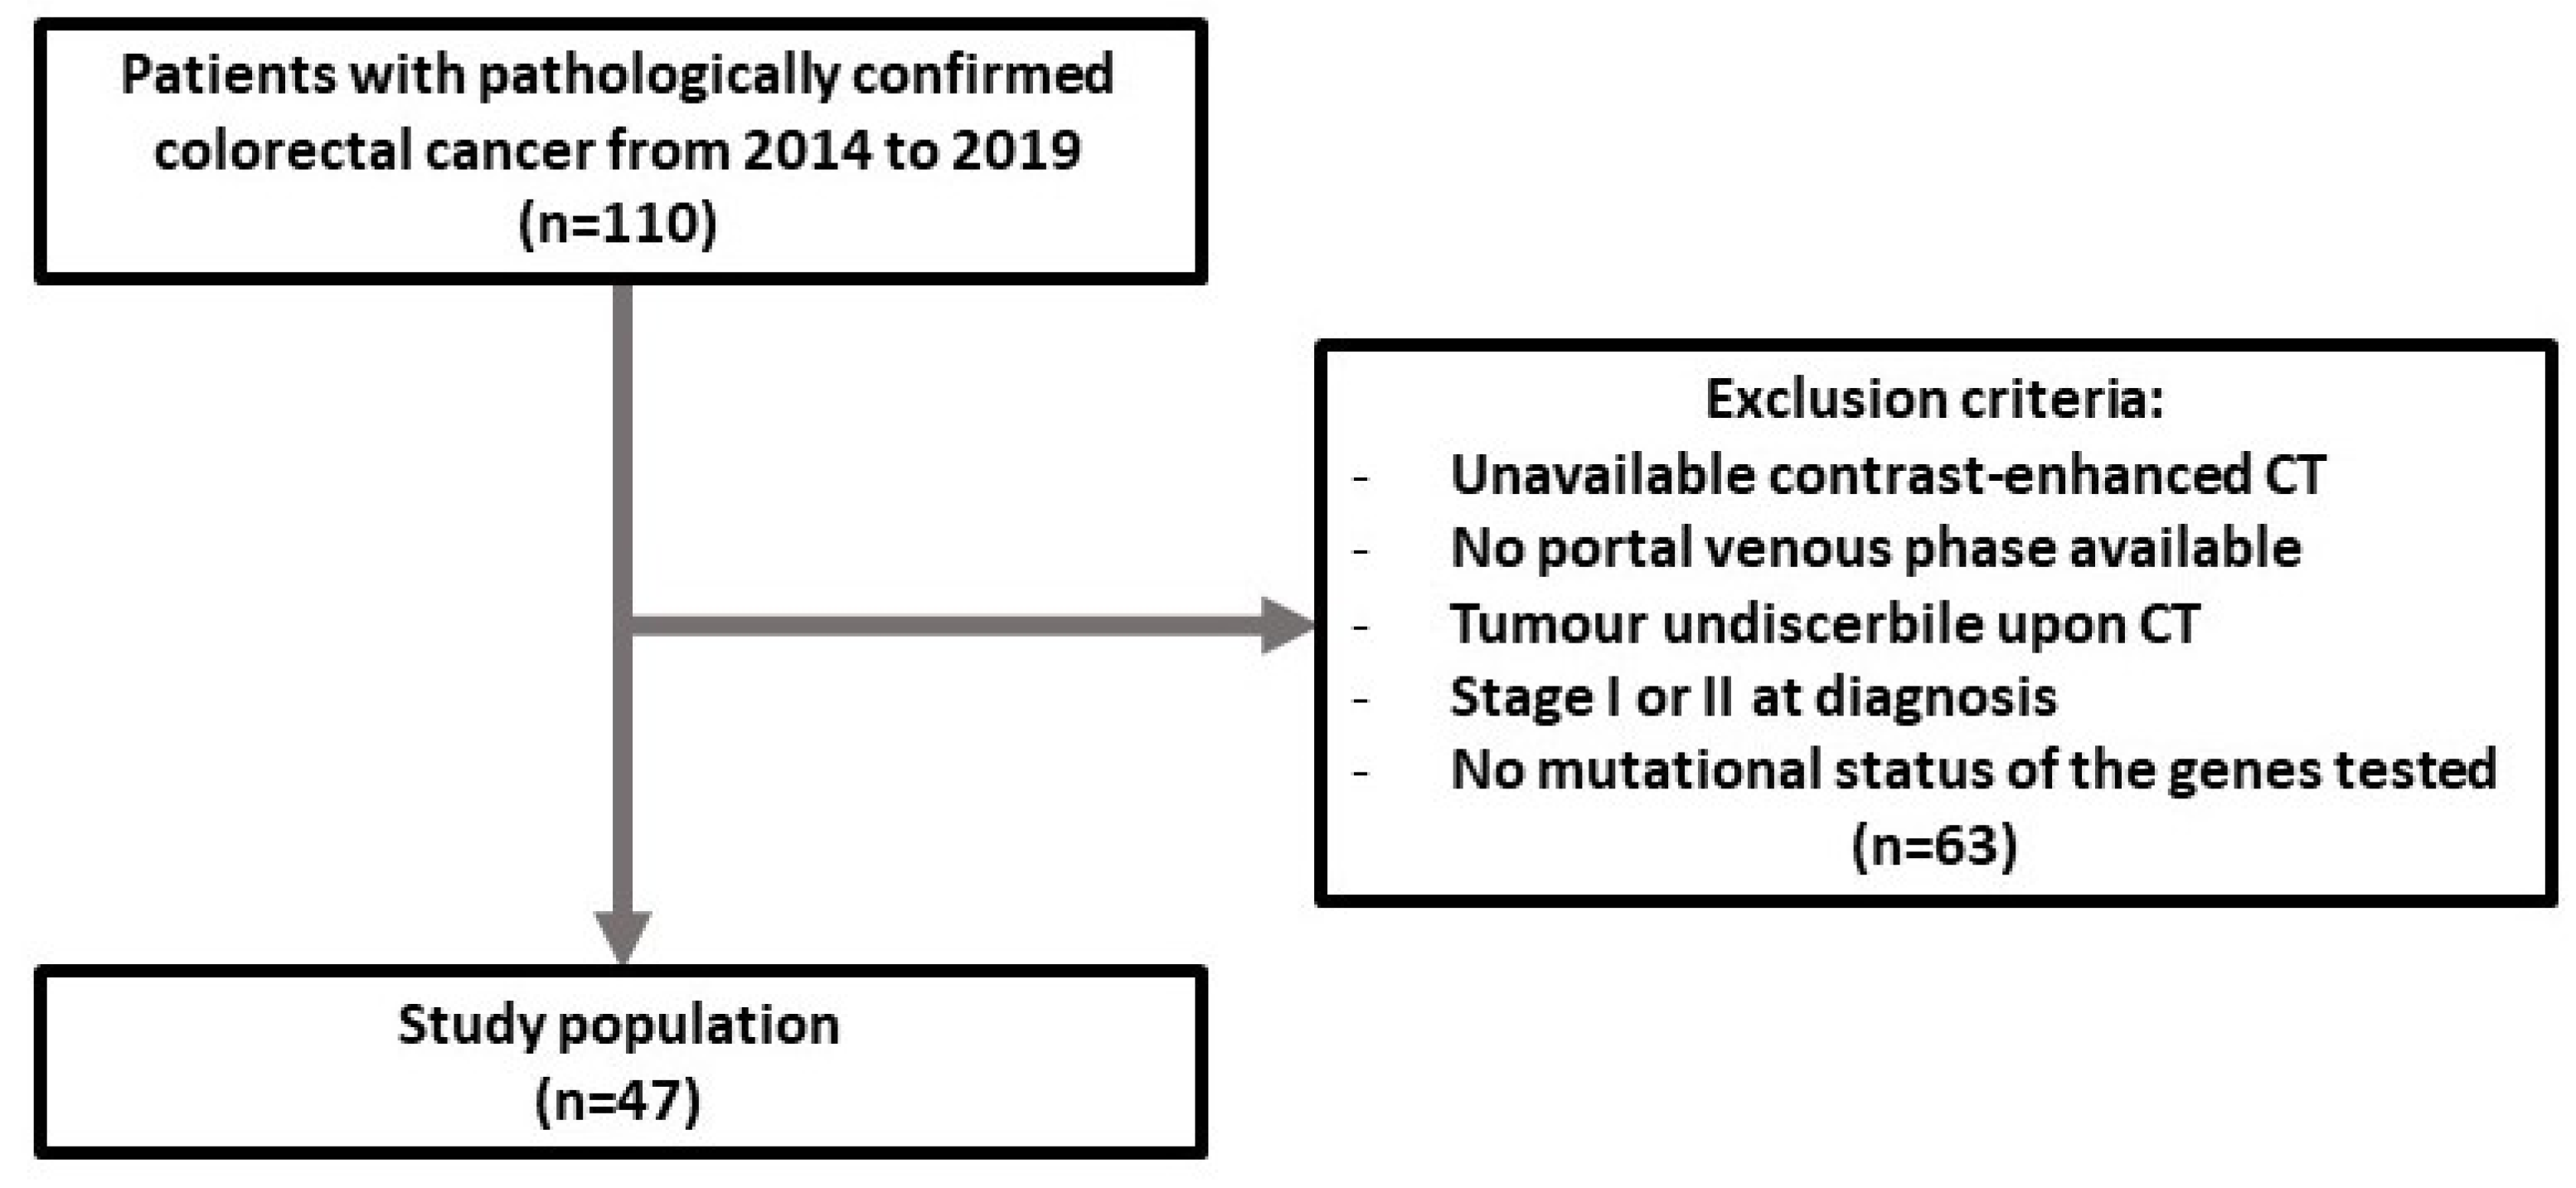
2.1. Patient Selection
2.2. CT Image Acquisition
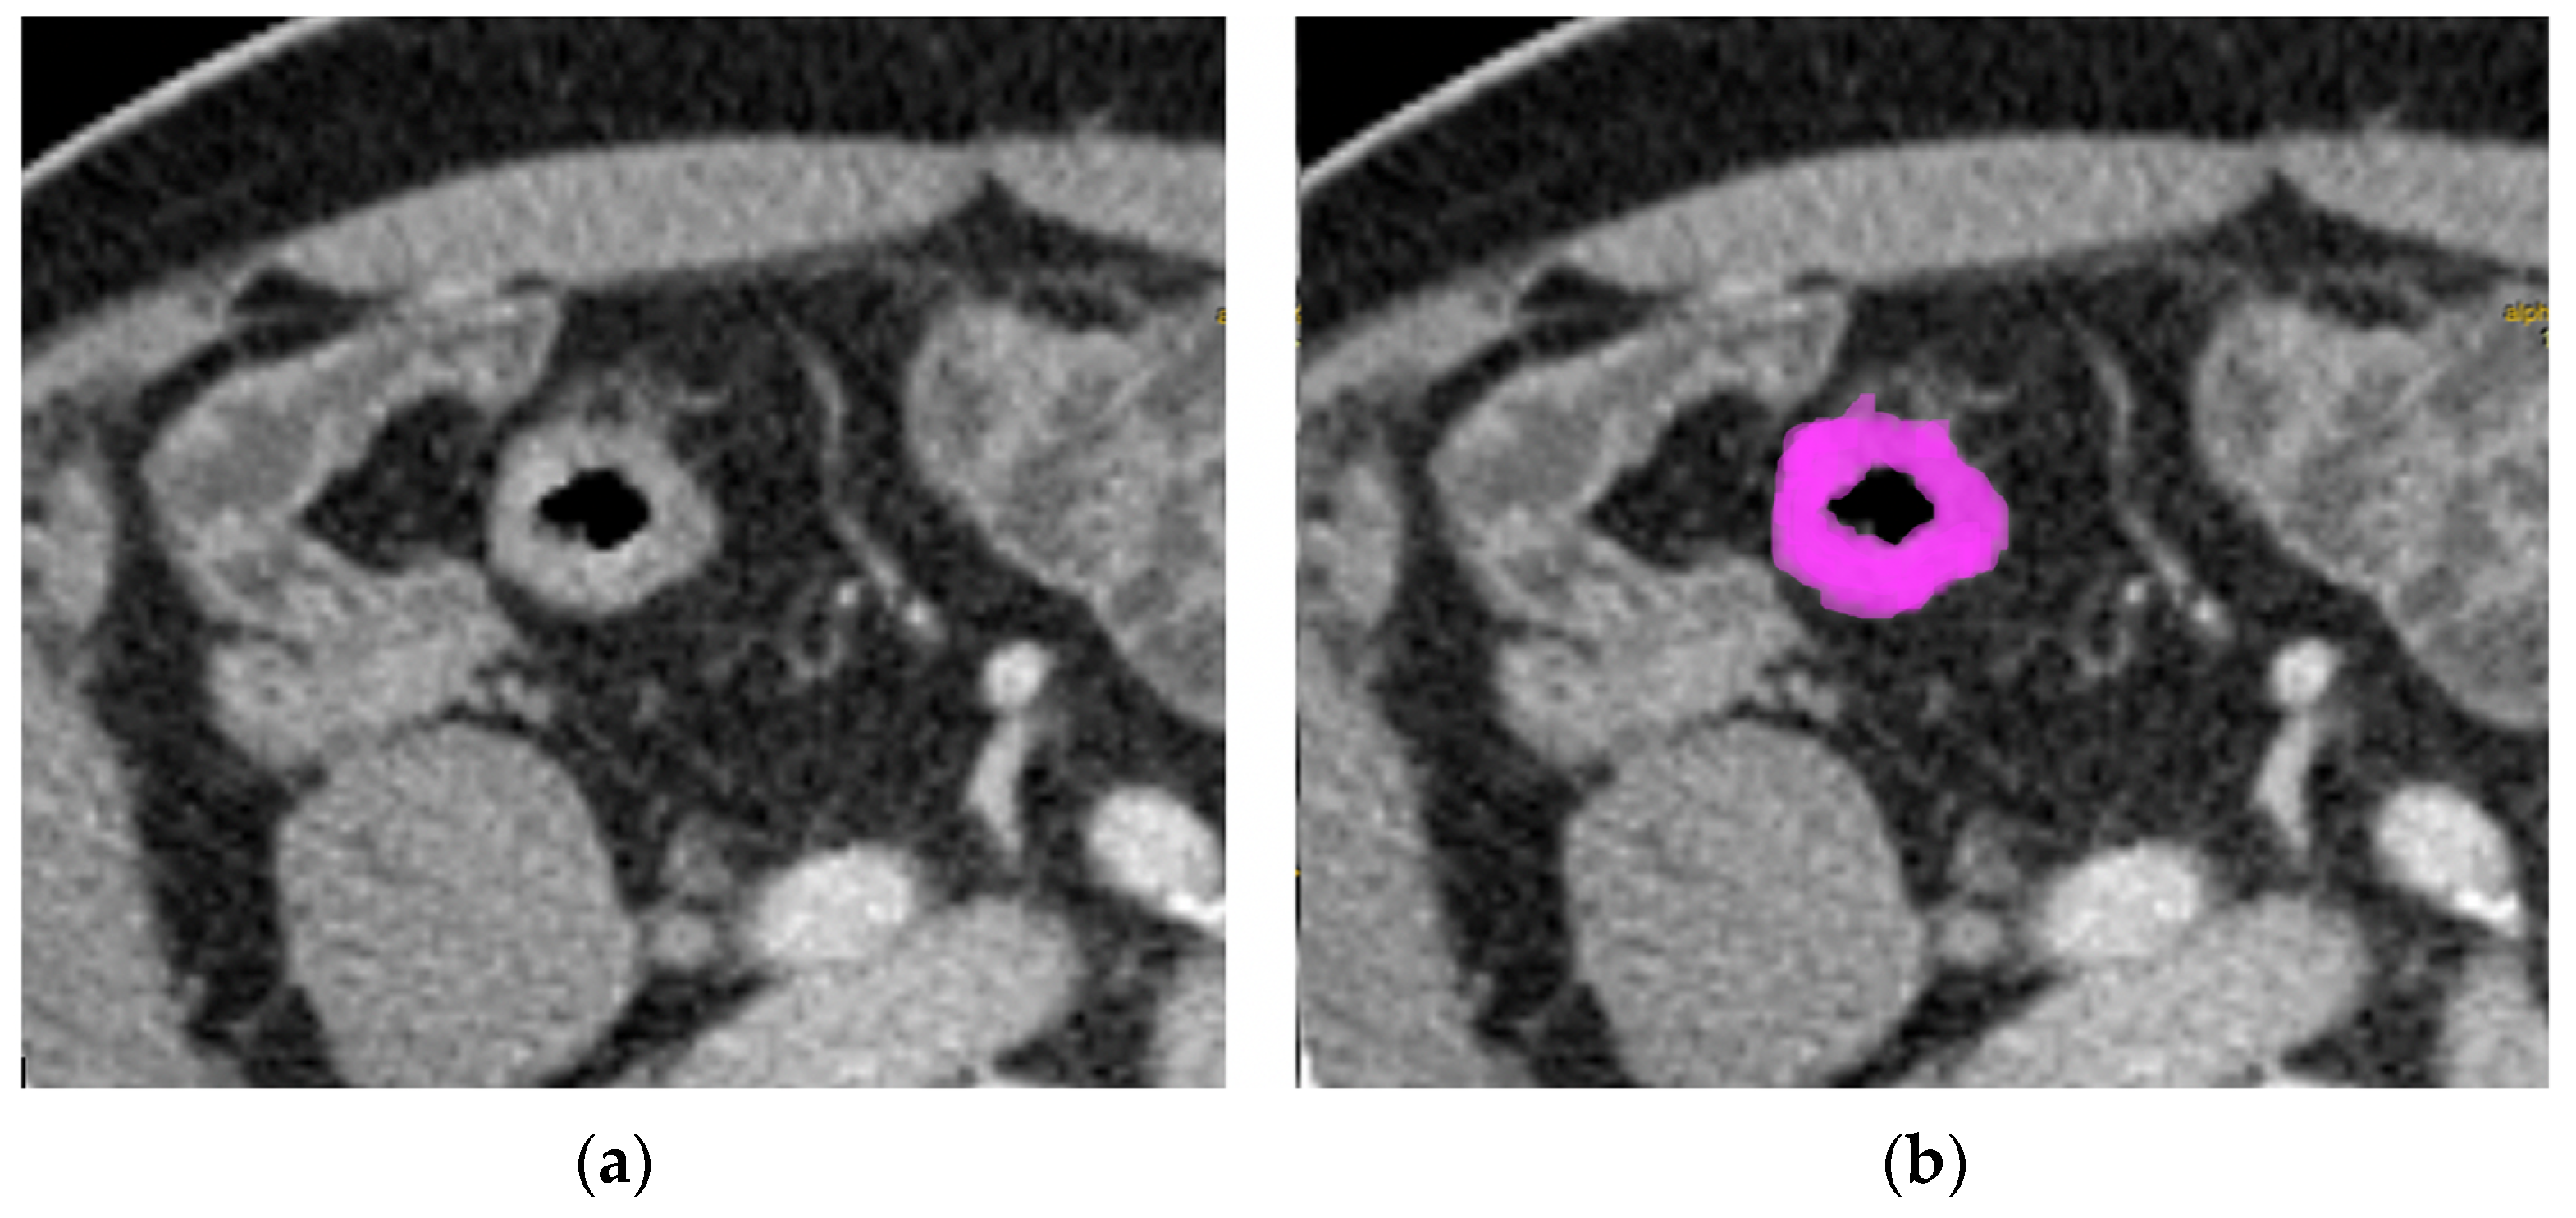
2.3. Texture Analysis
2.4. Statistical Analysis
3. Results
3.1. Patient Characteristics
3.2. Texture Values
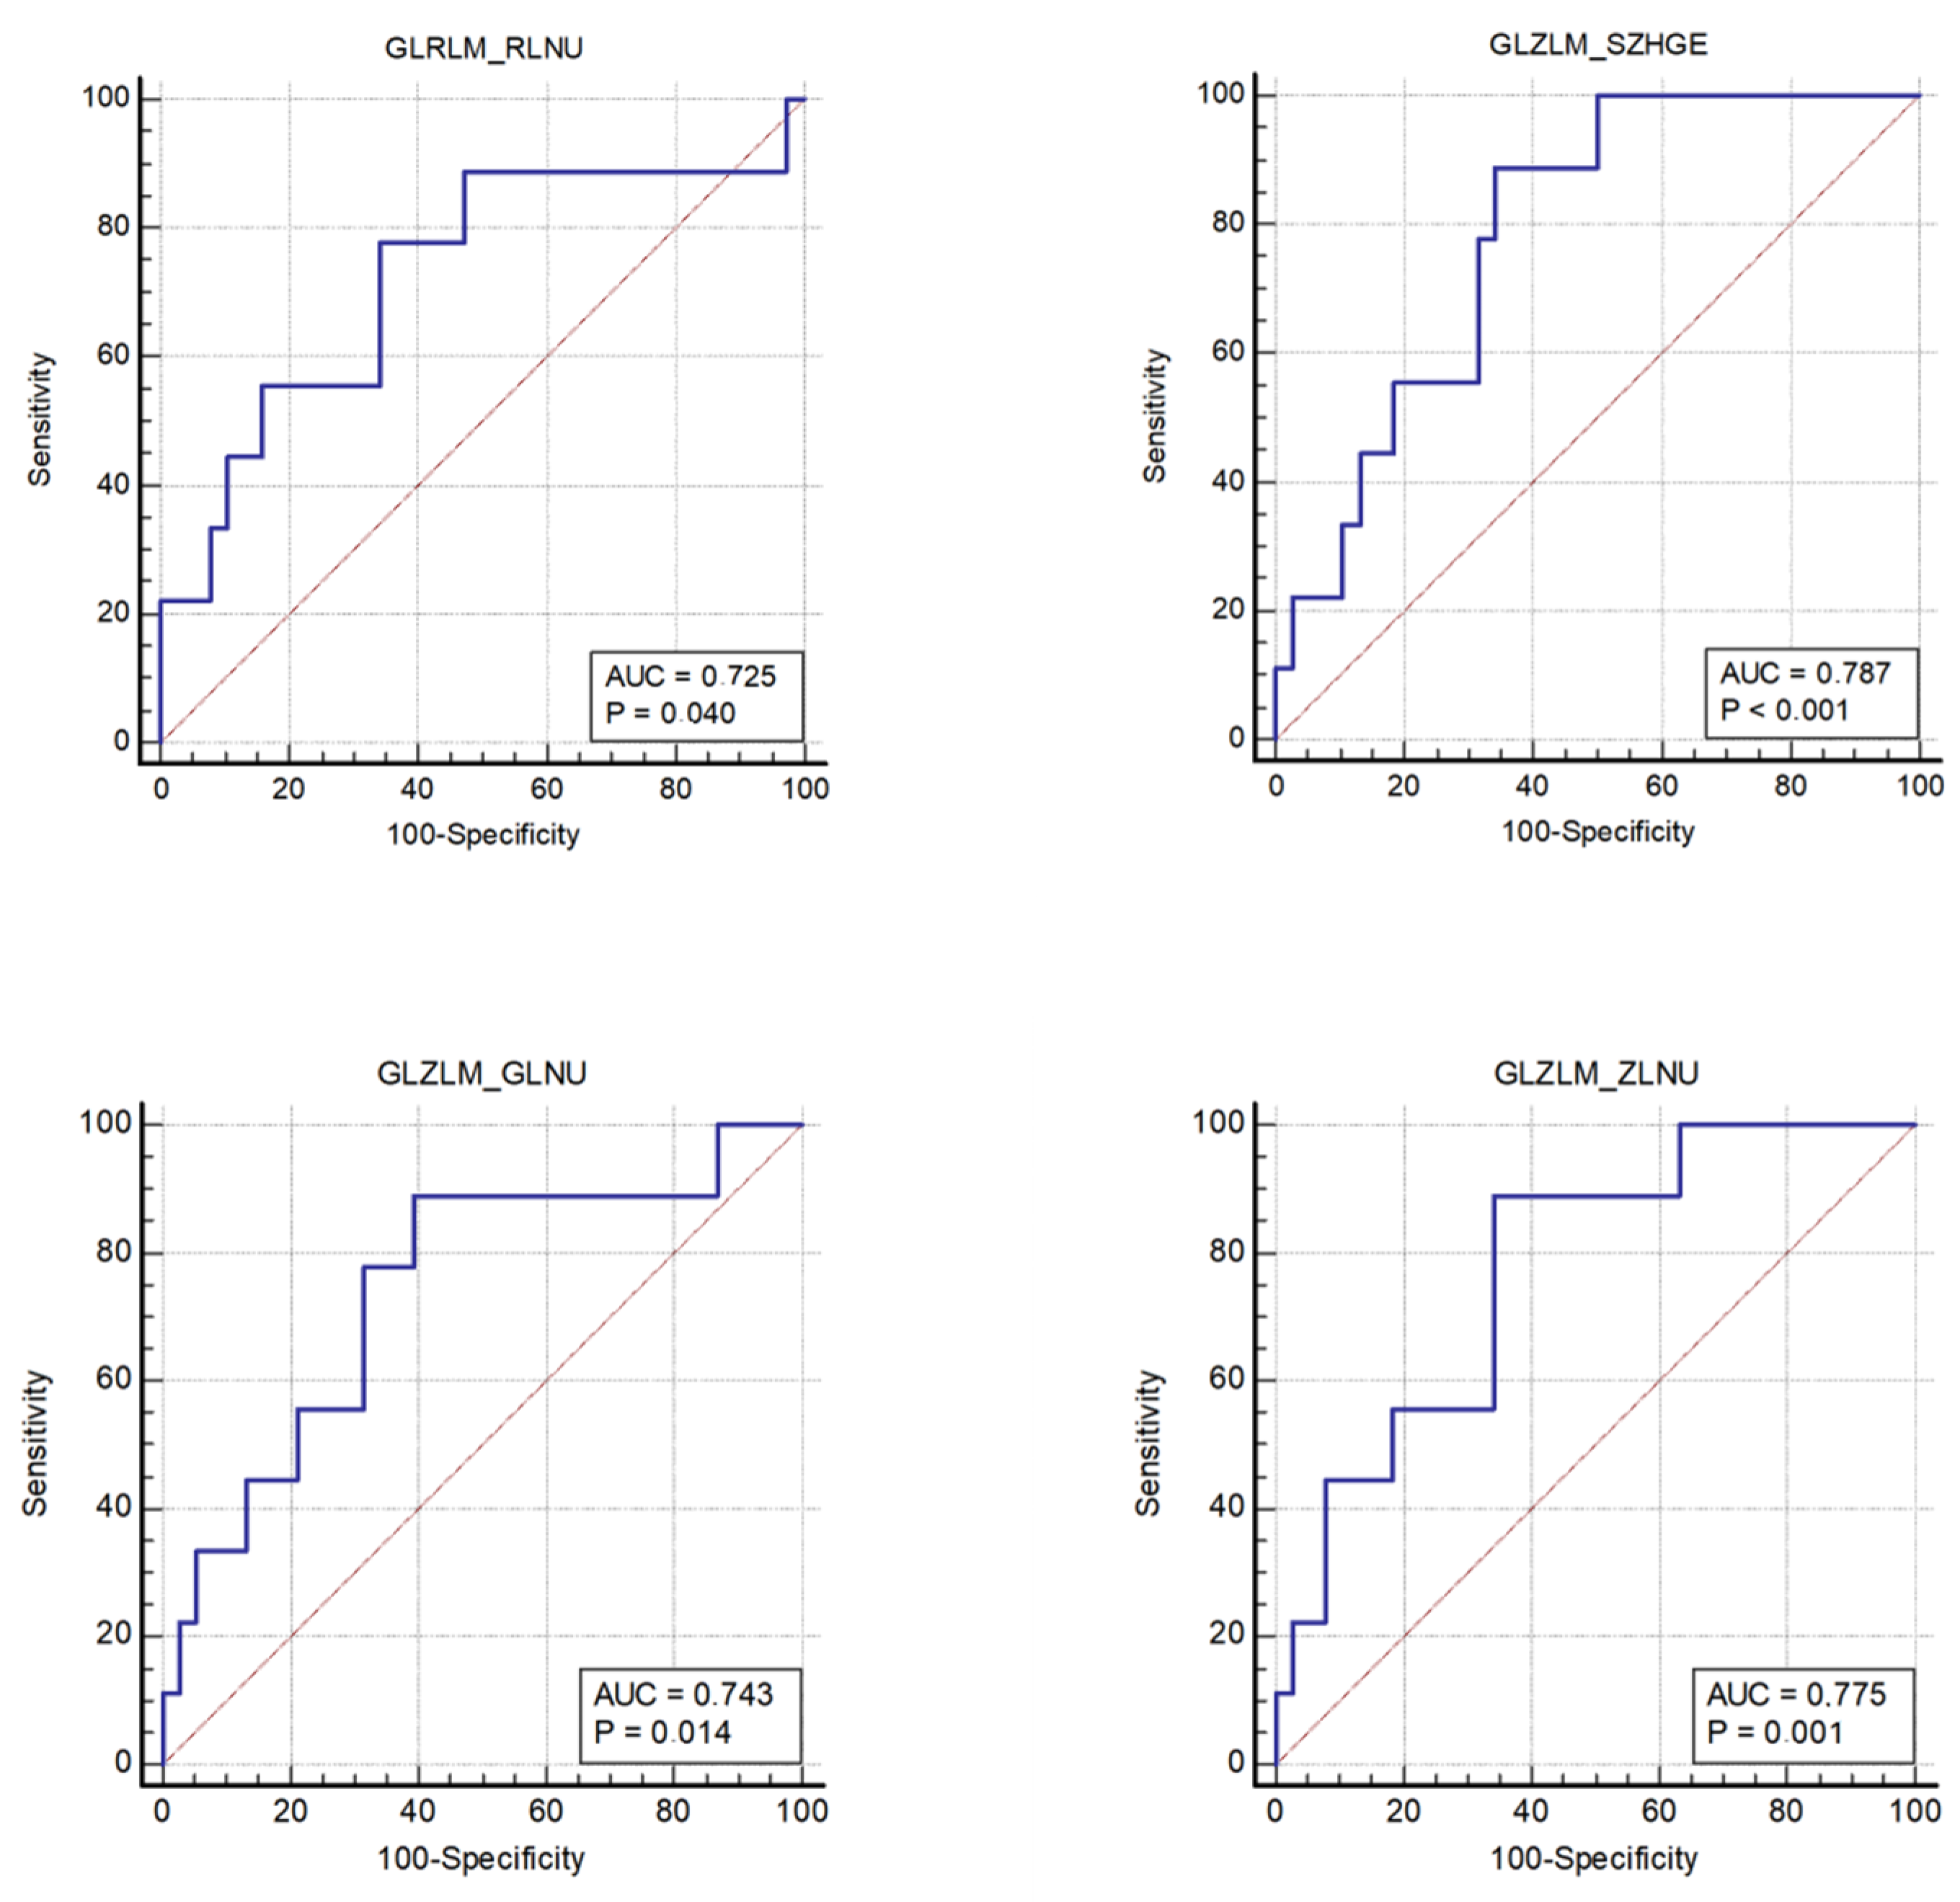
- The nonuniformity of the lengths of the homogeneous runs (GLRLM RLNU), which was significantly higher in patients with MSI (AUC 0.725, sensitivity 77.8%, specificity 65.8%);
- The distribution of the short homogeneous zones with high gray levels (GLZLM SZHGE), which was significantly lower in patients with MSI (AUC 0.787, sensitivity 88.9%, specificity 65.8%);
- The nonuniformity of the gray levels (GLZLM GLNU), which was significantly higher in patients with MSI (AUC 0.743, sensitivity 88.9%, specificity 60.5%);
4. Discussion
5. Conclusions
Supplementary Materials
Author Contributions
Funding
Institutional Review Board Statement
Informed Consent Statement
Data Availability Statement
Conflicts of Interest
References
- Sung, H.; Ferlay, J.; Siegel, R.L.; Laversanne, M.; Soerjomataram, I.; Jemal, A.; Bray, F. Global cancer statistics 2020: GLOBOCAN estimates of incidence and mortality worldwide for 36 cancers in 185 countries. CA Cancer J. Clin. 2021, 71, 209–249. [Google Scholar] [CrossRef] [PubMed]
- Rawla, P.; Sunkara, T.; Barsouk, A. Epidemiology of colorectal cancer: Incidence, mortality, survival, and risk factors. Gastroenterol. Rev. 2019, 14, 89–103. [Google Scholar] [CrossRef] [PubMed]
- Valderrama-Treviño, A.I.; Barrera-Mera, B.; Ceballos-Villalva, J.C.; Montalvo-Javé, E.E. Hepatic metastasis from colorectal cancer. Euroasian J. Hepato-Gastroenterol. 2017, 7, 166–175. [Google Scholar]
- Murphy, P.; Petersen, G.; Thibodeau, S.; Fishel, R. Genetic testing for colon cancer: Joint statement of the American College of Medical Genetics and American Society of Human Genetics. Joint Test and Technology Transfer Committee Working Group. Genet. Med. 2000, 2, 362–366. [Google Scholar] [CrossRef] [PubMed][Green Version]
- Boland, C.R.; Goel, A. Microsatellite instability in colorectal cancer. Gastroenterology 2010, 138, 2073–2087. [Google Scholar] [CrossRef]
- Xie, Y.-H.; Chen, Y.-X.; Fang, J.-Y. Comprehensive review of targeted therapy for colorectal cancer. Signal Transduct. Target. Ther. 2020, 5, 22. [Google Scholar]
- Afrăsânie, V.-A.; Marinca, M.V.; Alexa-Stratulat, T.; Gafton, B.; Păduraru, M.; Adavidoaiei, A.M.; Miron, L.; Rusu, C. KRAS, NRAS, BRAF, HER2 and microsatellite instability in metastatic colorectal cancer—Practical implications for the clinician. Radiol. Oncol. 2019, 53, 265–274. [Google Scholar] [CrossRef]
- Testa, U.; Pelosi, E.; Castelli, G. Colorectal cancer: Genetic abnormalities, tumor progression, tumor heterogeneity, clonal evolution and tumor-initiating cells. Med. Sci. 2018, 6, 31. [Google Scholar] [CrossRef]
- Kocak, B.; Durmaz, E.S.; Ates, E.; Kilickesmez, O. Radiomics with artificial intelligence: A practical guide for beginners. Diagn. Interv. Radiol. 2019, 25, 485–495. [Google Scholar] [CrossRef]
- Ognerubov, N.A.; Shatov, I.A.; Shatov, A.V. Radiogenomics and radiomics in the diagnostics of malignant tumours: A literary review. Tambov Univ. Rep. Ser. Nat. Tech. Sci. 2017, 22, 1453–1460. [Google Scholar] [CrossRef]
- Lubner, M.G.; Smith, A.D.; Sandrasegaran, K.; Sahani, D.V.; Pickhardt, P.J. CT texture analysis: Definitions, applications, biologic correlates, and challenges. RadioGraphics 2017, 37, 1483–1503. [Google Scholar] [CrossRef] [PubMed]
- Weiser, M.R. AJCC 8th edition: Colorectal cancer. Ann. Surg. Oncol. 2018, 25, 1454–1455. [Google Scholar] [CrossRef] [PubMed]
- Nioche, C.; Orlhac, F.; Boughdad, S.; Reuzé, S.; Goya-Outi, J.; Robert, C.; Pellot-Barakat, C.; Soussan, M.; Frouin, F.; Buvat, I. LIFEx: A freeware for radiomic feature calculation in multimodality imaging to accelerate advances in the characterization of tumor heterogeneity. Cancer Res. 2018, 78, 4786–4789. [Google Scholar] [CrossRef] [PubMed]
- Schirripa, M.; Cremolini, C.; Loupakis, F.; Morvillo, M.; Bergamo, F.; Zoratto, F.; Salvatore, F.; Antoniotti, C.; Marmorino, F.; Sensi, E.; et al. Role of NRAS mutations as prognostic and predictive markers in metastatic colorectal cancer. Int. J. Cancer 2015, 136, 83–90. [Google Scholar] [CrossRef] [PubMed]
- de Smedt, L.; Lemahieu, J.; Palmans, S.; Govaere, O.; Tousseyn, T.; Van Cutsem, E.; Prenen, H.; Tejpar, S.; Spaepen, M.; Matthijs, G.; et al. Microsatellite instable vs stable colon carcinomas: Analysis of tumour heterogeneity, inflammation and angiogenesis. Br. J. Cancer 2015, 113, 500–509. [Google Scholar] [CrossRef]
- Remo, A.; Fassan, M.; Vanoli, A.; Bonetti, L.R.; Barresi, V.; Tatangelo, F.; Gafà, R.; Giordano, G.; Pancione, M.; Grillo, F.; et al. Morphology and molecular features of rare colorectal carcinoma histotypes. Cancers 2019, 11, 1036. [Google Scholar] [CrossRef]
- Kawada, K.; Toda, K.; Nakamoto, Y.; Iwamoto, M.; Hatano, E.; Chen, F.; Hasegawa, S.; Togashi, K.; Date, H.; Uemoto, S.; et al. Relationship between 18F-FDG PET/CT scans and KRAS mutations in metastatic colorectal cancer. J. Nucl. Med. 2015, 56, 1322–1327. [Google Scholar] [CrossRef]
- Krikelis, D.; Skoura, E.; Kotoula, V.; Rondogianni, P.; Pianou, N.; Samartzis, A.; Xanthakis, I.; Fountzilas, G.; Datseris, I.E. Lack of association between KRAS mutations and 18F-FDG PET/CT in Caucasian metastatic colorectal cancer patients. Anticancer Res. 2014, 34, 2571–2579. [Google Scholar]
- Lovinfosse, P.; Koopmansch, B.; Lambert, F.; Jodogne, S.; Kustermans, G.; Hatt, M.; Visvikis, D.; Seidel, L.; Polus, M.; Albert, A.; et al. 18F-FDG PET/CT imaging in rectal cancer: Relationship with the RAS mutational status. Br. J. Radiol. 2016, 89, 1063. [Google Scholar] [CrossRef]
- Kim, S.-J.; Pak, K.; Kim, K. Diagnostic performance of F-18 FDG PET/CT for prediction of KRAS mutation in colorectal cancer patients: A systematic review and meta-analysis. Abdom. Radiol. 2019, 44, 1703–1711. [Google Scholar] [CrossRef]
- Taguchi, N.; Oda, S.; Yokota, Y.; Yamamura, S.; Imuta, M.; Tsuchigame, T.; Nagayama, Y.; Kidoh, M.; Nakaura, T.; Shiraishi, S.; et al. CT texture analysis for the prediction of KRAS mutation status in colorectal cancer via a machine learning approach. Eur. J. Radiol. 2019, 118, 38–43. [Google Scholar] [CrossRef] [PubMed]
- González-Castro, V.; Cernadas, E.; Huelga, E.; Fernández-Delgado, M.; Porto, J.; Antunez, J.R.; Souto-Bayarri, M. CT radiomics in colorectal cancer: Detection of KRAS mutation using texture analysis and machine learning. Appl. Sci. 2020, 10, 6214. [Google Scholar] [CrossRef]
- Yang, L.; Dong, D.; Fang, M.; Zhu, Y.; Zang, Y.; Liu, Z.; Zhang, H.; Ying, J.; Zhao, X.; Tian, J. Can CT-based radiomics signature predict KRAS/NRAS/BRAF mutations in colorectal cancer? Eur. Radiol. 2018, 28, 2058–2067. [Google Scholar] [CrossRef] [PubMed]
- Pernicka, J.S.G.; Gagniere, J.; Chakraborty, J.; Yamashita, R.; Nardo, L.; Creasy, J.M.; Petkovska, I.; Do, R.R.K.; Bates, D.D.B.; Paroder, V.; et al. Radiomics-based prediction of microsatellite instability in colorectal cancer at initial computed tomography evaluation. Abdom. Radiol. 2019, 44, 3755–3763. [Google Scholar]
- Fan, S.; Li, X.; Cui, X.; Zheng, L.; Ren, X.; Ma, W.; Ye, Z. Computed tomography-based radiomic features could potentially predict microsatellite instability status in stage II colorectal cancer: A preliminary study. Acad. Radiol. 2019, 26, 1633–1640. [Google Scholar] [CrossRef]
- Wu, J.; Zhang, Q.; Zhao, Y.; Liu, Y.; Chen, A.; Li, X.; Wu, T.; Li, J.; Guo, Y.; Liu, A. Radiomics analysis of iodine-based material decomposition images with dual-energy computed tomography imaging for preoperatively predicting microsatellite instability status in colorectal cancer. Front. Oncol. 2019, 9, 1250. [Google Scholar] [CrossRef]
- Zhang, W.; Huang, Z.; Zhao, J.; He, D.; Li, M.; Yin, H.; Tian, S.; Zhang, H.; Song, B. Development and validation of magnetic resonance imaging-based radiomics models for preoperative prediction of microsatellite instability in rectal cancer. Ann. Transl. Med. 2021, 9, 134. [Google Scholar] [CrossRef]
- Ganeshan, B.; Miles, K.A. Quantifying tumour heterogeneity with CT. Cancer Imaging 2013, 13, 140–149. [Google Scholar] [CrossRef]
- Taieb, J.; Jung, A.; Sartore-Bianchi, A.; Peeters, M.; Seligmann, J.; Zaanan, A.; Burdon, P.; Montagut, C.; Laurent-Puig, P. The evolving biomarker landscape for treatment selection in metastatic colorectal cancer. Drugs 2019, 79, 1375–1394. [Google Scholar] [CrossRef]
- Lakatos, G.; Köhne, C.H.; Bodoky, G. Current therapy of advanced colorectal cancer according to RAS/RAF mutational status. Cancer Metastasis Rev. 2020, 39, 1143–1157. [Google Scholar]


| Characteristics | N (%) |
|---|---|
| Sex | |
| Males | 27 (57%) |
| Females | 20 (43%) |
| Age (years) | |
| Median | 70 |
| IQR | 26–87 |
| Body mass index (kg/m2) | |
| Median | 24.6 |
| IQR | 19.1–31.8 |
| Stages | |
| III | 16 (33%) |
| IV | 31 (66%) |
| Tumor locations | |
| Rectum-sigma | 18 (38%) |
| Ascending colon | 8 (17%) |
| Tranverse | 8 (17%) |
| Descending | 7 (15%) |
| Ciecum | 6 (13%) |
| Genetic mutations | |
| BRAF | 7 (15%) |
| KRAS | 18 (38%) |
| NRAS | 3 (6%) |
| MMR | 9 (19%) |
| Median (IQR) | p-Value | SE | SP | AUC (95% CI) | p | |
|---|---|---|---|---|---|---|
| Group 0 NRAS | Group 1 NRAS | |||||
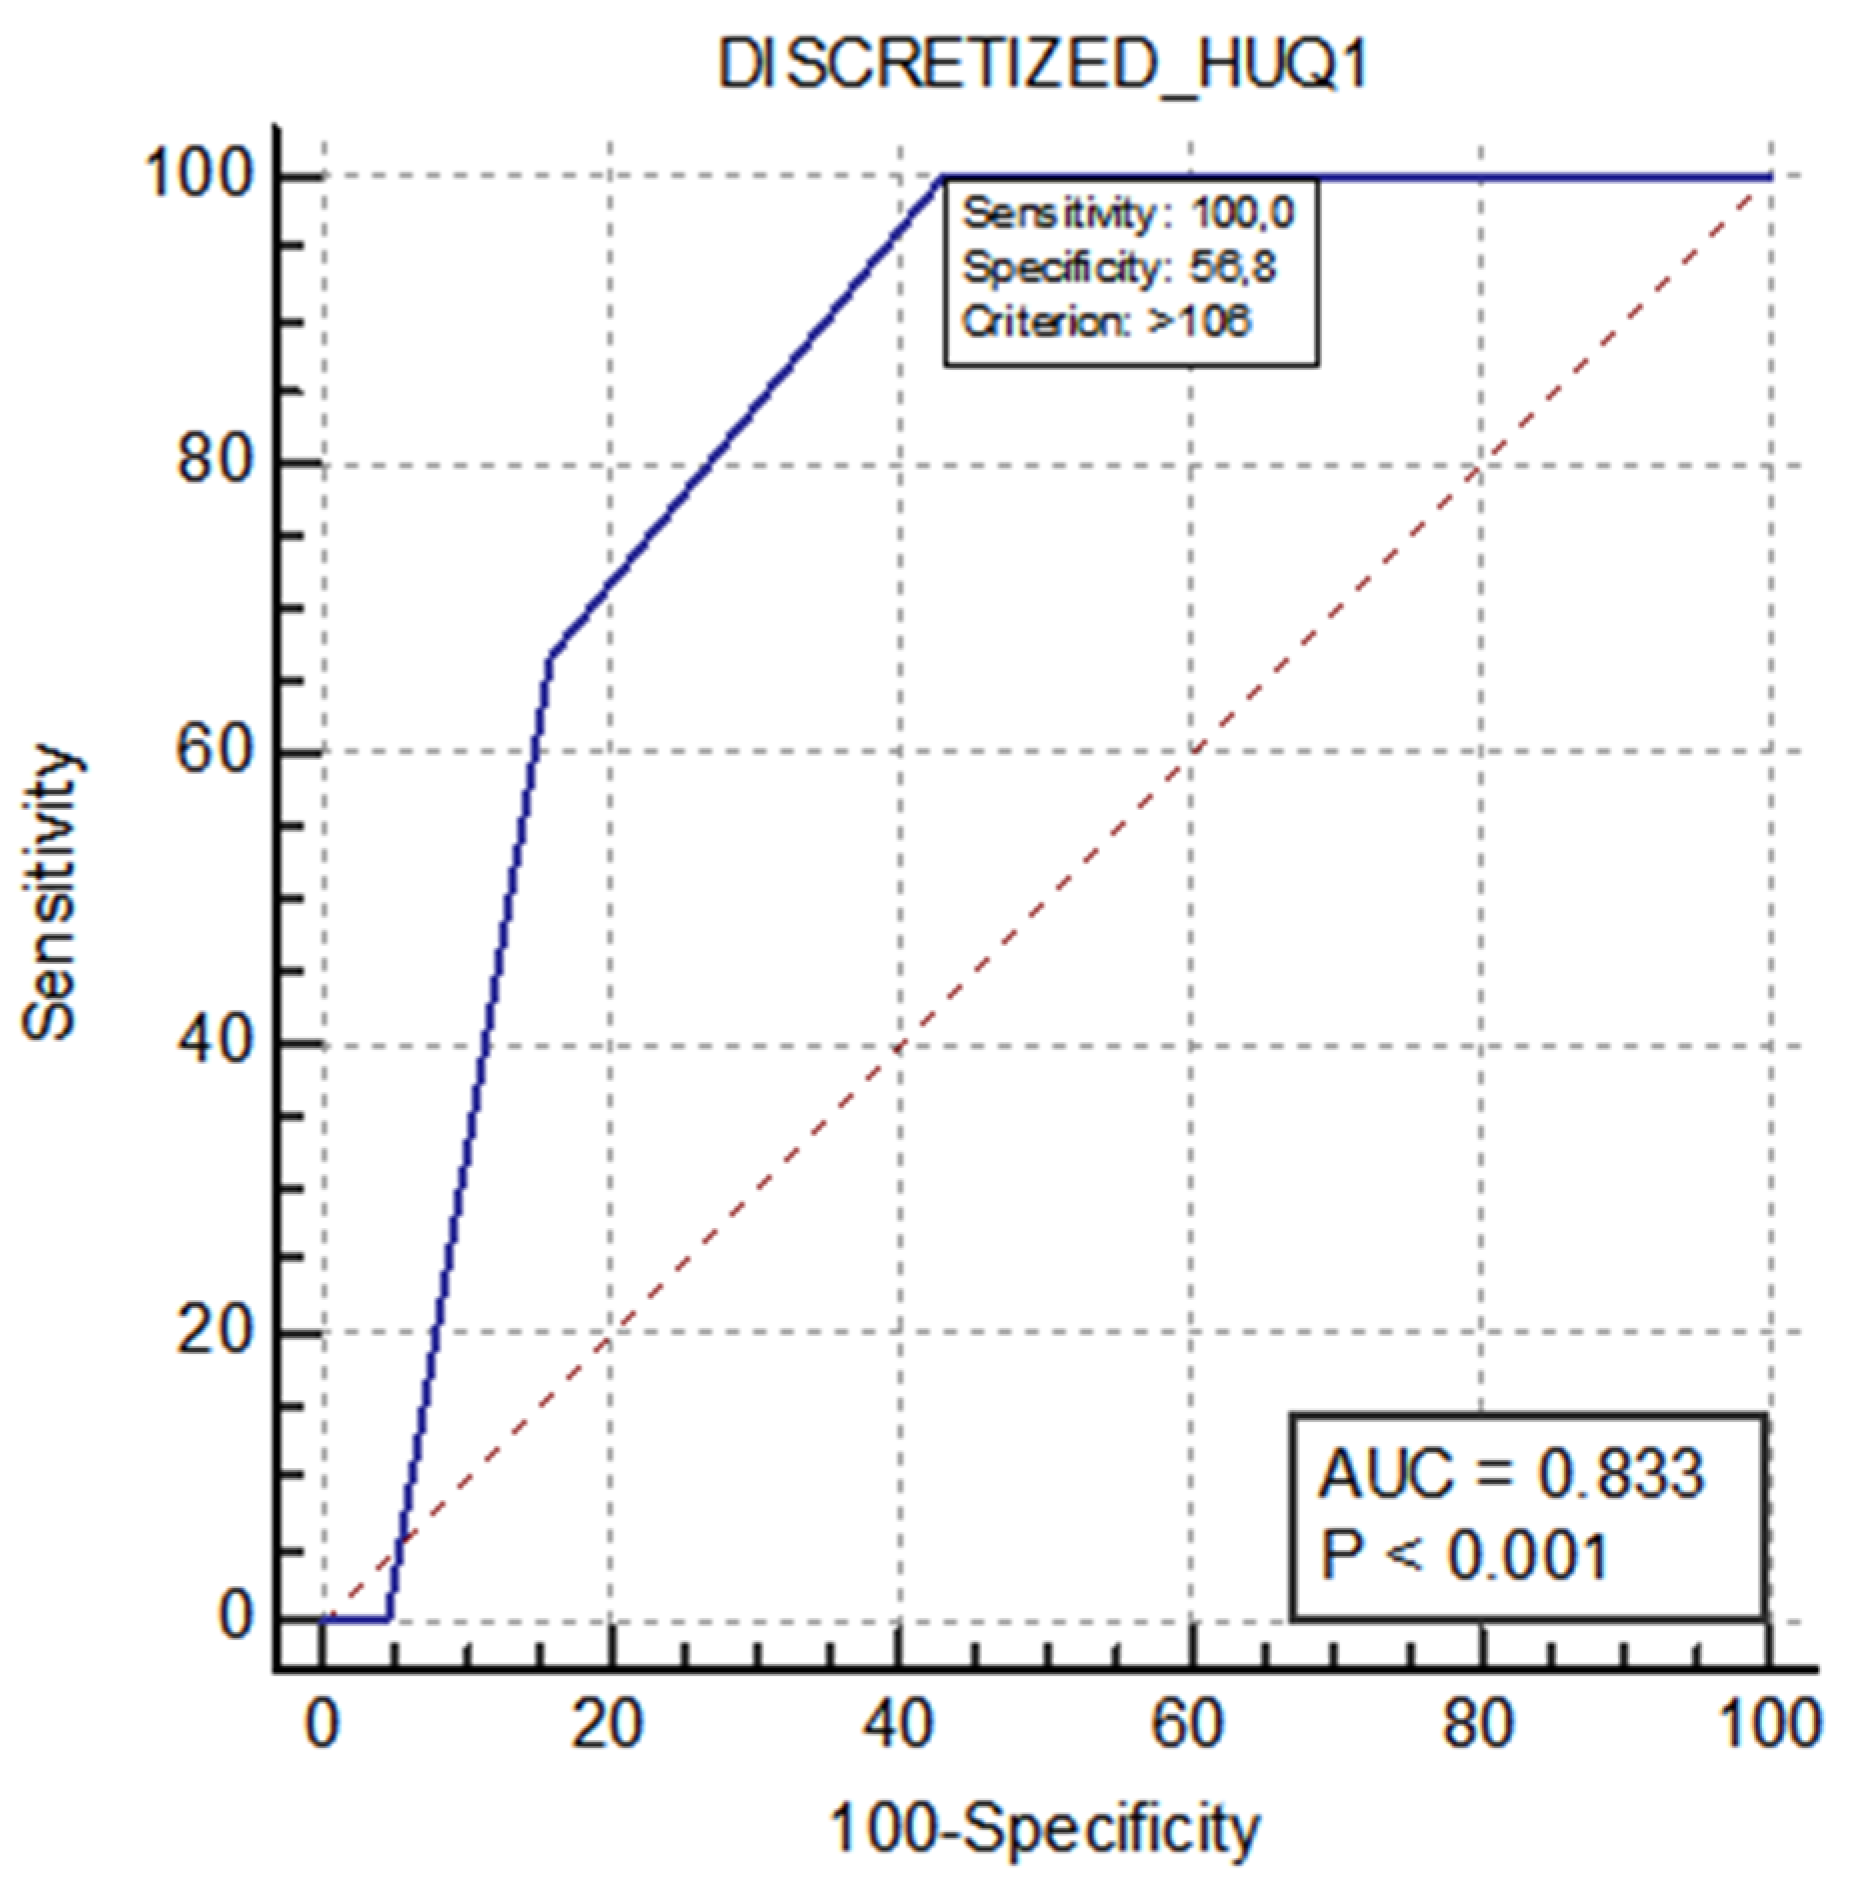
| 106 (105–107) | 108 | 0.049 | 100% | 56.8% | 0.833 (0.696–0.926) | <0.001 |
| CT-TA Parameters | Group 0 (MSS) Median (IQR) | Group 1 (MSI) Median (IQR) | p | YI | SE (%) | SP (%) | AUC (95% CI) | p |
|---|---|---|---|---|---|---|---|---|
| GLRLM RLNU | 4419 (2811–9267) | 11829 (5918–21721) | 0.037 | 0.44 | 77.8 | 65.8 | 0.725 (0.575–0.845) | 0.040 |
| GLZLM SZHGE | 7334 (7114–7457) | 7070 (6937–7192) | 0.0081 | 0.55 | 88.9 | 65.8 | 0.787 (0.643–0.892) | 0.001 |
| GLZLM GLNU | 97.39 (62.29–177.79) | 186.42 (133.31–290.23) | 0.025 | 0.49 | 88. 9 | 60.5 | 0.743 (0.594–0.859) | 0.014 |
| GLZLM ZLNU | 378.96 (304.16–763.17) | 920.71 (546.78–1378.71) | 0.011 | 0.55 | 88.9 | 65.8 | 0.775 (0.630–0.884) | 0.001 |
Publisher’s Note: MDPI stays neutral with regard to jurisdictional claims in published maps and institutional affiliations. |
© 2022 by the authors. Licensee MDPI, Basel, Switzerland. This article is an open access article distributed under the terms and conditions of the Creative Commons Attribution (CC BY) license (https://creativecommons.org/licenses/by/4.0/).
Share and Cite
Crimì, F.; Zanon, C.; Cabrelle, G.; Luong, K.D.; Albertoni, L.; Bao, Q.R.; Borsetto, M.; Baratella, E.; Capelli, G.; Spolverato, G.; et al. Contrast-Enhanced CT Texture Analysis in Colon Cancer: Correlation with Genetic Markers. Tomography 2022, 8, 2193-2201. https://doi.org/10.3390/tomography8050184
Crimì F, Zanon C, Cabrelle G, Luong KD, Albertoni L, Bao QR, Borsetto M, Baratella E, Capelli G, Spolverato G, et al. Contrast-Enhanced CT Texture Analysis in Colon Cancer: Correlation with Genetic Markers. Tomography. 2022; 8(5):2193-2201. https://doi.org/10.3390/tomography8050184
Chicago/Turabian StyleCrimì, Filippo, Chiara Zanon, Giulio Cabrelle, Kim Duyen Luong, Laura Albertoni, Quoc Riccardo Bao, Marta Borsetto, Elisa Baratella, Giulia Capelli, Gaya Spolverato, and et al. 2022. "Contrast-Enhanced CT Texture Analysis in Colon Cancer: Correlation with Genetic Markers" Tomography 8, no. 5: 2193-2201. https://doi.org/10.3390/tomography8050184
APA StyleCrimì, F., Zanon, C., Cabrelle, G., Luong, K. D., Albertoni, L., Bao, Q. R., Borsetto, M., Baratella, E., Capelli, G., Spolverato, G., Fassan, M., Pucciarelli, S., & Quaia, E. (2022). Contrast-Enhanced CT Texture Analysis in Colon Cancer: Correlation with Genetic Markers. Tomography, 8(5), 2193-2201. https://doi.org/10.3390/tomography8050184