Article

Dangerous Overtaking of Cyclists in Montréal

Centre Urbanisation Culture Société, Institut National de la Recherche Scientifique (INRS), 385 Sherbrooke E, Montréal, QC H2X 1E3, Canada
*
Author to whom correspondence should be addressed.
Safety 2022, 8(1), 16; https://doi.org/10.3390/safety8010016
Submission received: 25 June 2021 / Revised: 26 October 2021 / Accepted: 25 February 2022 / Published: 27 February 2022
(This article belongs to the Special Issue Non-Motorized Road Users Safety)

Abstract

:
It is largely consented that the bicycle is a sustainable mobility alternative in the city. Despite its many benefits, cycling comprises risks of injury or death. Among others, these risks are a result of unsafe overtaking manoeuvres performed by motorized vehicles against cyclists. This study aims to identify the characteristics of the road network and traffic influencing the lateral distance and duration of overtaking. Using bicycles equipped with distance sensors, GPS, and cameras, four cyclists covered 1689 km in Montréal. Hence, 3591 overtakings were identified with an average distance of 176 cm; 111 overtaking manoeuvres took place at distances less than 1 m, resulting in an unsafe event for every 32 overtakings. On average, the duration of an overtaking was 1.082 s and dangerous overtakings (less than one metre) lasted 0.57 s more than safe overtakings (one metre and over). A generalized additive logit model (GAM) is built to predict the likelihood of a dangerous lateral passing (less than 1 m). The results show that in taking a major route, the presence of parked vehicles and the time required for overtaking significantly increase the probability of experiencing a dangerous overtaking. However, the participant, type of vehicle, or presence of a bike lane have no significant effect. Therefore, the results demonstrate the importance of keeping cyclists isolated from traffic. Furthermore, providing a bike path along parking spaces seems to be a solution that does not enhance cyclist safety.

1. Introduction

Today, the bicycle is a sustainable mobility alternative for numerous actors. In fact, many governments and cities encourage their citizens to travel by bicycle because of its multiple benefits. According to Garrard et al. [1], these benefits can be separated into three categories: improvement of health due to an increase in physical activity, psychosocial benefits for mental health, and environmental benefits (reduction of atmospheric and noise pollution, and road congestion). Despite these individual and collective benefits, cycling in the city comprises risks of injury and death associated with collisions with motorized vehicles, and particularly in cities where the cycling network is underdeveloped and/or not separate from automobile traffic [2,3]. This situation is especially prevalent in North American cities, contrary to their Northern European counterparts (in particular Dutch and Danish) [4]. For example, on the island of Montréal (QC, Canada), only 24% of the cyclable network corresponds to lanes exclusively dedicated to cyclists (isolated from traffic) [5,6]. Cyclists must therefore share a significant part of their trip with motorized vehicles. As a result, 1389 collisions involving cyclists were registered between 2018 and 2019; 11% of these accidents took place in bicycle lanes (non-protected infrastructures), and 60% in traffic lanes [7].
It is largely recognized that a significant number of accidents involving cyclists take place during overtaking manoeuvres by motorized vehicles [8]. Consequently, many countries have adopted a regulation on overtaking distances to ensure the safety of cyclists. In the Province of Québec (QC, Canada), regulation establishes the following lateral passing distance (LPD): 1 metre in zones of 50 km/h zones or less, and 1.5 metres in zones of more than 50 km/h [9]. Previous studies have demonstrated that many factors influence LPD, sometimes placing cyclists in a particularly vulnerable situation [10,11,12,13,14,15,16,17,18,19,20,21]. They can be separated into three categories: characteristics of the road network, factors related to traffic, and those associated with cyclists.

1.1. Factors Associated with Characteristics of the Road Network

Many authors have found that LPD increase on roads of two lanes or more, compared to those that have only one lane [10,17,19]. Because the road width provides more space to drivers during an overtaking manoeuvre, unsurprisingly, the LPD is greater on wide roads than on narrow roads. As would be expected, the authors also report that where lanes are larger and more numerous, vehicle speed was greater during a LPD [10,17,19], thus possibly contributing to a decrease in the cyclist’s feeling of security [10].
The type of bicycle facility may also have an impact on LPD. As for the presence of a bicycle lane, the results vary greatly from one study to the next. In Victoria (Australia) [11], Lancashire (England) [18], and Ann Arbor (MI, USA) [15], riding in a bike lane would seem to significantly decrease the LPD (compared to a single lane without this facility). How can such a result be explained? It is probable that certain car drivers wrongly consider the line of the bicycle lane as a protective measure for the cyclist; therefore, they do not hesitate in driving close to it, thus executing a dangerous overtaking. Conversely, in Kitchener-Waterloo (ON, Canada), Mehta et al. [17] conclude that the LPD increases on two-lane roads with a bicycle lane, compared to the roads without a bicycle lane. Similarly, in Taiwan, Chuang et al. [12] found an increase in LPD on roads (with a speed limit of 50 km/h) with a bicycle lane.
The presence of parked vehicles on the road is a variable accounted for in many studies [10,11,13]. According to Beck et al. [11], LPD would be reduced from 30 to 40 cm in the presence of parked vehicles. This could be explained by the fact that cyclists steer clear of parked vehicles to avoid the probability of a dooring crash.

1.2. Factors Associated with Traffic

Among the factors associated with traffic, traffic density is certainly the one that is the most explored in literature [10,14,15,16,19,21]; moreover, it is evaluated either with proxies (e.g., annual average daily traffic—AADT) [18], or real-time traffic measures [10]. In this last study, the researchers found that an increase in traffic density resulted in a decrease of LPD.
Speed limits are also taken into account in many studies, although the speed limit does not necessarily correspond to the speed of vehicle overtaking [18]. There again, results differ: some studies report an inferior value for LPD [11,13,19] and others report a superior value [18] on roads with higher speed limits.
Many authors have measured vehicle speed while overtaking (with a speed sensor) [14,16] or have estimated it (with videos or the frequency of capture by the distance sensor) [10,17]. Some conclude that speed had no significant influence on the LPD [14,17], contrary to Apasnore et al. [10], reporting that it is positively correlated at LPD. Llorca et al. [16] conducted a quantitative analysis of the cyclist’s perception during overtaking. Although researchers found no significant relation between speed and LPD, the cyclist’s perception of danger was remarkably high during a high-speed overtaking manoeuvre (>80 km/h).
LPD could also vary significantly according to types of vehicles. Although the classification used differs from one study to another, the starting hypothesis remains the same; that is, bigger vehicles (buses, trucks, vans) tend to decrease LPD compared to smaller vehicles (cars, taxis, SUVs). Many studies confirm this hypothesis [11,12,13,18].
Finally, it would seem that LPDs decrease with the presence of oncoming vehicles [14,15,16,19]. Paradoxically, Dozza et al. [14] find that the speed of passing vehicles decreases in the presence of vehicles in the adjacent lanes (same direction or oncoming).

1.3. Factors Associated to Cyclists

Many individual factors could contribute to significantly decreasing or increasing LPD, particularly as concerns gender, experience, speed, and appearance of the cyclist.
First, some researchers have attempted to evaluate the influence of the cyclist’s gender on LPD. According to Debnath et al. [13], this individual factor would have no significant influence in Queensland (Australia). On the contrary, Chuang et al. [12] have shown that drivers have a tendency to allow more space to women than to men in Taiwan. It is important to highlight that the participating men in the study had more cycling experience than the participating women. These results are corroborated by Walker et al. [20], where the cities of Salisbury and Bristol (England) use a particularly original approach; that is, the cyclist wearing a wig to imitate an appearance often associated with the female gender. As a result, they report that LPD is greater for the cyclist wearing the wig [20].
Secondly, some suggest that the cyclist’s experience could have an impact on LPD [12,20,21]. Yet, to our knowledge, this element is not taken into account in the quasi-naturalistic studies. Indeed, some studies involve participants with various levels of experience; however, they do not include participant identifiers as explanatory or control variables in their models [11,12,16]. Other studies will prefer to impose upon participants a predefined distance between the bicycle and the sidewalk during trips (usually between 0.3 m to 1 m) [14,16,17,18,19,21]. Consequently, it seems difficult to establish if the experience or the type of driving has a significant impact on LPD or not.
Thirdly, an increase in cyclists’ speed is associated to a decrease in LPD [10]. According to them, automobile drivers would consider rapid cyclists to be more experienced and therefore less vulnerable during an overtaking with little lateral distancing.
Fourthly, the appearance of the cyclist does not seem to have a significant impact [13,21]. As an example, Walker et al. [21] compared seven outfits associated with the cyclist’s level of experience, one of which included a vest printed with the word “police”. Only this latter one is associated with a significant difference on LPD of approximately 8 cm more compared to other types of clothing.

1.4. Research Objectives

Many factors relative to the road network, traffic, and cyclists may therefore have an impact on LPD and thus increase or decrease the probability that a cyclist must deal with a dangerous overtaking. However, these factors are often inconsistent from one study to the next, depending on the city or country reviewed. To our knowledge, another factor has been rarely explored until now: the duration of cyclist overtaking. Yet, it is probable that the longer a dangerous overtaking, the greater the risk of collision and feeling of insecurity for the cyclist. According to Dozza et al. [14], an overtaking manoeuvre comprises four phases (approaching, steering away, passing, and returning). For the cyclist being overtaken by the vehicle, the average time is 1.65 s (±0.61), with an average distance of 2.03 m (±0.28) [14]. According to Chuang et al. [12], the LPD will be significantly lower during rapid overtaking (0.1 to 4 s) compared to those whose duration is superior to 4 s.
The main objective of this study is to analyze the factors contributing to the increase or decrease of the probability of a dangerous overtaking in Montréal (QC, Canada) by using a naturalistic cycling approach. For a second objective, we explore the relationships between LPD and passing duration.

2. Materials and Methods

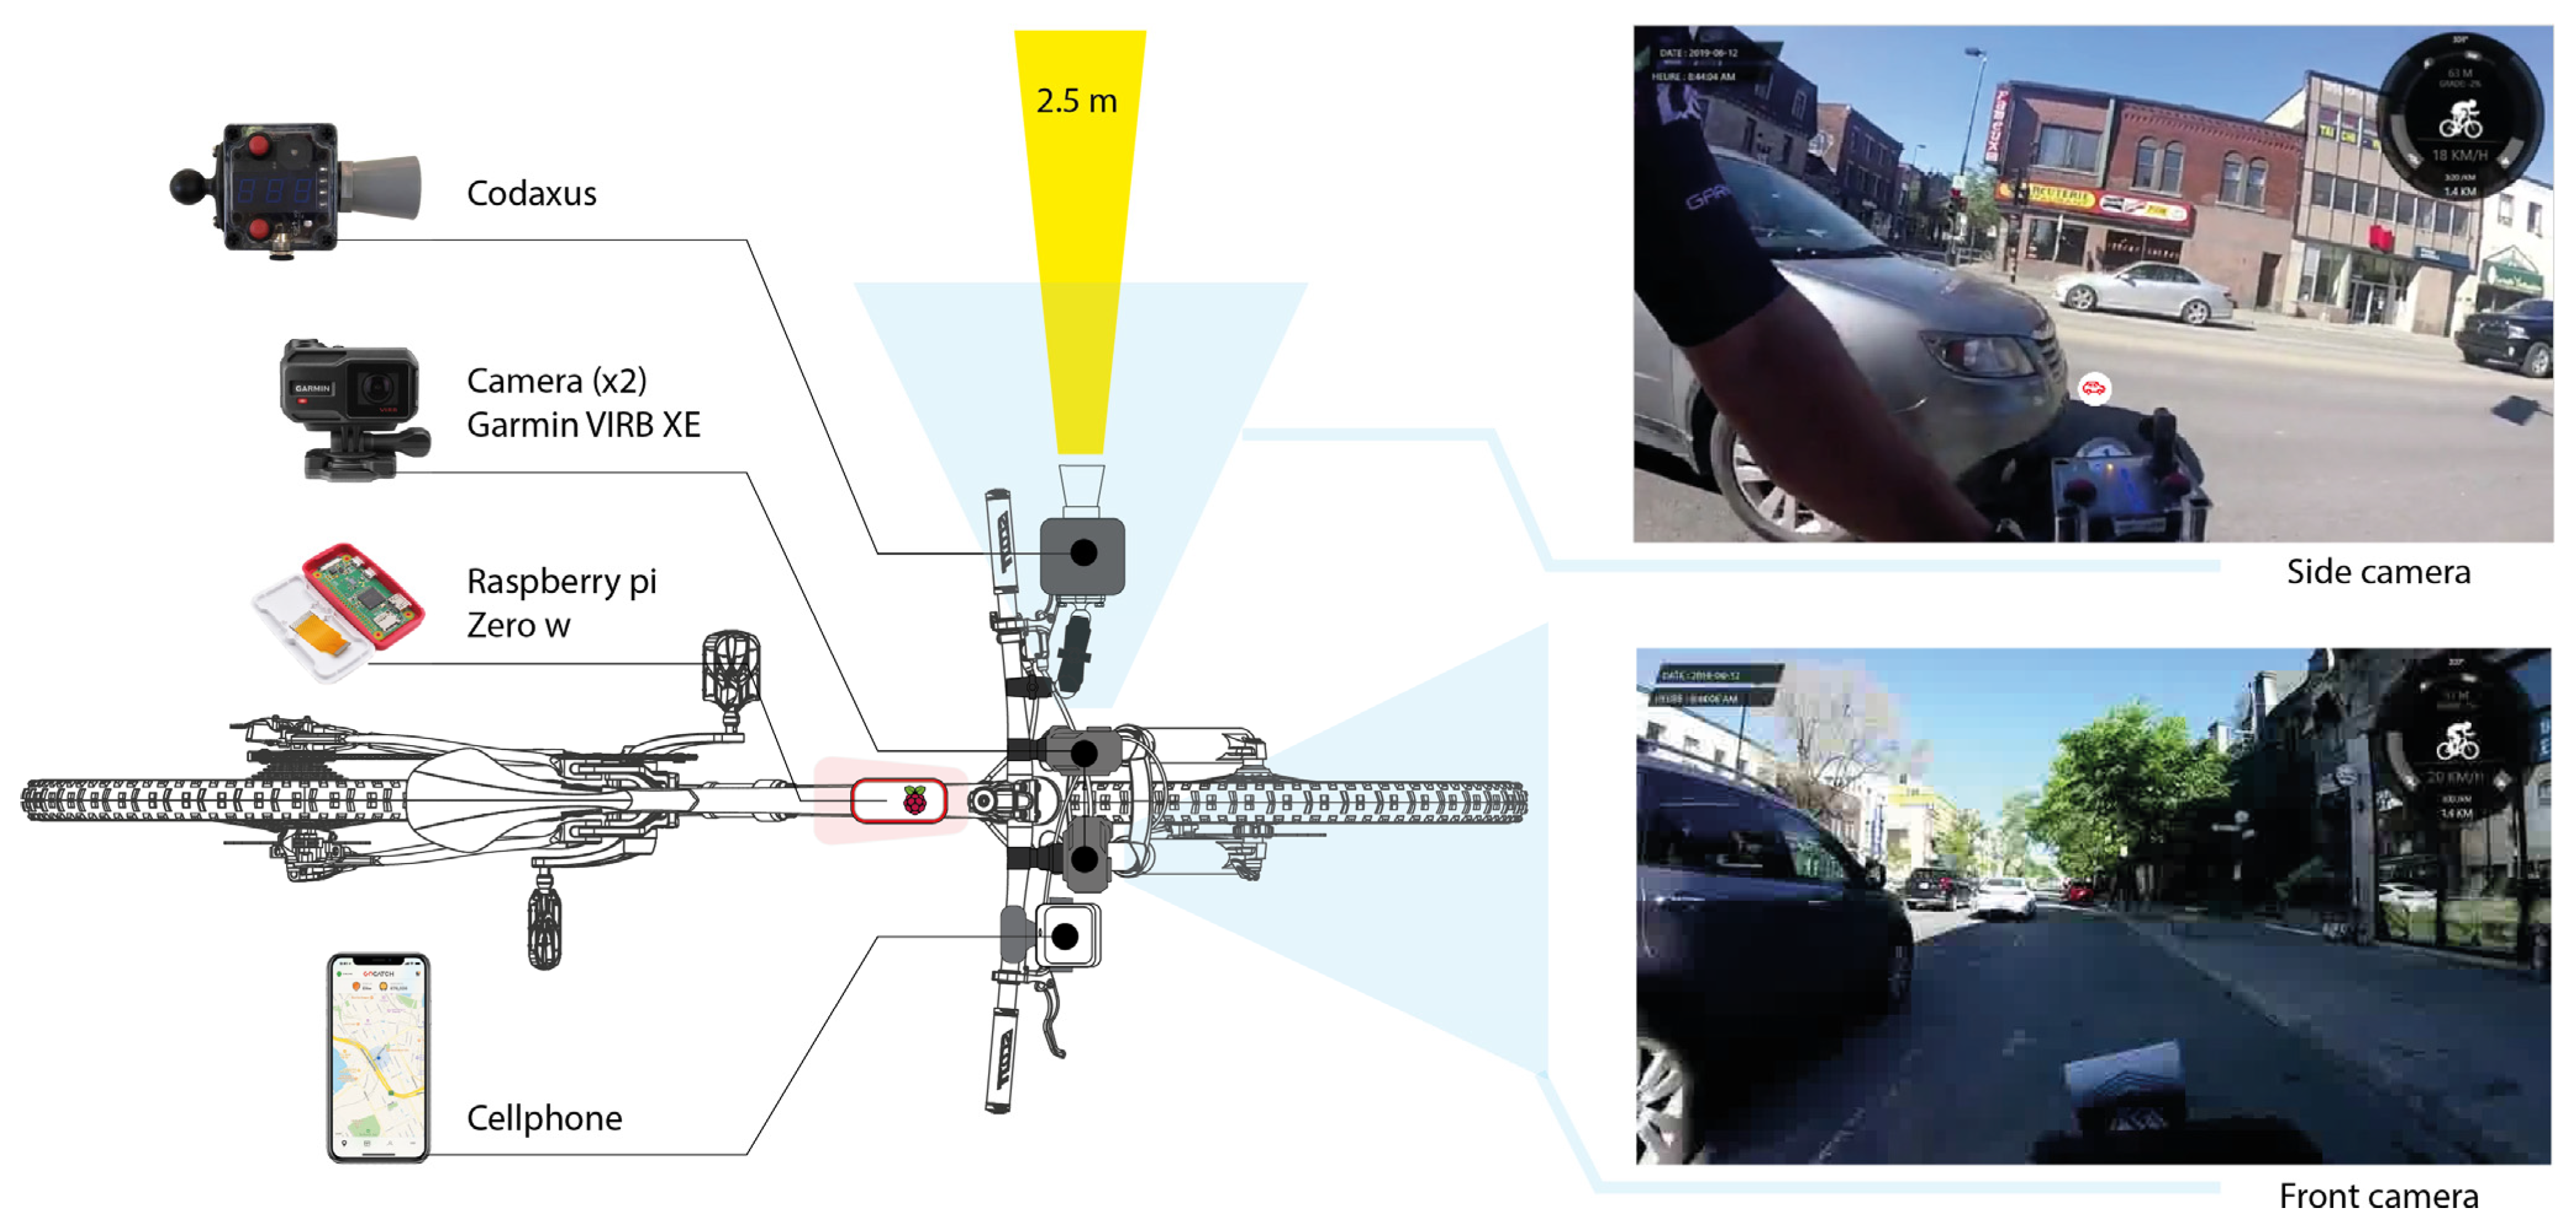
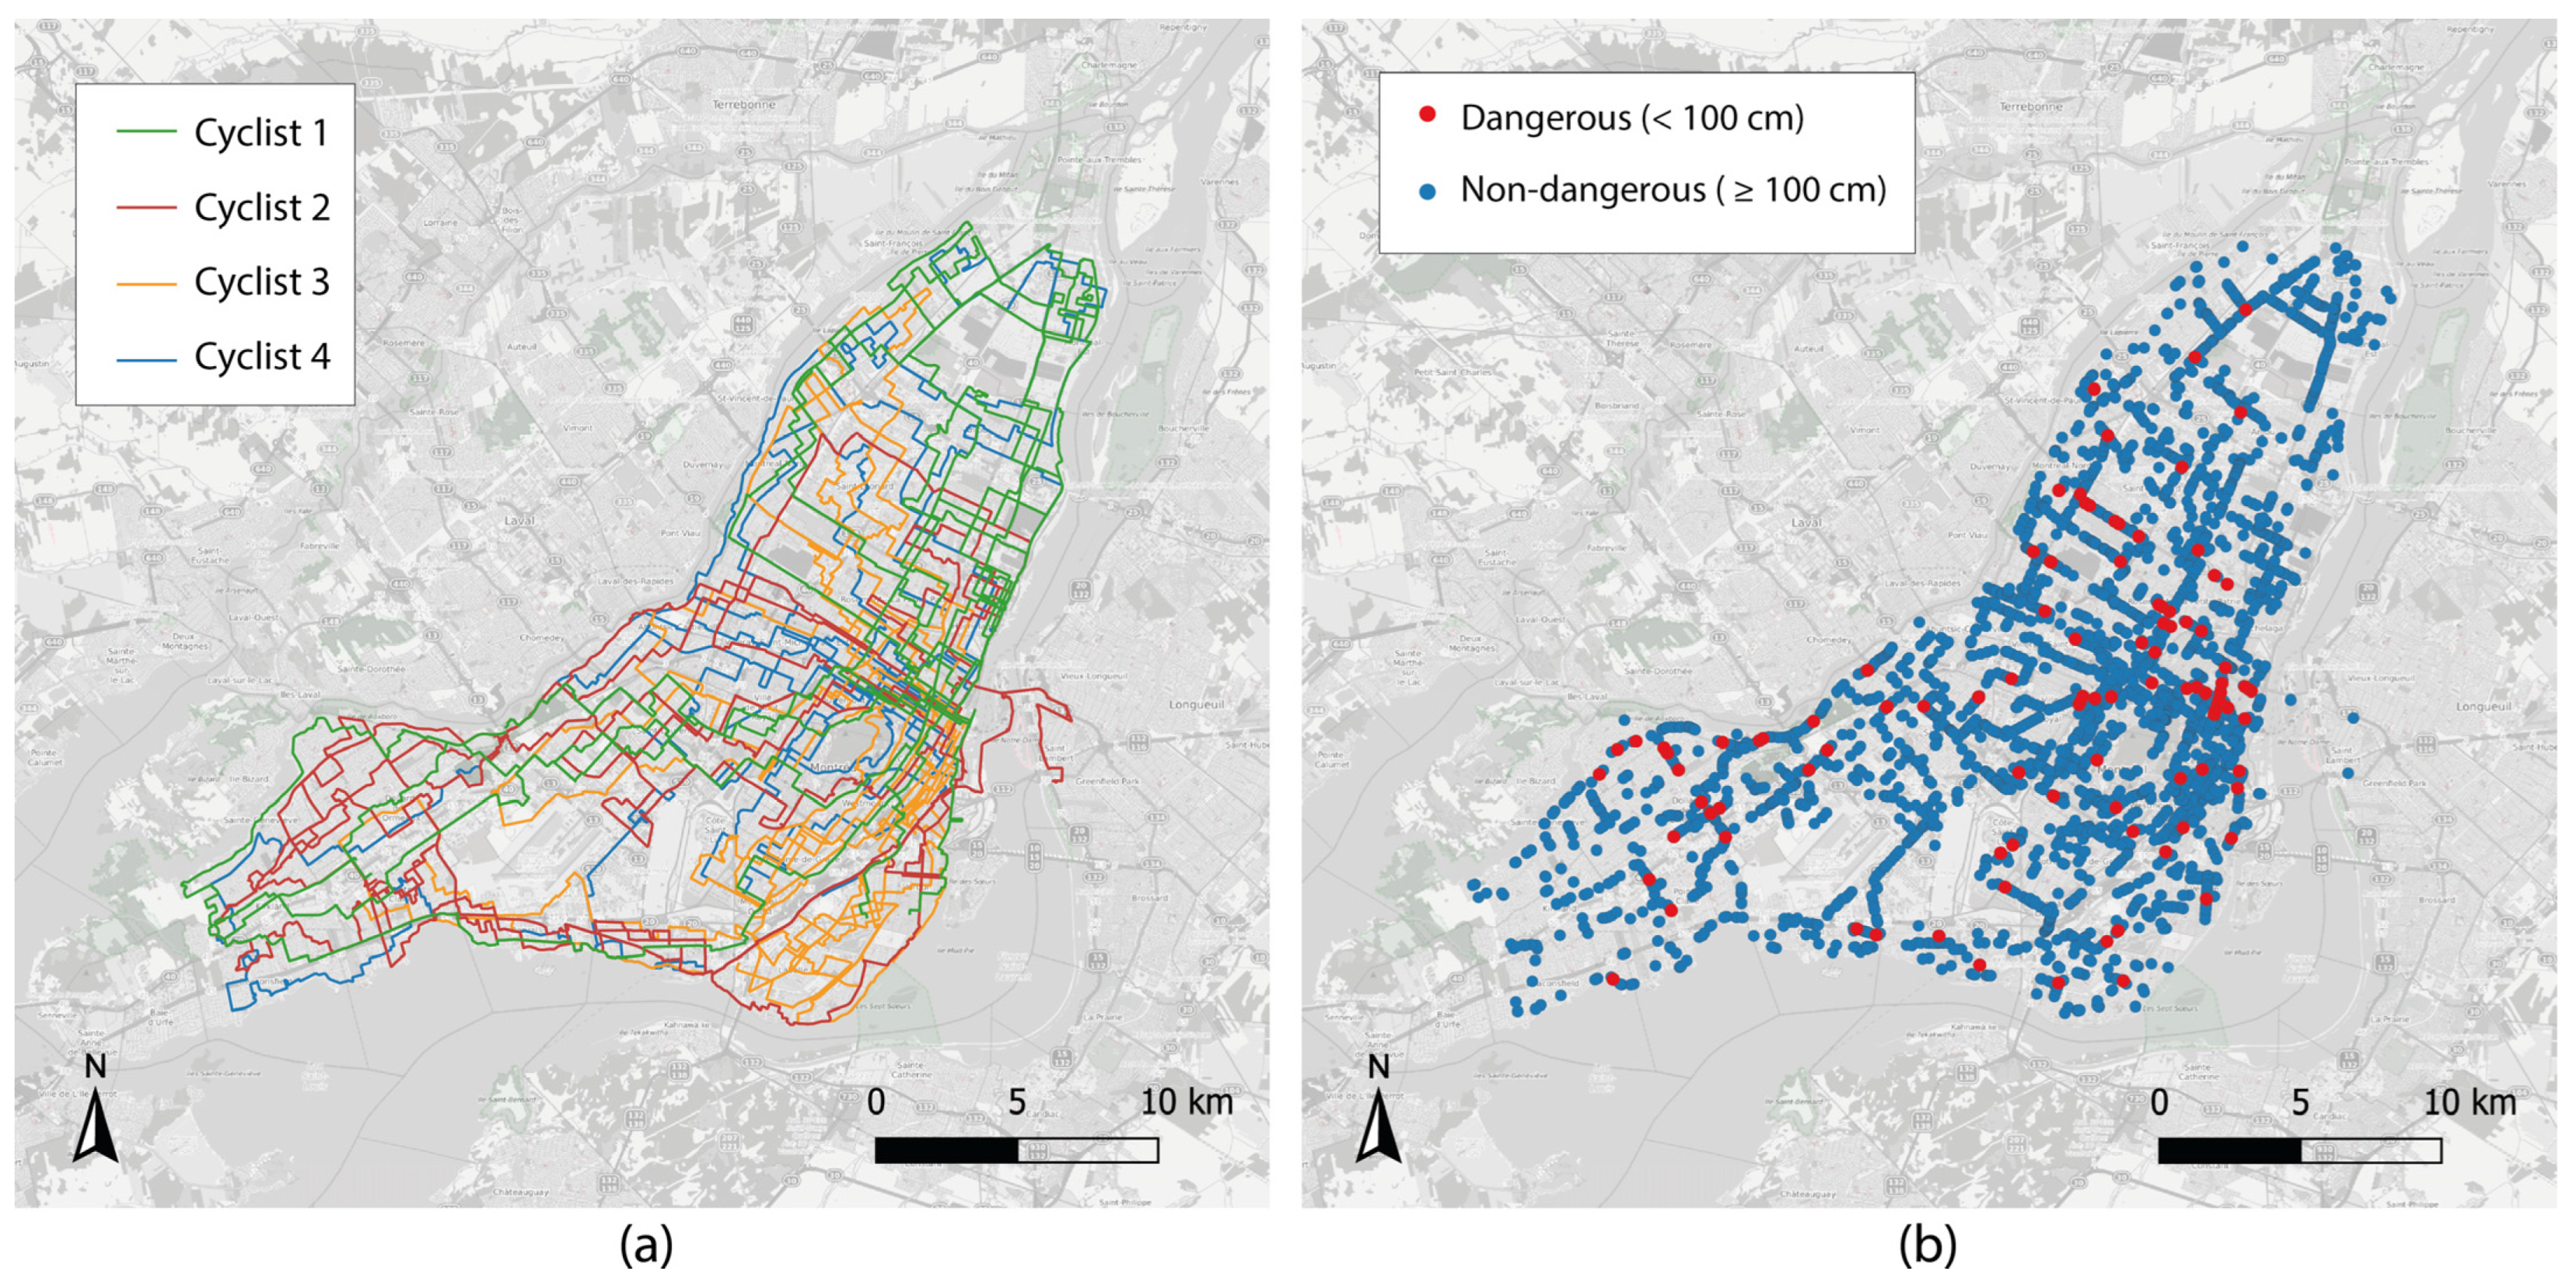
2.1. Study Area and Primary Data Collection

A mobile primary data collection was conducted on the territory of the island of Montréal (population of 1.942 million in 2020) during five dry-weather weekdays (12, 17–19, 21 June 2019). Four graduate students, in good physical condition and with moderate urban cycling experience, were involved in the data collection (one female and three male between 25 and 36 years old). The study was conducted in accordance with the Declaration of Helsinki, and the protocol was approved by the Ethics Committee of Institut national de la recherche scientifique (project no. CER 19-509). The participants wore the same cycling jersey, a bike helmet, and used the same bicycle equipped with mandatory visibility accessories (white front reflector, red rear reflector, yellow reflector on each pedal, reflectors on the wheels). Participants rode for two data collection sessions per day, in the morning (8 a.m. to 1 p.m.) and in the afternoon (2 p.m. to 6 p.m.). Cyclists covered 80 to 100 km individually per day, for a total of 1689 km (Figure 1a). They were provided with three riding instructions: (1) respect current traffic regulation; (2) ride at a safe speed for the urban environment (between 15 and 20 km/h); and (3) divide their routes into 40-min segments, to simplify data processing. However, no instruction was provided to define a specific distance they should keep from the sidewalk when riding.
As for collection devices, each bicycle was equipped with four: a Codaxus sensor (C3FT v3 Codaxus, Austin, TX, USA) to measure distance (up to 250 cm); two Garmin cameras (Virb XE, Garmin International, Inc., Olathe, KS, USA), a Raspberry Pi Zero W (Raspberry Pi Foundation, Cambridge, UK) to record data from the distance sensor, a cell phone to follow pre-determined itineraries. The devices were placed on the bicycle, as illustrated in Figure 2. The cyclists also wore a GPS watch (Forerunner 920XT, Garmin International, Inc., Olathe, KS, USA), which recorded their speed and geographical position each second.

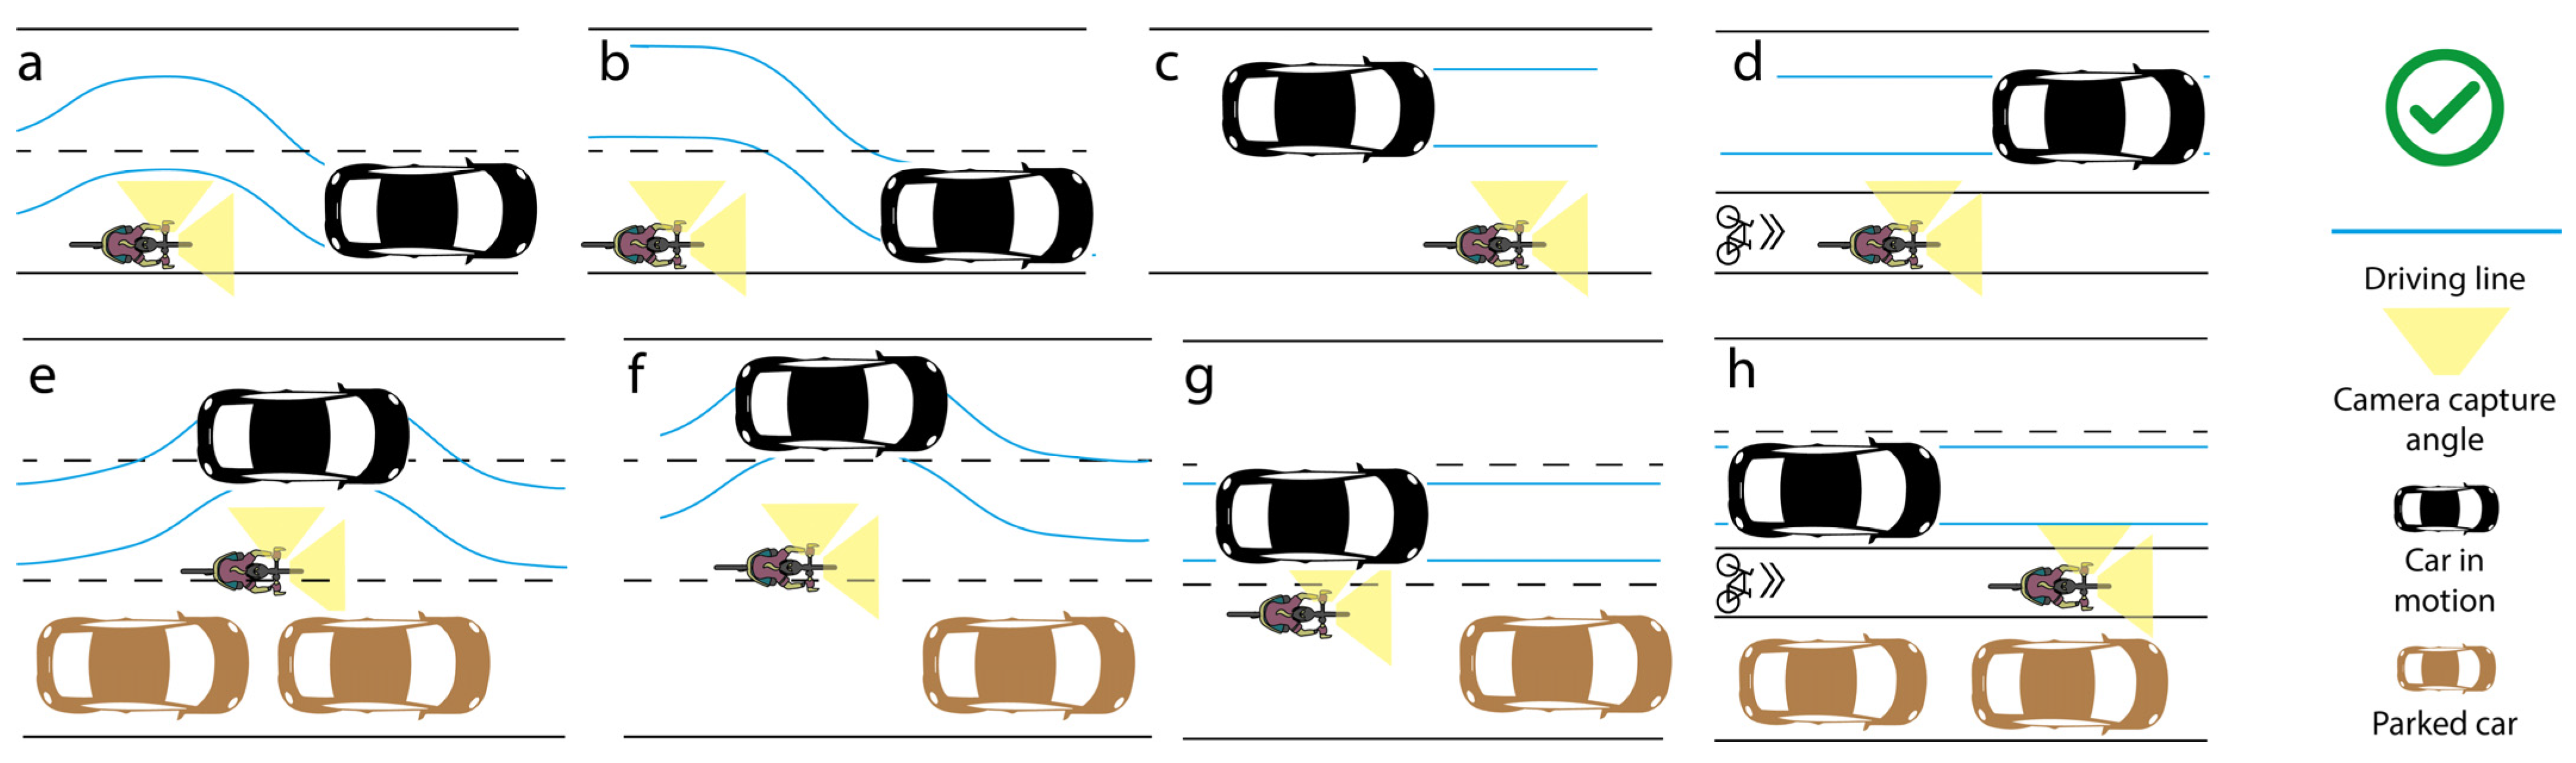
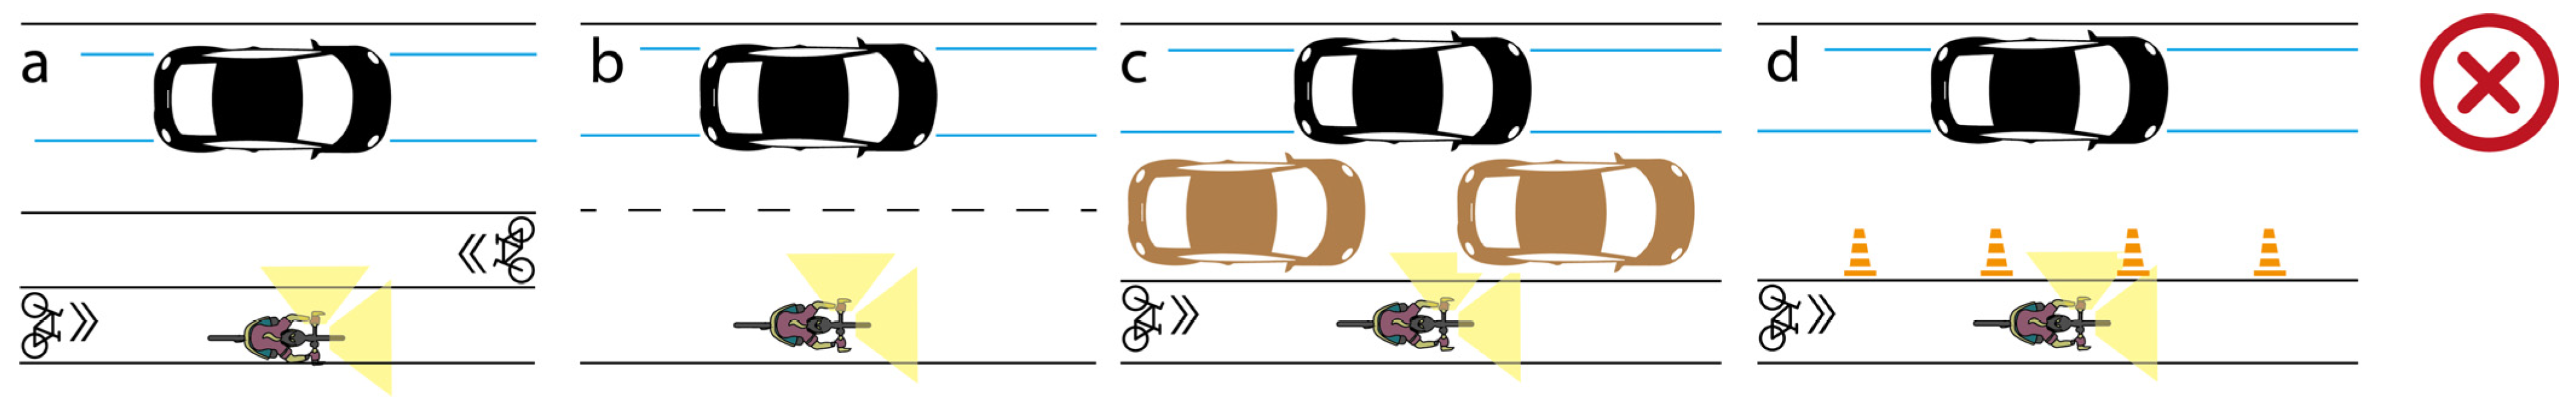
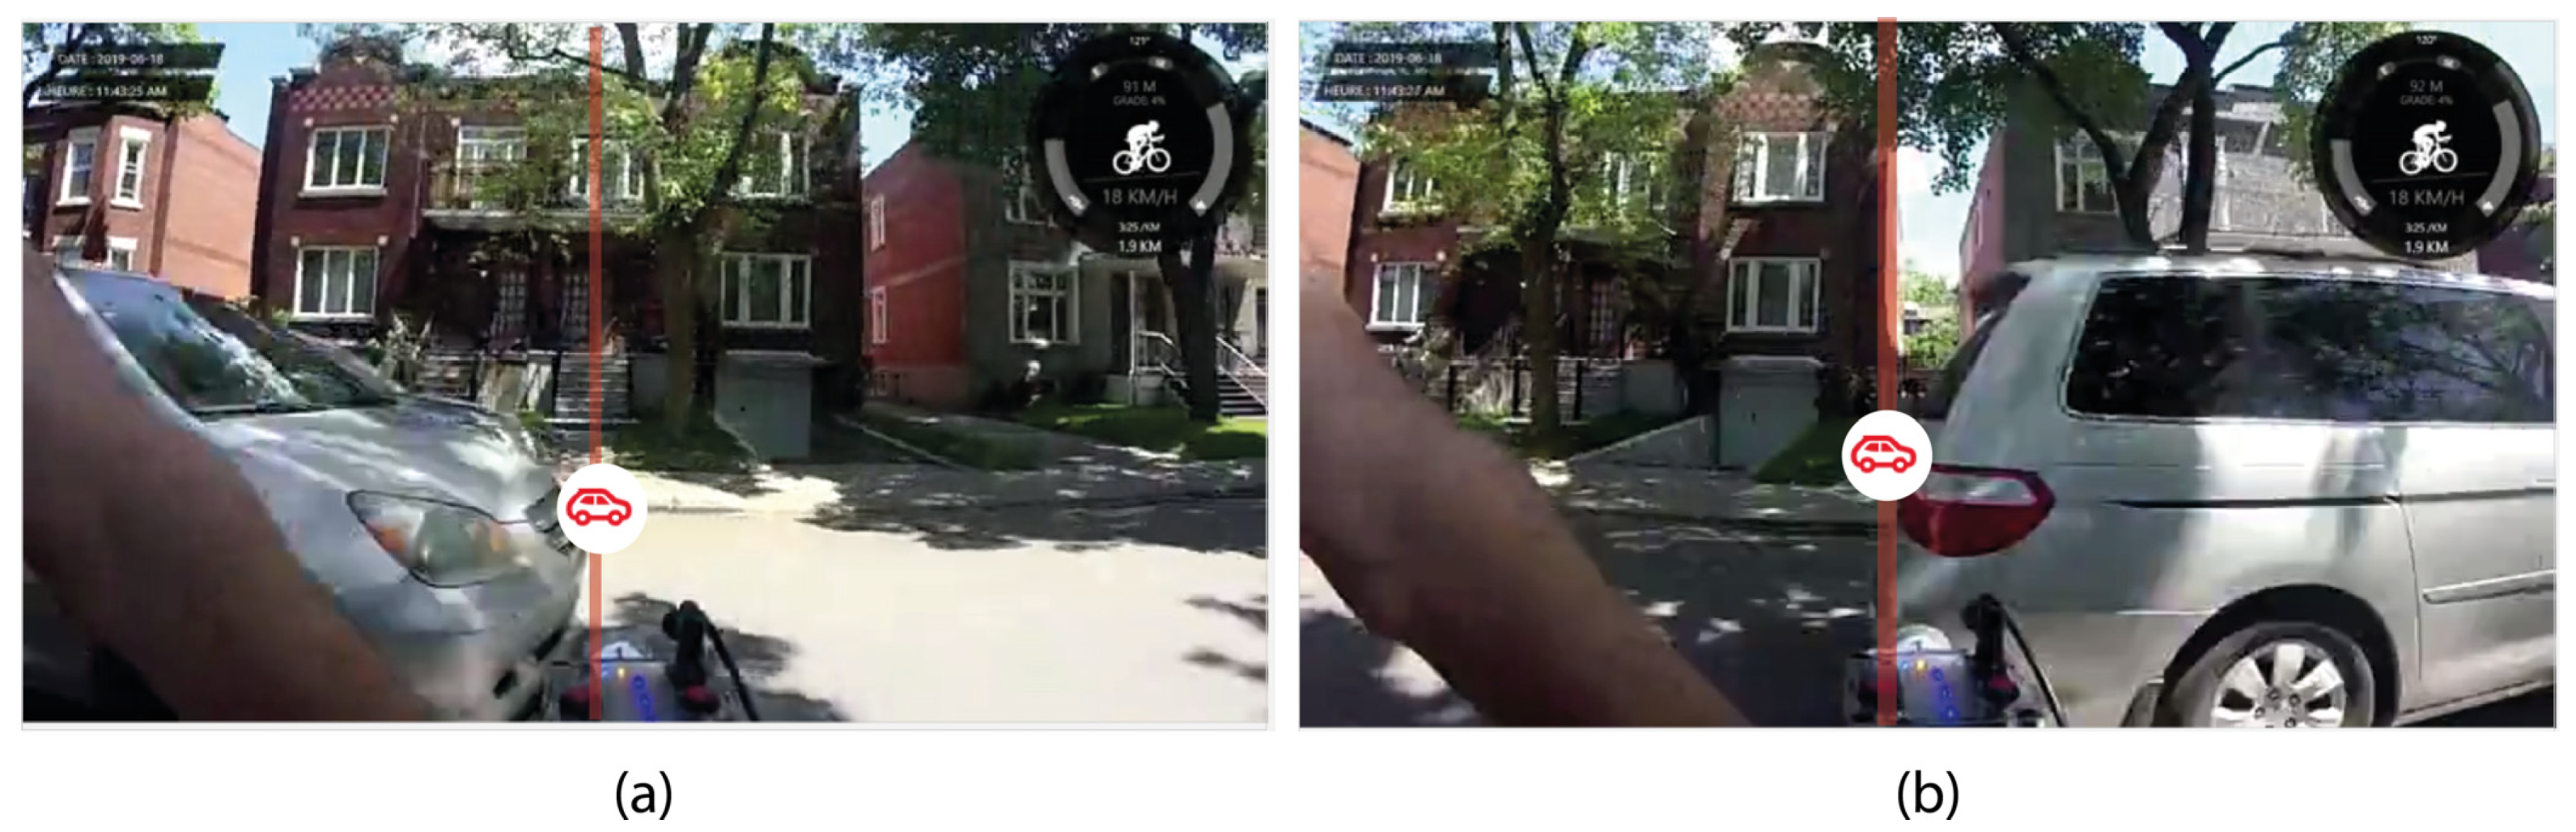
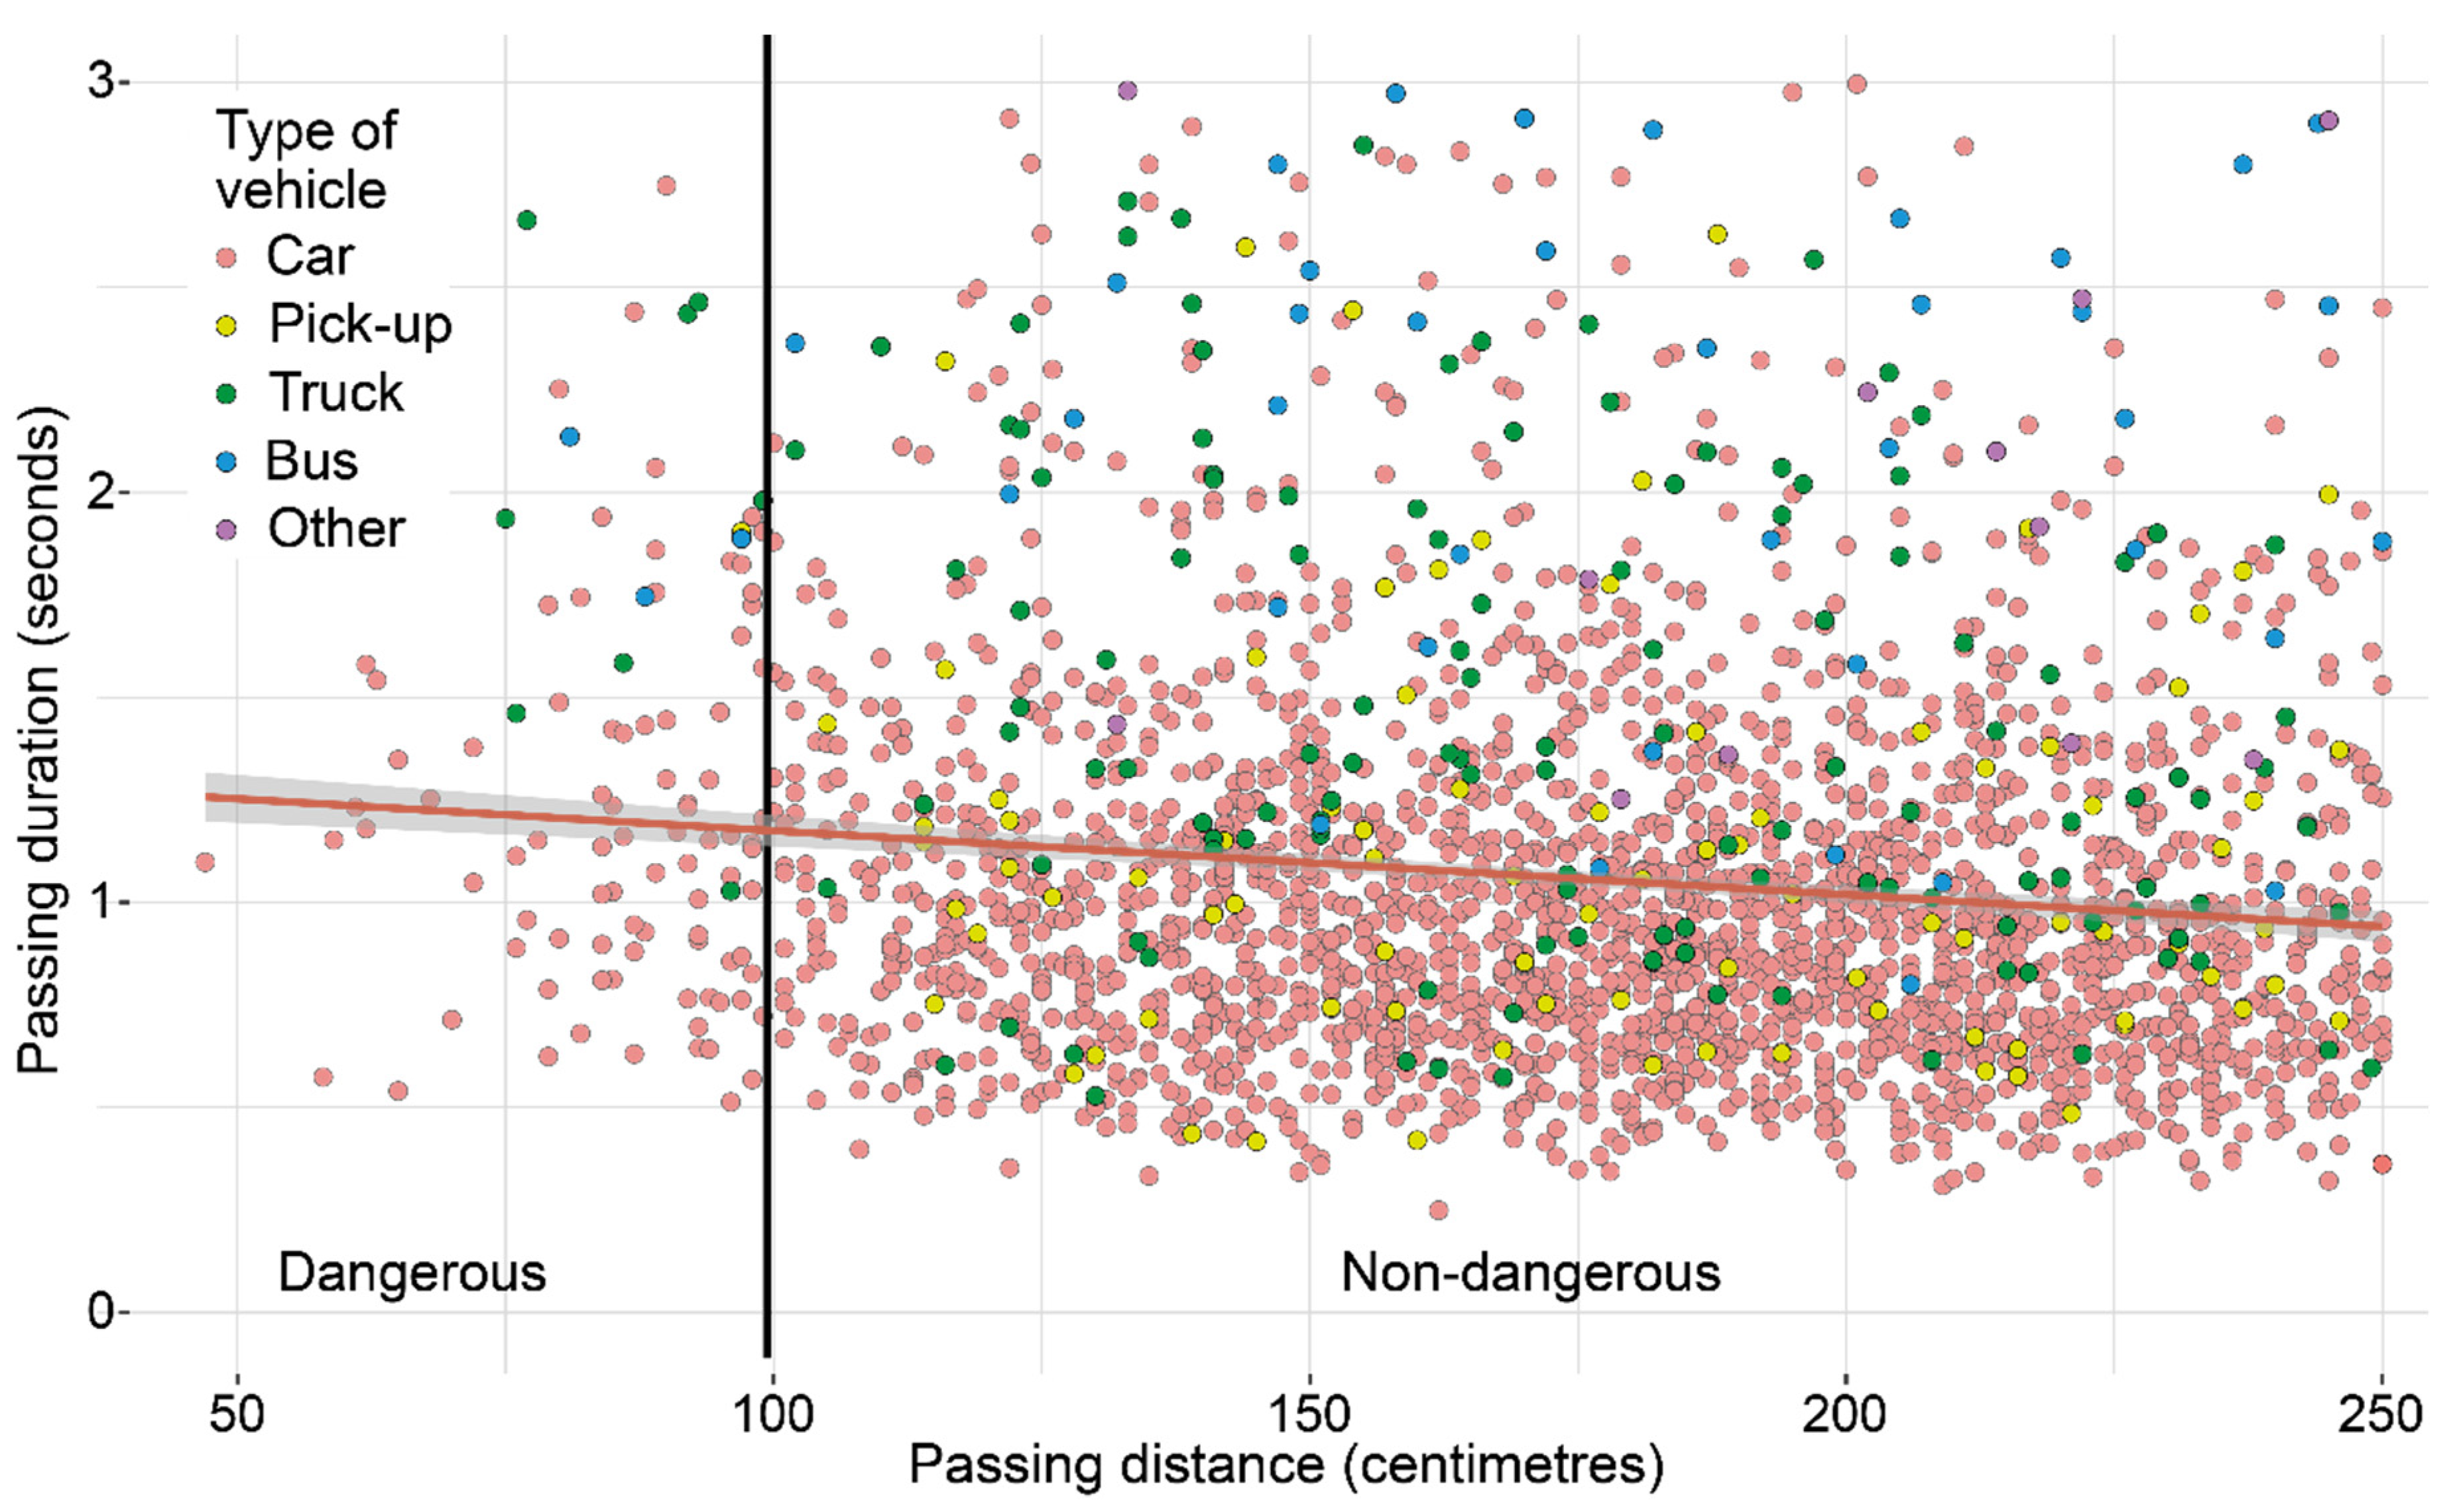
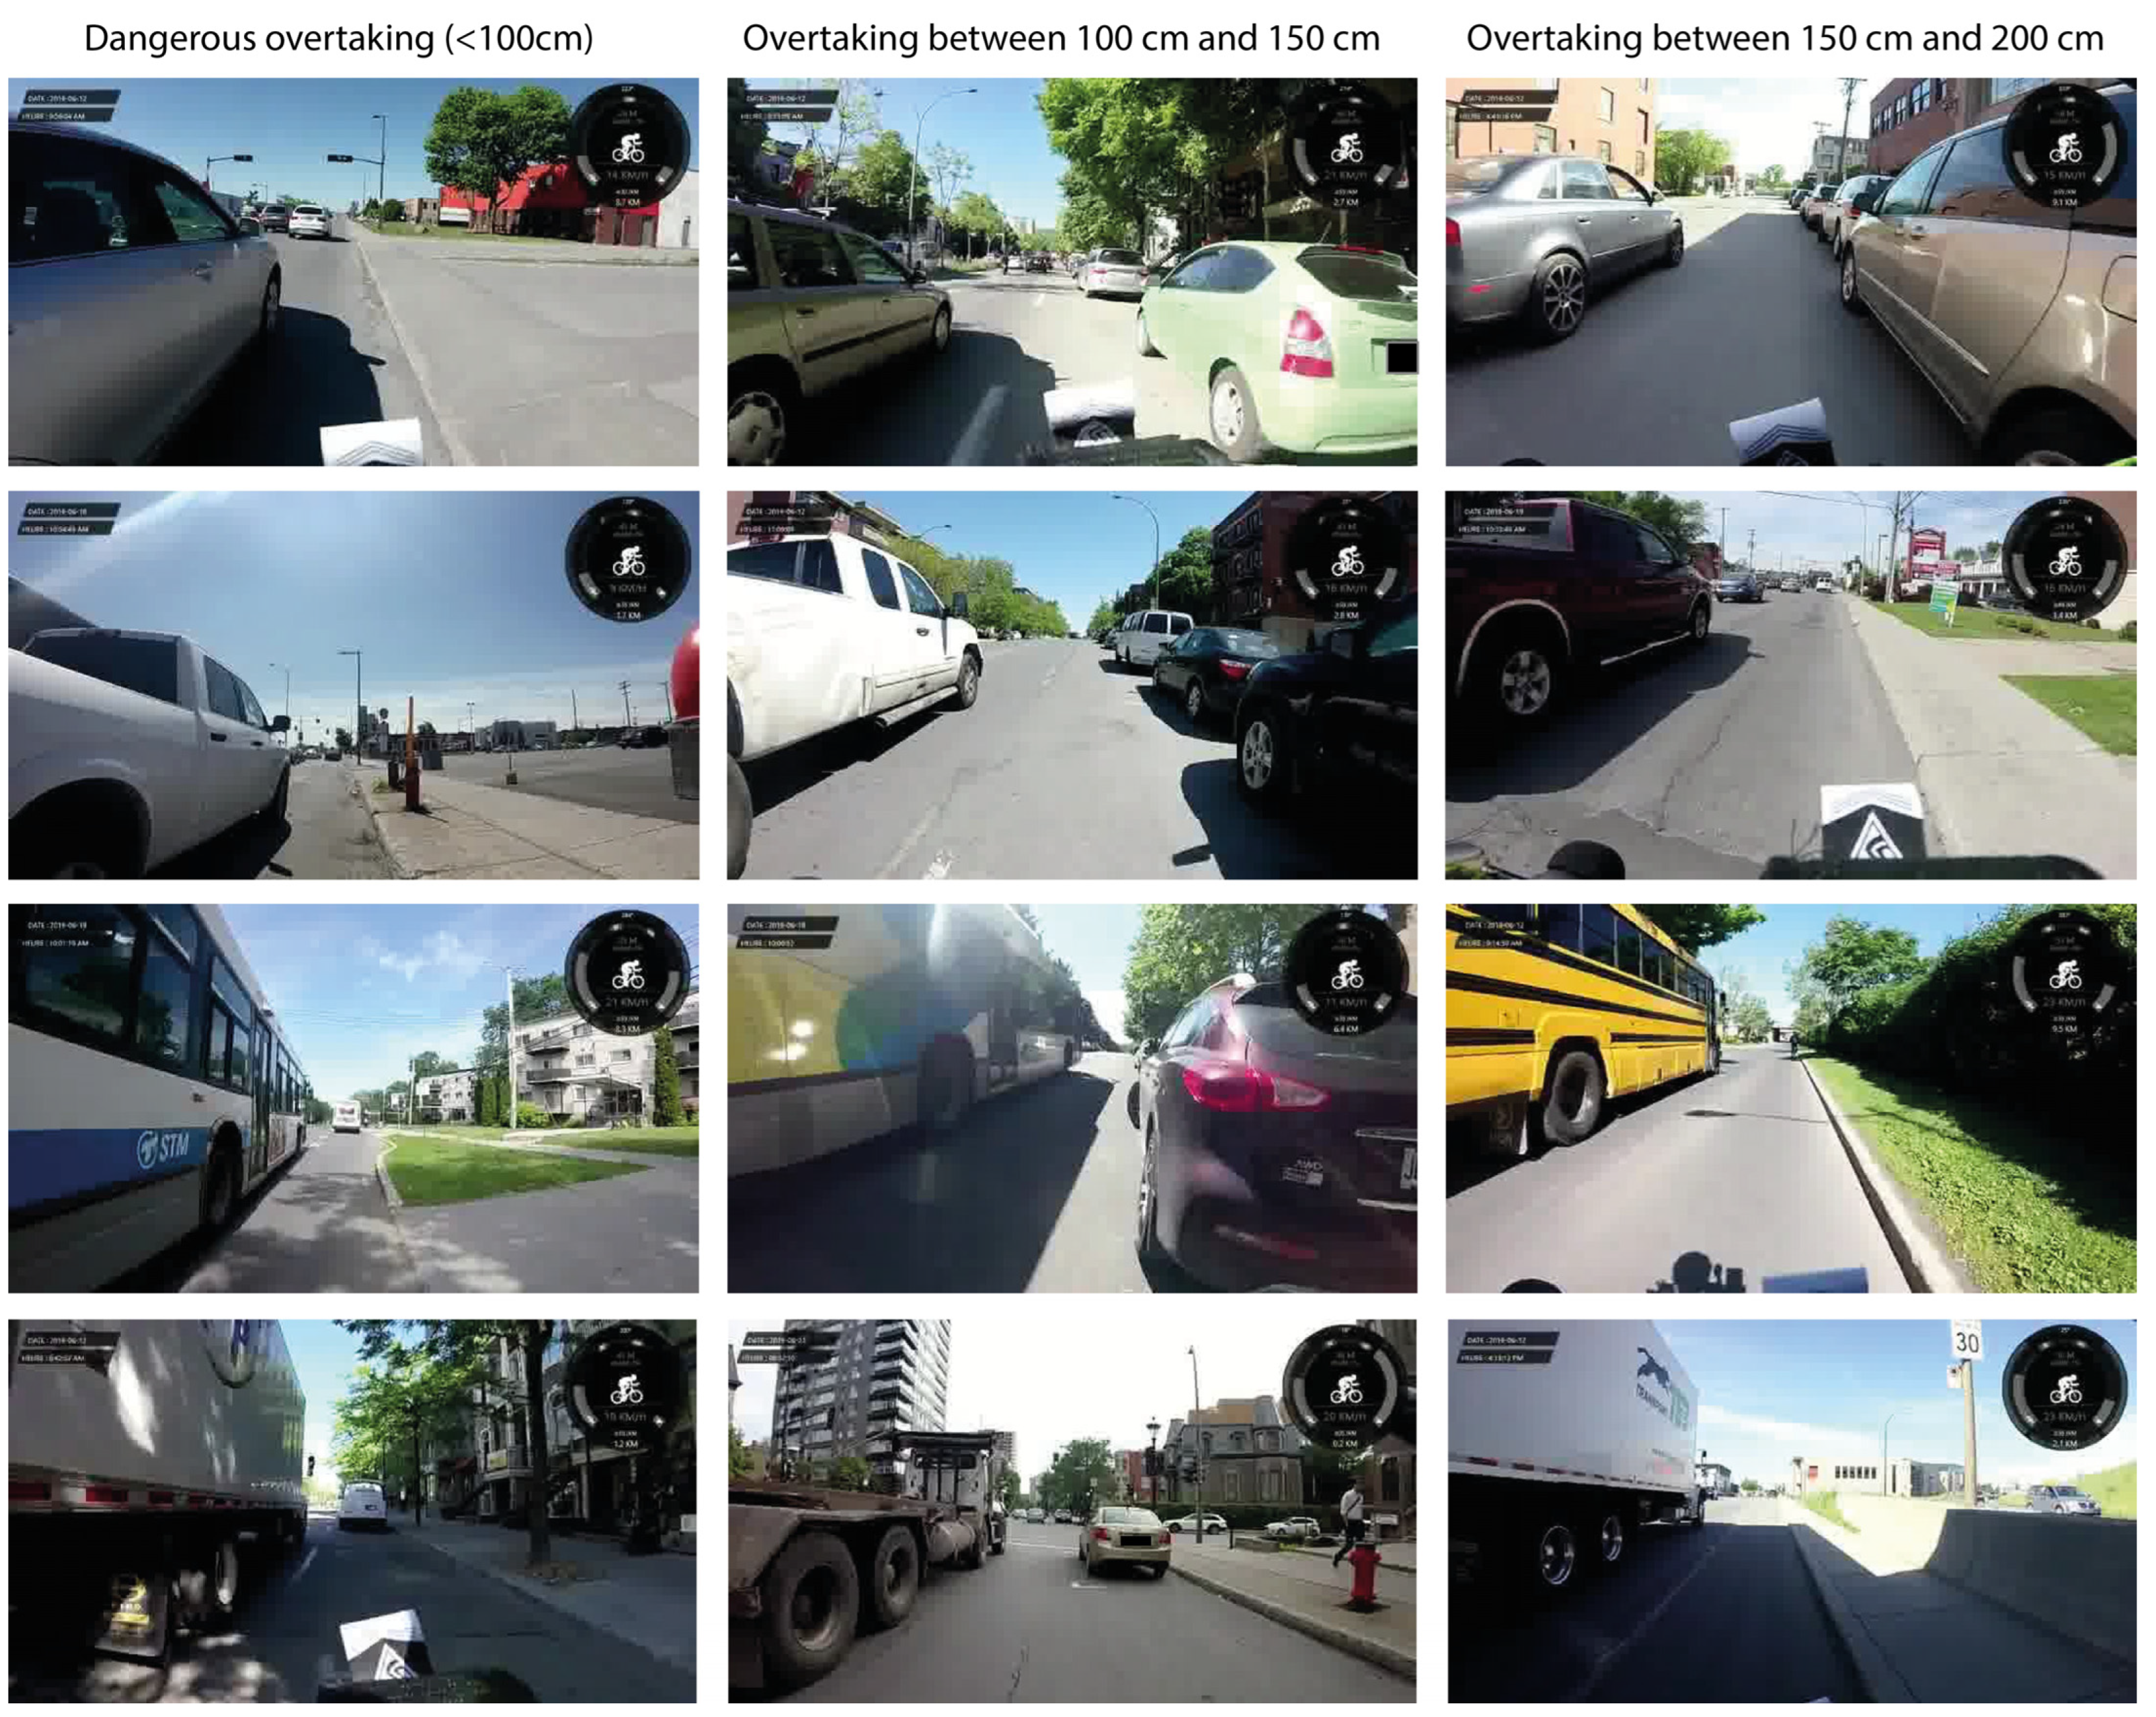
2.2. Operational Definition of Overtaking

An overtaking manoeuvre is the event that occurs when a motorized vehicle overtakes a moving cyclist. However, this manoeuvre largely depends on the morphology of the road in the urban environment. In order to establish overtakings through the analysis of videos, we defined a set of rules outlined in Figure 3. We consider that overtaking takes place when a vehicle overtaking a cyclist switches lane (Figure 3a,b), when there is an overtaking in the absence of a dividing line (Figure 3c), when there is overtaking parallel to a cycling lane (Figure 3d), and when there is overtaking in the presence of parked vehicles (Figure 3e–h).
Cases not considered to be overtakings are presented in Figure 4: there is no overtaking in the presence of a two-way traffic bike lane (Figure 4a), when a lane separates the cyclist and the overtaking vehicle (Figure 4b), when parked vehicles separate the cyclist and the overtaking vehicle (Figure 4c), and when urban property is present between the cyclist and the overtaking vehicle (Figure 4d); that is, traffic delineator posts, cones, bollards, or protective concrete.
Vifeco, an open-source software that allows us to annotate several features on videos [22], was used to characterize overtakings. Five categories were created in the software according to type of vehicle: car, truck, bus, pick-up, and others (see supplementary material). Starting with the operational definition of overtaking and the Vifeco software, two analysts were trained to identify and record overtakings (see supplementary material).
As for counting methodology, the analyst simultaneously observed frontal and lateral videos. Then, once an overtaking was identified, on the lateral video, he/she recorded the beginning and the end of the passing, as illustrated in Figure 5.
The two analysts dedicated approximately 230 h to video analyses, and they concluded with a global concordance index of 92.4% for 165 videos totalling 101 h. Finally, a third expert (professor of urban studies) reviewed the discordant cases with the two analysts to correct them.

2.3. Structuring of Data

Structuring of data includes five phases, all completed with version 4.0.2 of the R software [23]. First, lateral passings were exported from the Vifeco software in JSON format and imported in the R software, as distance measurements from Codaxus recorded in CSV format on Raspberry Pi. Second, these two data sources—passings and distance measurements—were then merged by exact time (timestamp). Third, by using the two respective observations for each passing manoeuver (beginning and end), it was possible to determine minimal distance and duration. Fourth, from the observations of the GPS watch, itinerary coordinates were mapped and map matched with OpenStreetMap. Thus, for each passing, we obtain the following information: types of roads (Key:highway on OpenStreetMap), types of bicycle paths (Key: cycleway on OpenStreetMap), and the cyclist’s speed recorded on the GPS watch. The last phase of structuring aims to identify the presence of parked vehicles and a bicycle lane during each overtaking. In order to do so, images and 20-s videoclips were exported for each event, then analyzed.

2.4. Modelling

A generalized additive logit model (GAM) was constructed using the mgcv package [24], with the LPD as the dependent dichotomous variable (less than one metre or not). The control variables and predictors are presented in Table 1.
Within the model, many factors are controlled to reduce their potential bias on predictor coefficients. First, it is possible that the probability of observing a dangerous overtaking is influenced by the type of cyclist, particularly as regards gender and their manner of riding. Secondly, the weekday, time of day, and geographical position are well-known factors of impact on traffic conditions [25,26,27,28] and therefore potentially on the probability of observing dangerous overtakings. Consequently, the participant and the weekday are introduced as linear effects, where time of day and geographical position are introduced as smooth effects (splines), as in recent works [29,30,31].
Once these factors controlled, one expects that riding on a major axis—such as primary and secondary roads—increases the likelihood of observing dangerous overtaking compared to a residential street [11,13,16,19]. As for the type of vehicle, we expect an increase in the probability of observing a dangerous overtaking in the presence of large vehicles (bus, truck and, less so, pick-up) compared to a car [11,13].
The presence of a bicycle lane could either increase the observance of a dangerous overtaking [11,15,18], or, on the contrary, reduce it [12,17]. It is possible that the duration of dangerous overtakings would be shorter [12]. Finally, the cyclist’s speed would reduce the probability of observing a dangerous overtaking. In compliance with the argument formulated by Apasnore et al. [10], cyclists riding more quickly are generally considered to be more experienced by motorized vehicle drivers who have a tendency to reduce distance during an overtaking manoeuvre.

3. Results

3.1. Descriptive Statistics

In total, 3591 overtaking manoeuvres were registered with an average of 176 cm, the minimal distance registered being 47 cm. Most lateral passings take place at a distance less than 250 cm (75%, n = 2632), and 3.1% took place at a distance inferior to 100 cm (n = 111), representing a dangerous event ratio for every 32 overtakings (Figure 1b).
Close to three-quarters of overtakings took place on secondary (40.5%) and tertiary (32.7%) roads. The types of vehicles most frequently involved in overtaking manoeuvres were cars (n = 3154, 78.8%), trucks (n = 131, 6.2%), pick-ups (n = 131, 3.6%), and buses (n = 62, 1.7%). Finally, more than one-quarter of overtakings took place in the presence of vehicles parked on the road (n = 988, 27.5%) and 13% when the cyclist was riding on a bicycle path or a shared lane.
Also, the ratios vary significantly according to type of vehicle. If, in total, there is a dangerous event every 32 overtakings for all vehicles combined, it is only 1 for 25 trucks and 1 for 12 buses. It must be noted, however, that overtaking occurrences are much lower for these two categories of vehicles.
As for road type, it is noted that there is 1 dangerous overtaking out of 16 on a primary road, compared to 1 out of 43 for a residential street or tertiary road. (Table 2). A variance analysis also demonstrated a statistically significant effect of types of lanes for LPD inferior to 250 cm (F(3, 2628) = 23.93, p < 0.001).
Table 3 presents the results associated with lateral passing duration, which on average is 1.082 s for all observations (Q1 = 0.723, Median = 0.908, Q3 = 1.299). Significant variations are observed according to type of vehicle (ANOVA: F(3, 3587) = 179.62, p < 0.001). Not surprisingly, longer vehicles have a tendency to take more time for an overtaking manoeuvre: on average, 2.318 for a bus, 1.759 for a truck, compared to 0.993 for a car.
Finally, dangerous overtakings (less than 1 m) would last longer than safe overtakings (more than 1 m): for all observations, 1.583 compared to 1.066, representing a difference of more than one-half second (0.517) (Table 3). These differences also vary according to road type: the difference between a dangerous overtaking or not is 0.393 for residential streets compared to 0.695 s for tertiary roads (Table 3).
Figure 6 illustrates this significant negative relation between duration and distance of lateral passing (Pearson’s Correlation Coefficient = −0.135, p < 0.001; Spearman’s rho = −0.149, p < 0.001). In summary, even if this correlation is weak, the shorter the LPD, the longer the duration of the lateral passing.
Finally, since the relative variable for duration of overtaking has a positively skewed distribution (Skewness = 4.97), it is introduced in the form of a logarithm in the GAM model.

3.2. Results of the Generalized Additive Logit Regression

The results are presented in Table 4. First, the fit statistics indicate that the model explains 16% of the total variance (Nagelkerke R2 = 0.159; Deviance explained = 0.142). It therefore allows to identify the variables having an impact on the probability of experiencing a dangerous overtaking, once many factors are controlled.

3.2.1. Control Variables Effects

A reading of the confidence intervals of the reports rated at 95% allows us to find that the weekday and the participant have no significant effect on the probability of experiencing a dangerous overtaking. As for splines, time of day is not significant (edf = 1.000, p = 0.616), contrary to geographical position (edf = 11, p < 0.001). This provides for two interesting findings. First, although traffic levels may vary during the day, nonetheless, the time of day does not seem to have an impact on the probability that a cyclist will experience a dangerous overtaking. Second, all things being equal, certain areas of the space under study are characterized by stronger or weaker probabilities of experiencing dangerous overtaking. However, these findings only apply to the collection period and our space under study. In other words, they cannot be generalized for the whole year or another city. Nevertheless, the fact that geographical position is significant demonstrates that this parameter, as is the case for the time of day, must be controlled in order to obtain non-biased coefficients for the other parameters (Table 4).

3.2.2. Effects off Factors Associated to Characteristics of the Road Network

Not surprisingly, the types of lanes greatly influence the probability of experiencing a dangerous overpassing. Compared to a residential or non classified street, this probability is five times higher on primary roads (OR = 5.608; CI[95%] = 2.518–12.491), and twice as high for secondary roads (OR = 2.430; CI[95%] = 1.223–4.827) (Table 4). On the other hand, the presence of a bicycle path has no significant effect on the probability of a dangerous overtaking. Finally, the presence of parked vehicles doubles the probability of experiencing a dangerous overtaking (OR = 1.954; CI[95%] = 2.220–3.129).

3.2.3. Effects of Factors Associated to Traffic

Contrary to our initial hypothesis, the type of vehicle has no influence. However, the logarithm for time required for overtaking is significant in the model (OR = 4.660; CI [95%] = 3.197–6.793), suggesting that a longer duration for overtaking is associated to a higher probability of dangerous overtaking.

3.2.4. Effects of Factors Associated to Cyclists

The cyclist’s speed is a significant factor in the model (OR = 0.945; CI[95%] = 0.902–0.991), but contrary to our initial hypothesis, it reduces the probability of observing a dangerous overtaking (Table 4).

4. Discussion

4.1. Limits of the Study

4.1.1. Accuracy of the Passing Duration Measurement

To assess the passing duration, two analysts recorded the beginning and the end of the passing on the lateral camera videos (see Section 2.2 and Figure 5). This novel approach allows us to estimate the duration of the overtaking manoeuvre; nonetheless, measurement errors may occur. Indeed, if the angle of the handlebars in relation to the vehicle is not exactly the same at the beginning and at the end of the overtaking manoeuvre, the duration measurement may be slightly distorted. In other words, to avoid the camera distortion, the angle must be 90 degrees at the beginning and at the end of the overtaking. Unfortunately, we did not conduct a data validation test to estimate and correct these potential measurement errors. However, we assume that these errors are randomly distributed in the dataset; specifically, it is likely that these errors do not occur more during dangerous overtakings than during non-dangerous overtakings.

4.1.2. Real-Time Traffic Indicators

Although the type of axis—a variable retained in this study—is considered a proxy for traffic density and width of the street [32], it would be appropriate to include traffic measures in real time for future research. These indicators could be introduced in the model in the form of splines since we may suppose that traffic density does not linearly influence the probability of an overtaking being dangerous. Although complex, resorting to methods of image detection and computer vision [33,34] would certainly allow the automation of camera video analyses to create these indicators. As a second limit, the effect of oncoming vehicles on LPD was not explored in our study, as done by several authors [14,15,16,19].

4.2. Contribution to Academic Knowledge

During our cycling data collection on the island of Montréal, we found that 1 overtaking out of 32 was dangerous. This ratio is much weaker than that reported in a study in Victoria, Australia (1 of 17) [11]. However, these two ratios should be compared with caution since the two collection methods are different. In the Australian study, 60 participants were recruited who cycled during their usual trips for one to two weeks. In our case, the mobile collection was extensive and aimed to cover the whole island of Montréal from 9 a.m. to 6 p.m. for five days.
Our results sometimes refute and at other times corroborate those of previous studies. There again, these comparisons must be interpreted with caution due to methodological designs and geographical contexts that differ greatly from one study to the next. On the one hand, contrary to the results of previous studies [11,12,13,18], the type of vehicle has no influence on the probability that an overtaking is dangerous, nor does the presence of a bike lane. On the other hand, our results corroborate other studies showing that traffic density [10,14,15,16,19,21] and parked vehicles decrease LPD [11]. Indeed, cycling on a primary or secondary route (compared to a residential street) and in the presence of parked vehicles quite significantly increases the probability that a cyclist experiences a dangerous overtaking.
This study also sheds light on two little-known results to date. First, the probability of a dangerous overtaking may vary nonlinearly in time and space. In order to do so, as demonstrated in this study, having recourse to generalized additive models (GAM) is particularly appropriate to control these effects. Therefore, in later modelling studies of dangerous overtakings or any other conflict involving different road users, control of space and time should be generalized. Secondly, in Montréal, dangerous lateral passings are associated with longer durations, certainly contributing to an increase of the cyclist’s level of insecurity. This would require being validated or refuted with further studies in other Canadian cities and elsewhere in the world.

4.3. Implications for Decision-Makers

In light of the results, many recommendations can be formulated. Providing a bicycle lane alongside parking places does not seem to be a safe solution since it enhances the possibility of both dangerous overtakings and dooring crash (unless there is a buffer space between the bicycle lane and the parking spaces).
Contrary to other studies [11,13], we did not find significant effects according to type of vehicle on LPD. However, the duration of a lateral passing is significantly longer for trucks and buses, and also during unsafe passings (for all types of vehicles). As a reminder, regulatory minimal distances are 1 m (speed inferior or equal to 50 km) and 1.5 m (speed superior to 50 km/h) in the Province of Québec. It is therefore legitimate to question whether these regulatory distances should be lengthened for heavy vehicles. As an illustration, Figure 7 presents several overtaking manoeuvres according to type of vehicle and distance intervals. Of course, an overtaking with less than a metre by a heavy vehicle (truck and bus) is certainly considered to make a cyclist feel much more insecure compared to being overtaken by an automobile. Although it is regulatory, it is also probable that an overtaking between 100 cm and 150 cm by a truck or a bus is deemed to be unsafe. As we have demonstrated, LPD is influenced by many variables relative to network and road traffic; it is therefore important to question these regulatory limits in order to establish safer riding conditions for cyclists in the future.

5. Conclusions

Within the framework of this quasi-naturalistic study on overtaking of cyclists by motorized vehicles in Montréal, one event in 32 overtakings was considered dangerous (less than one metre where the speed limit is 50 km/h or less), in compliance with current regulations in Québec. The results revealed that three major factors positively and significantly influence the probability that a cyclist will experience a dangerous overtaking: riding on a major road (primary or secondary route), the presence of parked vehicles, and the duration of the overtaking. However, compared to previous studies, the type of vehicle, the presence of a bike lane, and the participant had no significant effects. In light of these results, it would be appropriate to develop awareness campaigns for drivers with regard to distancing rules and risks involved in an unsafe overtaking. Also, to improve cyclists’ security, it would be useful to provide infrastructures separating cyclists from road traffic and away from parked vehicles.
On the methodological side, it is worth noting that these types of studies are relatively complex to implement since they are based on many different devices (commercial or home-made distance sensor, GPS, and action camera) that are quite expensive. The collected data set must then be merged and matched to a road network. The development of a low-cost sensor including a distance sensor (acoustic or lidar), a GPS, a camera and a microphone would certainly contribute to the democratization of these types of studies in the future.

Supplementary Materials

The following are available online at https://www.mdpi.com/article/10.3390/safety8010016/s1, Guide to Counting Overtaking Manoeuvres.

Author Contributions

Conceptualization, A.H. and P.A.; Methodology, data structuration and statistical analyses, A.H. and P.A.; writing—original draft preparation, A.H. and P.A.; writing—review and editing, A.H. and P.A.; supervision, project administration, funding acquisition: P.A. All authors have read and agreed to the published version of the manuscript.

Funding

This study was financially supported by the Canada Research Chair in Environmental Equity (950-230813) and the Social Sciences and Humanities Research Council of Canada (Insight Grant # 435-2019-0796).

Institutional Review Board Statement

This study has been approved by the Research Ethics Board of Institut national de la recherche scientifique (project no. CER 19-509).

Informed Consent Statement

Informed consent was obtained from all subjects involved in the study.

Acknowledgments

Special thanks to the cyclists who were involved in the data collection, Isabelle Boisvert Chastenay and Vincent Jarry for her insights on the first draft.

Conflicts of Interest

The authors declare no conflict of interest.

References

  1. Garrard, J.; Rissel, C.; Bauman, A. City Cycling; MIT Press: Cambridge, MA, USA, 2012; pp. 31–56. [Google Scholar]
  2. Buehler, R.; Pucher, J. Trends in Walking and Cycling Safety: Recent Evidence from High-Income Countries, with a Focus on the United States and Germany. Am. J. Public Health 2017, 107, 281–287. [Google Scholar] [CrossRef] [PubMed]
  3. Pucher, J.; Dijkstra, L. Promoting Safe Walking and Cycling to Improve Public Health: Lessons from the Netherlands and Germany. Am. J. Public Health 2003, 93, 1509–1516. [Google Scholar] [CrossRef]
  4. Furth, P.G. Bicycling infrastructure for mass cycling: A transatlantic comparison. In City Cycling; MIT Press: Cambridge, MA, USA, 2012; pp. 105–140. [Google Scholar]
  5. Vélo Québec L’état du vélo à Montréal en 2020. Available online: https://www.velo.qc.ca/wp-content/uploads/2021/06/vq-edv2020-fr.pdf (accessed on 26 February 2021).
  6. Houde, M.; Apparicio, P.; Séguin, A.-M. A Ride for Whom: Has Cycling Network Expansion Reduced Inequities in Accessibility in Montreal, Canada? J. Transp. Geogr. 2018, 68, 9–21. [Google Scholar] [CrossRef]
  7. Montréal Collisions Routières—Jeu de Données. Available online: https://donnees.montreal.ca/ville-de-montreal/collisions-routieres (accessed on 2 February 2021).
  8. Beck, B.; Stevenson, M.; Newstead, S.; Cameron, P.; Judson, R.; Edwards, E.R.; Bucknill, A.; Johnson, M.; Gabbe, B. Bicycling Crash Characteristics: An in-Depth Crash Investigation Study. Accid. Anal. Prev. 2016, 96, 219–227. [Google Scholar] [CrossRef] [PubMed]
  9. SAAQ Partage de la Route. Available online: https://saaq.gouv.qc.ca/securite-routiere/moyens-deplacement/auto/partage-de-la-route/ (accessed on 2 February 2021).
  10. Apasnore, P.; Ismail, K.; Kassim, A. Bicycle-Vehicle Interactions at Mid-Sections of Mixed Traffic Streets: Examining Passing Distance and Bicycle Comfort Perception. Accid. Anal. Prev. 2017, 106, 141–148. [Google Scholar] [CrossRef] [PubMed]
  11. Beck, B.; Chong, D.; Olivier, J.; Perkins, M.; Tsay, A.; Rushford, A.; Li, L.; Cameron, P.; Fry, R.; Johnson, M. How Much Space Do Drivers Provide When Passing Cyclists? Understanding the Impact of Motor Vehicle and Infrastructure Characteristics on Passing Distance. Accid. Anal. Prev. 2019, 128, 253–260. [Google Scholar] [CrossRef] [PubMed]
  12. Chuang, K.-H.; Hsu, C.-C.; Lai, C.-H.; Doong, J.-L.; Jeng, M.-C. The Use of a Quasi-Naturalistic Riding Method to Investigate Bicyclists’ Behaviors When Motorists Pass. Accid. Anal. Prev. 2013, 56, 32–41. [Google Scholar] [CrossRef] [PubMed]
  13. Debnath, A.K.; Haworth, N.; Schramm, A.; Heesch, K.C.; Somoray, K. Factors Influencing Noncompliance with Bicycle Passing Distance Laws. Accid. Anal. Prev. 2018, 115, 137–142. [Google Scholar] [CrossRef] [PubMed]
  14. Dozza, M.; Schindler, R.; Bianchi-Piccinini, G.; Karlsson, J. How Do Drivers Overtake Cyclists? Accid. Anal. Prev. 2016, 88, 29–36. [Google Scholar] [CrossRef] [PubMed] [Green Version]
  15. Feng, F.; Bao, S.; Hampshire, R.C.; Delp, M. Drivers Overtaking Bicyclists—An Examination Using Naturalistic Driving Data. Accid. Anal. Prev. 2018, 115, 98–109. [Google Scholar] [CrossRef] [PubMed]
  16. Llorca, C.; Angel-Domenech, A.; Agustin-Gomez, F.; Garcia, A. Motor Vehicles Overtaking Cyclists on Two-Lane Rural Roads: Analysis on Speed and Lateral Clearance. Saf. Sci. 2017, 92, 302–310. [Google Scholar] [CrossRef]
  17. Mehta, K.; Mehran, B.; Hellinga, B. Evaluation of the Passing Behavior of Motorized Vehicles When Overtaking Bicycles on Urban Arterial Roadways. Transp. Res. Rec. 2015, 2520, 8–17. [Google Scholar] [CrossRef]
  18. Parkin, J.; Meyers, C. The Effect of Cycle Lanes on the Proximity between Motor Traffic and Cycle Traffic. Accid. Anal. Prev. 2010, 42, 159–165. [Google Scholar] [CrossRef] [PubMed] [Green Version]
  19. Shackel, S.C.; Parkin, J. Influence of Road Markings, Lane Widths and Driver Behaviour on Proximity and Speed of Vehicles Overtaking Cyclists. Accid. Anal. Prev. 2014, 73, 100–108. [Google Scholar] [CrossRef] [PubMed]
  20. Walker, I. Drivers Overtaking Bicyclists: Objective Data on the Effects of Riding Position, Helmet Use, Vehicle Type and Apparent Gender. Accid. Anal. Prev. 2007, 39, 417–425. [Google Scholar] [CrossRef] [PubMed]
  21. Walker, I.; Garrard, I.; Jowitt, F. The Influence of a Bicycle Commuter’s Appearance on Drivers’ Overtaking Proximities: An on-Road Test of Bicyclist Stereotypes, High-Visibility Clothing and Safety Aids in the United Kingdom. Accid. Anal. Prev. 2014, 64, 69–77. [Google Scholar] [CrossRef] [PubMed] [Green Version]
  22. Apparicio, P.; Maignan, D.; Gelb, J. VIFECO: An Open-Source Software for Counting Features on a Video. J. Open Res. Softw. 2021, 9, 1–9. [Google Scholar] [CrossRef]
  23. R Core Team. R: A Language and Environment for Statistical Computing; R Foundation for statistical computing: Vienna, Austria, 2021. [Google Scholar]
  24. Wood, S.N. Fast Stable Restricted Maximum Likelihood and Marginal Likelihood Estimation of Semiparametric Generalized Linear Models. J. R. Stat. Soc. Ser. B (Stat. Methodol.) 2011, 73, 3–36. [Google Scholar] [CrossRef] [Green Version]
  25. Włodarek, P.; Olszewski, P. Traffic Safety on Cycle Track Crossings—Traffic Conflict Technique. J. Transp. Saf. Secur. 2020, 12, 194–209. [Google Scholar] [CrossRef]
  26. Carvajal, G.A.; Sarmiento, O.L.; Medaglia, A.L.; Cabrales, S.; Rodríguez, D.A.; Quistberg, D.A.; López, S. Bicycle Safety in Bogotá: A Seven-Year Analysis of Bicyclists’ Collisions and Fatalities. Accid. Anal. Prev. 2020, 144, 105596. [Google Scholar] [CrossRef]
  27. Rahman, Z.; Mattingly, S.; Kawadgave, R.; Nostikasari, D.; Roeglin, N.; Casey, C.; Johnson, T. Using Crowd Sourcing to Locate and Characterize Conflicts for Vulnerable Modes. Accid. Anal. Prev. 2019, 128, 32–39. [Google Scholar] [CrossRef] [PubMed]
  28. Schleinitz, K.; Petzoldt, T.; Franke-Bartholdt, L.; Krems, J.; Gehlert, T. Conflict Partners and Infrastructure Use in Safety Critical Events in Cycling—Results from a Naturalistic Cycling Study. Transp. Res. Part F Traffic Psychol. Behav. 2015, 31, 99–111. [Google Scholar] [CrossRef]
  29. Apparicio, P.; Gelb, J. Cyclists’ Exposure to Road Traffic Noise: A Comparison of Three North American and European Cities. In Acoustics; Multidisciplinary Digital Publishing Institute: Basel, Switzerland, 2020; Volume 2, pp. 73–86. [Google Scholar]
  30. Gelb, J.; Apparicio, P. Modelling Cyclists’ Multi-Exposure to Air and Noise Pollution with Low-Cost Sensors—The Case of Paris. Atmosphere 2020, 11, 422. [Google Scholar] [CrossRef] [Green Version]
  31. Gelb, J.; Apparicio, P. Noise Exposure of Cyclists in Ho Chi Minh City: A Spatio-Temporal Analysis Using Non-Linear Models. Appl. Acoust. 2019, 148, 332–343. [Google Scholar] [CrossRef]
  32. Gelb, J.; Apparicio, P. Cyclists’ Exposure to Atmospheric and Noise Pollution: A Systematic Literature Review. Transp. Rev. 2021, 41, 742–765. [Google Scholar] [CrossRef]
  33. Redmon, J.; Divvala, S.; Girshick, R.; Farhadi, A. You Only Look Once: Unified, Real-Time Object Detection. In Proceedings of the IEEE Conference on Computer Vision and Pattern Recognition, Las Vegas, NV, USA, 27–30 June 2016; pp. 779–788. [Google Scholar]
  34. Li, G.; Song, Z.; Fu, Q. A New Method of Image Detection for Small Datasets under the Framework of YOLO Network. In Proceedings of the 2018 IEEE 3rd Advanced Information Technology, Electronic and Automation Control Conference (IAEAC), Chongqing, China, 12–14 October 2018; IEEE: Piscataway, NJ, USA, 2018; pp. 1031–1035. [Google Scholar]
Figure 1. Data collected (a) Trips completed by the four participants; (b) dangerous overtakings or not.
Safety 08 00016 g001
Figure 2. The devices used for collection, attached to the bicycle.
Safety 08 00016 g002
Figure 3. Cases considered to be overtakings. (a) and (b) overtaking by switching lanes; (c) overtaking in the absence of a dividing line; (d) overtaking along a bike lane; (eh) overtaking in the presence of parked vehicles.
Safety 08 00016 g003
Figure 4. Cases not considered as overtakings (a) overtaking in a bidirectional lane; (b) overtaking with a lane separating the cyclist from the vehicle; (c) overtaking alongside parked cars; (d) overtaking alongside a protected bicycle lane.
Safety 08 00016 g004
Figure 5. Characterization of a lateral passing on Vifeco. (a) beginning of passing aligned with the device for distance measurement; (b) end of passing.
Safety 08 00016 g005
Figure 6. Overtaking in distance (less than 250 cm) and time (less than 3 s).
Safety 08 00016 g006
Figure 7. Different overtakings according to types of vehicles and LPD.
Safety 08 00016 g007
Table 1. Model specifications.
VariableNameModalityDimensionFamily
OutcomeType of overtakingDangerous (<100 cm),
Non-dangerous (≥100 cm)
-Binomial
ControlParticipantCyclist IDFCCategorical
Day of collection12, 17, 18, 19, 21 (June 2019)FTCategorical
Time of the dayNumber of minutes since 08:00FTContinuous
Geographical positionGeographic coordinates (x,y)FTContinuous
PredictorType of roadPrimary road, secondary road, tertiary road,
residential street and unclassified street
FRCategorical
Bike lane Presence. AbsenceFRBinomial
On-street parked vehiclesPresence. AbsenceFRBinomial
Type of vehicleCar, truck, bus, pick-up and otherFTCategorical
Passing durationLogarithm of time between the end and the beginning of the lateral passing (in seconds)FTContinuous
Cyclist speedSpeed at the moment of lateral passing (km/h)FCContinuous
FC: Factors associated to cyclists; FR: Factors associated with the road network; FT: Factors associated to traffic.
Table 2. Frequency of overtaking.
VariableLateral PassingPassing Distance
Less than 250 cm
Passing Distance
250 and Over
All<100 cmRation%MeanSDn%
Primary road372241625641584611631.2
Secondary road14544830106616.51734238826.7
Tertiary road1174274383712.91804033728.7
Residential street51912434216.5180399818.9
Unclassified street720 520.8195352027.8
Cycle lane4395883405.2181369922.6
Shared lane 28128240.417735414.3
On-street parked vehicles988372785113.116816813713.9
Car31549434231535.71764283926.6
Pick-up131344951.5176433627.5
Truck2239251562.4171436730
Bus62512500.8172491219.4
Other210 160.218939523.8
Total359111132263273.31764295926.7
Table 3. Duration of lateral passings (dangerous or not) in seconds.
All PassingsDangerous Passing
Less than 100 cm
Non-Dangerous Passing
100 cm and Over
Diff.
VariableMeanMedianMeanMedianMeanMedianMean
Primary road1.0180.8671.5121.5150.9840.8490.528
Secondary road1.0990.9241.5481.2381.0840.9160.464
Tertiary road1.0140.8561.6931.1610.9980.8500.695
Residential street1.2401.0801.6241.2901.2311.0750.393
Unclassified street1.0450.821----1.0450.821--
Bicycle lane1.1320.9702.5382.1361.1160.9681.422
Shared lane 1.3501.1443.8923.8921.2561.1362.636
On-street parked vehicles1.1360.9691.7881.4881.1100.9540.678
Car0.9930.8761.3841.1570.9810.8680.403
Pick-up1.2010.9723.2493.8581.1530.9672.096
Truck1.7561.3442.1421.9801.7391.3290.403
Bus2.3182.1803.3362.1362.2282.1801.108
Other2.9541.916----2.9541.916--
Total1.0820.9081.5831.2361.0660.9000.517
Table 4. Results of the generalized additive logit model.
VariablesOR 1OR CI (95%) 2
Intercept0.0250.0080.078
Control variables
 Wednesday, June 12 (ref.)Ref.
 Monday, June 170.6060.2931.251
 Tuesday, June 180.8230.4351.556
 Wednesday, June 190.7140.3861.321
 Friday, June 210.7110.3441.471
 Cyclist 1 (male)Ref.
 Cyclist 2 (male)1.3300.6392.770
 Cyclist 3 (female)1.6530.8603.179
 Cyclist 4 (male)1.7350.9113.305
SplinesEdf 3P
 Time of the day1.0000.616
 Geographical position11.0020.004
Predictor variablesOR 1OR CI (95%) 2
 Residential or unclassified street
Unclassified
Ref.
 Primary road5.6082.51812.491
 Secondary road2.4301.2234.827
 Tertiary road1.4240.6872.951
 Bicycle lane0.4230.1661.078
 On-street parked vehicle1.9541.2203.129
 CarRef.
 Pick-up0.5550.1691.827
 Truck + Other0.4720.2151.036
 Bus1.1170.3833.258
 Log(passing duration)4.6603.1976.793
 Cyclist speed (km/h)0.9450.9020.991
Fit statistics
 n3591
 R 2 Nagelkerke0.159
 Deviance explained0.142
1 OR: Odds ratio. 2 CI: confidence interval. Statistically significant values are shown in bold.3 edf: estimated degrees of freedom.
Publisher’s Note: MDPI stays neutral with regard to jurisdictional claims in published maps and institutional affiliations.

