
Exploring Visitors’ Visual Behavior Using Eye-Tracking: The Case of the “Studiolo Del Duca”


Abstract
:1. Introduction
2. Materials and Methods
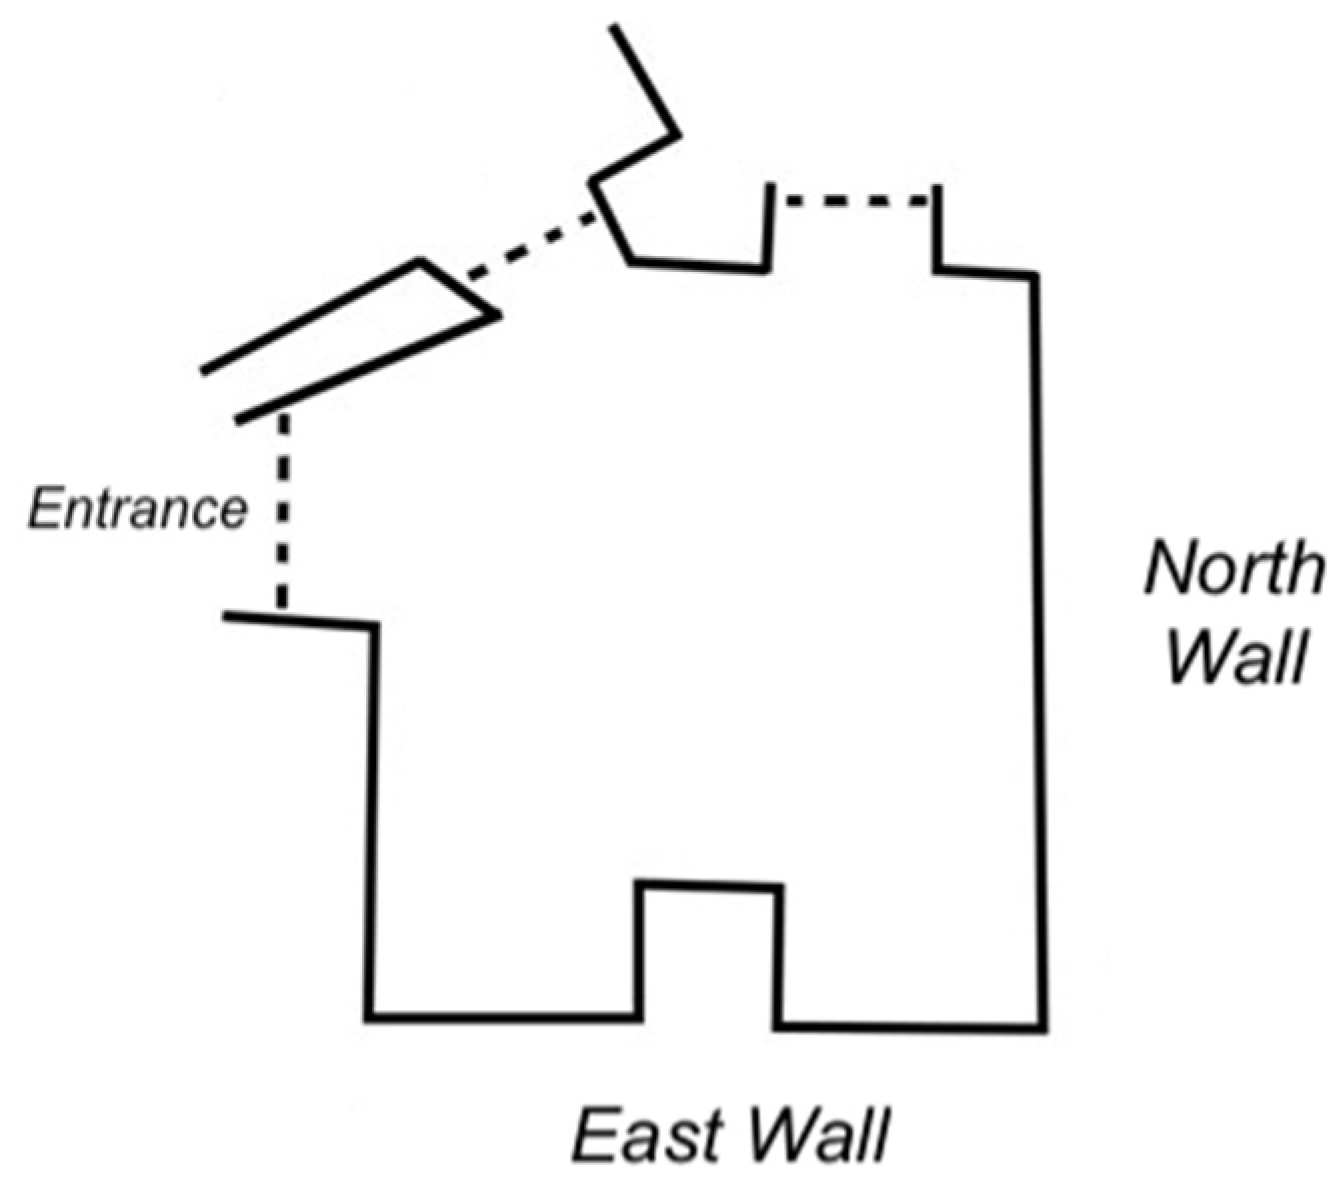
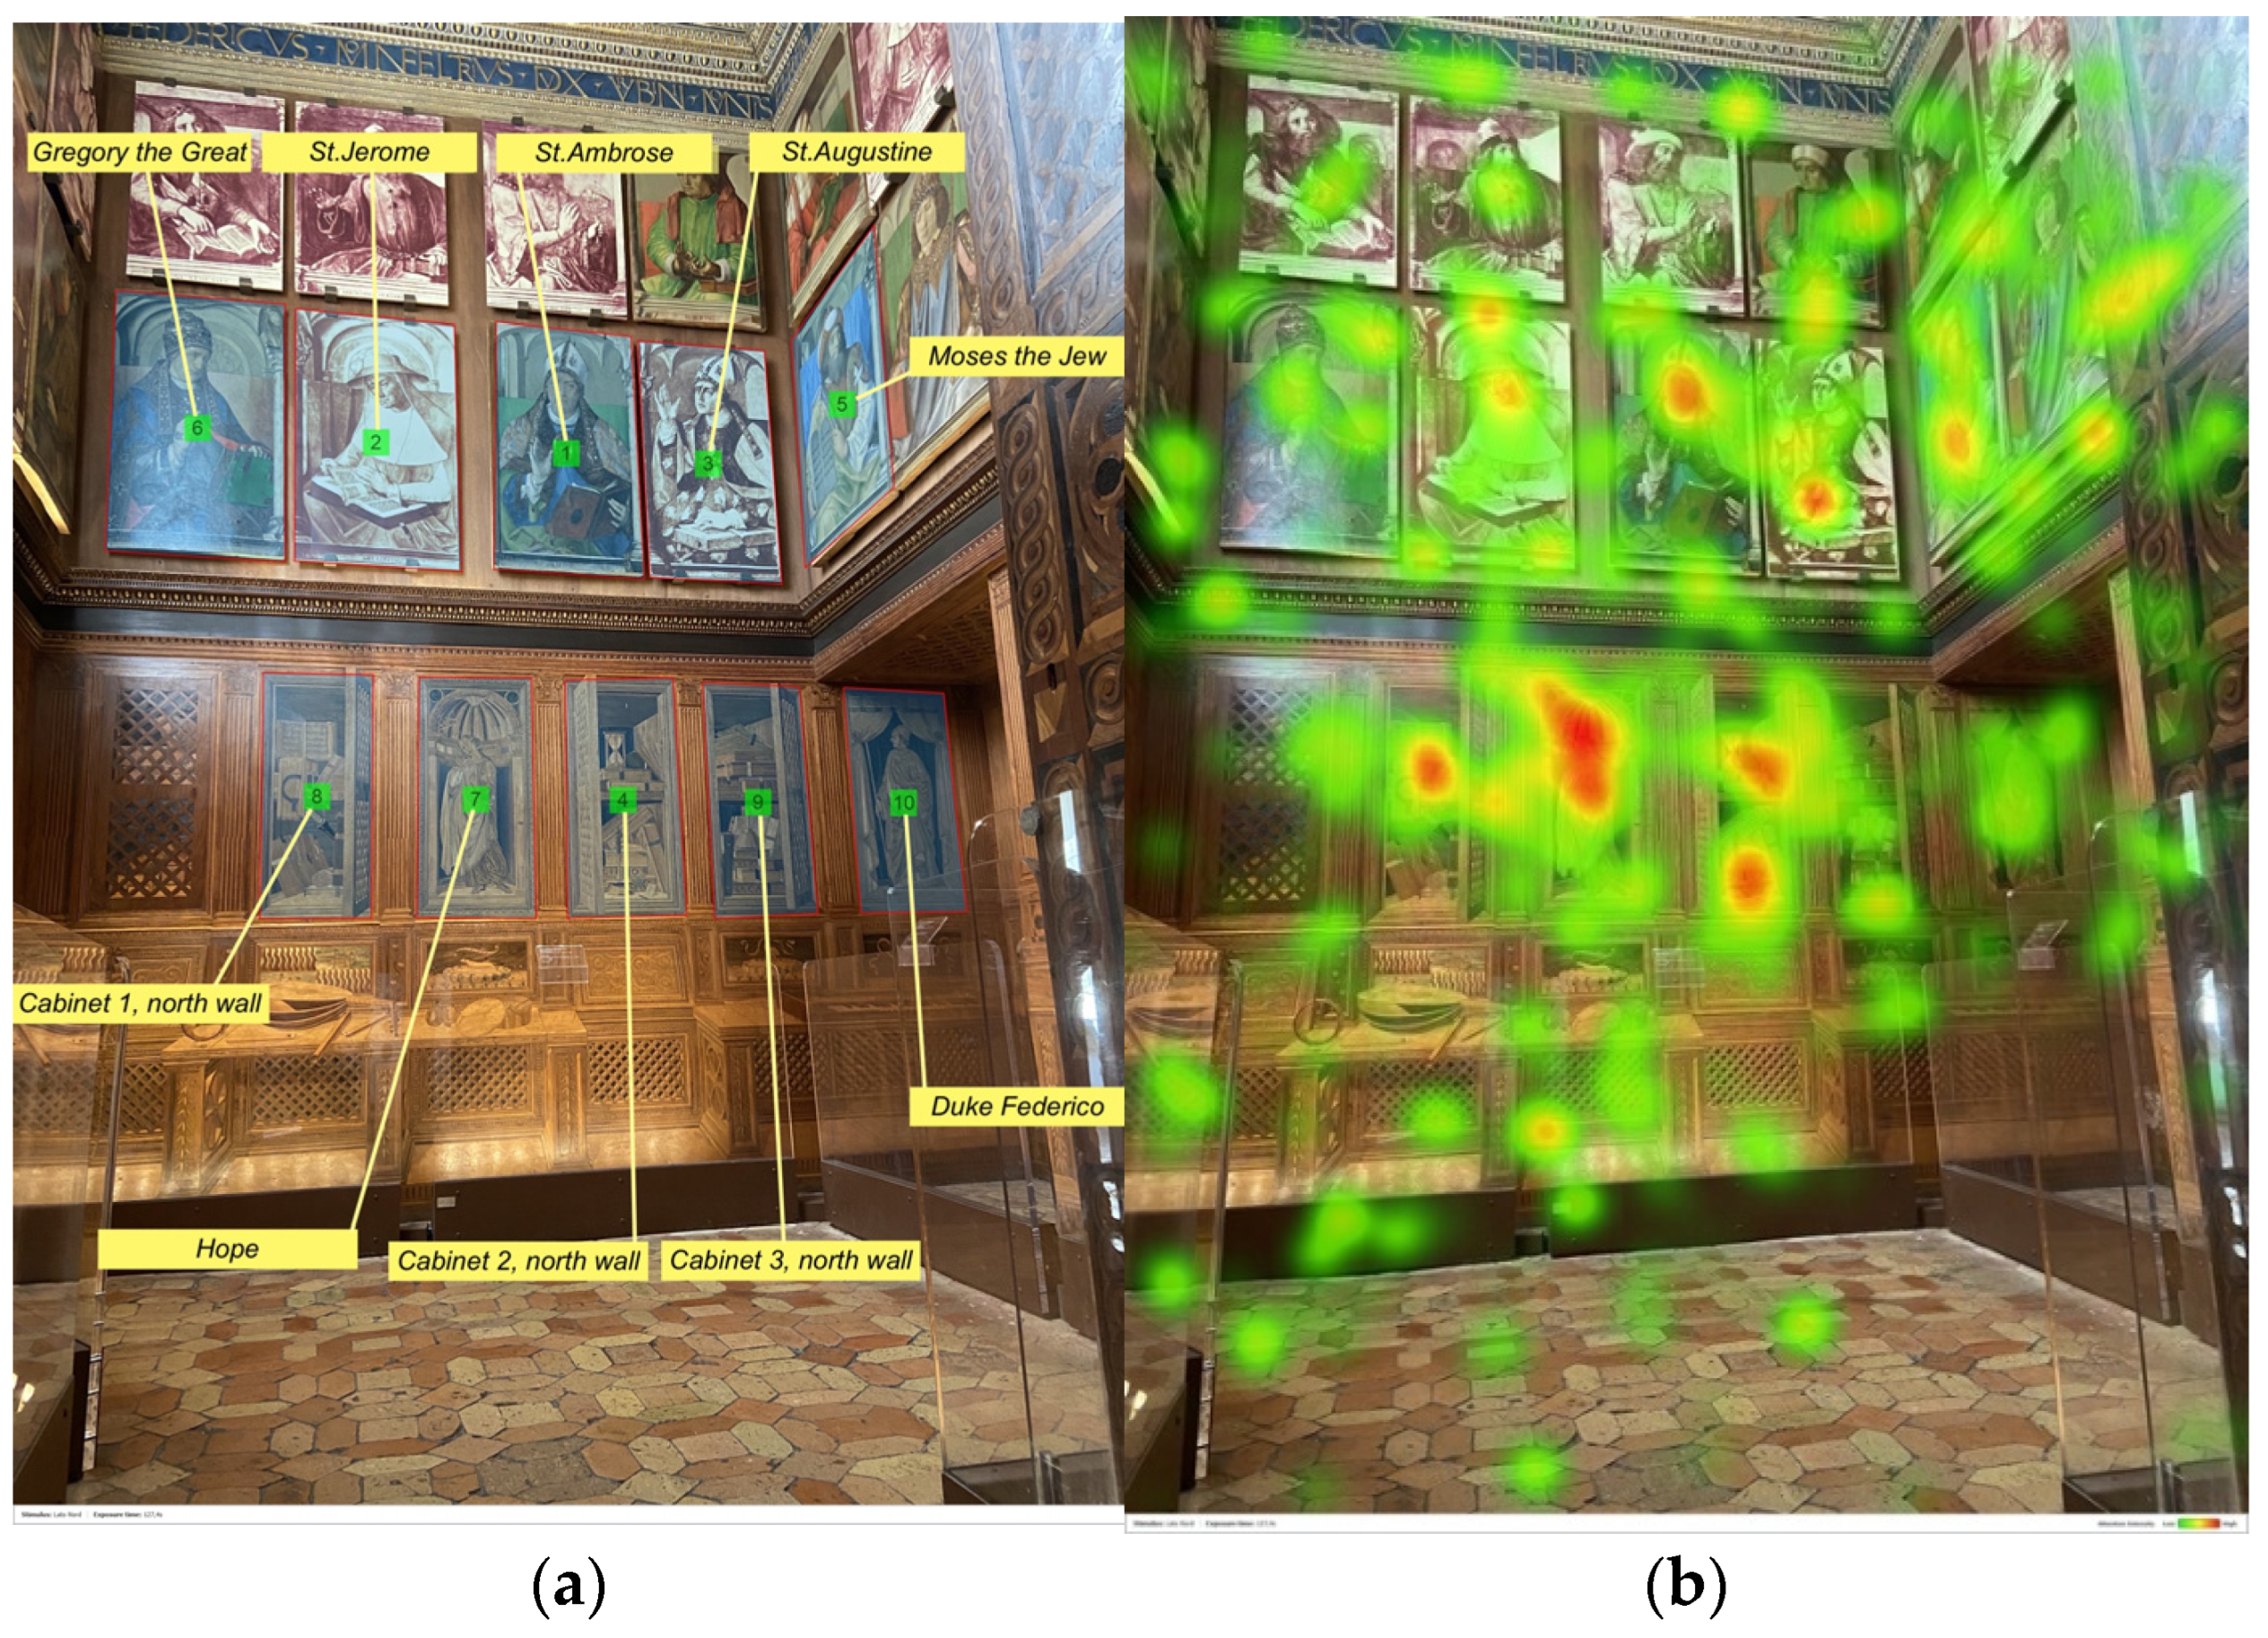
2.1. Stimulus
2.2. Equipment
2.3. Sample and Data Collection
2.4. Analyses
3. Results
4. Discussion and Conclusions
Author Contributions
Funding
Institutional Review Board Statement
Informed Consent Statement
Data Availability Statement
Acknowledgments
Conflicts of Interest
References
- Quiroga, R.Q.; Pedreira, C. How do we see art: An eye-tracker study. Front. Hum. Neurosci. 2011, 5, 98. [Google Scholar] [CrossRef] [PubMed] [Green Version]
- Villani, D.; Morganti, F.; Cipresso, P.; Ruggi, S.; Riva, G.; Gilli, G. Visual exploration patterns of human figures in action: An eye tracker study with art paintings. Front. Psychol. 2015, 6, 1636. [Google Scholar] [CrossRef] [PubMed] [Green Version]
- Zeki, S. Inner Vision: An Exploration of Art and the Brain; OUP: Oxford-London, UK, 1999. [Google Scholar]
- Nikolaev, A.R.; Pannasch, S.; Ito, J.; Belopolsky, A.V. Eye movement-related brain activity during perceptual and cognitive processing. Front. Syst. Neurosci. 2014, 8, 2013–2014. [Google Scholar] [CrossRef] [PubMed] [Green Version]
- Eckstein, M.K.; Guerra-Carrillo, B.; Miller Singley, A.T.; Bunge, S.A. Beyond eye gaze: What else can eyetracking reveal about cognition and cognitive development? Dev. Cogn. Neurosci. 2017, 25, 69–91. [Google Scholar] [CrossRef] [Green Version]
- Bojko, A. Eye Tracking the User Experience; Louis Rosenfeld: Brooklyn, NY, USA, 2013; ISBN 9781933820101. [Google Scholar]
- Tullis, T.; Albert, B. Behavioral and physiological metrics. Meas. User Exp. 2013, 163–186. [Google Scholar] [CrossRef]
- Wallraven, C.; Cunningham, D.W.; Rigau, J.; Feixas, M.; Sbert, M. Aesthetic appraisal of art: From eye movements to computers. In Proceedings of the Fifth International Symposium on Computational Aesthetics in Graphics, Visualization, and Imaging (2009), Victoria, BC, Canada, 28–30 May 2009; Deussen, O., Hall, P., Eds.; The Eurographics Association: Goslar, Germany, 2009. [Google Scholar]
- Pierdicca, R.; Paolanti, M.; Naspetti, S.; Mandolesi, S.; Zanoli, R.; Frontoni, E. User-centered predictive model for improving cultural heritage augmented reality applications: An HMM-based approach for eye-tracking data. J. Imag. 2018, 4, 101. [Google Scholar] [CrossRef] [Green Version]
- Le Meur, O.; Le Pen, T.; Cozot, R. Can we accurately predict where we look at paintings? PLoS ONE 2020, 15, e0239980. [Google Scholar] [CrossRef]
- Fuchs, I.; Ansorge, U.; Redies, C.; Leder, H. Salience in paintings: Bottom-up influences on eye fixations. Cognit. Comput. 2011, 3, 25–36. [Google Scholar] [CrossRef] [Green Version]
- Heidenreich, S.; Turano, K. Where does one look when viewing artwork in a museum? Empir. Stud. Arts 2011, 29, 51–72. [Google Scholar] [CrossRef]
- Quiroga, R.Q.; Dudley, S.; Binnie, J. Looking at Ophelia: A comparison of viewing art in the gallery and in the lab. Adv. Clin. Neurosci. Rehabil. 2011, 11, 9–12. [Google Scholar]
- Walker, F.; Bucker, B.; Anderson, N.C.; Schreij, D.; Theeuwes, J. Looking at paintings in the Vincent Van Gogh Museum: Eye movement patterns of children and adults. PLoS ONE 2017, 12, e0178912. [Google Scholar] [CrossRef] [PubMed] [Green Version]
- Massaro, D.; Savazzi, F.; Dio, D.C.; Freedberg, D.; Gallese, V.; Gilli, G.; Marchetti, A. When art moves the eyes: A behavioral and eye-tracking study. PLoS ONE 2012, 7, e37285. [Google Scholar] [CrossRef] [Green Version]
- Brieber, D.; Nadal, M.; Leder, H.; Rosenberg, R. Art in time and space: Context modulates the relation between art experience and viewing time. PLoS ONE 2014, 9, e99019. [Google Scholar] [CrossRef] [PubMed] [Green Version]
- Bailey-Ross, C.; Beresford, A.M.; Smith, D.T.; Warwick, C. Aesthetic appreciation and Spanish art: Insights from eye-tracking. Digit. Scholarsh. Humanit. 2019, 34, I17–I35. [Google Scholar] [CrossRef]
- Grazioso, M.; Esposito, R.; Kuflik, T.; Maayan-Fanar, E.; Cutugno, F. Using eye tracking data to understand visitors’ behaviour. In Proceedings of the AVI2CH 2020: Workshop on Advanced Visual Interfaces and Interactions in Cultural Heritage (AV I 2CH 2020). ACM, New York, NY, USA, 28 September–2 October 2020. [Google Scholar]
- Balbi, B.; Protti, F.; Montanari, R. Driven by Caravaggio through his painting. In Proceedings of the COGNITIVE 2016: The Eighth International Conference on Advanced Cognitive Technologies and Applications, Barcelona, Spain, 20–24 March 2016; pp. 72–76. [Google Scholar]
- Naspetti, S.; Pierdicca, R.; Mandolesi, S.; Paolanti, M.; Frontoni, E.; Zanoli, R. Automatic analysis of eye-tracking data for augmented reality applications: A prospective outlook. In Proceedings of the 3rd International Conference on Augmented Reality, Virtual Reality and Computer Graphics, AVR 2016, Lecce, Italy, 15–18 June 2016; pp. 217–230. [Google Scholar]
- Yarbus, A.L. Eye Movements and Vision; Springer: Boston, MA, USA, 1967. [Google Scholar]
- Stoica, B.; Florea, L.; Badeanu, A.; Racoviteanu, A.; Felea, I.; Florea, C. Visual saliency analysis in paintings. In Proceedings of the International Symposium on Signals, Circuits and Systems, Iasi, Romania, 13–14 July 2017; pp. 1–4. [Google Scholar] [CrossRef]
- Itti, L.; Koch, C. A saliency-based search mechanism for overt and covert shifts of visual attention. Vision Res. 2000, 40, 1489–1506. [Google Scholar] [CrossRef] [Green Version]
- Harel, J.; Koch, C.; Perona, P. Graph-based visual saliency. Adv. Neural Inf. Process. Syst. 2006, 545–552. [Google Scholar] [CrossRef] [Green Version]
- Underwood, G.; Foulsham, T. Visual saliency and semantic incongruency influence eye movements when inspecting pictures. Q. J. Exp. Psychol. 2006, 59, 1931–1949. [Google Scholar] [CrossRef] [Green Version]
- Rainoldi, M.; Neuhofer, B.; Jooss, M. Mobile eyetracking of museum learning experiences. Inf. Commun. Technol. Tour. 2018, 473–485. [Google Scholar] [CrossRef] [Green Version]
- Leopardi, A.; Ceccacci, S.; Mengoni, M. Dynamic Projection for the Design of an Adaptive Museum Guide. In Proceedings of the International Conference on Design Tools and Methods in Industrial Engineering, ADM 2019, Modena, Italy, 9–10 September 2019; pp. 85–94. [Google Scholar] [CrossRef]
- On Tam, C. Understanding the Inarticulateness of museum visitors’ experience of paintings: A phenomenological study of adult non-art specialists. Indo-Pacific J. Phenomenol. 2008, 8, 1–11. [Google Scholar] [CrossRef]
- Cheles, L. The inlaid decorations of Federico da Montefeltro’s Urbino Studiolo: An iconographic study. Mitt. Des Kunsthist. Inst. Florenz 1982, 26, 1–46. [Google Scholar]
- Sernani, P.; Angeloni, R.; Dragoni, A.F. Augmented Reality, Virtual Reality, and Computer Graphics; Springer: Berlin/Heidelberg, Germany, 2019; pp. 199–207. [Google Scholar]
- Chatterjee, A.; Widick, P.; Sternschein, R.; Smith, W.; Bromberger, B. The assessment of art attributes. Empir. Stud. Arts 2010, 28, 207–222. [Google Scholar] [CrossRef]
- Pine, B.J.; Gilmore, J.H. Welcome to the experience economy. Harv. Bus. Rev. 1998, 4, 97–105. [Google Scholar]
- Lundy, D.; Schenkel, M.; Akrie, T.; Walker, A. How important is beauty to you? The development of the desire for aesthetics scale. Empir. Stud. Arts 2010, 28, 73–92. [Google Scholar] [CrossRef]
- Taşkesen, O. Developing interest in art scale and determining the relation between personality type of teacher candidates and their interest in art. Educ. Res. Rev. 2014, 9, 216–226. [Google Scholar] [CrossRef] [Green Version]
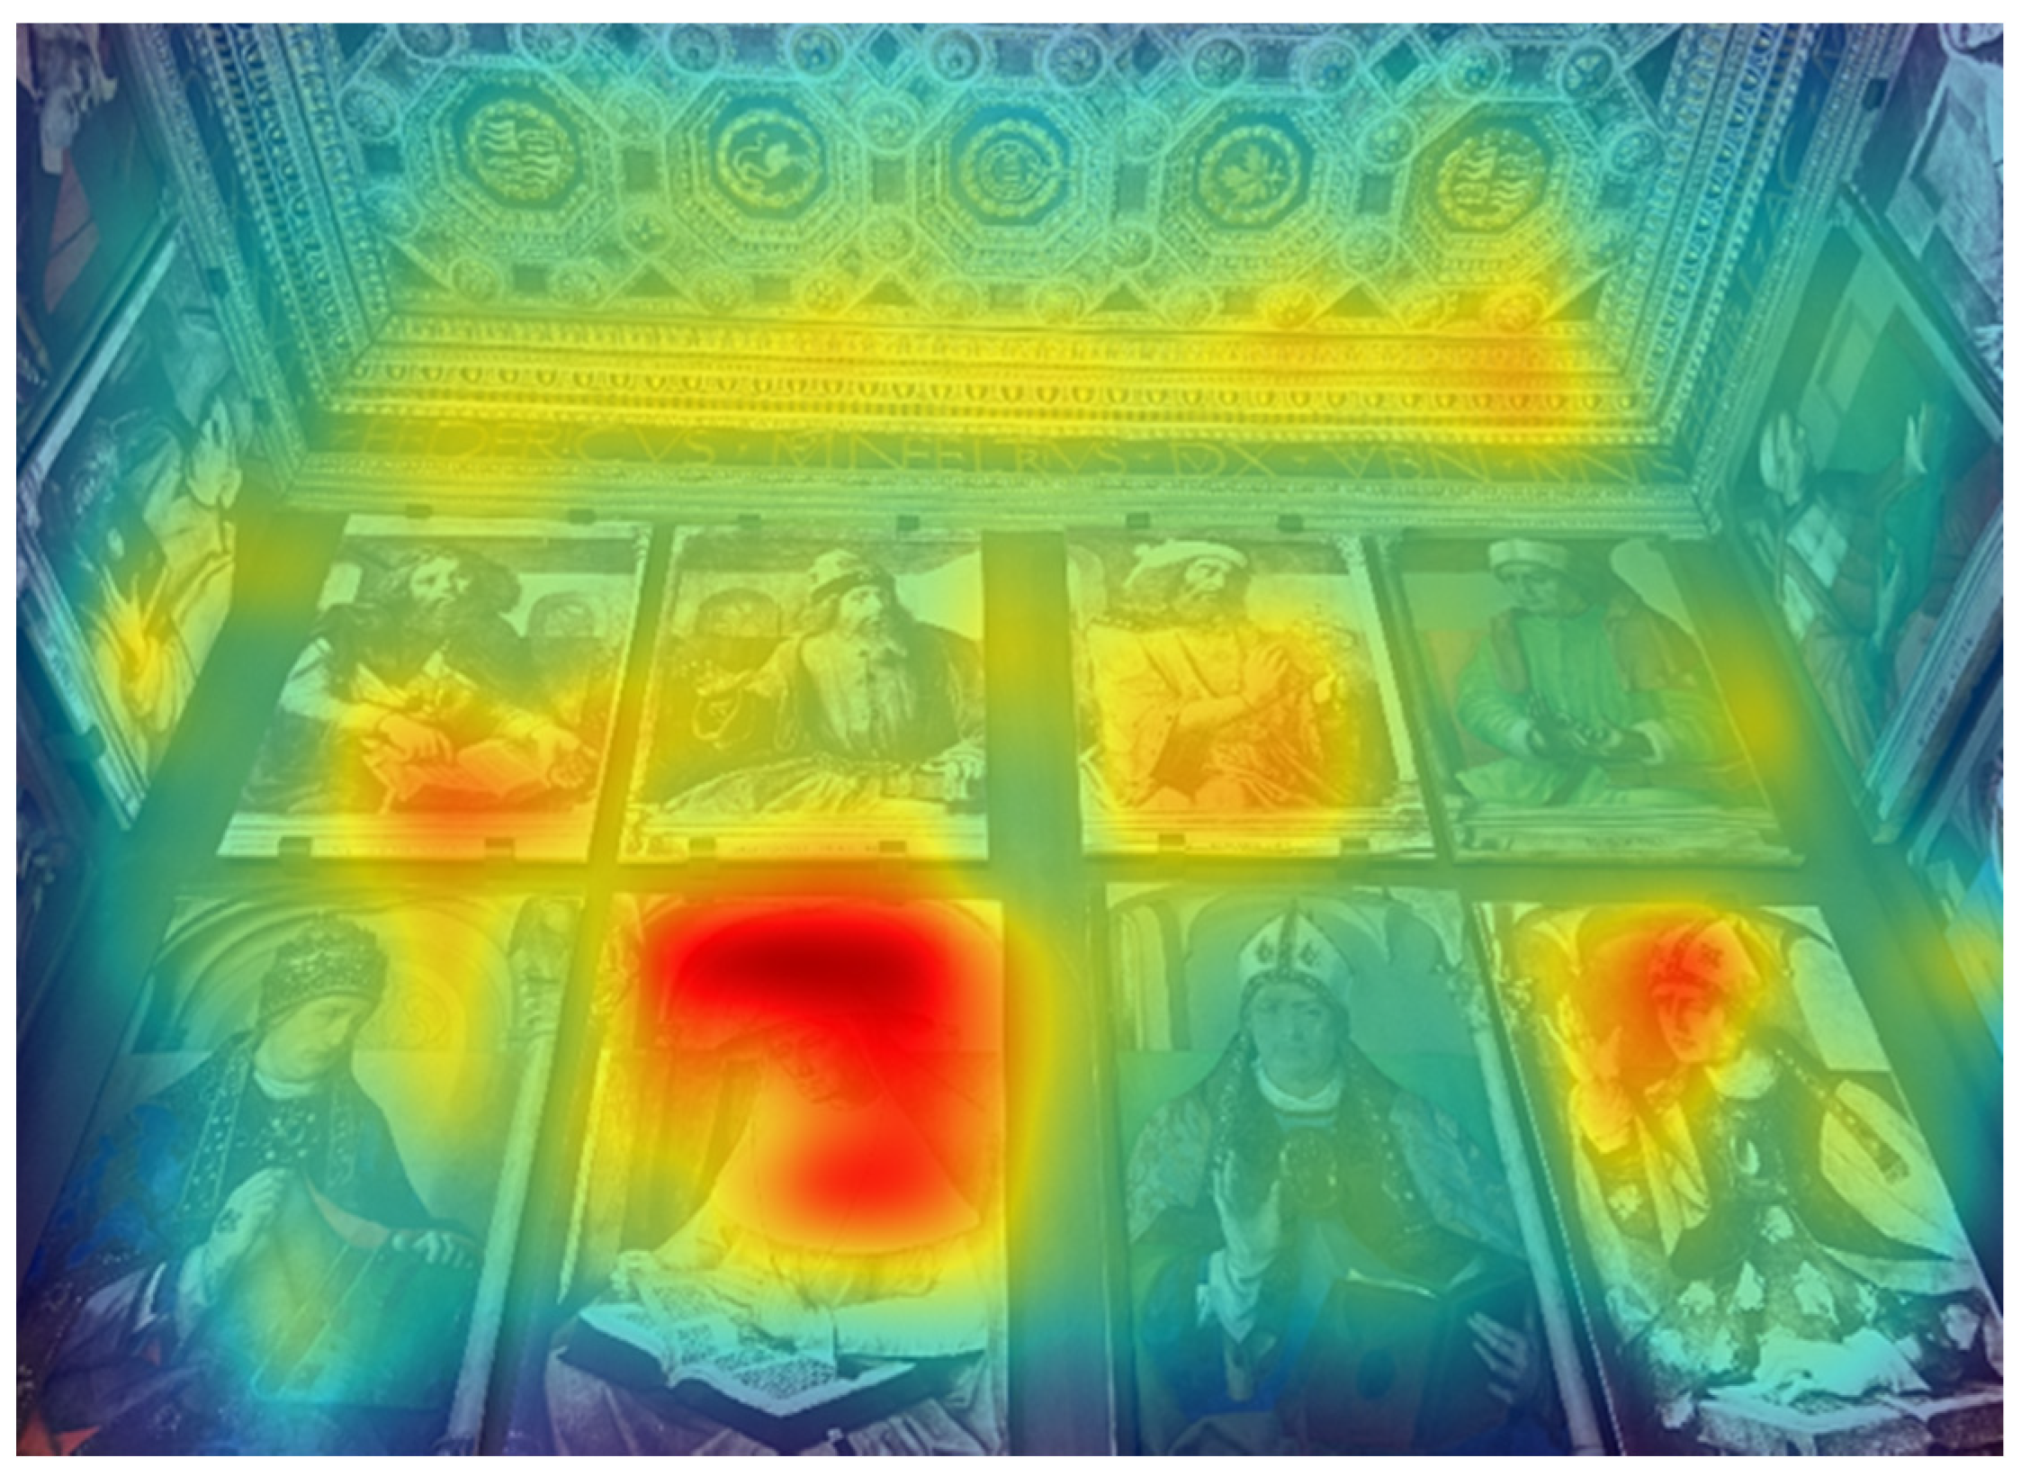
- Farnsworth, B. How to Analyze and Interpret Heat Maps. Available online: https://imotions.com/blog/analyze-heat-maps/ (accessed on 14 November 2021).
- Hein, G.E. Learning in the Museum; Routledge: London, UK, 1998. [Google Scholar]
- Smith, J.K.; Smith, L.F. Spending time on art. Empir. Stud. Arts 2001, 19, 229–236. [Google Scholar] [CrossRef]
- Crucq, A. Viewing patterns and perspectival paintings: An eye-tracking study on the effect of the vanishing point. J. Eye Mov. Res. 2021, 13, 1–21. [Google Scholar] [CrossRef] [PubMed]
- Raggio, O. The Gubbio Studiolo and Its Conservation: I. Federico da Montefeltro’s Palace at Gubbio and Its Studiolo; The Metropolitan Museum of Art: New York, NY, USA, 2000. [Google Scholar]
- Wang, H.C.; Pomplun, M. The attraction of visual attention to texts in real-world scenes. J. Vis. 2012, 12, 26. [Google Scholar] [CrossRef] [Green Version]
- Gao, H.; Wang, Z.; Zhu, D.; Zou, N. Research on the influence of lighting mode and CCT on the lighting design of art museum based on subjective experiment. AIP Adv. 2020, 10, 125024. [Google Scholar] [CrossRef]
- Innes, M. Lighting and museum exhibits. In Oxford Handbook of Light in Archaeology; online; Papadopoulos, C., Moyes, H., Eds.; Oxford University Press: Oxford, UK, 2017. [Google Scholar] [CrossRef]
- Bazán, L.N.; Ajmat, R.F.; Sandoval, J.D. Lighting in museums, visitors’ experience and satisfaction in a heritage context. Study cases in Northwest Argentina. An. La Asoc. Fis. Argent. 2018, 29, 39–48. [Google Scholar] [CrossRef]


| Almost Never | Once a Year | Every Six Months | Every Two Months | Every Month | Every Week | ||
|---|---|---|---|---|---|---|---|
| On average, how often do you visit art museums? | 4% | 16% | 36% | 28% | 12% | 4% | |
| On average, how often do you visit art galleries? | 8% | 28% | 24% | 24% | 8% | 4% | |
| 0 h | 1 h | 2 h | 3 h | 4 h | 5 h | 6 h | |
| In the average week, how many hours do you dedicate to visual artistic activities? | 16% | 44% | 8% | 12% | 4% | 4% | 12% |
| In the average week, how many hours do you spend reading a publication that is related to visual art? | 32% | 36% | 12% | 4% | 0% | 4% | 12% |
| In the average week, how many hours do you spend each week looking at visual art? | 16% | 52% | 16% | 4% | 0% | 4% | 8% |
| Interest in Art-Scale Items | Experience-Scale Items | ||
|---|---|---|---|
| 1 | Whenever I see a poster related art, I check it out | 1 | This experience stimulated my curiosity |
| 2 | I read culture and art pages of newspapers | 2 | This experience increased my knowledge |
| 3 | I do not like talking about art with my friends (R) | 3 | This experience enhanced my philosophy of living |
| 4 | I am interested in a branch of art unprofessionally | 4 | I like sharing this experience with my family and friends |
| 5 | I am not interested in painting exhibitions (R) | 5 | I like interacting with others in the museum |
| 6 | I could stare a long time at a beautiful painting | 6 | This experience relaxed me physically |
| 7 | I have a high appreciation for great architecture | 7 | This experience stimulated me emotionally |
| 8 | I think that individuals who deal with art are more creative | 8 | I had fun |
| 9 | I do not like reading book promotions of newspaper supplements | 9 | This experience was unusual |
| 10 | We talk and make discussions about art events in my family | 10 | I felt like someone else while in the museum |
| 11 | I believe that I should spare some money for artistic activities | 11 | I imagined living in a different time and place |
| 12 | When I see a beautiful photograph, I want to obtain information about it | 12 | At the museum I avoided interactions with others |
| 13 | I do not like following artistic events on the Internet (R) | 13 | I escaped from reality |
| 14 | I think that art is necessary for individual development | 14 | I wanted to get away from crowds of people |
| 15 | I watch carefully when there is news on TV about art | 15 | I wanted to get away from a stressful social environment |
| 16 | I do not like buying books about art (R) | 16 | I felt a sense of harmony with my surroundings |
| 17 | I’m passionate about art | 17 | This museum has a pleasing physical environment |
| 18 | I like decoring the walls of my room with nice artwork | 18 | Exhibitions are pleasant |
| 19 | I like doing research about artists and their works on the internet | 19 | I appreciated the different artefacts |
| 20 | I like going to exhibitions with friends and experts of art | 20 | I felt a pleasant interior ambience |
| Description | |
|---|---|
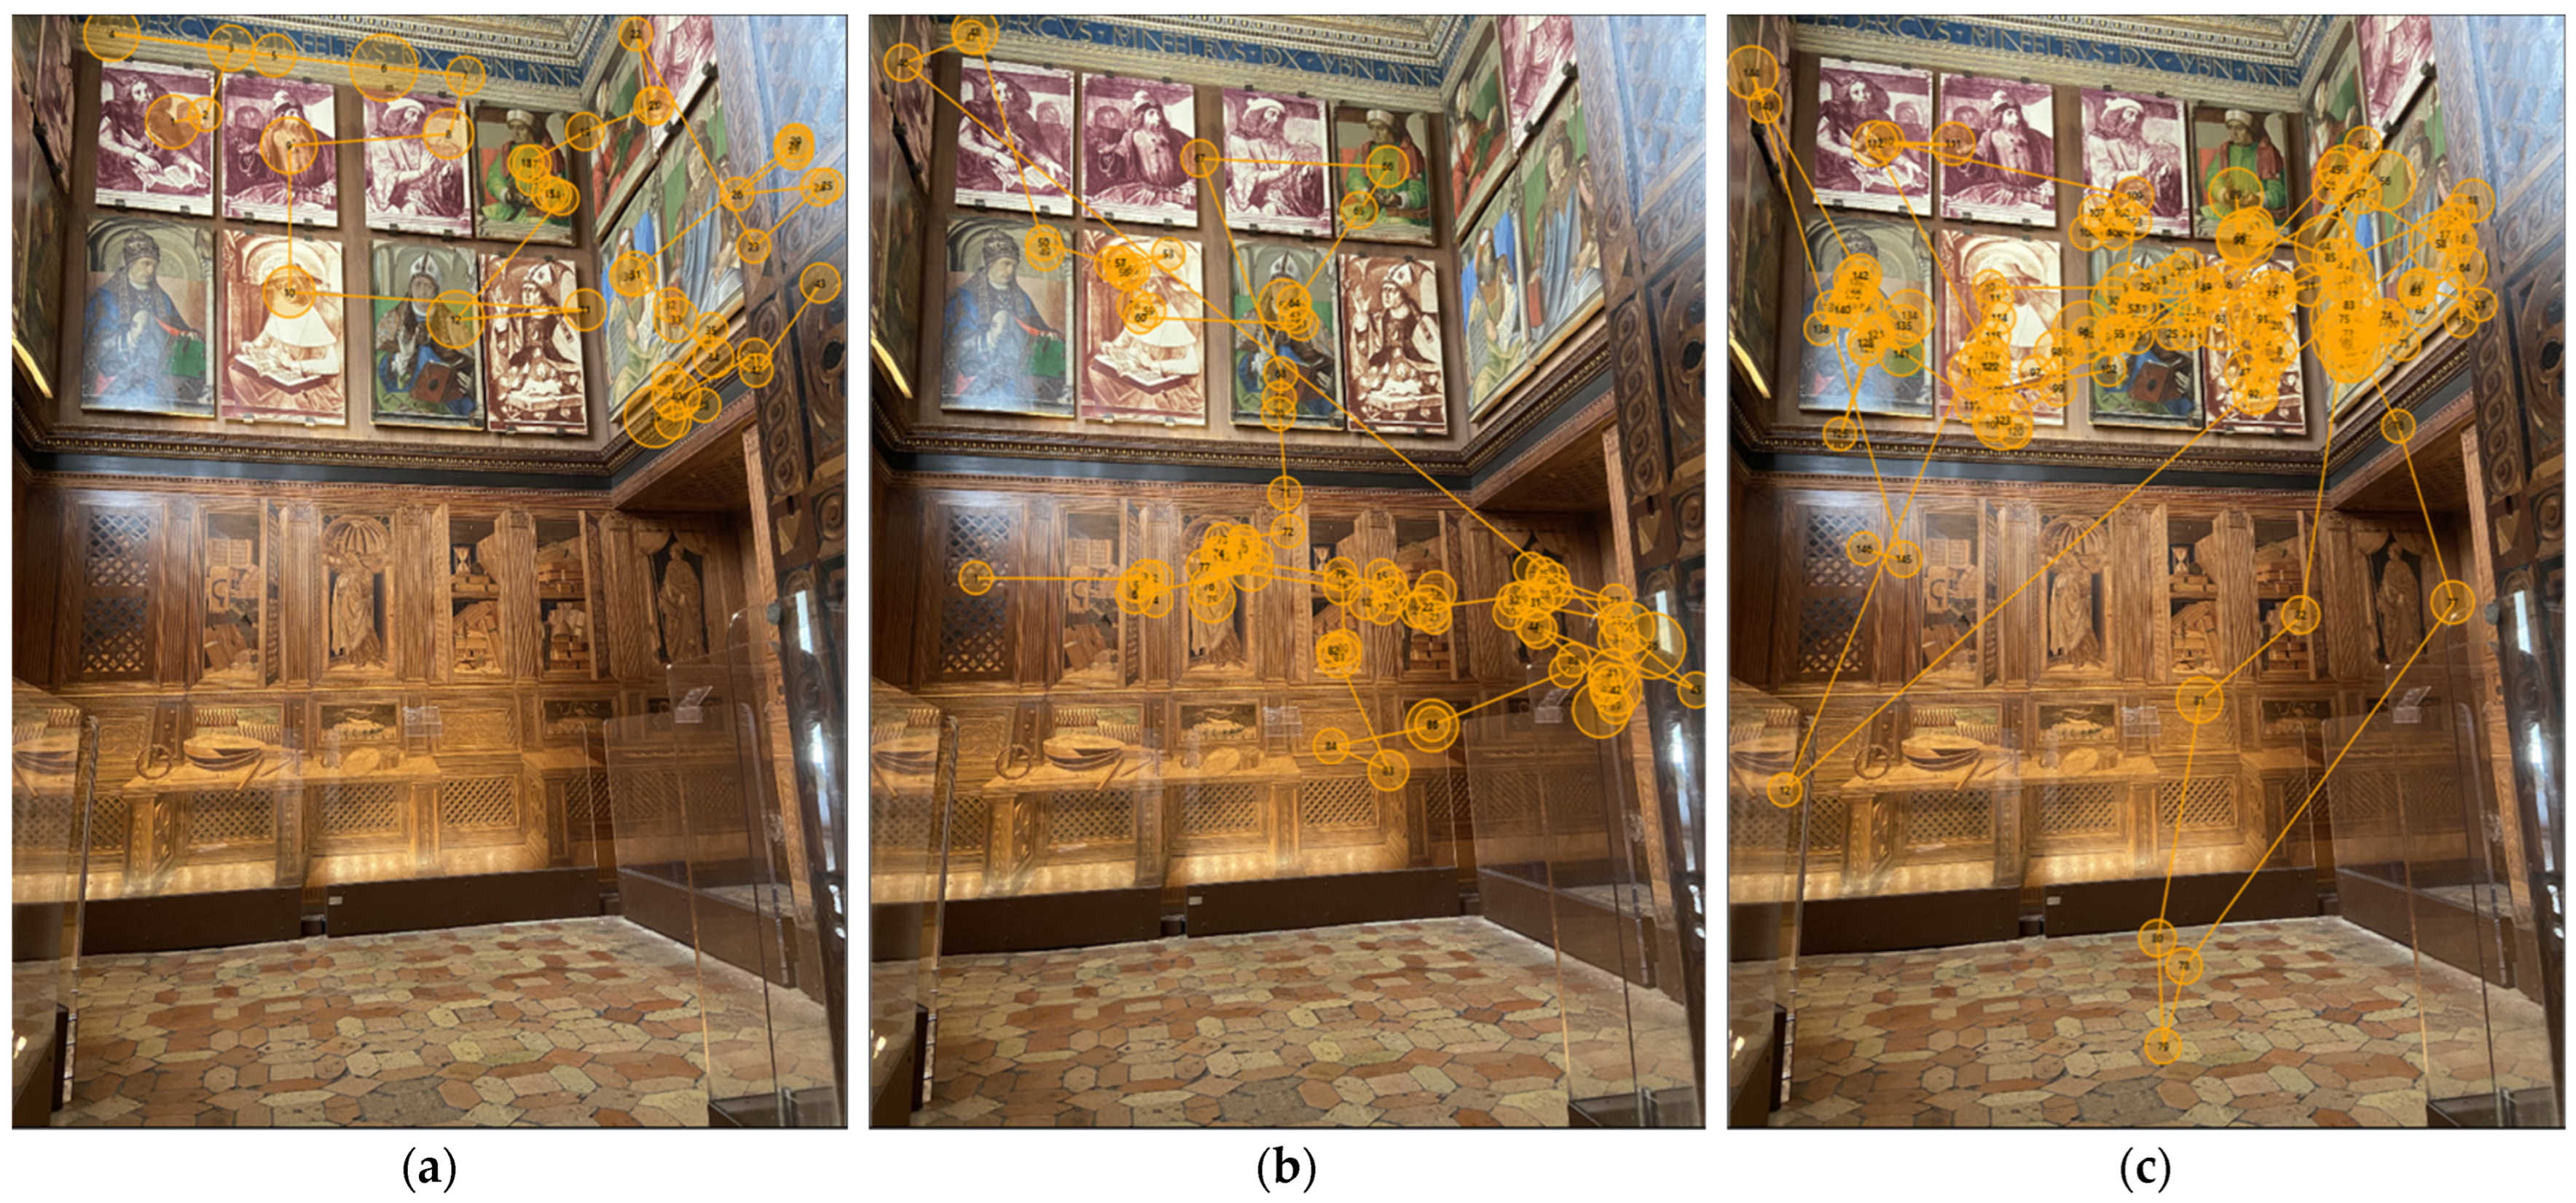
| Gaze points | Constitute the basic unit of measure. Show what eyes are looking at. In figures identified by numbers. |
| Gaze plots | Show the position and the order on the stimulus of the sequence of looking. |
| Fixations | Period in which eyes are locked toward a specific object. Typically is 100–300 ms. |
| Saccades | Eye movements between fixations. |
| Heatmaps | Aggregation of gaze points and fixations showing the general distribution of visual attention. Typically displayed as a colour gradient overlay on the stimulus. |
| AOIs | Areas of interest are user-defined subregions of a displayed stimulus used to extract metrics. |
| TTFF-F | Time to first fixation indicates the amount of time that it takes a respondent (or all respondents on average) to look at a specific AOI defined from a visual stimulus as the respondent entered the room. |
| Time spent-F | Quantifies the amount of time that respondents have spent looking at a particular AOI. |
| Fixation count | Indicates the number of fixations within a specific AOI. |
| Ratio | Provides information about how many of your respondents actually guided their gaze towards a specific AOI. |
| North Wall | ||||||||||
|---|---|---|---|---|---|---|---|---|---|---|
| AOI | 1 | 2 | 3 | 4 | 5 | 6 | 7 | 8 | 9 | 10 |
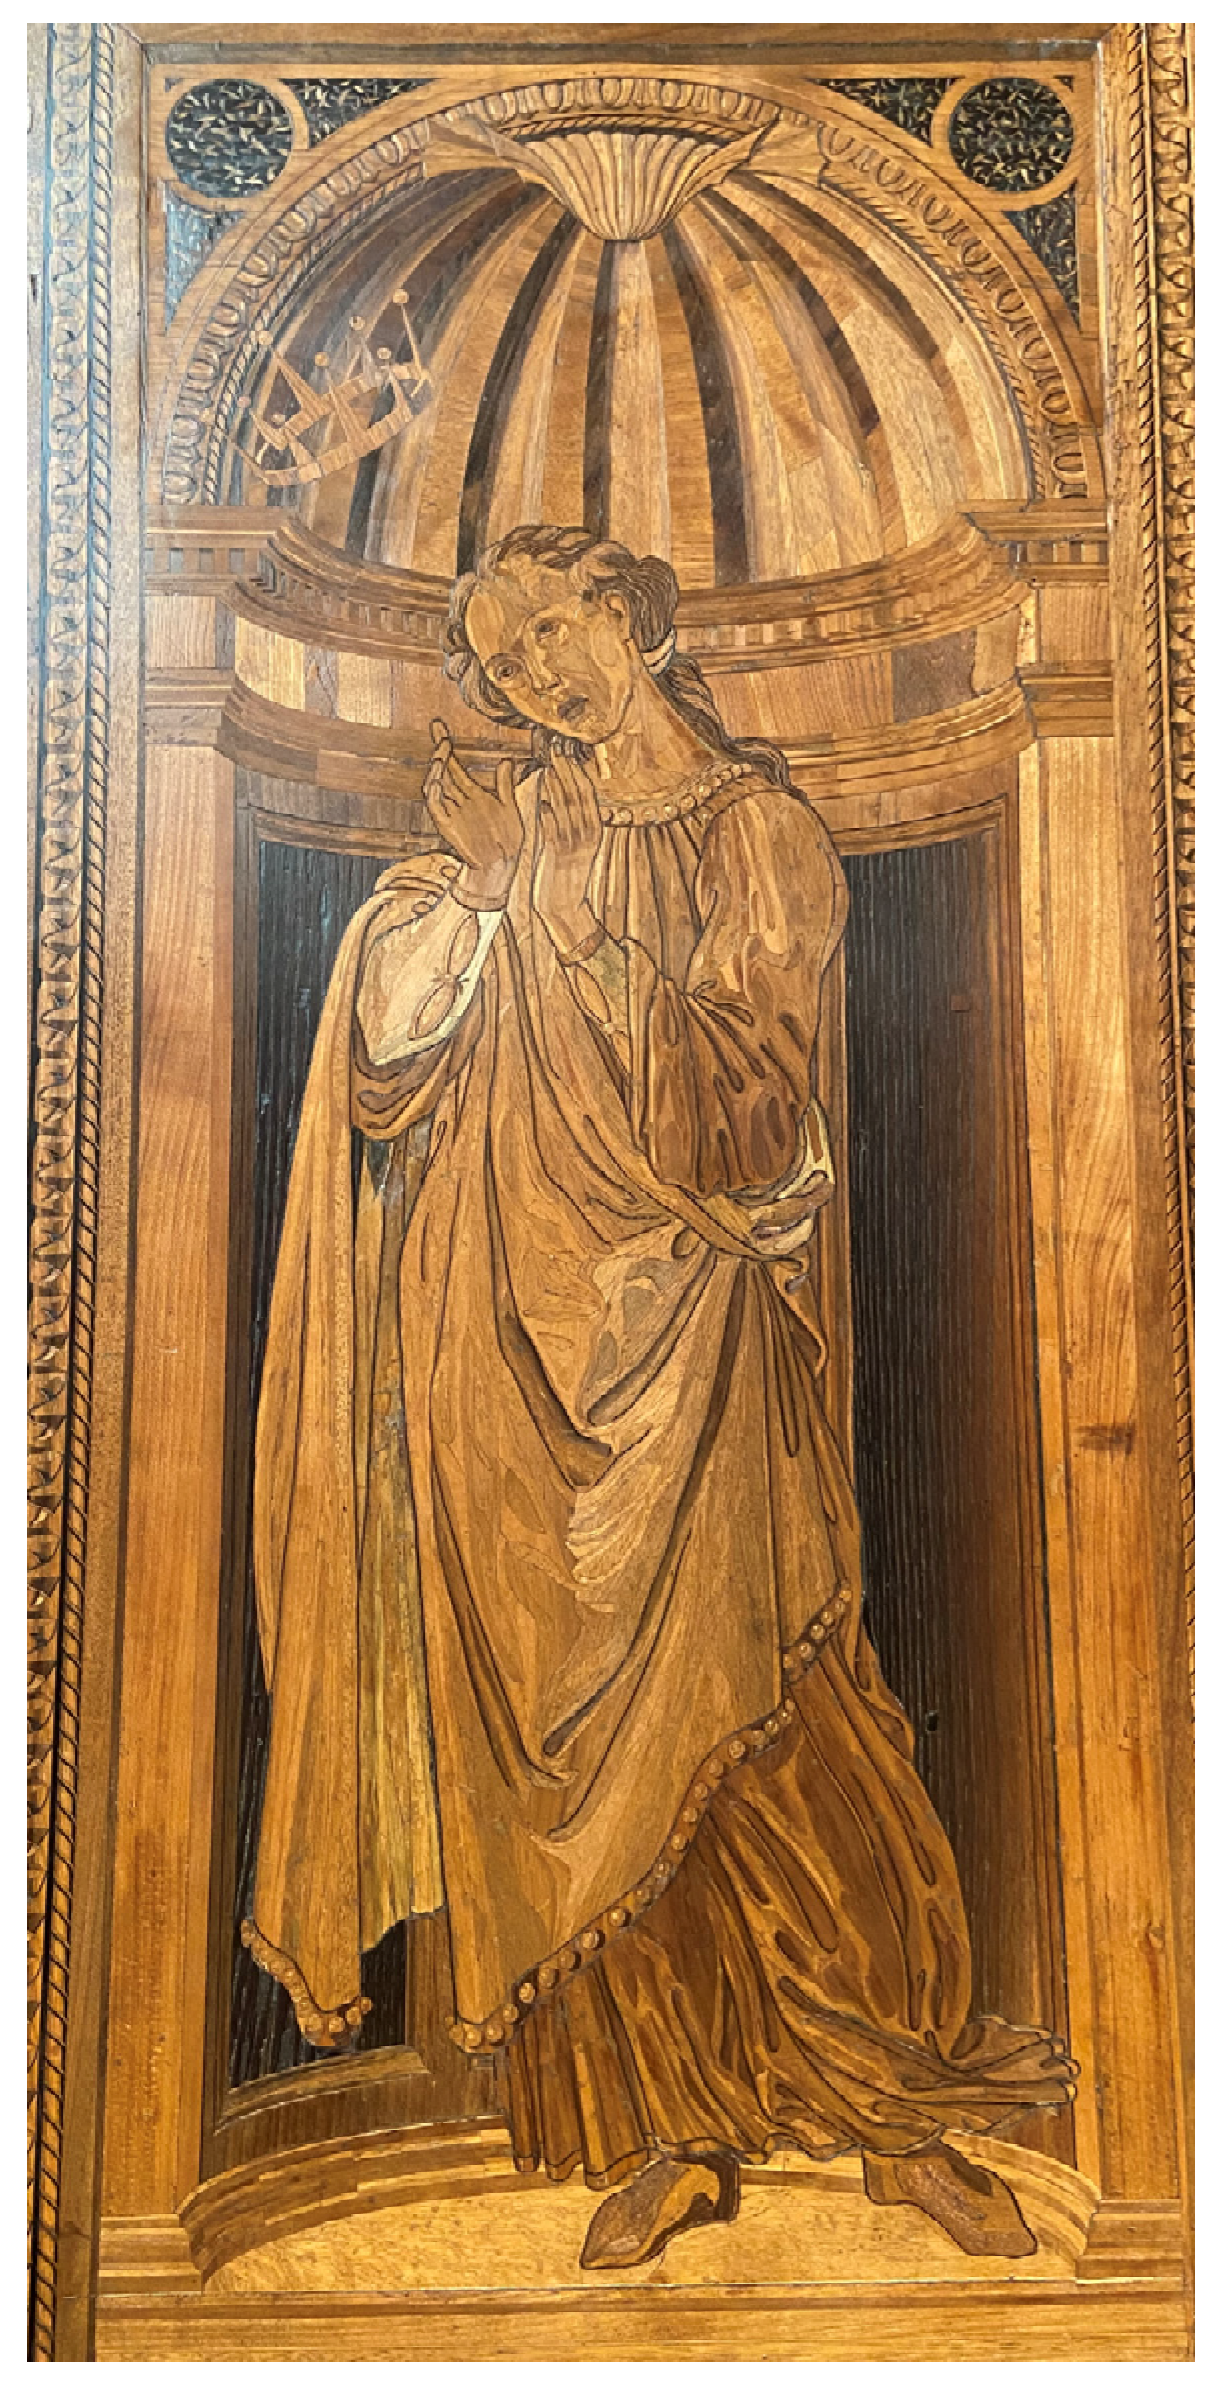
| St. Ambrose | St. Jerome | St. Augustine | Cabinet 2 | Moses the Jew | Gregory the Great | Hope | Cabinet 1 | Cabinet 3 | Duke Federico | |
| TTFF (s) | 46.7 | 54.7 | 60.1 | 77.4 | 78.2 | 79.9 | 93.9 | 90 | 102.4 | 109 |
| Time Spent (s) | 0.4 | 0.5 | 0.3 | 0.5 | 0.3 | 0.3 | 0.7 | 0.3 | 0.2 | 0.2 |
| Ratio | 23/25 | 20/25 | 16/25 | 17/25 | 12/25 | 15/25 | 15/25 | 10/25 | 10/25 | 9/25 |
| Fixations | 124 | 143 | 82 | 129 | 66 | 70 | 131 | 61 | 42 | 71 |
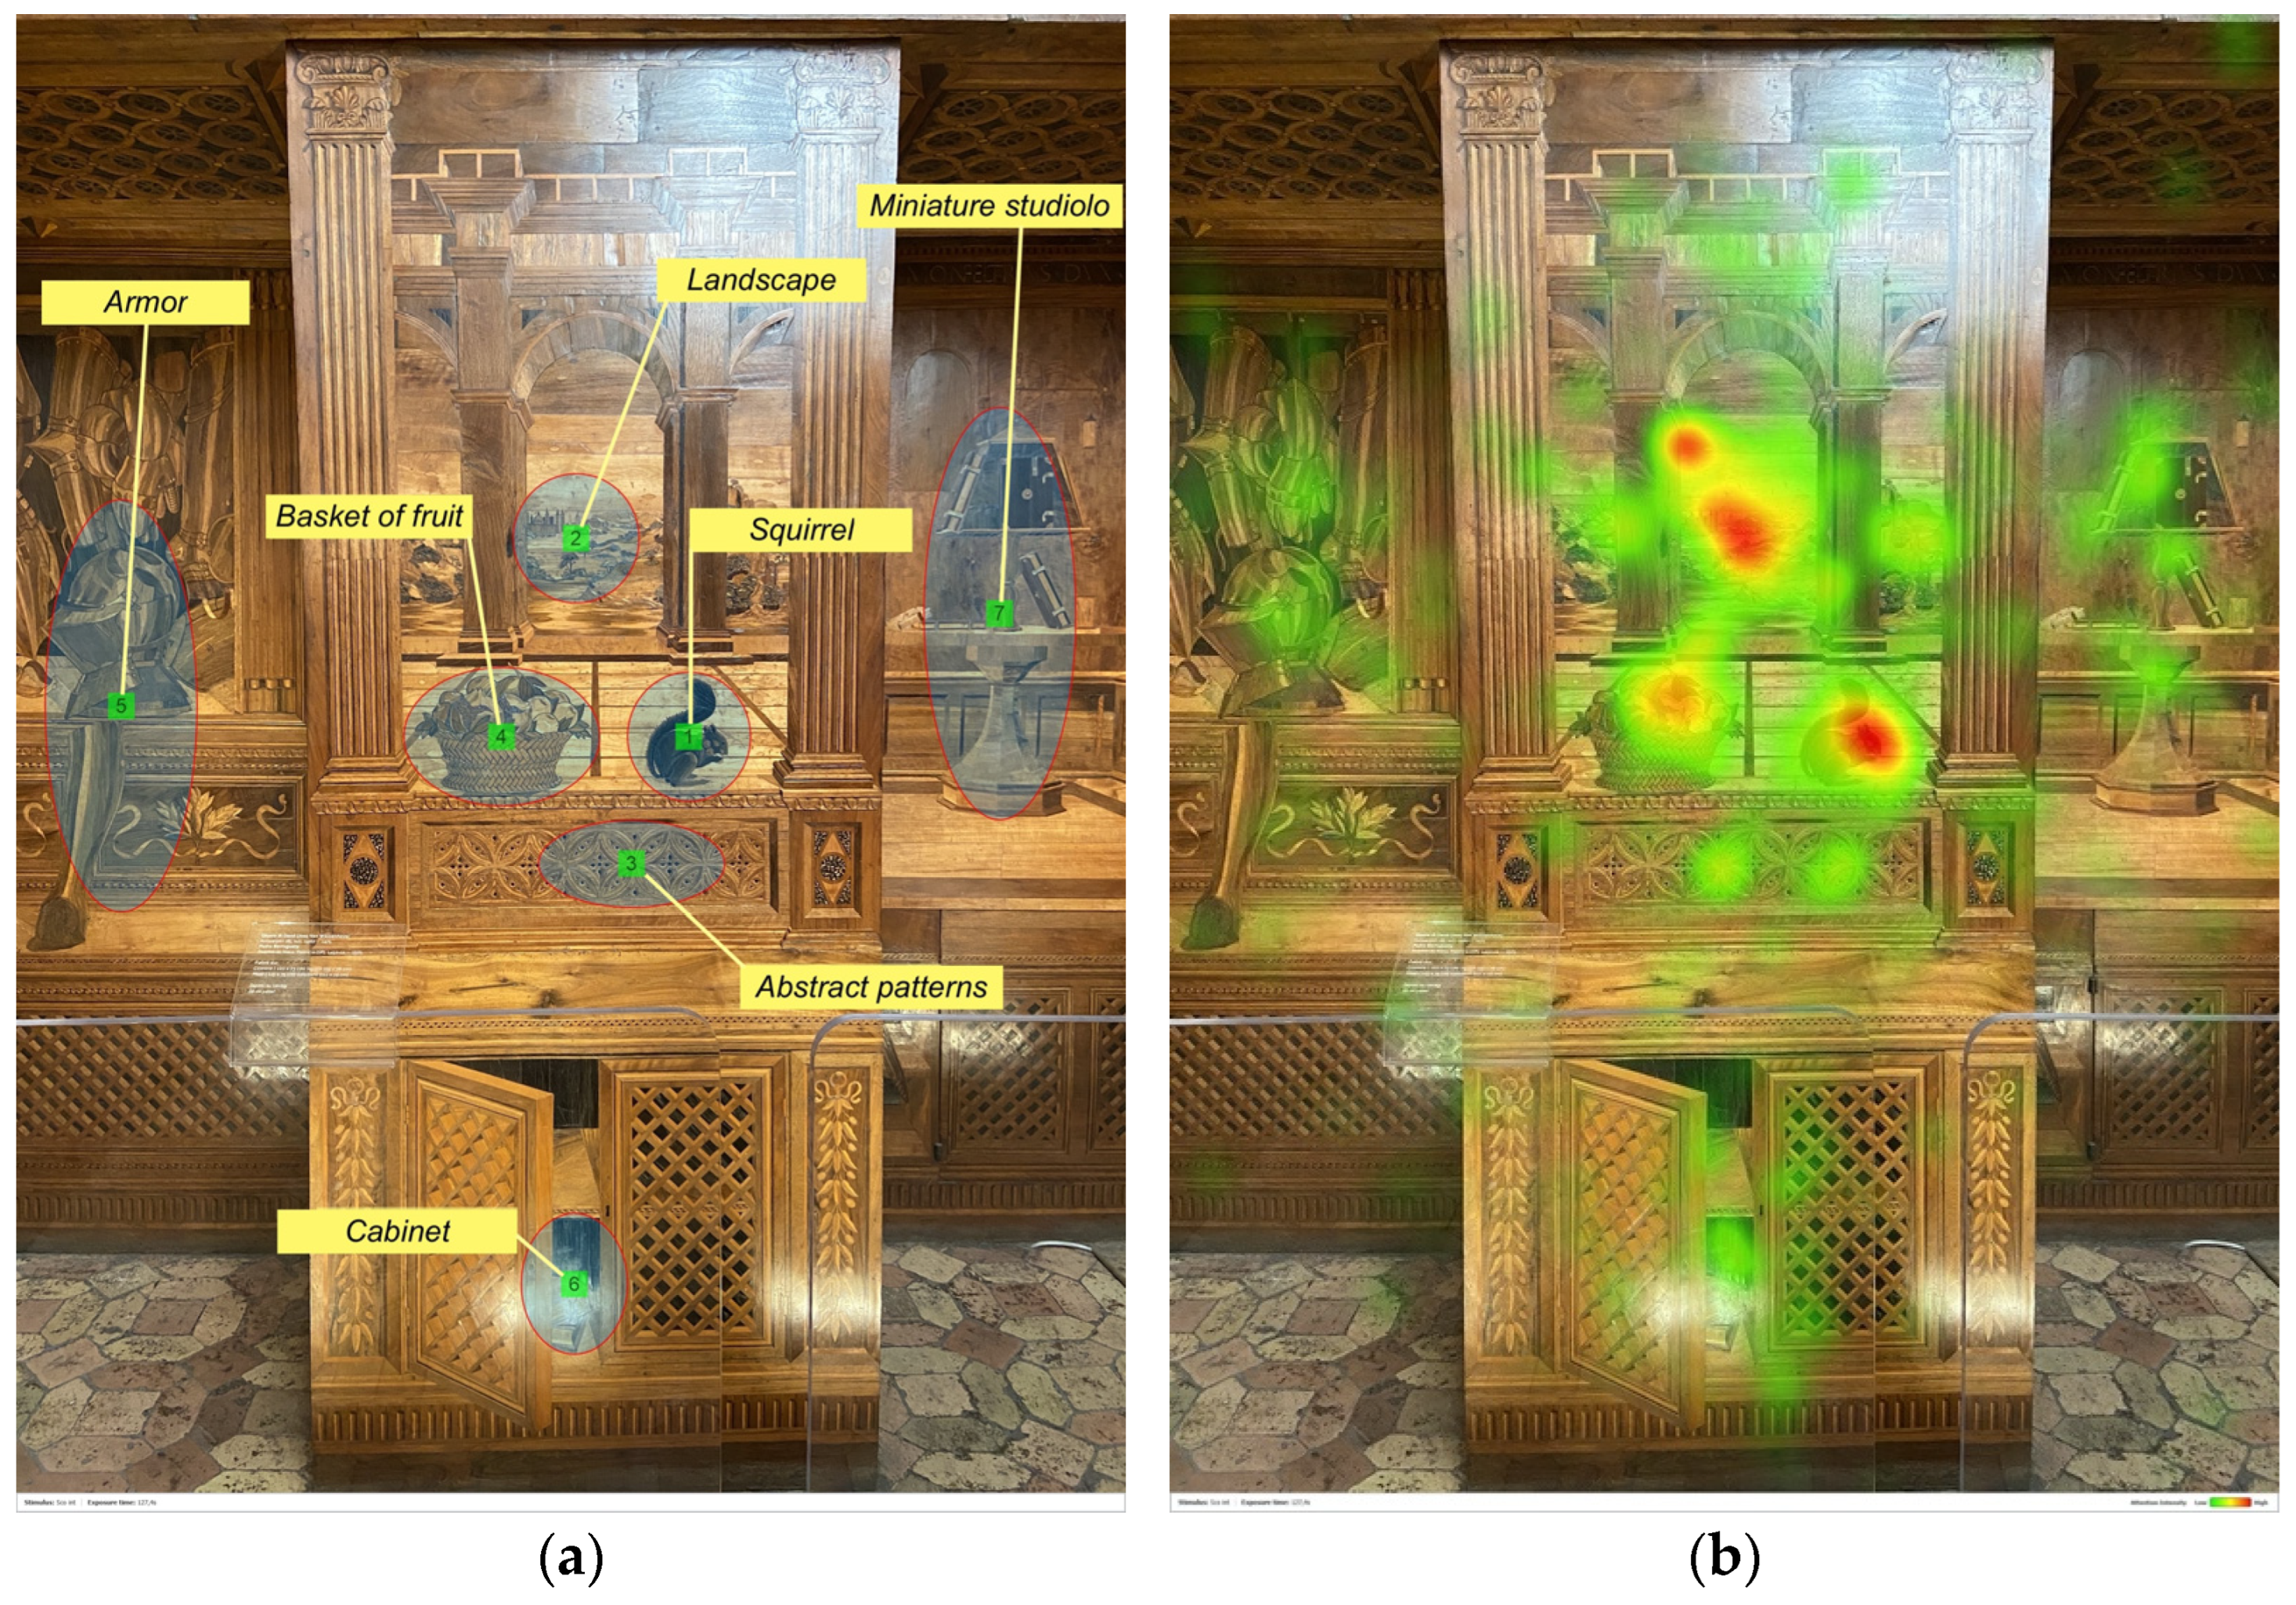
| East wall (lower part) | ||||||||
| AOI | 1 | 2 | 3 | 4 | 5 | 6 | 7 | |
| Squirrel | Landscape | Abstract Patterns | Basket of Fruit | Armour | Cabinet | Miniature Studiolo | ||
| TTFF (s) | 46.2 | 59 | 69.6 | 75.1 | 88.4 | 91.8 | 101.3 | |
| Time Spent (s) | 0.6 | 0.7 | 0.3 | 0.5 | 0.2 | 0.1 | 0.4 | |
| Ratio | 20/25 | 15/25 | 11/25 | 16/25 | 13/25 | 6/25 | 11/25 | |
| Fixations | 196 | 136 | 64 | 102 | 90 | 29 | 110 | |
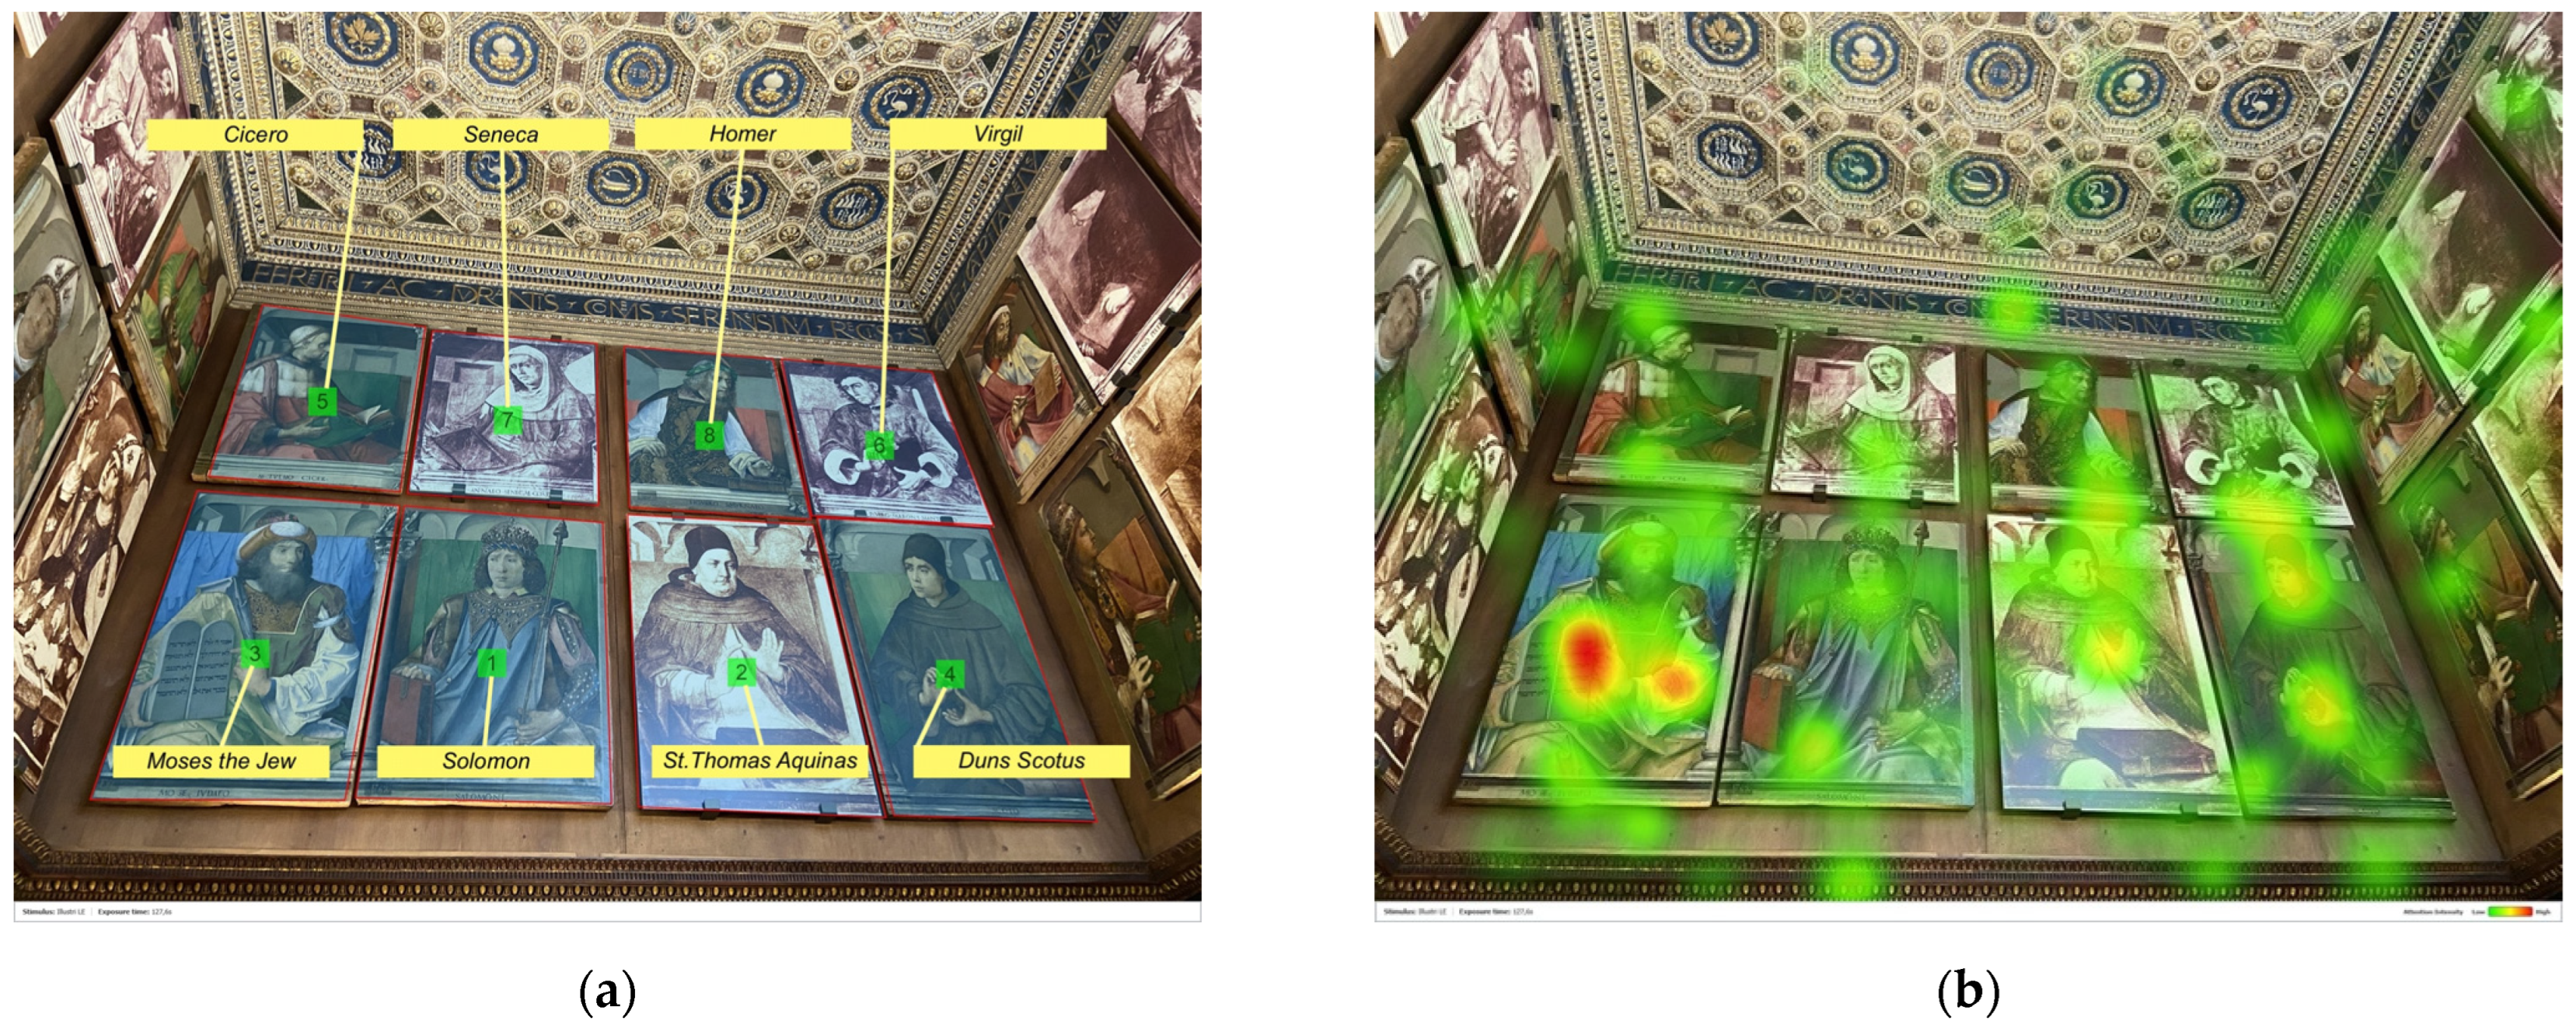
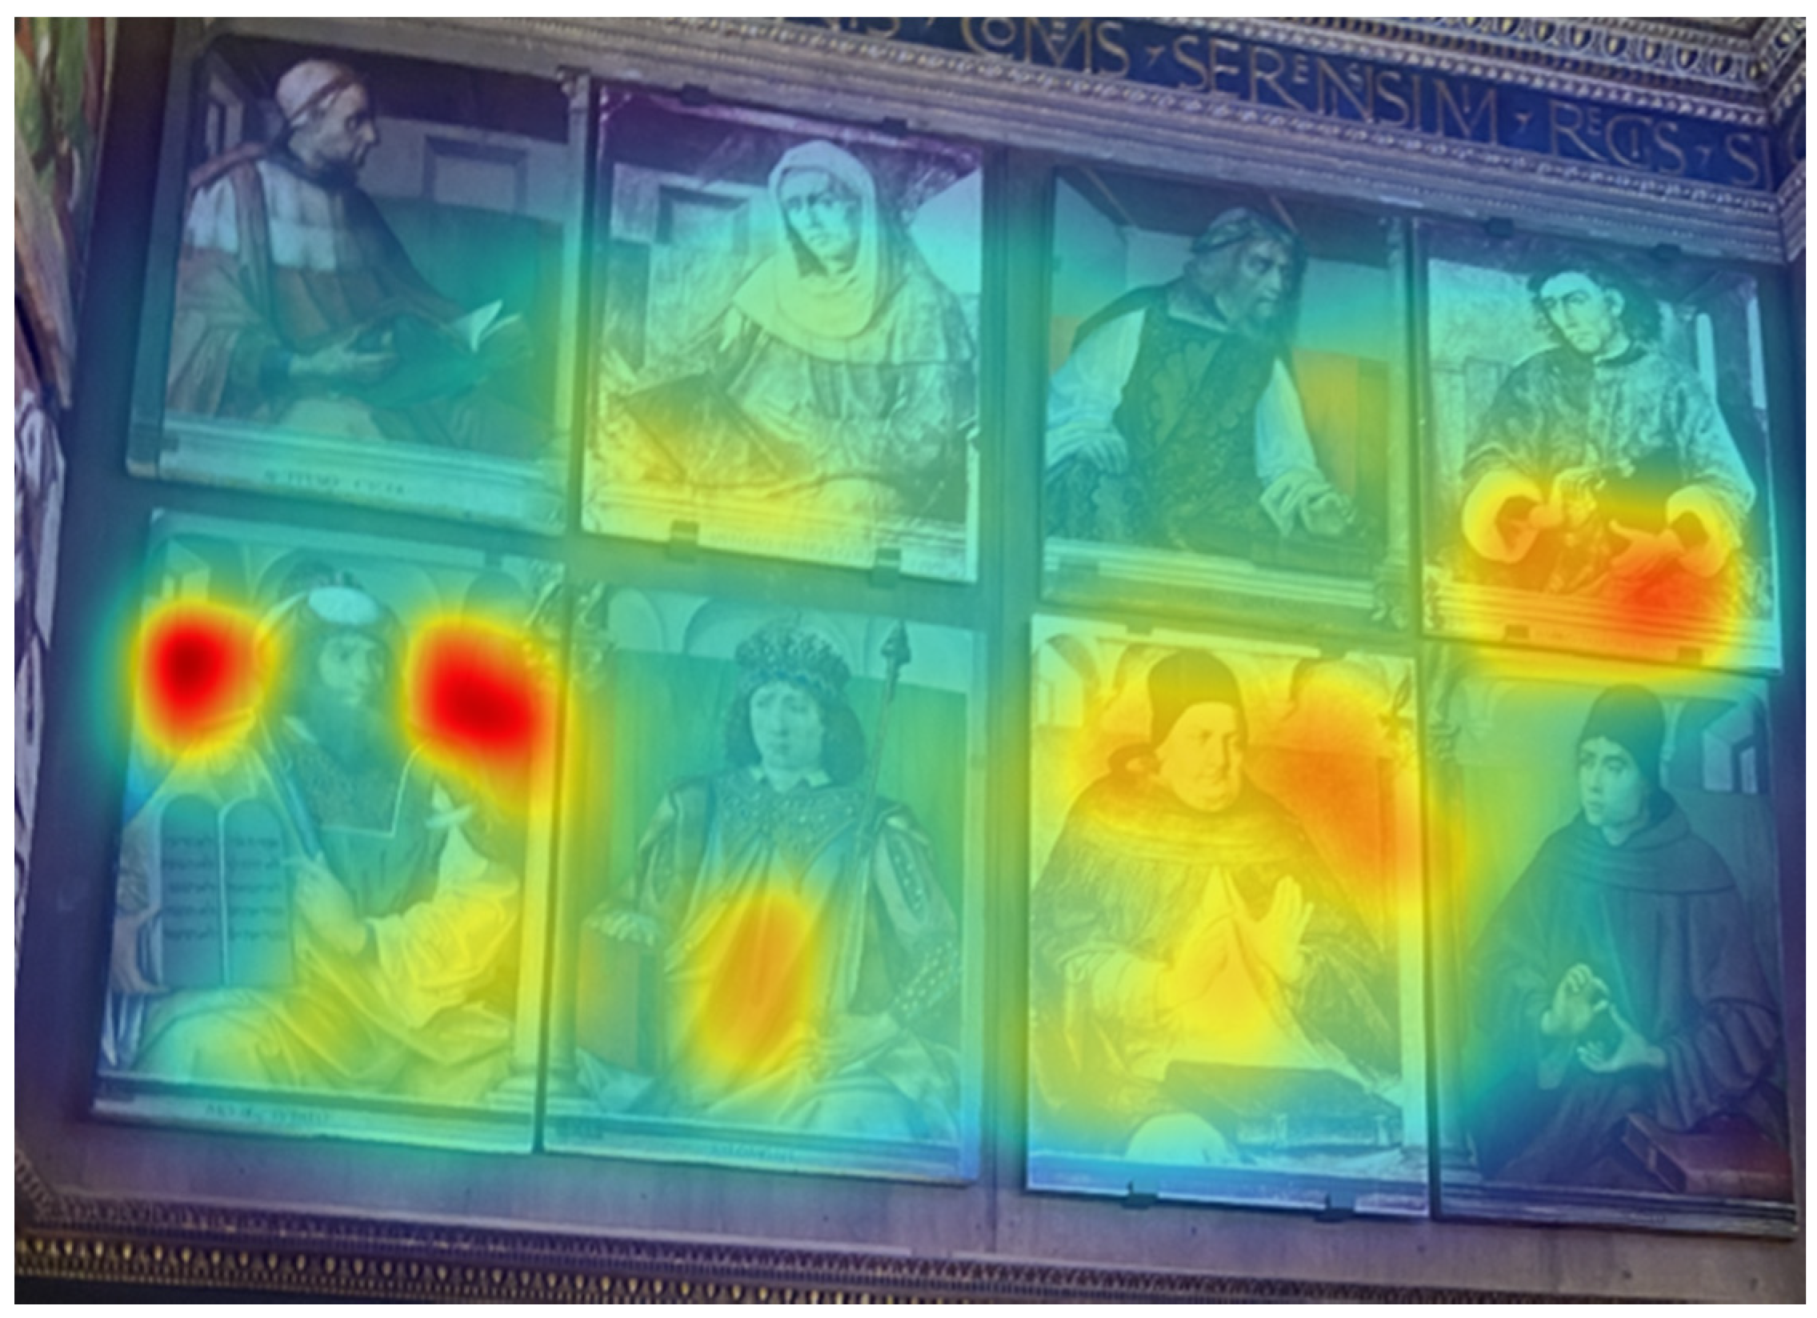
| East wall (upper part) | ||||||||
| AOI | 1 | 2 | 3 | 4 | 5 | 6 | 7 | 8 |
| Solomon | St. Thomas Aquinas | Moses the Jew | Duns Scotus | Cicero | Virgil | Seneca | Homer | |
| TTFF (s) | 65.3 | 72.5 | 72.9 | 88.4 | 92.1 | 100.1 | 103.7 | 109.3 |
| Time Spent (s) | 0.5 | 0.5 | 1.1 | 0.6 | 0.2 | 0.2 | 0.1 | 0.2 |
| Ratio | 18/25 | 18/25 | 15/25 | 12/25 | 11/25 | 10/25 | 8/25 | 7/25 |
| Fixations | 160 | 154 | 199 | 144 | 38 | 38 | 20 | 32 |
Publisher’s Note: MDPI stays neutral with regard to jurisdictional claims in published maps and institutional affiliations. |
© 2022 by the authors. Licensee MDPI, Basel, Switzerland. This article is an open access article distributed under the terms and conditions of the Creative Commons Attribution (CC BY) license (https://creativecommons.org/licenses/by/4.0/).
Share and Cite
Mandolesi, S.; Gambelli, D.; Naspetti, S.; Zanoli, R. Exploring Visitors’ Visual Behavior Using Eye-Tracking: The Case of the “Studiolo Del Duca”. J. Imaging 2022, 8, 8. https://doi.org/10.3390/jimaging8010008
Mandolesi S, Gambelli D, Naspetti S, Zanoli R. Exploring Visitors’ Visual Behavior Using Eye-Tracking: The Case of the “Studiolo Del Duca”. Journal of Imaging. 2022; 8(1):8. https://doi.org/10.3390/jimaging8010008
Chicago/Turabian StyleMandolesi, Serena, Danilo Gambelli, Simona Naspetti, and Raffaele Zanoli. 2022. "Exploring Visitors’ Visual Behavior Using Eye-Tracking: The Case of the “Studiolo Del Duca”" Journal of Imaging 8, no. 1: 8. https://doi.org/10.3390/jimaging8010008
APA StyleMandolesi, S., Gambelli, D., Naspetti, S., & Zanoli, R. (2022). Exploring Visitors’ Visual Behavior Using Eye-Tracking: The Case of the “Studiolo Del Duca”. Journal of Imaging, 8(1), 8. https://doi.org/10.3390/jimaging8010008